Embed Size (px)
Citation preview
INTERMOUNTAIN WEST NATIVE AND ADAPTED GRASS SPECIES AND
THEIR MANAGEMENT FOR TURFGRASS APPLICATIONS
by
Toby Richard Day
A thesis submitted in partial fulfillment of the requirements for the degree
of
Master of Science
in
Plant Sciences
MONTANA STATE UNIVERSTIY Bozeman, Montana
May 2006

©COPYRIGHT
by
Toby Richard Day
2006
All Rights Reserved

ii
APPROVAL
of a thesis submitted by
Toby Richard Day
This thesis has been read by each member of the thesis committee and has been found to be satisfactory regarding content, English usage, format, citations, bibliographic style, and consistency, and is ready for submission to the Division of Graduate Education. Dr. Tracy A. O. Dougher
Approved for the Department of Plant Sciences and Plant Pathology Dr. John Sherwood
Approved for the Division of Graduate Education Dr. Joseph J. Fedock

iii
STATEMENT OF PERMISSION TO USE
In presenting this thesis in partial fulfillment of the requirements for a
master’s degree at Montana State University, I agree that the Library shall make
it available to borrowers under rules of the Library.
If I have indicated my intention to copyright this thesis by including a
copyright notice page, copying in allowable only for scholarly purposes,
consistent with “fair use” as prescribed in the U. S. Copyright Law. Requests for
permission for extended quotation form or reproduction of this thesis in whole or
in parts may be granted only by the copyright holder.
Toby Richard Day
August 2006

iv
TABLE OF CONTENTS
1. LITERATURE REVIEW......................................................................................... 1 Evolution and Benefits of Turfgrass....................................................................... 1 Irrigation, Drought, and Water Conservation ................................... ..................... 2 Traditional Introduced Turfgrass Species and Their Limitations ..... ..................... 5 Species Selection.................................................................................................. 6 Introduced Grasses ............................................................................................... 6 Kentucky Bluegrass............................................................................................ 7 Tall Fescue......................................................................................................... 7 Native and Adapted Grasses ................................................................................ 8 Canada Bluegrass, Sandberg Bluegrass, and Muttongrass............................... 9 Streambank, Thickspike, Western, and Crested Wheatgrass .......................... 10 Sheep Fescue .................................................................................................. 11 Buffalograss ..................................................................................................... 12 Blue Grama ...................................................................................................... 13 Turfgrass Evaluation ........................................................................................... 13 Study Goals and Objectives ................................................................................ 14
2. MATERIALS AND METHODS............................................................................. 15
Selection of Native and Adapted Grasses for Turfgrass Application................... 15 Mixture Selection................................................................................................. 15 Experimental Design and Procedures................................................................. 17 Field Establishment ............................................................................................. 20 Irrigation ........................................................................................................... 20 Plot Maintenance.............................................................................................. 22 Data Collection and Statistical Analysis ........................................................... 23
3. RESULTS
Results for Turfgrass Quality ............................................................................... 25 Kentucky Bluegrass.......................................................................................... 25 Tall Fescue....................................................................................................... 27 Canada Bluegrass............................................................................................ 27 Crested Wheatgrass......................................................................................... 30 Muttongrass...................................................................................................... 32 Sandberg Bluegrass......................................................................................... 32 Sheep Fescue .................................................................................................. 32 Streambank Wheatgrass.................................................................................. 34 Thickspike Wheatgrass .................................................................................... 36 Western Wheatgrass........................................................................................ 38 Blue Grama ...................................................................................................... 40 Buffalograss ..................................................................................................... 42 Canada Bluegrass + Crested Wheatgrass ....................................................... 44
v
TABLE OF CONTENTS-CONTINUED
Canada Bluegrass + Western Wheatgrass ...................................................... 44 Western Wheatgrass + Streambank Wheatgrass ............................................ 47 Western Wheatgrass + Streambank Wheatgrass + Sheep Fescue ................. 49 Blue Grama + Sandberg Bluegrass.................................................................. 51 Blue Grama + Western Wheatgrass................................................................. 51 Buffalograss + Blue Grama + Sandberg Bluegrass.......................................... 51 Buffalograss + Blue Grama + Muttongrass ...................................................... 51 Buffalograss + Muttongrass.............................................................................. 55 Buffalograss + Sandberg Bluegrass................................................................. 55 Buffalograss + Sheep Fescue .......................................................................... 55 Buffalograss + Western Wheatgrass................................................................ 57 Turfgrass Quality ................................................................................................. 59 Water Requirements ........................................................................................... 59
4. DISCUSSION AND CONCLUSION..................................................................... 69
Turfgrass Recommendations for Bozeman, Montana......................................... 73 Buffalograss + Sheep Fescue Mixture ............................................................. 73 Sheep Fescue Mixture ..................................................................................... 76 Blue Grama and Buffalograss .......................................................................... 77 Turfgrass Quality of KBG and Tall Fescue.......................................................... 78 Turfgrass Recommended for Low-Maintenance Turf .......................................... 79 Western Wheatgrass........................................................................................ 80 Western Wheatgrass Mixtures ......................................................................... 80 Species and Mixtures Not Recommended for Turfgrass..................................... 82 Research and Development
REFERENCES CITED .............................................................................................. 85 APPENDICES ........................................................................................................... 88 APPENDIX A: Statistical Analysis ...................................................................... 89

vi
LIST OF TABLES
Table Page
2.1 Native, Adapted, and Introduced Grass Species Selected for This Study ................................................................................ 16
2.2 Native and Adapted Grass Species Mixtures
Used in This Study ....................................................................................... 16
3.1 Turfgrass Quality and Minimum Weekly Irrigation Recommendations and Timing for Native, Adapted And Introduced Grasses in Bozeman, Montana........................................... 60

vii
LIST OF FIGURES
Figure Page
1.1 U.S Drought Monitor, June 7, 2005. Showing Much of the Intermountain West is Experiencing a Drought .................................... 3 2.1 The Seasonal Effect on Shoot Growth Pattern of Cool-Season and Warm-Season Grasses ................................................... 17 2.2 The Experimental Design of the Native, Adapted, and
Introduced grass monostand and mixture plots at the MSU Horticulture Farm................................................................................. 18
2.3 Average Twice Weekly Supplemental Irrigation as Related
to the Distance from the Sprinkler Line-Source for Native and Adapted Turfgrass Study at Bozeman, Montana 2005.......................... 19
2.4 Head Placement and Coverage of Irrigation System .................................. 20
2.5 Line-Source Irrigation Water Coverage ........................................................ 21
2.6 Monthly Precipitation and Irrigation Averages for
Bozeman, Montana ...................................................................................... 22
3.1 Effect of Month and Moisture Level on Color, Texture, Density and Dry Weight of Kentucky Bluegrass ........................................... 26
3.2 Effect of Month and Moisture Level on Color, Texture, Density and Dry Weight of Tall Fescue ........................................................ 28
3.3 Effect of Month and Moisture Level on Color, Texture,
Density and Dry Weight of Canada Bluegrass............................................ 29
3.4 Effect of Month and Moisture Level on Color, Texture, Density and Dry Weight of Crested Wheatgrass......................................... 31
3.5 Effect of Month and Moisture Level on Color, Texture, Density and Dry Weight of Sheep Fescue .................................................. 33
3.6 Effect of Month and Moisture Level on Color, Texture, Density and Dry Weight of Streambank Wheatgrass.................................. 35
3.7 Effect of Month and Moisture Level on Color, Texture, Density and Dry Weight of Thickspike Wheatgrass .................................... 37
viii
LIST OF FIGURES - CONTINUED Figure Page
3.8 Effect of Month and Moisture Level on Color, Texture,
Density and Dry Weight of Western Wheatgrass........................................ 39
3.9 Effect of Month and Moisture Level on Color, Texture, Density and Dry Weight of Blue Grama ...................................................... 41
3.10 Effect of Month and Moisture Level on Color, Texture, Density and Dry Weight of Buffalograss..................................................... 43
3.11 Effect of Month and Moisture Level on Color, Texture, Density and Dry Weight of Canada Bluegrass + Crested Wheatgrass ................................................................................................45
3.12 Effect of Month and Moisture Level on Color, Texture, Density and Dry Weight of Canada Bluegrass + Western Wheatgrass ................................................................................................46
3.13 Effect of Month and Moisture Level on Color, Texture, Density and Dry Weight of Western Wheatgrass + Streambank Wheatgrass............................................................................ 48
3.15 Effect of Month and Moisture Level on Color, Texture, Density and Dry Weight of Western Wheatgrass + Streambank Wheatgrass + Sheep Fescue ................................................ 50
3.16 Effect of Month and Moisture Level on Color, Texture, Density and Dry Weight of Blue Grama + Western Wheatgrass ................................................................................................52
3.16 Effect of Month and Moisture Level on Color, Texture, Density and Dry Weight of Buffalograss + Blue Grama + Muttongrass ...............................................................................................54
3.17 Effect of Month and Moisture Level on Color, Texture, Density and Dry Weight of Buffalograss + Sheep Fescue ......................... 56
3.18 Effect of Month and Moisture Level on Color, Texture, Density and Dry Weight of Buffalograss + Western Wheatgrass ................................................................................................58
3.19 Minimum Irrigation Moisture Requirements for Kentucky Bluegrass, Tall Fescue, and Blue Grama................................... 63

ix
LIST OF FIGURES - CONTINUED Figure Page
3.20 Minimum Irrigation Moisture Requirements for Buffalograss, Sheep Fescue, and Buffalograss + Sheep Fescue ............................................................................................ 64
3.21 Minimum Irrigation Moisture Requirements for
Western Wheatgrass, Buffalograss + Blue Grama + Muttongrass, and Blue Grama + Western Wheatgrass.............................. 65
3.22 Minimum Irrigation Moisture Requirements for
Buffalograss + Western Wheatgrass, Western Wheatgrass + Streambank Wheatgrass, and Western Wheatgrass + Streambank Wheatgrass + Sheep Fescue ......................... 66
3.23 Minimum Irrigation Moisture Requirements for
Thickspike Wheatgrass, Canada Bluegrass, and Crested Wheatgrass................................................................................... 67
3.24 Minimum Irrigation Moisture Requirements for
Streambank Wheatgrass, Canada Bluegrass + Western Wheatgrass, and Canada Bluegrass + Crested Wheatgrass................................................................................... 68

x
ABSTRACT
This research addresses irrigation and water use of native and adapted grasses for turfgrass application. For this purpose, plots were established at the MSU Horticulture Research Farm, Bozeman, MT. The selected native and adapted grass species include 12 single species and 12 mixed species stands of ‘Cody’ buffalograss, ‘Foothills’ Canada bluegrass, ‘Bad River’ blue grama, sheep fescue, Sandberg bluegrass, muttongrass, and wheatgrasses ‘Sodar’ streambank, ‘Road Crest’ crested, ‘Rosana’ western, and ‘Critana’ thickspike with Kentucky bluegrass and tall fescue as introduced species. A line source irrigation system was installed to allow the plots to be evaluated at four irrigation levels. Experimental measurements on the plots included growth response as determined by clipping yield and quality ratings for color, texture, and density. Estimated timing and recommended minimum amount of water for irrigation for the grasses and mixtures for Bozeman, Montana, was determined from the data.
Single species and mixtures that had a good turf quality overall were sheep fescue, blue grama, buffalograss, and the mixture of buffalograss + sheep fescue. The single species and mixtures with adequate overall turfgrass were western wheatgrass and the mixtures of western wheatgrass + streambank wheatgrass, western wheatgrass + streambank wheatgrass + sheep fescue, blue grama + western wheatgrass, buffalograss + muttongrass, blue grama + muttongrass, and buffalograss + western wheatgrass. Canada bluegrass, crested wheatgrass, streambank wheatgrass, thickspike wheatgrass and the mixtures of Canada bluegrass + crested wheatgrass, and Canada bluegrass + western wheatgrass had poor overall turfgrass ratings and would not be recommended for turfgrass applications.
The results indicated that all the single species and mixtures required some irrigation for their optimum turfgrass quality. However, native and adapted grasses required less than or equal to the amount of supplemental irrigation needed by Kentucky bluegrass or tall fescue, and with many species and mixtures in the study, required a later recommended timing for irrigation.
1
LITERATURE REVIEW
Evolution and Benefits of Turfgrass
Turfgrass is defined as any grass that can be mowed, forming a dense ground
cover (Christians, 2004). Turfgrass is used to prevent erosion, maintain visibility,
reduce dust and glare, lower surface temperatures, add beauty, and provide a playable
surface for athletics (Duble, 1996). Western civilization has domesticated wild grasses
for these turfgrass characteristics dating back to the eighteenth century (Bormann,
1993).
Many of the species suited for turfgrass use evolved under grazing by
herbivores. Having a meristematic region closer to ground level and an initiated
defense mechanism for some grasses such as rhizomes, stolons, trichomes, siliceous
dentations, alkaloids, phenolic compounds, and associations with endophytic fungi
have all contributed to the co-evolution of grazing animals and grasses (Casler, 2003).
It has also been shown that leaf growth rate and photosynthetic rate depends on
periodic grazing in some perennial grasses (McNaughton, 1982). The evolution and
physiology of certain perennial grasses lend themselves to selection for turfgrass
purposes under mowing conditions. Out of more than 10,000 individual grass species
throughout the world (Watson and Dallwitz, 1994), only a handful of those species are
suited for turfgrass applications (Christians, 2004).
Turfgrass is a major component of managed landscapes throughout the United
States, and is used for home lawns, subdivision common areas, commercial grounds,
parks, cemeteries, athletic fields, golf courses, and highway rights-of-ways (Gould and
Shaw, 1983). Turfgrass has many functional, recreational, commercial, and aesthetic

2
benefits (Beard, 1994). Functional benefits include erosion control, dust prevention,
solar heat dissipation, fire prevention, pollution entrapment, groundwater recharge, and
environmental protection are examples of functional benefits of turfgrass. Recreational
benefits include low-cost surfaces, safety and physical health, and appealing visual
venues for spectators. Aesthetic benefits include community pride, improved quality of
life, mental health, and complimenting trees and shrubs in the landscape.
Irrigation, Drought, and Water Conservation
Irrigation is the largest input required to maintain desired turfgrass quality and
appearance throughout a growing season (Qian et al., 1999). The largest and most
visible domestic use of water resources is the irrigation of a home lawn and landscape.
A conventional turfgrass, such as Kentucky bluegrass, requires 1 to 1.5 inches of water
per week during the growing season to retain its visual characteristics (Christians,
2004). The amount of water needed for a traditional turfgrass lawn to retain its visual
quality is usually 2 to 3 times the amount of average annual precipitation in much of the
Intermountain West. Current climatic changes and drought in the Intermountain West,
combined with increased irrigation needs have created a net loss of water resources in
reservoirs and aquifers.
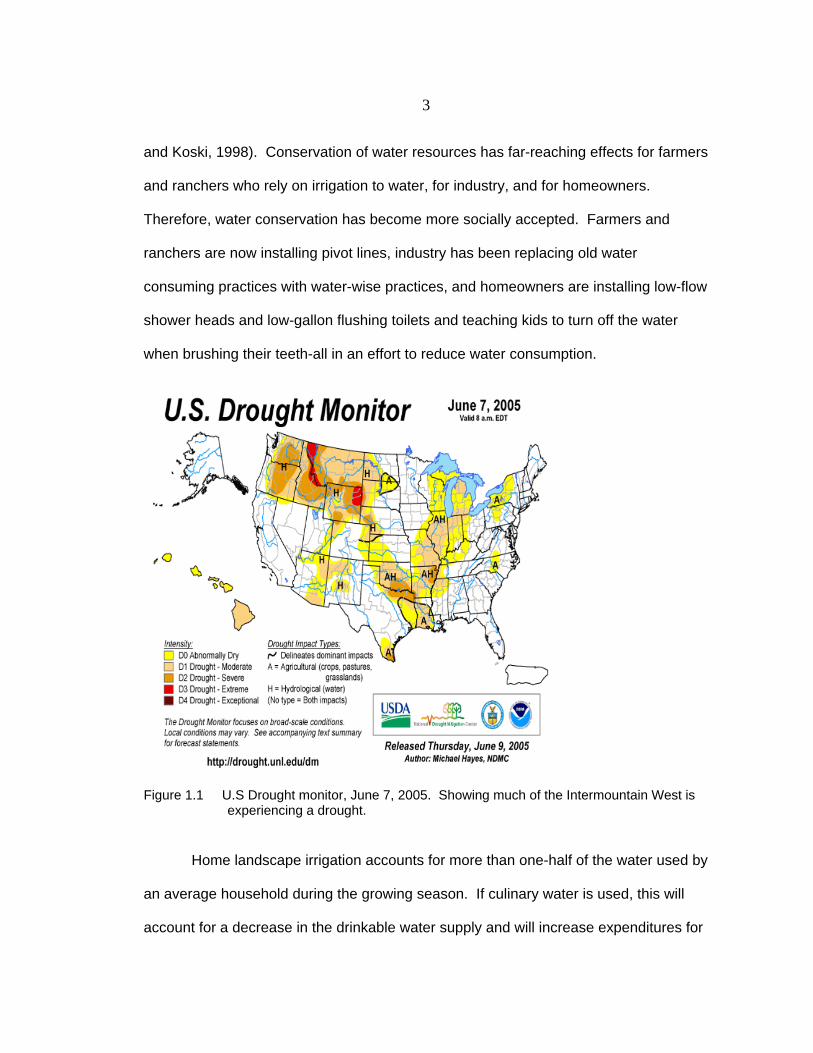
A persistent drought has occurred in the Intermountain West because of years
of below normal rainfall (www.NOAA.gov). The U.S. Drought Monitor through June of
2005 shows that most, if not all of the Intermountain West is abnormally to
exceptionally dry (Figure 1.1).
This drought, coupled with the increasing demand for water resources caused
by urban growth in the Intermountain West has led to water conservation efforts (Ervin
3
and Koski, 1998). Conservation of water resources has far-reaching effects for farmers
and ranchers who rely on irrigation to water, for industry, and for homeowners.
Therefore, water conservation has become more socially accepted. Farmers and
ranchers are now installing pivot lines, industry has been replacing old water
consuming practices with water-wise practices, and homeowners are installing low-flow
shower heads and low-gallon flushing toilets and teaching kids to turn off the water
when brushing their teeth-all in an effort to reduce water consumption.
Figure 1.1 U.S Drought monitor, June 7, 2005. Showing much of the Intermountain West is
experiencing a drought.
Home landscape irrigation accounts for more than one-half of the water used by
an average household during the growing season. If culinary water is used, this will
account for a decrease in the drinkable water supply and will increase expenditures for
4
the water. Normal household water bills often double or even triple in summer months
as compared to winter months (City of Bozeman, 2006). People in the Intermountain
West are removing or reducing lawns in an effort to conserve water by decreasing their
dependence on irrigation. In some instances, people are encouraged by water bill
credits offered by municipalities to remove turfgrass (ASHS, 2005).
A study in Logan, Utah, revealed that most homeowners irrigated their lawns
with little regard for the actual requirements of the grass (Aurasteh, 1984). The best
way to conserve water is by using water more efficiently and minimizing the
nonessential uses of that water is seen as a best strategy to conserve water (Bormann
et al., 1993). Bormann argues that “watering lawns that we have purposely designed
to be thirsty is certainly a practice that needs to be re-evaluated.” Understanding water
requirements of differing grass species, not only will conserve water resources, but
also is fundamental to plant health.
Increased pressure and interest in reducing irrigation have changed the market
for landscape irrigation products. This trend in irrigation system technology has
changed and is being developed to accommodate the need for water conservation.
Technologies include smart systems, moisture sensors, interactive sensing, remote
control, and pressure regulation (Vinchesi, 2002). It is hoped that new technology in
irrigation will reduce some of the dependency of water. However, technology has yet
to produce an accepted drought-tolerant, sustainable turfgrass, especially one that can
be sodded.

5
Traditional Introduced Turfgrass Species and Their Limitations
Traditional introduced species such as Kentucky bluegrass (Poa pratensis) and
tall fescue (Festuca arundinacea) are used extensively throughout the Intermountain
West for turfgrass applications. Kentucky bluegrass (KBG) is the most developed and
propagated cool-season grass used in the turfgrass industry. KBG is held as a
standard for comparison to all other cool-season turfgrasses because of its fine to
medium texture, softness, high density, dark green color, and persistence. The
manicured monolithic dark green appearance of traditional introduced turfgrass species
is the social accepted norm. However, significant amounts of water and fertilizer are
needed to keep these species lush and green (Bormann, 1993).
Managers in the turfgrass industry argue that KBG is the most drought-tolerant
grass available (Bob Wagner, personal conversation). During times of drought, KBG
and other traditional turf-type grasses enter dormancy, cease to grow, turn brown in
color, and then recover when rainfall reoccurs. It is argued that there is nothing wrong
with a tan lawn if someone chooses not to irrigate (Beard, 1994). This idea goes
against many of the functional, recreational, and aesthetic benefits outlined by some of
the same professionals who promote turfgrass. Dormant turfgrass does not have the
benefit of solar heat dissipation, fire prevention, and aesthetic benefits such as beauty,
mental health, social harmony, community pride, and increased property values.
Furthermore, in areas with a high evaporation rate such as the Intermountain West,
frequent drought conditions would cause traditional lawns to be soon replaced by local
vegetation, including turfgrass weeds that are more adapted to the frequent drought
conditions (Bormann, 1993).

6
Species Selection
Selection of drought-resistant grass varieties may be a way to save water
(Bormann, 1993). Most low-maintenance turfgrass studies focus on traditional
introduced species and cultivars for lower inputs such as nitrogen and water (Mintenko,
2002). Breeders have concentrated on genetic manipulation as well as cultivar
selection of traditional introduced species for new low-maintenance releases. While
selection of grass species for turfgrass is important, very few documented studies were
conducted on native and adapted grasses for selection for turfgrass applications. No
documented study has been performed on native and adapted grasses in the
Intermountain West.
Introduced Grasses
Introduced grasses such as KBG and tall fescue are adapted to environmental
temperature extremes, but need added inputs to flourish. Most traditional grasses are
native to Europe and Asia and have been bred and selected for use in the United
States. Turfgrasses that are dominated by introduced grasses are human modified
ecosystems that routinely require chemical and physical inputs such as fertilizers,
pesticides and irrigation, which account for negative environmental costs. These
negative costs are pollution, contamination, and dewatering of aquifers, including
streams, rivers, lakes and wetlands.
7
Kentucky Bluegrass
KBG is an introduced, highly rhizomatous medium-textured grass with a dark
kelly green appearance when irrigated. Because it is heavily rhizomatous, KBG has a
very high recuperative and reproductive capability, virtually “repairing itself” when
damaged (Christians, 2004). For this reason, KBG is well adapted to areas such as
home lawns, athletic fields, and parks and can be easily seeded or sodded. KBG has
a shallow root system that demands more frequent and high amounts of water for its
beneficial characteristics (Christians, 2004). It is highly drought tolerant because of its
capability to remain dormant for several months, but requires on average, at least 28
inches of precipitation each growing season for an acceptable appearance (USDA,
2005). KBG is more cold tolerant than some of the other industry standards, such as
tall fescue and perennial ryegrass (Christians, 2004,). KBG is tolerant to -33ºF (USDA,
2005), making it well-adapted to the Intermountain West temperature environment.
KBG prefers fine- and medium-textured soils and does not flourish on coarse soils.
The high fertility and water requirements for KBG make it a less desirable for a low-
input sustainable turfgrass.
Tall Fescue
Tall fescue (Festuca arundinacea) is a coarse-textured grass that is weakly
rhizomatous, but grows much more like a bunch grass. This introduced grass is cold
tolerant to -38ºF and is considered drought tolerant, but most cultivars require a
minimum of 24 to 30 inches of precipitation per year, even in an unmown situation
(USDA, 2005). Tall fescue is considered a drought tolerant turfgrass because of its
deep root system, although mowing height affects rooting depth (Christians, 2004).
The lower tall fescue is mowed, the less root depth it will have making it arguably less

8
drought tolerant. Tall fescue is adapted to fine- and medium-textured soils, and does
not grow as well in coarse soils (USDA, 2005). It has a very rapid growth rate, thus
requiring a medium fertility and irrigation level for acceptable appearance.
Native and Adapted Grasses
Grasses native to the Intermountain West have evolved to withstand extreme
environmental conditions such as drought, low fertility, extreme seasonal temperatures,
and grazing. Although most native grasses have not been evaluated for turfgrass
purposes (Mintenko, 2002), native grasses of the Northern Great Plains may have the
characteristics desired for a low-input sustainable turf (Holzworth, 1990). Selected
native species have been evaluated in the Northern Great Plains Region (Mintenko,
2002) and in the Upper Midwest (Diesburg, 1997), but very little scientific research has
been documented for the Intermountain West. Furthermore, there is very little
documentation of grass mixtures used for low-input turfgrass situations.
Adapted grasses are non-native, but have many positive qualities, such as
drought tolerance and winter hardiness, that enable them to survive in the
Intermountain West climate. Unlike introduced turfgrasses, survival of adapted
grasses is not dependent on amendments such as supplemental irrigation and
additional fertilizer; therefore, they may be good candidates for turfgrass applications in
the Intermountain West. Fertility and water requirements for most native and adapted
grasses are known only for unmown conditions. Their naturally low water requirements
make them excellent candidates for low input, but they are untested for turfgrass
applications for the Intermountain West.

9
Canada Bluegrass, Sandberg Bluegrass, and Muttongrass
Native bluegrasses such as Canada bluegrass (Poa compressa), Sandberg
bluegrass (Poa secunda), and Muttongrass (Poa fendleriana) are believed to have the
physiological attributes desired for low-input, sustainable turf. Canada bluegrass is a
fine-textured rhizomatous grass that is adapted to many soil textures, low fertility, and
temperatures to -38ºF. Canada bluegrass has a medium drought tolerance with a
minimum precipitation requirement of 20 inches under unmown conditions and has a
green fine texture in mid-summer (USDA, 2005). Canada bluegrass has had
intermediate success in the upper Midwest (Deisburg, 1997) and minimal success in
the Northern Great Plains (Mintenko, 2002). Although Canada bluegrass showed
promise as a low-input turfgrass, slow regrowth and loss of leaf material may distort the
color of Canada bluegrass under low (under 3.5”) mowing conditions (Mintenko, 2002).
Sandberg bluegrass is a fine-textured green bunch grass native to North
America. It is adapted to medium and coarse soils, has medium fertility requirements,
and tolerates temperatures to -36ºF. It is very drought tolerant with a low moisture
requirement of 8 to 16 inches per year under unmown conditions (USDA, 2005).
Sandberg bluegrass has not been studied for turfgrass applications.
Muttongrass is a native fine-textured bluegrass that has a high drought
tolerance requiring only 10 to 18 inches of annual precipitation to survive under
unmown conditions. It is a fine textured green grass that tolerates coarse- and
medium-textured soils and is winter hardy to -38ºF (USDA, 2005). Muttongrass has
not been studied for turfgrass applications.

10
Streambank, Thickspike, Western Wheatgrass and Crested Wheatgrass
Wheatgrasses such as streambank wheatgrass (Elymus lanceolatus) and
thickspike wheatgrass (E. lanceolatus), western wheatgrass (Pascopyrum smithii), and
crested wheatgrass (Agropyron cristatum) have proven to be very drought and winter
hardy. They create dense ground covers because of quick establishment (crested
wheatgrass) and rhizomatous growth habit (streambank, thickspike, and western
wheatgrass). In a study performed on native turfgrasses in a seven-state region
throughout the upper Midwest, wheatgrasses performed better than other native
species in the most western extent of the study (Mintenko, 2002). Wheatgrasses also
have been observed by researchers in Kansas and Nebraska to perform well for low-
maintenance turf (Diesburg, 1997).
Streambank and thickspike wheatgrass are ecologically distinct but are not
taxonomically distinct because of “evolution from dry-site populations” (Lavin and
Seibert, 2003). Streambank and thickspike wheatgrass are native rhizomatous
grasses with a medium texture and variations of color from blue-green (streambank) to
yellow-green (thickspike) and are able to establish a level surface suited for turfgrass
application, including athletic fields (Holzworth, 1990). They are adapted to fine,
medium, and coarse soils (USDA, 2005). However, streambank and thickspike
wheatgrass prefer loam to coarse-textured soils with medium fertility when grown in an
unmown situation (Holzworth, 1990). Streambank and thickspike wheatgrass are
winter hardy; they survive temperatures to -38ºF, and are very drought tolerant,
requiring less that 10 inches of precipitation per year in an unmown situation (USDA,
2005).
11
Western wheatgrass is another highly drought tolerant species that grows in 12-
inch precipitation zones (Holzworth, 1990). It is adapted to fine- and medium-textured
soils with a medium fertility requirement in an unmown situation. Western wheatgrass
is medium- to coarse-textured blue-green grass that is cold-tolerant to -38ºF (USDA,
2005). Western wheatgrass grows readily along roadsides and is used extensively for
erosion control (Lavin and Seibert, 2003).
Crested wheatgrass is an adapted, drought tolerant, bunch grass that only
requires 5 inches of annual precipitation in an unmown situation and grows in almost
any soil texture (Holzworth, 1990). It has medium-textured green foliage when irrigated
and has a rapid growth rate. It is very cold-tolerant, withstanding temperatures to
-43ºF.
Sheep Fescue
Found in many cool regions of the United States, including the Rocky
Mountains, sheep fescue (Festuca ovina) is also broadly adapted to low-input
sustainable turf in the upper Midwest (Diesburg, 1997). Sheep fescue is a non-native
fine-textured bunch grass that needs very little inputs for a turfgrass situation. It is a
common grass used in low-maintenance areas; however, only one variety, Quatro, is
currently being marketed (Christians, 2004). This variety is drought tolerant, requiring
less than 10 inches of precipitation per year. It grows well in medium- to coarse-
textured soils, and can withstand temperatures to -43ºF (USDA, 2005), making it one of
the most winter-hardy species in the Intermountain West. Fine fescue produces a
higher quality turf in older stands as compared to KBG, and show greater tolerance to
environmental stress than KBG and perennial ryegrass (Aronson, 1987). It is used
extensively for unmown borders on golf courses and unmown hillsides (Christians,
12
2004). Sheep fescue’s disadvantages include slow establishment and a bunch growth
habit. Therefore, it is not recommended for athletic fields, but may be a worthy
candidate for home lawns (Holzworth, 1990).
Buffalograss
Buffalograss (Buchloe dactyloides) is a native, warm-season, stoloniferous
grass that has been investigated for turfgrass applications for nearly 20 years
(Browning et al., 1994; Feldhake et al., 1984; McCarly and Colvin, 1992; Mintenko,
2002; National Turfgrass Evaluation Program, 1995; Qian et al., 1997). In fact, it is the
only Intermountain West native grass used extensively in the United States for
turfgrass applications (Casler and Duncan, 2003). Buffalograss is tolerant to extreme
temperatures and prolonged drought, enabling it to survive extreme conditions within
the environment. Buffalograss is a grey-green fine-textured grass and is
recommended for low-maintenance and low-use turfgrass areas (Duble, 1996). It
grows in fine- and medium-textured soils (USDA, 2005), rarely tolerating sandy soil
(Duble, 1996). It is very drought tolerant, requiring a minimum of 7 inches of
precipitation per year to survive, and is hardy to temperatures down to -28ºF (USDA,
2005). Buffalograss has performed well in the Turfgrass Transition Zone (Diesburg,
1997). In northern climates, winterkill may occur because mowing reduces root and
crown reserves that are necessary to prevent winter damage (DiPaola and Beard,
1992). Late spring green-up and early fall dormancy have reflected low quality ratings
for May and September in the Northern Great Plains region (Mintenko, 2002). Earlier
establishment was very time consuming and expensive because buffalograss required
plugging or sodding. However, buffalograss is gaining acceptance by turfgrass

13
professionals because there are new cultivars that can be established by seed (Casler
and Duncan, 2003; National Turfgrass Evaluation Program, 1995).
Blue Grama
Blue grama (Bouteloua gracilis) is a warm-season native bunch grass with fine-
textured, grey-green foliage (Holzworth, 1990). Blue grama requires only 12 inches of
precipitation per year to survive in an unmown situation and is cold hardy to -38ºF,
making it both drought and cold tolerant. Blue grama grows in a wide range of soil
textures and has a low fertility requirement (USDA, 2005). It has been used
increasingly in golf course roughs in dry regions. Similar to buffalograss, it is adapted
to both warm and cool arid climates (Christians, 2004). Blue grama has been rated
high on turf quality in the Great Northern Plains, showing excellent drought tolerance,
as well as good winter hardiness, color, texture, and adaptability to mowing stress
(Mintenko, 2002). It is mainly planted on roadsides and other low-maintenance areas
and has lost favor with turfgrass professionals as buffalograss has been improved
(Christians, 2004)
Turfgrass Evaluation
The National Turfgrass Evaluation Program (NTEP) is the authority on turfgrass
evaluation in North America, evaluating seventeen turfgrass species in as many as
forty U.S. states and six provinces in Canada (NTEP, 2005). The evaluation includes
both visual and functional qualities of turf. Visual qualities include density, texture,
uniformity, color, growth habit, and smoothness. Functional qualities include rigidity,
elasticity, resiliency, ball roll, yield, verdure, rooting, and recuperative capacity (Beard,
1994). Ratings are compared to traditional introduced grasses, such as cool-season

14
KBG and warm-season bermudagrass, because they set the standard for turfgrass
quality. The National Turfgrass Evaluation Program rates grasses on a 1 to 9 score,
with one being low quality and 9 being the utmost quality for turfgrass. For instance,
turfgrass color would be rated as 1 = brown or yellow, 5 = light green, 7 = blue green,
and 9 = dark green (Mintenko, 2002). Quality turfgrass ratings for native and adapted
grasses are rarely evaluated in the NTEP program. Many native and adapted grasses
may perform well as a turfgrass, but the color of these grasses may differ from that of
conventional turfgrass species.
Study Goals and Objectives
The purpose of this experiment is to evaluate native and adapted grasses
under mown conditions, and under line-source irrigation for yield, color, texture, and
density. Timing and minimum amounts of irrigation to retain their optimum turfgrass
qualities will be estimated for Bozeman, Montana.
Hypothesis 1: Native and adapted grasses will hold their desired turfgrass qualities
under low water conditions.
Hypothesis 2: Mixtures of the adapted and native grasses will hold their desired
turfgrass qualities under low water conditions.
Hypothesis 3: Native and adapted grasses and their mixtures will retain desirable
turfgrass qualities while requiring less water than Kentucky bluegrass and tall fescue.
15
MATERIALS AND METHODS
Selection of Native and Adapted Grasses for Turfgrass Application
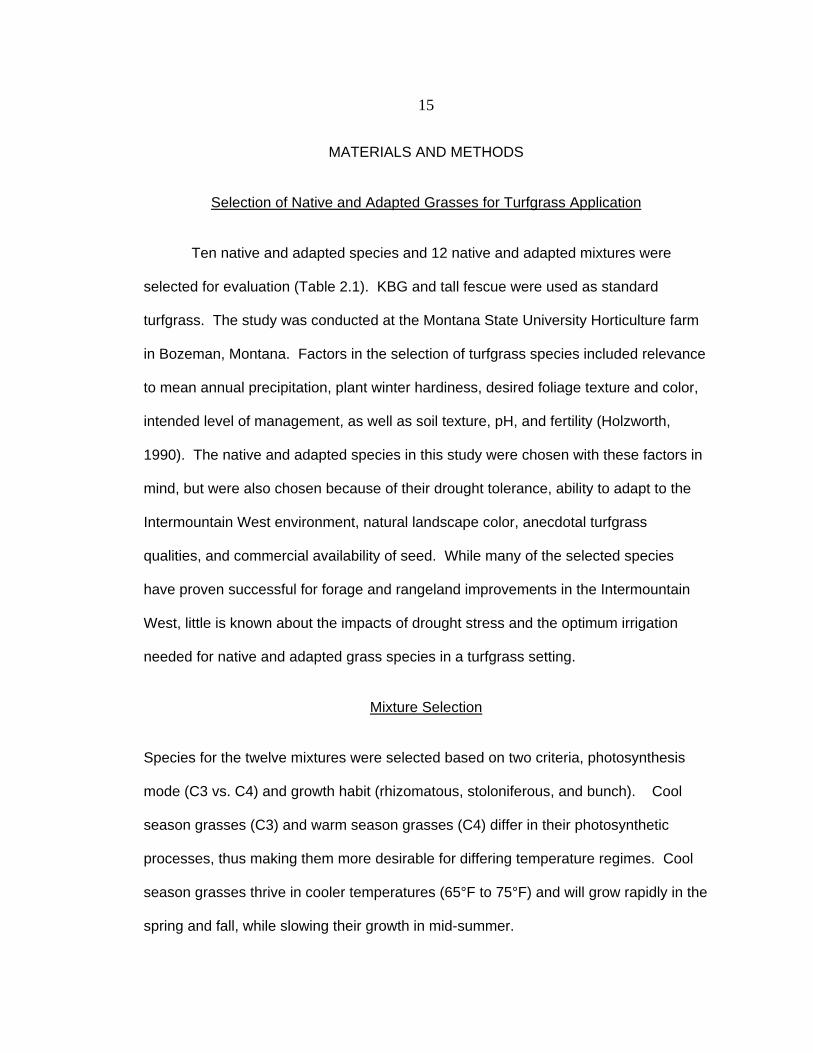
Ten native and adapted species and 12 native and adapted mixtures were
selected for evaluation (Table 2.1). KBG and tall fescue were used as standard
turfgrass. The study was conducted at the Montana State University Horticulture farm
in Bozeman, Montana. Factors in the selection of turfgrass species included relevance
to mean annual precipitation, plant winter hardiness, desired foliage texture and color,
intended level of management, as well as soil texture, pH, and fertility (Holzworth,
1990). The native and adapted species in this study were chosen with these factors in
mind, but were also chosen because of their drought tolerance, ability to adapt to the
Intermountain West environment, natural landscape color, anecdotal turfgrass
qualities, and commercial availability of seed. While many of the selected species
have proven successful for forage and rangeland improvements in the Intermountain
West, little is known about the impacts of drought stress and the optimum irrigation
needed for native and adapted grass species in a turfgrass setting.
Mixture Selection
Species for the twelve mixtures were selected based on two criteria, photosynthesis
mode (C3 vs. C4) and growth habit (rhizomatous, stoloniferous, and bunch). Cool
season grasses (C3) and warm season grasses (C4) differ in their photosynthetic
processes, thus making them more desirable for differing temperature regimes. Cool
season grasses thrive in cooler temperatures (65°F to 75°F) and will grow rapidly in the
spring and fall, while slowing their growth in mid-summer.
16
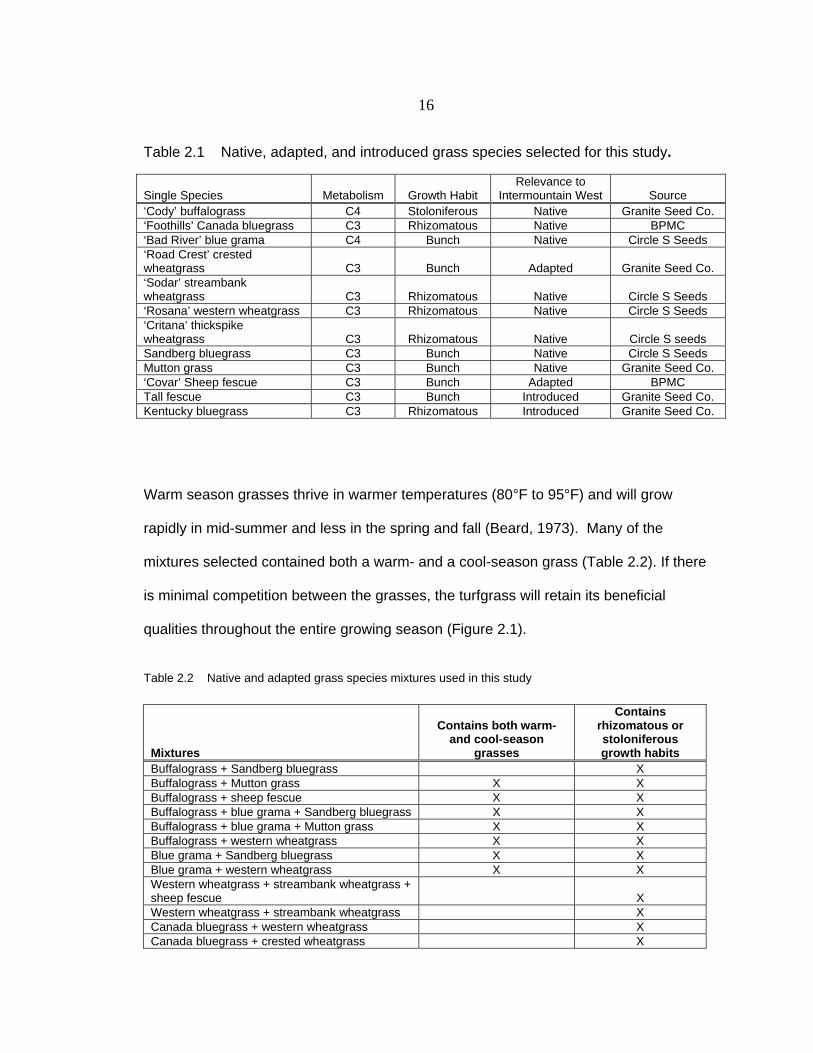
Table 2.1 Native, adapted, and introduced grass species selected for this study. Single Species
Metabolism
Growth Habit
Relevance to Intermountain West
Source
‘Cody’ buffalograss C4 Stoloniferous Native Granite Seed Co. ‘Foothills’ Canada bluegrass C3 Rhizomatous Native BPMC ‘Bad River’ blue grama C4 Bunch Native Circle S Seeds ‘Road Crest’ crested wheatgrass
C3
Bunch
Adapted
Granite Seed Co.
‘Sodar’ streambank wheatgrass
C3
Rhizomatous
Native
Circle S Seeds
‘Rosana’ western wheatgrass C3 Rhizomatous Native Circle S Seeds ‘Critana’ thickspike wheatgrass
C3
Rhizomatous
Native
Circle S seeds
Sandberg bluegrass C3 Bunch Native Circle S Seeds Mutton grass C3 Bunch Native Granite Seed Co. ‘Covar’ Sheep fescue C3 Bunch Adapted BPMC Tall fescue C3 Bunch Introduced Granite Seed Co. Kentucky bluegrass C3 Rhizomatous Introduced Granite Seed Co.
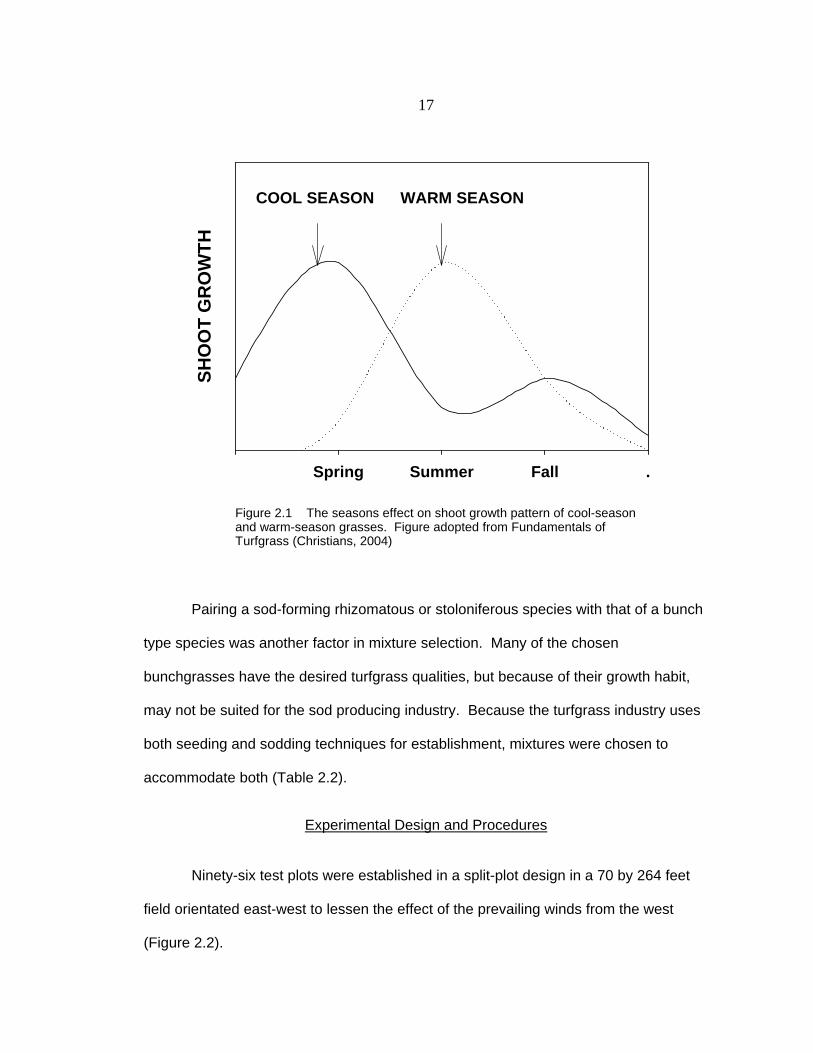
Warm season grasses thrive in warmer temperatures (80°F to 95°F) and will grow
rapidly in mid-summer and less in the spring and fall (Beard, 1973). Many of the
mixtures selected contained both a warm- and a cool-season grass (Table 2.2). If there
is minimal competition between the grasses, the turfgrass will retain its beneficial
qualities throughout the entire growing season (Figure 2.1).
Table 2.2 Native and adapted grass species mixtures used in this study
Mixtures
Contains both warm-
and cool-season grasses
Contains rhizomatous or stoloniferous growth habits
Buffalograss + Sandberg bluegrass X Buffalograss + Mutton grass X X Buffalograss + sheep fescue X X Buffalograss + blue grama + Sandberg bluegrass X X Buffalograss + blue grama + Mutton grass X X Buffalograss + western wheatgrass X X Blue grama + Sandberg bluegrass X X Blue grama + western wheatgrass X X Western wheatgrass + streambank wheatgrass + sheep fescue
X
Western wheatgrass + streambank wheatgrass X Canada bluegrass + western wheatgrass X Canada bluegrass + crested wheatgrass X
17
Spring Summer Fall .
SHO
OT
GR
OW
THCOOL SEASON WARM SEASON
Figure 2.1 The seasons effect on shoot growth pattern of cool-seasonand warm-season grasses. Figure adopted from Fundamentals of Turfgrass (Christians, 2004)
Pairing a sod-forming rhizomatous or stoloniferous species with that of a bunch
type species was another factor in mixture selection. Many of the chosen
bunchgrasses have the desired turfgrass qualities, but because of their growth habit,
may not be suited for the sod producing industry. Because the turfgrass industry uses
both seeding and sodding techniques for establishment, mixtures were chosen to
accommodate both (Table 2.2).
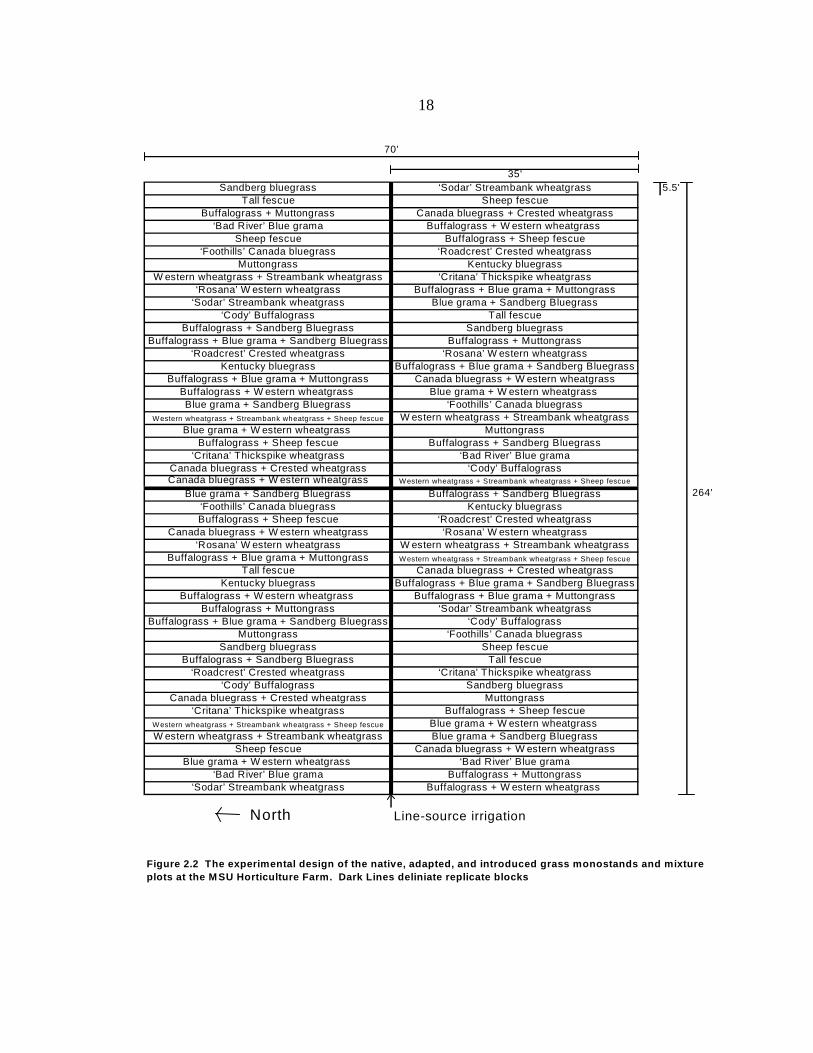
Experimental Design and Procedures
Ninety-six test plots were established in a split-plot design in a 70 by 264 feet
field orientated east-west to lessen the effect of the prevailing winds from the west
(Figure 2.2).
18
35'Sandberg bluegrass ‘Sodar’ Streambank wheatgrass 5.5'
Tall fescue Sheep fescueBuffalograss + Muttongrass Canada bluegrass + Crested wheatgrass
‘Bad River’ Blue grama Buffalograss + W estern wheatgrass Sheep fescue Buffalograss + Sheep fescue
‘Foothills’ Canada bluegrass ‘Roadcrest’ Crested wheatgrassMuttongrass Kentucky bluegrass
W estern wheatgrass + Streambank wheatgrass ‘Critana’ Thickspike wheatgrass‘Rosana’ W estern wheatgrass Buffalograss + Blue grama + Muttongrass
‘Sodar’ Streambank wheatgrass Blue grama + Sandberg Bluegrass‘Cody’ Buffalograss Tall fescue
Buffalograss + Sandberg Bluegrass Sandberg bluegrassBuffalograss + Blue grama + Sandberg Bluegrass Buffalograss + Muttongrass
‘Roadcrest’ Crested wheatgrass ‘Rosana’ W estern wheatgrassKentucky bluegrass Buffalograss + Blue grama + Sandberg Bluegrass
Buffalograss + Blue grama + Muttongrass Canada bluegrass + W estern wheatgrassBuffalograss + W estern wheatgrass Blue grama + W estern wheatgrass Blue grama + Sandberg Bluegrass ‘Foothills’ Canada bluegrass
Western wheatgrass + Streambank wheatgrass + Sheep fescue W estern wheatgrass + Streambank wheatgrassBlue grama + W estern wheatgrass Muttongrass
Buffalograss + Sheep fescue Buffalograss + Sandberg Bluegrass‘Critana’ Thickspike wheatgrass ‘Bad River’ Blue grama
Canada bluegrass + Crested wheatgrass ‘Cody’ BuffalograssCanada bluegrass + W estern wheatgrass Western wheatgrass + Streambank wheatgrass + Sheep fescue
Blue grama + Sandberg Bluegrass Buffalograss + Sandberg Bluegrass‘Foothills’ Canada bluegrass Kentucky bluegrassBuffalograss + Sheep fescue ‘Roadcrest’ Crested wheatgrass
Canada bluegrass + W estern wheatgrass ‘Rosana’ W estern wheatgrass‘Rosana’ W estern wheatgrass W estern wheatgrass + Streambank wheatgrass
Buffalograss + Blue grama + Muttongrass Western wheatgrass + Streambank wheatgrass + Sheep fescue
Tall fescue Canada bluegrass + Crested wheatgrassKentucky bluegrass Buffalograss + Blue grama + Sandberg Bluegrass
Buffalograss + W estern wheatgrass Buffalograss + Blue grama + MuttongrassBuffalograss + Muttongrass ‘Sodar’ Streambank wheatgrass
Buffalograss + Blue grama + Sandberg Bluegrass ‘Cody’ BuffalograssMuttongrass ‘Foothills’ Canada bluegrass
Sandberg bluegrass Sheep fescueBuffalograss + Sandberg Bluegrass Tall fescue
‘Roadcrest’ Crested wheatgrass ‘Critana’ Thickspike wheatgrass‘Cody’ Buffalograss Sandberg bluegrass
Canada bluegrass + Crested wheatgrass Muttongrass‘Critana’ Thickspike wheatgrass Buffalograss + Sheep fescue
Western wheatgrass + Streambank wheatgrass + Sheep fescue Blue grama + W estern wheatgrass W estern wheatgrass + Streambank wheatgrass Blue grama + Sandberg Bluegrass
Sheep fescue Canada bluegrass + W estern wheatgrassBlue grama + W estern wheatgrass ‘Bad River’ Blue grama
‘Bad River’ Blue grama Buffalograss + Muttongrass‘Sodar’ Streambank wheatgrass Buffalograss + W estern wheatgrass
North Line-source irrigation
264'
Figure 2.2 The experimental design of the native, adapted, and introduced grass monostands and mixture plots at the M SU Horticulture Farm. Dark Lines deliniate replicate blocks
70'
19
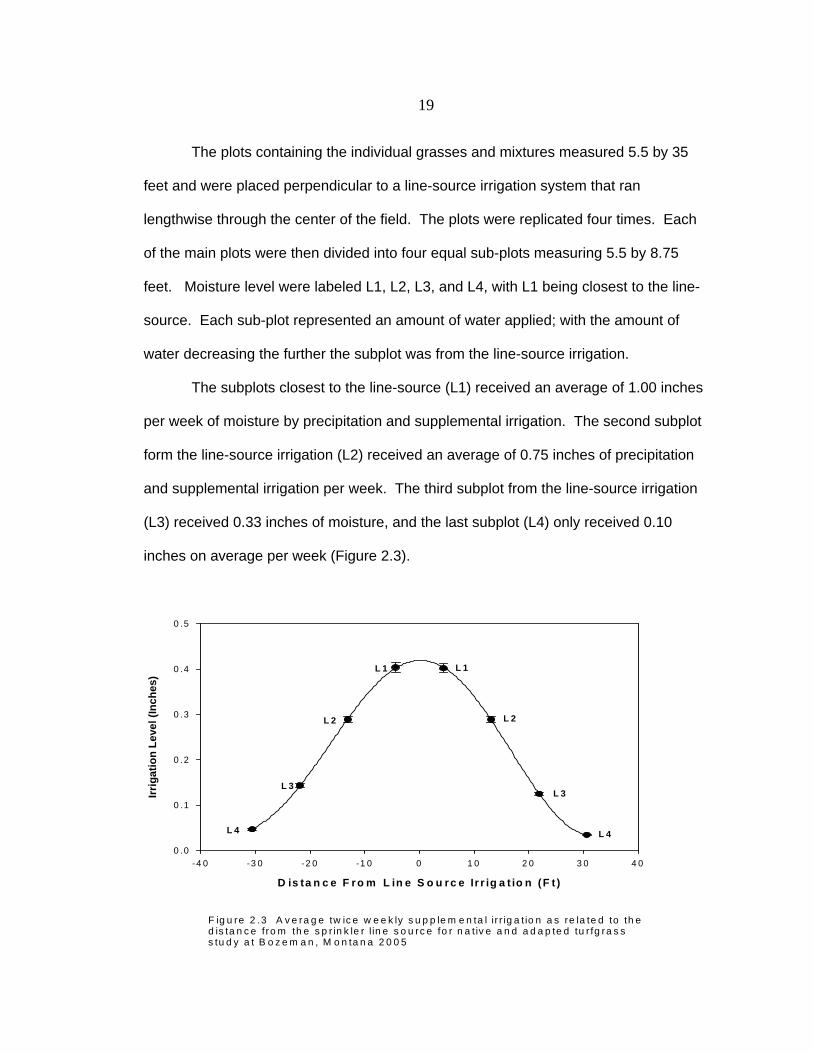
The plots containing the individual grasses and mixtures measured 5.5 by 35
feet and were placed perpendicular to a line-source irrigation system that ran
lengthwise through the center of the field. The plots were replicated four times. Each
of the main plots were then divided into four equal sub-plots measuring 5.5 by 8.75
feet. Moisture level were labeled L1, L2, L3, and L4, with L1 being closest to the line-
source. Each sub-plot represented an amount of water applied; with the amount of
water decreasing the further the subplot was from the line-source irrigation.
The subplots closest to the line-source (L1) received an average of 1.00 inches
per week of moisture by precipitation and supplemental irrigation. The second subplot
form the line-source irrigation (L2) received an average of 0.75 inches of precipitation
and supplemental irrigation per week. The third subplot from the line-source irrigation
(L3) received 0.33 inches of moisture, and the last subplot (L4) only received 0.10
inches on average per week (Figure 2.3).
D is ta n c e F ro m L in e S o u rc e Ir r ig a t io n (F t )
-4 0 -3 0 -2 0 -1 0 0 1 0 2 0 3 0 4 0
Irrig
atio
n Le
vel (
Inch
es)
0 .0
0 .1
0 .2
0 .3
0 .4
0 .5
L 1
L 2
L 1
L 2
L 3L 3
L 4 L 4
F ig u re 2 .3 A v e ra g e tw ic e w e e k ly s u p p le m e n ta l ir r ig a t io n a s re la te d to th e d is ta n c e fro m th e s p r in k le r l in e s o u rc e fo r n a t iv e a n d a d a p te d tu r fg ra s s s tu d y a t B o z e m a n , M o n ta n a 2 0 0 5
20
Field Establishment
Preparation of the plots consisted of working the field with a harrow and hand-
raking the field to create an even planting area. The seed was measured for each sub-
plot at a rate of 500 pure live seed (PLS) per square foot. For mixtures, the rates were
divided evenly among species. The seed was then evenly broadcast on each sub-plot.
The seed was then raked into the seed bed with a common garden rake. To eliminate
air pockets and to enhance seed-soil contact, the plots were rolled over using a garden
roller.
Irrigation
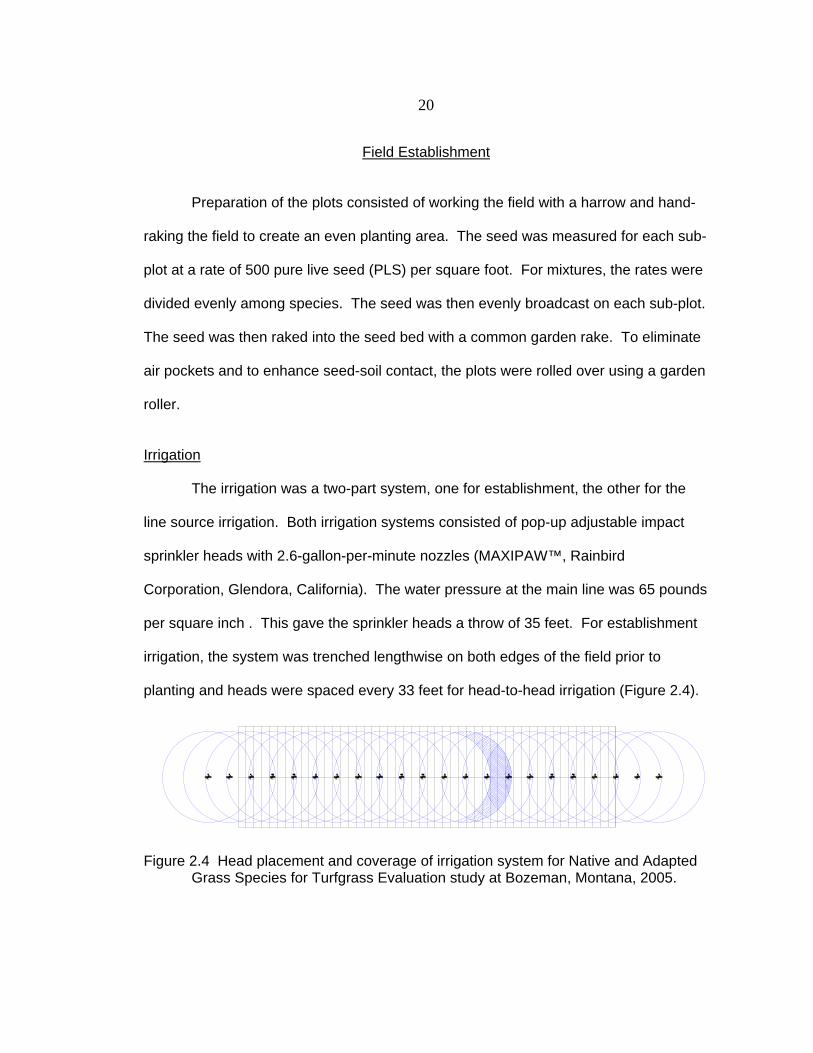
The irrigation was a two-part system, one for establishment, the other for the
line source irrigation. Both irrigation systems consisted of pop-up adjustable impact
sprinkler heads with 2.6-gallon-per-minute nozzles (MAXIPAW™, Rainbird
Corporation, Glendora, California). The water pressure at the main line was 65 pounds
per square inch . This gave the sprinkler heads a throw of 35 feet. For establishment
irrigation, the system was trenched lengthwise on both edges of the field prior to
planting and heads were spaced every 33 feet for head-to-head irrigation (Figure 2.4).
Figure 2.4 Head placement and coverage of irrigation system for Native and Adapted Grass Species for Turfgrass Evaluation study at Bozeman, Montana, 2005.
21
Another line was trenched lengthwise through the center of the plots and heads
were spaced every 30 feet. In the second season the center line was used as part of
the line source irrigation. During the establishment period, plots were irrigated at an
average rate of three-quarters of an inch per week throughout the growing season,
depending on the prevailing temperature and precipitation conditions.
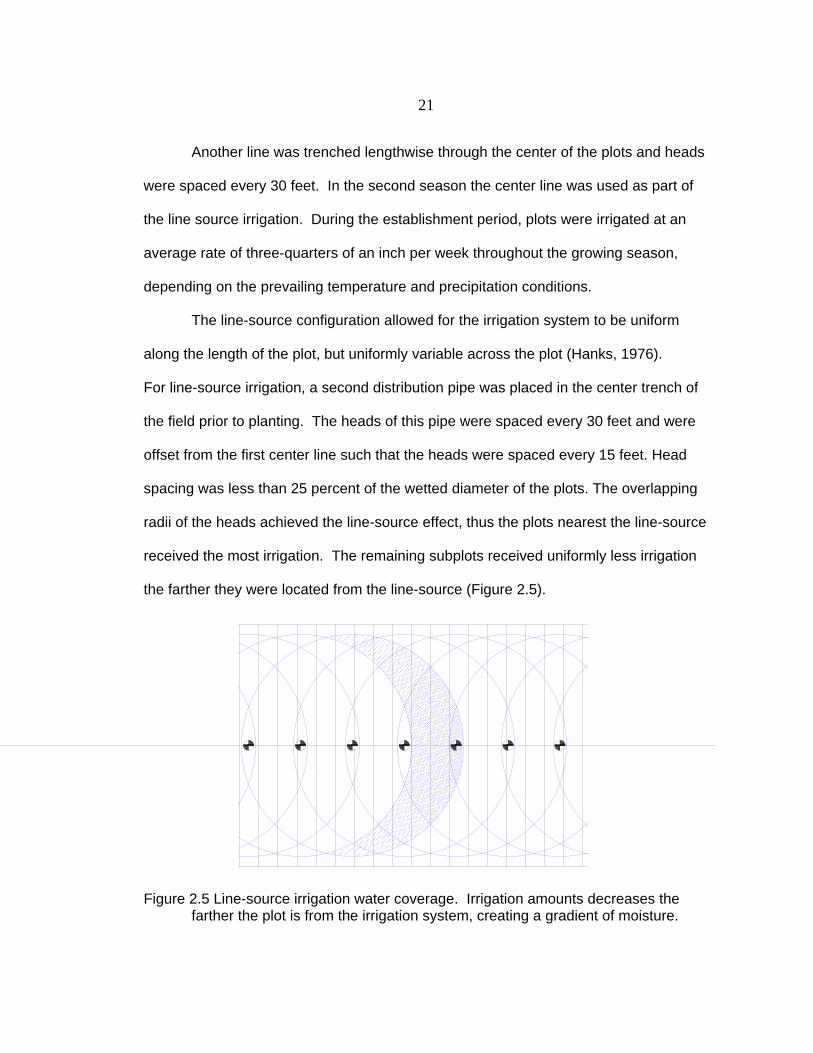
The line-source configuration allowed for the irrigation system to be uniform
along the length of the plot, but uniformly variable across the plot (Hanks, 1976).
For line-source irrigation, a second distribution pipe was placed in the center trench of
the field prior to planting. The heads of this pipe were spaced every 30 feet and were
offset from the first center line such that the heads were spaced every 15 feet. Head
spacing was less than 25 percent of the wetted diameter of the plots. The overlapping
radii of the heads achieved the line-source effect, thus the plots nearest the line-source
received the most irrigation. The remaining subplots received uniformly less irrigation
the farther they were located from the line-source (Figure 2.5).
Figure 2.5 Line-source irrigation water coverage. Irrigation amounts decreases the farther the plot is from the irrigation system, creating a gradient of moisture.
22
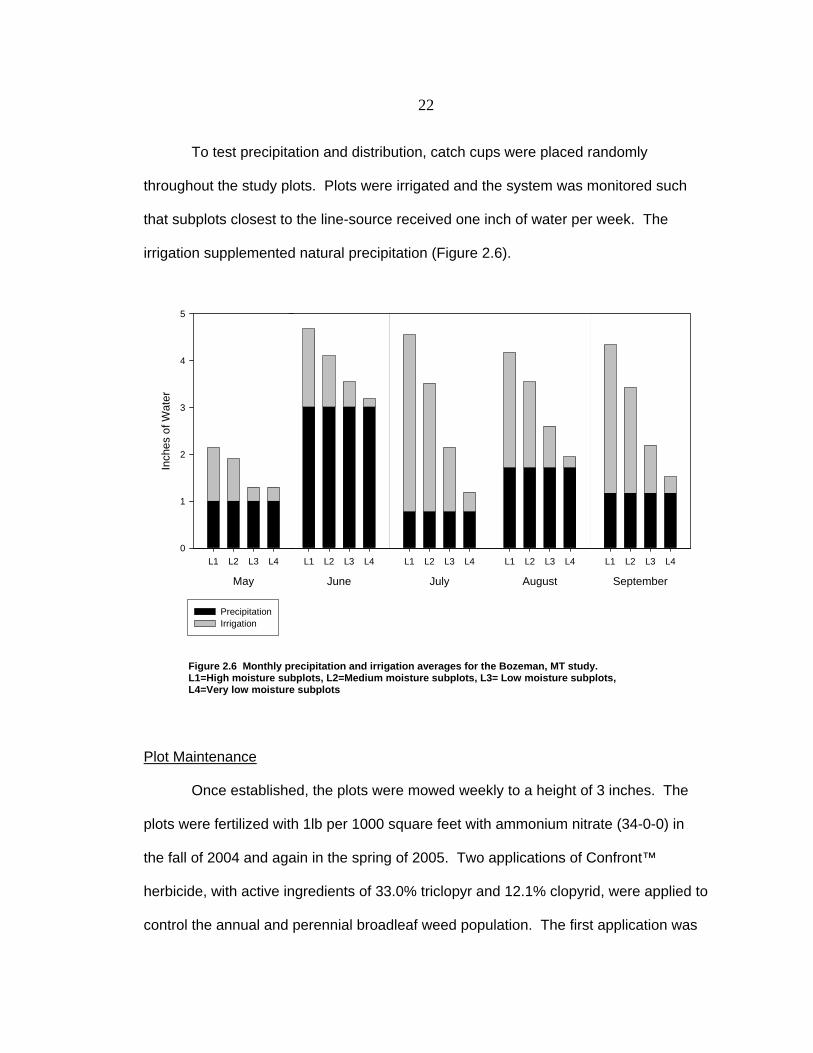
To test precipitation and distribution, catch cups were placed randomly
throughout the study plots. Plots were irrigated and the system was monitored such
that subplots closest to the line-source received one inch of water per week. The
irrigation supplemented natural precipitation (Figure 2.6).
Figure 2.6 Monthly precipitation and irrigation averages for the Bozeman, MT study.L1=High moisture subplots, L2=Medium moisture subplots, L3= Low moisture subplots, L4=Very low moisture subplots
May
L1 L2 L3 L4
Inch
es o
f Wat
er
0
1
2
3
4
5
PrecipitationIrrigation
June
L1 L2 L3 L4
July
L1 L2 L3 L4
August
L1 L2 L3 L4
September
L1 L2 L3 L4
Plot Maintenance
Once established, the plots were mowed weekly to a height of 3 inches. The
plots were fertilized with 1lb per 1000 square feet with ammonium nitrate (34-0-0) in
the fall of 2004 and again in the spring of 2005. Two applications of Confront™
herbicide, with active ingredients of 33.0% triclopyr and 12.1% clopyrid, were applied to
control the annual and perennial broadleaf weed population. The first application was
23
applied in the fall of 2004 at a rate of 1 pint per acre. The second application was
applied in the late spring of 2005 at a rate of 2 pints per acre.
Data Collection and Statistical Analysis
Hypothesis 1: Native and adapted grasses will hold their desired turfgrass
qualities under low water conditions.
Monthly measurements were performed to find dry weight, and to rate the
color, texture, and density of the single species and mixtures. Once a month,
immediately prior to the weekly mowing, a randomly selected 25 square centimeter
section of each subplot was harvested above 3 inches. The clipped material was dried
in a drying oven at 70ºC for 48 hours and weighed to find the dry weight.
Following the clipping collection, and prior to the weekly mowing, the entire
plots were evaluated for color, texture, and density using NTEP guidelines (NTEP)
Color was rated on a 1 to 9 scale with one equaling straw brown and nine equaling
dark green. Texture was measured on a 1 to 9 scale with one equaling coarse texture
and nine equaling fine texture. Density was measured using a 1 to 9 scale with one
equaling bare ground and nine equaling maximum density. The data for single species
was analyzed within species using the SAS mixed model. (SAS Institute, Cary, NC).
Hypothesis 2: Mixtures of the adapted and native grasses will hold their desired
turfgrass qualities under low water conditions.
Plots containing mixtures were evaluated monthly using the same steps outlined
above. The data was analyzed as to whether the mixtures held their turfgrass quality
consistently throughout the season.
Hypothesis 3: Native and adapted grasses and their mixtures will retain desirable
turfgrass qualities while requiring less water than Kentucky bluegrass and tall fescue.

24
The data was analyzed and general characteristics of the plots’ overall turfgrass
color, texture, and density were considered. A generalization was then made about
whether each monostand or mixture had overall turfgrass qualities and was labeled a
good, fair, or poor turfgrass.
The recommended minimum moisture and timing of irrigation needed for
optimum turfgrass quality of the single species and mixtures was found by plotting the
one-hundred-year-weekly average precipitation for Bozeman, Montana, against the
minimum moisture needed each month for each grass or mixture to retain its optimum
turfgrass quality. Minimum water requirements for optimum turfgrass quality were
determined by selecting the subplot with the least amount of irrigation which retained
statistically the highest ratings for color, texture, and density. The timing for irrigation
was determined when the precipitation no longer sustained optimum turfgrass quality.
The point at which the two plots intersected was the estimated time in which irrigation
should begin. The recommended minimum weekly irrigation required was calculated
by subtracting the highest minimum moisture amount of the season from the average
weekly precipitation.
Bozeman, Montana is situated in the Rocky Mountains and has a comparable
environment and climate to much of the Intermountain west. The recommended timing
and level of irrigation was based on the average precipitation for Bozeman. The data
from Bozeman, Montana study can be applied to anywhere in the Intermountain west
by substituting their average weekly precipitation of other areas and evaluating the
data.
25
RESULTS
Results for Turfgrass Quality
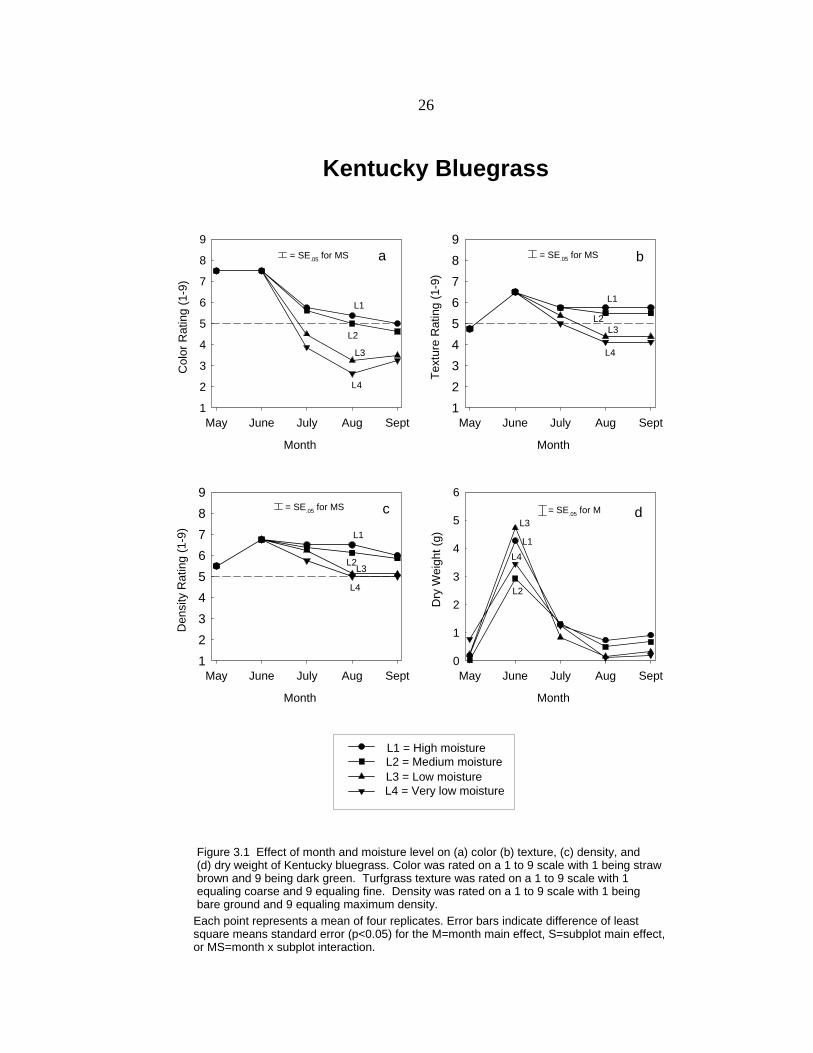
Kentucky Bluegrass
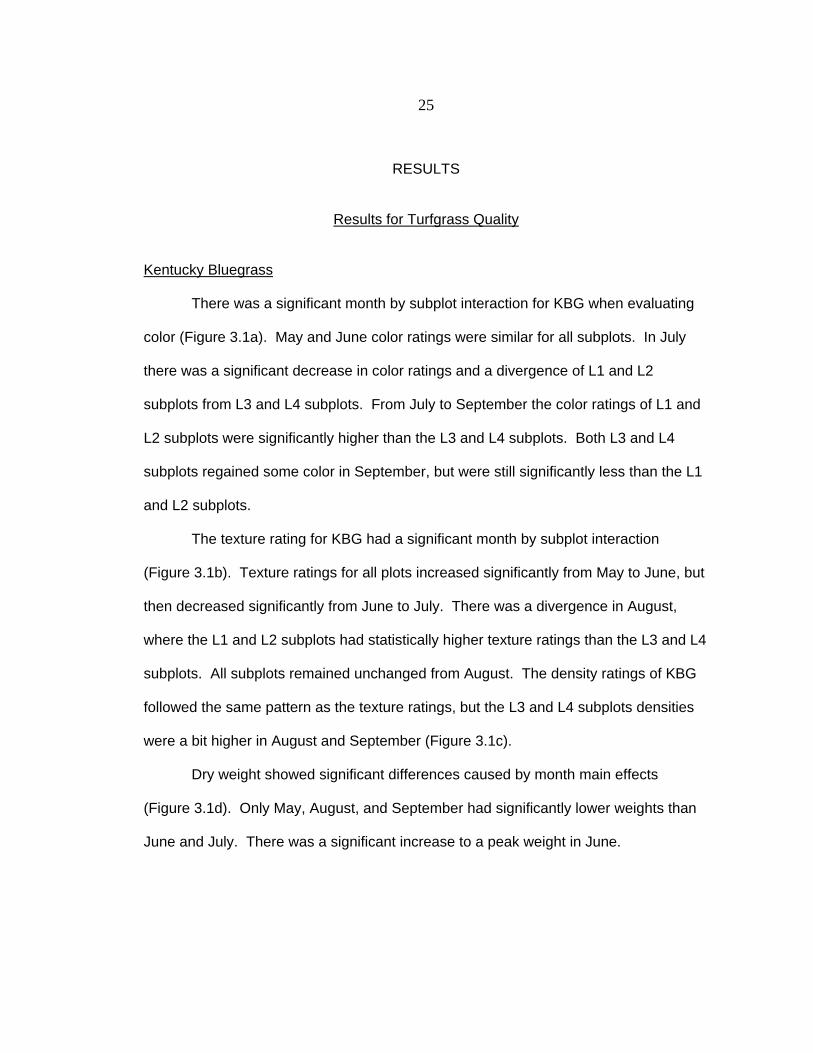
There was a significant month by subplot interaction for KBG when evaluating
color (Figure 3.1a). May and June color ratings were similar for all subplots. In July
there was a significant decrease in color ratings and a divergence of L1 and L2
subplots from L3 and L4 subplots. From July to September the color ratings of L1 and
L2 subplots were significantly higher than the L3 and L4 subplots. Both L3 and L4
subplots regained some color in September, but were still significantly less than the L1
and L2 subplots.
The texture rating for KBG had a significant month by subplot interaction
(Figure 3.1b). Texture ratings for all plots increased significantly from May to June, but
then decreased significantly from June to July. There was a divergence in August,
where the L1 and L2 subplots had statistically higher texture ratings than the L3 and L4
subplots. All subplots remained unchanged from August. The density ratings of KBG
followed the same pattern as the texture ratings, but the L3 and L4 subplots densities
were a bit higher in August and September (Figure 3.1c).
Dry weight showed significant differences caused by month main effects
(Figure 3.1d). Only May, August, and September had significantly lower weights than
June and July. There was a significant increase to a peak weight in June.
26
Month
May June July Aug Sept
Den
sity
Rat
ing
(1-9
)
123456789
Month
May June July Aug SeptTe
xtur
e R
atin
g (1
-9)
123456789
L1
L2L3
L4
Kentucky Bluegrass
b
c
Month
May June July Aug Sept
Col
or R
atin
g (1
-9)
1
2
3
4
5
6
7
8
9
L1
L2
L3
L4
= SE.05 for MS a
= SE.05 for MS
Month
May June July Aug Sept
Dry
Wei
ght (
g)
0
1
2
3
4
5
6
L1
L2
L3
L4
d= SE.05 for M
L2
L4
L1
L3
= SE.05 for MS
L1 = High moistureL2 = Medium moistureL3 = Low moistureL4 = Very low moisture
Figure 3.1 Effect of month and moisture level on (a) color (b) texture, (c) density, and(d) dry weight of Kentucky bluegrass. Color was rated on a 1 to 9 scale with 1 being strawbrown and 9 being dark green. Turfgrass texture was rated on a 1 to 9 scale with 1equaling coarse and 9 equaling fine. Density was rated on a 1 to 9 scale with 1 being bare ground and 9 equaling maximum density.
Each point represents a mean of four replicates. Error bars indicate difference of leastsquare means standard error (p<0.05) for the M=month main effect, S=subplot main effect,or MS=month x subplot interaction.
27
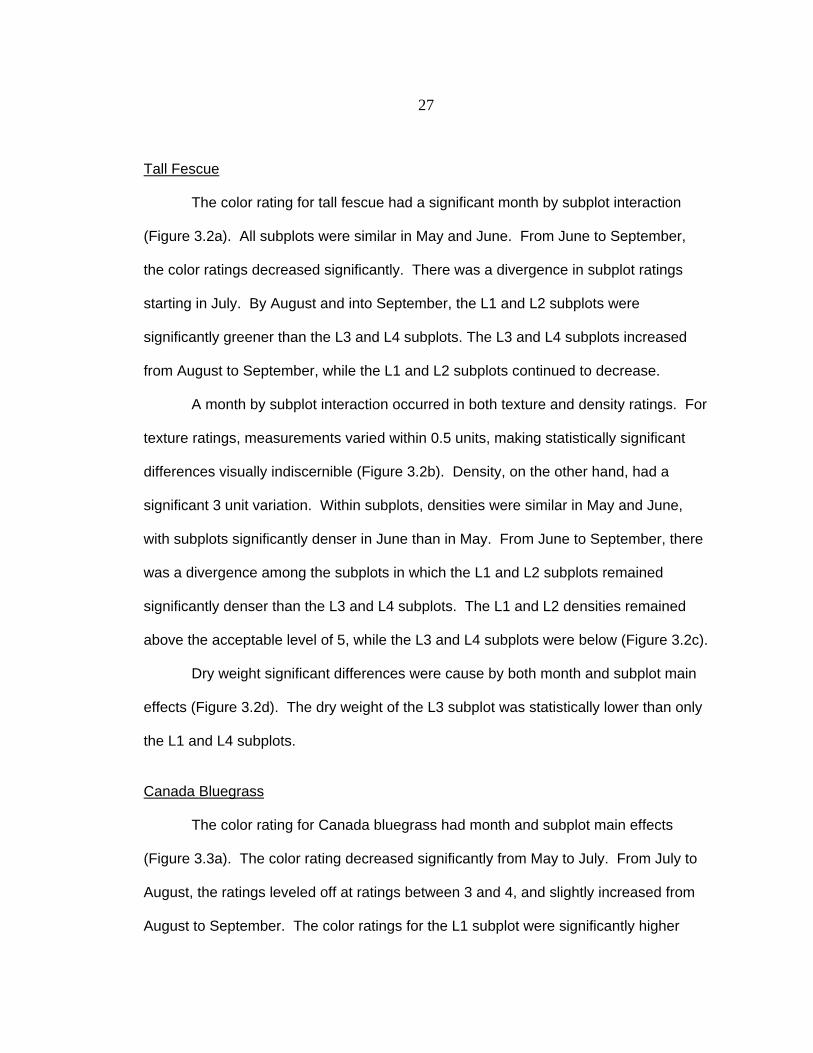
Tall Fescue
The color rating for tall fescue had a significant month by subplot interaction
(Figure 3.2a). All subplots were similar in May and June. From June to September,
the color ratings decreased significantly. There was a divergence in subplot ratings
starting in July. By August and into September, the L1 and L2 subplots were
significantly greener than the L3 and L4 subplots. The L3 and L4 subplots increased
from August to September, while the L1 and L2 subplots continued to decrease.
A month by subplot interaction occurred in both texture and density ratings. For
texture ratings, measurements varied within 0.5 units, making statistically significant
differences visually indiscernible (Figure 3.2b). Density, on the other hand, had a
significant 3 unit variation. Within subplots, densities were similar in May and June,
with subplots significantly denser in June than in May. From June to September, there
was a divergence among the subplots in which the L1 and L2 subplots remained
significantly denser than the L3 and L4 subplots. The L1 and L2 densities remained
above the acceptable level of 5, while the L3 and L4 subplots were below (Figure 3.2c).
Dry weight significant differences were cause by both month and subplot main
effects (Figure 3.2d). The dry weight of the L3 subplot was statistically lower than only
the L1 and L4 subplots.
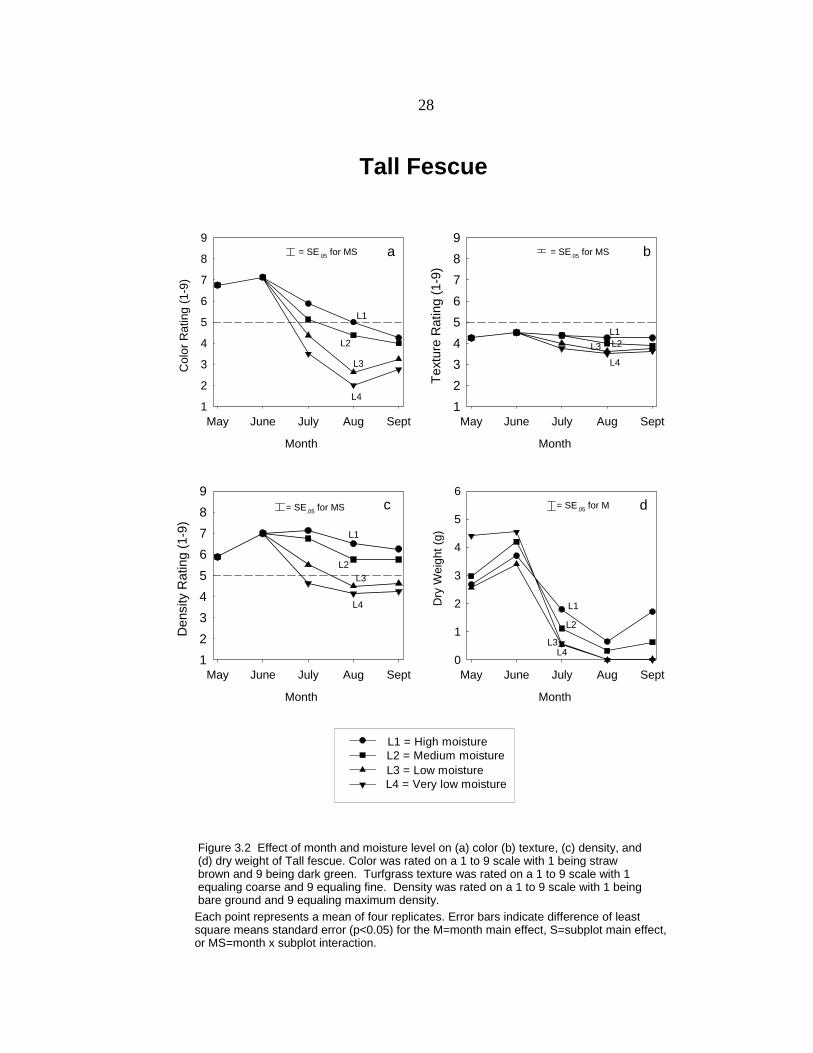
Canada Bluegrass The color rating for Canada bluegrass had month and subplot main effects
(Figure 3.3a). The color rating decreased significantly from May to July. From July to
August, the ratings leveled off at ratings between 3 and 4, and slightly increased from
August to September. The color ratings for the L1 subplot were significantly higher
28
Month
May June July Aug Sept
Den
sity
Rat
ing
(1-9
)
123456789
Month
May June July Aug SeptTe
xtur
e R
atin
g (1
-9)
123456789
Month
May June July Aug Sept
Col
or R
atin
g (1
-9)
1
2
3
4
5
6
7
8
9
L1L2L3
L4
L1
L2
L3
L4
L1
L2L3
L4
Tall Fescue
= SE.05 for MS = SE.05 for MS
= SE.05 for MS
a b
c
Month
May June July Aug Sept
Dry
Wei
ght (
g)
0
1
2
3
4
5
6
L1
L2
L3L4
d= SE.05 for M
Figure 3.2 Effect of month and moisture level on (a) color (b) texture, (c) density, and(d) dry weight of Tall fescue. Color was rated on a 1 to 9 scale with 1 being strawbrown and 9 being dark green. Turfgrass texture was rated on a 1 to 9 scale with 1equaling coarse and 9 equaling fine. Density was rated on a 1 to 9 scale with 1 being bare ground and 9 equaling maximum density.
Each point represents a mean of four replicates. Error bars indicate difference of leastsquare means standard error (p<0.05) for the M=month main effect, S=subplot main effect,or MS=month x subplot interaction.
L1 = High moistureL2 = Medium moistureL3 = Low moistureL4 = Very low moisture
29
Month
May June July Aug Sept
Den
sity
Rat
ing
(1-9
)
123456789
Month
May June July Aug SeptTe
xtur
e R
atin
g (1
-9)
123456789
Month
May June July Aug Sept
Col
or R
atin
g (1
-9)
1
2
3
4
5
6
7
8
9
L1 L2
L3 L4
L1L2L3
L4
L1L2
L3L4
Canada Bluegrass
= SE.05 for M = SE.05 for M
= SE.05 for M
a b
c
Month
May June July Aug Sept
Dry
Wei
ght (
g)
0123456789
10
L1
L2
L3
L4
d= SE.05 for MS
L1 = High moistureL2 = Medium moistureL3 = Low moistureL4 = Very low moisture
Figure 3.3 Effect of month and moisture level on (a) color (b) texture, (c) density, and(d) dry weight of Canada bluegrass. Color was rated on a 1 to 9 scale with 1 being strawbrown and 9 being dark green. Turfgrass texture was rated on a 1 to 9 scale with 1equaling coarse and 9 equaling fine. Density was rated on a 1 to 9 scale with 1 being bare ground and 9 equaling maximum density.
Each point represents a mean of four replicates. Error bars indicate difference of leastsquare means standard error (p<0.05) for the M=month main effect, S=subplot main effect,or MS=month x subplot interaction.
30
than the color ratings for theL3 and L4 subplots. The color rating of the L2 subplot was
statistically higher than the L4 subplot.
The texture rating for Canada bluegrass had a month main effect (Figure 3.3b).
In May the texture ratings averaged just over 4. The ratings lowered slightly in July
and rebounded through August and September. Texture ratings fluctuated at most one
point on a scale of 1-9, a difference the human eye would barely discern.
Density ratings had month and subplot main effects (Figure 3.3c). Density
decreased from May to June, then increased from July to September. Density of L1
and L2 subplots was significantly higher than L3 and L4 subplots.
Dry weight in Canada bluegrass had a significant month by subplot interaction
(Figure 3.3d). Because of the rain episodes in May, dry weights during the month were
high, with the L3 and L4 subplots yielding the statistically highest weight. From May to
June the dry weights of the subplots statistically increased, but all subplot dry weights
in June were not significantly different. Dry weights statistically decreased from June
to August. Dry weights for August and September were not significantly different from
one another, but were significantly lower than the previous months.
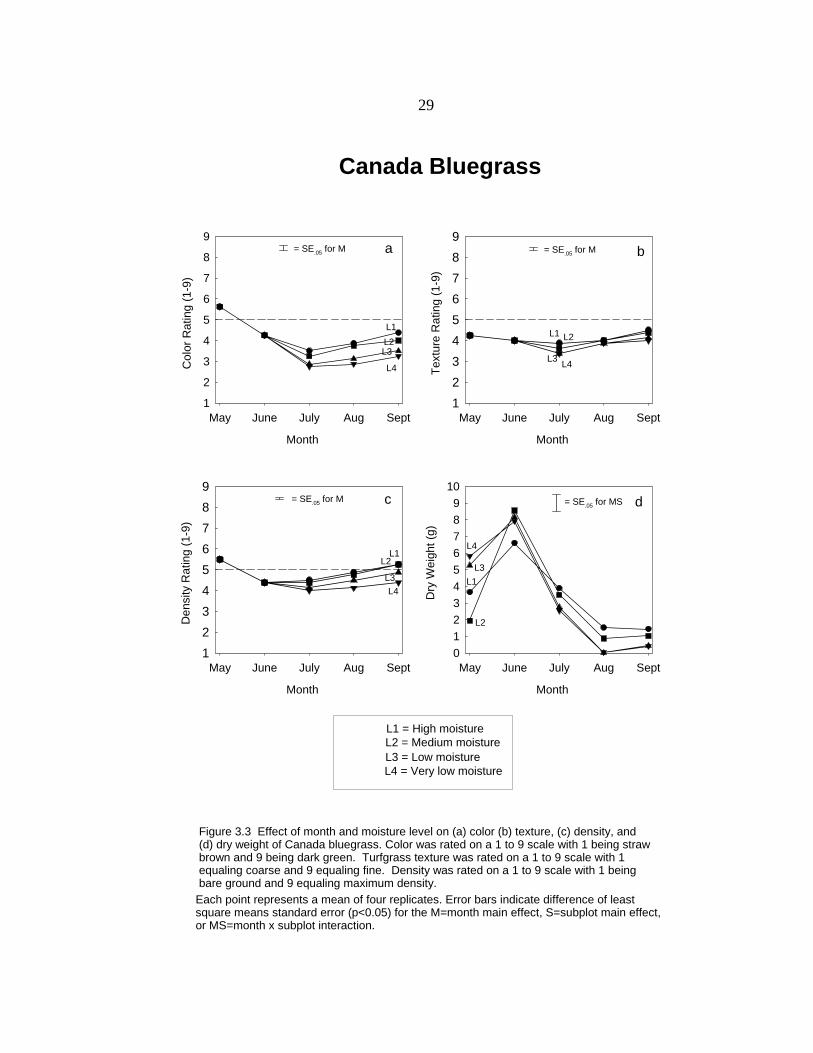
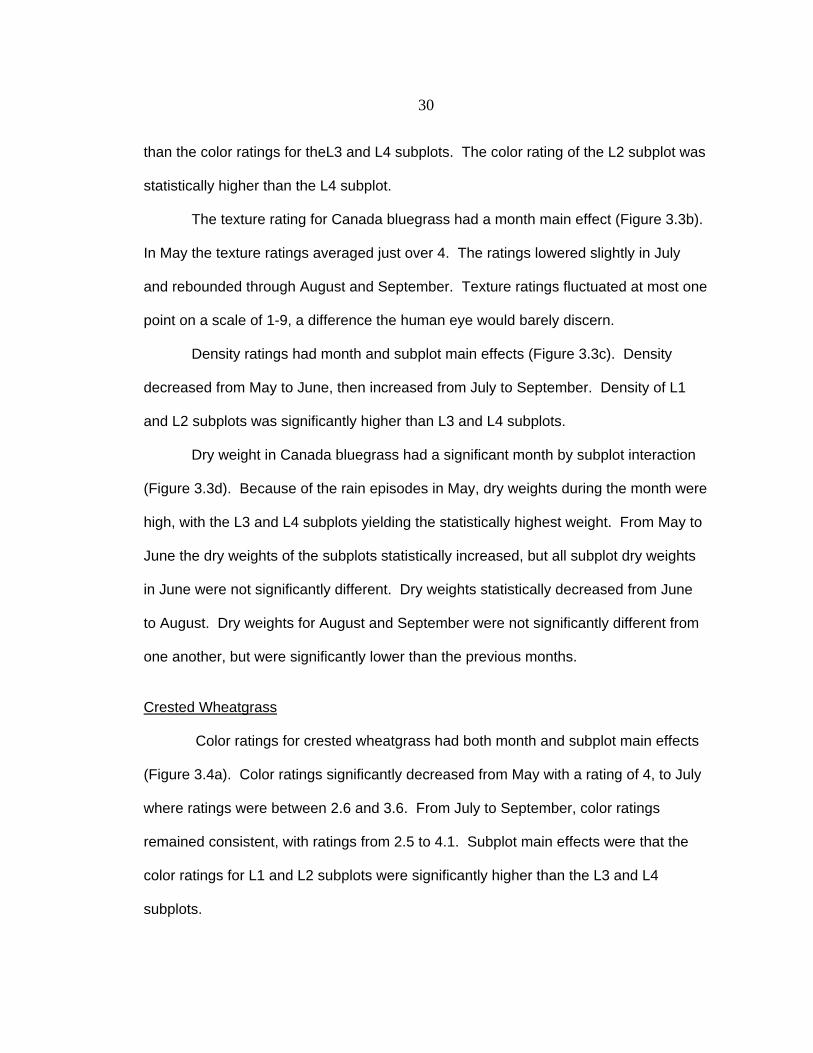
Crested Wheatgrass
Color ratings for crested wheatgrass had both month and subplot main effects
(Figure 3.4a). Color ratings significantly decreased from May with a rating of 4, to July
where ratings were between 2.6 and 3.6. From July to September, color ratings
remained consistent, with ratings from 2.5 to 4.1. Subplot main effects were that the
color ratings for L1 and L2 subplots were significantly higher than the L3 and L4
subplots.
31
Month
May June July Aug Sept
Den
sity
Rat
ing
(1-9
)
123456789
Month
May June July Aug SeptTe
xtur
e R
atin
g (1
-9)
123456789
Month
May June July Aug Sept
Col
or R
atin
g (1
-9)
1
2
3
4
5
6
7
8
9
L1L2 L3
L4
L1
L2L3
L4
L1
L2L3
L4
Crested Wheatgrass
= SE.05 for S = SE.05 for S
= SE.05 for S
a b
c
Month
May June July Aug Sept
Dry
Wei
ght (
g)
0
1
2
3
4
5
6
L1
L2
L3
L4
d= SE.05 for M
L1 = High moistureL2 = Medium moistureL3 = Low moistureL4 = Very low moisture
Figure 3.4 Effect of month and moisture level on (a) color (b) texture, (c) density, and(d) dry weight of crested wheatgrass. Color was rated on a 1 to 9 scale with 1 being strawbrown and 9 being dark green. Turfgrass texture was rated on a 1 to 9 scale with 1equaling coarse and 9 equaling fine. Density was rated on a 1 to 9 scale with 1 being bare ground and 9 equaling maximum density.
Each point represents a mean of four replicates. Error bars indicate difference of leastsquare means standard error (p<0.05) for the M=month main effect, S=subplot main effect,or MS=month x subplot interaction.
32
Texture and density ratings had month and subplot main effects; although
ratings increased slightly during the summer, the changes were not visually significant
(Figure3.4b,c).
Significant differences among dry weights for crested wheatgrass were caused
by month main effects (Figure 3.4d). Plant weights were highest in May, with both
parameters significantly decreasing from May until August. Plant weight decreased the
most from May to June, and slowly decreased from June to August.
Muttongrass
Muttongrass was not evaluated due to its low vigor and a lack of competition
with weeds. Although muttongrass grows well in the greenhouse under manipulated
controls, in the field it was poor to establish and was out-competed by annual and
perennial broadleaf and grass weeds. This created a situation in which it was
impossible to collect data.
Sandberg Bluegrass
Sandberg bluegrass was not evaluated because of less than pure seed stock,
in which a range type tall fescue in the mixture overtook the plots making evaluations
impossible. The canopy of the plots was dominated by tall fescue and other weeds,
thus out-competing Sandberg bluegrass.
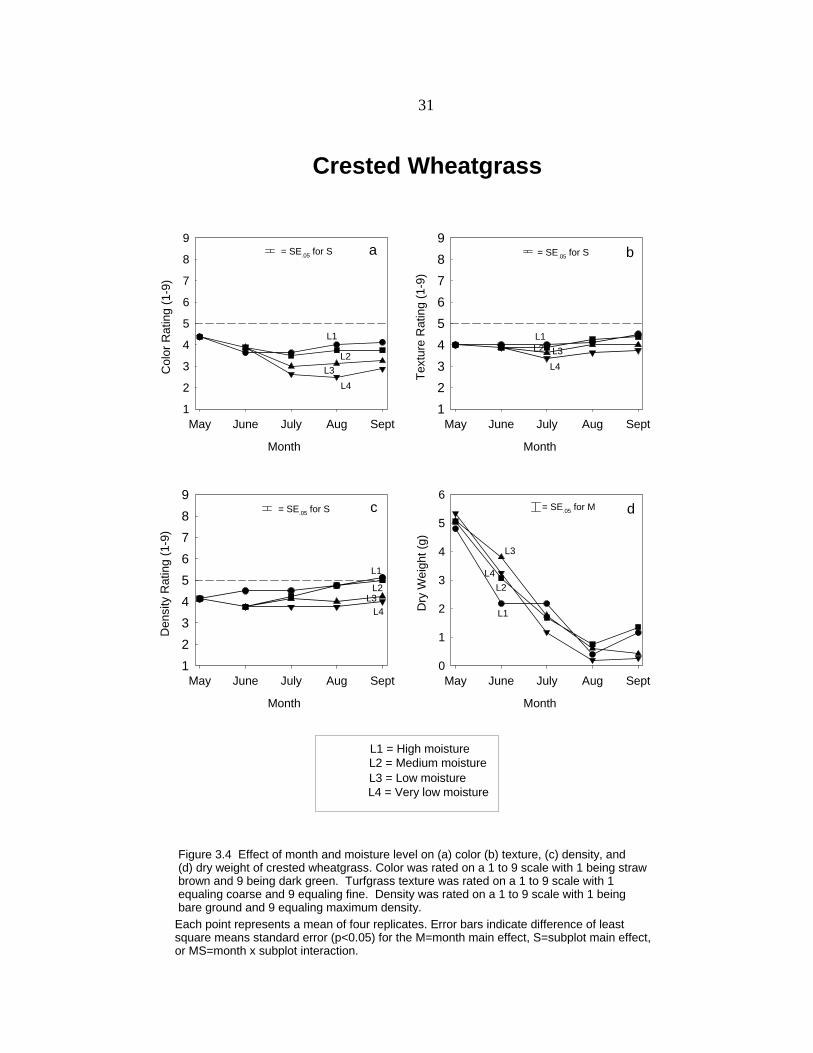
Sheep Fescue
There was a significant month by subplot interaction in the rating of color for sheep
fescue (Figure 3.5a). Color ratings in May and June were 6.1 and 6.2
33
Month
May June July Aug Sept
Den
sity
Rat
ing
(1-9
)
123456789
Month
May June July Aug SeptTe
xtur
e R
atin
g (1
-9)
123456789
Month
May June July Aug Sept
Col
or R
atin
g (1
-9)
1
2
3
4
5
6
7
8
9
L1
L2L3L4
L1
L2L3
L4
L1
L2L3L4
Sheep Fescue
= SE.05 for MS = SE.05 for MS
= SE.05 for MS
a b
c
Month
May June July Aug Sept
Dry
Wei
ght (
g)
0
1
2
3
4
5
6
L1
L2
L3
L4
d= SE.05 for MS
L1 = High moistureL2 = Medium moistureL3 = Low moistureL4 = Very low moisture
Figure 3.5 Effect of month and moisture level on (a) color (b) texture, (c) density, and(d) dry weight of sheep fescue. Color was rated on a 1 to 9 scale with 1 being strawbrown and 9 being dark green. Turfgrass texture was rated on a 1 to 9 scale with 1equaling coarse and 9 equaling fine. Density was rated on a 1 to 9 scale with 1 being bare ground and 9 equaling maximum density.Each point represents a mean of four replicates. Error bars indicate difference of leastsquare means standard error (p<0.05) for the M=month main effect, S=subplot main effect,or MS=month x subplot interaction.

34
respectively. In July, there was divergence in which the L1 and L2 subplots color
ratings were significantly higher than the L3 and L4 subplots. By August, the L1 and
L2 subplots color remained above the accepted rating of 5, and was significantly higher
than the L3 and L4 subplots.
Texture and density had significant month by subplot interactions, although
differences were within one unit, a range narrowly discernable by the human eye.
Texture ratings remained high with only the L4 subplot falling below the accepted level,
and significantly lower than rest of the subplots (Figure 3.5b). Density rating
differences likely would not be dicernable and were above the accepted rating of 5
(Figure 3.5c).
Dry weight for sheep fescue had a significant month by subplot interaction
(Figure 3.5d). Weights did not follow convention in the first month; the weights for L1
and L2 subplots were significantly lower than the L3 and L4 subplots. Weights for L3
and L4 subplots had a significant drop throughout the summer, while the L1 subplot
remained consistent throughout the summer. The L2 subplot had significantly higher
weights in June rather than in May.
Streambank Wheatgrass
Differences in color ratings for streambank wheatgrass were caused by both a
month and a subplot main effect (Figure 3.6a). The color for streambank wheatgrass
was highest in May. The color ratings fell significantly from May to July. The color
rating remained low for the remainder of the season with only a slight increase from
August to September. The L1 and L2 subplots overall were significantly higher than
the L3 and L4 subplots.
35
Month
May June July Aug Sept
Den
sity
Rat
ing
(1-9
)
123456789
Month
May June July Aug SeptTe
xtur
e R
atin
g (1
-9)
123456789
Month
May June July Aug Sept
Col
or R
atin
g (1
-9)
1
2
3
4
5
6
7
8
9
L1
L2L3
L4
L1
L2L3
L4
L1
L2L3
L4
Streambank Wheatgrass
= SE.05 for S = SE.05 for MS
= SE.05 for S
a b
c
Month
May June July Aug Sept
Dry
Wei
ght (
g)
0
1
2
3
4
5
6
L1
L2
L3
L4
d= SE.05 for M
L1 = High moistureL2 = Medium moistureL3 = Low moistureL4 = Very low moisture
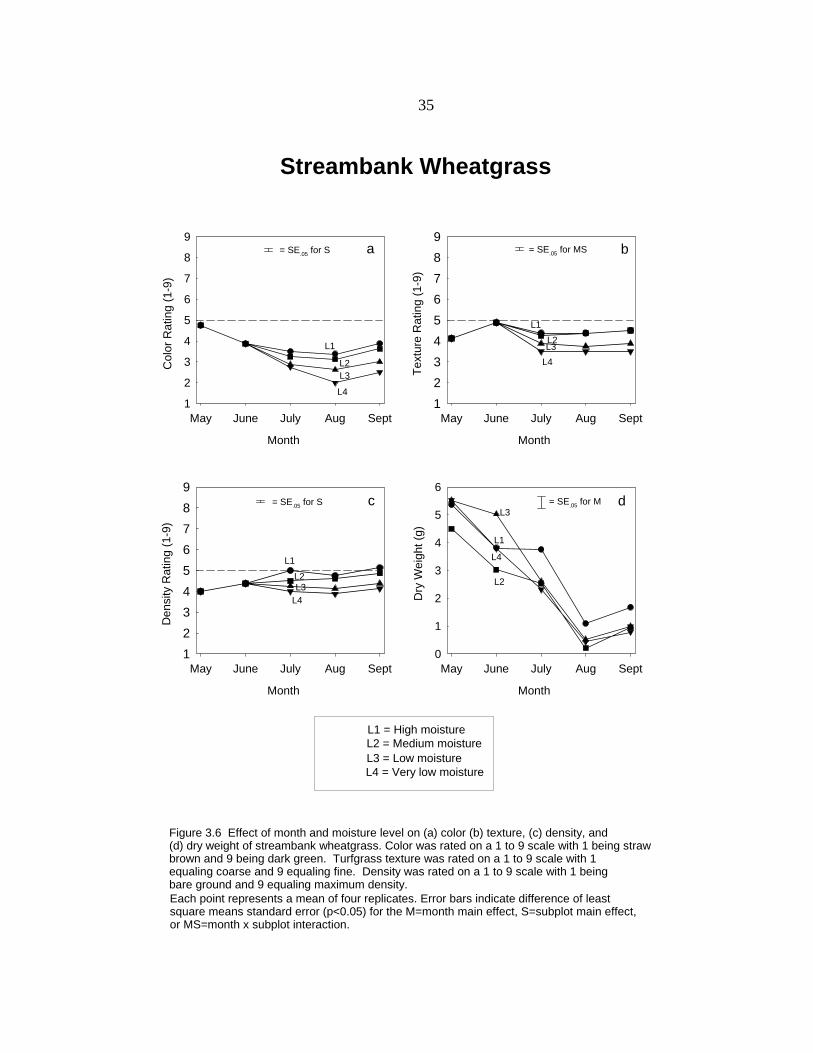
Figure 3.6 Effect of month and moisture level on (a) color (b) texture, (c) density, and(d) dry weight of streambank wheatgrass. Color was rated on a 1 to 9 scale with 1 being strawbrown and 9 being dark green. Turfgrass texture was rated on a 1 to 9 scale with 1equaling coarse and 9 equaling fine. Density was rated on a 1 to 9 scale with 1 being bare ground and 9 equaling maximum density.Each point represents a mean of four replicates. Error bars indicate difference of leastsquare means standard error (p<0.05) for the M=month main effect, S=subplot main effect,or MS=month x subplot interaction.
36
Differences in texture ratings for streambank wheatgrass were caused by a
significant month by subplot interaction, although the change was within one unit
(Figure 3.6b). The texture of the grass was below the acceptable level, except in June,
where all subplots were near the acceptable level of 5. Significant differences in
density were caused by both a month and subplot main effects (Figure 3.6c).
Densities increased significantly from May to June and leveled off for the remainder of
the year, although like texture, the change was within one unit.
Month main effects caused the significant differences in dry weight in
streambank wheatgrass (Figure 3.6d). Plant weights and water content were highest
in May. Plant weights significantly decreased from May to August. Plant water content
dropped significantly from May to July, and significantly dropped again from July to
September.
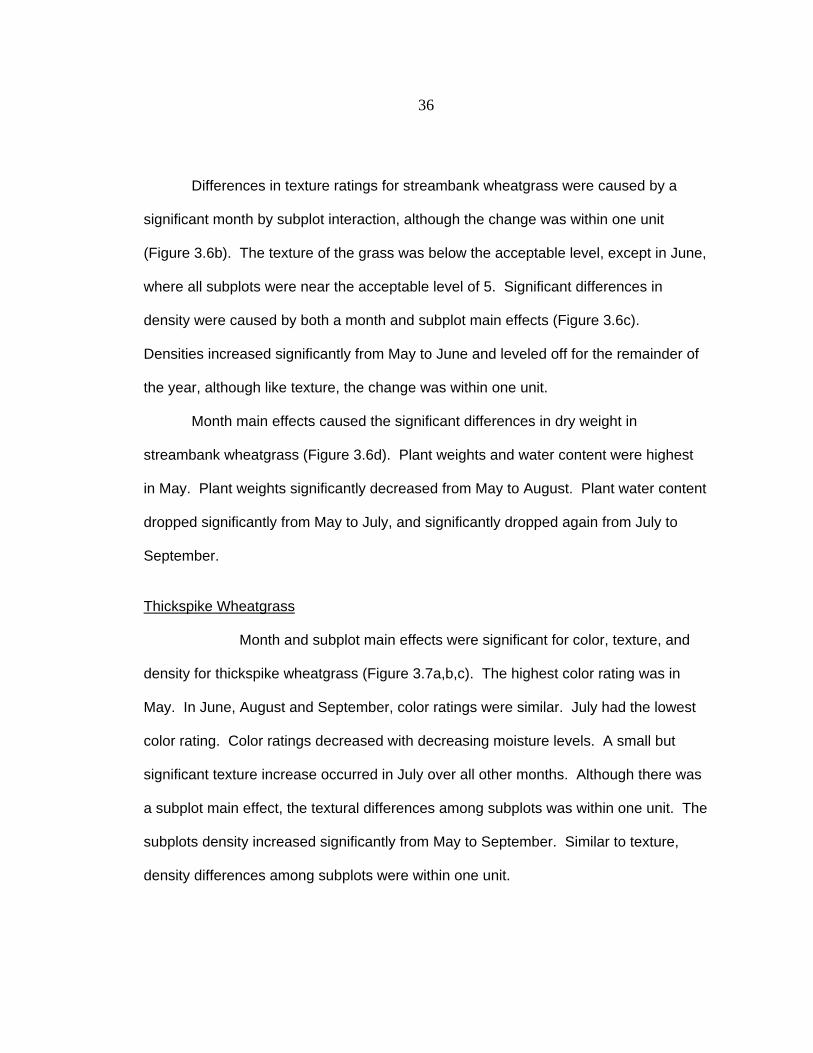
Thickspike Wheatgrass
Month and subplot main effects were significant for color, texture, and
density for thickspike wheatgrass (Figure 3.7a,b,c). The highest color rating was in
May. In June, August and September, color ratings were similar. July had the lowest
color rating. Color ratings decreased with decreasing moisture levels. A small but
significant texture increase occurred in July over all other months. Although there was
a subplot main effect, the textural differences among subplots was within one unit. The
subplots density increased significantly from May to September. Similar to texture,
density differences among subplots were within one unit.
37
Month
May June July Aug Sept
Den
sity
Rat
ing
(1-9
)
123456789
Month
May June July Aug SeptTe
xtur
e R
atin
g (1
-9)
123456789
Month
May June July Aug Sept
Col
or R
atin
g (1
-9)
1
2
3
4
5
6
7
8
9
L1L2L3
L4
L1
L2L3
L4
L1
L2 L3L4
Thickspike Wheatgrass
= SE.05 for S = SE.05 for M
= SE.05 for S
a b
c
L1 = High moistureL2 = Medium moistureL3 = Low moistureL4 = Very low moisture
Figure 3.7 Effect of month and moisture level on (a) color (b) texture, (c) density, and(d) dry weight of thickspike wheatgrass. Color was rated on a 1 to 9 scale with 1 being strawbrown and 9 being dark green. Turfgrass texture was rated on a 1 to 9 scale with 1equaling coarse and 9 equaling fine. Density was rated on a 1 to 9 scale with 1 being bare ground and 9 equaling maximum density.
Each point represents a mean of four replicates. Error bars indicate difference of leastsquare means standard error (p<0.05) for the M=month main effect, S=subplot main effect,or MS=month x subplot interaction.
Month
May June July Aug Sept
Dry
Wei
ght (
g)
0
1
2
3
4
5
6
7
8
L1
L2
L3
L4
d= SE.05 for MS

38
There was a significant month by subplot interaction for and dry weight of
thickspike wheatgrass (Figure 3.7d). In May, the L4 subplot produced the significantly
highest dry weight. In June the subplot plant weights converged. Plant weights
dropped significantly from June to September. The L2, L3, and L4 subplots dropped
weight significantly faster than the L1 subplot. The L1 subplot decreased in weight less
drastically, but eventually had low weights in September, similar to the other subplots.
Western Wheatgrass
Color rating significant differences were caused by month and subplot main
effects (Figure 3.8a). The color rating remained fairly level throughout the season,
although July, August and September were statistically less than May and June. Color
ratings of L1 and L2 subplots were significantly higher than the L3 and L4 subplots.
Texture ratings had a month by subplot interaction (Figure 3.8b). The texture of
western wheatgrass was highest in June, with a divergence of the L1 and L2 subplots
from the L3 and L4 subplots by September. However, the differences between
subplots were within 0.5 units. Density ratings were caused by month and subplot main
effects (Figure 3.8c). Density ratings increased statistically in the later part of the
season, but again would have been hard to observe because the increases were also
within one unit.
The significant differences in dry weight of western wheatgrass were caused by
month main effects (Figure 3.8d). Dry weights were significantly higher from May to
June, but decreased significantly from June to August.
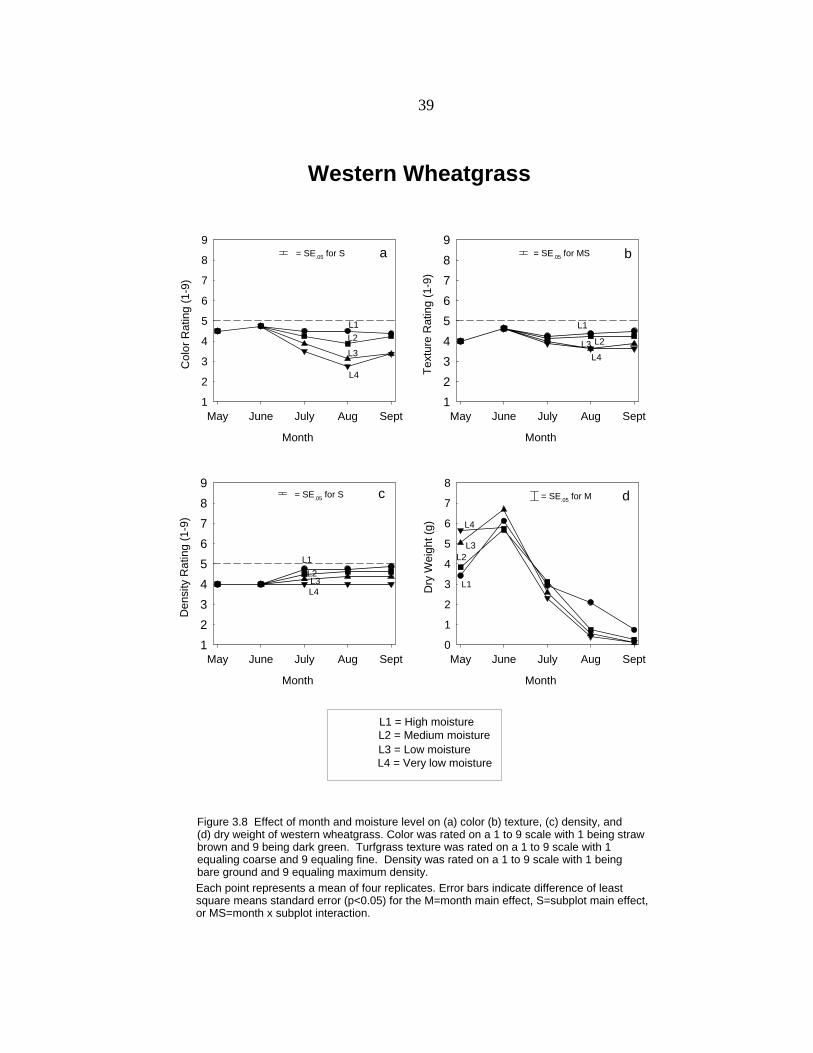
39
Month
May June July Aug Sept
Den
sity
Rat
ing
(1-9
)
123456789
Month
May June July Aug SeptTe
xtur
e R
atin
g (1
-9)
123456789
Month
May June July Aug Sept
Col
or R
atin
g (1
-9)
1
2
3
4
5
6
7
8
9
L1
L2L3L4
L1L2
L3
L4
L1L2L3
Western Wheatgrass
= SE.05 for S = SE.05 for MS
= SE.05 for S
a b
c
L4
Month
May June July Aug Sept
Dry
Wei
ght (
g)
0
1
2
3
4
5
6
7
8
L1
L2L3
L4
d= SE.05 for M
L1 = High moistureL2 = Medium moistureL3 = Low moistureL4 = Very low moisture
Figure 3.8 Effect of month and moisture level on (a) color (b) texture, (c) density, and(d) dry weight of western wheatgrass. Color was rated on a 1 to 9 scale with 1 being strawbrown and 9 being dark green. Turfgrass texture was rated on a 1 to 9 scale with 1equaling coarse and 9 equaling fine. Density was rated on a 1 to 9 scale with 1 being bare ground and 9 equaling maximum density.Each point represents a mean of four replicates. Error bars indicate difference of leastsquare means standard error (p<0.05) for the M=month main effect, S=subplot main effect,or MS=month x subplot interaction.

40
Blue Grama
The color rating for blue grama had a significant month by subplot interaction
(Figure 3.9a). All subplot color ratings significantly increased from May to June, but
slowly and significantly decreased from June to September. However, subplot color
ratings diverged in July when the L1 subplot was significantly higher than the L4
subplot. This divergence continued into August, when L1 and L2 levels remained near
the accepted level of 5 and significantly differed from that of L3 and L4 subplots, which
dropped off quickly to a rating near 3. The color ratings for all subplots decreased
dramatically in September, when all subplots were statistically the same, all with
ratings under 2.
Texture rating for blue grama showed only a month main effect. All months
were statistically different from one another except July from August (Figure 3.9b).
Like the color ratings, texture ratings peaked in June, with a rating just below 7, and
slowly decreased the remainder of the summer to a rating average of around 4.5.
The month main effect for density was significant, with July to August
statistically denser than May, June, and September (Figure 3.9c). Subplot main effects
were evident. The densities of subplots L1 and L2 were significantly higher than the
subplots L3 and L4.
The significant differences in dry weight of blue grama were caused by month
main effects (Figure 3.9d). May and September had no measured dry weight, as the
grass was dormant during those months. Plant weights were highest in June,
significantly decreased from June throughout the summer.
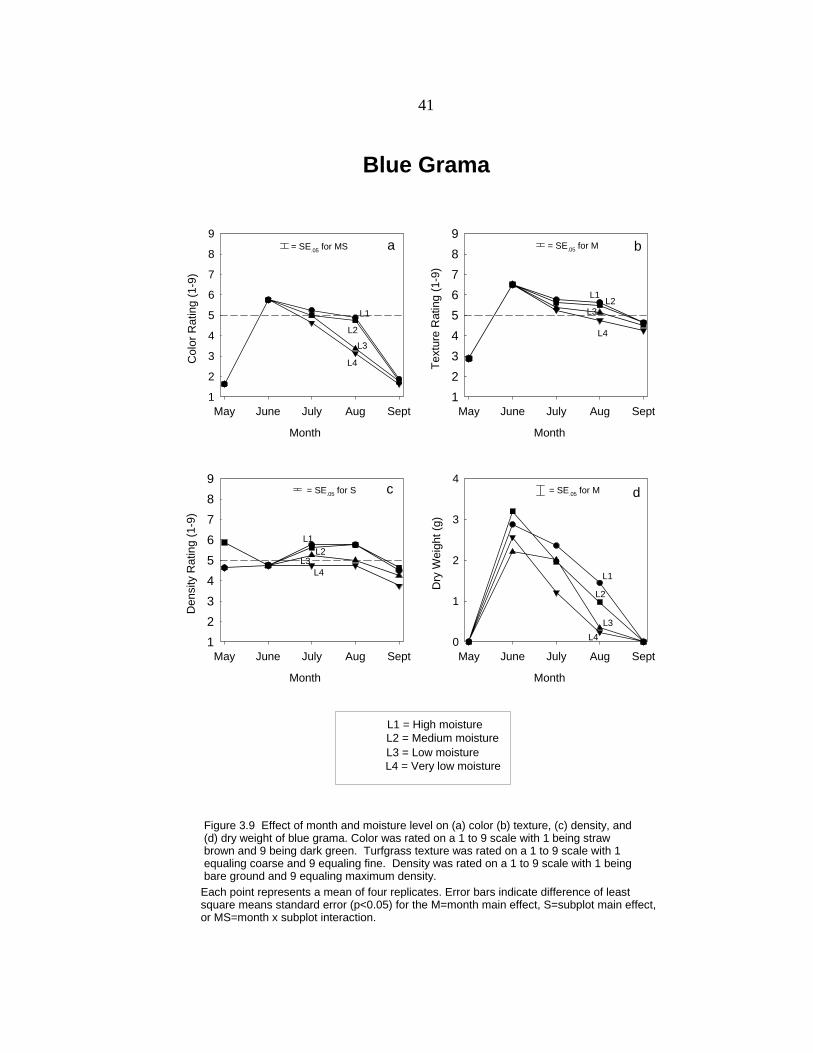
41
Month
May June July Aug Sept
Den
sity
Rat
ing
(1-9
)
123456789
Month
May June July Aug Sept
Text
ure
Rat
ing
(1-9
)
123456789
Month
May June July Aug Sept
Col
or R
atin
g (1
-9)
1
2
3
4
5
6
7
8
9
L1L2
L3
L4
L1
L2
L3
L4
L1L2
L3L4
Blue Grama
= SE.05 for MS = SE.05 for M
= SE.05 for S
a b
c
Month
May June July Aug Sept
Dry
Wei
ght (
g)
0
1
2
3
4
L1
L2
L3L4
d= SE.05 for M
L1 = High moistureL2 = Medium moistureL3 = Low moistureL4 = Very low moisture
Figure 3.9 Effect of month and moisture level on (a) color (b) texture, (c) density, and(d) dry weight of blue grama. Color was rated on a 1 to 9 scale with 1 being strawbrown and 9 being dark green. Turfgrass texture was rated on a 1 to 9 scale with 1equaling coarse and 9 equaling fine. Density was rated on a 1 to 9 scale with 1 being bare ground and 9 equaling maximum density.
Each point represents a mean of four replicates. Error bars indicate difference of leastsquare means standard error (p<0.05) for the M=month main effect, S=subplot main effect,or MS=month x subplot interaction.
42
Buffalograss
The color rating for buffalograss had a month main effect in which all months
were significantly different from one another except May from September (Figure
3.10a). Color ratings showed a statistical increase from May to June, but decreased
the following months.
The texture of buffalograss showed both a month and subplot main effect
(Figure 3.10b). The month main effect showed that texture was significantly highest in
July and August. Like the color ratings, texture ratings increased from May to June
and decreased from June to September. Texture subplot main effect showed that
subplots L1 and L2 were significantly higher than subplot L4.
There was a month by subplot interaction for density of buffalograss (Figure
3.10c). The density of buffalograss increased significantly from May until July. In the
month of July there was a divergence in which the subplots L1 and L2 were
significantly denser than the subplots L3 and L4. In August, the densities of the
subplots were statistically similar to those in July. The L4 subplot density decreased
such that it was statistically less that the density of subplot L3. In September, as
buffalograss went into dormancy, the density ratings of all the subplots were near 2.
There was a significant month by subplot interaction for buffalograss in dry
weight (Figure 3.10d). No clippings were taken May and September because the
grass was dormant and not growing. In June, dry weight of the L3 subplot was
significantly higher compared to the other subplots. In July, dry weights increased for
all subplots except the L4 subplot, which saw a slight decrease. The weight of the L2
subplot increased the most, with a dry weight that was significantly higher than the L1
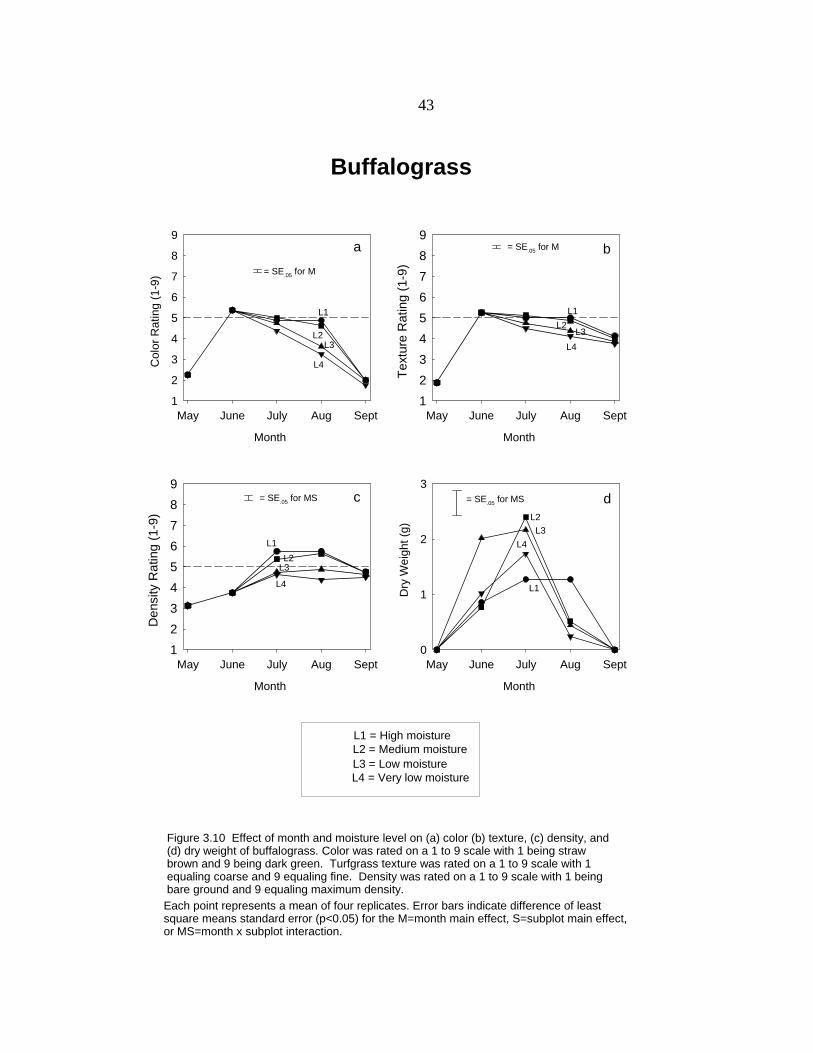
43
Month
May June July Aug Sept
Den
sity
Rat
ing
(1-9
)
123456789
Month
May June July Aug SeptTe
xtur
e R
atin
g (1
-9)
123456789
Month
May June July Aug Sept
Col
or R
atin
g (1
-9)
1
2
3
4
5
6
7
8
9
L1L2
L3L4
L1
L2L3
L4
L1L2
L3
L4
Buffalograss
= SE.05 for M
= SE.05 for M
= SE.05 for MS
a b
c
Month
May June July Aug Sept
Dry
Wei
ght (
g)
0
1
2
3
L1
L2L3
L4
d= SE.05 for MS
L1 = High moistureL2 = Medium moistureL3 = Low moistureL4 = Very low moisture
Figure 3.10 Effect of month and moisture level on (a) color (b) texture, (c) density, and(d) dry weight of buffalograss. Color was rated on a 1 to 9 scale with 1 being strawbrown and 9 being dark green. Turfgrass texture was rated on a 1 to 9 scale with 1equaling coarse and 9 equaling fine. Density was rated on a 1 to 9 scale with 1 being bare ground and 9 equaling maximum density.
Each point represents a mean of four replicates. Error bars indicate difference of leastsquare means standard error (p<0.05) for the M=month main effect, S=subplot main effect,or MS=month x subplot interaction.
44
subplot but statistically similar to the remaining plots. The month of August saw a
sharp decrease in dry weights of the L2, L3, and L4 subplots, but the L1 subplot
remained nearly the same weight. The L1 subplot was significantly higher than the L4
subplot, but was significantly similar to the L2 and L3 subplots. The L2, L3, and L4
subplots were statistically similar in the month of August.
Canada Bluegrass + Crested Wheatgrass
The color rating of the mixture of Canada bluegrass + crested wheatgrass
mixture had month and subplot main effects (Figure 3.11a). Color ratings decreased
significantly from May to July, leveled off in August, and then increased significantly in
September. The L1 and L2 subplots had significantly higher color ratings than the L3
and L4 subplots.
Texture and density of the mixture had significant differences caused by month
main effects (Figure 3.11b,c). From May to July, ratings for texture and density
significantly decreased, but then increased significantly from July to September.
Significant differences in dry weight for the Canada bluegrass + crested
wheatgrass mixture were caused by month main effects (Figure 3.11d). There was a
significant decrease in dry weights from June to August.
Canada Bluegrass + Western Wheatgrass
The color ratings for the mixture of Canada bluegrass + western wheatgrass
had month and subplot main effects (Figure 3.12a). Color ratings remained similar in
May and June but decreased significantly from June to July. The color ratings were
similar from July to September. The L1 and L2 subplots were significantly higher than
the L3 and L4 subplots.
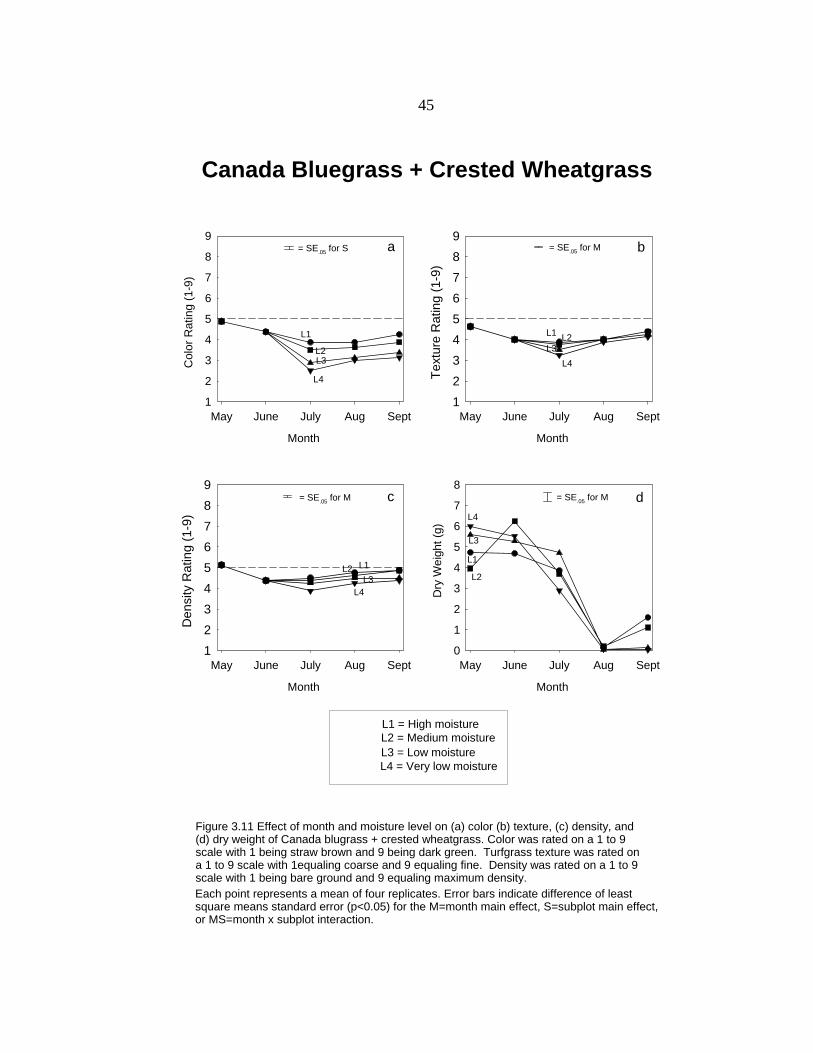
45
Month
May June July Aug Sept
Den
sity
Rat
ing
(1-9
)
123456789
Month
May June July Aug Sept
Text
ure
Rat
ing
(1-9
)
123456789
Month
May June July Aug Sept
Col
or R
atin
g (1
-9)
1
2
3
4
5
6
7
8
9
L1 L2L3
L4
L1
L2L3
L4
L1L2L3
L4
Canada Bluegrass + Crested Wheatgrass
= SE.05 for S = SE.05 for M
= SE.05 for M
a b
c
Month
May June July Aug Sept
Dry
Wei
ght (
g)
0
1
2
3
4
5
6
7
8
L1
L2
L3
L4
d= SE.05 for M
L1 = High moistureL2 = Medium moistureL3 = Low moistureL4 = Very low moisture
Figure 3.11 Effect of month and moisture level on (a) color (b) texture, (c) density, and(d) dry weight of Canada blugrass + crested wheatgrass. Color was rated on a 1 to 9 scale with 1 being straw brown and 9 being dark green. Turfgrass texture was rated on a 1 to 9 scale with 1equaling coarse and 9 equaling fine. Density was rated on a 1 to 9scale with 1 being bare ground and 9 equaling maximum density.Each point represents a mean of four replicates. Error bars indicate difference of leastsquare means standard error (p<0.05) for the M=month main effect, S=subplot main effect,or MS=month x subplot interaction.
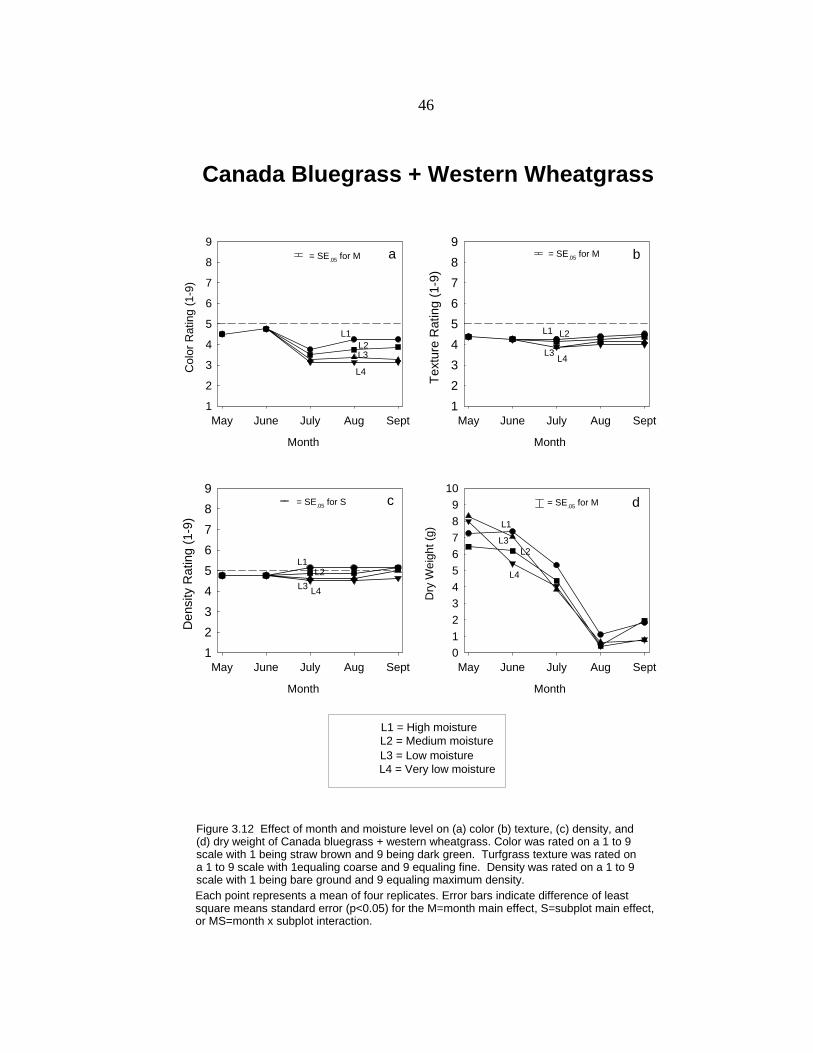
46
Month
May June July Aug Sept
Den
sity
Rat
ing
(1-9
)
123456789
Month
May June July Aug SeptTe
xtur
e R
atin
g (1
-9)
123456789
Month
May June July Aug Sept
Col
or R
atin
g (1
-9)
1
2
3
4
5
6
7
8
9
L1 L2
L3 L4
L1L2L3
L4
L1L2
L3 L4
Canada Bluegrass + Western Wheatgrass
= SE.05 for M = SE.05 for M
= SE.05 for S
a b
c
L1 = High moistureL2 = Medium moistureL3 = Low moistureL4 = Very low moisture
Figure 3.12 Effect of month and moisture level on (a) color (b) texture, (c) density, and(d) dry weight of Canada bluegrass + western wheatgrass. Color was rated on a 1 to 9 scale with 1 being straw brown and 9 being dark green. Turfgrass texture was rated ona 1 to 9 scale with 1equaling coarse and 9 equaling fine. Density was rated on a 1 to 9 scale with 1 being bare ground and 9 equaling maximum density.Each point represents a mean of four replicates. Error bars indicate difference of leastsquare means standard error (p<0.05) for the M=month main effect, S=subplot main effect,or MS=month x subplot interaction.
Month
May June July Aug Sept
Dry
Wei
ght (
g)
0123456789
10
L1
L2L3
L4
d= SE.05 for M
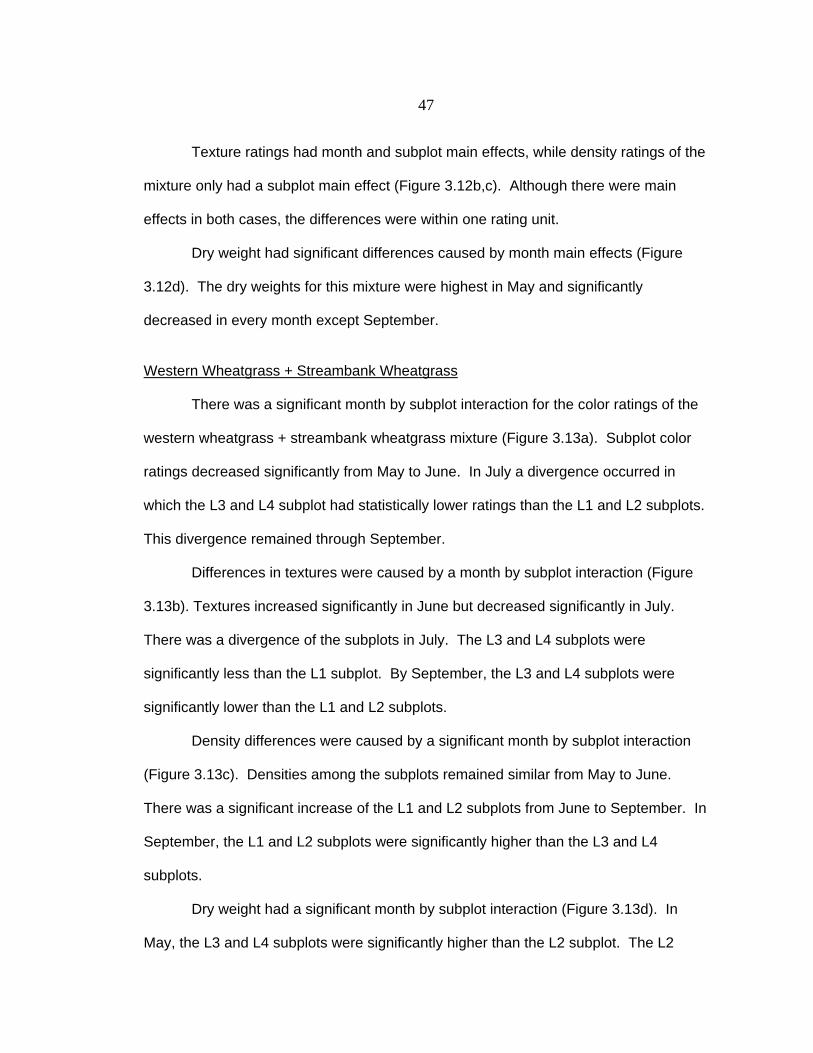
47
Texture ratings had month and subplot main effects, while density ratings of the
mixture only had a subplot main effect (Figure 3.12b,c). Although there were main
effects in both cases, the differences were within one rating unit.
Dry weight had significant differences caused by month main effects (Figure
3.12d). The dry weights for this mixture were highest in May and significantly
decreased in every month except September.
Western Wheatgrass + Streambank Wheatgrass
There was a significant month by subplot interaction for the color ratings of the
western wheatgrass + streambank wheatgrass mixture (Figure 3.13a). Subplot color
ratings decreased significantly from May to June. In July a divergence occurred in
which the L3 and L4 subplot had statistically lower ratings than the L1 and L2 subplots.
This divergence remained through September.
Differences in textures were caused by a month by subplot interaction (Figure
3.13b). Textures increased significantly in June but decreased significantly in July.
There was a divergence of the subplots in July. The L3 and L4 subplots were
significantly less than the L1 subplot. By September, the L3 and L4 subplots were
significantly lower than the L1 and L2 subplots.
Density differences were caused by a significant month by subplot interaction
(Figure 3.13c). Densities among the subplots remained similar from May to June.
There was a significant increase of the L1 and L2 subplots from June to September. In
September, the L1 and L2 subplots were significantly higher than the L3 and L4
subplots.
Dry weight had a significant month by subplot interaction (Figure 3.13d). In
May, the L3 and L4 subplots were significantly higher than the L2 subplot. The L2
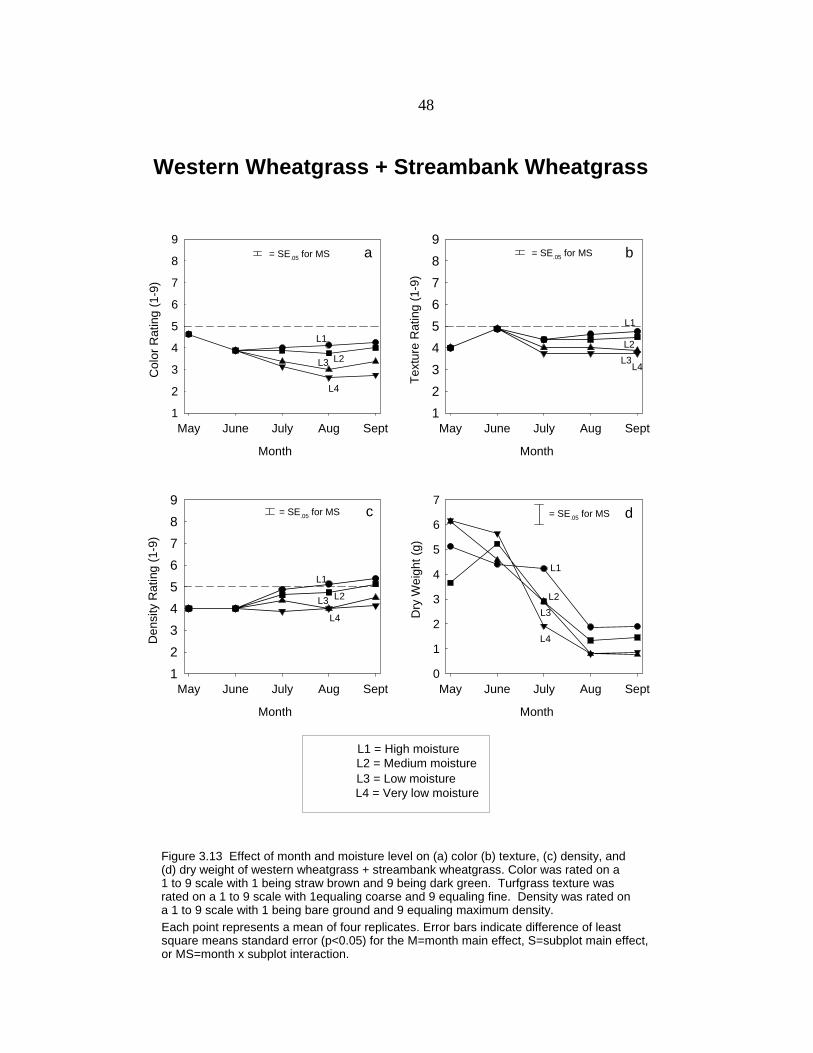
48
Month
May June July Aug Sept
Den
sity
Rat
ing
(1-9
)
123456789
Month
May June July Aug SeptTe
xtur
e R
atin
g (1
-9)
123456789
Month
May June July Aug Sept
Col
or R
atin
g (1
-9)
1
2
3
4
5
6
7
8
9
L1
L2L3
L4
L1
L2L3
L4
L1
L2L3
L4
Western Wheatgrass + Streambank Wheatgrass
= SE.05 for MS = SE.05 for MS
= SE.05 for MS
a b
c
Month
May June July Aug Sept
Dry
Wei
ght (
g)
0
1
2
3
4
5
6
7
L1
L2L3
L4
d= SE.05 for MS
L1 = High moistureL2 = Medium moistureL3 = Low moistureL4 = Very low moisture
Figure 3.13 Effect of month and moisture level on (a) color (b) texture, (c) density, and(d) dry weight of western wheatgrass + streambank wheatgrass. Color was rated on a 1 to 9 scale with 1 being straw brown and 9 being dark green. Turfgrass texture was rated on a 1 to 9 scale with 1equaling coarse and 9 equaling fine. Density was rated on a 1 to 9 scale with 1 being bare ground and 9 equaling maximum density.Each point represents a mean of four replicates. Error bars indicate difference of leastsquare means standard error (p<0.05) for the M=month main effect, S=subplot main effect,or MS=month x subplot interaction.

49
subplot dry weight increased significantly in June, when it was not significantly different
from the other subplots. A significant drop in weights occurred in July for all subplots
except the L1 subplot. In August there was a significant decrease in weights for all
subplots except the L4 subplot. All subplots were similar in August and September.
Western Wheatgrass _+ Streambank Wheatgrass + Sheep Fescue
Color, texture, and density ratings for the western wheatgrass + streambank
wheatgrass + sheep fescue mixture all had month by subplot interactions (Figure
3.14a,b,c). Color ratings diverged in August, when the L4 subplot color rating
decreased and was significantly lower than the L1 and L2 subplots ratings. In
September, the L1 subplot was significantly higher than the L3 and L4 subplots, while
the L2 subplot was significantly higher than the L4 subplot.
The texture of the mixture subplots increased significantly from May to June,
but decreased in July. There was a significant divergence in textures in August and
September. The L4 subplot was significantly lower than other subplots in August and
significantly lower than the L1 subplot in September. Although indiscernible by the
human eye, densities increased throughout the season. The L1 and L2 subplots were
significantly denser than the L3 and L4 subplots from July through September.
Dry weight significant differences for the mixture of western wheatgrass +
streambank wheatgrass + sheep fescue were caused by month main effects (Figure
3.14d). Dry weight decreased significantly each month from May to August.
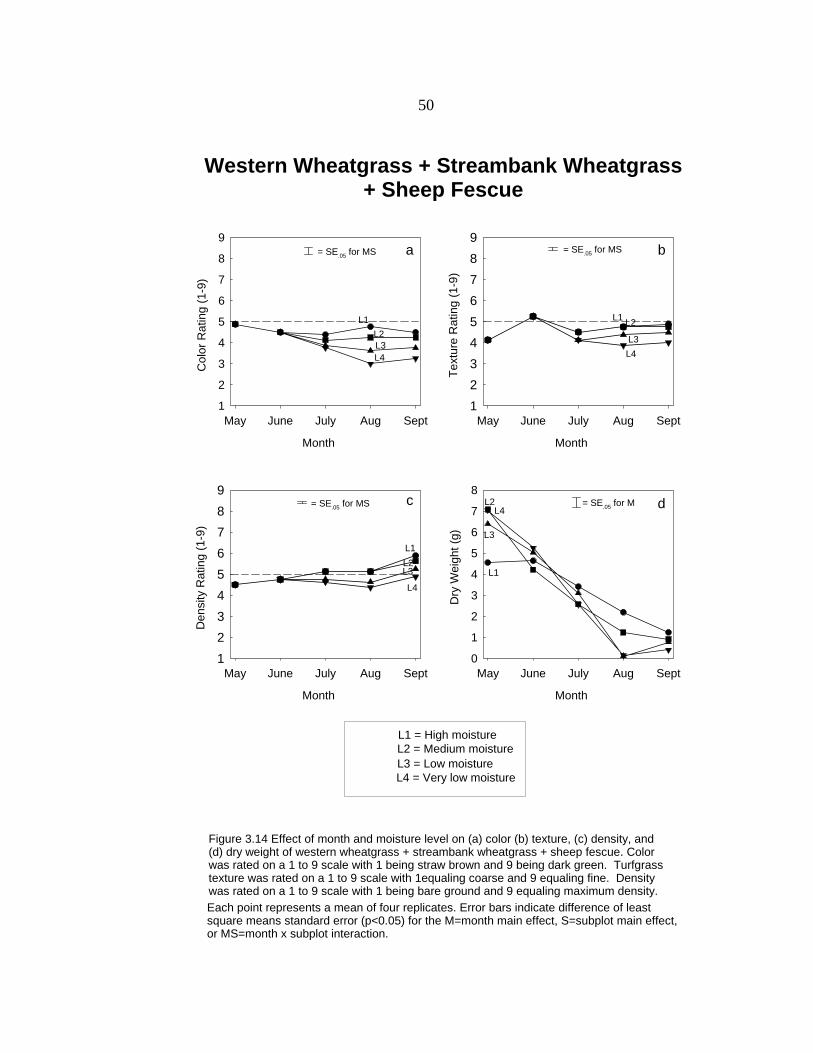
50
Month
May June July Aug Sept
Den
sity
Rat
ing
(1-9
)
123456789
Month
May June July Aug Sept
Text
ure
Rat
ing
(1-9
)
123456789
Month
May June July Aug Sept
Col
or R
atin
g (1
-9)
1
2
3
4
5
6
7
8
9
L1 L2
L3L4
L1L2L3L4
L1L2L3
L4
Western Wheatgrass + Streambank Wheatgrass+ Sheep Fescue
= SE.05 for MS = SE.05 for MS
= SE.05 for MS
a b
c
Month
May June July Aug Sept
Dry
Wei
ght (
g)
0
1
2
3
4
5
6
7
8
L1
L2
L3
L4 d= SE.05 for M
L1 = High moistureL2 = Medium moistureL3 = Low moistureL4 = Very low moisture
Figure 3.14 Effect of month and moisture level on (a) color (b) texture, (c) density, and(d) dry weight of western wheatgrass + streambank wheatgrass + sheep fescue. Color was rated on a 1 to 9 scale with 1 being straw brown and 9 being dark green. Turfgrass texture was rated on a 1 to 9 scale with 1equaling coarse and 9 equaling fine. Density was rated on a 1 to 9 scale with 1 being bare ground and 9 equaling maximum density.Each point represents a mean of four replicates. Error bars indicate difference of leastsquare means standard error (p<0.05) for the M=month main effect, S=subplot main effect,or MS=month x subplot interaction.

51
Blue Grama + Sandberg Bluegrass
The blue grama + Sandberg bluegrass mixture was not evaluated because of
contamination of the Sandberg bluegrass seed stock with a range type tall fescue. The
tall fescue overtook the plots making evaluations impossible.
Blue Grama + Western Wheatgrass
Month and subplot main effects were significant for color, texture, and density
for the mixture of blue grama + western wheatgrass (Figure 3.15a,b,c). Color ratings
increased significantly from May to June, but significantly decreased from June to
September. Texture and density ratings increased significantly from May to June,
decreased significantly in July, but remained similar from July to September. For color,
texture, and density ratings the L1 and L2 subplots were significantly higher than the
L3 and L4 subplots.
Dry weight for the mixture of blue grama + western wheatgrass had a significant
month main effect (Figure 3.15d) Dry weights significantly increased from May to June,
and decreased significantly from June to August.
Buffalograss + Blue Grama + Sandberg Bluegrass
The mixture of buffalograss + blue grama + Sandberg bluegrass was not
evaluated because the contaminated Sandberg bluegrass seed stock. A range type
tall fescue in the mixture overtook the plots making evaluations impossible.
Buffalograss + Blue Grama + Muttongrass
The buffalograss + blue grama + muttongrass mixture was evaluated even
though muttongrass had low vigor and a lack of competition. The mixture gave insight
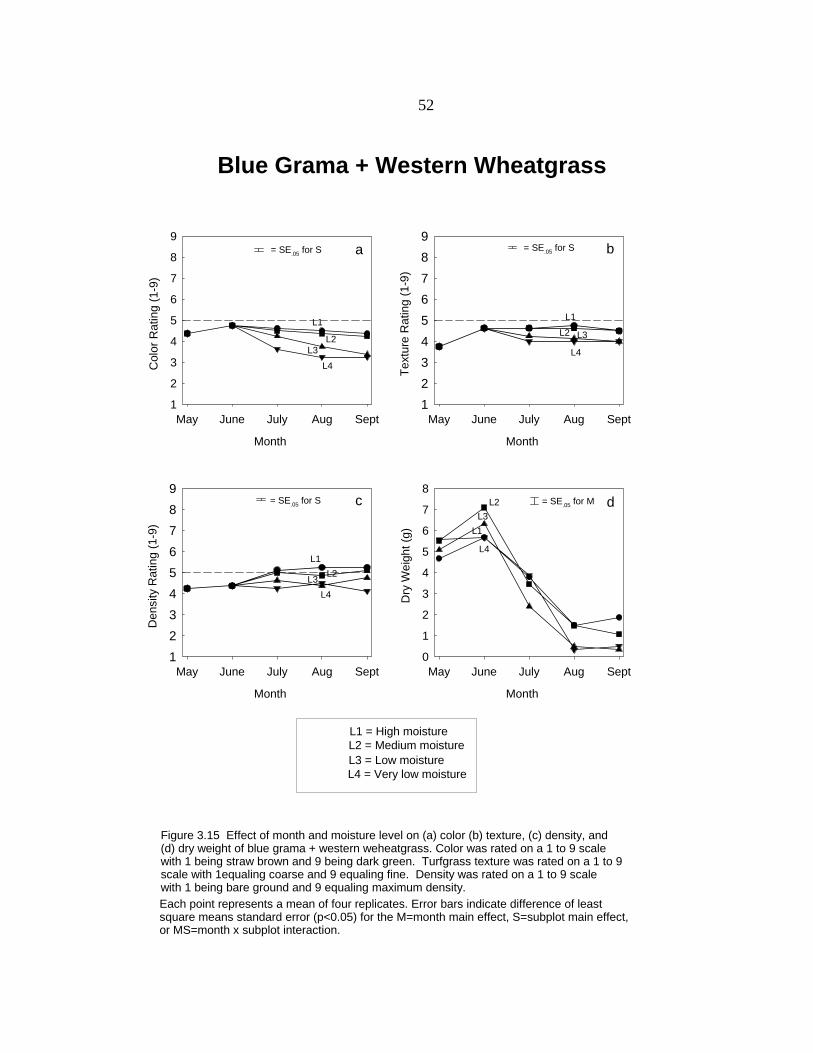
52
Month
May June July Aug Sept
Den
sity
Rat
ing
(1-9
)
123456789
Month
May June July Aug SeptTe
xtur
e R
atin
g (1
-9)
123456789
Month
May June July Aug Sept
Col
or R
atin
g (1
-9)
1
2
3
4
5
6
7
8
9
L1
L2 L3
L4
L1
L2L3
L4
L1L2L3
L4
Blue Grama + Western Wheatgrass
= SE.05 for S = SE.05 for S
= SE.05 for S
a b
c
Month
May June July Aug Sept
Dry
Wei
ght (
g)
0
1
2
3
4
5
6
7
8
L1
L2L3
L4
d= SE.05 for M
L1 = High moistureL2 = Medium moistureL3 = Low moistureL4 = Very low moisture
Figure 3.15 Effect of month and moisture level on (a) color (b) texture, (c) density, and(d) dry weight of blue grama + western weheatgrass. Color was rated on a 1 to 9 scale with 1 being straw brown and 9 being dark green. Turfgrass texture was rated on a 1 to 9 scale with 1equaling coarse and 9 equaling fine. Density was rated on a 1 to 9 scale with 1 being bare ground and 9 equaling maximum density.Each point represents a mean of four replicates. Error bars indicate difference of leastsquare means standard error (p<0.05) for the M=month main effect, S=subplot main effect,or MS=month x subplot interaction.

53
to how the mixture would perform as buffalograss + blue grama. The subplots did not
contain the standard 500 PLS per square feet, but did give some understanding about
how the mixture would react under differing water measurements.
There was a significant month by subplot interaction for color ratings (Figure
3.16a). All subplots were similar and significantly increased from May to June. The L3
and L4 subplots decreased significantly in July and August, diverging from the L1 and
L2 subplots. The L1 and L2 subplots decreased significantly from July to September.
In September, the L1 and L2 subplots were significantly higher than only the L4
subplot.
Texture rating significant differences were caused by a month by subplot
interaction (Figure 3.16b). The subplots increased significantly from May to June. The
L2 subplot decreased significantly in July, while the L3 and L4 subplots significantly
decreased in July and then again in August. In August, the L1 and L2 subplots had
significantly finer textures than the L3 and L4 subplots. The L1 and L2 subplot texture
decreased in September, but was still significantly higher than the L4 subplot.
Density rating differences also were caused by a significant month by subplot
interaction (Figure 3.16c). The subplots were similar in May and June. The L1 and L2
subplots increased from June to July and were significantly denser in July than the L3
and L4 subplots. This trend continued until September when the L2 subplot density
rating decreased and was significantly less dense than the L1 subplot.
The significant differences in dry weight of the buffalograss + blue grama +
muttongrass mixture were caused by month main effects (Figure 3.16d). Dry weight
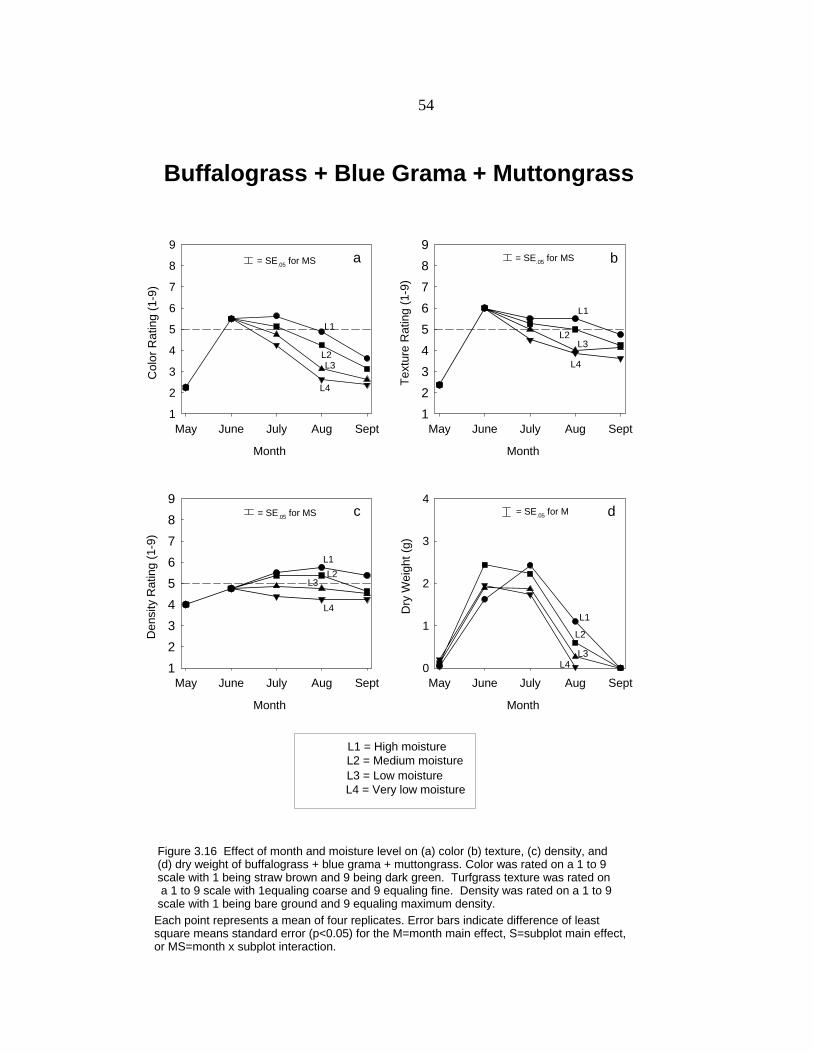
54
Month
May June July Aug Sept
Den
sity
Rat
ing
(1-9
)
123456789
Month
May June July Aug Sept
Text
ure
Rat
ing
(1-9
)123456789
Month
May June July Aug Sept
Col
or R
atin
g (1
-9)
1
2
3
4
5
6
7
8
9
L1
L2L3
L4
L1
L2L3
L4
L1L2
L3
L4
Buffalograss + Blue Grama + Muttongrass
= SE.05 for MS = SE.05 for MS
= SE.05 for MS
a b
c
Month
May June July Aug Sept
Dry
Wei
ght (
g)
0
1
2
3
4
L1
L2
L3L4
d= SE.05 for M
L1 = High moistureL2 = Medium moistureL3 = Low moistureL4 = Very low moisture
Figure 3.16 Effect of month and moisture level on (a) color (b) texture, (c) density, and(d) dry weight of buffalograss + blue grama + muttongrass. Color was rated on a 1 to 9 scale with 1 being straw brown and 9 being dark green. Turfgrass texture was rated on a 1 to 9 scale with 1equaling coarse and 9 equaling fine. Density was rated on a 1 to 9 scale with 1 being bare ground and 9 equaling maximum density.
Each point represents a mean of four replicates. Error bars indicate difference of leastsquare means standard error (p<0.05) for the M=month main effect, S=subplot main effect,or MS=month x subplot interaction.
55
significantly increased from May to June. From July to September, there was a
significant decrease in weights.
Buffalograss _+ Muttongrass
The buffalograss + muttongrass mixture was not evaluated because of
muttongrass’ low vigor and a lack of competition. Although muttongrass grows well in
the greenhouse under manipulated controls, in the field it was poor to establish and
was out competed by the buffalograss. This created a situation in which the data
collected was similar to the single species of buffalograss.
Buffalograss + Sandberg Bluegrass
The buffalograss + Sandberg bluegrass mixture was not evaluated because of
tall fescue contamination in the Sandberg bluegrass seed stock. A range type tall
fescue overtook the plots making evaluations impossible.
Buffalograss + Sheep Fescue
Color rating for the buffalograss + sheep fescue mixture had only a significant
month main effect (Figure 3.17a). The subplot color rating increased from May to
June, but decreased from June to August. Texture rating significant differences were
caused by a month by subplot interaction (Figure 3.17b). All subplot color ratings
increased significantly from May to June. The L4 subplot color decreased significantly
from June to August. In August, the L1 and L2 subplots were significantly higher than
the L3 and L4 subplots. By September, only the L4 subplot was significantly less than
the L1 and L2 subplots.
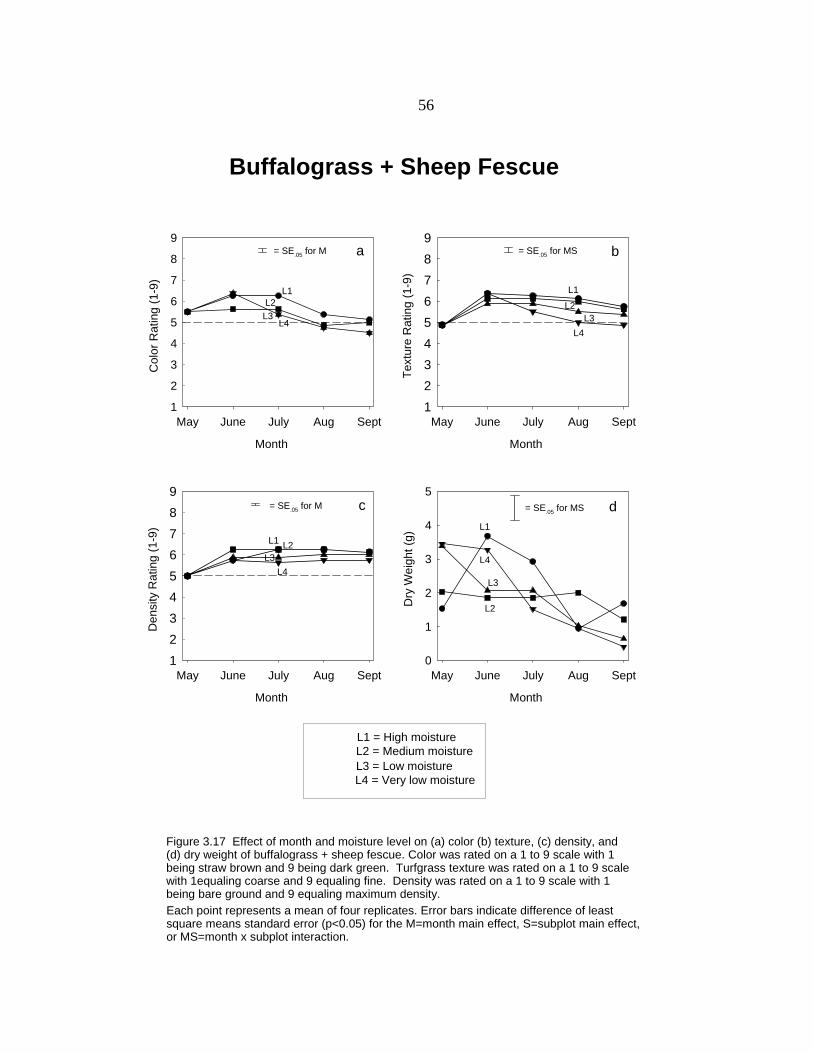
56
Month
May June July Aug Sept
Den
sity
Rat
ing
(1-9
)
123456789
Month
May June July Aug SeptTe
xtur
e R
atin
g (1
-9)
123456789
Month
May June July Aug Sept
Col
or R
atin
g (1
-9)
1
2
3
4
5
6
7
8
9
L1
L2L3
L4
L1L2L3
L4
L1 L2L3
L4
Buffalograss + Sheep Fescue
= SE.05 for M = SE.05 for MS
= SE.05 for M
a b
c
Month
May June July Aug Sept
Dry
Wei
ght (
g)
0
1
2
3
4
5
L1
L2
L3
L4
d= SE.05 for MS
L1 = High moistureL2 = Medium moistureL3 = Low moistureL4 = Very low moisture
Figure 3.17 Effect of month and moisture level on (a) color (b) texture, (c) density, and(d) dry weight of buffalograss + sheep fescue. Color was rated on a 1 to 9 scale with 1 being straw brown and 9 being dark green. Turfgrass texture was rated on a 1 to 9 scale with 1equaling coarse and 9 equaling fine. Density was rated on a 1 to 9 scale with 1 being bare ground and 9 equaling maximum density.Each point represents a mean of four replicates. Error bars indicate difference of leastsquare means standard error (p<0.05) for the M=month main effect, S=subplot main effect,or MS=month x subplot interaction.
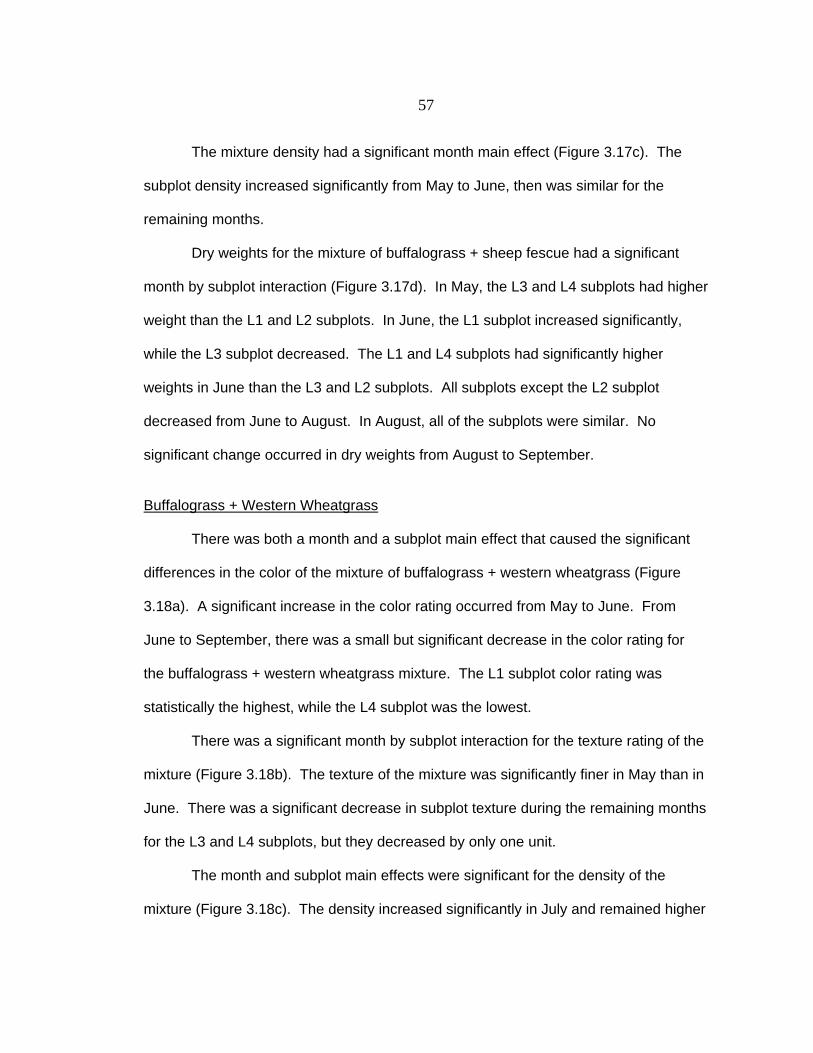
57
The mixture density had a significant month main effect (Figure 3.17c). The
subplot density increased significantly from May to June, then was similar for the
remaining months.
Dry weights for the mixture of buffalograss + sheep fescue had a significant
month by subplot interaction (Figure 3.17d). In May, the L3 and L4 subplots had higher
weight than the L1 and L2 subplots. In June, the L1 subplot increased significantly,
while the L3 subplot decreased. The L1 and L4 subplots had significantly higher
weights in June than the L3 and L2 subplots. All subplots except the L2 subplot
decreased from June to August. In August, all of the subplots were similar. No
significant change occurred in dry weights from August to September.
Buffalograss + Western Wheatgrass
There was both a month and a subplot main effect that caused the significant
differences in the color of the mixture of buffalograss + western wheatgrass (Figure
3.18a). A significant increase in the color rating occurred from May to June. From
June to September, there was a small but significant decrease in the color rating for
the buffalograss + western wheatgrass mixture. The L1 subplot color rating was
statistically the highest, while the L4 subplot was the lowest.
There was a significant month by subplot interaction for the texture rating of the
mixture (Figure 3.18b). The texture of the mixture was significantly finer in May than in
June. There was a significant decrease in subplot texture during the remaining months
for the L3 and L4 subplots, but they decreased by only one unit.
The month and subplot main effects were significant for the density of the
mixture (Figure 3.18c). The density increased significantly in July and remained higher
58
Month
May June July Aug Sept
Den
sity
Rat
ing
(1-9
)
123456789
Month
May June July Aug SeptTe
xtur
e R
atin
g (1
-9)
123456789
Month
May June July Aug Sept
Col
or R
atin
g (1
-9)
1
2
3
4
5
6
7
8
9
L1L2L3
L4
L1L2
L3
L4
L1L2L3
L4
Buffalograss + Western Wheatgrass
= SE.05 for S = SE.05 for MS
= SE.05 for S
a b
c
Month
May June July Aug Sept
Dry
Wei
ght (
g)
0
1
2
3
4
5
6
7
L1
L2L3
L4
d= SE.05 for M
L1 = High moistureL2 = Medium moistureL3 = Low moistureL4 = Very low moisture
Figure 3.18 Effect of month and moisture level on (a) color (b) texture, (c) density, and(d) dry weight of buffalograss + western wheatgrass. Color was rated on a 1 to 9 scale with 1 being straw brown and 9 being dark green. Turfgrass texture was rated on a 1 to 9 scale with 1equaling coarse and 9 equaling fine. Density was rated on a 1 to 9 scale with 1 being bare ground and 9 equaling maximum density.Each point represents a mean of four replicates. Error bars indicate difference of leastsquare means standard error (p<0.05) for the M=month main effect, S=subplot main effect,or MS=month x subplot interaction.
59
during August and September. The L1 and L2 subplots were significantly denser than
the L3 and L4 subplots.
Month main effects caused the significant differences in dry weight for the
buffalograss + western wheatgrass mixture (Figure 3.18d). Dry weights decreased
significantly each month from June to August.
Turfgrass Quality
The single species and mixture that had a good overall turf quality were the
two introduced grasses of KBG and tall fescue, as well as sheep fescue, blue grama,
buffalograss, and the mixture of buffalograss and sheep fescue (Table 3.1). The single
specie and mixtures that had adequate overall turfgrass qualities were
rated fair. These included the single specie of western wheatgrass and the mixtures of
western wheatgrass + streambank wheatgrass, western wheatgrass + streambank
wheatgrass + sheep fescue, buffalograss + blue grama + muttongrass, blue grama +
western wheatgrass, and buffalograss + western wheatgrass (Table 3.1). Canada
bluegrass, crested wheatgrass, streambank wheatgrass, thickspike wheatgrass and
the mixtures of Canada bluegrass + crested wheatgrass, and Canada bluegrass +
western wheatgrass had poor overall turfgrass ratings and would not be recommended
for turfgrass applications in Southwest Montana (Table 3.1).
Water Requirements
The water requirements of KBG, tall fescue, blue grama, and buffalograss for
optimum turfgrass quality and basic plant functions increased just as precipitation is
declined (Figures 3.19a,b,c and Figure 3.20a). The water requirement for optimum

60
Table 3.1 Turfgrass Quality and Minimum Weekly Irrigation Recommendations and Timing For Native, Adapted, and Introduced Grasses in Bozeman, Montana
Species or Mix
Overall
Turf Color
Overall Turf Texture
Overall
Turf Density
Overall
Turf Quality
Timing of Turfgrass
Color
Recommended Minimum Weekly
Irrigation Requirements and Timing for Optimum Turfgrass
Quality
Recommended Minimum Weekly
Irrigation Requirements and Timing to Retain Some Color
Kentucky bluegrass good good good good all season 0.75" mid June to early September 0.75" early July to early September
Tall Fescue good fair good good all season 1.00" mid June to early September 1.00" early July to early September Sheep Fescue good good good good all season 0.50" early July to early September none
Blue Grama fair good good good late-May to late- August
0.50" early July to mid August .50" early-mid July to mid August
Buffalograss fair good good good early-June to late- August
0.50" early July to mid August 0.50" early-mid July to mid August
Buffalograss + Sheep Fescue
good good good good all season 0.50" late-mid July to early September
none
Western Wheatgrass fair fair fair fair all season 0.75"late-mid June to early September
only during drought periods
Western Wheatgrass + Streambank Wheatgrass
fair fair fair fair all season 0.50" late-mid June to early September
only during drought periods
Western Wheatgrass + Streambank
Wheatgrass+ Sheep Fescue
fair fair fair fair all season 0.50" early July to early September only during drought periods
Blue Grama + Western Wheatgrass
fair fair fair fair all season 0.50" early-mid July to early September
only during drought periods
Buffalograss + Western Wheatgrass
fair fair fair fair all season 0.75" early-mid July to early September
only during drought periods
Buffalograss + Blue grama + Muttongrass
fair fair fair fair early-June to late- August
0.75" mid June to early September only during drought periods
Canada Bluegrass poor poor fair poor all season 0.50" mid June to early September only during drought periods Crested Wheatgrass poor poor poor poor all season 0.50" mid June to early September only during drought periods
Streambank Wheatgrass poor fair fair poor all season 0.50" mid June to early September only during drought periods Thickspike Wheatgrass poor fair fair poor all season 0.50"early July to early September only during drought periods
Canada Bluegrass + Crested Wheatgrass
poor poor fair poor all season 0.50" mid June to early September only during drought periods
Canada Bluegrass + Western Wheatgrass
poor fair fair poor all season 0.50" mid June to early September only during drought periods

61
turfgrass quality of sheep fescue increased similarly, but basic plant function water
demands remained lower than the average weekly precipitation for Bozeman, Montana
(Figure 3.20b). The buffalograss + sheep fescue mixture also increased in moisture
requirements, but the need for water for the mixture was much later in the year
compared to the other single species and mixtures in the study (Figure 3.20c). The
moisture needed to retain the basic plant functions of the buffalograss + sheep fescue
mixture remained lower than the average weekly precipitation for Bozeman, Montana.
The water requirements for optimum turfgrass quality for western wheatgrass,
and the mixtures of buffalograss + blue grama + muttongrass, blue grama + western
wheatgrass, buffalograss + western wheatgrass, western wheatgrass + streambank
wheatgrass, and western wheatgrass + streambank wheatgrass + sheep fescue all
increased as precipitation declined (Figure 3.21a,b,c and Figure 3.22a,b,c). However,
to retain only plant functions, these species and mixtures required supplemental
irrigation only during drought periods. Although the water requirements of these
grasses and mixtures were similar to that of KBG and tall fescue, their color, texture,
and density ratings were lower and were considered to be adequate for turfgrass
applications.
Thickspike wheatgrass, Canada bluegrass, crested wheatgrass, streambank
wheatgrass, and the mixtures of Canada bluegrass + western wheatgrass, and Canada
bluegrass + crested wheatgrass all had very similar water requirements (Figure
3.23a,b,c and Figure 3.24a,b,c) Water requirements for these species and mixtures
ramped up as average precipitation declined. The water requirement to retain basic
plant functions for these single species and mixtures were all lower than the average
precipitation for Bozeman, Montana, and therefore needed irrigation only during

62
drought periods. Water requirements for this group were also similar to KBG and tall
fescue, but as stated earlier, they were poor candidates for turfgrass applications.
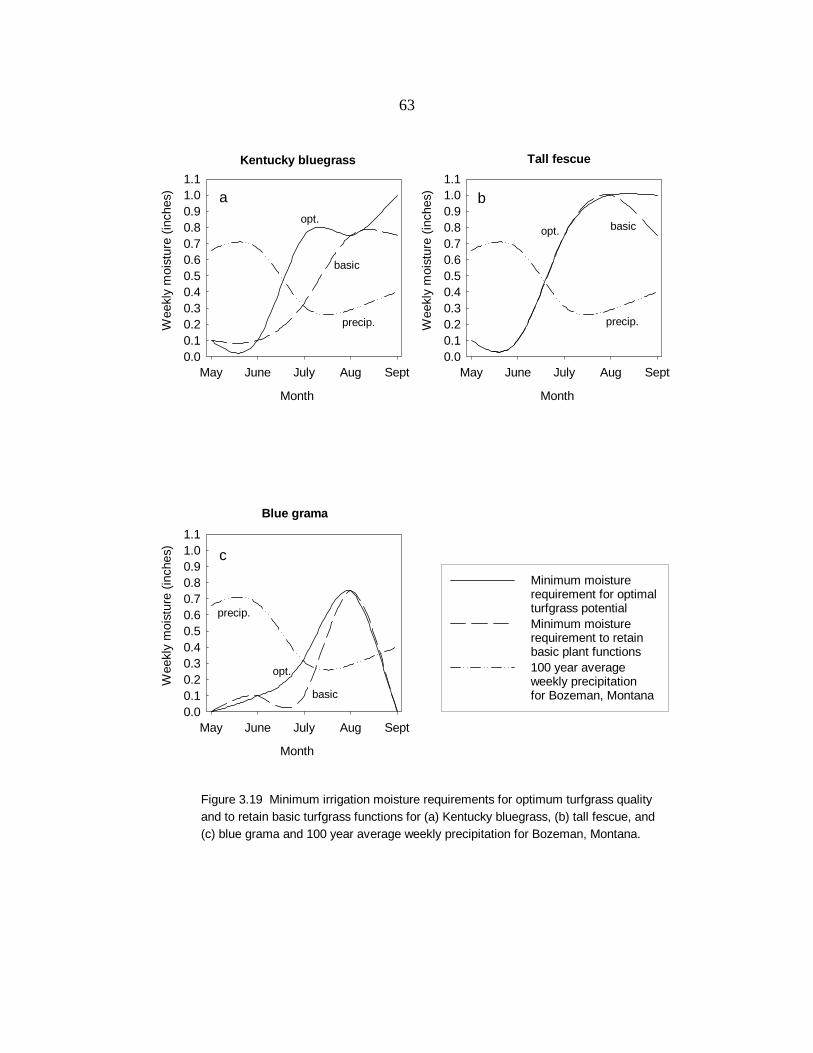
63
Month
May June July Aug Sept
Wee
kly
moi
stur
e (in
ches
)
0.00.10.20.30.40.50.60.70.80.91.01.1
Minimum moisture requirement for optimal turfgrass potentialMinimum moisture requirement to retain basic plant functions100 year average weekly precipitation for Bozeman, Montana
Kentucky bluegrass Tall fescue
Blue grama
Month
May June July Aug Sept
Wee
kly
moi
stur
e (in
ches
)
0.00.10.20.30.40.50.60.70.80.91.01.1
Month
May June July Aug Sept
Wee
kly
moi
stur
e (in
ches
)
0.00.10.20.30.40.50.60.70.80.91.01.1
a b
c
opt.
basic
precip.
opt. basic
precip.
opt.
basic
precip.
Figure 3.19 Minimum irrigation moisture requirements for optimum turfgrass qualityand to retain basic turfgrass functions for (a) Kentucky bluegrass, (b) tall fescue, and (c) blue grama and 100 year average weekly precipitation for Bozeman, Montana.
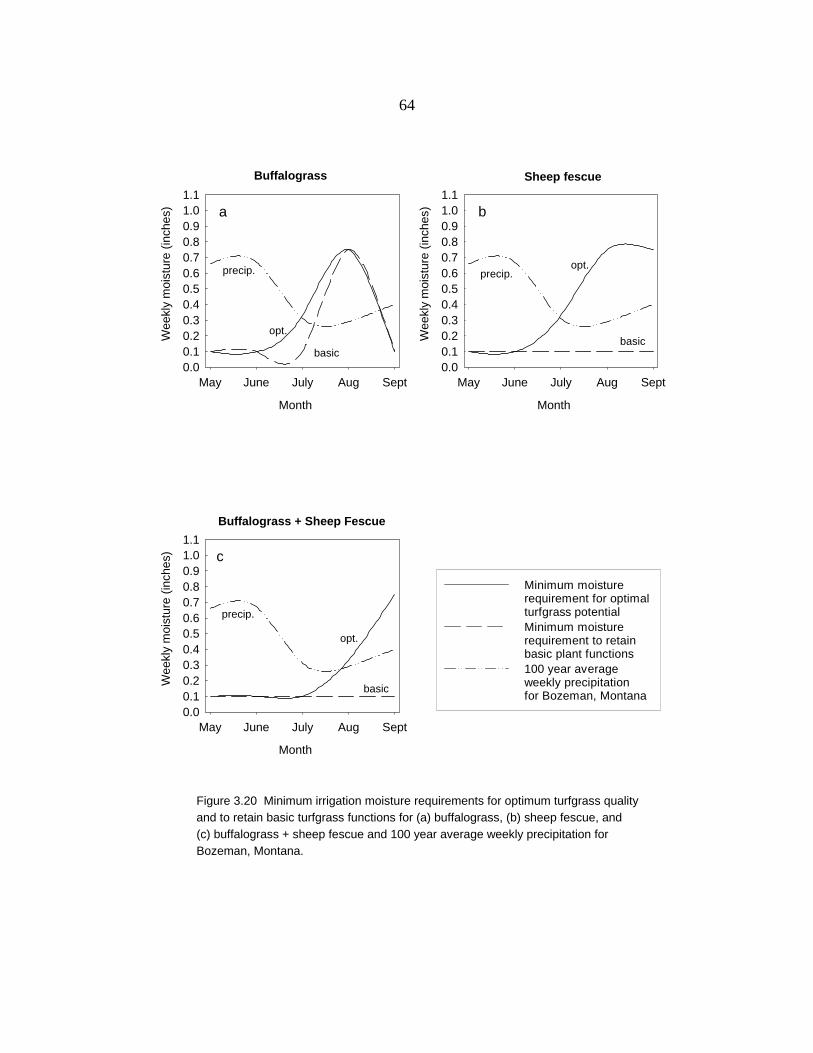
64
Month
May June July Aug Sept
Wee
kly
moi
stur
e (in
ches
)
0.00.10.20.30.40.50.60.70.80.91.01.1
Buffalograss
Month
May June July Aug Sept
Wee
kly
moi
stur
e (in
ches
)
0.00.10.20.30.40.50.60.70.80.91.01.1
Buffalograss + Sheep Fescue
a
c
opt.
basic
precip.
opt.
basic
precip.
Sheep fescue
Month
May June July Aug Sept
Wee
kly
moi
stur
e (in
ches
)
0.00.10.20.30.40.50.60.70.80.91.01.1
b
opt.
basic
precip.
Figure 3.20 Minimum irrigation moisture requirements for optimum turfgrass qualityand to retain basic turfgrass functions for (a) buffalograss, (b) sheep fescue, and(c) buffalograss + sheep fescue and 100 year average weekly precipitation for Bozeman, Montana.
Minimum moisture requirement for optimal turfgrass potentialMinimum moisture requirement to retain basic plant functions100 year average weekly precipitation for Bozeman, Montana
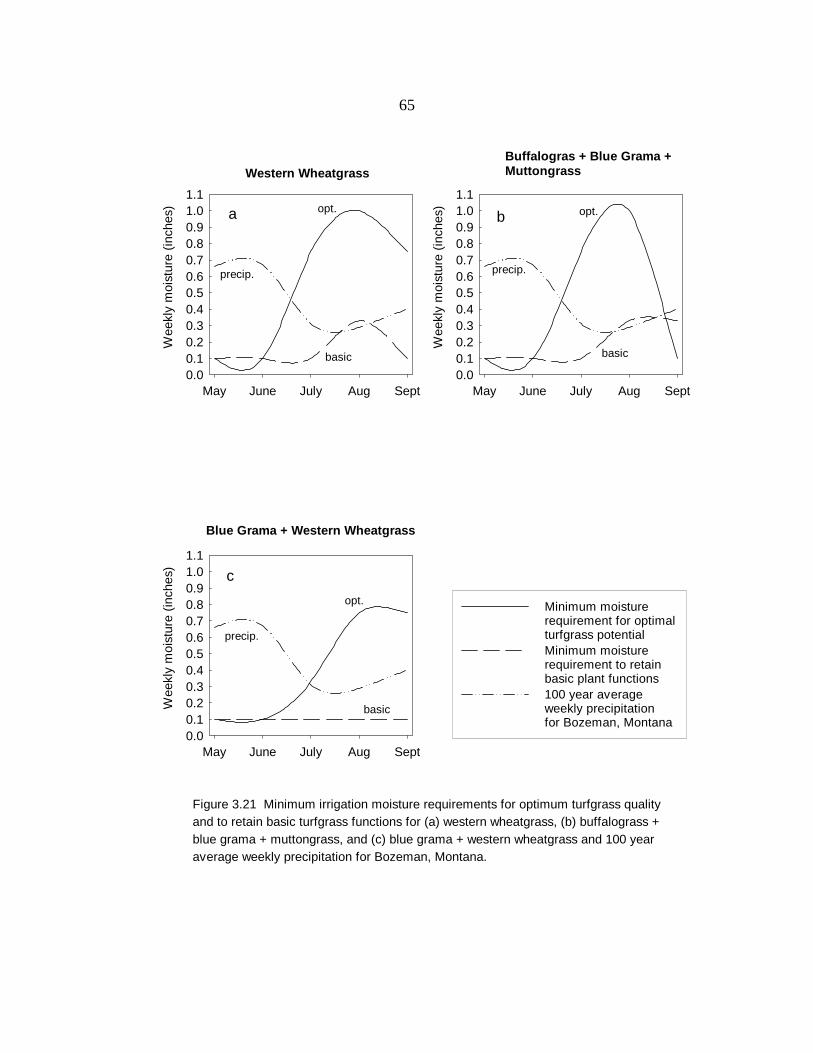
65
May June July Aug Sept
Wee
kly
moi
stur
e (in
ches
)
0.00.10.20.30.40.50.60.70.80.91.01.1
Western Wheatgrass
May June July Aug Sept
Wee
kly
moi
stur
e (in
ches
)
0.00.10.20.30.40.50.60.70.80.91.01.1
Buffalogras + Blue Grama +Muttongrass
May June July Aug Sept
Wee
kly
moi
stur
e (in
ches
)
0.00.10.20.30.40.50.60.70.80.91.01.1
Blue Grama + Western Wheatgrass
a b
c
opt.
precip.
basic
opt.
precip.
basic
opt.
precip.
basic
Minimum moisture requirement for optimal turfgrass potentialMinimum moisture requirement to retain basic plant functions100 year average weekly precipitation for Bozeman, Montana
Figure 3.21 Minimum irrigation moisture requirements for optimum turfgrass qualityand to retain basic turfgrass functions for (a) western wheatgrass, (b) buffalograss + blue grama + muttongrass, and (c) blue grama + western wheatgrass and 100 year average weekly precipitation for Bozeman, Montana.
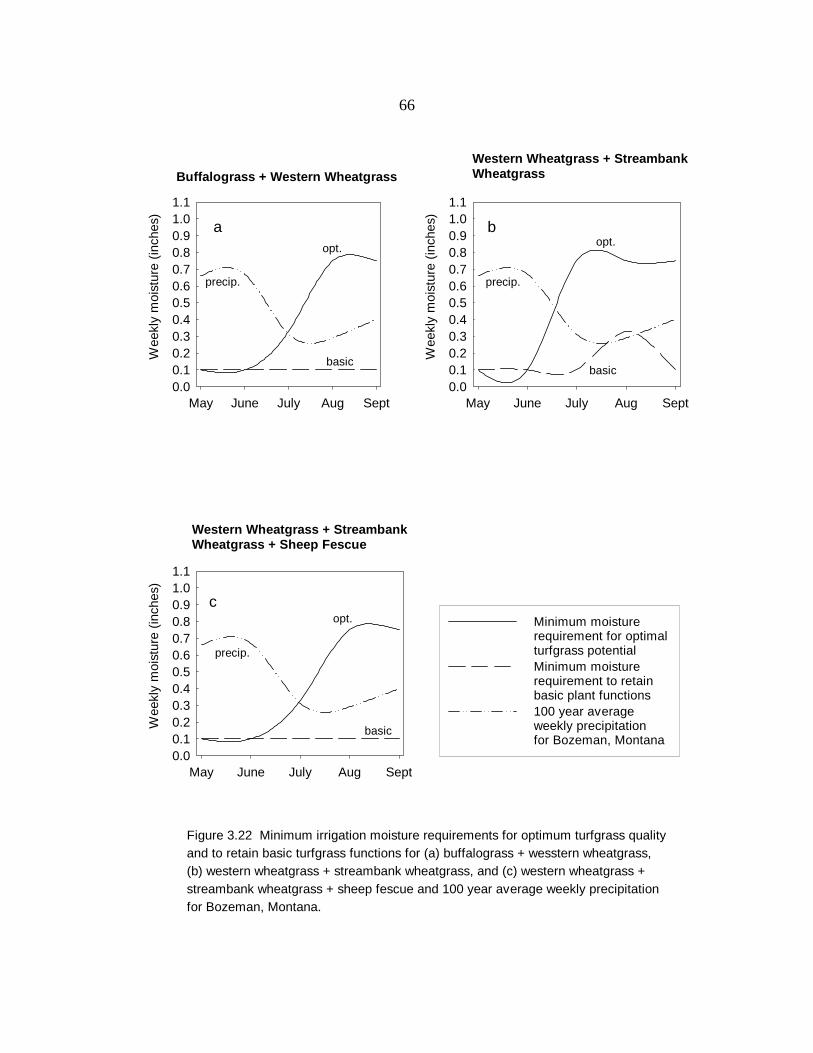
66
May June July Aug Sept
Wee
kly
moi
stur
e (in
ches
)
0.00.10.20.30.40.50.60.70.80.91.01.1
Buffalograss + Western Wheatgrass
a
May June July Aug Sept
Wee
kly
moi
stur
e (in
ches
)
0.00.10.20.30.40.50.60.70.80.91.01.1
Western Wheatgrass + Streambank Wheatgrass
b
May June July Aug Sept
Wee
kly
moi
stur
e (in
ches
)
0.00.10.20.30.40.50.60.70.80.91.01.1
Western Wheatgrass + Streambank Wheatgrass + Sheep Fescue
copt.
basic
precip.
opt.
basic
precip.
opt.
basic
precip.
Minimum moisture requirement for optimal turfgrass potentialMinimum moisture requirement to retain basic plant functions100 year average weekly precipitation for Bozeman, Montana
Figure 3.22 Minimum irrigation moisture requirements for optimum turfgrass qualityand to retain basic turfgrass functions for (a) buffalograss + wesstern wheatgrass, (b) western wheatgrass + streambank wheatgrass, and (c) western wheatgrass + streambank wheatgrass + sheep fescue and 100 year average weekly precipitation for Bozeman, Montana.
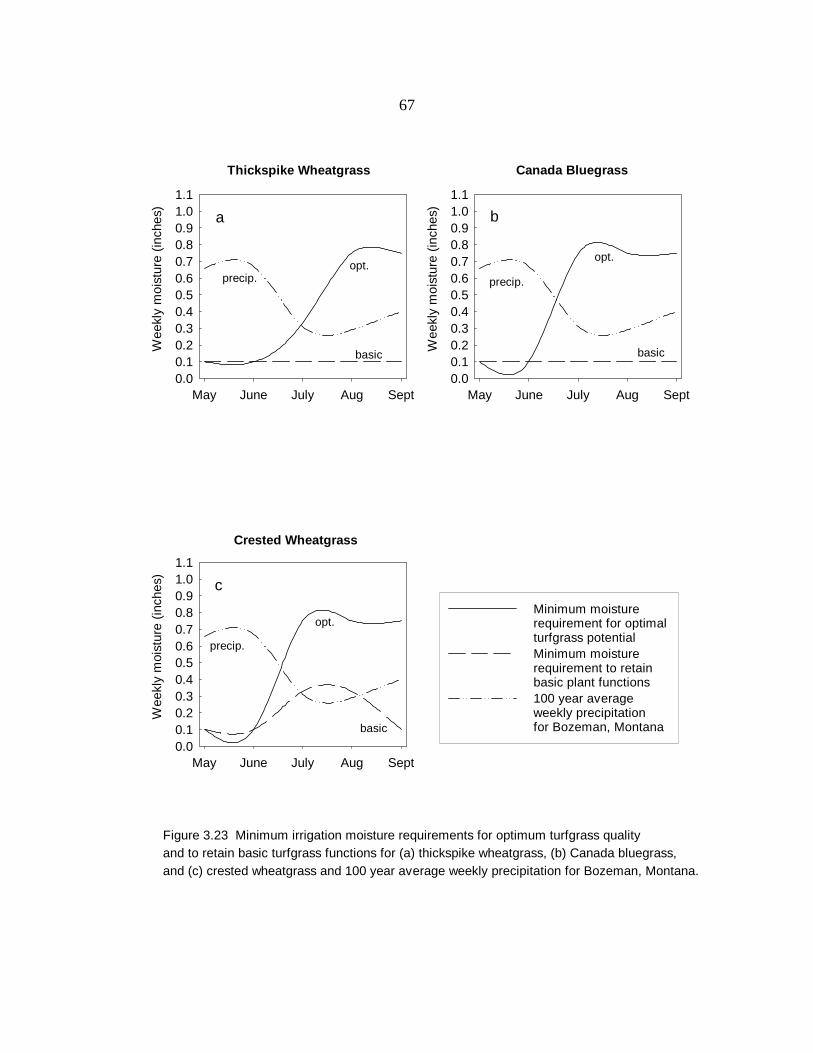
67
May June July Aug Sept
Wee
kly
moi
stur
e (in
ches
)
0.00.10.20.30.40.50.60.70.80.91.01.1
Thickspike Wheatgrass
May June July Aug Sept
Wee
kly
moi
stur
e (in
ches
)
0.00.10.20.30.40.50.60.70.80.91.01.1
Canada Bluegrass
May June July Aug Sept
Wee
kly
moi
stur
e (in
ches
)
0.00.10.20.30.40.50.60.70.80.91.01.1
Crested Wheatgrass
a b
c
opt.
basic
precip.
opt.
basic
precip.
opt.
basic
precip.
Minimum moisture requirement for optimal turfgrass potentialMinimum moisture requirement to retain basic plant functions100 year average weekly precipitation for Bozeman, Montana
Figure 3.23 Minimum irrigation moisture requirements for optimum turfgrass qualityand to retain basic turfgrass functions for (a) thickspike wheatgrass, (b) Canada bluegrass, and (c) crested wheatgrass and 100 year average weekly precipitation for Bozeman, Montana.
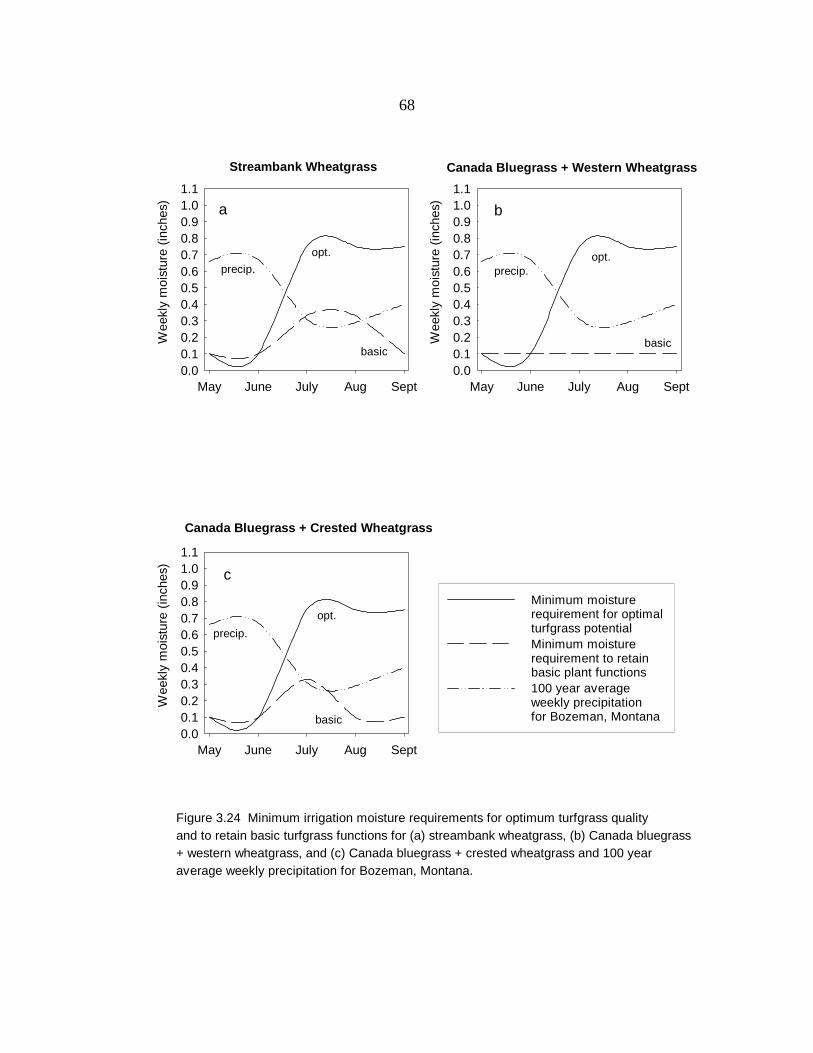
68
May June July Aug Sept
Wee
kly
moi
stur
e (in
ches
)
0.00.10.20.30.40.50.60.70.80.91.01.1
Streambank Wheatgrass
May June July Aug Sept
Wee
kly
moi
stur
e (in
ches
)
0.00.10.20.30.40.50.60.70.80.91.01.1
May June July Aug Sept
Wee
kly
moi
stur
e (in
ches
)
0.00.10.20.30.40.50.60.70.80.91.01.1
Canada Bluegrass + Western Wheatgrass
Canada Bluegrass + Crested Wheatgrass
a b
c
opt.
basic
precip.opt.
basic
precip.
opt.
basic
precip.
Minimum moisture requirement for optimal turfgrass potentialMinimum moisture requirement to retain basic plant functions100 year average weekly precipitation for Bozeman, Montana
Figure 3.24 Minimum irrigation moisture requirements for optimum turfgrass qualityand to retain basic turfgrass functions for (a) streambank wheatgrass, (b) Canada bluegrass + western wheatgrass, and (c) Canada bluegrass + crested wheatgrass and 100 year average weekly precipitation for Bozeman, Montana.

69
DISCUSSION AND CONCLUSION
Hypothesis 1: Native and adapted grasses will hold their desired turfgrass
qualities under low water conditions.
KBG and tall fescue’s color, texture, and density significantly decreased under
low water conditions. The high and medium moisture subplots held the turfgrasses
expected color, texture, and density, which proved that if the optimum turfgrass
qualities are desired, irrigation will have to occur at an average rate of three-quarters to
one inch of precipitation a week. Tall fescue required more water than KBG to retain
its turfgrass qualities.
Sheep fescue was the only monostand of grass that had overall better turfgrass
qualities under low water conditions than KBG and tall fescue. It held its color and
texture under low moisture in the arid months of July, August, and September when it
was subjected to 0.33 inches of moisture or less. During those same months, within
the same low moisture environment, KBG and tall fescue lost substantial color and
texture.
Sheep fescue has a fine texture that gives it an advantage over the wide blade
of tall fescue. Sheep fescue had similar texture ratings compared to KBG, rating above
the accepted level of five when subjected to higher moisture. When moisture was
limited, the texture of sheep fescue did not decrease as substantially as KBG in the
drier months of July, August, and September.
The density of these three grasses, when subjected to higher moisture
amounts, had ratings greater than the accepted rating of five. In the lower water
regimes, tall fescue density ratings dropped below acceptable densities in July, August,
and September. Lower moisture caused the density of sheep fescue and KBG to
70
decline in July. However, sheep fescue density increased in September, while the
KBG densities did not. Both KBG and sheep fescue densities remained above the
acceptable level throughout the season under low water.
The appearance and overall turfgrass quality of sheep fescue makes it a
respectable replacement for conventional turfgrasses in landscapes that require less
moisture. The fine texture and dark green appearance of sheep fescue held better
than the conventional turfgrass under low moisture and its density did not decrease.
More research is needed on sheep fescue to determine its compatibility to other
environments.
Many grasses held their color, textures, and densities well enough to be
considered acceptable turfgrasses for low water conditions. With some supplemental
irrigation at key times, some native and adapted turfgrass will perform well and could
be accepted as alternatives to KBG or tall fescue. For instance, western wheatgrass
did not score well using NTEP scoring, but it held its color, texture, and density for the
season with supplemental irrigation. This does not mean that a lawn planted with
these grasses or mixtures will have the same appearance as KBG, but they may have
applications in drought tolerant landscapes. Furthermore, many of the plots containing
western wheatgrass had a lighter blue-green appearance and may compliment the
color palette of drought tolerant landscape designs.
Other grasses held their color, texture, or density, but made for a poor
turfgrass. For example, crested wheatgrass held its color, texture, and density, but the
brown-green color and overall low densities of crested wheatgrass made it undesirable
for turfgrass. Crested wheatgrass may only be a good candidate for functional use,
such as erosion control and slope stabilization.
71
Thickspike wheatgrass and streambank wheatgrass are other grasses that had
some desirable turfgrass characteristics, but shredded when they were mowed. They
produced a fine texture and formed a dense turf, but the shredding caused a white cast
over the turf, thus making it undesirable.
Canada bluegrass appeared to have good turfgrass quality only in the early
spring. It held fair density throughout the season, but repeated mowing decreased its
color and texture, thus making it a poor choice for turfgrass applications.
Hypothesis 2: Mixtures of the adapted and native grasses will hold their
desired turfgrass qualities under low water conditions.
The warm-season/cool-season mixtures of buffalograss and western
wheatgrass, blue grama and western wheatgrass, and buffalograss and sheep fescue
had overall color, texture and density scores that were more consistent throughout the
growing season when compared to the single species of buffalograss or blue grama.
Buffalograss and blue grama are C4 grasses with late greenup and early fall dormancy
that contribute to low color and texture ratings in the spring and fall. When C3 grasses
such as western wheatgrass or sheep fescue were added to the warm-season grass
mixture, an early spring and late fall flush of color and texture enhanced color and
texture scores. Conversely, the addition of the warm-season grasses to western
wheatgrass or sheep fescue did not detract form the overall turfgrass qualities of the
western wheatgrass or the sheep fescue. Although blue grama or buffalograss had
altered the appearance of either western wheatgrass or sheep fescue stands, the color
and texture ratings still remained consistently at or near the same level.
72
It is then recommended that if one was to select a warm-season grass for
turfgrass in cooler climates like Southwest Montana, an addition of a cool-season grass
would increase desired turfgrass qualities with more consistency throughout the
growing season. However, compatibility studies should be performed to see if species
dominance occurs.
There was no correlation as to whether there was an increase in performance
when a mixture contained only cool-season grasses or only warm-season grasses.
Every cool season mixture in this study contained a species, such as crested
wheatgrass, Canada bluegrass, or streambank wheatgrass, which was considered
undesirable for turfgrass use. There was a limited increase in turfgrass quality by other
species masking their negative attributes, but the overall increase was not convincing
enough to recommend the mixture.
In some cases, such as the western wheatgrass, streambank wheatgrass, and
sheep fescue mix, the addition of the wheatgrasses to the sheep fescue reduced the
overall turfgrass scores as it was planted as a single species. If two higher-quality,
cool-season native and adapted grass species were isolated for their turfgrass use, it
would be applicable to retry this study. Until then, the mixing of the cool-season
grasses in this study is not advisable.
The buffalograss, blue grama, and muttongrass mixture did not have better
turfgrass qualities than the single species of buffalograss and blue grama. Therefore,
one would only need to mix the two warm-season grasses if specific colors or textures
were desired.

73
Hypothesis 3: Native and adapted grasses and their mixtures will retain their
desirable turfgrass qualities while requiring less water than Kentucky bluegrass and tall
fescue.
No grass species or mixture could perform optimally without supplemental
irrigation in Bozeman, Montana. Sheep fescue, blue grama, buffalograss, and the
buffalograss and sheep fescue mix required less supplemental irrigation than KBG and
tall fescue. However, to sustain acceptable growth, sheep fescue and the buffalograss
and sheep fescue mix could do without supplemental irrigation.
Many of the grasses and mixtures required less minimum moisture and had a
later recommended timing for irrigation than KBG. Many grasses could withstand
drought and on average would only need minimal amounts of water to retain plant
functions.
Turfgrass Recommendations for Bozeman, Montana
The grasses and mixtures with overall ratings above the acceptable score of 5
for color, texture, and density are considered the best candidates for turfgrass. They
include the buffalograss + sheep fescue mix, sheep fescue, blue grama, and
buffalograss. These grasses and mixtures would be acceptable in areas where overall
aesthetics is desired and limited water resources prohibit using KBG.
Buffalograss + Sheep Fescue Mixture
The buffalograss and sheep fescue mixture had the best overall turfgrass
quality of all of the native and adapted grasses and mixtures. The turfgrass color was
above acceptable levels without supplemental irrigation in May, June, and July. In
August and September, only minimal amount of moisture was needed to retain an
74
acceptable color. The minimum irrigation requirement for the buffalograss and sheep
fescue mix was one-third to one-half the moisture required for KBG and tall fescue.
The buffalograss and sheep fescue mix only required a minimum weekly irrigation of
0.50 inches and was recommended to begin the third week of July to obtain optimum
turfgrass quality. This was more than five weeks later than the recommended timing of
irrigation for the controls.
The texture for the mixture of buffalograss + sheep fescue also remained
above the acceptable level for all subplots during all months. The finer leaf blade of
sheep fescue combined with the fine texture of buffalograss provided a textured
turfgrass that only diminished slightly with lower water amounts in the later months of
the season.
The mixture produced a thick mat of grass which was confirmed by a high
density score for all months and water regimes. Buffalograss + sheep fescue had a
density equaling that of the sheep fescue, filling in with no bare patches and very little
weed penetration. This was unexpected because the single species of buffalograss
had only fair densities, especially within the lower moisture subplots.
The high color ratings of the buffalograss + sheep fescue mixture confirmed the
hypothesis that a warm season grass combined with a cool season grass would
support color throughout the season. Color ratings, with supplemental irrigation, were
above acceptable levels in August and September. These are months when
buffalograss has significant loss of color because of dormancy. The dark green color of
sheep fescue appeared to mask the brown dormant color of buffalograss in the spring
and the fall.

75
The stoloniferous growth habit of the buffalograss combined with the bunch-
type growth habit of sheep fescue could make the mixture a good candidate for sod
production. Weekly mowing did not suppress stolon growth for buffalograss and
allowed it to fill in areas where seeds were not dispersed well in initial seeding. Sheep
fescue filled in very well and appeared to have good binding qualities within its root
zone.
There are two possible explanations why the mix did so well. First, a better
distribution of the root system throughout the soil profile would mean there is less
competition for available moisture. Buffalograss is a C4 plant and has a maximum root
depth that is much deeper than the C3 sheep fescue. This distribution of root mass
throughout the soil profile allows sheep fescue to use the available moisture in the
upper soil profile with less competition. The ability of buffalograss to take up moisture
from lower in the soil profile with less competition means it could sustain plant
functions, thus retaining its positive turfgrass qualities. Second, there was less
competition for soil moisture within the root zone. The seeding rate for all the plots was
500 PLS per square feet. In the mixtures, the seeding rate was split among the
species. This meant that approximately half the number of plants within the specific
root zone was competing for the available water.
A drawback to the mixture is that it did not appear to be able to withstand the
foot traffic based on daily observations and weekly mowing records. The foot traffic
caused the grasses in the mixture to lie over, suggesting that the mixture may not be
able to withstand wear. Wear resistance would be important in areas such as athletic
fields and parks or in yards where increased traffic may occur from children, pets, or
recreational activities.

76
Sheep Fescue
Sheep fescue’s fine texture and dark green color contributed to its overall
turfgrass quality, making it a good candidate for a drought tolerant turfgrass. Although
it required some late-season irrigation to retain its color and texture, it held favorable
color for the entire season. Sheep fescue also provided high densities when planted at
500 PLS per square feet.
Less irrigation and a later application of irrigation reinforces the
recommendation that sheep fescue could be used as a drought tolerant turfgrass. The
recommended minimum water requirements and timing for optimum quality of sheep
fescue was 0.50 inches starting July 1. Sheep fescue required one-third to one-half
the amounts of average supplemental irrigation needed for KBG and tall fescue and a
two-week later irrigation timing.
Sheep fescue also could be considered for a low-maintenance turfgrass
because it doesn’t require mowing on a weekly basis. Sheep fescue has a maximum
height of six inches. It grew only moderately in May and June, and dry weights were
low from July to September. Because of its short stature and moderate growth, mowing
frequency is reduced and may only be needed earlier in the season.
A definite disadvantage to sheep fescue is that it did not hold up well to foot
traffic, similar to the buffalograss and sheep fescue mixture. Wear tolerance studies,
as well as mowing rate and timing, weed competition, disease and pest tolerance, and
fertility studies should be performed before it is truly considered a low-maintenance
turfgrass.
77
Blue Grama and Buffalograss
The two warm-season grasses, blue grama and buffalograss also performed
well, with high color, texture, and density ratings in the summer months. Warm-season
grasses such as blue grama and buffalograss have a late green-up and an early
dormancy. However, mid-summer color ratings were above acceptable. The color
ratings for these grasses were acceptable during June, July, and August, but increased
water was needed in August to retain acceptable color. Plant texture and densities in
both species were also acceptable, but were dependent on supplemental moisture
during the growing period.
An attracting quality to these warm-season grasses is that average
supplemental irrigation would only need to occur for six to seven weeks for optimum
turfgrass quality compared to eleven to twelve weeks of irrigation for KBG and tall
fescue. A minimum weekly irrigation of 0.50 inches from July 1 to August 15 is
recommended for these warm-season grasses for their optimum turfgrass quality in
this region. Supplemental irrigation is one-third to one-half the recommended rate of
KBG and tall fescue and has a two-week later timing than the traditional turfgrasses.
There would be a three- to four-fold water savings for the summer if these warm-
season grasses were used compared to conventional turf. There may be a less
favorable timing of color, but blue grama and buffalograss may be suitable for regions
with warmer springs and falls or for people who want only summer color.
Small differences between blue grama and buffalograss may favor choosing
one of the species over another. Blue grama greened-up earlier in the spring and was
a lighter green compared to the light blue-green of buffalograss. Texture and density
of blue grama also appeared to be better early in the season compared to the

78
buffalograss. Buffalograss, on the other hand, is stoloniferous and may have a better
recuperative capacity if there is a disturbance. Buffalograss also appeared to be able
to withstand long periods of moisture, while the blue grama discolored when
waterlogged during rain periods which lasted for several days.
As with the sheep fescue and buffalograss + sheep fescue mixture, there
should be further research to determine suitability of the buffalograss + blue grama
mixture for turfgrass. One concern is their ability to withstand winterkill. Although they
survived the winter in this experiment, much harder winters have been known to occur.
The warm-season grasses should be further evaluated in cooler regions such as
Bozeman, Montana.
Turfgrass Quality of KBG and Tall Fescue
Most of the turfgrass in the Intermountain West contains KBG. KBG is planted
because it has desired turfgrass qualities such as good color and texture, high
densities, wear resistance, and good recuperative capacities. However, the retention
of these qualities requires high amounts of moisture.
KBG was indeed dependent on higher moisture for long periods of time to
achieve overall turfgrass quality. It had the desirable kelly green color, but was unable
to hold that color from July to September without increased amounts of moisture.
The turfgrass industry recommends that KBG receive an inch of water every
week for optimum turfgrass quality. The results of this experiment confirmed this with a
recommendation of a minimum of 0.75 inches and an optimum 1.00 inches of water
per week, starting in mid-June to retain optimum color. Starting irrigation in July, any
water less than 0.75 inches per week caused the grass to go dormant and turn brown.
79
Color was not the only parameter affected with low irrigation amounts. Texture ratings
of KBG were also lowered at a minimum irrigation of 0.75 inches per week in the later
half of the season.
Tall fescue is a rough-textured turfgrass that has many good attributes, such as
good color and density desired for turfgrass. However, it is mainly used on athletic
fields because of its wear resistance. Recently, tall fescue seed has been marketed as
a drought tolerant turfgrass because of its deep root growth. According to the results
of this study, to retain the desired turfgrass qualities tall fescue required just as much
water as KBG, if not more. Tall fescue required a minimum of 1.00 inch of irrigation
per week starting mid-June to retain acceptable color ratings. This is counterintuitive to
the anecdotal evidence that tall fescue is as drought tolerant as KBG.
Further evidence that tall fescue may not be suitable as a drought tolerant
turfgrass is that the texture rating fell below the acceptable level for the season, as
expected, because of the wide leaf blade. Plot densities were acceptable, although
water amounts below 0.75 inches in August and September decreased plant densities
for tall fescue.
Turfgrass Recommended for Low-Maintenance Turf
Some species and mixtures lent themselves to be adequate drought tolerant
turfgrass, but lack either the color, texture, density, or a combination of characteristics
that would make them favorable for optimal turfgrass purposes. In this study, many of
the results for color, texture, and density for these plots may have fallen below the
acceptable level of 5, but held ratings just below that benchmark for most of the

80
season. In most cases, the grasses or mixtures adequate for drought tolerant
turfgrass needed supplemental water to achieve optimum appearance.
Western Wheatgrass
The light green-blue appearance and drought tolerant attributes of western
wheatgrass could make it an alternative turfgrass in drought tolerant landscapes. It is
not expected that any of the wheatgrasses would appear to have the same optimal
characteristics as the controls, but some attributes of western wheatgrass may be
desirable. Its color, texture, and density ratings were just below 5, but they were mostly
consistent throughout the season. Optimum ratings for western wheatgrass did require
higher moisture levels from July to September. However, if less water was applied, the
reduction in its qualities would be minimal except for color. To retain the desired color
of western wheatgrass, 0.75 inches per week of irrigation would have to occur.
Western wheatgrass had fair color, texture, and density ratings, but required a
minimum of 0.75 inches of supplemental irrigation starting the third week in June to
retain optimum color. When western wheatgrass was added to a mixture, the need for
supplemental irrigation decreased and the irrigation time was delayed accordingly.
Further study and possible selection of differing races of western wheatgrass may
make it applicable for drought resistant turfgrass in other regions of the Intermountain
West.
Western Wheatgrass Mixtures
The mixture of western + streambank wheatgrass and the mixture of western
wheatgrass + streambank wheatgrass + sheep fescue had very similar color, texture,
and density ratings. Both mixtures held their color for the season, but some minimum
81
irrigation later in the season was required for optimum turfgrass appearance. When
the others species were added to western wheatgrass, 0.25 inches less moisture was
required than when western wheatgrass stood alone. Most of the ratings for texture
were just below the acceptable level because wheatgrasses have wider blades and
higher meristematic regions that make them appear to be less dense. Densities also
were just below the accepted level, but increased with supplemental irrigation.
Minimum water required for optimum color, texture and density in the western
wheatgrass and streambank wheatgrass mixture was 0.50 inches per week from mid
July to early September. When sheep fescue was added to the mixture, 0.50 inches
was the minimum moisture requirement, but supplemental irrigation could begin on
average a week later. The supplemental irrigation requirements were one-quarter to
one-half the recommended rates for KBG and tall fescue. Furthermore, the estimated
timing of irrigation in a sheep fescue mixture was one to two weeks later than timing of
irrigation for KBG and tall fescue. This would equate to a substantial decrease in
overall water use.
The streambank wheatgrass in the mixture lowered ratings for color because it
shreds when mowed. Shredding formed a white cast on the plots making them appear
less desirable. Interestingly, in the western wheatgrass, streambank wheatgrass, and
sheep fescue colors did not mix well and gave the mixture a mottled effect of light tan,
dark green, and light blue-green. This mixture was affectionately called “camograss.”
When western wheatgrass was mixed with the warm-season grasses of blue
grama and buffalograss, the color, texture, and density ratings held at or just below the
acceptable score of 5, which meant that these mixtures, although not optimum, may be
good candidates for drought tolerant turfgrass. Furthermore, these mixtures fit well
82
with the desired mixing of a warm-season with a cool-season grass, and mixing a
stoloniferous growth habit with a bunch type growth habit as in the buffalograss and
western wheatgrass mixture.
The timing of supplemental irrigation for the buffalograss or blue grama +
western wheatgrass mixture was delayed until early July. Unlike the monoculture of
warm-season grasses, the blue grama + western wheatgrass and the buffalograss +
western wheatgrass mixture held very uniform color all season, with only a minimum
irrigation of 0.50 inches per week needed in the later months. Later irrigation, plus the
need for less water amounted to more water savings than KBG or tall fescue.
Compatibility and competition, resistance to winterkill, wear resistance, mowing
rate and timing, weed competition, disease and pest tolerance, and fertility studies
could be performed on wheatgrass monostands or mixtures before truly knowing if
there are desired qualities for various turfgrass situations.
Species and Mixtures Not Recommended for Turfgrass
Due to low quality ratings and higher irrigation needs, some species and
mixture did not meet the criteria of an acceptable turfgrass and therefore we did not
recommend them for Bozeman, Montana. The grasses did not hold their color and/or
had texture or density ratings significantly below the acceptable rating of 5, mostly
because repeated mowing affected their appearance. These include: crested
wheatgrass, streambank wheatgrass, thickspike wheatgrass, and Canada bluegrass.
Crested wheatgrass, streambank wheatgrass, and thickspike wheatgrass all
had low color ratings, as well as less than adequate textures and densities. Although
‘Road Crest’ crested wheatgrass was developed as a drought tolerant grass for
83
maintained roadside use, its color was reduced and, at best, was usually brown-green.
The texture and density of crested wheatgrass was low, although densities increased
with more moisture. Overall, crested wheatgrass may be drought tolerant, but is not
suitable for any kind of turfgrass use.
Streambank and thickspike wheatgrass had a very resilient blade that, when
mowed, shredded and produced a white cast over the plots. This white cast detracted
from the overall appearance of the grass and caused low color ratings. Textures and
densities of the grasses were adequate, but under any kind of mowing these grasses
are not recommended. Finally, as with all the wheatgrasses, the higher dry weights
meant heavy growth in the early summer in which more frequent mowing would have
to occur.
The mixtures and single specie plots containing Canada bluegrass had very low
color and texture ratings because of the ‘steminess’ caused by repeated mowing.
When mowed, the internodes of its crowns elongated, creating an inferior turfgrass. In
May, Canada bluegrass seemed to be a superior grass. However, as the summer
went on, the lush blade growth was removed by mowing and only the ‘stem’ remained.
This caused low texture and color ratings.
The mixtures that contained Canada bluegrass also had lower color and texture
because the ‘steminess’ also was very apparent in those plots. The mixture of Canada
bluegrass + western wheatgrass did have higher texture and density scores, but the
overall color distracted from its appearance. Currently, Canada bluegrass is being
used by some sod producers as a binder species in sod production of drought tolerant
turfgrasses. It would be inadvisable to include it in any mixture if mowing heights were
to be limited to three inches or lower.

84
Research and Development
Much turfgrass research and development has gone into KBG and tall fescue.
Color, wear resistance, vigor, cold tolerance, and other characteristics have been
evaluated and bred into these grasses. This study has shown that some uncommon
grasses have some desirable turfgrass qualities comparable to KBG and tall fescue,
with proper irrigation and scheduling.
More research has to be performed on selected native and adapted grasses to
understand their potential for turfgrass applications. General considerations in overall
turfgrass quality such as color, texture, density, spring greenup, seedling vigor and
establishment, living ground cover, drought tolerance, frost tolerance, tolerance to
winterkill, disease and pest resistance, and wear resistance should be evaluated.
This study was performed on one site and in one environment. However, the
species and mixtures that performed well in this study should be more intensively
evaluated in the future. Similar studies are being performed in Bridger, Montana, and
Logan, Utah, and may produce results in differing soils and environments. The
measurements of this experiment, along with the other locations’ experimental data,
should give a better view into the recommendations for these native and adapted
grasses for turfgrass applications.
85
REFERENCES CITED ________________________ American Society of Horticulture Science Annual Convention, 2005 Las Vegas, Nevada. Aronson, L. J., Gold, A. J., and Hull, R. J. 1987. Cool-Season Turfgrass Responses to
Drought Stress. Crop Science, Vol. 27: 1261-1266 Aurasteh R. 1984. Residential Lawn Irrigation Management. Transactions of the ASAE v 27
Mar/Apr 1984. 470-472
Beard, J. B. 1973. Turfgrass: Science and Culture. Prentice-Hall, Inc. Englewood Cliffs, New Jersey.
Beard, J. B., and Green, R.L. 1994. The Role of Turfgrass in Environmental Protection and
Their Benefits. Journal of Environmental Quality, Vol. 23, no. 3: 452-460 Bormann, H. F., Balmori, D., and Geballe, G. T. 1993. Redesigning the American lawn : A
Search for Environmental Harmony. Yale University Press,
Browning, S. J., Riordan, T. P., Johnson, R. K., and Johnson-Cicalese, J. Hertiability Estimates of Turf-Type Characteristics in Buffalograss. Hortscience, Vol. 27: 204-205
Casler, M. D. and Duncan, R. R. 2003. Turfgrass Biology, Genetics, and Breeding. John
Wiley & Sons, Inc. Hoboken, NJ Christians, N. 2004. Fundamentals of Turfgrass Management. John Wiley & Sons, Inc,
Hoboken, NJ. DiPaola, J. M. and Beard, J. B. 1992 Physiological Effects of Temperature Stress. Agronomy
Journal, Vol. 32: 434-439 Diesberg, K. L., Christians, N. E., Moore, R., Branham, B., Danneberger, T. K., Reicher, Z. J.,
Voigt, T., Minner, D. D., and Newman, R. 1997. Species for Low-Input Sustainable Turf in the U.S. Upper Midwest. Agronomy Journal, Vol. 89: 690-694
Duble, R. L. 1996. Turfgrasses, Their Management and Use in the Southern Zone. Texas
A&M University Press, College Station, TX. Ervin, E. H. and Koski, A. J. 1998. Drought Avoidance Aspects and Crop Coefficients of
Kentucky Bluegrass and Tall Fescue Turfs in the Semiarid West. Crop Science, Vol.38, no.3: 788-796
Feldhake, C. M., Danileson, R. E., and Butler, J. D. 1984. Turfgrass Evapotranspiration. II.
Responses to Deficit Irrigation. Agronomy Journal, Vol. 76: 85-89
86
Gould, F. W. and Shaw, R. B. 1983. Grass Systematics. Texas A&M University Press, College Station, TX.
Hanks, R. J., Keller, J., Rasmussen, V. P., and Wilson, D. 1976. Sprinkler for Continuous
Variable Irrigation Crop Production Studies. Soil Science Society of America, Vol 40 No, 3: 426-429
Holzworth, R. 1990. Native Grasses for Low Maintenance Ground Cover. USDA-NRCS,
Bozeman, Mt. Lavin, M. and Seibert, C. 2005. Grasses of Montana. MSU (Montana State University)
Herbarium, Department of Plant Sciences. McCarly, L. B. and Colvin, D. C. 1992. Buffalograss Tolerance to Post Emergence Herbicide.
HortScience, Vol. 27: 898-899 McNaughton 1982. I got this from Bormann, but I haven’t tracked down the reference. Mintenko, A. S., Smith, S. R., and Cattani, D. J. Turfgrass Evaluation of Native Grasses for
the Northern Great Plains Region. Crop Science, Vol. 42: 2018-2024 National Oceanic and Atmospheric Administration. 2004. Website, www.noaa.gov National Turfgrass and Evaluation Program 2005. Website, www.ntep.org National Turfgrass and Evaluation Program. 1995. National Buffalograss Test 1991. NTEP
Final Report. USDA-ARS, Beltsville, MD. Qian, Y. L. and Engelke, M. C. 1999. Performance of Five Turfgrasses under Linear Gradient
Irrigation. HortScience, Vol. 34. no. 5: 893-896 Qian, Y. L., Fry, J. D., and Upham, W. S. 1997. Rooting and Drought Avoidance of Warm-
Season Turfgrasses and Tall Fescue in Kansas. Crop Science, Vol. 37: 905-910 SAS Institute Inc., 1988. SAS/STAT User’s Guide (release 9.1 Edn). SAS Institute Inc, Cary,
Indiana. 1028pp. United States Department of Agriculture, National Resource and Conservation Service Plants
Database. 2005. Website, www.plants.usda.gov Vinchesi, B. E. 2002. Irrigations Changing Face: The Trends that will Determine How You
Will Soon Irrigate Your Customer’s Properties. Landscape Management, Vol.41, no. 2: 30 Watson, L. and Dallwitz, M. J. 1994. The Grass Genera of the World. CAB International,
Wallingford OX10 8DE, United Kingdom, 1080pp.

87
APPENDICES
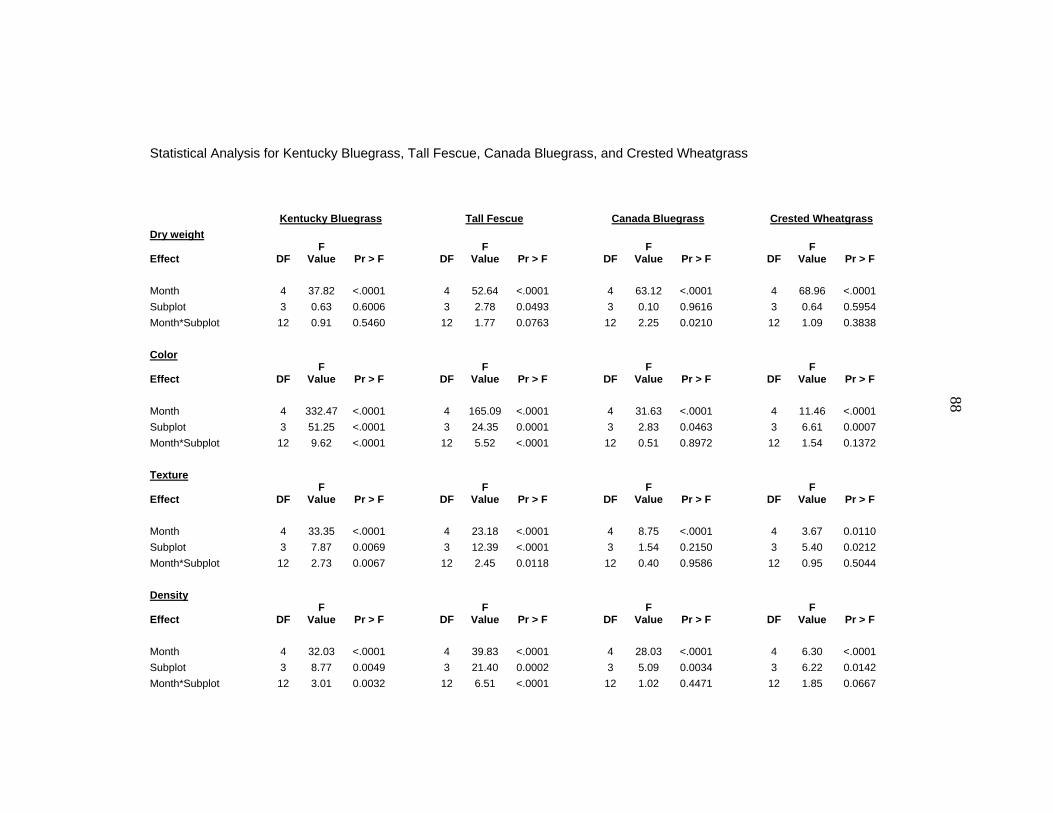
Statistical Analysis for Kentucky Bluegrass, Tall Fescue, Canada Bluegrass, and Crested Wheatgrass
Kentucky Bluegrass Tall Fescue Canada Bluegrass Crested Wheatgrass Dry weight
Effect DF F
Value Pr > F DF F
Value Pr > F DF F
Value Pr > F DF F
Value Pr > F Month 4 37.82 <.0001 4 52.64 <.0001 4 63.12 <.0001 4 68.96 <.0001 Subplot 3 0.63 0.6006 3 2.78 0.0493 3 0.10 0.9616 3 0.64 0.5954 Month*Subplot 12 0.91 0.5460 12 1.77 0.0763 12 2.25 0.0210 12 1.09 0.3838 Color
Effect DF F
Value Pr > F DF F
Value Pr > F DF F
Value Pr > F DF F
Value Pr > F
Month 4 332.47 <.0001 4 165.09 <.0001 4 31.63 <.0001 4 11.46 <.0001 Subplot 3 51.25 <.0001 3 24.35 0.0001 3 2.83 0.0463 3 6.61 0.0007 Month*Subplot 12 9.62 <.0001 12 5.52 <.0001 12 0.51 0.8972 12 1.54 0.1372 Texture
Effect DF F
Value Pr > F DF F
Value Pr > F DF F
Value Pr > F DF F
Value Pr > F Month 4 33.35 <.0001 4 23.18 <.0001 4 8.75 <.0001 4 3.67 0.0110 Subplot 3 7.87 0.0069 3 12.39 <.0001 3 1.54 0.2150 3 5.40 0.0212 Month*Subplot 12 2.73 0.0067 12 2.45 0.0118 12 0.40 0.9586 12 0.95 0.5044 Density
Effect DF F
Value Pr > F DF F
Value Pr > F DF F
Value Pr > F DF F
Value Pr > F Month 4 32.03 <.0001 4 39.83 <.0001 4 28.03 <.0001 4 6.30 <.0001 Subplot 3 8.77 0.0049 3 21.40 0.0002 3 5.09 0.0034 3 6.22 0.0142 Month*Subplot 12 3.01 0.0032 12 6.51 <.0001 12 1.02 0.4471 12 1.85 0.0667
88
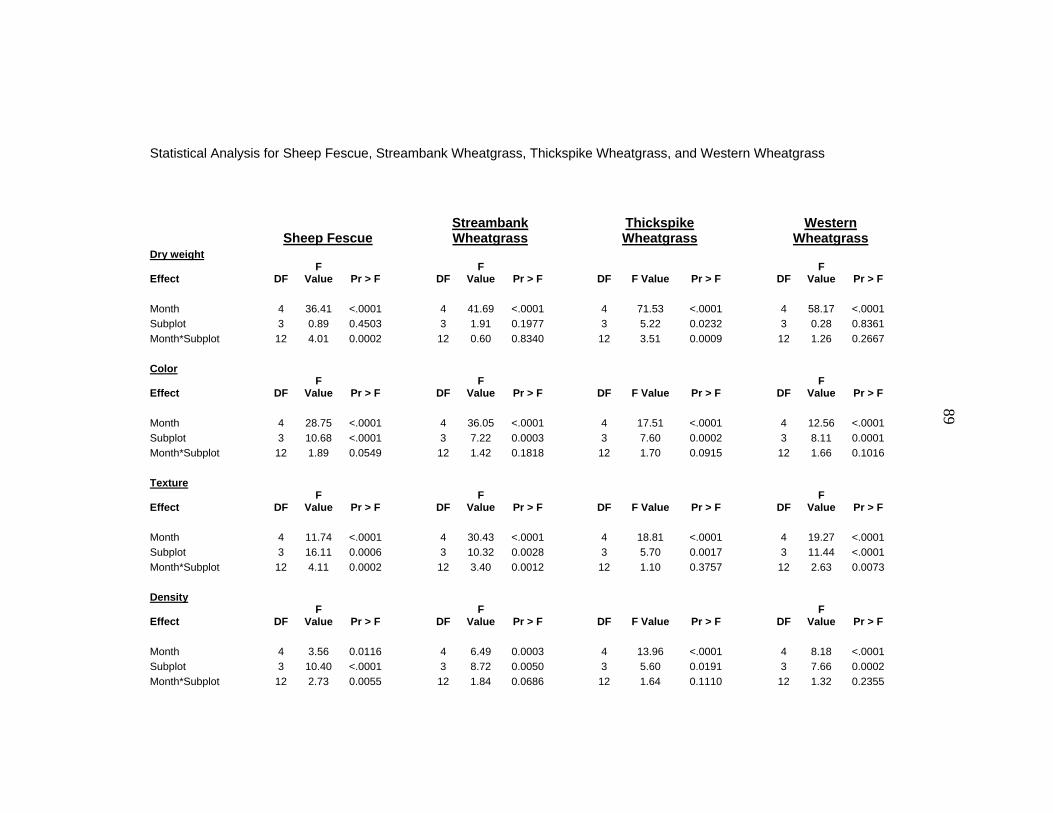
Statistical Analysis for Sheep Fescue, Streambank Wheatgrass, Thickspike Wheatgrass, and Western Wheatgrass
Sheep Fescue Streambank Wheatgrass
Thickspike Wheatgrass
Western Wheatgrass
Dry weight
Effect DF F
Value Pr > F DF F
Value Pr > F DF F Value Pr > F DF F
Value Pr > F Month 4 36.41 <.0001 4 41.69 <.0001 4 71.53 <.0001 4 58.17 <.0001 Subplot 3 0.89 0.4503 3 1.91 0.1977 3 5.22 0.0232 3 0.28 0.8361 Month*Subplot 12 4.01 0.0002 12 0.60 0.8340 12 3.51 0.0009 12 1.26 0.2667 Color
Effect DF F
Value Pr > F DF F
Value Pr > F DF F Value Pr > F DF F
Value Pr > F Month 4 28.75 <.0001 4 36.05 <.0001 4 17.51 <.0001 4 12.56 <.0001 Subplot 3 10.68 <.0001 3 7.22 0.0003 3 7.60 0.0002 3 8.11 0.0001 Month*Subplot 12 1.89 0.0549 12 1.42 0.1818 12 1.70 0.0915 12 1.66 0.1016 Texture
Effect DF F
Value Pr > F DF F
Value Pr > F DF F Value Pr > F DF F
Value Pr > F Month 4 11.74 <.0001 4 30.43 <.0001 4 18.81 <.0001 4 19.27 <.0001 Subplot 3 16.11 0.0006 3 10.32 0.0028 3 5.70 0.0017 3 11.44 <.0001 Month*Subplot 12 4.11 0.0002 12 3.40 0.0012 12 1.10 0.3757 12 2.63 0.0073 Density
Effect DF F
Value Pr > F DF F
Value Pr > F DF F Value Pr > F DF F
Value Pr > F Month 4 3.56 0.0116 4 6.49 0.0003 4 13.96 <.0001 4 8.18 <.0001 Subplot 3 10.40 <.0001 3 8.72 0.0050 3 5.60 0.0191 3 7.66 0.0002 Month*Subplot 12 2.73 0.0055 12 1.84 0.0686 12 1.64 0.1110 12 1.32 0.2355
89
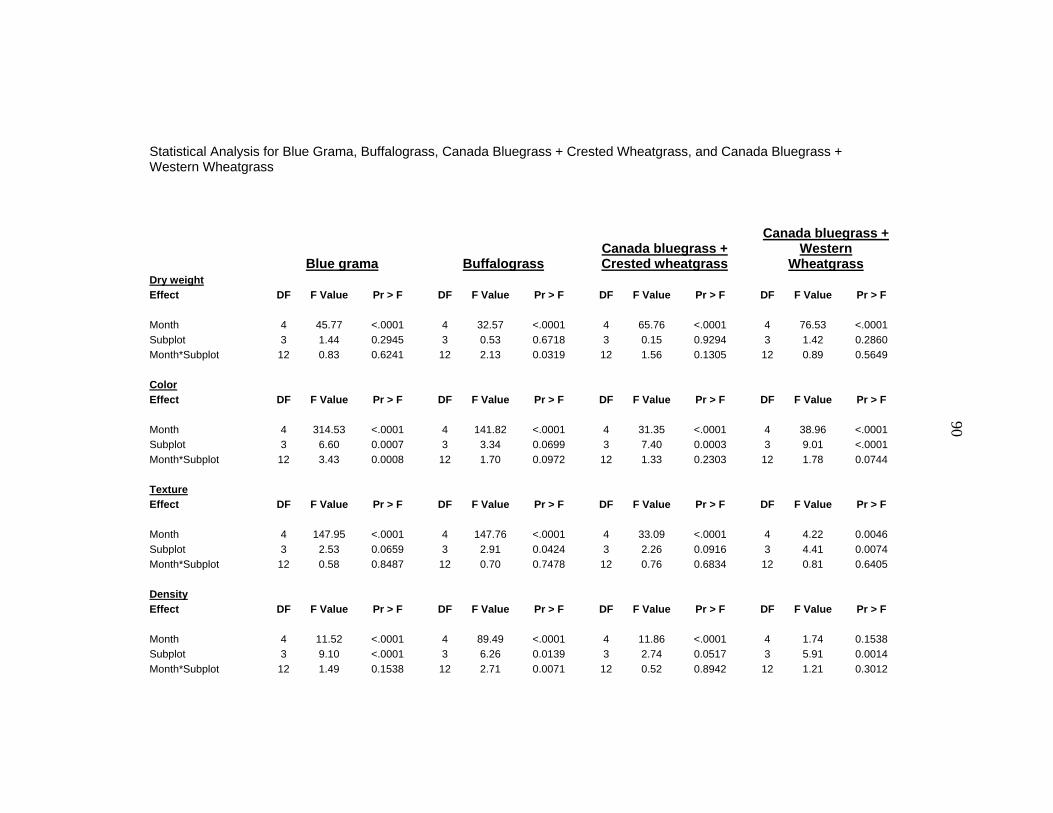
Statistical Analysis for Blue Grama, Buffalograss, Canada Bluegrass + Crested Wheatgrass, and Canada Bluegrass + Western Wheatgrass
Blue grama Buffalograss Canada bluegrass + Crested wheatgrass
Canada bluegrass + Western
Wheatgrass Dry weight Effect DF F Value Pr > F DF F Value Pr > F DF F Value Pr > F DF F Value Pr > F Month 4 45.77 <.0001 4 32.57 <.0001 4 65.76 <.0001 4 76.53 <.0001 Subplot 3 1.44 0.2945 3 0.53 0.6718 3 0.15 0.9294 3 1.42 0.2860 Month*Subplot 12 0.83 0.6241 12 2.13 0.0319 12 1.56 0.1305 12 0.89 0.5649 Color Effect DF F Value Pr > F DF F Value Pr > F DF F Value Pr > F DF F Value Pr > F
Month 4 314.53 <.0001 4 141.82 <.0001 4 31.35 <.0001 4 38.96 <.0001 Subplot 3 6.60 0.0007 3 3.34 0.0699 3 7.40 0.0003 3 9.01 <.0001 Month*Subplot 12 3.43 0.0008 12 1.70 0.0972 12 1.33 0.2303 12 1.78 0.0744 Texture Effect DF F Value Pr > F DF F Value Pr > F DF F Value Pr > F DF F Value Pr > F Month 4 147.95 <.0001 4 147.76 <.0001 4 33.09 <.0001 4 4.22 0.0046 Subplot 3 2.53 0.0659 3 2.91 0.0424 3 2.26 0.0916 3 4.41 0.0074 Month*Subplot 12 0.58 0.8487 12 0.70 0.7478 12 0.76 0.6834 12 0.81 0.6405 Density Effect DF F Value Pr > F DF F Value Pr > F DF F Value Pr > F DF F Value Pr > F Month 4 11.52 <.0001 4 89.49 <.0001 4 11.86 <.0001 4 1.74 0.1538 Subplot 3 9.10 <.0001 3 6.26 0.0139 3 2.74 0.0517 3 5.91 0.0014 Month*Subplot 12 1.49 0.1538 12 2.71 0.0071 12 0.52 0.8942 12 1.21 0.3012
90
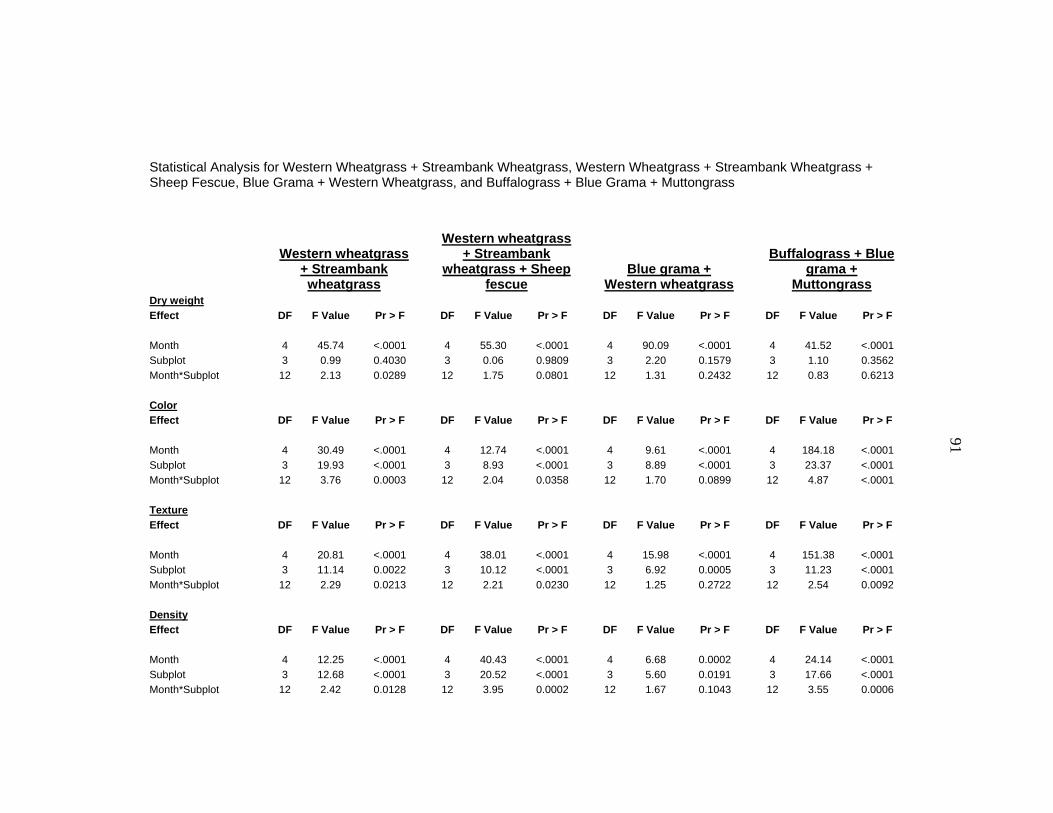
Statistical Analysis for Western Wheatgrass + Streambank Wheatgrass, Western Wheatgrass + Streambank Wheatgrass + Sheep Fescue, Blue Grama + Western Wheatgrass, and Buffalograss + Blue Grama + Muttongrass
Western wheatgrass + Streambank wheatgrass
Western wheatgrass + Streambank
wheatgrass + Sheep fescue
Blue grama + Western wheatgrass
Buffalograss + Blue grama +
Muttongrass Dry weight Effect DF F Value Pr > F DF F Value Pr > F DF F Value Pr > F DF F Value Pr > F Month 4 45.74 <.0001 4 55.30 <.0001 4 90.09 <.0001 4 41.52 <.0001 Subplot 3 0.99 0.4030 3 0.06 0.9809 3 2.20 0.1579 3 1.10 0.3562 Month*Subplot 12 2.13 0.0289 12 1.75 0.0801 12 1.31 0.2432 12 0.83 0.6213 Color Effect DF F Value Pr > F DF F Value Pr > F DF F Value Pr > F DF F Value Pr > F Month 4 30.49 <.0001 4 12.74 <.0001 4 9.61 <.0001 4 184.18 <.0001 Subplot 3 19.93 <.0001 3 8.93 <.0001 3 8.89 <.0001 3 23.37 <.0001 Month*Subplot 12 3.76 0.0003 12 2.04 0.0358 12 1.70 0.0899 12 4.87 <.0001 Texture Effect DF F Value Pr > F DF F Value Pr > F DF F Value Pr > F DF F Value Pr > F Month 4 20.81 <.0001 4 38.01 <.0001 4 15.98 <.0001 4 151.38 <.0001 Subplot 3 11.14 0.0022 3 10.12 <.0001 3 6.92 0.0005 3 11.23 <.0001 Month*Subplot 12 2.29 0.0213 12 2.21 0.0230 12 1.25 0.2722 12 2.54 0.0092 Density Effect DF F Value Pr > F DF F Value Pr > F DF F Value Pr > F DF F Value Pr > F Month 4 12.25 <.0001 4 40.43 <.0001 4 6.68 0.0002 4 24.14 <.0001 Subplot 3 12.68 <.0001 3 20.52 <.0001 3 5.60 0.0191 3 17.66 <.0001 Month*Subplot 12 2.42 0.0128 12 3.95 0.0002 12 1.67 0.1043 12 3.55 0.0006
91
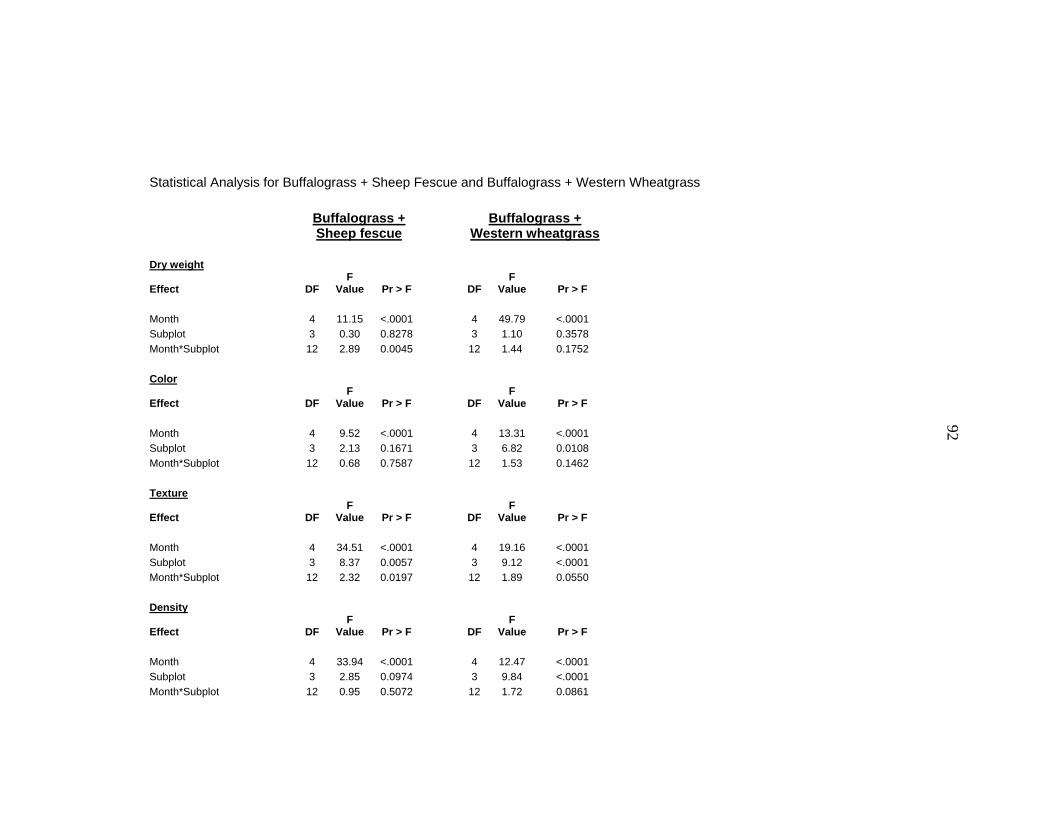
Statistical Analysis for Buffalograss + Sheep Fescue and Buffalograss + Western Wheatgrass
Buffalograss + Sheep fescue
Buffalograss + Western wheatgrass
Dry weight
Effect DF F
Value Pr > F DF F
Value Pr > F Month 4 11.15 <.0001 4 49.79 <.0001 Subplot 3 0.30 0.8278 3 1.10 0.3578 Month*Subplot 12 2.89 0.0045 12 1.44 0.1752 Color
Effect DF F
Value Pr > F DF F
Value Pr > F
Month 4 9.52 <.0001 4 13.31 <.0001 Subplot 3 2.13 0.1671 3 6.82 0.0108 Month*Subplot 12 0.68 0.7587 12 1.53 0.1462 Texture
Effect DF F
Value Pr > F DF F
Value Pr > F Month 4 34.51 <.0001 4 19.16 <.0001 Subplot 3 8.37 0.0057 3 9.12 <.0001 Month*Subplot 12 2.32 0.0197 12 1.89 0.0550 Density
Effect DF F
Value Pr > F DF F
Value Pr > F Month 4 33.94 <.0001 4 12.47 <.0001 Subplot 3 2.85 0.0974 3 9.84 <.0001 Month*Subplot 12 0.95 0.5072 12 1.72 0.0861
92