Embed Size (px)
Citation preview
DIOMISDeveloping Infrastructure and Operating Models for Intermodal Shift
International Combined Transport Production Systems including long and heavy trains(Workpackage A7)
July 2007
UNION INTERNATIONALE DES CHEMINS DE FERINTERNATIONALER EISENBAHNVERBANDINTERNATIONAL UNION OF RAILWAYS
© E
TF p
ublic
atio
n - 2
007

Developing Infrastructure and Operating Models for Intermodal Shift
International Combined Transport Production Systems including long and heavy trains
(Workpackage A7)

ISBN 2-7461-1378-3
Warning
No part of this publication may be copied, reproduced or distributed by any means whatsoever, including
electronic, except for private and individual use, without the express permission of the International Union of
Railways (UIC). The same applies for translation, adaptation or transformation, arrangement or reproduction
by any method or procedure whatsoever. The sole exceptions - noting the author’s name and the source - are
“analyses and brief quotations justifi ed by the critical, argumentative, educational, scientifi c or informative nature of
the publication into which they are incorporated”.
(Articles L 122-4 and L122-5 of the French Intellectual Property Code).
© Copyright - Paris, 2007

Contents
1 Background ..............................................................................................1
2 International combined transport production systems ........................2
2.1 Objectives ..........................................................................................................................2
2.2 Methodology ......................................................................................................................3
2.3 Description of combined transport production systems .....................................................4
2.3.1 - Direct train ...............................................................................................................6
2.3.2 - Shuttle train ...............................................................................................................6
2.3.3 - Y-shuttle train ............................................................................................................7
2.3.4 - Liner train ..................................................................................................................8
2.3.5 - Group train ................................................................................................................9
2.3.6 - Turntable traffi c .......................................................................................................10
2.3.7 - Gateway traffi c ........................................................................................................11
2.3.8 - Megahub/Mainhub production ................................................................................13
2.3.9 - Mixed intermodal/conventional traffi c .....................................................................14
2.4 Assessment criteria of combined transport production systems ......................................15
2.5 Assessment of effi ciency of combined transport production systems ..............................18
2.6 Conclusions and considerations ......................................................................................31
3 Long and heavy trains ...........................................................................35
3.1 Objective .........................................................................................................................35
3.2 General methodology .......................................................................................................35
3.3 Current situation of infrastructure with respect to longer and heavier trains and existing plans for improvements ......................................................................................36
3.4 Identifi cation of suitable corridors for longer and heavier trains .......................................40
3.4.1 - Identifi cation of suitable corridors by the analysis of CT volumes and infrastructure capacities .........................................................................................42
3.4.2 - Identifi cation of suitable corridors by a partial assignment on given intersections .............................................................................................46
3.5 Technical and operational opportunities and limits for longer and heavier trains .............51
3.5.1 - Technical aspects:...................................................................................................52
3.5.2 - Operational aspects ................................................................................................53
3.5.3 - Corridors recommended .........................................................................................54

3.6 Impact of longer and heavier trains on the use of capacity 2015 .....................................55
3.6.1 - Methodology ...........................................................................................................55
3.6.2 - Scenarios calculated ...............................................................................................59
3.7 Conclusions .....................................................................................................................65
List of fi gures .............................................................................................66
List of tables ..............................................................................................68

Page 5 of 74
1 Background
Apart from ensuring a customer-oriented time-table the greatest challenge for combined rail/road transportation is to collect volumes that enable operators achieving competitive production costs. The present study deals with three issues in this respect:
• Which intermodal production systems on what market conditions are most effi cient?• How could trains longer and heavier than the current “standards” be achieved?• What could enhanced operational schemes contribute to improve the employment of
saturated rail infrastructure and ensure the future growth of combined transport?
The fi ndings of the present study are an input into the Combined Transport Master Plan 2015, which – based on the results of the DIOMIS components - will contain recommendations on how to enhance and promote the combined transport industry in Europe (cf Fig. 1-1). The Master Plan will be completed by the end of 2007.
Figure 1-1: Components of DIOMIS Master Plan process

Page 6 of 74
2 International combined transport production systems
2.1 Objectives
Combined rail/road transportation - like every other rail freight service – is only effi cient if the intermodal operator succeeds in consolidating such a volume of cargo to achieve competitive cost per unit or shipment. To match the service requirements of shippers’ and/or logistic service providers a daily service operated in both directions is used to be supplied. On trade lanes between major economic centres the intermodal operator may fi nd ample market potential to run direct point-to-point services. If the volumes are not or not yet suffi cient he is challenged to design and apply appropriate production systems, which allow for bundling fl ows of cargo for operating market-oriented roundtrip schemes.
But what is “good” for operators of intermodal services must not necessarily be “good” for rail infrastructure. The increasing saturation of the European rail network calls for production systems, which employ the infrastructure most effi ciently as well.
Against this background the present section of the study has investigated how international combined transport could contribute to this goal and how the economic and operational necessities of operators be reconciled with the challenge of coping with limited rail infrastructure capacities and also ensuring a further growth of intermodal freight transport. The objectives of this investigation in particular were:
• To identify production systems which enable the intermodal stakeholders to bundle volumes and/or transport more volumes on the same train,
• To assess the impact on coping with limited rail infrastructure capacities,• To assess the impact of those schemes on rail’s ability to capture forecast traffi c
growth.

Page 7 of 74
2.2 Methodology
With respect to the above objectives the investigation into the impact of combined transport production systems on the employment of rail infrastructure capacities has been carried out in three consecutive steps:
• Identifi cation of intermodal production systems: The focus of the study, fi rst of all, is on the most common operational schemes and, secondly, on systems, which are supposed to have a signifi cant future potential.
• Analysis and determination of appropriate assessment criteria of intermodal production systems.
• Assessment of effi ciency of combined transport production systems.
The “classic” operators associated in the UIRR and, to a lesser extent, Intercontainer were used to neither perform rail/road services for their own cargo nor invest in assets maybe except for specialized wagons. Even if they sold one or the other service completely to one customer (company train) as a rule they were and are still operating rather “open systems”. On the other hand, since the liberalization of combined transport services in Europe in the 1990’s operators with new business models have emerged. Many operate services primarily for their own cargo and have also an extensive scope of intermodal services. Fig. 2-1 shows some examples of existing business models.
For the purpose of this investigation, however, we have assumed the standpoint of the classic operator who, too, normally requires for the co-operation of two or more intermodal operators and railways.

Page 8 of 74
Figure 2-1: Business models in combined rail/road transport in Europe
2.3 Description of combined transport production systems
In order to supply cost-competitive transportation services intermodal production systems are designed to achieve the maximum possible capacity load factor. Every production systems selected by an operator will refl ect the specifi c market situation particularly as concerns the assessment of the potential market share, the type of cargo and customers, and the regularity or volatility of transport fl ows. Against this background we distinguish two main categories of production systems for combined transport – but equally for conventional wagonload traffi c:
• A full-trainload production system can be employed on trade lanes that provide for suffi cient point-to-point volumes to operate a regular service. Shipments are consolidated at the point of origin and carried to the fi nal destination avoiding any intermediate handling of the train for loading, unloading or transhipment. In combined transport, full-trainload services are usually terminal-to-terminal journeys.
• If the volume of shipments between origin and destination areas falls short of the economic threshold of full trains less-than-trainload production systems have to be implemented. They imply that the volume of two or more O/D trade lanes will be bundled
Level of „openness“
Scope of integrationof CT chain
+
+0
ClassicUIRR-IO
ICA/TFGIItalcontainer
ERSAmbrogio/Hangartner
IFBPolzug
TX/PCCRail Link
CargoNet
Level of „openness“
Scope of integrationof CT chain
+
+0
ClassicUIRR-IO
ICA/TFGIItalcontainer
ERSAmbrogio/Hangartner
IFBPolzug
TX/PCCRail Link
CargoNet

Page 9 of 74
and/or distributed at intermediate handling points by applying various technologies described below. The key objective is to generate full trainloads on every single section of the rail service even if the shipments travel on various routes. Since every action to consolidate volumes produces additional handling cost and consumes time the intermodal operator is required to assess whether the outcome is still competitive and the service acceptable for customers.
The present survey includes the common intermodal production systems but also takes account of those operational schemes, which, for the time being, are scarcely employed but might possess a potential for being spread in future. Direct and shuttle trains are the only full-trainload production systems currently applied. Compared to that seven less-than-trainload production systems have been analyzed (cf Fig. 2-2). While full-trainload systems could be operated as stand alone services less-than-trainload production schemes necessarily are network systems to a certain extent.
Figure 2-2: Overview of combined transport production systems
Field of employment Production system
Direct train
Shuttle train
Y-shuttle train
Liner train
Group train
Turntable traffic
Gateway traffic
Megahub/Mainhub production
Mixed intermodal/conventional traffic
Full-trainload O/D lanes
Less-than-trainload O/D lanes

Page 10 of 74
2.3.1 Direct train
For a direct train operation a set of intermodal wagons to be loaded is formed at the departure terminal. This train set runs straightforward to the arrival terminal without any manipulation of wagons or shipments (cf Fig. 2-3). For the return journey the intermodal operator may employ the same wagon set but he might also adapt it to the specifi c needs of the route concerning the demand for transportation, the pattern of customers’ loading units or the shipment weights. Theoretically, the wagon set of a direct train could be customized for every single trip to respond to requirements. However, intermodal operators are reluctant to change the composition to avoid shunting cost and minimize the reserve stock of wagons at the terminals that, if they couldn’t be deployed on other services, would stand idle.
Figure 2-3: Direct train production system
According to operators’ experience a trade lane, which shall be served by direct trains at least every working day both ways, requires for an annual O/D market volume of about 150,000 to 200,000 tonnes. Consequently, direct trains are most suitable for connecting agglomerations, centres of industrial production and container ports with major inland locations. They are equally used for domestic and international traffi c, in container hinterland and continental transport. The direct train production is one of the most often employed systems in combined transport in Europe because it is a very effi cient scheme that avoids train manipulation as much as possible.
2.3.2 Shuttle train
The shuttle train is an improved version of the direct train production. Like a direct train it operates point-to-point without intermediate handling operations. Unlike a common direct train, however, the shuttle train is commuting between two intermodal terminals with a dedicated set of wagons. Operationally, the train must only be manipulated if damaged wagons need to be replaced (cf Fig. 2-4).

Page 11 of 74
An economic shuttle train system just like direct trains requires for an annual transport volume of about 150,000 to 200,000 tonnes. Since the wagon composition of a shuttle train is due to be maintained for a longer period – from one month up to one year - prior to the implementation of this scheme, the intermodal operator will have analyzed the market thoroughly whether the patterns of demand are rather stable and predictable.
Currently, shuttle trains are primarily deployed on domestic and international continental services to link long-standing areas of industrial production. However, they are rather seldom used in container hinterland transport since the fl ows are less stable and balanced.
Figure 2-4: Shuttle train production system
2.3.3 Y-shuttle train
A Y-shuttle train is composed of two and sometimes even three train sets with dedicated wagons, which though departing from separate intermodal terminals are bound for the same destination. The train sets are assembled at either a train station providing for appropriate shunting tracks or a marshalling yard. One version of the Y-shuttle shows the typical funnel-shape: The two train sets start from terminals with a different catchment area and are merged at an appropriate node in the rail network. On the return trip the same wagons are employed but the production process is organized the other way round: at the interim node the full train is split up into two sets, which then are moved to the intermodal terminals in question (cf Fig. 2-5).
More typically is the second “in-line production” version of the Y-shuttle train: one train set departs from the fi rst terminal and the other half-train is attached to it in the neighbourhood of the second terminal located on the route to the arrival terminal. This scheme in fact is not so different from a liner train production (cf Chapter 2.3.4).
Figure 2-5: Y-shuttle train production system
Y

Page 12 of 74
In order to avoid sub-optimum employment of train capacity, which might lead to non-competitive operational cost per shipment, it is paramount that the distance between the two terminals is short compared to the total transport route. If this prerequisite is matched the Y-shuttle production can universally be used if the intermodal operator:
• seeks to link an economic centre with two or three medium-size economic areas;• is scheduled to inaugurate new direct train services but prefers to reduce the economic
risk in the initial phase by bundling two or more freight markets; • is testing which of the local markets respond more positively to the new service.
The Y-shuttle production system is often employed particularly on domestic services of both categories of combined transport services and also on international continental services. According to the results of our market survey, however, it is rather rarely performed in the original meaning of the word “shuttle”. In many cases the wagon sets are not completely dedicated, and the train parameters allocated to the terminals involved in the system are subject to changes as well.
2.3.4 Liner train
This type of production system bundles the volumes of intermodal shipments originating in two or more terminals that are located in a line, and carries them to a destination terminal, and vice versa (cf Fig. 2-6).
In the “classical” meaning of liner train operations a full train set of wagons independent of their loading status is starting at the fi rst terminal of departure, enters the second terminal where loading units are both loaded and – if requested – unloaded, and continues to its fi nal destination provided that the train doesn’t call at a third liner terminal. For a very long time such a type of liner train was only a theoretic concept, however, it hasn’t been implemented for economic and technological reasons. Since recently a blueprint exists: liner trains starting at the Maasvlakte container terminal in Rotterdam call at the RSC terminal and carry on to several international locations.
Another apparently more common variant sees the liner train not pulling into the intermediate terminal for transhipping loading units. Instead the shipments have already been loaded on a group of wagons, which is then attached to the starting set. This type of liner train production resembles the “false” Y-shuttle. Only if also a wagon set with shipments from the departure terminal were bound for the intermediate terminal we would consider it a “real” liner train production.

Page 13 of 74
Figure 2-6: Liner train production system
Basically, the liner train production system appears to be suitable for serving locations with a large total market potential for combined transport, which, however, is split into several less-than-trainload trade lanes, such as regions with a poly-centric pattern of economic activity. In order to achieve a high capacity load factor over the total distance of the service the amount of shipments that get off the train and those that embark it at interim terminals must be highly balanced. Most of the time, the reality of transport economics is different. Owing to this lack of economic performance and technological barriers – only very few intermodal terminals provide for a direct and fast access to the main line –.the liner train production system, for the time being, hasn’t spread largely.
2.3.5 Group train
In the most elementary case the group train system comprises two trains departing from different intermodal terminals. Each of them consists of two groups of wagons bound for two terminals of destination. The trains meet at a node in the rail network that is playing the role of a turnpike for this system. Here the wagon groups are interchanged between the trains by preferably employing the long-distance locomotives in order to set up single-destination trains for the terminals involved. Therefore it is of utmost importance that, at the departure terminals, the wagons sets are always put in such a sequence to enable a fast swap at the turnpike. The system works the same way in both directions (cf Fig. 2-7).
Figure 2-7: Group train production system
><

Page 14 of 74
The group train system was likely to be the most employed production scheme in combined transport in Europe until the mid-90s. It was the backbone both of domestic networks and international services. This production system was also related to the business model and the commercial relationships between railway undertakings and intermodal operators at that time. The railways controlled and run the system more or less at their own risk whereas operators either booked a certain train capacity in advance or purchased on a per wagon basis.
Over the years group trains lost their importance with the enforcement of block train services and the growth of combined traffi c volumes allowing for operating more effi cient direct trains. Notwithstanding, some intermodal services currently are based on group train operations involving even three or more trains, which are interlinked at turnpikes. Group trains enable intermodal operators to serve connections between medium- and even small-size economic areas.
2.3.6 Turntable traffi c
Even more than the group train production the turntable system allows for bundling the volumes of numerous trade lanes and connecting a couple of areas and intermodal terminals. The amount of trains involved in such a network of intermodal services is depending on the freight market affected and the geographical situation. What is a distinctive feature of turntable operations, unlike the other production systems described above, is that it is based not on end-to-end or terminal-to-terminal trains but on two separate train services, which are linked via a turntable that is a shunting yard.
At the departure terminals intermodal trains are loaded largely unsorted with shipments bound for many places. At the shunting yard trains can be handled in two different ways. Inbound trains can be split up completely and the wagons are re-sorted by gravity-shunting to assemble new outbound trains – just like in single-wagon traffi c. Alternatively, single wagons or groups of wagons are moved and interchanged between the trains – like in the group train production. In fact both procedures might also be employed simultaneously. The outbound trains to the fi nal destinations must not necessarily be direct services though, in practice, they often are (cf Fig. 2-8).

Page 15 of 74
Figure 2-8: Turntable production system
The turntable system has been systematically used particularly by the intermodal operator Intercontainer (ICF). While ICF earlier operated on the basis of three major turntables the company’s international network now relies primarily on a hub in Sopron and other production systems. Also a typical representative of the turntable system has been Transfracht’s Albatros domestic network in Germany with the turntable Maschen. These examples show that the turntable system is applied both on rather medium distances of some 400 to 600 km as well as on very long distances of some 1,000 kilometres.
2.3.7 Gateway traffi c
At fi rst sight, the approach and the workfl ow organization of a gateway production may look like the turntable traffi c:
• The gateway system is composed of two separate train services.• The trains are interlinked at a node.• The trains starting at the departure terminals may be carrying shipments bound for
various destinations. • Outbound trains leaving the node are very often direct or even shuttle services.
The key distinction between the gateway system and the turntable traffi c, and what makes the system unique and only applicable in combined transport is that the turntable of the gateway system is an intermodal terminal. Since inbound and outbound services at the gateway terminal are used to rely on separated rail traction services and train sets, inbound trains must be completely discharged. What is also a distinctive feature is that inbound trains to the gateway terminal move both shipments for the local market, which are due to be picked up by road vehicles for delivery, and shipments, which must be carried on. The latter units are transhipped to the trains bound for the fi nal destination terminals. In many cases a direct move will not be possible owing to distinguished arrival and departure times of services involved. The units must then be stored intermediately at the terminal yard

Page 16 of 74
(cf Fig. 2-9). The gateway concept successfully is operating both ways. Whereas, however, the trains in one direction are composed of shipments for several destinations they carry almost only dedicated shipments in the opposite direction.
The gateway system has been introduced by the intermodal operator Hupac. Currently, many other companies such as Cemat and Kombiverkehr have adopted this scheme and extended its scope of application. Initially the gateway production was intended to connect domestic and international intermodal services on the continental freight market. It particularly enabled operators to supply competitive international services to medium-sized economic areas. Meanwhile the system has also been spread to be employed in domestic networks and for integrating maritime container transports.
Figure 2-9: Gateway production system
Figure 2-10: Megahub/Mainhub production system

Page 17 of 74
2.3.8 Megahub/Mainhub production
The mainhub or megahub production system can be considered as an even more sophisticated gateway concept. What is comparable is that, from one end of the transport chain, intermodal trains leave with shipments, which since they are bound for various destination terminals will be re-sorted at an intermediate hub terminal. The hub production, however, has a couple of distinctive components (cf Fig. 2-10):
• In the fi rst place, it is based on through-train sets from origin to destination terminals, not on two separate traction schemes in and out the hub.
• While incoming trains always feature shipments with a variety of fi nal destinations, outbound trains are used to collect units for a single terminal (direct service) or at maximum two sites (liner service).
• All trains that are dedicated to specifi c O/D intermodal services must arrive at the hub terminal as a “bundle” within a tight period of time (“time-window”) to enable transhipping intermodal loading units fast, cost-effective and directly between trains and avoiding interim storage. Usually, every train will operate on a defi ned route with a defi ned destination. All those shipments that are bound for this destination but arrive on another train must be transhipped and assembled with loading units of other origins but the same destination.
• A hub terminal must not absolutely be dedicated to this sorting function. It could also perform road/rail handlings for local shipments. However, it is paramount that the time-critical transhipments are prioritized.
Compared to the gateway concept the mainhub or megahub production system enables to achieve faster transit times, which would allow for serving less-than-trainload lanes over medium distances at a road-competitive schedule. There are large potentials especially on domestic freight markets that could be opened up for combined transportation.
In fact, the Belgian operator Interferry Boats (IfB) is employing such a system at its mainhub terminal in Antwerpen designed to serve especially national routes of container hinterland traffi c. The trains that depart from various quays are more or less unsorted concerning the destination of the containers. The mainhub terminal cares for transhipping containers between a bundle of six to seven trains, which are in the handling area at the same time, and producing dedicated trains as far as possible.
Page 18 of 74
In Germany, the intermodal stakeholders under the lead of DB Netz are seeking to build a megahub terminal in the vicinity of Hannover, which is a prerequisite for implementing a production system that should primarily be geared towards the needs of domestic freight both for the continental and maritime business.
The largest challenge for this type of production system is to ensure a high reliability of all trains belonging to a “bundle” handled simultaneously at the hub terminal. Owing to the small time frame for transhipments, a delay of only one train would have a negative impact on all other trains of the bundle.
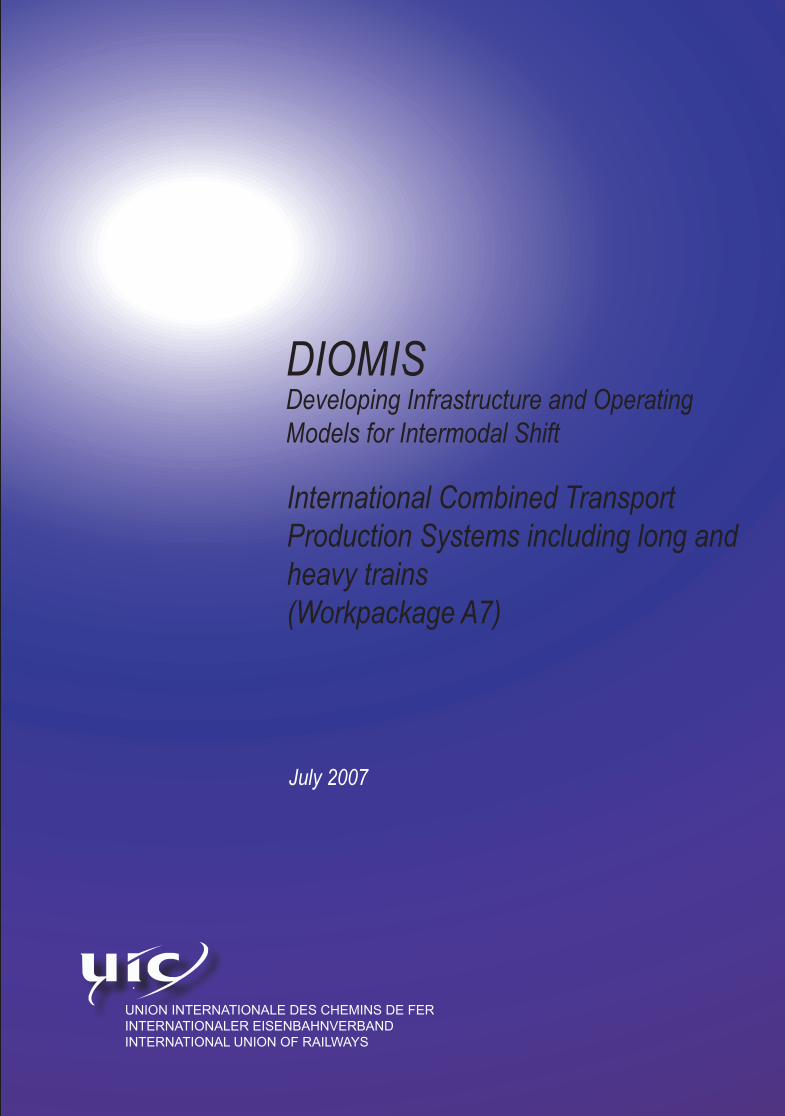
2.3.9 Mixed intermodal/conventional traffi c
The combination of intermodal shipments and conventional rail wagons calls for establishing one consolidation and one distribution centre in the rail network since generally both rail freight services will depart from and arrive at different locations. Conventional wagons are usually loaded and discharged at rail sidings, combined transport travels between terminals. Between the two nodes the cargo is carried together (cf Fig. 2-11). Economically, it is paramount that the distances between the loading/unloading stations and the nodes are short compared to the total rail journey.
Figure 2-11: Mixed intermodal/conventional production system
Two fi elds of deployment for the mixed production system have been identifi ed:
• On inter-industrial trade lanes between two production facilities or on routes from one manufacturer to a big customer, various commodities come up such as packed and bulk goods, which are more suitable either for road and intermodal services or for conventional wagons. Instead of running separate rail freight services the idea is to combine them on the trunk haul. Such production schemes are used particularly in the chemical industry as well as in the automotive industry.

Page 19 of 74
• Another approach advances from the assumption that, in each direction, the “strength” of one type of rail freight is compensating for the “defi cit” of the other. Conventional wagonload traffi c is unbalanced in most cases, loaded one way and empty return. In contrast to that the capacity of intermodal trains is employed rather evenly on roundtrips at least as concerns the amount of units. If, however, the capacity of an intermodal service were underemployed in terms of weight on the direction where conventional wagons are full the combination of both services would bring about a benefi t for each of them. Examples for such “lucky conditions” couldn’t be identifi ed in the course of this investigation.
2.4 Assessment criteria of combined transport production systems
The task of this part of the study, to begin with, was to analyze the combined transport production systems described above if, on what conditions and to what extent they enable intermodal stakeholders bundling volumes of shipments and operating effi cient services. Secondly, the impact of these operational schemes on the employment of rail infrastructure capacities has been examined and their infrastructure-related effi ciency derived. In total, 18 criteria classifi ed into the following three categories have been applied to evaluate the intermodal production systems:
• Market features: The criteria indicate the specifi c conditions and prerequisites of the freight transport market for deploying the production system in question.
• Combined transport operator perspective: The criteria assess, from the intermodal operator’s point of view, the effectiveness of the production systems as regards various quality and cost indicators as well as the level of market acceptance.
• Rail infrastructure perspective: Here the production systems are evaluated with respect to their effi ciency of using the train path capacities of the rail network. Against the background of an increasingly congested infrastructure production systems should minimize the “rate of consumption” of scarce train paths and maximize the “rate of employment” in terms of tonnes carried.

Page 20 of 74
Every criteria is explained in more detailed in the following section.
Market features
1 O/D volumeIt indicates the amount of shipments or tonnage (market potential), which is required on the trade lane between origin and destination terminal to be capable of reaching a satisfactory capacity load factor.
2 Market stabilityIt indicates the expected level of regularity both of the volume of shipments and the pattern of intermodal loading units.
3 Catchment areaIt indicates the scope of road distances for pick-up and delivery of shipments from/to intermodal terminals to capture suffi cient volumes.
Combined transport operator perspective4 Bundling capacity It indicates the capability of the production system
(1) to attract and collect regularly a satisfactory amount of shipments;(2) to ensure well-balanced round trip schemes.
5 Cost per shipment It indicates the expected average operational cost per intermodal shipment incurred by all handlings related to the production system.
6 Economic risk It indicates the extent of capacity employment risks, which the CT operator is due to undertake by operating the production system assuming block train commitment for each of the systems.
7 Transit time It indicates the potential of the production system concerning the quality of the timetable (cut-off time/time of availability), which can be accomplished for the underlying intermodal service.
8 Punctuality of service
It indicates the inherent vulnerability of the production system to delays. Generally speaking, the lower the complexity of operations the lower the vulnerability and the higher the probability of punctuality.
9 Reliability of service
It indicates the inherent vulnerability of the production system to irregularities and thus the volatility of the rate of punctuality. The volatility is high if the system is not only prone to unpunctuality but if the rate of unpunctuality varies strongly (lack of consistency).
10 Terminal-related train manipulation
It indicates the efforts required to compose the train inside the departure terminal and prepare it for departure.

Page 21 of 74
11 Intermediate train manipulation
It indicates the efforts, at interim rail nodes, required for handling the train and/or wagons: coupling, decoupling, shunting, interchange.
12 Intermediate transhipments
It indicates the efforts, at interim intermodal terminals, required for loading/unloading or transhipping intermodal loading units.
13 Wagon management
It indicates the efforts for providing intermodal wagons beyond “standard process” as concerns the easiness or complexity of planning and the necessity for keeping a stock of reserve wagons.
14 Data management
It indicates the scope and complexity of producing, collecting and forwarding data and documents, and the level of vulnerability to data loss.
15 Shipment monitoring
It indicates the capability of the production system to facilitate the tracking & tracing of shipments and supply a high quality of information.
Rail infrastructure perspective16 Interim system
stopsThey are indicators of the need of train paths per intermodal service. The less handling a production system requires at interim nodes the less train paths it “consumes”.
17 Reliability of service
It indicates the need of train paths per intermodal service. The less vulnerable a production system is to irregularities the less train paths it “consumes”.
18 Net tonnes/ roundtrip
It indicates how effi cient a production system on average employs train paths in a roundtrip schedule.

Page 22 of 74
2.5 Assessment of effi ciency of combined transport production systems
By means of the assessment criteria explained above the nine intermodal production systems identifi ed have been evaluated. We have carried out a qualitative appraisal of each of the criteria. Both the hands-on experience and know-how of combined transport operators and theoretical considerations entered into the evaluation.
In contrast to the category “market features” the criteria of the categories “combined transport operator perspective” and “rail infrastructure perspective” additionally were rated on a scale from 1 to 10, where 10 means the highest score – “best” for the operator and/or the infrastructure – and 1 the lowest. For each of the two categories a performance indicator has been calculated representing the un-weighted average value of all individual criteria ratings per category:
• The consolidated combined transport operator performance indicator illustrates, in the operator’s view, which production systems are most suitable for being deployed to supply competitive intermodal services.
• Against the background of an increasingly congested infrastructure the consolidated rail infrastructure performance indicator highlights, which production systems employ train path capacities of the rail network most effi ciently by minimizing the “rate of consumption” of scarce train paths and maximizing the “rate of employment” in terms of tonnes carried.
The result of the evaluation exercise is an evaluation sheet for every production system represented below.

Page 23 of 74
CT Production System: Direct train
Performance indicator Assessment Rating
Market features
1 O/D volume Very high: 150,000 - 200,000 tonnes p.a. n.a.2 Market stability High n.a.3 Catchment area Large n.a.
CT operator perspective
4 Bundling capacity High: attractive service quality + price; probable unbalance on roundtrip due to fl uctuations of demand
8
5 Cost per shipment High capacity load factor, effi cient turnaround schedules for wagons, few operations except n° 10+13;
9
6 Economic risk + Attractive service on high-volume lane;- Dependency on single O/D
6
7 Transit time Best: no interim handling on rail journey 108 Punctuality of
serviceVery high: no train or shipment handlings; delays may occur if wagon set is changed
9
9 Reliability of service Very high:; cf n° 8 910 Terminal-related
train manipulationOnly if wagon set is to be adapted to topical demand of pattern of loading units
8
11 Intermediate train manipulation
None 10
12 Intermediate transhipments
None 10
13 Wagon management Small stock for wagon changes (n° 10) 914 Data management Special attention only if wagons change 915 Shipment monitoring All shipments on same train 10
Consolidated CT operator performance indicator (∅ score) 8.92
Rail infrastructure perspective
16 Interim system stops None 1017 Reliability of service Very high 918 Net tonnes/roundtrip High bundling capability (market features,
customer-oriented service parameters)8
Consolidated rail infrastructure performance indicator (∅ score) 9.0

Page 24 of 74
CT Production System: Shuttle train
Performance indicator Assessment Rating
Market features
1 O/D volume Very high: 150,000 - 200,000 tonnes p.a. n.a.2 Market stability Very high n.a.3 Catchment area Very large n.a.
CT operator perspective
4 Bundling capacity High: market-oriented service parameters; probable unbalance on roundtrip due to fl uctuations of demand & rigid wagon set
8
5 Cost per shipment High capacity load factor, effi cient turnaround schedules for wagons, no manipulations
9
6 Economic risk + Attractive service on high-volume lane;- Dependency on single O/D, rigid wagon set
5
7 Transit time Best: no interim handling on rail journey 108 Punctuality of
serviceVery high: no train or shipment handlings 10
9 Reliability of service Very high: no train or shipment handlings 1010 Terminal-related
train manipulationNone 10
11 Intermediate train manipulation
None 10
12 Intermediate transhipments
None 10
13 Wagon management Very easy: seldom wagon exchange, suffi cient lead time
10
14 Data management Very easy 1015 Shipment monitoring All shipments on same train 10
Consolidated CT operator performance indicator (∅ score) 9.33
Rail infrastructure perspective
16 Interim system stops None 1017 Reliability of service Very high 1018 Net tonnes/roundtrip High bundling capability (customer-oriented
service parameters, imbalances)8
Consolidated rail infrastructure performance indicator (∅ score) 9.33

Page 25 of 74
CT Production System: Y-shuttle
Performance indicator Assessment Rating
Market features
1 O/D volume High: 75,000 - 100,000 tonnes p.a. n.a.2 Market stability High n.a.3 Catchment area Medium to large n.a.
CT operator perspective
4 Bundling capacity + good service parameters; one location can compensate for imbalance of other; - risk of underemployment of one branch
9
5 Cost per shipment + high capacity load factor;- half-full train(s) until consolidation point- cost for intermediate train handling
7
6 Economic risk + Attractive service; two points of origin- rigid wagon set; capacity load factor of train segments
6
7 Transit time Good, but time loss for train consolidation 88 Punctuality of
serviceDependency of train segments: if one delayed all shipments delayed, cf also n° 14
8
9 Reliability of service Cf n° 8; greater risk of irregular delays 710 Terminal-related
train manipulationNone 10
11 Intermediate train manipulation
Coupling/de-coupling of train segments; checking if no overweight
8
12 Intermediate transhipments
None 10
13 Wagon management Very easy: seldom wagon exchange, suffi cient lead time
10
14 Data management Consolidation of data of train segments required; loss of documents cause delay
7
15 Shipment monitoring Easy except if Y-shape production (two trains meet at bottom of funnel)
8
Consolidated CT operator performance indicator (∅ score) 8.17
Rail infrastructure perspective
16 Interim system stops Loss of 1-2 train paths 617 Reliability of service Cf n° 9 718 Net tonnes/roundtrip High: due to market features and effi cient
bundling capability9
Consolidated rail infrastructure performance indicator (∅ score) 7.33

Page 26 of 74
CT Production System: Liner train
Performance indicator Assessment Rating
Market features
1 O/D volume High: 75,000 - 100,000 tonnes p.a. n.a.2 Market stability High n.a.3 Catchment area Medium to large n.a.
CT operator perspective
4 Bundling capacity Fair: two points of loading but half-full train until liner terminal and limited service quality
6
5 Cost per shipment + high capacity load factor;- half-full train until liner terminal
6
6 Economic risk + Attractive service; two points of origin- capacity load factor of forerun train, real demand for short distances
4
7 Transit time Good for interim terminal, but timetable for 1st terminal dependent on performance of interim loading
6
8 Punctuality of service
If train arrives delayed at 2nd terminal eventually no terminal slot available
7
9 Reliability of service
Cf n° 8; greater risk of irregular delays 6
10 Terminal-related train manipulation
Only if wagon set is to be adapted to topical demand of pattern of loading units
9
11 Intermediate train manipulation
None 10
12 Intermediate transhipments
Loading/unloading at liner terminal 7
13 Wagon management
Small stock for wagon changes (cf n° 10) 9
14 Data management Special attention only if wagons change 915 Shipment
monitoringAll shipments on same train 10
Consolidated CT operator performance indicator (∅ score) 7.42
Rail infrastructure perspective
16 Interim system stops
Loss of 1 train path 7
17 Reliability of service
Cf n° 9 6
18 Net tonnes/roundtrip
Medium due to restricted bundling capability
6
Consolidated rail infrastructure performance indicator (∅ score) 6.33

Page 27 of 74
CT Production System: Group train
Performance indicator Assessment Rating
Market features
1 O/D volume High: 75,000 - 100,000 tonnes p.a. n.a.2 Market stability High n.a.3 Catchment area Medium (2 destinations per origin) n.a.
CT operator perspective
4 Bundling capacity + good service parameters; two destinations per origin; fairly fl exible wagon capacity allocation- risk of underemployment of one branch
9
5 Cost per shipment + high capacity load factor;- cost for terminal and intermediate train manipulations
7
6 Economic risk Comparatively low due to n° 4+5 87 Transit time Good but time loss for wagon interchange 78 Punctuality of
serviceVulnerable to delays owing to interdependent production
6
9 Reliability of service Cf n° 8; greater risk of irregular delays 510 Terminal-related train
manipulationSecuring proper sequence of wagon groups to facilitate interchange at node; demand-driven adaptation of wagon sets
6
11 Intermediate train manipulation
Interchange of wagon groups 6
12 Intermediate transhipments
None 10
13 Wagon management Flexibility of wagon sets requires for wagon stock and extra manipulation
7
14 Data management 3 times data recording and documents 515 Shipment monitoring Complex operations; dependency on
proper data records 6
Consolidated CT operator performance indicator (∅ score) 6.83
Rail infrastructure perspective
16 Interim system stops Loss of two train paths 517 Reliability of service Cf n° 9 518 Net tonnes/roundtrip Very effi cient bundling capability 9Consolidated rail infrastructure performance indicator (∅ score) 6.33

Page 28 of 74
CT Production System: Turntable traffi c
Performance indicator Assessment Rating
Market features
1 O/D volume Small (up from 7,500 tonnes) n.a.2 Market stability Small n.a.3 Catchment area Small n.a.
CT operator perspective
4 Bundling capacity + consolidation of various O/D; mutual compensation of peaks and lows; - weak service parameters, high cost, uneven load factors of trains to/from node
6
5 Cost per shipment Uneven load factors of trains to/from turntable, high cost for shunting, provision of wagons and locomotives
4
6 Economic risk High: commitment to bundle of trains, high operational cost
2
7 Transit time Rather large: time used for shunting at node; interdependency of trains
4
8 Punctuality of service
Vulnerable to delays owing to interdependent and turntable production
3
9 Reliability of service Cf n° 8; greater risk of irregular delays 310 Terminal-related
train manipulationOnly if change of wagon set 9
11 Intermediate train manipulation
Shunting at turntable 4
12 Intermediate transhipments
None 10
13 Wagon management Large efforts to control wagon run; wagon stock to compensate for “loss” in network
5
14 Data management Advance information to plan new trains, new train data generated, double checks
5
15 Shipment monitoring Complex operations; dependency on proper data records
5
Consolidated CT operator performance indicator (∅ score) 5.00
Rail infrastructure perspective
16 Interim system stops Loss of many train paths; compensation possible by other trains using turntable
5
17 Reliability of service Cf n° 9 318 Net tonnes/roundtrip Cf n° 4 7Consolidated rail infrastructure performance indicator (∅ score) 5.00

Page 29 of 74
CT Production System: Gateway
Performance indicator Assessment Rating
Market features
1 O/D volume Small (up from 7,500 tonnes) n.a.2 Market stability Small to medium n.a.3 Catchment area Small n.a.
CT operator perspective
4 Bundling capacity + bundling of local and transit shipments and several O/D, inherent fl exibility to respond to imbalances (separate production at both ends), fl exible wagon sets- dependency between in- and outbound trains at Gateway terminal
9
5 Cost per shipment + High capacity load factor;- cost for intermediate transhipment
8
6 Economic risk Very low: distribution of risk on many O/D 97 Transit time Only competitive on very long distances 58 Punctuality of
serviceHigh if direct/shuttle trains from/to Gateway terminal, normally enough time for transhipment; interface vulnerability: lack of information (n° 14) - occasional delays
8
9 Reliability of service Cf n° 8 810 Terminal-related
train manipulationChange of wagon sets 8
11 Intermediate train manipulation
None 10
12 Intermediate transhipments
Transhipment at gateway terminal 7
13 Wagon management If no shuttle trains: particular care to provide appropriate wagons
8
14 Data management Advance information paramount to ensure capacity on onward trains, double-checks
6
15 Shipment monitoring Critical point: gateway terminal 8Consolidated CT operator performance indicator (∅ score) 7.83
Rail infrastructure perspective
16 Interim system stops No loss of train paths 1017 Reliability of service High 818 Net tonnes/roundtrip Very effi cient bundling capability 9Consolidated rail infrastructure performance indicator (∅ score) 9.00

Page 30 of 74
CT Production System: Megahub/Mainhub service
Performance indicator Assessment Rating
Market features
1 O/D volume Small (up from 7,500 tonnes) n.a.2 Market stability Medium to high n.a.3 Catchment area Small n.a.
CT operator perspective
4 Bundling capacity + bundling of several O/D fl ows, also local volume at hub terminal, market-driven service parameters on medium-distance- lack of inherent fl exibility to respond to imbalances, vulnerability to delay at hub
7
5 Cost per shipment + Effi cient wagon turnaround schedules, fair capacity load factor (but risks)- costs for intermediate transhipment & increased planning and monitoring
7
6 Economic risk High: commitment to bundle of trains, risk of uneven capacity load factor
3
7 Transit time Very good even on medium-distances if fast handling and train paths ensured
8
8 Punctuality of service
Risk of delays since bundle of trains must be punctual (inherent vulnerability)
6
9 Reliability of service Cf n° 8 610 Terminal-related
train manipulationChange of wagon sets 8
11 Intermediate train manipulation
None 10
12 Intermediate transhipments
Transhipment at hub terminal 6
13 Wagon management Small stock for change of wagon set 914 Data management Advance information to ensure fast
transhipment at hub & punctual departure of onward trains; new train data generated
5
15 Shipment monitoring Complex operations; proper data records 5Consolidated CT operator performance indicator (∅ score) 6.75
Rail infrastructure perspective
16 Interim system stops Probable loss of bundle of train paths 417 Reliability of service Cf n° 9 618 Net tonnes/roundtrip Cf n° 4 7Consolidated rail infrastructure performance indicator (∅ score) 5.67
Page 31 of 74
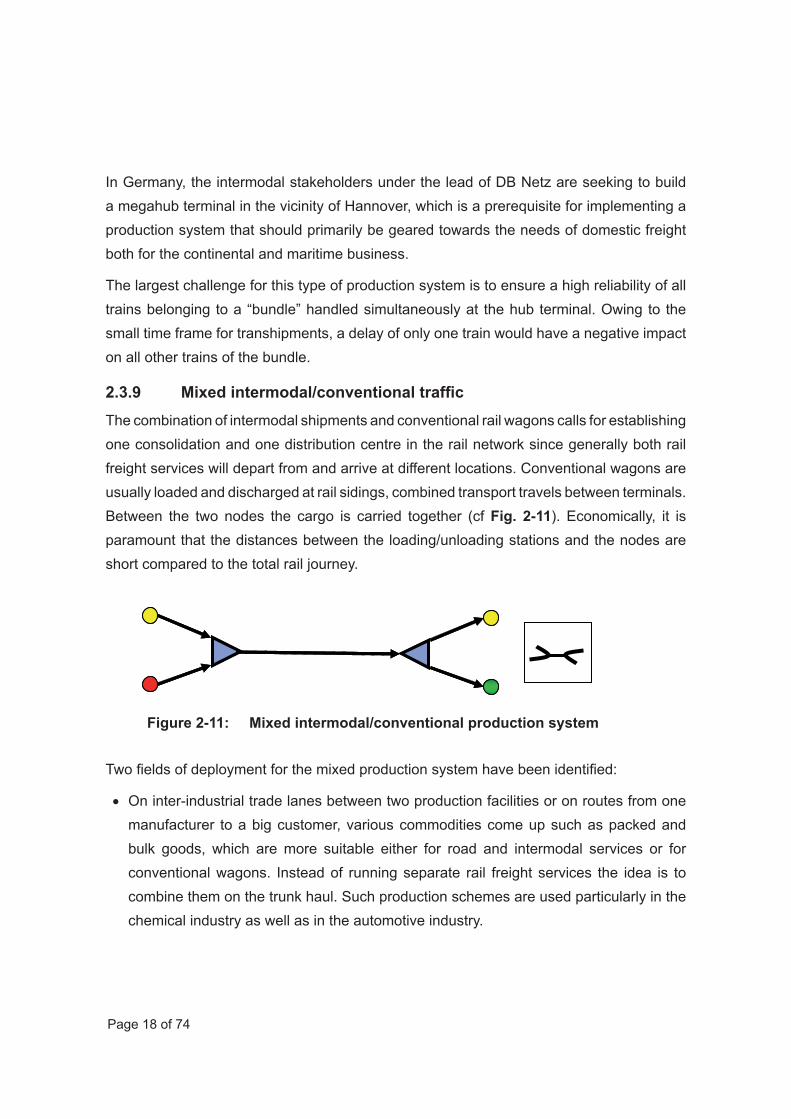
CT Production System: Mixed intermodal/conventional traffi c
Performance indicator Assessment Rating
Market features
1 O/D volume High/very high: > 100,000 tonnes p.a. n.a.2 Market stability Very high n.a.3 Catchment area Medium n.a.
CT operator perspective
4 Bundling capacity Uneven capacity load factor: one way full, return “half-full” (wagonload); risk of reinforcement of underemployment since both origins & destinations in same area
5
5 Cost per shipment + very low in full direction- high in half-full direction- twice intermediate train manipulation
5
6 Economic risk Distribution of risk, higher mean revenues from conventional traffi c, but n° 5
6
7 Transit time Below CT “standard” due to n° 11 58 Punctuality of
serviceVulnerable to delays owing to interdependent production
6
9 Reliability of service Cf n° 8; greater risk of irregular delays 510 Terminal-related
train manipulationChange of wagon set 8
11 Intermediate train manipulation
Coupling/decoupling of conventional and CT train sets, risk of overweight if lack of coordination between Ct & conventional
4
12 Intermediate transhipments
None 10
13 Wagon management Mostly dedicated wagons, small stock 914 Data management Several times data recording & generating
documents; consolidation of different “freight cultures”
3
15 Shipment monitoring Complex operations; cf also n° 14 5Consolidated CT operator performance indicator (∅ score) 5.92
Rail infrastructure perspective
16 Interim system stops Loss of train paths only critical if feeder trains travel on main network
7
17 Reliability of service Cf n° 9 518 Net tonnes/roundtrip Uneven capacity load factors 5Consolidated rail infrastructure performance indicator (∅ score) 5.67

Page 32 of 74
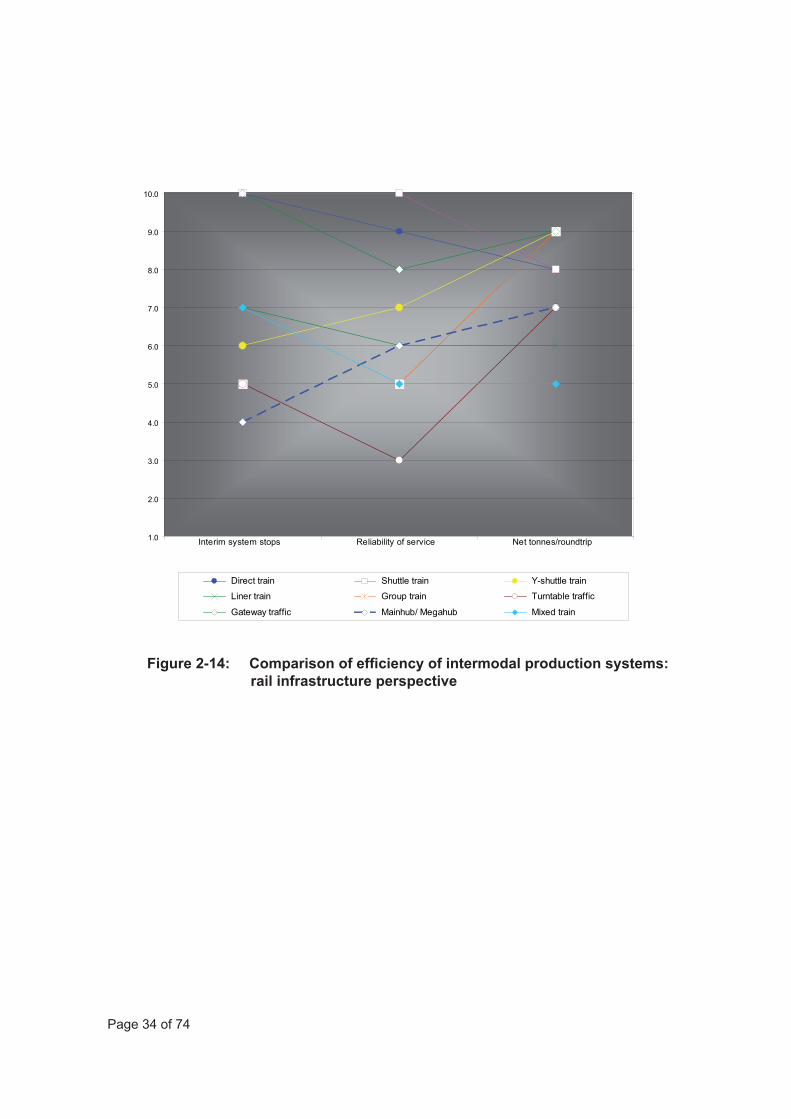
The market features as well as the ratings of the infrastructure- and operator-related effi ciency of intermodal production systems have been consolidated in an overview presentation and two graphical representations (cf Fig. 2-12 - 2-14).
It doesn’t come as a surprise that the full-trainload (FTL) schemes, the direct and shuttle trains, scored best in both respects. Amongst the less-than-trainload (LTL) production systems the Gateway services and the Y-shuttle trains gained a signifi cant edge against all other operational schemes. As concerns impact on rail infrastructure the Gateway system even performs as well as the FTL systems. In contrast to that all other LTL systems are evaluated to be less effi cient.
Figure 2-12: Assessment of effi ciency of intermodal production systems
Direct train
Shuttle train
Y-shuttle train
Liner train
Group train
Turntable traffic
Gateway traffic
Mainhub/ Megahub
Mixed train
1 O/D volume Very high Very high High High High Small Small Small High2 Market stability High Very high High High High Small Small-medium Medium-high Very high3 Catchment area Large Very large Large Large Medium Small Small Small Medium
4 Bundling capacity 8.0 8.0 9.0 6.0 9.0 6.0 9.0 7.0 5.05 Cost per shipment 9.0 9.0 7.0 6.0 7.0 4.0 8.0 7.0 5.06 Economic risk 6.0 5.0 6.0 4.0 8.0 2.0 9.0 3.0 6.07 Transit time 10.0 10.0 8.0 6.0 7.0 4.0 5.0 8.0 5.08 Punctuality of service 9.0 10.0 8.0 7.0 6.0 3.0 8.0 7.0 6.09 Reliability of service 9.0 10.0 7.0 6.0 5.0 3.0 8.0 6.0 5.0
10 Terminal-related train manipulation 8.0 10.0 10.0 9.0 6.0 9.0 8.0 8.0 8.011 Intermediate train manipulation 10.0 10.0 8.0 10.0 6.0 4.0 10.0 10.0 4.012 Intermediate transhipments 10.0 10.0 10.0 7.0 10.0 10.0 7.0 6.0 10.013 Wagon management 9.0 10.0 10.0 9.0 7.0 5.0 8.0 9.0 9.014 Data management 9.0 10.0 7.0 9.0 5.0 5.0 6.0 5.0 3.015 Shipment monitoring 10.0 10.0 8.0 10.0 6.0 5.0 8.0 5.0 5.0
8.92 9.33 8.17 7.42 6.83 5.00 7.83 6.75 5.92
16 Interim system stops 10.0 10.0 6.0 7.0 5.0 5.0 10.0 4.0 7.017 Reliability of service 9.0 10.0 7.0 6.0 5.0 3.0 8.0 6.0 5.018 Net tonnes/roundtrip 8.0 8.0 9.0 6.0 9.0 7.0 9.0 7.0 5.0
9.00 9.33 7.33 6.33 6.33 5.00 9.00 5.67 5.67
Ra ting: 1 …. . 10 lowest …. highest score
Consolidated CT operator performance indicator
LTL routesCriteria
Rail infrastructure perspective
Consolidated rail infrastructure performance indicator
FTL routes
Market features
CT operator perspective

Page 33 of 74
Figure 2-13: Comparison of effi ciency of intermodal production systems: CT operator perspective
1.0
2.0
3.0
4.0
5.0
6.0
7.0
8.0
9.0
10.0
Bundli
ng ca
pacit
y
Cost p
er sh
ipmen
t
Econo
mic ris
k
Transit
time
Punctu
ality
of se
rvice
Reliab
ility o
f serv
ice
Termina
l train
man
ipulat
ion
Interm
ediat
e trai
n man
ipulat
ion
Interm
ediat
e tran
shipm
ents
Wag
on m
anag
emen
t
Data m
anag
emen
t
Shipmen
t mon
itorin
g
Direct train Shuttle train Y-shuttle train
Liner train Group train Turntable traffic
Gateway traffic Mainhub/ Megahub Mixed train
Page 34 of 74
Figure 2-14: Comparison of effi ciency of intermodal production systems: rail infrastructure perspective
1.0
2.0
3.0
4.0
5.0
6.0
7.0
8.0
9.0
10.0
Interim system stops Reliability of service Net tonnes/roundtrip
Direct train Shuttle train Y-shuttle train
Liner train Group train Turntable traffic
Gateway traffic Mainhub/ Megahub Mixed train

Page 35 of 74
2.6 Conclusions and considerations
What conclusions can be drawn from the above results of the assessment process as concerns the three chief objectives of this investigation?
(1) Identifi cation of intermodal production systems which enable intermodal stakeholders to bundle volumes and/or transport more volumes on the same train
Both intermodal operators and railway undertakings providing rail traction services for combined transportation are usually anxious to achieve an optimum capacity load factor on roundtrips and not on one-way journeys since the latter normally lead to repositioning cost of equipment and empty runs. Bearing this in mind, the results of the assessment process shows that the less-than-trainload (LTL) systems, Y-shuttle train, group train and gateway traffi c, have the best bundling capabilities and in this respect even exceed the direct and shuttle train production systems. Except for the group train these production systems are also very attractive to intermodal operators and their customers in terms of cost and service level. They are market-effective and do not only perform well theoretically.
It may appear as if the bundling potential of the mainhub/megahub system has been underestimated. The comparatively poor rating (7), on the one hand, is owing to a lack of experience with such a system. Secondly, the effectiveness of such a system is largely dependent on a very high performance of rail traction as concerns the synchronization of train services. Even if we assume a tremendous improvement of the quality of service in the following years this system is unlikely to be capable of fully exploiting its bundling capacity potential.
(2) Assessment of the impact of intermodal production systems on coping with limited rail infrastructure capacities
Next to the full-trainload direct and shuttle train schemes the LTL gateway production system reaches the highest score of the rail infrastructure performance indicator. The three intermodal production systems use scarce infrastructure resources better than others since they reach high values for each of the criteria applied:
• No interim stop in the network • Low or very low inherent vulnerability to irregularities due to a straightforward organization
of the production process

Page 36 of 74
• Market-oriented service features pay back in terms of high capacity load factors per roundtrip
Y-shuttle and group trains also have the potential for high payload factors. They, however, score much lower concerning the “rate of consumption” of train paths per intermodal service. This also applies to all other LTL schemes owing to necessary system stops for collecting and/or distributing shipments and their actual or presumable vulnerability to delays and other irregularities.
(3) Assessment of the impact of intermodal production systems on rail’s ability to capture forecast traffi c growth
Against this background it becomes obvious what requirements production systems in combined transport and their process organization have to match to employ saturated infrastructure capacities effi ciently:
• The more simple an intermodal production is organized the more reliable it could be operated (if they are really operated reliably, however, depends on the performance of stakeholders). Since systems such as direct, shuttle and gateway traffi c don’t have interim stops in the network they hardly “waste” train paths.
• If the production system requires for interim points of consolidation and distribution they should not be located in the core network unless a network of services has been established that makes sure that, for – almost - every train that stops in that consolidation centre another train leaves taking over the train path, which otherwise would be wasted.
• The more customer-oriented the service and cost characteristics of a production system are the more it is due to achieve high capacity load factors on a roundtrip basis.
• The production system should not inherently be prone to irregularities, e.g. owing to a complex organization, unless the service providers are committed to very high quality levels (“zero-fault organization”), which are common in advanced logistics service industries such as parcel, express and groupage transports.

Page 37 of 74
How, in this respect, should a production system for a European network of combined transport services look alike to ensure the expected and potential growth?
In Europe, a majority of international services in combined transport currently is already operated by direct and shuttle trains. In an ideal rail world as concerns the infrastructure-related effi ciency, the production would rely on nothing but these FTL schemes. They, however, require for very high O/D trade lane volumes. Even if we assumed in our investigations into combined transport in six European countries (DIOMIS A1 report) that more and more routes both in domestic and international traffi c will be suitable for deploying direct and shuttle trains, there will remain a large percentage of intermodal market potential that couldn’t be captured with common forms of FTL systems. This is particularly owing to a secular trend of “decentralization” of production and warehousing on a European scale. The overwhelming supremacy of “old” economic centres is going to be reduced – not eliminated – and “new” industrial and logistics cores are emerging. This is partly resulting from the impact of globalization of trade but – in our view – more related to the economic and political integration of European countries and the liberalization of trade and freight traffi c.
The decentralization or the poly-centre evolution is affecting combined transport both for continental cargo and maritime container fl ows. Intermodal operators could address this challenge by massively extending the gateway production, which currently is employed by just some combi-companies on a few corridors, and additionally develop sophisticated hub production systems. The result would be an “industrialization” of the production of intermodal services where the individual services and infrastructure facilities are closely interrelated in the style of European and global parcel logistics services.
The concept or vision, which, at the end of the day, should effectuate that more intermodal volumes will have been shipped at viable rates by employing less infrastructure capacities, includes the following components:
(1) The network of gateway terminals across Europe would be extended considerably including an adaptation of the terminal infrastructure – if required - to enable increasing the amount of rail/rail transhipments.

Page 38 of 74
(2) Shuttle or direct services would be established between these gateway terminals. Though in the style of existing transalpine connections the concept would advance much further. The idea is to implement such a scope of daily services that the network could be operated like a conveyor-belt system:
• multi-frequency services: several daily departures • mix of overnight and over-day schedules • consolidation of domestic and international, local and gateway volumes
The concept deliberately accepts that some departures would not be suffi ciently employed. However, the marketing message to the logistics industry would be that it could rely on a consistent supply of services and capacity. The concept also accepts that many shipments would not be carried on the shortest possible way because it would mean to convey them on a complex and infrastructure-related ineffi cient LTL production system. Instead they make a detour by being moved on two shuttle services connected via a gateway terminal.
(3) The above network would represent the core system carrying the bulk of international shipments. In our view, it would be required to be complemented by a couple of hub systems that, depending on the geographic and infrastructure conditions, must not necessarily be linked to the core system. The role of the hub systems particularly would be twofold:
• improvement of the hinterland transport of maritime containers on LTL trade lanes relieving both congested sea ports and dry inland terminals;
• development of small- and medium-size economic areas for combined transport, which could not economically be served by the core network.
In order to operate those hub systems effi ciently as concerns rail infrastructure capacities the consolidation centres (hubs) should be located off the main lines. Even if this resulted in extra transport time the entire system would be due to perform better as regards punctuality and reliability. This in turn should contribute to raising the customer satisfaction and the market acceptance of the services involved.
(4) The progress of intermodal production systems and a more effi cient use of rail infrastructure capacities as sketched above, ultimately, will depend on punctual and reliable terminal-to-terminal services. Delays and irregularities would consume much more train paths than could be “saved” by top rated production systems.

Page 39 of 74
3 Long and heavy trains
3.1 Objective
After the systematic description and assessment of all production systems regarding their ability to bundle volumes of shipments and thus to capture forecast growth, the objective is now to analyse the opportunities and limits of bundling trains to longer and/or heavier trains and to assess the impacts on the future employment of the infrastructure on se-lected European corridors.
In the following
• a number of suitable European corridors for longer and/or heavier trains will be identi-fi ed (chapter 3.4),
• the technical and operational aspects of longer and/or heavier trains will be discussed (chapter 3.5),
• and, fi nally, the impact of these production systems on the use of the capacity in 2015 will be quantifi ed for selected corridors (chapter 3.6).
3.2 General methodology
Since every corridor is characterized by various very specifi c technical, operational and market conditions which can not be considered in a model, it is obvious that the chosen approach can only give a fi rst quantifi cation of the impact as a base for further in-depth corridor specifi c feasibility analysis. It is obvious too, that the selected corridors do not cover all potential corridors for the operation of long and heavy trains, but they cover some central strategic axes for combined transport in Europe.
The chosen methodology follows three consecutive steps and seeks to combine a statisti-cal (model) approach with the practical experience with long and heavy trains collected during expert talks.
At fi rst, some suitable corridors are identifi ed using the data base elaborated for the UIC Capacity Study and DIOMIS. These corridors were identifi ed by the following criteria,

Page 40 of 74
which will be explained in detail further down:
• the number of intermodal services within and beyond the corridor,• the “homogeneity” of the corridor,• the distance of the homogeneous sections between the two bundling points,• the split of domestic and international services on the corridor,• the number of bottlenecks on the homogeneous sections of the corridor.
The second step seeks to transform the practical experience with long and heavy trains collected so far into parameters. These parameters could be varied according pessimistic or optimistic assumptions with the aim to quantify -in a third step- the minimum/maximum spared train paths, when operating long and heavy trains. This is developed further under chapter 3.6.1.
3.3 Current situation of infrastructure with respect to longer and heavier
trains and existing plans for improvements
One of the basic assumptions of the UIC capacity study of 2004 was that all main European corridors allow for 750 m maximum train length and 1,500 tonnes maximum train gross weight by 2015. The UIC ERIM report 2007 (European Rail Infrastructure Master-plan) gives a good overview of the current and future situation on the European main railway network. Figure 3-1 presents the current situation as concerns maximum train length on selected axes. As can be seen from this fi gure, practically all lines in Italy and in the Benelux countries are marked in red, which means a maximum train length of less than 750 m. Particularly in Italy rail freight traffi c suffers from a maximum train length of 550 m, whereas the Benelux network allows for approx. 600 m. Even on the German network and on the Brenner axis, strategic links allow only for less than 750 m trains.

Page 41 of 74
(source: ERIM Report 2007)Figure 3-1: Maximum train length on selected European corridors in 2006
max. train length< 750 m> 749 m

Page 42 of 74
By 2020 the general picture looks more positive (cf Fig. 3-2): The most important corridors allow for at least 750 m trains, in particular on the corridors from Antwerp to Milan as well as from Hamburg to Rome.
(source: ERIM Report 2007)Figure 3-2: Maximum train length on selected European corridors by 2020
As concerns the maximum train weight, the fi gures 3-3 and 3-4 compare the situation in 2006 and 2020. Particularly in 2006 the transalpine axes are limited to less than 1,500 tonnes gross weight per train. ERIM expects for 2020 a considerable improvement of this situation. Only the Lyon – Turin corridor will still be below the threshold of 1,500 tonnes.
max. train length< 750 m> 749 m

Page 43 of 74
(source: ERIM Report 2007)
Figure 3-3: Maximum train weight on selected European corridors in 2006
max. train load< 1,500 t> 1,500 t

Page 44 of 74
(source: ERIM Report 2007) Figure 3-4: Maximum train weight on selected European corridors in 2020
To summarise, the ERIM study, with its time horizon of 2020, confi rms in principle the assumptions made in the capacity study.
3.4 Identifi cation of suitable corridors for longer and heavier trains
As described in the methodology above, the fi rst step consists of the identifi cation of suitable corridors for the operation of longer and heavier trains. This work is based on the data elaborated for the UIC capacity study and DIOMIS. It contains the O/D fl ows of intermodal and conventional freight trains and the tonnes, differentiated by commodities. For the identifi cation of suitable corridors, this database serves for the following two objectives
• a distinction between „heavy“ and „light“ commodities in order to differentiate weight and volume critical O/D fl ows. For example, chemical products are in most cases heavy loads, whereas automotive transports are typically voluminous (=”light”) goods.
max. train load< 1,500 t> 1,500 t
Page 45 of 74
• The identifi cation of origins and destinations of each fl ow and the bundling potential on the corridors.
Then, some suitable corridors for longer and heavier trains were identifi ed according to the following criteria:
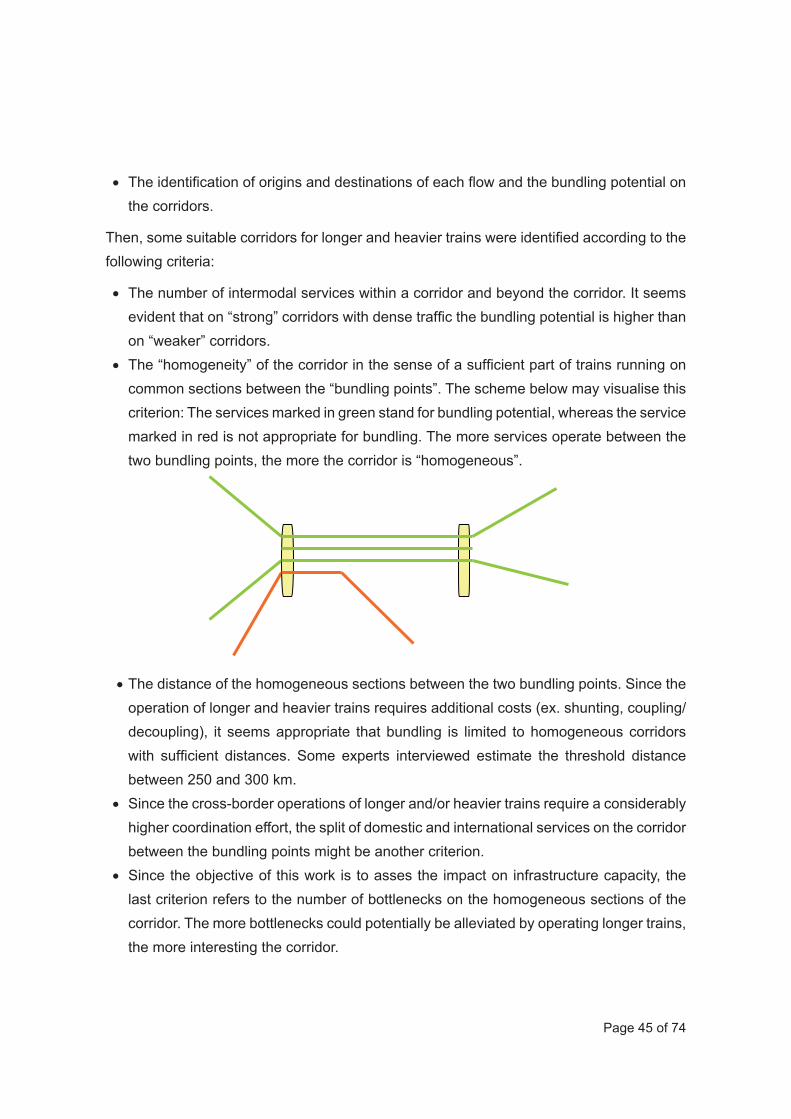
• The number of intermodal services within a corridor and beyond the corridor. It seems evident that on “strong” corridors with dense traffi c the bundling potential is higher than on “weaker” corridors.
• The “homogeneity” of the corridor in the sense of a suffi cient part of trains running on common sections between the “bundling points”. The scheme below may visualise this criterion: The services marked in green stand for bundling potential, whereas the service marked in red is not appropriate for bundling. The more services operate between the two bundling points, the more the corridor is “homogeneous”.
• The distance of the homogeneous sections between the two bundling points. Since the operation of longer and heavier trains requires additional costs (ex. shunting, coupling/decoupling), it seems appropriate that bundling is limited to homogeneous corridors with suffi cient distances. Some experts interviewed estimate the threshold distance between 250 and 300 km.
• Since the cross-border operations of longer and/or heavier trains require a considerably higher coordination effort, the split of domestic and international services on the corridor between the bundling points might be another criterion.
• Since the objective of this work is to asses the impact on infrastructure capacity, the last criterion refers to the number of bottlenecks on the homogeneous sections of the corridor. The more bottlenecks could potentially be alleviated by operating longer trains, the more interesting the corridor.

Page 46 of 74
3.4.1 Identifi cation of suitable corridors by the analysis of CT volumes and infrastructure capacities
Figure 3.5 presents the assignment of national and international CT volumes as well as the use of capacity by 2015 in the case that all planned infrastructure investments are under operation. The indication of the use of capacity refl ects all types of trains (passenger and freight) on the links.
Figure 3-5: European high volume corridors by 2015
> 173
Rate of employment
N° of trains per day and direction on a double tracked electrified line
145 - 173121 – 144
< 12070 – 84 %
85 – 100 %> 100 %
< 70 %
> 173
Rate of employment
N° of trains per day and direction on a double tracked electrified line
145 - 173121 – 144
< 12070 – 84 %
85 – 100 %> 100 %
< 70 %

Page 47 of 74
The corridors fulfi lling the criteria of high volumes of combined transport and –at the same time- a high rate of capacity employment are highlighted in Fig. 3-5. Basically, one can identify 5 corridors:
• A1: Rotterdam – Brussels – Dijon – (Avignon / Milano)• A2: (Rotterdam / Paris) – Dijon – Avignon • B1: Hamburg / Bremen – Fulda – Munich – Verona respectively Hamburg / Bremen – Fulda
– Frankfurt – Basel – Milano (where Frankfurt – Milano is covered by corridor B2)• B2: (Rotterdam / Rhine-Ruhr) – Cologne – Frankfurt – Basel – Milano• C1: (Milano -) – Bologna / Genova – Firenze
Regarding the only criteria “number of bottlenecks”, the corridor A2 is saturated on approx. 50% of its total length, while the other corridors show a much higher degree of saturation.
Regarding the criteria “repartition of domestic and international fl ows”, fi gure 3-6 presents the corridors differentiated between national (yellow) and international (red) CT traffi c.
Figure 3-6: European high volume corridors for national (yellow) and international combined transport by 2015

Page 48 of 74
A fi rst rough corridor related analysis (in depth analysis are presented further down) of the characteristics presented so far, leads to the following:
Corridor A1 Rotterdam – Brussels – Dijon – (Avignon / Milano) is primarily characterized by its load with international trains. According to our forecasts by 2015, 88 combined trains will pass the Nancy area in France, of which only 2 daily trains are domestic trains. As can be seen from Fig. 3-6, most of the international trains are bound to Northern Italy via Dijon – Modane. Consequently, further analysis on corridor A1 should be concentrated on the axes Rotterdam/Antwerp – Brussels – Dijon – Modane – Northern Italy.
80 daily combined trains will pass in 2015 the section North of Avignon on the corridor A2 (Rotterdam / Paris – Dijon – Avignon). The repartition of national to international trains will be 47/33 trains per day. As can be drawn from Fig. 3-6, the national trains connect the Paris region and Marseille, whereas international trains are mostly bound to Spain. Thus, refl ections regarding longer and heavier trains should consider the axis Paris – Dijon – Avignon/Marseille, since the superposition of national and international services between these bundling points offers a suffi cient potential for longer and/or heavier trains.
As concerns corridor B1 (Hamburg / Bremen – Fulda – Munich – Verona respectively Hamburg / Bremen – Fulda – Frankfurt – Basel – Milano), Fig. 3-6 clearly shows a high concentration of domestic trains on this axis. According to the forecasts, the intersection between Hannover and Göttingen is passed by 190 CT trains in 2015, of which 158 are domestic (100 maritime, 58 continental) and 32 international trains. Almost all hinterland services from/to the German seaports are concentrated on this part of the corridor. An important part of these traffi cs are routed via Frankfurt and further down the corridor B2 to Northern Italy. Consequently, one can estimate a high potential for coupling trains, between the bundling points Hannover and Fulda. Further down southwards the corridor is less homogenous until Munich, since Nürnberg is an import intermediate point with comparatively small distances to the neighbouring bundling points Fulda and Munich. South of Munich the traffi c is practically completely international. Thus, disregarding eventual additional technical limits, the Brenner route requires international cooperation for the bundling of trains.

Page 49 of 74
The corridor B2 is not surprisingly geared to a high degree to international services. By 2015, on the intersection between Arth-Goldau and Andermatt a total of 141 CT trains are estimated, of which 119 (= 84%) are international and only 22 domestic. Regarding the pure criterion “number of services” this corridor offers clearly a high potential for the bundling of trains. Disregarding technical and operational aspects, discussed further down, this corridor can be characterized by a high degree of homogeneity between bundling points in the Rhine-Ruhr area, the Rhine-Main-Neckar area and the Milan area.
By contrast to that, corridor C1 (Milano -) – Bologna / Genova – Firenze is statistically nearly completely dedicated to domestic combined services. For example on the intersection Terontola – Roma only 5 CT trains out of 60 are international. On this intersection the continental domestic traffi c (49 trains out of 60) is clearly preponderant. Nevertheless, it must be pointed out that this axis bears a huge number of international GATEWAY shipments fed in by the corridors A2, B1 and B2 and maritime shipments of the ports of Gioa Tauro, Taranto and Triest. According to the criteria homogeneity and distance between the bundling points this corridor offers a certain potential. Nevertheless, the economic centres in northern Italy are located relatively close to each other and are linked with a relatively dense railway network. Consequently, this corridor requires further in depth analysis of the bundling potential.
3.4.2 Identifi cation of suitable corridors by a partial assignment on given intersections
As pointed out at the beginning of the chapter, it is important that the corridors can be considered as “homogenous”. This means that between the two bundling points a suffi cient number of trains must operate, and the distance between these points must be suffi cient so that productivity gains can be realised.
This requires an in depth analysis of the origin and destination of trains within the corridor. The DIOMIS data base in combination with a powerful software tool allow for this analysis.
Figure 3-8 visualises for the corridor A1. (Rotterdam – Brussels – Dijon – Avignon / Milano) all origins and destinations of the trains passing over a given intersection south of Brussels (cross section A1.1) by 2015.

Page 50 of 74
As can be clearly seen, most of the traffi c connects Antwerp/Brussels and the Milan area via Modane and the new Lyon-Turin line1. The only junction where important traffi cs are split is Dijon, where a part of the traffi c goes to South of France and Spain. Thus, one can conclude for the A1 corridor that a bundling potential can be seen between Antwerp/Brussels and Dijon, Dijon and Milan and/or the whole corridor Antwerp/Brussels and Milan. From Fig. 3-8 it can also be seen, that a bundling of trains between Antwerp/Brussels and Dijon could alleviate important bottlenecks in Belgium and in the North of France.
But this is only true if the new Lyon-Turin axis will be realised, since at the moment, compared to the Gotthard/Lötschberg corridor, the Modane corridor suffers from its reduced weights (1.150 tonnes, compared to 1.300/1540 in Switzerland), whereas the Swiss corridor offers advantages like multiple traction providers and the higher reliability of the service. That means that today most traffi c on this corridor is routed via Basel/Athus and Basel/Aachen.
1 It should be reminded that this analysis is based on the assumption of the capacity study that all planned infrastructure investments are under operation in 2015.

Page 51 of 74
Figure 3-8: Origins and destinations of trains passing an intersection south of Brussels (A1.1)
For the A2 corridor (Rotterdam / Paris – Dijon – Avignon), fi gure 3-9 presents the assignment of the traffi c passing via the intersection between Lyon and Avignon. It becomes evident that Metz is an important bundling point for this corridor. South of Metz, the A2 corridor is relatively homogenous until Barcelona and further down to Tarragona and Valencia.
Figure 3-9 also makes it evident that bottlenecks in the North of France are affected by this measure. One must point out that the infrastructure situation in 2015 is characterized
A1.1
59 trains/d
A1.1
59 trains/d
> 173
Rate of employment
N° of trains per day and direction on a double tracked electrified line
145 - 173121 – 144
< 12070 – 84 %
85 – 100 %> 100 %
< 70 %
> 173
Rate of employment
N° of trains per day and direction on a double tracked electrified line
145 - 173121 – 144
< 12070 – 84 %
85 – 100 %> 100 %
< 70 %

Page 52 of 74
by the assumption that all planned investments have been made: i.e. the realisation of the Lyon bypass (CFAL Contournement Ferroviaire de l’Agglomération Lyonnaise) and the bypasses/new lines on the Nîmes – Montpellier – Perpignan - Figueras – Barcelona - Tarragona line got completely equipped with UIC standard gauge.
Figure 3-9: Origins and destinations of trains passing an intersection between Lyon and Avignon (A2.1)
The bundling options on corridor B1 (Hamburg / Bremen – Fulda – Munich – Verona respectively Hamburg / Bremen – Fulda – Frankfurt – Basel – Milano) are presented in Fig. 3-10. It becomes evident that on this corridor a bundling of trains seems promising between Hamburg and Fulda. This is even more true, since between Hamburg and Fulda
A2.133 trains/d
A2.133 trains/d
> 173
Rate of employment
N° of trains per day and direction on a double tracked electrified line
145 - 173121 – 144
< 12070 – 84 %
85 – 100 %> 100 %
< 70 %
> 173
Rate of employment
N° of trains per day and direction on a double tracked electrified line
145 - 173121 – 144
< 12070 – 84 %
85 – 100 %> 100 %
< 70 %

Page 53 of 74
important bottlenecks occur. Thus, a bundling of trains could help alleviating bottlenecks on this important strategic link in Europe.
Figure 3-10: Origins and destinations of trains passing an intersection in Fulda (B1.2)
When regarding the situation on corridor B2 (Rotterdam / Rhine-Ruhr) – Cologne – Frankfurt – Basel – Milano) (Fig. 3-11), it becomes evident that this corridor is one of the most important corridors in the European network. 60 daily trains run in 2015 only between the Cologne and the Milan areas. As can be seen from this picture, the corridor is homogeneous between Cologne and Milan which offers a variety of bundling options for example between Cologne – Rhine/Main/Neckar – Milan.
> 173
Rate of employment
N° of trains per day and direction on a double tracked electrified line
145 - 173121 – 144
< 12070 – 84 %
85 – 100 %> 100 %
< 70 %
> 173
Rate of employment
N° of trains per day and direction on a double tracked electrified line
145 - 173121 – 144
< 12070 – 84 %
85 – 100 %> 100 %
< 70 %

Page 54 of 74
Figure 3-11 Origins and destinations of trains passing an intersection south of Cologne (B2.1)
Particular bottlenecks occur between Cologne and Mannheim. Consequently, a bundling between these two points would alleviate important bottlenecks on this link.
Figure 3-11 also reveals that the cross section (B 2.1) in Cologne is touched as well by approx. 10 trains running down to Spain. These trains are included in the analysis of the corridor A1 and A2.
Köln
Rotterdam
Antwerp
33 trains/d
18 trains/d
80 trains/d
112 trains/d
(about 60 from thearea of Köln)
14 trains/d
Verona
Köln
Rotterdam
Antwerp
33 trains/d
18 trains/d
80 trains/d
112 trains/d
(about 60 from thearea of Köln)
14 trains/d
Verona

Page 55 of 74
3.5 Technical and operational opportunities and limits for longer and heavier trains
After the analytical deduction of the corridors according to the parameters described above, the next steps deal with the assessment of the technical and operational opportunities and limits of longer and heavier trains. For this reason a number of talks were held with experts from railway undertakings, infrastructure managers and intermodal operators.
These talks revealed that longer and heavier trains are –to a certain extent- “daily business” in some national networks: For example in Denmark 835 m trains are allowed. Consequently, an extension of these trains further down to Hamburg (Maschen), as proposed during the expert talks, seems appropriate.
Another example exists in Switzerland, on the east-west axis between the shunting yards Zürich (Limmattal) and Lausanne 800 m trains are operating. These trains are running during night times and with specially planned train paths, seeking to avoid the overtaking of this train, since most of the passing tracks do not allow a stop of trains of more than 750 m length.
As concerns heavier trains, the interview partners reported daily practices of much heavier trains than 1,500 tonnes. For example Railion operates super heavy ore block trains with a gross weight of maximum 6,000 tonnes between Hamburg and Salzgitter and 3,000 tonnes block trains between Emden and Salzgitter. These trains require at least 2 engines and all wagons and locomotives are equipped with automatic coupling systems, since the maximum weight for conventional coupling systems is 3,600 tonnes, as stated by the experts.
To summarise, longer and heavier trains are in some cases common practice but they need specifi c treatment i.e. either technical equipment (automatic coupling and radio control systems for the locomotives) as well as specifi c train paths.
Some interview partners, in particular from the operator’s side, expressed their scepticism concerning a bundling of trains since they fear that infrastructure managers and traction providers would raise their respective prices and that the bundling of trains would lead to less frequent departures and thus to a reduced offer.

Page 56 of 74
In contrast to the objective of this work package, the interviews revealed, that so far, the reason for longer and heavier trains is not primarily to spare capacity on the infrastructure, but to adapt the load capacity of the train to the client’s requirements and/or to optimise the use of rolling stock.
Consequently, the objective of the following chapters is to show that longer and heavier trains may also lead to considerable gains in terms of infrastructure capacity.
3.5.1 Technical aspects:
One of the most obvious limits for longer trains is the length of the passing tracks. If on a given route there are only a few passing tracks with suffi cient length, the overtaking of long trains is hardly possible. In consequence, train paths for special long trains have to be planned specifi cally avoiding overtaking. In these cases, it is a problem that the train paths have to be planned with a safety factor of 1.5 (1.5 paths for 1 train), which reduces considerably the advantages of the long trains regarding the use of capacity.
The Swiss interview partners highlighted the aspect of gradients. Even when the base tunnels (NEAT) are under operation, gradients of 17 ‰ occur. This means that maximum train weight drops from approx. 2,000 tonnes to approx. 1,000 tonnes (cf. Fig. 3-12)
Gradient Maximum towed load0 ‰ 2,000 t 100 %12 ‰ 1,300 t 65 %20 ‰ 840 t 42 %26 ‰ 650 t 35 %30 ‰ 540 t 27 %38 ‰ 400 t 20 %
(source: SBB cargo)
Figure 3-12: Towed load as a function of gradients
In the tunnels the problem is even aggravated due to wet tracks and higher air resistance.
Some of the experts estimated that the existing technical equipment (standard coupling, break systems) allow for a maximum train length of 1,000 to 1,200 m. Beyond this threshold additional supporting technical systems are needed.

Page 57 of 74
When discussing the opportunities of longer and heavier trains one has to discuss clearly the interdependency between both length and weight. For example between Ludwigshafen and Italy, there is a clear dominance of heavy consignments (chemical products). Thus, the maximum weight of 1,600 tonnes is reached with a train length of 530m, which limits the potential for the bundling of trains.
Another aspect related to infrastructure –especially in the case of heavy trains- is the problem of suffi cient electric power supply for two locomotives, which is not guaranteed for all European networks (ex. in France). In the end, this means that the advantages of bundling trains with respect to capacity would be partially –or completely- compensated by the fact that fewer trains could run at the same time on a given section.
On some links with a particular dense traffi c the capacity was improved by reducing the block distance. In the case of long trains these block distances have to be readjusted.
To summarise, all experts stated that a couple of technical problems have to be taken into account before a production system “longer and/or heavier trains” could be implemented systematically, but they also stated that all these diffi culties could be overcome.
3.5.2 Operational aspects
Two operation schemes can be imagined:
• Longer and/or heavier trains between one origin and one destination,• Coupling and/or decoupling of two trains on long distance haul between two bundling
points.
The advantage of the latter is the higher potential for longer and heavier trains and, consequently, the impact on infrastructure capacity might be higher. On the other hand, this scheme requires infrastructure of suffi cient length to couple two trains. Furthermore, this scheme is relatively fragile as concerns delays. A delay of one of the trains might have a knock on effect.
The interview partners from SNCF pointed out that they experimented with the coupling of 2 complete trains with an intermediate engine, which is radio-controlled by the leading engine (“jumelage par radio”). Beside some technical problems concerning the radio control of the second engine the system functioned relatively well.

Page 58 of 74
The fi rst scheme demands clearly less organisational efforts, but on the other hand the bundling potentials are probably lower. The second scheme offers a higher bundling potential but requires more organisational efforts, in particular if the second scheme is applied on an international link.
A general prerequisite for both schemes is for the market to accept volume bundling. This is only the case if the shipments tolerate in average a longer transit time. The interview partner estimated that this might be easier for conventional trains than for intermodal services. They explained that for conventional trains, in particular single wagon traffi c, suffi cient buffer times for shunting allow additional operations for the bundling of trains.
As concerns the traction of longer and heavier trains, some of the interview partners stated that it requires a second locomotive, which bears a risk of unproductive use of the second engine. Searching for a maximum productivity of the rolling stock, SBB cargo tends to use one single locomotive for the whole trip from Rotterdam to Milan.
Again, the experts stated that beside the technical aspects, the operational aspects have to be taken into consideration when planning longer and/or heavier trains. But the operational diffi culties were estimated to be solvable as well.
3.5.3 Corridors recommended
During the talks, principally all corridors presented so far were validated by the experts. Of course, at this stage of the work, it must be pointed out, that the presented corridors are most probably not the only ones, where a bundling of trains seems possible and advantageous.
Nevertheless, the interview partners from Railion, SBB cargo and HUPAC stated the following corridors as being the most promising in the future:
• Cologne – Basel• Maschen (Hamburg) – Malmö• Rotterdam – Duisburg

Page 59 of 74
The French experts mentioned additional French corridors, which could be interesting in medium terms
• Paris – Dourges – (Lille)• Paris – Le Havre• Paris – Hendaye• Avignon – Port-Bou/Cerbère
Especially the experts who are active on the Italian market, stated that in Italy a general increase of the train length to 750m (as foreseen in the ERIM report (cf. Fig. 3-2) would allow for enormous gains of capacity and that this would be the primary step. They declared that an increase of the maximum train length is of particular interest for the maritime business.
3.6 Impact of longer and heavier trains on the use of capacity 2015
3.6.1 Methodology
The third step of the model now seeks to quantify the impact of the operation of longer and/or heavier trains regarding spared train paths. In the following, the methodology to quantify the impacts on infrastructure capacity is described:
The basic idea is to combine the experience collected during the talks with the existing data. In principle, for the line sections within the corridors a reduction factor (“R”) for longer and heavier trains is calculated, which represents the possible reduction of freight train slots due to longer and heavier trains. This reduction factor is depending on the following parameters:
• the ratio of „length critical“ and „weight critical“ (parameter a) trains,• the ratio of trains which only operates in between the defi ned bundling points
(parameter b),• for those trains running in between the bundling points: The ratio how many of them
allow for an increase of length or weight (parameter c),• for those trains, which run beyond the bundling points: The ratio how many of them
could be bundled (parameter d),

Page 60 of 74
• factor giving the increase of maximum length / of max. weight of trains (parameter e),• parameter to consider that a longer/heavier train needs more time capacity than a
conventional train (parameter f).
Furthermore, R is differentiated for
• CT, national and international,• conventional freight trains, national and international.
Once R is calculated2, for each section within the corridors, the number of freight trains in the base scenario (= predicted number of freight trains in the UIC capacity study) is multiplied with R. The number of passenger trains is not modifi ed. The scheme in Fig. 3-13 visualises this methodology:
2 R is calculated according to the following formula: R = (a * b * c * (1 + f) + a * (1 – b) * d * (1 + f)) / (1 + e) + (a – a * b * c - a * (1 – b) * d) The following example may illustrate the calculation process of R for International CT, length critical trains, on a given link:a: 60% of the trains can be seen as length criticalb: 80% of the length critical trains operates in between the bundling points in the corridor c: 70% of the length critical trains, which operates in between the bundling points in the corridor allow for an increase of lengthd: 30% of the length critical trains, which runs beyond the corridor, allow for a coupling e: The increase of maximum train length is 100 %f: One longer train needs 10 % more slot capacity than a shorter trainR = (0,6 * 0,8 * 0,7 * (1 + 0,1) + 0,6 * (1 – 0,8) * 0,3 (1 + 0,1)) / (1 + 1) + (0,6 - 0,6 * 0,8 * 0,7 – 0,6 * (1 – 0,8) * 0,3)According to this calculation, 39 % of the slots can be spared on the given link

Page 61 of 74
Figure 3-13: Methodology for the estimation of the reduction of train paths by implementing longer and heavier trains
By varying the parameters (cf. example in footnote 2 above), one optimistic and one pessimistic scenario were calculated. The assumptions were discussed with the experts. Generally speaking, the experts stated that the “pessimistic” assumptions could be seen as realistic, whereas the optimistic assumptions seem achievable only in the long term. Nevertheless, we decided to keep the optimistic scenario with the objective to give an idea of the maximum thinkable gain of capacity by operating longer and heavier trains.
Since the parameters a and b are given directly by the database, the assumptions for the parameters c to f are presented in the following for the “pessimistic” and the “optimistic” scenario:

Page 62 of 74
Parameter c for trains running in between the bundling points: The ratio, how many of them allow for an increase of length or weight
This parameter depends on assumptions concerning the following parameters:
• The possibilities and limits of a reduction of frequency of departures,• The possibilities and limits of bundling of volumes from different terminals or sidings,• The possibilities and limits to deal with longer trains in terminals or sidings,• The possibilities and limits to adapt the infrastructure required for the formation of the
trains (i.e. shunting yards).
For the optimistic scenario the assumption was made that 80 % of the trains running in between the bundling points allow for an increase of length or weight.
In contrast to that, in the pessimistic scenario “only” 40 % of the trains would be suitable for an increase of length and weight.
Factor d for trains, which run beyond the bundling points: The ratio, how many of them allow for a bundling
This parameter depends on the same technical and logistical parameters as parameter c. In addition to that, the following parameters have to be considered:
• The possibilities and limits of coupling and splitting trains at the beginning/end of corridors (waiting times, adapted infrastructure),
• The possibilities and limits to combine different types of trains, (e.g. a „light“ train with a “heavy” train)3.
For the optimistic scenario it was assumed that 55 % of the trains running beyond a corridor could be coupled. For the pessimistic scenario a ratio of 7 % was assumed.
3 For example one of the interview partners stated that it is technically not possible to couple a heavy train after a light train because of the risk that in curves the light part of the train would derail

Page 63 of 74
Parameter e concerning the maximum length / maximum weight of trains
In the optimistic scenario it was assumed that the infra- and suprastructure allow for all trains (100%) on the given corridor an increase of the train length from 750 m to 1,500 m and an increase of the maximum weight from 1,500 tones to 3.000 tonnes.
As concerns the pessimistic scenario, it was assumed that “only” a third of all trains (33%) allow for this increase.
Parameter f to consider that a longer/heavier train needs more time capacity than a conventional train.
This parameter was introduced in the formula in order to consider the fact that a 1,500 m train requires more infrastructure capacity than a 750 m train due, for example, to safety factors. Thus, parameter f is a supplement to consider the additional need of slot capacity for the longer/heavier trains.
In the optimistic scenario, it was assumed that this parameter is 0, whereas in the pessimistic scenario, the assumption was made that the slot factor is 1.15, which means that the longer and heavier trains need 15% more capacity than conventional trains.
3.6.2 Scenarios calculated
Once the assumptions for the parameters were made, four different scenarios were calculated. These scenarios were differentiated according to the following:
• For one set of scenarios the reduction parameter “R” was calculated under the assumption that longer and heavier trains could be operated on all corridors identifi ed in Fig. 3-7.
• For a second set of scenarios “R” was calculated under the assumption that only for one section between Basel and Chiasso (Fig. 3-14) longer and heavier trains could be operated.

Page 64 of 74
Figure 3-14: Corridor Basel – Chiasso
Each of the scenarios was calculated for the optimistic as well as for the pessimistic parameters, thus totalling to 4 scenarios (cf. table 3-1):
Table 3-1: Scenarios
43One section for longer and heavier trains (Basel –Chiasso)
21All corridors for longer and heavier trains
Pessimistic parameters
Optimistic parameters
43One section for longer and heavier trains (Basel –Chiasso)
21All corridors for longer and heavier trains
Pessimistic parameters
Optimistic parameters

Page 65 of 74
These scenarios lead to the results presented herewith. For each of them the absolute reduction of freight trains (“cargo” in the fi gures) are presented on specifi c cross sections.
In addition to that, for the scenarios 1 and 2 the total of train kilometres compared to the base scenario (= UIC capacity study) is presented. It seems important to remind again that in the capacity study it was assumed that the total European network allowed for 750 m/1,500 tonnes.
Figure 3-15: Use of capacity on the European network in scenario 1 (optimistic)

Page 66 of 74
In scenario 1, where all the corridors suitable for longer and heavier trains (cf. Fig. 3-6) are combined with the optimistic parameters, a reduction of freight train slots between 13% (cross section Fulda – Hanau and Brenner) and 23-25 % (cross sections Lyon – Avignon and Gotthard) could be reached.
On the total network, the combination of the optimistic parameter would reduce the total volume of train kilometres on the selected corridors by 35% as shown in table 3-2 below:
Table 3-2: Reduction of train kilometres/day on the selected corridors by the operation of longer and heavier trains
in the optimistic scenario
Base scenario Scenario 1 Percentage change1.315.186 852.893 - 35%
Figure 3-16: Use of capacity on the European network in scenario 2 (pessimistic)

Page 67 of 74
In scenario 2, where all the corridors suitable for longer and heavier trains (cf. Fig. 3-6) are combined with the pessimistic parameters, a reduction of freight train slots between 2% (cross section Fulda – Hanau), 3% (Lyon-Avignon), 4% (Gotthard) and 7% (cross sections Brenner) could be achieved.
On the total network the combination of the pessimistic parameters would reduce the total volume of train kilometres on the selected corridors by 5% as shown in table 3-3 below:
Table 3-3: Reduction of train kilometres/day on the selected corridors by the operation of longer and heavier trains
Base scenario Scenario 2 Percentage change1.315.186 1.252.120 - 5%
Figure 3-17: Use of capacity on the European network in scenario 3 (Basel-Chiasso; optimistic)

Page 68 of 74
When allowing longer and heavier trains only on the section between Basel and Chiasso, and considering the optimistic parameters for scenario 3, Fig. 3-17 shows that a considerable number of train paths could be spared. In total, this situation would lead to a capacity gain of 20% on the Basel-Chiasso corridor.
Figure 3-18: Use of capacity on the European network in scenario 4
Finally, in scenario 4 (corridor Basel – Chiasso in combination with the pessimistic parameters) 3% of the train slots could be spared.

Page 69 of 74
3.7 Conclusions
Even if the quantifi ed results presented above are an output of a model that cannot integrate all technical, operational and market aspects on a given corridor, they can serve as a fi rst quantifi ed estimation, how the operation of longer and/or heavier trains could impact the capacity situation within the selected corridors. The model’s input parameters were discussed with experts with different points of view. Thus, we think that the parameters refl ect, at least for the pessimistic scenario, suffi ciently realistic estimates.
From the results of the scenarios 1 to 4 the following general conclusions can be drawn:
• Corridors with a potential for longer and heavier trains do exist.• These corridors suffer from capacity bottlenecks that could be alleviated by bundling
trains.• The analysis of the technical and operational aspects brought to evidence that a couple
of obstacles occur. This means that some coordination efforts have to be taken as well as some investments (prolongation of passing tracks, adjustments of security and signalling systems) have to be made. Moreover, some intermodal operators expressed their scepticism against this production system, since they fear increasing prices for traction and access to infrastructure. Nevertheless, all interview partners agreed that these obstacles can be surmounted.
• The calculations proved that with the regular operation of longer and/or heavier trains considerable gains of capacity could be achieved. Of course, this has to be seen in the light of the technical feasibility and the marketability of this production system.
The results presented brought to evidence that in the “pessimistic” scenario (which actually seems to be achievable by 2015 on given corridors), up to 7% of the train paths could be spared. This would result in a gain of 5% of train kilometres only on the corridors analysed.
Regarding the “optimistic” scenario, giving the maximum thinkable gains of capacity the respective fi gures amount to approximately 15 to 25% spared train paths per section and to 35% less train kilometres on the selected axes. It is true that this scenario is based on rather challenging assumptions, which seem only achievable in the long run. Nevertheless these fi gures reveal a considerable potential of productivity gains.

List of fi gures
Page 70 of 74
Figure 1-1: Components of DIOMIS Master Plan process .....................................................1
Figure 2-1: Business models in combined rail/road transport in Europe ..................................4
Figure 2-2: Overview of combined transport production systems ...........................................5
Figure 2-3: Direct train production system ................................................................................6
Figure 2-4: Shuttle train production system ..............................................................................7
Figure 2-5: Y-shuttle train production system ...........................................................................7
Figure 2-6: Liner train production system .................................................................................9
Figure 2-7: Group train production system ...............................................................................9
Figure 2-9: Gateway production system .................................................................................12
Figure 2-10: Megahub/Mainhub production system ...............................................................12
Figure 2-11: Mixed intermodal/conventional production system .............................................14
Figure 2-12: Assessment of effi ciency of intermodal production systems ..............................32
Figure 2-13: Comparison of effi ciency of intermodal production systems: CT operator perspective .....................................................................................33
Figure 2-14: Comparison of effi ciency of intermodal production systems: rail infrastructure perzspective ...........................................................................34
Figure 3-1: Maximum train length on selected European corridors in 2006 ..........................37
Figure 3-2: Maximum train length on selected European corridors by 2020 .........................38
Figure 3-3: Maximum train weight on selected European corridors in 2006 .........................39
Figure 3-4: Maximum train weight on selected European corridors in 2020 .........................40
Figure 3-5: European high volume corridors by 2015 ............................................................42
Figure 3-6: European high volume corridors for national (yellow) and international combined transport by 2015 ............................................................44
Figure 3-8: Origins and destinations of trains passing an intersection south of Brussels (A1.1) ..................................................................................................................47

Page 71 of 74
Figure 3-9: Origins and destinations of trains passing an intersection between Lyon and Avignon (A2.1) .....................................................................................................48
Figure 3-10: Origins and destinations of trains passing an intersection in Fulda (B1.2) .......49
Figure 3-11: Origins and destinations of trains passing an intersection south of Cologne (B2.1) .................................................................................................................50
Figure 3-12: Towed load as a function of gradients ................................................................52
Figure 3-13: Methodology for the estimation of the reduction of train paths by implementing longer and heavier trains .......................................................57
Figure 3-14: Corridor Basel – Chiasso ...................................................................................60
Figure 3-15: Use of capacity on the European network in scenario 1 (optimistic) .................61
Figure 3-16: Use of capacity on the European network in scenario 2 (pessimistic) ...............62
Figure 3-17: Use of capacity on the European network in scenario 3 (Basel-Chiasso; optimistic) ................................................................................63
Figure 3-18: Use of capacity on the European network in scenario 4 ....................................64

List of tables
Page 72 of 74
Table 3-1: Scenarios ...............................................................................................................60
Table 3-2: Reduction of train kilometres/day on the selected corridors by the operation of longer and heavier trains in the optimistic scenario .........................................62
Table 3-3: Reduction of train kilometres/day on the selected corridors by the operation of longer and heavier trains ..................................................................................63

ETF EDITIONS TECHNIQUES FERROVIAIRES
RAILWAY TECHNICAL PUBLICATIONS - EISENBAHNTECHNISCHE PUBLIKATIONEN16 rue Jean Rey - F 75015 PARIS
http://www.uic.asso.fr/etf/

Printed by
Xerox Global Services France
16, rue Jean Rey 75015 Paris - France
October 2007
Dépôt légal October 2007
ISBN 2-7461-1378-3 (English version)