Embed Size (px)
Citation preview
1
International Comparison Euramet.QM-K111 – Propane in
Nitrogen
J. Wouter van der Hout1, Adriaan M.H. van der Veen
1, Paul R. Ziel
1, Heinrich Kipphardt
2, Dirk Tuma
2, Michael
Maiwald2, Teresa E. Fernández
3, Concepción Gómez
3, Dariusz Cieciora
4, Grzegorz Ochman
4, Florbela Dias
5,
Victor Silvino5, Tatiana Macé
6, Christophe Sutour
6, Fabrice Marioni
6, Andreas Ackermann
7, Bernhard
Niederhauser7, Judit Fükő
8, Tamás Büki
8, Zsófia Nagyné Szilágyi
8, Tanıl Tarhan
9, Erinç Engin
9
1Van Swinden Laboratorium (VSL), Chemistry Group, Thijsseweg 11, 2629 JA Delft, The Netherlands
2 Bundesanstalt für Materialforschung und -prüfung (BAM), Unter den Eichen 87, 12205 Berlin, Germany
3Centro Español de Metrologia (CEM), Reference Material Laboratory, C / Alfar 2, 28760 Tres Cantos Madrid,
Spain
4Central Office of Measures (GUM), Elektoralna 2, 00-139 Warsaw, Poland
5Portuguese Institute of Quality (IPQ), Area Amount of Matter and Electrochemistry, Rua António Gião 2,2829
513 Caparica, Portugal 6Joint Laboratory of Metrology (LNE), 25 avenue Alber Bartolomé, 75015 Paris, France
7Federal Institute of Metrology (METAS), Sector Analytical Chemistry, Lindenweg 50, CH-3003 Bern Wabern,
Switzerland 8Magyar Kereskedelmi Engedéleyezési Hivatal (MKEH), Németvölgyi út 37-39, 1124 Budapest, Hungary
9National Metrology Institute TÜBİTAK (UME), Gas Metrology Laboratory, TÜBİTAK Gebze Yerleşkesi, Bariş
Mah. Dr. Zeki Acar Cad. No:1, 41470 Gebze Kocaeli, Turkey
Field
Amount-of-substance
Subject
Comparison of propane in nitrogen (track A – core competences)
Table of contents
Field ........................................................................................................................................................ 1
Subject .................................................................................................................................................... 1
Table of contents ..................................................................................................................................... 1
1 Introduction ..................................................................................................................................... 2
2 Design and organisation of the key comparison ............................................................................. 2
2.1 Participants .............................................................................................................................. 2 2.2 Measurement standards ........................................................................................................... 2 2.3 Measurement protocol............................................................................................................. 3 2.4 Schedule .................................................................................................................................. 3 2.5 Measurement equation ............................................................................................................ 3 2.6 Measurement methods ............................................................................................................ 5 2.7 Degrees of equivalence ........................................................................................................... 5
3 Results ............................................................................................................................................. 6
4 Discussion and conclusions ............................................................................................................ 7
References ............................................................................................................................................... 7
Coordinator ............................................................................................................................................. 8
Project reference ..................................................................................................................................... 8
Completion date ...................................................................................................................................... 8
Measurement report of BAM .............................................................................................................. 9 Measurement report of CEM ............................................................................................................ 12 Measurement report of GUM ............................................................................................................ 14

2
Measurement report of IPQ .............................................................................................................. 17 Measurement report of LNE ............................................................................................................. 19 Measurement report of METAS ....................................................................................................... 24 Measurement report of MKEH ......................................................................................................... 26 Measurement report of UME ............................................................................................................ 29 Measurement report of VSL ............................................................................................................. 32
1 Introduction
This key comparison belongs to a series of key comparisons in the field of gas analysis assessing core
competences (track A key comparisons). Such competences include, among others, the capabilities to
prepare Primary Standard Gas Mixtures (PSMs), to perform the necessary purity analysis on the
materials used in the gas mixture preparation, the verification of the composition of newly prepared
PSMs against existing ones, and last but not least the capability of calibrating a gas mixture.
For this key comparison, a binary mixture of propane in nitrogen has been chosen at an amount-of-
substance fraction level of 1000 µmol mol-1
[1]. The key comparison was organized in the same way
as previous comparisons on gravimetrically prepared mixtures [2].
2 Design and organisation of the key comparison
2.1 Participants
Table 1 lists the participants in this key comparison.
Table 1: List of participants
Acronym Country Institute
BAM DE Bundesanstalt für Materialforschung und -prüfung, Berlin,
Germany
CEM ES Centro Español de Metrología, Spanish Metrological Centre
Tres Cantos, Madrid, Spain
GUM PL Central Office of Measures, Warsaw, Poland
IPQ PT Instituto Português da Qualidade, Portuguese Institute of Quality
Monte de Caparica, Portugal
LNE FR Laboratoire national de métrologie et d'essais, Paris, France
METAS CH Federal Institute of Metrology, Bern Wabern, Switzerland
MKEH HU Magyar Kereskedelmi Engedélyezési Hivatal, Budapest,
Hungary
UME TR National Metrology Institute TÜBİTAK , Gebze Kocaeli, Turkey
VSL NL Van Swinden Laboratorium, Delft The Netherlands
2.2 Measurement standards
A set of mixtures was prepared gravimetrically by VSL. For the preparation propane was used from
Scott Specialty Gases grade 3.5 and nitrogen from Air Products, grade 6.0 respectively. The mixtures
to be distributed among the participants were verified against a set of VSL PSMs. The propane was
subjected to a purity analysis in accordance with ISO 19229 [3] prior to use for preparation of the gas
mixtures.
The filling pressure in the cylinders was approximately 100 bar. Aluminium cylinders of a 5 dm3
water volume from Luxfer UK with SpectaSeal treatment were used. The mixture composition and its
3
associated uncertainty were calculated in accordance with ISO 6142 [4]1. The amount-of-substance
fractions as obtained from gravimetry and purity verification of the parent gases were used as key
comparison reference values (KCRVs). Each cylinder had an individual reference value.
The nominal amount-of-substance fraction of propane was 1000 µmol/mol.
The verification measurements were carried out in accordance with ISO 6143 [5]. For this purpose,
the measurement standards were compared against VSL PSMs. The suites of PSMs used for the
various verification measurements differed, because of the replacement of some PSMs due to
depletion. In this key comparison, an approach has been chosen which resembles that of CCQM-K3
[5] and takes advantage of the work done in the gravimetry study CCQM-P41 [6].
2.3 Measurement protocol
The measurement protocol demanded from each laboratory to perform at least 3 measurements, with
independent calibrations. The replicates, leading to the result reported here, were to be carried out
under repeatability conditions. The protocol informed the participants about the nominal
concentration ranges. The laboratories were also requested to submit a summary of their uncertainty
evaluation used for calculating the uncertainty of their result.
2.4 Schedule
The schedule of this key comparison was as follows (table 2).
Table 2: Key comparison schedule
Date Stage
August 2014 Agreement on protocol
August 2014 Registration of participants
December 2014 Preparation of mixtures
January 2015 Verification of mixture compositions
January 2015 Dispatch of mixtures
April 2015 Reports and cylinder arrived at VSL
May 2015 Re-verification of the mixtures
July 2015 Draft A report available
November 2015 Draft B report available
2.5 Measurement equation
The key comparison reference values are based on the weighing data from gravimetry, and the purity
verification of the parent gases. All mixtures underwent verification prior to shipping them to the
participants. After return of the cylinders, they were verified a second time to reconfirm the stability
of the mixtures.
In the preparation, the following four groups of uncertainty components were considered:
1. gravimetric preparation (weighing process) (xi,grav)
2. purity of the parent gases (xi,purity)
3. stability of the gas mixture (xi,stab)
4. correction due to partial recovery of a component (xi,nr)
1 Once ISO 6142-1:2015 was published, VSL revisited its procedures which were based on the then valid
edition, ISO 6142:2001. This analysis showed that the procedures used in this key comparison are also
consistent with the requirements of ISO 6142-1:2015.
4
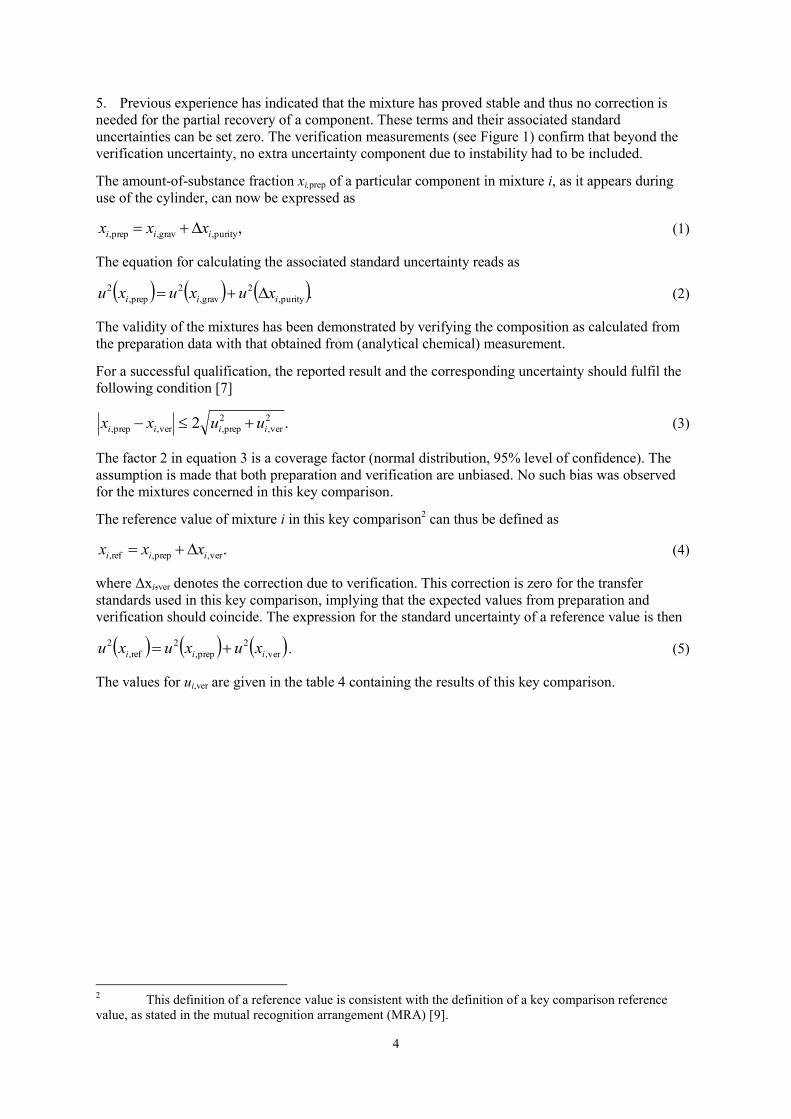
5. Previous experience has indicated that the mixture has proved stable and thus no correction is
needed for the partial recovery of a component. These terms and their associated standard
uncertainties can be set zero. The verification measurements (see Figure 1) confirm that beyond the
verification uncertainty, no extra uncertainty component due to instability had to be included.
The amount-of-substance fraction xi,prep of a particular component in mixture i, as it appears during
use of the cylinder, can now be expressed as
,purity,grav,prep, iii xxx (1)
The equation for calculating the associated standard uncertainty reads as
.purity,
2
grav,
2
prep,
2
iii xuxuxu (2)
The validity of the mixtures has been demonstrated by verifying the composition as calculated from
the preparation data with that obtained from (analytical chemical) measurement.
For a successful qualification, the reported result and the corresponding uncertainty should fulfil the
following condition [7]
.2 2
ver,
2
prep,ver,prep, iiii uuxx (3)
The factor 2 in equation 3 is a coverage factor (normal distribution, 95% level of confidence). The
assumption is made that both preparation and verification are unbiased. No such bias was observed
for the mixtures concerned in this key comparison.
The reference value of mixture i in this key comparison2 can thus be defined as
.ver,prep,ref, iii xxx (4)
where Δxi,ver denotes the correction due to verification. This correction is zero for the transfer
standards used in this key comparison, implying that the expected values from preparation and
verification should coincide. The expression for the standard uncertainty of a reference value is then
ver,
2
prep,
2
ref,
2
iii xuxuxu . (5)
The values for ui,ver are given in the table 4 containing the results of this key comparison.
2 This definition of a reference value is consistent with the definition of a key comparison reference
value, as stated in the mutual recognition arrangement (MRA) [9].

5
BA
M
CE
M
GU
M
IPQ
LN
E
ME
TA
S
MK
EH
UM
E
988
989
990
991
992
993
994
995
am
ount-
of-
substa
nce fra
ction p
ropane (
µm
ol/m
ol)
Laboratory
preparation
1st verificaton
2nd verificaton
Figure 1: Preparation and verification data of the transfer standards used in this key comparison
The preparation and verification data (see figure 1) agree well.
2.6 Measurement methods
The measurement methods used by the participants are described in annex A of this report. A
summary of the calibration methods, dates of measurement and reporting, and the modality of
establishing metrological traceability is given in table 3.
Table 3: Summary of calibration methods and metrological traceability
Laboratory
Code
Measurements Calibration Traceability Matrix
standards
Measurement
technique
MKEH 28/29/30 April 2015 One point
calibration
Own standards Nitrogen GC-FID
METAS 12/16/18 March 2015 ISO 6143 Own standards Nitrogen GC-FID
VSL 22/27 May 2014 and
11/12 June 2014
ISO 6143 Own standards
(ISO 6142)
Nitrogen GC-FID
IPQ 8/14/16 April 2015 ISO 6143 Own standards
(ISO 6142)
Nitrogen ND-IR
LNE 12/13/16 March 2015 Bracketing Own standards
(ISO 6142)
Nitrogen GC-TCD
CEM 23/29 April and
5 May 2015
ISO 6143 Own standards
(ISO 6142)
Nitrogen GC-FID
BAM 18/18/19/20/23/23
March 2015
Bracketing Own standards
(ISO 6142)
Nitrogen GC-TCD
GUM 4/4/5/5/16/19 February
and 5 March 2015
One point
calibration (5*)
+ ISO 6143 (2*)
Own standards
(ISO 6142)
Nitrogen GC-FID
UME 24/25/25/27/27 March
2015
ISO 6143 Own standards
(ISO 6142)
Nitrogen GC-FID
2.7 Degrees of equivalence
A unilateral degree of equivalence in key comparisons is defined as
,KCRVi,ii xxd (6)

6
and the uncertainty of the difference di at 95 % level of confidence. Here xi,KCRV denotes the key
comparison reference value, and xi the result of laboratory i.3 With reference to the special conditions
in gas analysis, it can be expressed as
.refi,ii xxd (7)
The standard uncertainty of di can be expressed as
,ver,
2
prep,
222
iiii xuxuxudu (8)
assuming that the aggregated error terms are uncorrelated. As discussed, the combined standard
uncertainty of the reference value comprises that from preparation and that from verification for the
mixture involved.
3 Results
In this section, the results of the key comparison are summarised. In the tables, the following data are
presented
xprep amount-of-substance fraction, from preparation (µmol/mol)
uprep uncertainty of xprep (µmol/mol)
uver uncertainty from verification (µmol/mol)
uref uncertainty of reference value (µmol/mol)
xlab result of laboratory (µmol/mol)
Ulab stated uncertainty of laboratory, at 95 % level of confidence (µmol/mol)
klab stated coverage factor
di difference between laboratory result and reference value (µmol/mol)
k assigned coverage factor for degree of equivalence
U(di) expanded uncertainty of difference di, at 95 % level of confidence4 (µmol/mol)
Table 4: Results of Euramet.QM-K111
Laboratory Cylinder xprep uprep uver uref xlab Ulab klab di k U(di)
MKEH 153259 993.15 0.26 0.35 0.44 1000.8 6.8 2 7.6 2 6.9
METAS 153322 993.69 0.27 0.35 0.44 996.0 4.0 2 2.3 2 4.1
VSL 153513 993.40 0.27 0.35 0.44 993.4 0.7 2 0.0 2 1.1
IPQ 153743 991.72 0.26 0.35 0.44 999.4 7.4 1.98 7.7 2 7.5
LNE 153769 991.01 0.27 0.35 0.44 991.1 1.8 2 0.1 2 2.0
CEM 153885 993.04 0.27 0.35 0.44 992.0 3.0 2 -1.0 2 3.1
BAM 153929 989.47 0.26 0.35 0.44 987.4 4.6 2 -2.1 2 4.7
GUM 153933 991.07 0.26 0.35 0.44 993.0 4.0 2 1.9 2 4.1
UME 178727 991.53 0.26 0.35 0.44 991.06 1.75 2 -0.5 2 2.0
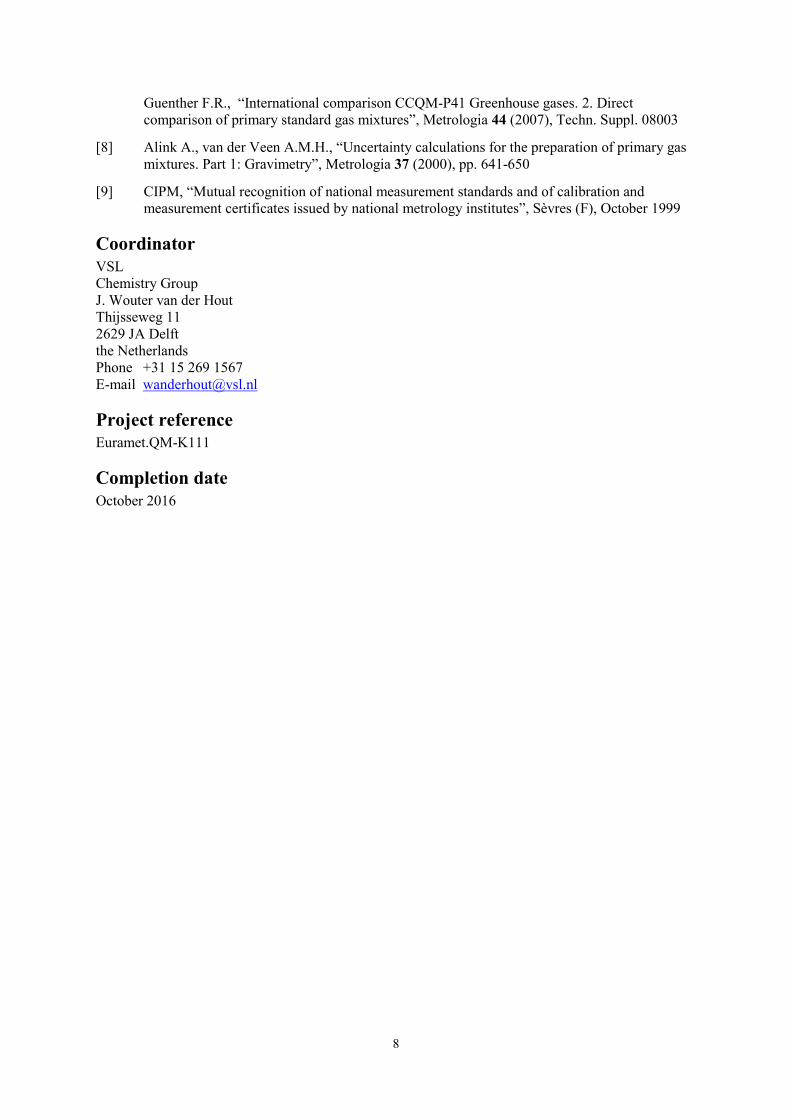
In figure 2 the degrees of equivalence for all participating laboratories are given relative to the
gravimetric value. The uncertainties are, as required by the MRA [9], given as 95% confidence
intervals. For the evaluation of uncertainty of the degrees of equivalence, the normal distribution has
been assumed, and a coverage factor k = 2 was used. For obtaining the standard uncertainty of the
laboratory results, the expanded uncertainty (stated at a confidence level of 95%) from the laboratory
was divided by the reported coverage factor.
3 Each laboratory has received one cylinder, so that the same index can be used for both a laboratory and
a cylinder. 4 As defined in the MRA [9], a degree of equivalence is given by x and U(x).

7
MKEH METAS VSL IPQ LNE CEM BAM GUM UME
-2
-1
0
1
2d
iffe
ren
ce
(%
)
Laboratory
Figure 2: Degrees of equivalence
4 Discussion and conclusions
The results in this Track A key comparison on 1000 µmol mol-1
are generally good. Two laboratories
report results that are slightly inconsistent with the KCRV, but all results are within ± 1 % of the
KCRV.
References
[1] Van der Veen A.M.H., Van der Hout J.W., Ziel P.R., Oudwater R.J., Fioravante A.L.,
Augusto C.R., Brum M.C., Uehara S., Akima D., Bae H.K., Kang N., Woo J.C., Liaskos C.E.,
Roderick G.C., Brewer P.H., Brown A.S., Bartlett S., Downey M.L., Konopelko L.A.,
Kolobova A.V., Pankov A.A., Orshanskaya A.A., Efremova O.V., “International Comparison
CCQM-K111 – Propane in nitrogen”, Final Report, Metrologia Technical Supplement 54
(2017), 08009
[2] Alink A., “The first key comparison of primary standard gas mixtures”, Metrologia 37 (2000),
pp. 35-49
[3] International Organization for Standardization, ISO 19229:2015 Gas analysis − Purity
analysis and the treatment of purity data, ISO Geneva, 2015
[4] International Organization for Standardization, ISO 6142:2001 Gas analysis − Preparation of
calibration gas mixtures - Gravimetric methods, ISO Geneva, 2001
[5] International Organization for Standardization, “ISO 6143:2001 Gas analysis − Comparison
methods for determining and checking the composition of calibration gas mixtures”, ISO
Geneva, 2001
[6] Van der Veen A.M.H, van Wijk J.I.T., van Otterloo R.P., Wessel R.M., de Leer E.W.B.,
Perrochet J.-F., Wang Lin Zhen, Heine H.-J., Knopf D., Richter W., Barbe J., Marschal A.,
Vargha G., Deák E., Maruyama M.,Takahashi C., Kim J.S., Kim Y.D., Kim B.M., Kustikov
Yu.A., Khatskevitch E.A., Pankratov V.V., Popova T.A., Konopelko L., Musil S., Holland P.,
Milton M.J.T., Miller W.R., Guenther F.R., “International Comparison CCQM-K3, Final
Report”, BIPM, 2000; van der Veen A.M.H., “CCQM key comparison CCQM-K3 of
measurements of CO, CO2, and C3H8 in N2”, Metrologia 39 (2002), pp. 121-122
[7] Van der Veen A.M.H., Brinkmann F.N.C., Arnautovic M., Besley L., Heine H.-J., Lopez
Esteban T., Sega M., Kato K., Kim J.S., Perez Castorena A., Rakowska A., Milton M.J.T.,
8
Guenther F.R., “International comparison CCQM-P41 Greenhouse gases. 2. Direct
comparison of primary standard gas mixtures”, Metrologia 44 (2007), Techn. Suppl. 08003
[8] Alink A., van der Veen A.M.H., “Uncertainty calculations for the preparation of primary gas
mixtures. Part 1: Gravimetry”, Metrologia 37 (2000), pp. 641-650
[9] CIPM, “Mutual recognition of national measurement standards and of calibration and
measurement certificates issued by national metrology institutes”, Sèvres (F), October 1999
Coordinator
VSL
Chemistry Group
J. Wouter van der Hout
Thijsseweg 11
2629 JA Delft
the Netherlands
Phone +31 15 269 1567
E-mail [email protected]
Project reference
Euramet.QM-K111
Completion date
October 2016

9
Measurement report of BAM
Laboratory name: Bundesanstalt für Materialforschung und -prüfung (BAM)
Cylinder number: 153929
1) Background
EURAMET.QM-K111 is a regional interlaboratory comparison organized by VSL succeeding and
linked to CCQM-K111. CCQM-K111 classified as a core comparison of GAWG was conducted in
2014 and due to capacity reasons has not been opened to all potentially interested participants.
2) Choice of method
For the determination of propane in nitrogen the method of choice is GC with TCD or FID detection.
Although FID could provide smaller uncertainties at that concentration level, it was decided at BAM
to use the Siemens Maxum II gas analyser, which is equipped with TCD detection only.
3) Sample: labeling, packing, pre-information
The sample was provided from VSL in a 5 L cylinder with the cylinder number NMI 153929 with a
DIN 477 thread No. 1 (hydrogen). The initial (and final) pressure was not measured.
4) Sample pretreatment No heating or rolling was applied.
5) Devices used and flushing
A DIN 477 No. 1 (hydrogen)-VRC ¼″ fitting was adapted to the sample cylinder. A reduction valve,
a needle valve for dosing, and a closing valve with an outlet to Swagelok 1/16″ capillaries were
attached. For the two simultaneously employed calibration gases a similar assembly was used. The
assembly for the sample cylinder was not changed during the entire measuring campaign, the
assembly of the individual calibration gases used had to be changed (i.e., disconnected/connected).
A freshly installed assembly was evacuated down to a pressure of approximately 10–3
mbar and then
filled with gas from the cylinder. The evacuating/flushing was repeated five times.
6) Measurement instruments and settings
A specially designed Siemens Maxum II process gas analyser was used applying “method 1” which
executes a sequence of 44 injections. The oven was set to 60 oC and operated in isothermal mode. The
dosing volume of each injection was 240 µL. Details on Maxum operation can be found in the BAM
SOP “GAS-StAA-027”.
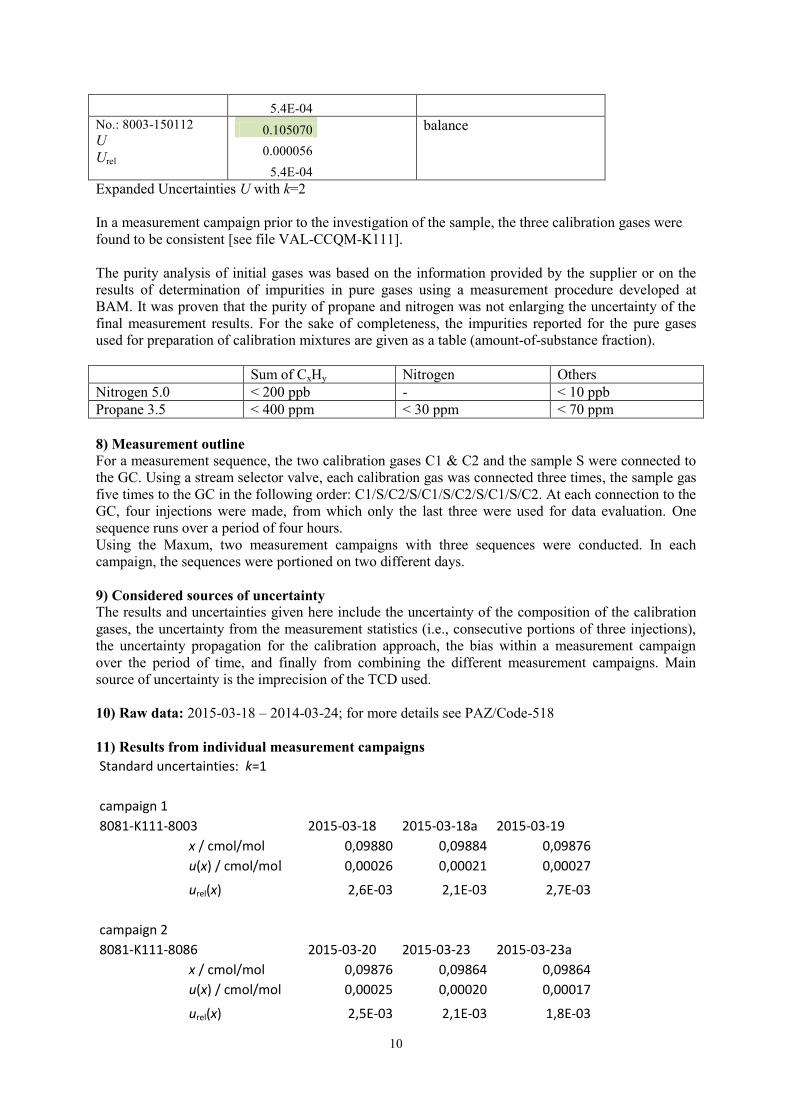
7) Calibration Three starting mixtures prepared from high-purity propane (grade 3.5) and high-purity nitrogen (grade
5.0) were further diluted in two steps by a gravimetric method according to DIN EN ISO 6142:2006.
The resulting three calibration gases are:
Cylinder Amount-of-substance
fraction
propane / cmol/mol
Amount-of-substance
fraction
nitrogen / cmol/mol No.: 8081-150119
U
Urel
0.095046
0.000051
5.4E-04
balance
No.: 8086-150105
U
Urel
0.099997
0.000054
balance
10
5.4E-04
No.: 8003-150112
U
Urel
0.105070
0.000056
5.4E-04
balance
Expanded Uncertainties U with k=2
In a measurement campaign prior to the investigation of the sample, the three calibration gases were
found to be consistent [see file VAL-CCQM-K111].
The purity analysis of initial gases was based on the information provided by the supplier or on the
results of determination of impurities in pure gases using a measurement procedure developed at
BAM. It was proven that the purity of propane and nitrogen was not enlarging the uncertainty of the
final measurement results. For the sake of completeness, the impurities reported for the pure gases
used for preparation of calibration mixtures are given as a table (amount-of-substance fraction).
Sum of CxHy Nitrogen Others
Nitrogen 5.0 < 200 ppb - < 10 ppb
Propane 3.5 < 400 ppm < 30 ppm < 70 ppm
8) Measurement outline For a measurement sequence, the two calibration gases C1 & C2 and the sample S were connected to
the GC. Using a stream selector valve, each calibration gas was connected three times, the sample gas
five times to the GC in the following order: C1/S/C2/S/C1/S/C2/S/C1/S/C2. At each connection to the
GC, four injections were made, from which only the last three were used for data evaluation. One
sequence runs over a period of four hours.
Using the Maxum, two measurement campaigns with three sequences were conducted. In each
campaign, the sequences were portioned on two different days.
9) Considered sources of uncertainty
The results and uncertainties given here include the uncertainty of the composition of the calibration
gases, the uncertainty from the measurement statistics (i.e., consecutive portions of three injections),
the uncertainty propagation for the calibration approach, the bias within a measurement campaign
over the period of time, and finally from combining the different measurement campaigns. Main
source of uncertainty is the imprecision of the TCD used.
10) Raw data: 2015-03-18 – 2014-03-24; for more details see PAZ/Code-518
11) Results from individual measurement campaigns
Standard uncertainties: k=1
campaign 1 8081-K111-8003 2015-03-18 2015-03-18a 2015-03-19
x / cmol/mol 0,09880 0,09884 0,09876
u(x) / cmol/mol 0,00026 0,00021 0,00027
urel(x) 2,6E-03 2,1E-03 2,7E-03
campaign 2 8081-K111-8086 2015-03-20 2015-03-23 2015-03-23a
x / cmol/mol 0,09876 0,09864 0,09864
u(x) / cmol/mol 0,00025 0,00020 0,00017
urel(x) 2,5E-03 2,1E-03 1,8E-03

11
The consistency of the measurement campaigns is very good. The results from the two campaigns do
not differ significantly, all results were pooled.
Standard uncertainties: k=1
campaign 1 campaign 2 all campaigns
x / cmol/mol 0,09880 0,09868 0,09874
u(x) / cmol/mol 0,00024 0,00021 0,00023
urel(x) 2,5E-03 2,1E-03 2,3E-03
12) Consolidated results
From the two measurement campaigns, the amount-of-substance fraction of propane in the cylinder
NMI 153929 is:
x( C3H8, NMI 153929) = ( 0.098 74 ± 0.000 46 ) cmol/mol
Given is the expanded measurement uncertainty U =k uc with k = 2 according to the ISO/BIPM
Guide to the Expression of Uncertainty in Measurement. Values obtained from the individual
measurement campaigns are given in section 11.
13) Remarks The measurement result obtained seems to be compatible with the announced target value of 0.1
cmol/mol.
14) Responsibility
The calibration gases have been prepared by the filling team consisting of Claudia Boissière, Kerstin
Köster, Jeannette Pelchen, under supervision of Dr. Dirk Tuma. The measurements using the Maxum
II gas chromatograph have been performed by Jeannette Pelchen. Reporting and calculations have
been performed by Dr. Heinrich Kipphardt. Advice was given by Dr. Wolfram Bremser and Dr.
Michael Maiwald.
The overall technical responsibility for the measurement result is with Dr. Heinrich Kipphardt.
Berlin, 2015-04-30 Heinrich Kipphardt FB 1.4
15) Additional information
Customer: VSL, EURAMET.QM-K111
PAZ-No. -
Sample arrival: 2013-03-05
Internal No.: Code-518
Sample No.: NMI 153929
Task: Determination of propane amount-of-substance fraction
Period of measurement: 2015-03-18 – 2013-03-24
Location: Building 42 Room 049
Method: GC with TCD

12
Measurement report of CEM
Laboratory name: Centro Español de Metrología (CEM)
Cylinder number: 153885
Measurement #1
Component Date
(dd/mm/yy)
Result
(µmol/mol)
Standard deviation
(% relative)
number of replicates
Propane 23/04/15 992.67 0.05 6
Measurement #2
Component Date
(dd/mm/yy)
Result
(µmol/mol)
Standard deviation
(% relative)
number of replicates
Propane 29/04/15 991.52 0.06 6
Measurement #3
Component Date
(dd/mm/yy)
Result
(µmol/mol)
Standard deviation
(% relative)
number of replicates
Propane 05/05/15 991.69 0.04 6
Results
Component Date
(dd/mm/yy)
Result
(µmol/mol)
Expanded uncertainty
(µmol/mol)
Coverage factor
Propane 02/10/2015 992.0 3.0 2
Calibration standards
‒ Method of preparation: A set of primary standard gas mixtures (PSMs) were prepared
according the gravimetric method described in ISO 6142. All PSMs are binary mixtures in
nitrogen and the three calibration standards were prepared in a two stage dilution process.
PSM xC3H8 assigned value
(mol/mol)
uC3H8 (mol/mol)
MRP292346 901.1 1.8
MRP292345 1002.2 1.5
MRP292344 1102.2 1.7
‒ Weighing data: In the case of PSM MRP292345, the mixture was prepared weighing 21.44 g
from a 0.035 mol/mol pre-mixture and 711.46 g nitrogen. All weights were over 20 g.
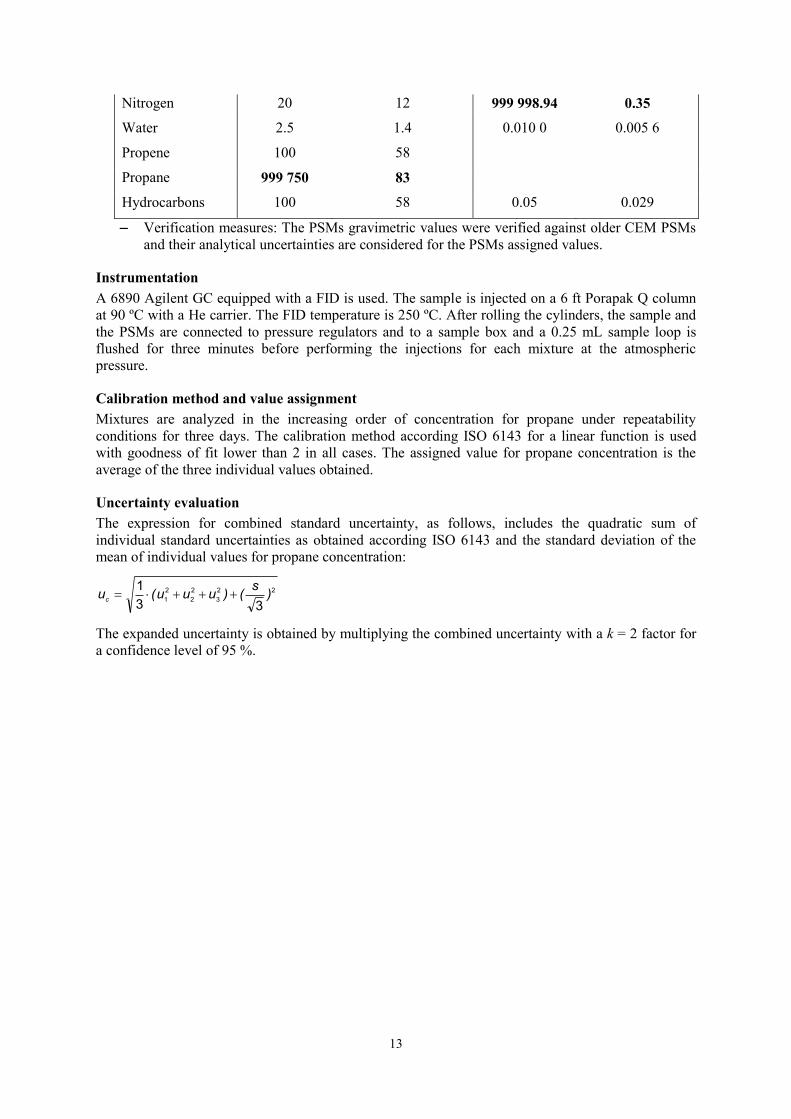
‒ Purity tables (composition) of the parent gases:
PROPANE (3.5) - Air Liquide NITROGEN (BIP) - Air Products
COMPONENT xi (mol/mol) ui (mol/mol) xi (mol/mol) ui (mol/mol)
Carbon monoxide 0.25 0.14
Carbon dioxide 2.5 1.4 0.25 0.14
Hydrogen 20 12 0.50 0.29
Oxygen 5.0 2.9 0.005 0 0.002 9
13
Nitrogen 20 12 999 998.94 0.35
Water 2.5 1.4 0.010 0 0.005 6
Propene 100 58
Propane 999 750 83
Hydrocarbons 100 58 0.05 0.029
‒ Verification measures: The PSMs gravimetric values were verified against older CEM PSMs
and their analytical uncertainties are considered for the PSMs assigned values.
Instrumentation
A 6890 Agilent GC equipped with a FID is used. The sample is injected on a 6 ft Porapak Q column
at 90 ºC with a He carrier. The FID temperature is 250 ºC. After rolling the cylinders, the sample and
the PSMs are connected to pressure regulators and to a sample box and a 0.25 mL sample loop is
flushed for three minutes before performing the injections for each mixture at the atmospheric
pressure.
Calibration method and value assignment
Mixtures are analyzed in the increasing order of concentration for propane under repeatability
conditions for three days. The calibration method according ISO 6143 for a linear function is used
with goodness of fit lower than 2 in all cases. The assigned value for propane concentration is the
average of the three individual values obtained.
Uncertainty evaluation
The expression for combined standard uncertainty, as follows, includes the quadratic sum of
individual standard uncertainties as obtained according ISO 6143 and the standard deviation of the
mean of individual values for propane concentration:
22
3
2
2
2
1
33
1)
s()uuu(u
c
The expanded uncertainty is obtained by multiplying the combined uncertainty with a k = 2 factor for
a confidence level of 95 %.
14
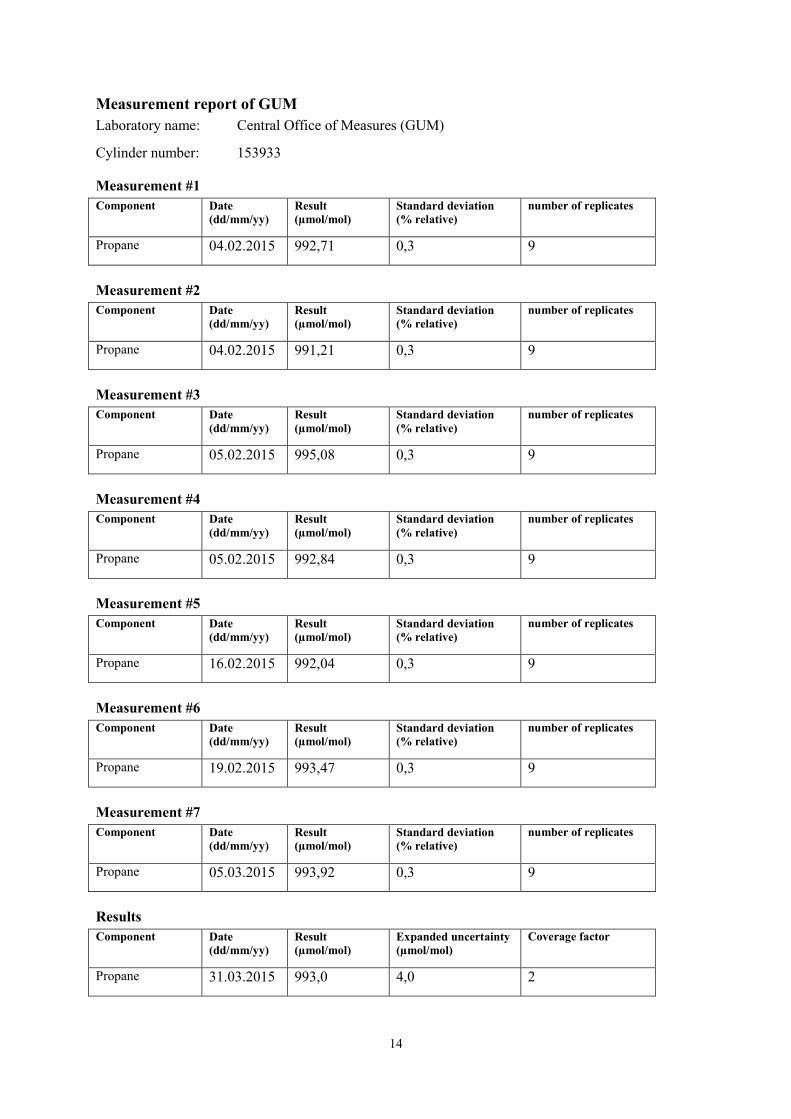
Measurement report of GUM
Laboratory name: Central Office of Measures (GUM)
Cylinder number: 153933
Measurement #1
Component Date
(dd/mm/yy)
Result
(µmol/mol)
Standard deviation
(% relative)
number of replicates
Propane 04.02.2015 992,71 0,3 9
Measurement #2
Component Date
(dd/mm/yy)
Result
(µmol/mol)
Standard deviation
(% relative)
number of replicates
Propane 04.02.2015 991,21 0,3 9
Measurement #3
Component Date
(dd/mm/yy)
Result
(µmol/mol)
Standard deviation
(% relative)
number of replicates
Propane 05.02.2015 995,08 0,3 9
Measurement #4
Component Date
(dd/mm/yy)
Result
(µmol/mol)
Standard deviation
(% relative)
number of replicates
Propane 05.02.2015 992,84 0,3 9
Measurement #5
Component Date
(dd/mm/yy)
Result
(µmol/mol)
Standard deviation
(% relative)
number of replicates
Propane 16.02.2015 992,04 0,3 9
Measurement #6
Component Date
(dd/mm/yy)
Result
(µmol/mol)
Standard deviation
(% relative)
number of replicates
Propane 19.02.2015 993,47 0,3 9
Measurement #7
Component Date
(dd/mm/yy)
Result
(µmol/mol)
Standard deviation
(% relative)
number of replicates
Propane 05.03.2015 993,92 0,3 9
Results
Component Date
(dd/mm/yy)
Result
(µmol/mol)
Expanded uncertainty
(µmol/mol)
Coverage factor
Propane 31.03.2015 993,0 4,0 2
15
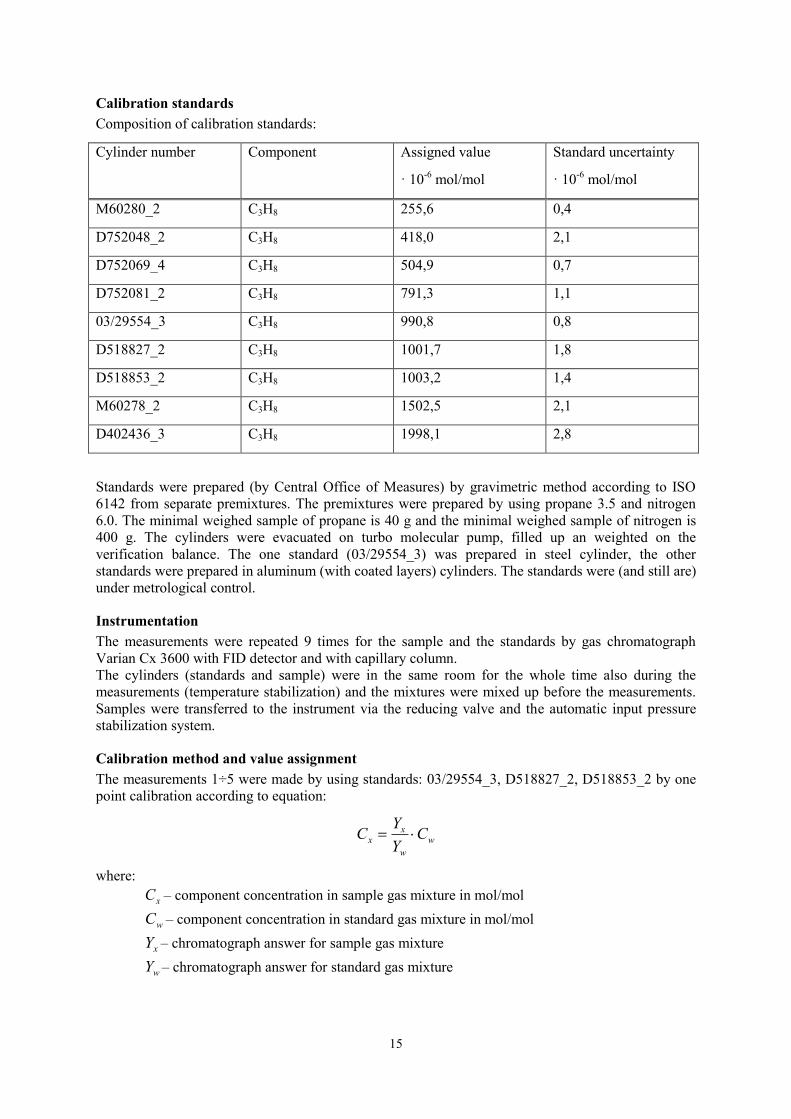
Calibration standards
Composition of calibration standards:
Cylinder number Component Assigned value
· 10-6
mol/mol
Standard uncertainty
· 10-6
mol/mol
M60280_2 C3H8 255,6 0,4
D752048_2 C3H8 418,0 2,1
D752069_4 C3H8 504,9 0,7
D752081_2 C3H8 791,3 1,1
03/29554_3 C3H8 990,8 0,8
D518827_2 C3H8 1001,7 1,8
D518853_2 C3H8 1003,2 1,4
M60278_2 C3H8 1502,5 2,1
D402436_3 C3H8 1998,1 2,8
Standards were prepared (by Central Office of Measures) by gravimetric method according to ISO
6142 from separate premixtures. The premixtures were prepared by using propane 3.5 and nitrogen
6.0. The minimal weighed sample of propane is 40 g and the minimal weighed sample of nitrogen is
400 g. The cylinders were evacuated on turbo molecular pump, filled up an weighted on the
verification balance. The one standard (03/29554_3) was prepared in steel cylinder, the other
standards were prepared in aluminum (with coated layers) cylinders. The standards were (and still are)
under metrological control.
Instrumentation
The measurements were repeated 9 times for the sample and the standards by gas chromatograph
Varian Cx 3600 with FID detector and with capillary column.
The cylinders (standards and sample) were in the same room for the whole time also during the
measurements (temperature stabilization) and the mixtures were mixed up before the measurements.
Samples were transferred to the instrument via the reducing valve and the automatic input pressure
stabilization system.
Calibration method and value assignment
The measurements 1÷5 were made by using standards: 03/29554_3, D518827_2, D518853_2 by one
point calibration according to equation:
w
w
xx C
Y
YC
where:
xC – component concentration in sample gas mixture in mol/mol
wC – component concentration in standard gas mixture in mol/mol
xY – chromatograph answer for sample gas mixture
wY – chromatograph answer for standard gas mixture

16
The measurements 6 and 7 were made by calibration method according to ISO 6143 by using standards:
M60280_2, D752048_2, D752069_4, D752081_2, D518827_2, M60278_2, D402436_3. The
calibration curve was calculated from ratios by the software B_leats.exe (linear case). Measurement sequence:
standards (for calculation of calibration curve) and sample.
Uncertainty evaluation
The final uncertainty, consists of the following components:
- the uncertainty of standard preparation calculated according to ISO 6142
- the standard deviation of the measurement
Resolution of the chromatograph is negligible.

17
Measurement report of IPQ
Laboratory name: Instituto Português da Qualidade (IPQ) Cylinder number: 153743 NOMINAL COMPOSITION - Propane : 1000 ×10
-6 mol/mol
- Nitrogen : matrix
Measurement No. 1
Date
Result (10
-6 mol/mol)
stand. deviation (% relative)
number of sub- measurements
C3H8 08-04-2015 999,0 0,1 3
Measurement No. 2
Date
Result (10
-6 mol/mol)
stand. deviation (% relative)
number of sub- measurements
C3H8 14-04-2015 999,7 0,1 3
Measurement No. 3
Date
Result (10
-6 mol/mol)
stand. deviation (% relative)
number of sub- measurements
C3H8 16-04-2015 999,7 0,3 3
Results:
Gas mixture
Result (assigned value) (10
-6 mol/mol)
Coverage factor
Assigned expanded uncertainty (10
-6 mol/mol)
C3H8 999,4 1,98 7,4
Reference Method: Non Dispersive Infrared Spectroscopy (NDIR): Analyzer: URAS 4 Data Collection: Auto-sampler - Software Sira version 2.0 Calibration Standards: The preparation was done according to ISO 6142:2001- Gravimetric method The estimated uncertainty was done according ISO GUM: 2005 “Guide to the Expression of Uncertainty in Measurement”. Composition of calibrants:
Propane cylinder Assigned value(x) (x10-6
mol/mol) Standard uncertainty (u(x)) (x10
-6 mol/mol)
NMI2714 200,1 0,8
PSM108966 520,7 1,5
PSM308339 599,7 1,6
PSM202605 1010,7 2,2
Instrument Calibration: The calibration instrument was done according to ISO 6143. We have used the B_Least program to determine the best model for data handling. All components of mixture have a goodness of fit less than 2 using a linear or quadratic function. For all components were used a set of four PSM. At least three repeated analyses were performed in three independent days. Manual calibration (zero and span are calibrated separately by pressing the analyzer system display and control unit softkeys). Sample Handling:
18
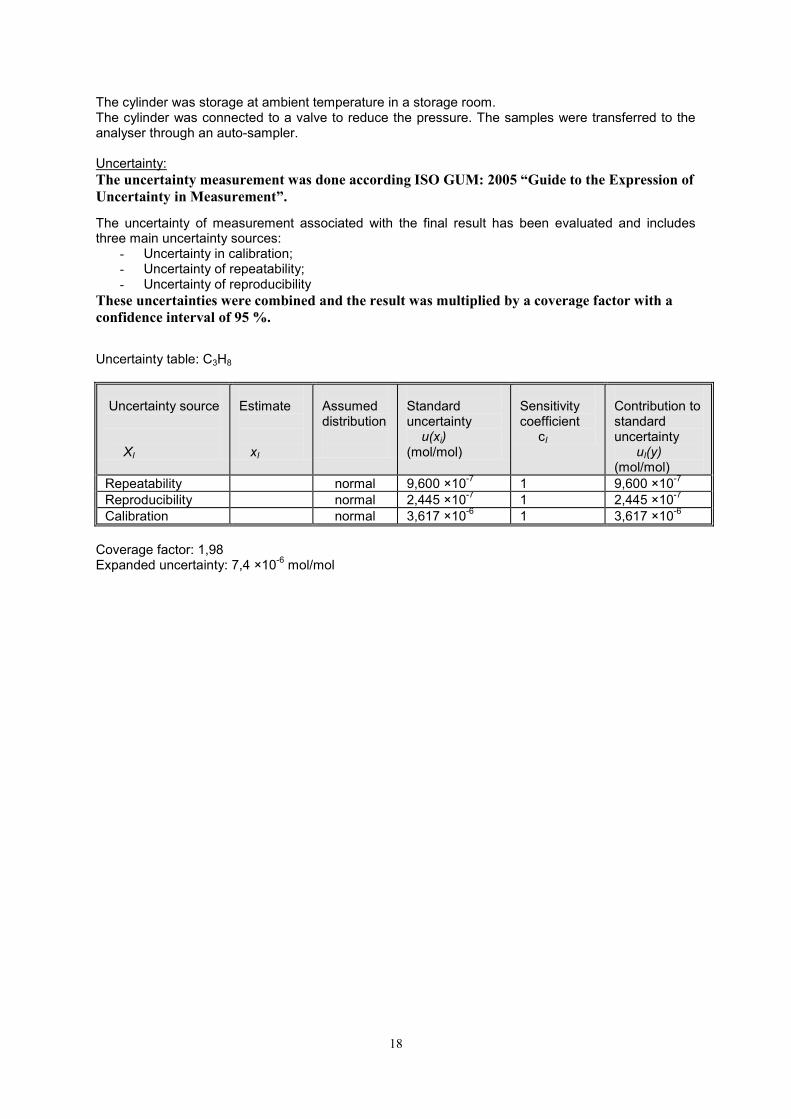
The cylinder was storage at ambient temperature in a storage room. The cylinder was connected to a valve to reduce the pressure. The samples were transferred to the analyser through an auto-sampler. Uncertainty:
The uncertainty measurement was done according ISO GUM: 2005 “Guide to the Expression of
Uncertainty in Measurement”.
The uncertainty of measurement associated with the final result has been evaluated and includes three main uncertainty sources:
- Uncertainty in calibration; - Uncertainty of repeatability; - Uncertainty of reproducibility
These uncertainties were combined and the result was multiplied by a coverage factor with a
confidence interval of 95 %.
Uncertainty table: C3H8
Uncertainty source XI
Estimate xI
Assumed distribution
Standard uncertainty u(xi) (mol/mol)
Sensitivity coefficient cI
Contribution to standard uncertainty uI(y) (mol/mol)
Repeatability normal 9,600 ×10-7
1 9,600 ×10-7
Reproducibility normal 2,445 ×10-7
1 2,445 ×10-7
Calibration normal 3,617 ×10-6
1 3,617 ×10-6
Coverage factor: 1,98 Expanded uncertainty: 7,4 ×10
-6 mol/mol

19
Measurement report of LNE
Laboratory name: Laboratoire national de métrologie et d'essais (LNE)
Cylinder number: N°153769SG
Measurement #1
Component Date
(dd/mm/yy)
Result
(µmol/mol)
Standard deviation
(% relative)
number of replicates
Propane 12/03/15 991.00 0.05 3
Measurement #2
Component Date
(dd/mm/yy)
Result
(µmol/mol)
Standard deviation
(% relative)
number of replicates
Propane 13/03/15 991.17 0.11 3
Measurement #3
Component Date
(dd/mm/yy)
Result
(µmol/mol)
Standard deviation
(% relative)
number of replicates
Propane 16/03/15 991.07 0.06 3
Results
Component Date
(dd/mm/yy)
Result
(µmol/mol)
Expanded uncertainty
(µmol/mol)
Coverage factor
Propane 991.1 1.8 2
Calibration standards
The reference gas mixtures were prepared according to the gravimetric preparation method ISO 6142
from pure gases (propane and nitrogen).
A first high concentration gas mixture was prepared at about 2.6 10-2
mol/mol (C3H8/N2 0031) and
was diluted by the gravimetric method to prepare a gas mixture of propane in nitrogen at about
1000 µmol/mol (C3H8/N2 0032).
The mass of each component was determined by weighing the cylinder on a Mettler mass comparator
(32 kg with a resolution of 0.1 mg).
The purities of all used gases and the values of the masses introduced are shown in the following
tables.

20
Gravimetric composition of cylinder C3H8_N2_0032
Date: 09/03/2015
Time: 16:45:13
Operator: fm Mixture prepared by: lne
Lab book: le 09/03/15
OUTPUTS
=======
Component µmol/mol uncertainty % u/c
---------------------------------------------------------
N2 999004.5931 0.41030628 0.000
propane 995.0880162 0.38532651 0.039
propene 0.09953369 0.05746023 57.729
CnHm 0.09953369 0.05745997 57.729
H2 0.04488185 0.01799978 40.105
methane 0.02497512 0.01385279 55.466
CO2 0.01497590 0.00709266 47.361
CO 0.01248756 0.00694564 55.620
H2O 0.01247839 0.05562212 445.748
O2 0.00997171 0.00399818 40.095
N2O 0.00000599 0.00000144 24.073
INPUTS
======
File Mass (g) u/c (g)
--------------------------------------
melanges\C3H8_N2 60.05484 0.01700
Pur\N2_bip.txt 1468.434 0.02000
INPUT DATA FILES
================
°°°°°°°°°° melanges\C3H8_N2_0031.txt °°°°°°°°°°°
Component mol/mol uncertainty
------------------------------------------------
N2 0.9743086236 0.0000076518
propane 0.0256853796 0.0000073469
propene 0.0000025692 0.0000014832
CnHm 0.0000025692 0.0000014832
H2 0.0000005382 0.0000002970
O2 0.0000001333 0.0000000742
CO2 0.0000000764 0.0000000377
H2O 0.0000000740 0.0000000674
methane 0.0000000244 0.0000000140
CO 0.0000000122 0.0000000070
N2O 0.0000000000 0.0000000000

21
°°°°°°°°°°°°°°°° Pur\N2_bip.txt °°°°°°°°°°°°°°°°
Component mol/mol uncertainty
------------------------------------------------
N2 0.9999999100 0.0000000520
O2 0.0000000050 0.0000000029
H2O 0.0000000100 0.0000000578
methane 0.0000000250 0.0000000144
CO2 0.0000000125 0.0000000072
CO 0.0000000125 0.0000000072
H2 0.0000000250 0.0000000144
N2O 0.0000000000 0.0000000000
Gravimetric composition of cylinder C3H8_N2_0031
Date: 11/02/2015
Time: 11:10:36
Operator: fm Mixture prepared by: lne
Lab book: le 28/01/2015
OUTPUTS
=======
Component µmol/mol uncertainty % u/c
---------------------------------------------------------
N2 974308.6236 7.65181592 0.001
propane 25685.37962 7.34689348 0.029
propene 2.56918026 1.48317849 57.730
CnHm 2.56918026 1.48317189 57.729
H2 0.53819376 0.29699459 55.184
O2 0.13333055 0.07422027 55.666
CO2 0.07640836 0.03774477 49.399
H2O 0.07397259 0.06742824 91.153
methane 0.02435770 0.01403004 57.600
CO 0.01217885 0.00703451 57.760
N2O 0.00000585 0.00000146 25.000
INPUTS
======
File Mass (g) u/c (g)
--------------------------------------
Pur\C3H8pur_0004 60.65832 0.01700
Pur\N2_bip.txt 1461.431 0.02000
22
INPUT DATA FILES
================
°°°°°°°°°°°°° Pur\C3H8pur_0004.txt °°°°°°°°°°°°°
Component mol/mol uncertainty
------------------------------------------------
propane 0.9997500000 0.0000833417
CO2 0.0000025000 0.0000014434
propene 0.0001000000 0.0000577350
O2 0.0000050000 0.0000028868
N2 0.0000200000 0.0000115470
H2O 0.0000025000 0.0000014434
H2 0.0000200000 0.0000115470
CnHm 0.0001000000 0.0000577350
°°°°°°°°°°°°°°°° Pur\N2_bip.txt °°°°°°°°°°°°°°°°
Component mol/mol uncertainty
------------------------------------------------
N2 0.9999999100 0.0000000520
O2 0.0000000050 0.0000000029
H2O 0.0000000100 0.0000000578
methane 0.0000000250 0.0000000144
CO2 0.0000000125 0.0000000072
CO 0.0000000125 0.0000000072
H2 0.0000000250 0.0000000144
N2O 0.0000000000 0.0000000000
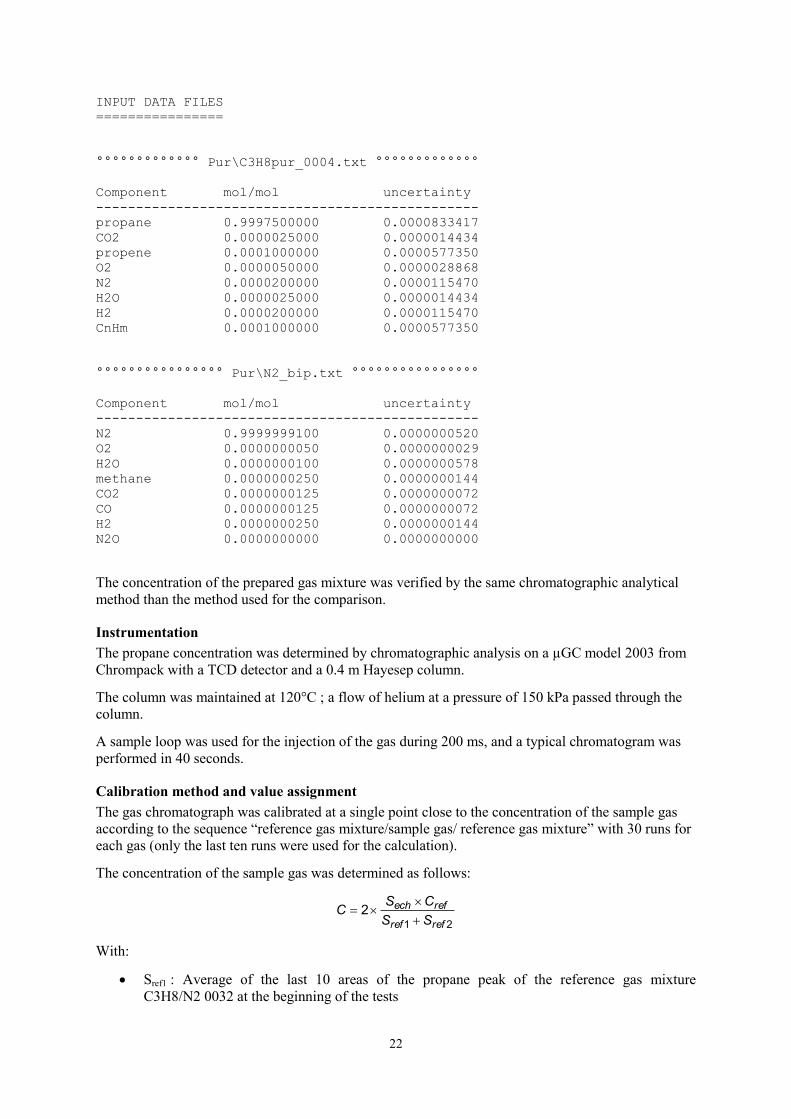
The concentration of the prepared gas mixture was verified by the same chromatographic analytical
method than the method used for the comparison.
Instrumentation
The propane concentration was determined by chromatographic analysis on a µGC model 2003 from
Chrompack with a TCD detector and a 0.4 m Hayesep column.
The column was maintained at 120°C ; a flow of helium at a pressure of 150 kPa passed through the
column.
A sample loop was used for the injection of the gas during 200 ms, and a typical chromatogram was
performed in 40 seconds.
Calibration method and value assignment
The gas chromatograph was calibrated at a single point close to the concentration of the sample gas
according to the sequence “reference gas mixture/sample gas/ reference gas mixture” with 30 runs for
each gas (only the last ten runs were used for the calculation).
The concentration of the sample gas was determined as follows:
21
2refref
refech
SS
CSC
With:
Sref1 : Average of the last 10 areas of the propane peak of the reference gas mixture
C3H8/N2 0032 at the beginning of the tests
23
Sech : Average of the last 10 areas of the propane peak of the sample gas N°153769 SG
Sref2 : Average of the last 10 areas of the propane peak of the reference gas mixture
C3H8/N2 0032 at the end of the tests
Cref : Concentration of the reference gas mixture C3H8/N2 0032
The procedure is repeated three times per day and on 3 different days.
The final concentration is the average of the three determinations obtained on the 3 different days.
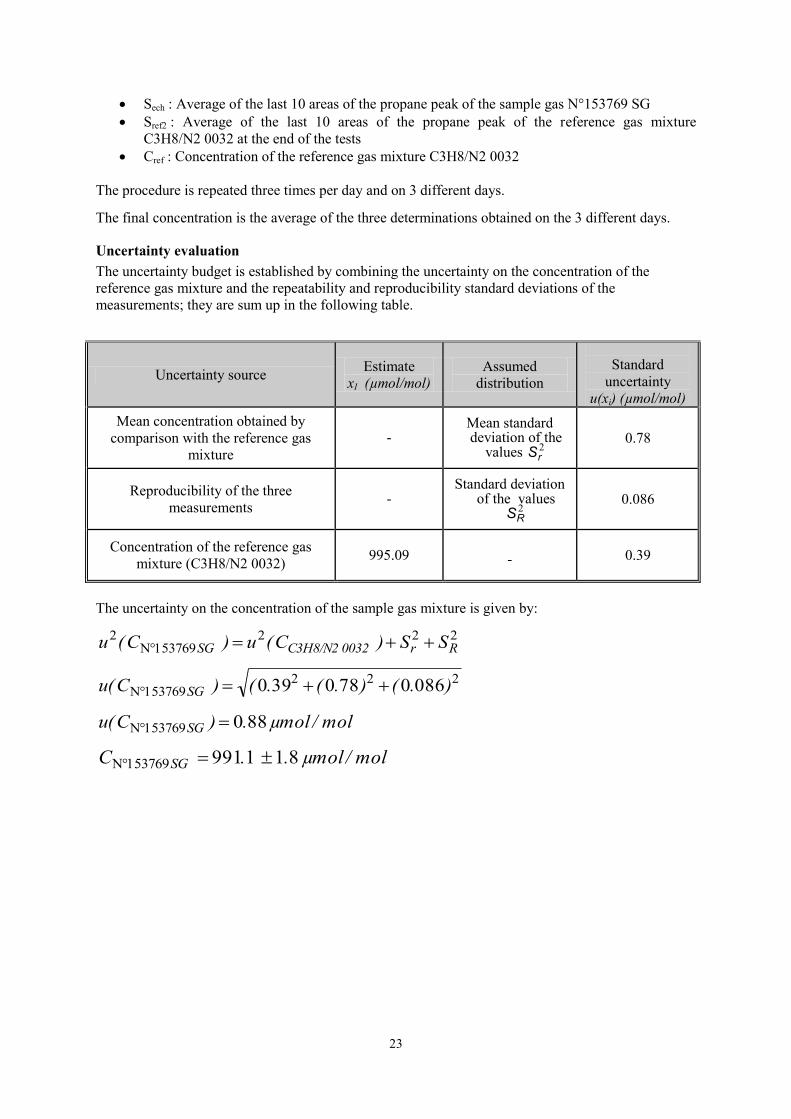
Uncertainty evaluation
The uncertainty budget is established by combining the uncertainty on the concentration of the
reference gas mixture and the repeatability and reproducibility standard deviations of the
measurements; they are sum up in the following table.
Uncertainty source Estimate
xI (µmol/mol)
Assumed
distribution
Standard
uncertainty
u(xi) (µmol/mol)
Mean concentration obtained by
comparison with the reference gas
mixture
- Mean standard deviation of the
values 2rS
0.78
Reproducibility of the three
measurements -
Standard deviation of the values
2RS
0.086
Concentration of the reference gas
mixture (C3H8/N2 0032) 995.09 - 0.39
The uncertainty on the concentration of the sample gas mixture is given by:
2222Rr0032 C3H8/N2SG SS) C(u)C(u
222 0860780390 ).().(.()C(u SG
mol/µmol .)C(u SG 880
mol/µmol . .C SG 811991

24
Measurement report of METAS
Laboratory name: Federal Institute of Metrology METAS
Cylinder number: VSL 153322
Measurement #1
Component Date
(dd/mm/yy)
Result
(µmol/mol)
Standard deviation
(% relative)
number of replicates
Propane 12.03.2015 996.1 0.01 4
Measurement #2
Component Date
(dd/mm/yy)
Result
(µmol/mol)
Standard deviation
(% relative)
number of replicates
Propane 16.03.2015 996.1 0.01 4
Measurement #3
Component Date
(dd/mm/yy)
Result
(µmol/mol)
Standard deviation
(% relative)
number of replicates
Propane 18.03.2015 996.0 0.01 4
Results
Component Date
(dd/mm/yy)
Result
(µmol/mol)
Expanded uncertainty
(µmol/mol)
Coverage factor
Propane 01.04.2015 996.0 4.0 2
Calibration standards
Reference 1: Cylinder No. Messer 80510 with METAS value (100.0 ± 0.8) mol/mol
Reference 2: Cylinder No. Carbagas 55101 with METAS value (100.1 ± 0.9) mol/mol
Reference 3: Cylinder No. Messer 76512 with METAS value (300.8 ± 2.5) mol/mol
Reference 4: Cylinder No. PanGas 221572 with METAS value (299.0 ± 2.4) mol/mol
Reference 5: Cylinder No. PanGas 225881 with METAS value (600.0 ± 4.8) mol/mol
Reference 6: Cylinder No. PanGas 2942 with METAS value (1002 ± 9) mol/mol
Reference 7: Cylinder No. Carbagas 7243 with METAS value (998 ± 8) mol/mol
Reference 8: Cylinder No. PanGas 221993 with METAS value (1997 ± 16) mol/mol
Purity: - Carbagas: C3H8: 3.5 N2 (Matrix): 5.7
- Messer: C3H8: 3.5 N2 (Matrix): 6.0
- PanGas: C3H8: 3.5 N2 (Matrix): 5.0
Instrumentation
A fully automatic pressure controlled Gas-Chromatograph with FID (Orthodyne S.A., Belgium) was
used with an autosampler (Swagelok IGC-III, all gas conduits are electropolished and pneumatically
controlled).
Sample Handling: The sample flow through the sample loop of the injector is controlled at 60 ml/min
@ 0 °C/1013 hPa, the pressure of the sample flow after the sample loop is also controlled at 1000 hPa
absolute.
25
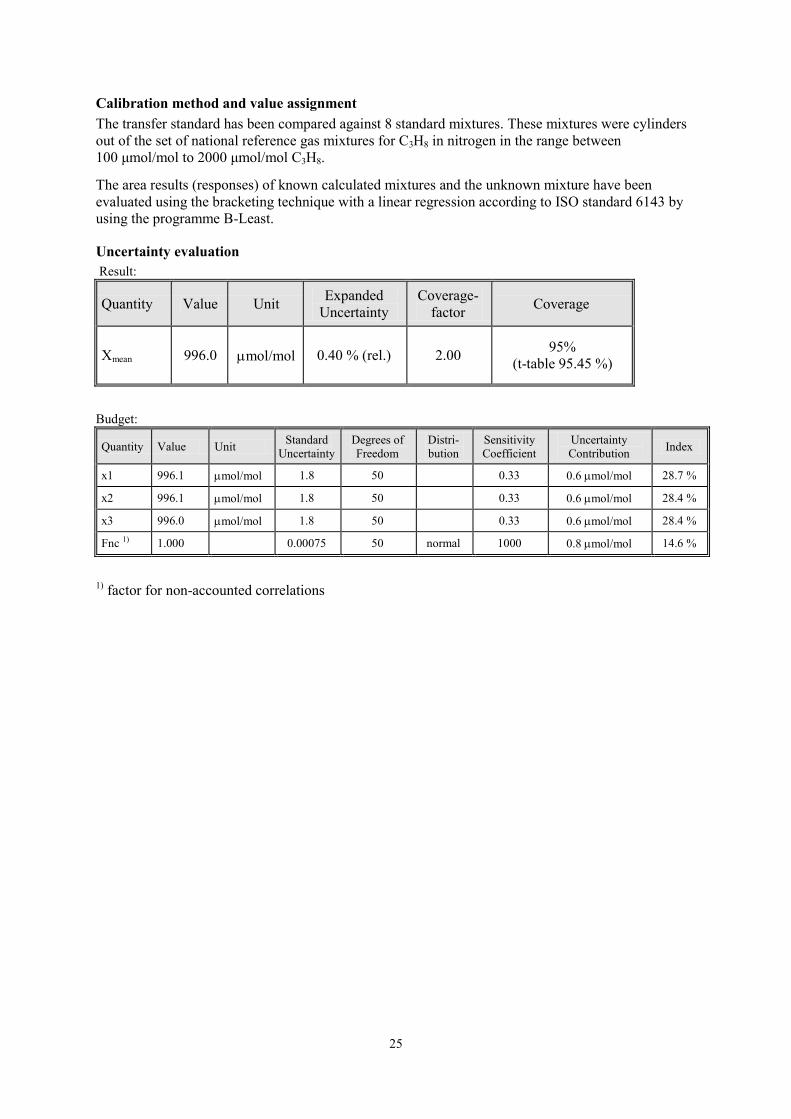
Calibration method and value assignment
The transfer standard has been compared against 8 standard mixtures. These mixtures were cylinders
out of the set of national reference gas mixtures for C3H8 in nitrogen in the range between
100 μmol/mol to 2000 μmol/mol C3H8.
The area results (responses) of known calculated mixtures and the unknown mixture have been
evaluated using the bracketing technique with a linear regression according to ISO standard 6143 by
using the programme B-Least.
Uncertainty evaluation
Result:
Quantity Value Unit Expanded
Uncertainty
Coverage-
factor Coverage
Xmean 996.0 mol/mol 0.40 % (rel.) 2.00 95%
(t-table 95.45 %)
Budget:
Quantity Value Unit Standard
Uncertainty
Degrees of
Freedom
Distri-
bution
Sensitivity
Coefficient
Uncertainty
Contribution Index
x1 996.1 mol/mol 1.8 50 0.33 0.6 mol/mol 28.7 %
x2 996.1 mol/mol 1.8 50 0.33 0.6 mol/mol 28.4 %
x3 996.0 mol/mol 1.8 50 0.33 0.6 mol/mol 28.4 %
Fnc 1) 1.000 0.00075 50 normal 1000 0.8 mol/mol 14.6 %
1) factor for non-accounted correlations

26
Measurement report of MKEH
Laboratory name: Hungarian Trade Licensing Office (MKEH)
Cylinder number: 153259
Measurement #1
Component Date
(dd/mm/yy)
Result
(µmol/mol)
Standard deviation
(% relative)
number of replicates
Propane 28/04/2015 998.9 0.15 3
Measurement #2
Component Date
(dd/mm/yy)
Result
(µmol/mol)
Standard deviation
(% relative)
number of replicates
Propane 29/04/2015 1003.8 0.17 3
Measurement #3
Component Date
(dd/mm/yy)
Result
(µmol/mol)
Standard deviation
(% relative)
number of replicates
Propane 30/04/2015 999.8 0.25 3
Results
Component Date
(dd/mm/yy)
Result
(µmol/mol)
Expanded uncertainty
(µmol/mol)
Coverage factor
Propane 30/04/2015 1000.8 6.8 2
Calibration standards
10 L aluminium cylinder (Luxfer) with stainless steel valve, high purity Propane (99,979%, unknown source of the origin, controlled by GC-FID-TCD for purity) and N2 (99.995%, Messer, Hungary, controlled by GC-FID-TCD and electrochemical sensor and mirror dew point meter for purity) gases were used for the preparation of the primary standard gas diluted by three steps: 8.8492 %(n/n), 1.0051 %(n/n) and 1003.17 ppm(n/n). The mass measurements of the gases were carried out by a balance (Mettler Toledo XP 26003 L) with repeatability of 0.0015 g and capacity of 15000 g. Purity table of Propane
Pure Propane Concentration %(mol/mol)
Uncertainty %(mol/mol)
Propane 99.9790 ± 0.0020
Nitrogen 0.0030 ± 0.0001
Methane 0.0060 ± 0.0001
Carbon-dioxide 0.0120 ± 0.0001
Purity table of Nitrogen
Pure Nitrogen Concentration %(mol/mol)
Uncertainty %(mol/mol)
Nitrogen 99.9988 ± 0.0020
Water 0.00050 ± 0.0001
Methane 0.00125 ± 0.0001
Oxygen 0.00050 ± 0.0001
Carbon-monoxide 0.00005 ± 0.0001

27
Instrument Calibration: MKEH primary standard No: OMH 31/2015.03.25. Propane: 1003.17 ppm ± 0.65 ppm(mol/mol) The measurement with a MKEH primary standard with 1000 ppm Propane nominal concentration. The standard gas and the sample gas were changed in every 20 minutes. The temperature and pressure correction were not done. Sample Handling: We used stainless steel valve for the cylinders and 50 mbar was set up on flow measurement, and the flow was stable.
Instrumentation
Gas chromatography (HP6890 GC-FID) was used to analyze Propane/N2 gas. The flow rate of the gases was controlled by EPC. Column: Porapack PS 4.4m, 0.75mm ID, Sulfinert; oven temp.: 70˚C; Carrier gas: 4.5 bar He to FID.
Calibration method and value assignment
Reference Method: Gas chromatography (HP6890 GC-FID-TCD) was used to analyze Propane/N2 gas. The measurement method was direct comparison with a standard which has the same nominal concentration as the sample.
Uncertainty evaluation
The potential sources of the uncertainty: Uncertainty of the primary reference material.
Uncertainty of calibration measurement series. Standard deviation of measurement series. Uncertainty table 1: Propane
Uncertainty source XI
Estimate xI
Assumed distribution
Standard uncertainty u(xi)
Sensitivity coefficient cI
Contribution to standard uncertainty uI(y)
Standard reference material
1003.17 ppm(mol/mol)
ormal
0.325 ppm(mol/mol)
1
0.032
Standard deviation of the calibration measurement series
568.86 area
Normal
0.79 area
1
0.14
Standard deviation of the measurement series
566.47 area
Normal
0.31 area
1
0.06
Variancia
998.94 ppm(mol/mol)
1.52 ppm(mol/mol)
0.15

28
Uncertainty table 2: Propane
Uncertainty source XI
Estimate xI
Assumed distribution
Standard uncertainty u(xi)
Sensitivity coefficient cI
Contribution to standard uncertainty uI(y)
Standard reference material
1003.17 ppm(mol/mol)
Normal
0.325 ppm(mol/mol)
1
0.032
Standard deviation of the calibration measurement series
574.43 area
Normal
0.63 area
1
0.11
Standard deviation of the measurement series
574.80 area
Normal
0.71 area
1
0.12
Variancia
1003.82 ppm(mol/mol)
1.69 ppm(mol/mol)
0.17
Uncertainty table 3: Propane
Uncertainty source XI
Estimate xI
Assumed distribution
Standard uncertainty u(xi)
Sensitivity coefficient cI
Contribution to standard uncertainty uI(y)
Standard reference material
1003.17 ppm(mol/mol)
Normal
0.325 ppm(mol/mol)
1
0.032
Standard deviation of the calibration measurement series
575.37 area
Normal
1.42 area
1
0.25
Standard deviation of the measurement series
573,45 area
Normal
0.30 area
1
0.05
Variancia
999.82 ppm(mol/mol)
2.54 ppm(mol/mol)
0.25
Propane concentration: 1000.8 ppm (n/n) Coverage factor: 2 Expanded uncertainty: 6.8 ppm (mol/mol), Ui= 0.67
References
A van der Veen, Gergely Vargha, Éva Deák at all, CCQM key comparison CCQM-K3 of
measurements of CO, CO2, and C3H8 in N2, 2002 Metrologia 39 121. doi:10.1088/0026-1394/39/1/18,

29
Measurement report of UME
Laboratory name: National Metrology Institute TÜBİTAK (UME)
Cylinder number: VSL 178727
Measurement #1
Component Date
(dd/mm/yy)
Result
(µmol/mol)
Standard deviation
(% relative)
number of replicates
Propane 24/03/2015 991.29 0.09 10
Measurement #2
Component Date
(dd/mm/yy)
Result
(µmol/mol)
Standard deviation
(% relative)
number of replicates
Propane 25/03/2015 990.00 0.17 10
Measurement #3
Component Date
(dd/mm/yy)
Result
(µmol/mol)
Standard deviation
(% relative)
number of replicates
Propane 25/03/2015 991.37 0.15 10
Measurement #4
Component Date
(dd/mm/yy)
Result
(µmol/mol)
Standard deviation
(% relative)
number of replicates
Propane 27/03/2015 991.29 0.13 10
Measurement #5
Component Date
(dd/mm/yy)
Result
(µmol/mol)
Standard deviation
(% relative)
number of replicates
Propane 27/03/2015 991.37 0.13 10
Results
Component Date
(dd/mm/yy)
Result
(µmol/mol)
Expanded uncertainty
(µmol/mol)
Coverage factor
Propane 30/03/2015 991.06 1.75 2
Calibration standards
Primary reference gas mixtures used in calibration are given in the Table 1. All the primary standards
are binary mixtures of propane in nitrogen. They were prepared individually according to ISO 6142
“Gas analysis - Preparation of calibration gases - Gravimetric Method” at TÜBİTAK UME. Three
different pre-mixtures were individually prepared from pure propane and nitrogen gases. Then, pre-
mixtures were diluted with the same pure nitrogen gas to prepare the standards. Pure propane (3.5
grade) and nitrogen (6.0 grade) were from Air Liquide Germany and Linde Gas Turkey, respectively.
The content of the impurities in the pure gases were determined based on the gas producers’
specifications. The uncertainties of the mixtures given in Table 1 were determined by combining the
standard uncertainties of weighing, purity and molar masses.

30
Table 1. List of primary reference gas mixtures
Item Prepared
By
Cylinder
Number
Mole Fraction
(µmol/mol) Uncertainty (k=1)
(µmol/mol)
1 UME 249096 947.43 0.47
2 UME 249207 1002.12 0.61
3 UME 249095 1039.90 0.62
Instrumentation
The propane in nitrogen was analyzed on an Agilent 6890N gas chromatography instrument equipped
with FID, split/splitless injector, gas injection valve, including Chemstation software (ver Rev. A.
10.02 [1757]) to collect and process data. The conditions for the analyses are given below:
Conditions:
Carrier gas : Helium
Inlet:
Mode : Split
Split ratio : 5:1
Injection temperature : 100 ºC
Sample loop : 1 ml
Column:
Type : HP-PLOT Q 30 m, 0.32 mm, 20 μm (19091P-Q04)
Flow rate : 8.0 ml/min (constant flow)
Oven:
Temperature : Isothermal @ 100 ºC
Duration : 5 min
Detector:
Type : FID
Temperature : 300 ºC
H2 flow rate : 40 ml/min
Air flow rate : 400 ml/min
Aux:
Valve box temperature : 100 ºC
Signal:
Data rate : 20 Hz
Sample injection:
Duration : between 0.1 and 0.6 min.
Calibration method and value assignment
After the arrival of the cylinder from VSL, it was stored in the laboratory where the analyses were
carried out. Three primary standard gas mixtures were also stored in the same laboratory during all the
measurements. The cylinder and the calibration standards were equipped with pressure reducers and
connected to computer programmed multiposition valve gas sampling box. They were flushed before
the first measurement. The flow rates of sample and standard gases were controlled by a mass flow
controller at 40 ml/min.
The data was collected using Chemstation software. Each sample in the sequence was injected 12
times, and the first two injections in each case were discarded as they were considered as flushing of
sample loop. The responses were averaged. The software “B_Least” was utilized to determine the

31
fitting data for the calibrations. The value for goodness of fit in each measurement was found to be
less than 2 for linear function.
The assigned value was calculated by averaging the results of five independent measurements.
Uncertainty evaluation
The measurement uncertainty of sample was determined according to ISO 6143 “Gas analysis -
Comparison methods for determining and checking the composition of calibration gas mixtures”
standard, using the B_Least software.
The combined standard uncertainty was determined by the following equation:
where
um, standard uncertainty from measurements
ug, standard uncertainty from gravimetric preparation
um = 0.064 % rel. (determined by selecting the largest uncertainty value among the obtained
uncertainties for each measurement)
ug = 0.061 % rel. (determined by selecting the largest uncertainty value among the uncertainties of
primary reference gas mixtures)
uc was determined as 0.088 % rel.
The expanded uncertainty was determined by multiplying the combined standard uncertainty by a
coverage factor of 2 with a confidence interval of 95%.

32
Measurement report of VSL
Laboratory name: Van Swinden Labratorium B.V. (VSL)
Cylinder number: 153513
Measurement #1 (GC-6)
Component Date (yyyy-mm-dd)
Result
(mol/mol)
Standard deviation
(% relative) Number of replicates
C3H8 2014-05-22 993.90 × 10⁻⁶
0.02 6
Measurement #2 (GC-6)
Component Date (yyyy-mm-dd)
Result
(mol/mol)
Standard deviation
(% relative) Number of replicates
C3H8 2014-05-27 993.80 × 10⁻⁶
0.03 6
Measurement #3 (GC-3)
Component Date (yyyy-mm-dd)
Result
(mol/mol)
Standard deviation
(% relative) Number of replicates
C3H8 2014-06-11 992.77 × 10⁻⁶
0.02 6
Measurement #4 (GC-6)
Component Date (yyyy-mm-dd)
Result
(mol/mol)
Standard deviation
(% relative) Number of replicates
C3H8 2014-06-12 993.30 × 10⁻⁶
0.02 6
Results
Component Result
(mol/mol)
Expanded Uncertainty
(mol/mol) Coverage factor5
C3H8 993.4 × 10⁻⁶
0.7 × 10⁻⁶
2
Reference Method and calibration:
Propane is analyzed on an Agilent 6890 GC equipped with a FID. Three times the sample is injected
on a 10 ft Porapak N column at 145 °C with a helium carrier (GC-6). One time the sample is injected
on a 10 ft Porapak T column at 150 °C with a hydrogen carrier (GC-3). Together with the CCQM-
K111 sample cylinder also 4 PSMs of C3H8 in N2 are connected to a computer programmed
multiposition valve gas sampling box. A sample loop, 1 mL in GC-6 and 0.25 mL in GC-3, is flushed
for 3 minutes before performing 6 injections for each mixture. A straight line is used as calibration
function in the regression analysis for propane. A correction cylinder is used for eliminating the
instrument drift. Each measurement is preformed in compliance with ISO 6143 [5].
Calibration Standards:
All Primary Standard gas Mixtures (PSMs) for the measurements of C3H8 are binary mixtures in
nitrogen. Preparation is performed according ISO 6142 [4]. The standard uncertainty is based on the
uncertainty of the gravimetric preparation process and the purity analysis of the parent gases.
5 The coverage factor shall be based on approximately 95% confidence.

33
Table 1: Purity table of propane.
Chemical symbol Amount fraction
x (mol/mol)
Standard uncertainty
ux (mol/mol)
C2H6 0.0000001 0.00000001
C3H6 0.000114 0.000011
C3H8 0.9998556 0.000015
C4H8 0.00000006 0.00000003
n-C4H10 0.0000016 0.00000016
i-C4H10 0.00000023 0.00000003
1-C5H10 0.0000004 0.0000002
n-C5H10 0.00000004 0.00000002
Table 2: Purity table of nitrogen.
Chemical symbol Amount fraction
x (mol/mol)
Standard uncertainty
ux (mol/mol)
H2 0.000005 0.000003
H2O 0.00000001 0.000000006
CH4 0.000000008 0.000000005
N2 0.999994927 0.000006
CO 0.000000015 0.000000009
O2 0.000000005 0.000000003
Ar 0.000005 0.000003
CO2 0.00000001 0.000000006
Table 3: Composition of PSMs and correction cylinder.
Component Cylinder number Assigned value
x (mol/mol)
Standard uncertainty
u(x) (mol/mol)
C3H8 VSL303807 400.17 × 10⁻⁶
0.06 × 10⁻⁶
VSL204663 600.35 × 10⁻⁶
0.08 × 10⁻⁶
VSL328517 799.06 × 10⁻⁶
0.10 × 10⁻⁶
VSL238482 999.60 × 10⁻⁶
0.27 × 10⁻⁶
Correction
cylinder VSL423616 1000.90 × 10-6
0.27 × 10⁻⁶
Sample handling:
The CCQM-K111 cylinder 153513 and the PSMs used for calibration are equipped with a pressure
regulator. Sampling takes place with automated multiposition valve sample boxes as described in
VSL‘s work instructions for routine analyses.
Evaluation of measurement uncertainty:
The calibration curves where obtained in accordance with ISO 6143 [5]. As indicated, a straight line
was used. From the uncertainty associated with the amount-of-substance fractions propane of the
calibration mixtures and the repeatability standard deviation of the analyses of the calibration
mixtures and the sample mixture, the amount-of-substance fraction propane and its associated
standard uncertainty where calculated.
To arrive at the final result, the results of the four measurements were averaged. The standard error of
the mean was combined with the pooled uncertainty from evaluating the data from the calibration of
the GCs.

34
Table 4: Uncertainty evaluation
fit value
(mol/mol)
standard
uncertainty
u#x (mol/mol)
Expanded
Uncertainty
#1 9.9390 × 10⁻⁴
1.97 × 10⁻⁷
#2 9.9380 × 10⁻⁴
2.69 × 10⁻⁷
#3 9.9277 × 10⁻⁴
1.97 × 10⁻⁷
#4 9.9330 × 10⁻⁴
1.97 × 10⁻⁷
Standard
deviation 5.1951 × 10
-7 2.60 × 10
-7
mean 9.9344 × 10⁻⁴
6.77 × 10⁻⁷
The standard error of the mean is 2.17 × 10⁻⁷
and the pooled standard uncertainty is 2.60 × 10⁻⁷
. These
standard uncertainties were combined using the law of propagation of uncertainty. The expanded
uncertainty was obtained by multiplying the standard uncertainty with a coverage factor of k = 2.