Embed Size (px)
Citation preview
4th International Conference on Multidisciplinary Research & Practice (4ICMRP-2017) P a g e | 191
www.rsisinternational.org ISBN: 978-93-5288-448-3
Implementation of Box-Behnken Experimental
Design for the Robustness Study and Its
Comprehensive Approach in Development and
Validation of RP-HPLC Method for Simultaneous
Estimation of Rifampicin and Levofloxacin
Roma N. Trivedia*
, Purvi A. Shaha, Vaishali T. Thakkar
b
aDepartment of Quality Assurance, Anand Pharmacy College, NearTown Hall, Anand 388 315,Gujarat, India. bDepartment of Pharmaceutics, Anand Pharmacy College, NearTown Hall, Anand 388 315,Gujarat, India.
Abstract: - Chemometrically assisted development and validation
of the RP-HPLC method intended for the quantitative analysis of
Rifampicin (RIF) and Levofloxacin (LFX). Box-Behnken
experimental design was applied in Robustness study for
obtaining desired chromatographic resolution with limited
numbers of experiments. Three independent variables; volume of
acetonitrile in mobile phase (X1), pH of mobile phase (X2) and
flow rate (X3), were used to design the mathematical models and
study the in depth effect of this independent variables on
retention time of both drugs and Asymmetric factor of LFX. The
chromatographic separation was carried out on Kinetex C18, 100
A Phenomenex column (250 mm × 4.6 mm, 5µm) with a mixture
of 0.03M Potassium dihydrogen phosphate buffer (pH 3.0):
Acetonitrile (55:45, % v/v) as mobile phase; at a flow rate of 0.8
ml/min, with UV detection at 230nm. A linear response was
observed over the concentration range of 2-10 μg/ml for both
drugs, with retention time of RIF (4.86±0.395 min) and LFX
(2.92 ± 0.447 min) and LOD and LOQ value as 0.0214 and 0.0648
μg/ml for RIF and 0.0858 and 0.2600 μg/ml for LFX respectively.
The method was rapid as separation of both drugs was achieved
within the run time of 10min. The method was validated for
linearity, sensitivity, system suitability, accuracy, precision and
robustness as per the ICH guideline. The system revealed that
there was no significant effect of all three factors on the
responses. Finally, the developed experimental design was
validated by statistical analysis using ANOVA. The obtained
results revealed that the proposed method is simple, accurate,
reproducible, and robust thus finding applicability for routine
quality control testing.
Keywords: Rifampicin, Levofloxacin, RP-HPLC, Box-Behnken
experimental design, Validation Parameters
I. INTRODUCTION
uberculosis is one of the leading killer disease among the
young adults worldwide. It is pervasive and highly
contagious chronic bacterial infection, which has led to 1.7
million deaths in 2016 [1]. Returning with a new face, the
global tormentor of multi-drug resistant TB (MDR TB) is
reaching epidemic proportions. The treatment of Tuberculosis
remains very difficult and laboratory studies in order to
characterize drugs working with mechanisms other than first
line agents and having high bactericidal activity has become a
necessity. In order to overcome various drawbacks of TB
therapy viz. lengthy treatment time, various side effects of
conventional drugs, and premature self-termination by
patients [2], at least two or more bactericidal drugs need to be
incorporated. Thus, a strategic combination therapy is a key to
overcome emergence of drug resistance and to shorten the
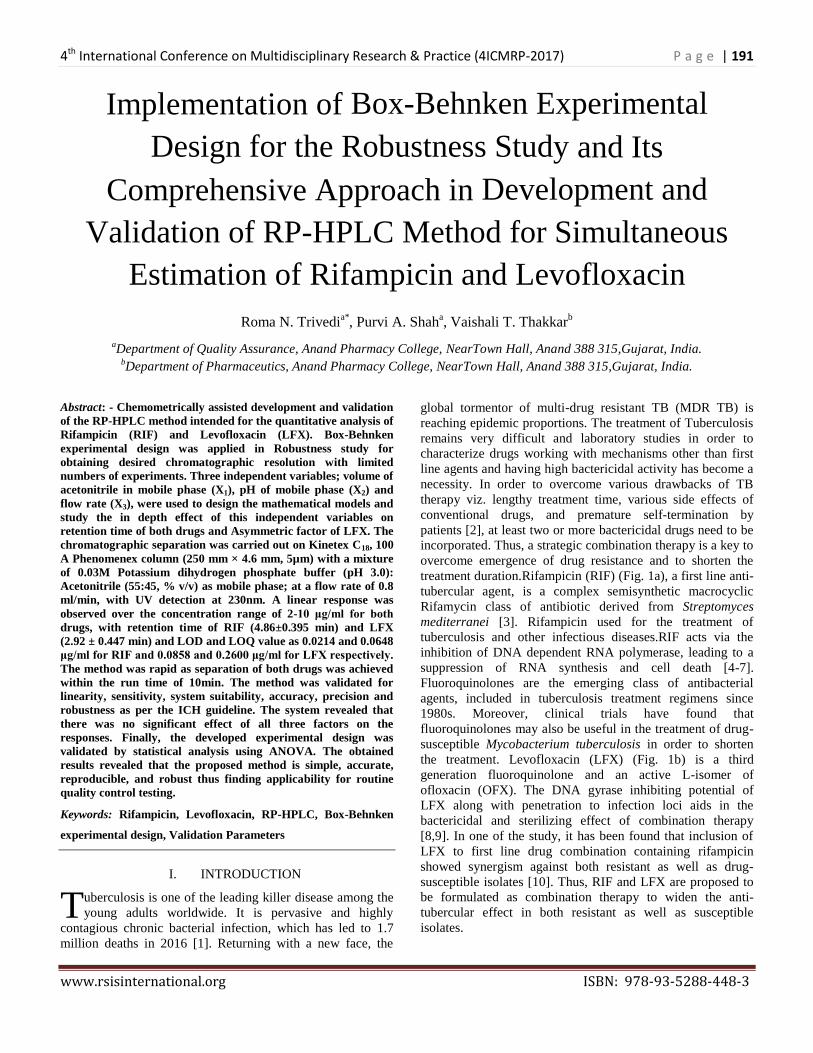
treatment duration.Rifampicin (RIF) (Fig. 1a), a first line anti-
tubercular agent, is a complex semisynthetic macrocyclic
Rifamycin class of antibiotic derived from Streptomyces
mediterranei [3]. Rifampicin used for the treatment of
tuberculosis and other infectious diseases.RIF acts via the
inhibition of DNA dependent RNA polymerase, leading to a
suppression of RNA synthesis and cell death [4-7].
Fluoroquinolones are the emerging class of antibacterial
agents, included in tuberculosis treatment regimens since
1980s. Moreover, clinical trials have found that
fluoroquinolones may also be useful in the treatment of drug-
susceptible Mycobacterium tuberculosis in order to shorten
the treatment. Levofloxacin (LFX) (Fig. 1b) is a third
generation fluoroquinolone and an active L-isomer of
ofloxacin (OFX). The DNA gyrase inhibiting potential of
LFX along with penetration to infection loci aids in the
bactericidal and sterilizing effect of combination therapy
[8,9]. In one of the study, it has been found that inclusion of
LFX to first line drug combination containing rifampicin
showed synergism against both resistant as well as drug-
susceptible isolates [10]. Thus, RIF and LFX are proposed to
be formulated as combination therapy to widen the anti-
tubercular effect in both resistant as well as susceptible
isolates. T

192 | P a g e Implementation of Box-Behnken Experimental Design for the Robustness Study
www.rsisinternational.org ISBN: 978-93-5288-448-3
(a) (b)
Fig. 1. Chemical structure of (a) RIF and (b) LFX
As a part of fabrication of microparticles based dry powder
inhaler drug delivery system of RIF and LFX, development of
suitable assay method for the simultaneous estimation of both
the drugs is the prerequisite. From the thorough literature
survey, various methods have been reported for the
determination of RIF [11-18] and LFX [19-27] individually
and in combination with other drugs. However, RP-HPLC
method for the simultaneous determination of RIF and LFX in
combination has not yet been reported till date. Hence, the
aim of the present study was to develop accurate, precise and
selective RP-HPLC assay procedure for the simultaneous
estimation of RIF and LFX in synthetic mixture. The
validation of proposed method is done according to the ICH
guideline ICH Q2 (R1) [28].
Analytical Quality by design (AQbD) is a systematic
approach to development that begins with a predefined
objective and emphasises method understanding and control
based on sound science and quality risk management. AQbD
plays an important role in developing a robust method as an
early risk assessment and helps to identify the critical
analytical parameters and to focus on these factors in method
development [29, 30]. Furthermore, experimental design is a
good alternative than traditional approach for proper planning
and conducting of improved study. In order to study the
simultaneous variation of the factors on the considered
responses, a multivariate approach using design of
experiments is recommended in robustness testing [31].
Among the various experimental designs, Box-Behnken
experimental design (BBD), a response surface design, is
preferred for the prediction of nonlinear response and also due
to its flexibility, in terms of experimental runs and
information related to the factor's main and interaction effects
[32]. Selection of critical parameters and responses is an
important aspect for the development of HPLC method. The
method has to be validated by statistical analysis using
ANNOVA in compliance with regulatory requirements for
demonstrating its suitability when used. Hence, in line with
the notion and keeping the current FDA requirements in mind
while pursuing the research considering AQbD based
approach, the objective of our study was to develop a novel,
simple, accurate, robust and specific HPLC methodsuitable
for quality control of RIF and LFX using BBD design for
robustness testing.
II. EXPERIMENTAL
A. Standards and Reagents
Analytically pure RIF and LFX were purchased from
Swapnroop Drugs and Pharmaceuticals, Aurangabad, India.
PLGA (75:25) used in preparation of synthetic mixture was
received as gift sample from Evonik Degussa India Pvt. Ltd.,
Mumbai, India.All solvents and chemicals used were of
HPLC grade, purchased from Merck Specialities Pvt. Ltd.,
Mumbai, India.
B. Instrumentation
A HPLC instrument (LC-2010C HT, Shimadzu, Japan) was
used. The system also includes photodiode array (Shimadzu
SPD- M20A) detector. Data were acquired and processed
using LC solution software version 1.25. Analytical balance
AUW 220D (Shimadzu, Japan) with minimum 1 mg
sensitivity was used.
C. Chromatographic conditions
Chromatographic separation was performed at ambient
temperature with a constant injection volume of 10 µl,
using Kinetex C18, 100 A Phenomenex column (250 mm x
4.6 mm, 5 μm) with run time of 10 min. The mobile phase
consisted a mixture of 0.03M Potassium dihydrogen
phosphate buffer (pH 3.0): Acetonitrile (55:45, % v/v). The
mobile phase was prepared daily followed by filtration
through 0.45-μm nylon membrane filter and sonicated for
15 min. The flow rate of 0.8 ml/min for the mobile phase
with an UV detection carried at 230 nm.
D. Preparation of Standard Stock Solutions
A standard stock solution of RIF and LFX (1000 µg/ml) was
prepared individually by dissolving accurately weighed, 10
mg of drug in 10 ml volumetric flask, dissolved and made
upto the mark with acetonitrile. Aliquots of the stock solutions
were appropriately diluted with acetonitrile to obtain working
standards of 100 µg/ml solutions of RIF and LFX.
E. Method validation
The HPLC method was validated in terms of linearity,
sensitivity, precision, accuracy, robustness in accordance with
ICH Q2 (R1) guideline and system suitability test as per USP
[33].
i. System suitability test: System suitability was
determined by five replicate injections of the standard
solution of RIF and LFX (2 µg/ml) before the sample
analysis. Various parameters like resolution, theoretical
plate (N), tailing factor (T) were evaluated in terms of
%RSD.
ii. Linearity: The linearity of an analytical method is its
ability, within a given range, to provide results that are
directly, or through a mathematical transformation,
proportional to the concentration of the analyte.
Different volumes of standard solutions of drugs were
injected to obtain a concentration range of 2-10 µg/ml of
RIF and LFX, in five replicates. The linearity in terms of

4th International Conference on Multidisciplinary Research & Practice (4ICMRP-2017) P a g e | 193
www.rsisinternational.org ISBN: 978-93-5288-448-3
measured peak areas versus corresponding concentration
of drugs wasestimated by ordinary linear regression
analysis. The slope, intercept (with respective
confidence intervals) and correlation coefficient (r2)
were calculated and evaluated. Furthermore, the
homoscedasticity of the variances along the regression
line of each drug was verified using the Bartlett’s
test[34].
iii. Limit of detection (LOD) and limit of quantitation
(LOQ): The Limit of Detection (LOD) and Limit of
Quantification (LOQ). LOD and LOQ of the developed
method were calculated from the standard deviation
of the response and slope of the calibration curve of
drugs using the formula as per ICH guideline,
Limit of detection = 3.3 × σ/S
Limit of quantitation = 10 × σ/S
Where, “σ” is standard deviation of y intercepts of
regression lines, “S” is Slope of calibration curve.
iv. Precision: The precision of the developed method was
evaluated by performing Intra-day and Inter-day
precision studies. Intra-day precision was carried out by
performing three replicates of three different
concentrations (2, 6 and 10 µg/ml of RIF and LFX) on
same day and peak area measured was expressed in
terms of percent relative standard deviation (% RSD).
The inter-day precision study was performed on three
different days using mentioned concentrations of both
drugs in triplicate and % RSD was calculated.
v. Accuracy:The accuracy of the method was assessed
employing the standard addition method, where sample
containing synthetic mixture of RIF, LFX and PLGA
were spiked at three different concentrations levels of
50%, 100%, and 150%. Briefly, recovery studies were
carried out by spiking three different amounts of RIF
and LFX standard (2 µg, 4 µg and 6 µg) to the synthetic
mixture containing RIF (4 µg/ml) and LFX (4 µg/ml).
Recovery studies were performed in triplicate by
calculating the recovery and % RSD for both the drugs.
vi. Robustness testing using Box-Behnken experimental
design:In the present study, robustness of HPLC
analytical method for the simultaneous estimation of RIF
and LFX was determined by Box-Behnken experimental
design (BBD).Here, three independent factors were
selected based on the criticality of factors observed
during trial runs, chromatographic intuition and
experience gained from optimization of chromatographic
conditions. The effect of changes on parameters like,
acetonitrile volume in mobile phase composition (X1),
pH of mobile phase (X2) and flow rate (X3) on the
retention time of both drug, and asymmetric factor of
LFX was examined.
The nominal value for all these three factors, volume of
acetonitrile in mobile phase (X1), pH of mobile phase (X2)
and flow rate (X3) were 45ml, 3.0, and 0.8 ml/min
respectively. In context to this, volume of acetonitrile in
mobile phase was kept between 40-50 ml. Similarly,
minimum and maximum pH of mobile phase was fixed in
between 2.8-3.2, respectively. Likewise, minimum and
maximum values for flow rate were selected as 0.7 and 0.9
ml/min. The data generated were analyzed using Design
Expert (Version 10.0, Stat-Ease Inc., Minneapolis, MN, USA)
statistical software. A total of 15 runs were obtained for the
fixed variables by selecting one center repetition, carried out
in order to know the experimental error variance.Each
combination of mobile phase composition, pH and flow rate
suggested by BBD were finally run on the system; the
observed responses such as retention time of both drugs and
asymmetry factor of levofloxacin were noted and represented
in Table II. All experiments were performed in randomized
order to minimize the effects of uncontrolled factors that may
introduce a bias on the response.
F. Analysis of synthetic mixture
The synthetic mixture was prepared by choosing PLGA
(75:25) as a polymer with an aim to formulate dry powder
inhaler. The synthetic mixture comprised of RIF: LFX (1:1)
and drugs: polymer (1:1), the ratio mimicking the formulation
composition. Accurately weighed 40 mg of synthetic mixture
equivalent to 10 mg of RIF and 10 mg LFX was transferred in
to 10 ml volumetric flask and dissolved in 5 ml acetonitrile.
Then the solution was sonicated for 5 min and made up the
volume up to 10 ml with acetonitrile. The solution was
filtered through Whatman filter paper no. 42 wetted with
acetonitrile and further diluted to obtain 2 μg/ml of RIF and 2
μg/ml of LFX.
III. RESULTS AND DISCUSSION
A. Optimization of chromatographic conditions
The optimizations of chromatographic conditions were done
with a view to develop HPLC method for the simultaneous
determination of RIF and LFX in bulk and in pharmaceutical
dosage form. For the selection of wavelength, 10 µg/ml
standard solutions of RIF and LFX were scanned in the
spectrum mode between 190 and 400 nm using acetonitrile as
a blank. Both drugs absorbed appreciably at 230 nm, which
was selected as the detection wavelength (Fig. 2).
Fig. 2. Zero order overlay spectra of RIF and LFX

194 | P a g e Implementation of Box-Behnken Experimental Design for the Robustness Study
www.rsisinternational.org ISBN: 978-93-5288-448-3
Various mobile phases comprising different ratios of water,
acetonitrile and potassium dihydrogen phosphate buffer were
tried. Water and acetonitrile when used as mobile phase in
different ratios lead to early elution of both drugs giving sharp
peak of RIF but tailing was observed in LFX peak. Hence,
various ratios of different strengths of potassium dihydrogen
phosphate buffer and acetonitrile were tried that gave
acceptable peak shape of RIF and LFX and resolution. Finally,
mobile phase comprised of 0.03M potassium dihydrogen
phosphate adjusted to pH 3.0 with ortho-phosphoric acid and
acetonitrile in ratio of 55:45 % v/v gave acceptable retention
time LFX (2.92 ± 0.447 min) and RIF (4.86 ± 0.395 min) at
230 nm and 0.8 ml/min flow rate.
B. Method validation
i. System suitability parameters: System suitability
testing is used as method control strategy. System
suitability tests are an integral part of method
development and were performed to evaluate the
behaviour of the chromatographic system. The %
RSD was found less than 2%, for system suitability
parameters: Rt (For RIF, 4.86 ± 0.395; for LFX 2.92
± 0.447), peak area (For RIF, 52605.2 ± 0.011; for
LFX, 101063.8 ± 0.005), and resolution (4.81 ±
0.255). Moreover, theoretical plates, 6941.98 ± 0.196
and 3752.76 ± 0.772 as well as tailing factor 1.26 ±
0.433 and 1.38 ± 0.824 for RIF and LFX respectively
were obtained.
ii. Linearity: Linear relationship between peak area and
concentration of RIF and LFX showed a good
correlation coefficient (r2
= 0.9998 and 0.9909
respectively) in the proposed concentration range 2-
10 μg/ml for RIF and LFX. Homoscedasticity of
variance was confirmed by Bartlett’s test and the
response of peak area for both drugs showed
homogenous variance that was exemplified by the χ2
value less than the tabulated value (Table I). Thus,
from the obtained results, there was no further need
of weighting and transformation approach. Fig. 3
shows overlay HPLC chromatogram for linearity of
RIF and LFX at 230 nm.
Fig. 3. Overlay HPLC chromatogram for linearity of RIF and LFX at 230nm.
iii. LOD and LOQ: LOD for RIF and LFX was found to
be 0.0214 and 0.0858μg/ml while LOQ was found
tobe0.0648 and 0.2600 μg/ml respectively indicating
the sensitivity of the proposed method (Table I).
iv. Precision: The experiment was repeated three times
in a day (Intra-day precision) and the average %
RSD values of the results were calculated. Similarly,
the experiment was repeated on three different days
(Inter-day precision) and the average % RSD values
for peak area of RIF and LFX was calculated.
Results of intra-day and inter-day precision
expressed in terms of % RSD less than 2 confirm
precision of the method (Table I).
v. Accuracy: The mean percentage recovery at three
levels, 50%, 100% and 150% after spiking with
standard were in the range of 99.02- 100.48 % for
RIF and 100.83-102.62 % for LFX which were
within acceptable ranges of 100 ± 2 % (Table I).
Good agreements between actual and determined
values were found that confirm the accuracy of the
method. The % RSD less than 2 for both drugs
suggest suitability and applicability of the method for
routine drug analysis.
Table I. Analytical Validation Parameters for RIF and LFX by HPLC Method
Parameters RIF LFX
Linearity a
Linearity range (μg/ml) 2-10 2-10
Correlation coefficient (r2) 0.9998 0.9909
Slope ± SD 31233.70±8.79 28890.75± 68.00
Confidence limit of slopeb 31208.7-31258.7 28660.75-29120.75
Intercept ± SD 9856.76 ± 202.39 34499.82± 751.21
Confidence limit of interceptb 9676.76-10036.76 33839.82-35159.82
Bartlett’s test c(χ2) 0.0005 0.0030
Sensitivity
LOD (μg/ml) 0.0214 0.0858
LOQ (μg/ml) 0.0648 0.2600
Precisiond (%RSD)
Intra-day Precision 0.000 - 0.042 0.034 - 0.468
Inter-day Precision 0.032 - 0.229 0.678 - 1.904
Accuracye
50%
100%
150%
100.48 ± 0.22
99.02 ± 0.21
99.68 ± 0.15
102.62 ± 0.24
102.13 ± 1.14
100.83 ± 0.41
SD = standard deviation, % RSD = relative standard deviation, RIF =
Rifampicin, LFX = Levofloxacin a Average of five determinations b Confidence interval at 95% confidence level and 5 degree of freedom
(t=2.57) c Calculated value less than tabulated value, χ2critical value 9.488 at α = 0.05. d Average of three determinations for each concentratione Average of three
determinations at each level.

4th International Conference on Multidisciplinary Research & Practice (4ICMRP-2017) P a g e | 195
www.rsisinternational.org ISBN: 978-93-5288-448-3
vi. Robustness testing using Box-Behnken experimental
design:As defined by the ICH, the robustness of an
analytical procedure refers to its capability to remain
unaffected by small and deliberate variations in
method. In the present study, three independent
factors, i.e. acetonitrile volume in mobile phase
composition (X1), pH of mobile phase (X2) and flow
rate (X3) were selected based on the criticality of
factors that was observed during trial runs,
chromatographic intuition, and experience gained
from previous optimization studies. The experiments
were carried out based on the experimental domain,
and the qualitative responses studied were the
retention factor of LFX (Y1), retention factor of RIF
(Y2)and asymmetric factor of LFX (Y3).The
observed responses were noted and are represented
in Table II.Among the various models, the classical
second-degree model with a quadratic experimental
domain was suggested by the design with the highest
least squares regression value for all responses as
compared to other models. The model was examined
using lack of fit test, which indicated insignificant
lack of fit value corresponding with higher p-Value
as compared to the model F-Value. Graphical
interpretation in form of response surfaces and
perturbation plots showed the correlation of the
effect of the factors on the retention factor of each
drug. Perturbation plots reveal the change in
response from its nominal value with all other factors
held constant at a reference point, and steepest slope
or curvature indicates sensitiveness to specific
factors. Perturbation plots indicated that none of the
factors had significant effect on responses (Fig. 4).
The model was evaluated for the effect of individual
factors on the responses in the form of contour plots
and three dimensional response surfaces for the
response Y1, Y2 and Y3 as shown in (Fig. 5). The
contour plots indicated that the effect of all the
responses are independent of the factors X1 (ACN
volume), X2 (pH) and X3 (flow rate). Furthermore,
the model was validated by the application of
analysis of variance (ANOVA) to all the response
variables to examine the significance of model,
which showed that all the responses achieved
insignificant differences in their values. The
quadratic equations for all model responses Y1, Y2
and Y3 are as follows:
Y1 (Rt of LFX) = -25.415000 + 0.2940 X1 + 13.1250
X2 + 4.47500 X3 + 0.06500 X1X2 - 0.04000 X1X3 +
0.25000 X2X3 -5.10000E-003X12 - 2.68750 X2
2 -
2.25000X32
Y2 (Rt of RIF) = -56.47708 + 2.151750 X1 -
8.00000X2 + 69.50417X3 + 0.10500X1X2 -
0.20500X1X3 + 1.00000 X2X3 -0.026117X12 +
0.48958X22 - 42.29167X3
2
Y3 (Asymmetry factor of LFX) = -57.38958 +
0.53175X1 + 25.1625X2 + 23.35417X3 +
0.027500X1X2 - 0.020000X1X3 + 0.62500X2X3 -
6.66667E - 003X12 - 4.47917X2
2 - 15.16667X3
2
Here positive sign indicates synergistic effect, while
a negative sign indicates antagonistic effect in
polynomial equation. From the Table III of ANOVA
for response Y1, Y2 and Y3 showed that the predicted
values for all factors are under the satisfactory value
with predicted model F-value representing the model
is highly significant. Model p value > 0.05 indicates
that factors had non-significant effect on response
resulting in a robust method.
Table II. Experimental Design for Robustness Testing Using Factors and Obtained Responses
Number of runs Volume of ACN
(ml)
pH of mobile
phase
Flow rate
(ml/min) Rt of LFX Rt of RIF
Asymmetric
factor of LFX
1 40.00 3.00 0.70 2.60 4.65 1.36
2 50.00 3.00 0.90 2.56 4.20 1.35
3 45.00 2.80 0.90 2.58 4.50 1.34
4 45.00 3.00 0.80 2.82 5.60 1.86
5 45.00 3.00 0.80 2.80 5.60 1.85
6 40.00 3.20 0.80 2.50 5.50 1.32
7 50.00 2.80 0.80 2.40 4.23 1.30
8 40.00 3.00 0.90 2.62 4.40 1.37
9 45.00 2.80 0.70 2.64 5.84 1.33
10 45.00 3.00 0.80 2.63 5.61 1.34
11 45.00 3.20 0.90 2.61 4.60 1.40
12 45.00 3.20 0.70 2.65 5.86 1.34
13 50.00 3.00 0.70 2.62 4.86 1.38

196 | P a g e Implementation of Box-Behnken Experimental Design for the Robustness Study
www.rsisinternational.org ISBN: 978-93-5288-448-3
Design-Expert® SoftwareFactor Coding: ActualRt of RIF (min)
Actual FactorsA: Volume of ACN = 45.00B: pH of mobile phase = 3.00C: Flow rate = 0.80
-1.000 -0.500 0.000 0.500 1.000
4
4.5
5
5.5
6
A
A
B
BC
C
Perturbation
Deviation from Reference Point (Coded Units)
Rt of
RIF
(min)
Design-Expert® SoftwareFactor Coding: ActualRt of LFX (min)
Actual FactorsA: Volume of ACN = 40.00B: pH of mobile phase = 3.00C: Flow rate = 0.70
-1.000 -0.500 0.000 0.500 1.000
2.3
2.4
2.5
2.6
2.7
2.8
2.9
A
A
B
B
CC
Perturbation
Deviation from Reference Point (Coded Units)
Rt of
LFX
(min)
14 50.00 3.20 0.80 2.61 4.75 1.34
15 40.00 2.80 0.80 2.55 5.40 1.39
Table III. Statistical Parameters by ANOVA Analysis for the Responses
Parameters SS Df MS F-value p-value Model F-value Model p-value Prob>F
Response Y1 (Rt of LFX)
ACN volume (ml) 8.000E-004 1 8.000E-004 0.17 0.7003
2.83 0.1324 Not significant pH 5.000E-003 1 5.000E-003 1.04 0.3547
Flow rate (ml/min) 2.450E-003 1 2.450E-003 0.51 0.5073
Response Y2 (Rt of RIF)
ACN volume (ml) 0.46 1 0.46 2.67 0.1632
2.78 0.1361 Not significant pH 0.068 1 0.068 0.40 0.5545
Flow rate (ml/min) 1.54 1 1.54 9.02 0.0300
Response Y3 (Asymmetric factor of LFX)
ACN volume (ml) 6.125E - 004 1 6.125E- 004 0.017 0.9012
0.84 0.6164 Not significant pH 2.000E - 004 1 2.000E-004
5.564E –
003 0.9434
Flow rate (ml/min) 3.125E - 004 1 3.125E- 004 8.693E-
003 0.9293
(a) (b)
(c)
Fig. 4. Perturbation plot showing effect of factors on Responses
Design-Expert® SoftwareFactor Coding: ActualAsym factor
Actual FactorsA: Volume of ACN = 45.00B: pH of mobile phase = 3.00C: Flow rate = 0.80
-1.000 -0.500 0.000 0.500 1.000
1.3
1.4
1.5
1.6
1.7
1.8
1.9
AAB
BC C
Perturbation
Deviation from Reference Point (Coded Units)
Asym
fact
or

4th International Conference on Multidisciplinary Research & Practice (4ICMRP-2017) P a g e | 197
www.rsisinternational.org ISBN: 978-93-5288-448-3
(A)
(B)
(C)
Fig. 5.Contour plots and three dimensional response surfaces (A) Effect of factor X1 (ACN volume) and X2 (pH); fixed factor X3 (flow rate0.8), on response Y1
(Rt of LFX), (B) Effect of factor X1 (ACN volume) and X2 (pH); fixed factor or actual factor X3 (flow rate 0.8), on response Y2 (Rt of RIF) and (C) Effect of factor
X1 (ACN volume) and X2 (pH); fixed factor or actual factor X3 (flow rate 0.8), on response Y2 (Asymmetry factor of LFX)
Design-Expert® SoftwareFactor Coding: ActualRt of LFX (min)
Design Points2.82
2.4
X1 = A: Volume of ACNX2 = B: pH of mobile phase
Actual FactorC: Flow rate = 0.80
40.00 42.00 44.00 46.00 48.00 50.00
2.80
2.90
3.00
3.10
3.20Rt of LFX (min)
A: Volume of ACN (ml)
B: p
H o
f mob
ile p
hase
2.52.6
2.6
2.6
2.7
3
Design-Expert® SoftwareFactor Coding: ActualRt of LFX (min)
Design points above predicted valueDesign points below predicted value2.82
2.4
X1 = A: Volume of ACNX2 = B: pH of mobile phase
Actual FactorC: Flow rate = 0.80
2.80
2.90
3.00
3.10
3.20
40.00
42.00
44.00
46.00
48.00
50.00
2.3
2.4
2.5
2.6
2.7
2.8
2.9
Rt
of
LF
X (
min
)
A: Volume of ACN (ml)B: pH of mobile phase
Design-Expert® SoftwareFactor Coding: ActualRt of RIF (min)
Design Points5.86
4.2
X1 = A: Volume of ACNX2 = B: pH of mobile phase
Actual FactorC: Flow rate = 0.80
40.00 42.00 44.00 46.00 48.00 50.00
2.80
2.90
3.00
3.10
3.20Rt of RIF (min)
A: Volume of ACN (ml)
B: p
H of
mob
ile p
hase
4.8
55.25.4 5.4
5.6
3
Design-Expert® SoftwareFactor Coding: ActualRt of RIF (min)
Design points above predicted valueDesign points below predicted value5.86
4.2
X1 = A: Volume of ACNX2 = B: pH of mobile phase
Actual FactorC: Flow rate = 0.80
2.80
2.90
3.00
3.10
3.20
40.00
42.00
44.00
46.00
48.00
50.00
4
4.5
5
5.5
6 R
t of R
IF (
min
)
A: Volume of ACN (ml)B: pH of mobile phase
Design-Expert® SoftwareFactor Coding: ActualAsym factor
Design Points1.86
1.3
X1 = A: Volume of ACNX2 = B: pH of mobile phase
Actual FactorC: Flow rate = 0.80
40.00 42.00 44.00 46.00 48.00 50.00
2.80
2.90
3.00
3.10
3.20Asym factor
A: Volume of ACN (ml)
B: p
H o
f mob
ile p
hase
1.4
1.4
1.4
1.5
1.5
1.5 1.5
1.6
3
Design-Expert® SoftwareFactor Coding: ActualAsym factor
Design points above predicted valueDesign points below predicted value1.86
1.3
X1 = A: Volume of ACNX2 = B: pH of mobile phase
Actual FactorC: Flow rate = 0.80
2.80
2.90
3.00
3.10
3.20
40.00
42.00
44.00
46.00
48.00
50.00
1.2
1.3
1.4
1.5
1.6
1.7
1.8
1.9
Asy
m f
act
or
A: Volume of ACN (ml)B: pH of mobile phase

198 | P a g e Implementation of Box-Behnken Experimental Design for the Robustness Study
www.rsisinternational.org ISBN: 978-93-5288-448-3
IV. ANALYSIS OF SYNTHETIC MIXTURE
The concentration of RIF and LFX was analysed in
synthetic mixture using proposed HPLC method in
triplicate. The percent assay was found to be 99.84 ± 0.55
and 101.56 ± 0.101 % w/w and %RSD less than 2 reveals
lack of interference from PLGA (75:25) and the proposed
method can be successfully applied to analysis of
formulation containing RIF and LFX.
V. CONCLUSION
A simple, sensitive, accurate, economical and precise HPLC
analytical method has been developed for the simultaneous
determination of RIF and LFX and validated as per ICH
guidelines. A Box-Behken design use dissuitable for
exploring quadratic response surfaces and constructing
econdorder polynomial models by evaluating the selected
factors simultaneously including interactions between
factors. ACN volume in mobile phase, pH of the mobile
phase and flow rate were simultaneously optimized by
applying useful tools of response surface design and
Derringer’s desirability function. The results revealed that
the all selected factors have not significant effect on
retention time of RIF and LFX, as well as Asymmetric
factor of LFX.The good % recovery in synthetic mixtures
suggests that the excipients present have no interference in
the determination. The validation study supported the
selection of the best conditions by confirming that the
method was specific, linear, and robust. The proposed
HPLC method would be of use in routine quality control
and combined dosage form analysis.
ACKNOWLEDGEMENT
We would like to extend heartful thanks to Ms. Tosha Pandya
for execution of the experimental work and express our
gratitude to Science for Equity Empowerment and
Development (SEED) division, Department of Science and
Technology (DST), for providing us grant for the research
work.
REFERENCES
[1] World Health Organization; (2016). WHO Global
tuberculosisreport. Geneva, Switzerland: WHO. [2] R.G. Hall, R.D. Leff, T. Gumbo., (2009). Treatment of Active
Pulmonary Tuberculosis in Adults: Current Standards and Recent
Advances. Pharmacotherapy, 1468-1481. [3] O'Neil, M.J. (ed.)., (2001). The Merck Index An Encyclopedia of
Chemicals, Drugs, and Biologicals. Whitehouse Station, NJ: Merck
and Co., 13th edition, pp. 1474. [4] N. Maggi, C.R. Pasqualucci, R. Ballota, P. Sensi.,
(1966).Rifampicin: a new orally active rifamycin. Chemotherapia.
11, 285-292. [5] G. Binda, E. Domenichini, A. Gottardi., (1971). Rifampicin, a
general review, Arzneim.-Forsch. 21, 1907-1977. [6] R. Pähkla, J. Lambert, P. Ansko, P. Winstanley, P.D.O. Davies, R.-
A. Kiivet., (1999). Comparative bioavailability of three different
preparations of rifampicin. J. Clin. Pharm. Ther, 24, 219-225. [7] J.Rainbow, E. Cebelinski, J. Bartkus, A.Glennen,D. Boxrud,
R.Lynfield., (2005). Rifampin-resistant Meningococcal Disease.
Emerg Infect Dis, 11, 977-979.
[8] A.S. Ginsburg, J.H. Grosset, W.R. Bishai., (2003). Fluoroquinolone,
tuberculosis, and resistance. Lancet Infect Dis, 3, 432-442.
[9] Howard takiff and elba guerrero., (2011). Current prospects for the Fluoroquinolones as First-line Tuberculosis Therapy. J. Antimicrob.
Chemother, 55(12), 5421-5429.
[10] E. R Jurado, G. Tudó, J. P. Bellacasac, M. Espasa, J. G. Martín., (2013). In vitro effect of three-drug combinations of antituberculous
agents against multidrug-resistant Mycobacterium tuberculosis
isolates. Int. J. Antimicrob. Agents, 41, 278– 280. [11] P.Jain, V. M. Pathak., (2013). Development and validation of UV-
visible spectrophotometric method for estimation of rifapentine in
bulk and dosage form. Der Pharma Chemica, 5, 251-255. [12] E.D. Tella, S. Sunitha, D. K. Garikipati, T. Benjamin, N. Prasad,
Tand Ch., (2012). Assay of Rifampicin in Bulk and its Dosage
Forms by Visible Spectrophotometry using Chloranilic Acid. IJCEE, 3, 64-67.
[13] S.T. Sriram, B. Prasanthi, S. Tata, V. J. Ratna., (2012).
Development and validation of high performance liquid chromatographic method for the determination of Rifampicin in
human plasma. Int J Pharm Pharm Sci., 4, 362-367.
[14] J. Liua, J. Suna, W. Zhanga, K. Gaoa, Z. Hea., (2008). HPLC
determination of rifampicin and related compounds in
pharmaceuticals using monolithic column. J Pharm Biomed Anal.
46, 405–409. [15] J. Ali, N. Ali, Y. Sultana, S. Baboota, S. Faiyaz., (2007).
Development and validation of a stability- indicating HPTLC
method for analysis of antitubercular drugs. ACTA chromatographica.18, 168.
[16] K. G. Kapuriya, P. M. Parmar, H. R. Topiya, S. D. Faldu., (2012).
Method development and validation of rifampicine and piperine in their combined dosage form. Int. bull. drug res. 1, 71-80.
[17] S.S. Bhusari, V. Bhat, M. Koul, S. C. Sharma, M. Tikoo, A. K.
Tikoo, N.K. Satti , K.A Suri, R K. Johri., (2009). Development and Validation of a RP-HPLC Method for the Simultaneous
Determination of Rifampicin and a Flavonoid Glycoside - A Novel
Bioavailability Enhancer of Rifampicin. Trop J Pharm Res. 8, 531-537.
[18] Hongling Yan, Yaping Zhou, Qingji Xie, Yi Zhang, Pei Zhang,
Hualing Xiao, Wen Wang and Shuozhuo Yao., (2014). Simultaneous analysis of isoniazid and rifampicin by high
performance liquid chromatography with gradient elution and wall-
jet/thin-layer electrochemical detection. Anal. Methods. 6, 1530-1537.
[19] PhamVan Toi. et. Al., (2017). High-performance liquid
chromatography with time-programmed fluorescence detection for the quantification of Levofloxacin in human plasma and
cerebrospinal fluid in adults with tuberculous meningitis. Journal of Chromatography B. 1061, 256-262.
[20] A. Czyrski, E. Szalek., (2016). An HPLC method for levofloxacin
determination and its application in biomedical analysis. Journal of Analytical Chemistry,71(8),840–843.
[21] S. Siewert., (2006). Validation of a levofloxacin HPLC assay in
plasma and dialysate for pharmacokinetic studies. Journal of Pharmaceutical and Biomedical Analysis. 41(4), 1360-1362.
[22] Arayne MS1, Sultana N, Siddiqui FA., (2007). Optimization of
levofloxacin analysis by RP-HPLC using multivariate calibration technique. Pak J Pharm Sci.20(2), 100-6.
[23] Safila Naveed*, Najma Sultana, M. Saeed Arayne, Huma Dilshad.,
(2014). A new HPLC method for the assay of levofloxacin and its
application in drug-metal interaction studies. Journal of Scientific
and Innovative Research. 3 (1). 91-96.
[24] Felipe K. H et al., (2006). Determination of Levofloxacin in a Pharmaceutical Injectable Formulation by Using HPLC and UV
Spectrophotometric Methods. Journal of liquid chromatography and
related technologies, 1981-1989. [25] I. F. Al‐Momani ., (2005). Flow Injection Spectrophotometric
Determination of the Antibacterial Levofloxacin in Tablets and
Human Urine. Journal of analytical letters. 741-750. [26] Kumar et al., (2011). Development and validation of HPLC-UV
method for the estimation of levofloxacin in human plasma.

4th International Conference on Multidisciplinary Research & Practice (4ICMRP-2017) P a g e | 199
www.rsisinternational.org ISBN: 978-93-5288-448-3
International Journal of Pharmacy and Pharmaceutical Sciences,
3(2), 247250.
[27] P.sureshkumar et. al., (2011). HPLC method development of levofloxacin by RP-HPLC in its bulk dosage form. IJRAP. 2(6),
1790-1792.
[28] International Conference on Harmonization. ICH Q2 (R1)., (2005). Validation of analytical procedures: text and methodology, ICH
Secretariat, Geneva.
[29] D.A. Bhatt, S.I. Rane., (2011). QbD approach to analytical RP- HPLC method development and its validation. Int. J. Pharm.
Pharm. Sci., 3, 1179–1187.
[30] H. Bhutani, M. Kurmi, S. Singh, S. Beg, B. Singh., (2014). Quality by design (QbD) in analytical sciences: an overview, Pharm. Times
46, 71–75.
[31] A.H. Schmidt, M. Stanic, I. Molnar., (2014). In silico robustness
testing of a compendial HPLC purity method by using a
multidimensional design space build by chromatography modeling- case study pramipexole. J. Pharm. Biomed. Anal. 91, 97–107.
[32] R.M.Hallem, M. Y.Salem, F.A.Fatahallah, L.E.Abdelfattah.,
(2015). Quality in the pharmaceutical industry –A literature review, Saudi Pharm J. 23, 463-469.
[33] United States Pharmacopeia 27., (2003). National Formulary 22,
(2), The United States Pharmacopoeial Convention, Rockville, pp. 2281.
[34] Zar JH., (2010). Biostatistical analysis. Upper saddle River NJ,
USA: Pearson Educational Publications; 5.


![Microfiltration systems for the food & beverage industryfood & beverage industry DEPTH FILTRATION FOR VALUABLE LIQUIDS. SWISS QUALITY. SINCE 1938. Nominal retention re ta [µm]* *](https://img.pdfslide.net/doc/110x75/6129c268344eb56f3103606d/microfiltration-systems-for-the-food-beverage-industry-food-beverage.jpg)