Embed Size (px)
DESCRIPTION
International Critical Care Nutrition Survey 2009: Defining Gaps in Practice. Naomi E Cahill, RD MSc Project Leader Queen’s University/Clinical Evaluation Research Unit Kingston, Ontario, Canada. Acknowledgments. Participants of the International Nutrition Survey 2009 - PowerPoint PPT Presentation
Citation preview
International Critical Care Nutrition Survey 2009:
Defining Gaps in Practice
Naomi E Cahill, RD MScProject Leader
Queen’s University/Clinical Evaluation Research Unit
Kingston, Ontario, Canada

Acknowledgments
• Participants of the International Nutrition Survey 2009
• Dr Daren Heyland and the Research Team at the Clinical Evaluation Research Unit– Lauren Murch, Project Assistant– Rupinder Dhaliwal, Project Leader– Andrew Day, Biostatistician– Miao Wang, Data Analyst– Fernando Ferrer, IT Support


The provision of safe and adequate nutrition for all our
critically ill patients
5

What is an audit?
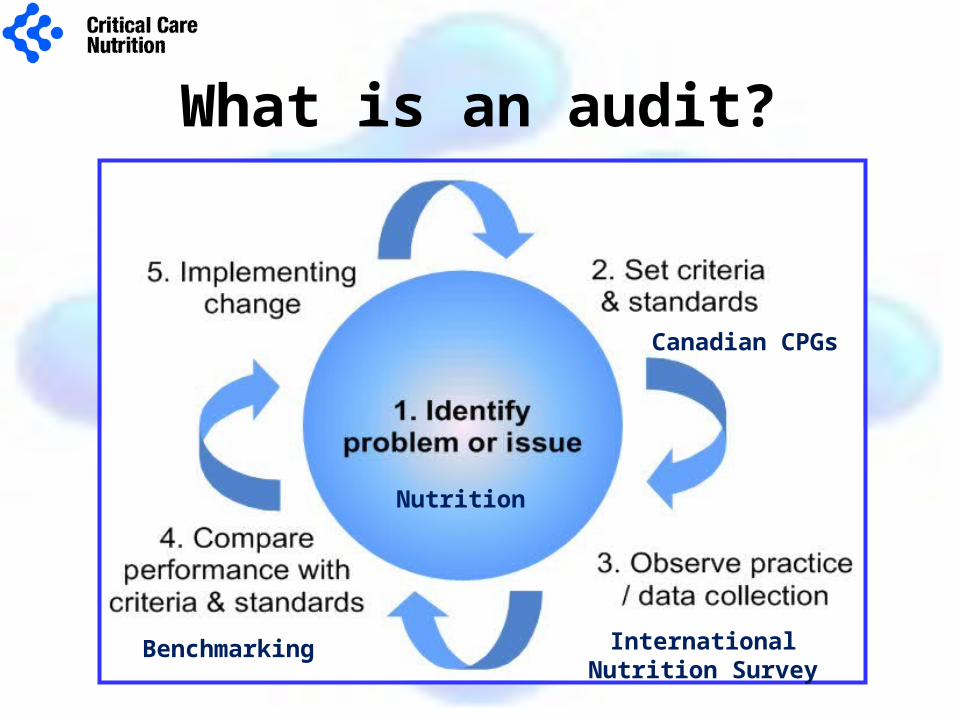
What is an audit?
Nutrition
Canadian CPGs
International Nutrition Survey
Benchmarking
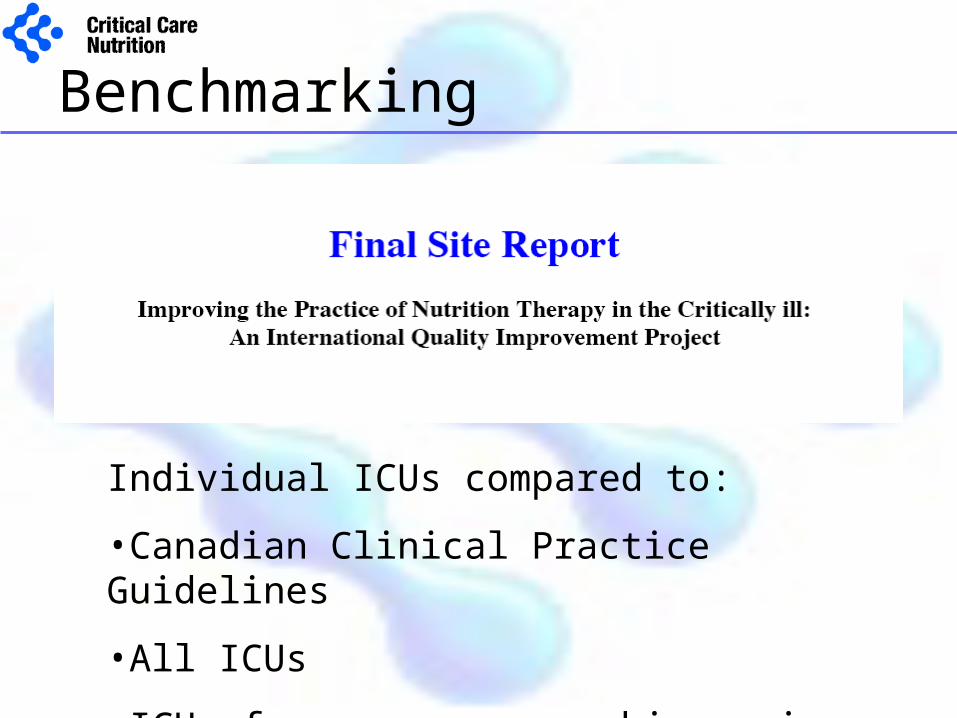
Benchmarking
Individual ICUs compared to:
•Canadian Clinical Practice Guidelines
•All ICUs
•ICUs from same geographic region

Why Audit Nutrition Practice?
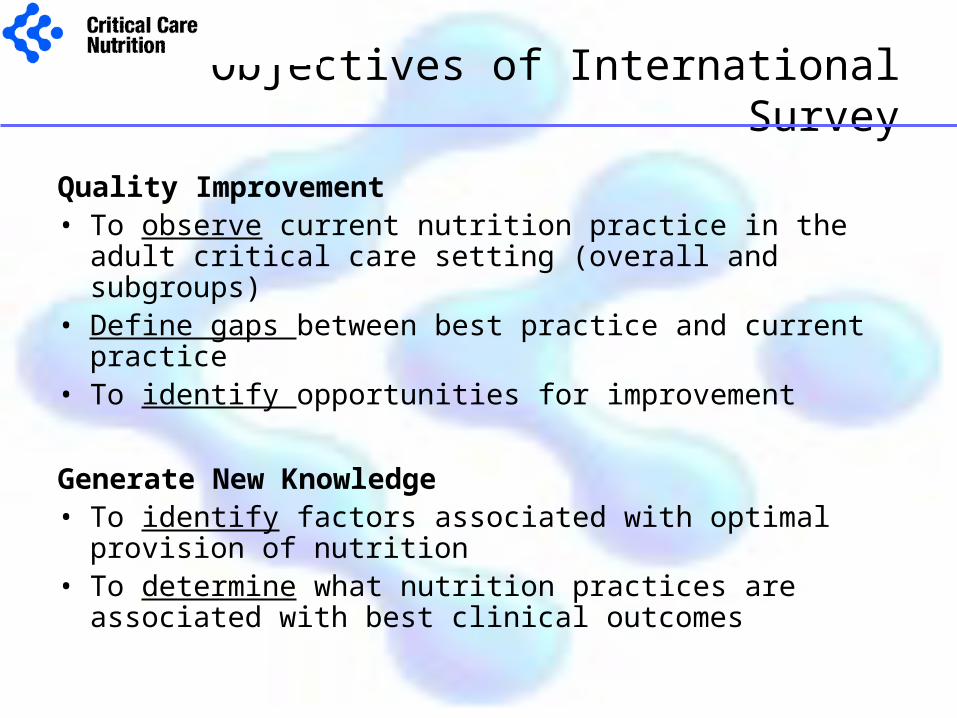
Objectives of International Survey
Quality Improvement• To observe current nutrition practice in the adult critical
care setting (overall and subgroups)• Define gaps between best practice and current practice • To identify opportunities for improvement
Generate New Knowledge• To identify factors associated with optimal provision of
nutrition • To determine what nutrition practices are associated with
best clinical outcomes
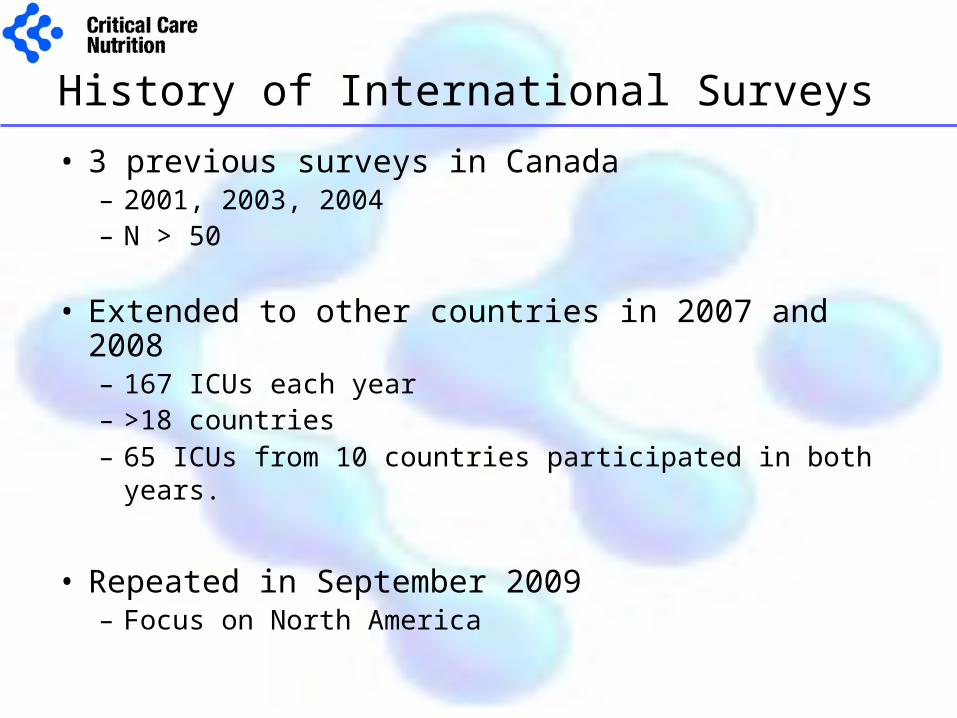
History of International Surveys
• 3 previous surveys in Canada– 2001, 2003, 2004– N > 50
• Extended to other countries in 2007 and 2008– 167 ICUs each year– >18 countries
– 65 ICUs from 10 countries participated in both years.
• Repeated in September 2009– Focus on North America
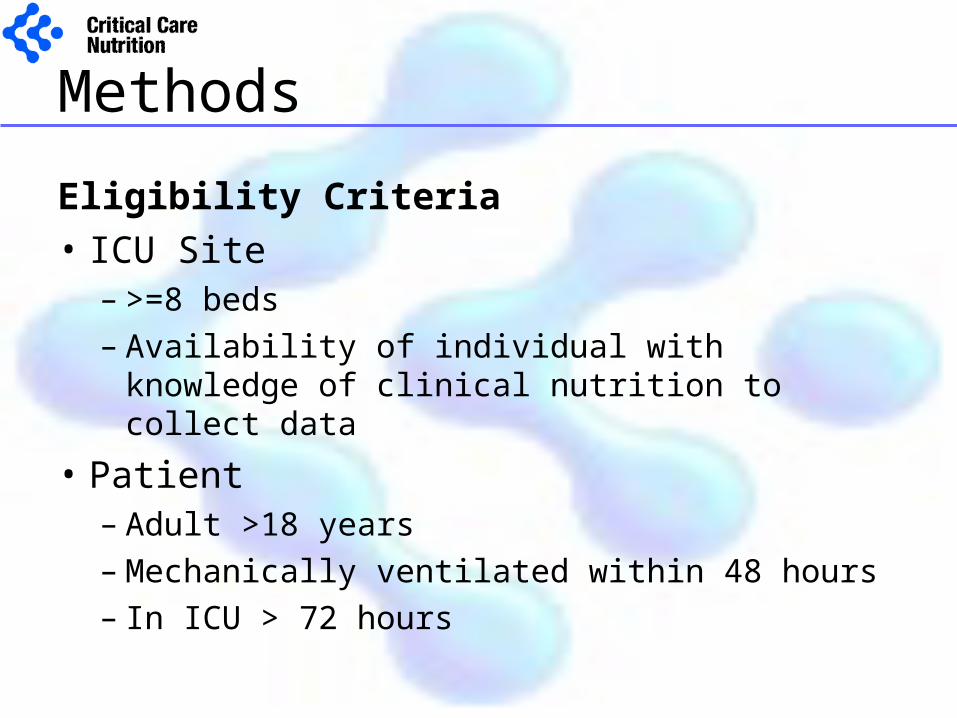
Methods
Eligibility Criteria• ICU Site
– >=8 beds– Availability of individual with knowledge of
clinical nutrition to collect data
• Patient– Adult >18 years– Mechanically ventilated within 48 hours– In ICU > 72 hours
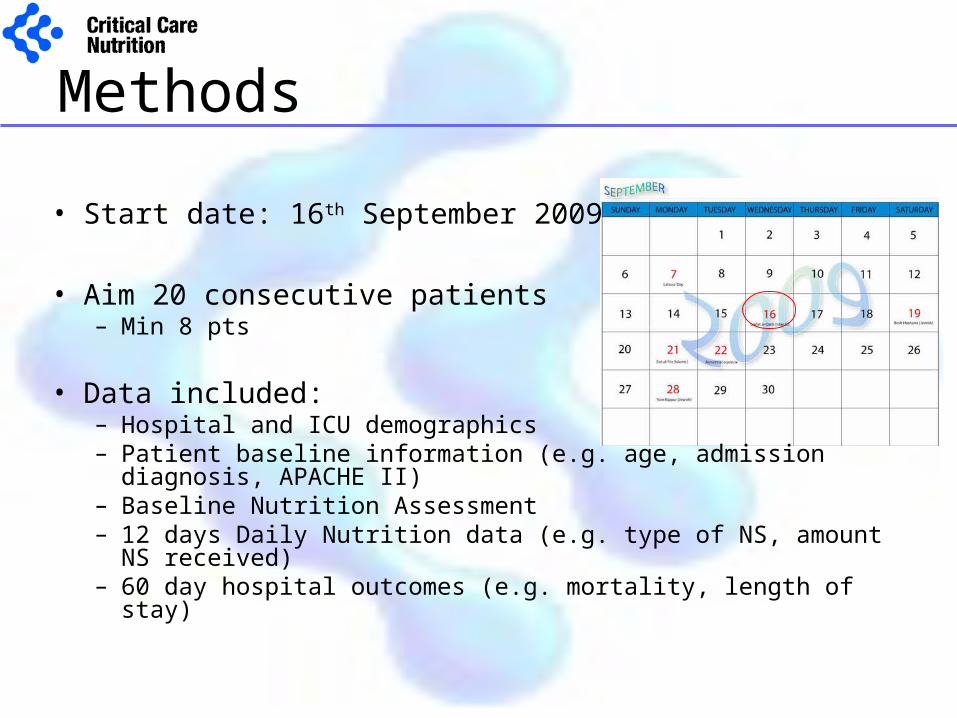
Methods
• Start date: 16th September 2009
• Aim 20 consecutive patients– Min 8 pts
• Data included:– Hospital and ICU demographics– Patient baseline information (e.g. age, admission diagnosis,
APACHE II)– Baseline Nutrition Assessment– 12 days Daily Nutrition data (e.g. type of NS, amount NS
received)– 60 day hospital outcomes (e.g. mortality, length of stay)
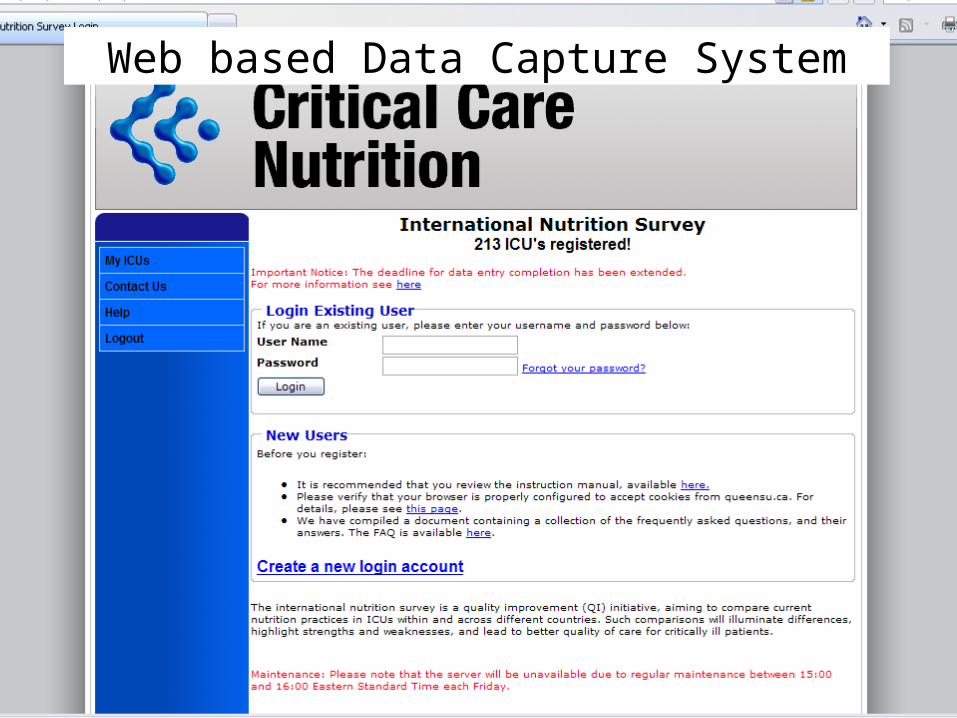
Web based Data Capture System
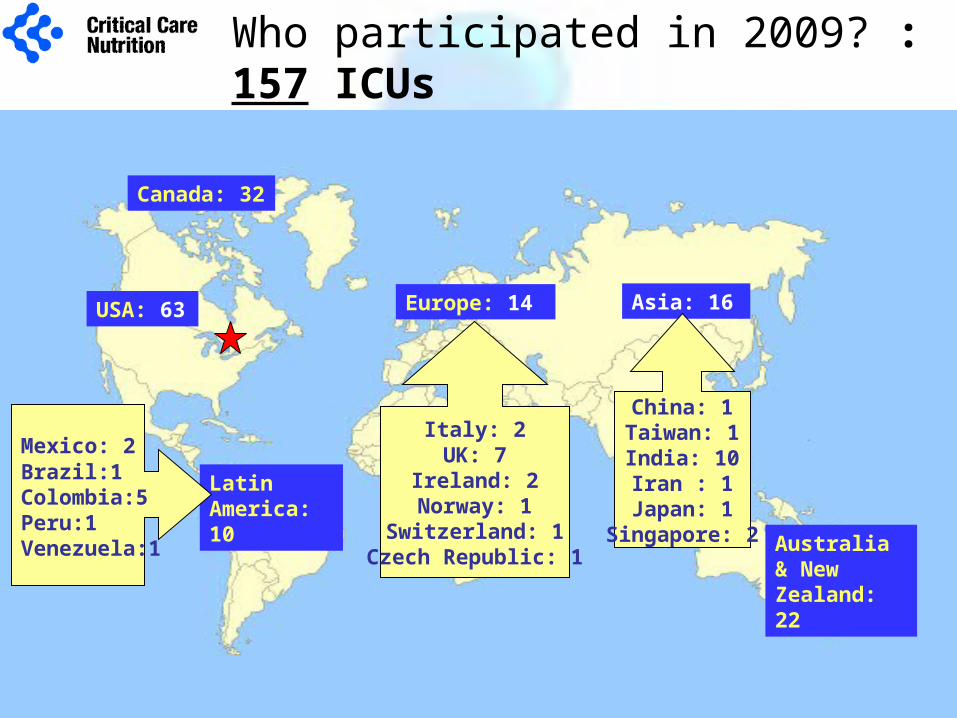
Canada: 32
USA: 63
Australia & New Zealand: 22
Europe: 14
Latin America: 10
Asia: 16
Mexico: 2 Brazil:1Colombia:5Peru:1Venezuela:1
Italy: 2UK: 7
Ireland: 2Norway: 1
Switzerland: 1Czech Republic: 1
China: 1Taiwan: 1India: 10Iran : 1
Japan: 1Singapore: 2
Who participated in 2009? : 157 ICUs
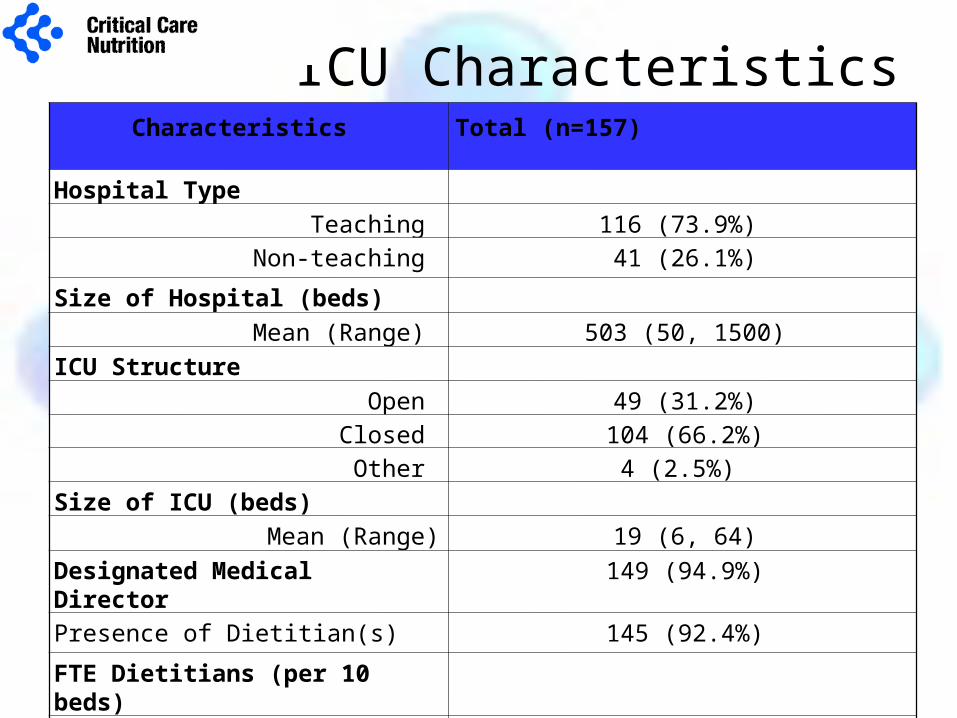
ICU CharacteristicsCharacteristics Total (n=157)
Hospital Type
Teaching 116 (73.9%)
Non-teaching 41 (26.1%)
Size of Hospital (beds)
Mean (Range) 503 (50, 1500)
ICU Structure
Open 49 (31.2%)
Closed 104 (66.2%)
Other 4 (2.5%)
Size of ICU (beds)
Mean (Range) 19 (6, 64)
Designated Medical Director 149 (94.9%)
Presence of Dietitian(s) 145 (92.4%)
FTE Dietitians (per 10 beds)
Mean (Range) 0.4 (0.0, 1.7)
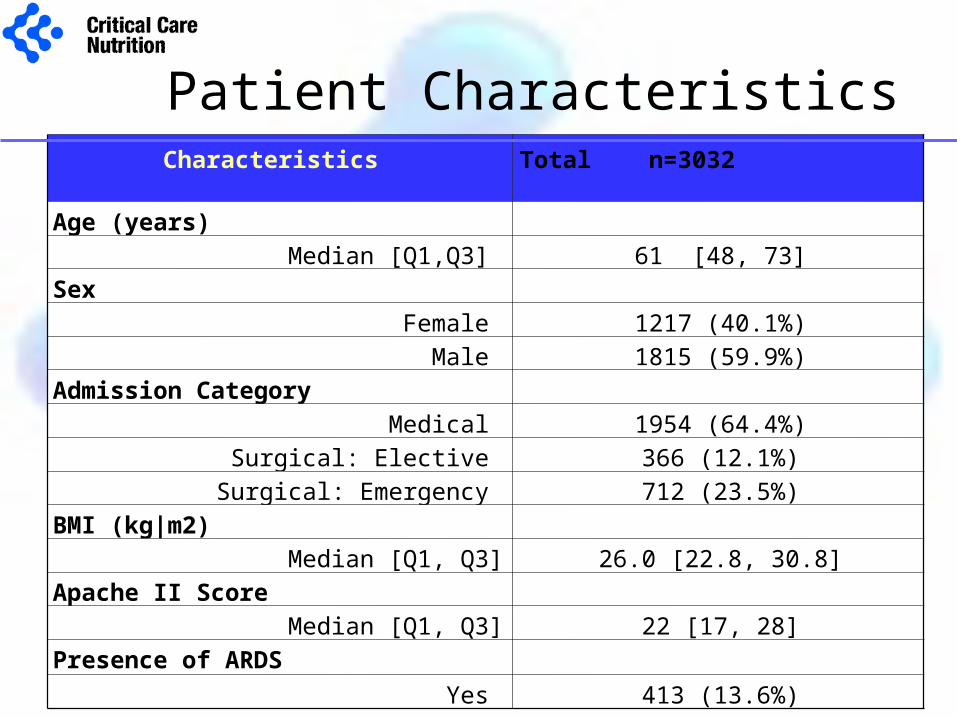
Patient CharacteristicsCharacteristics Total n=3032
Age (years)
Median [Q1,Q3] 61 [48, 73]
Sex
Female 1217 (40.1%)
Male 1815 (59.9%)
Admission Category
Medical 1954 (64.4%)
Surgical: Elective 366 (12.1%)
Surgical: Emergency 712 (23.5%)
BMI (kg|m2)
Median [Q1, Q3] 26.0 [22.8, 30.8]
Apache II Score
Median [Q1, Q3] 22 [17, 28]
Presence of ARDS
Yes 413 (13.6%)

We strongly recommend the use of enteral nutrition over
parenteral nutrition
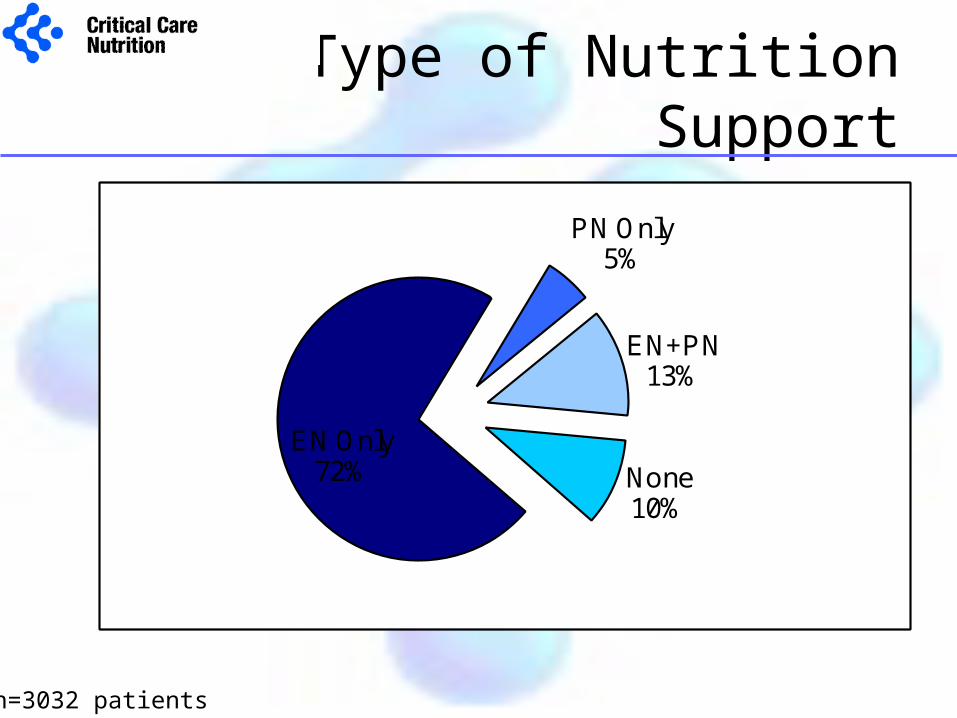
Type of Nutrition Support
n=3032 patients
EN Only72%
PN Only5%
EN+PN13%
None10%
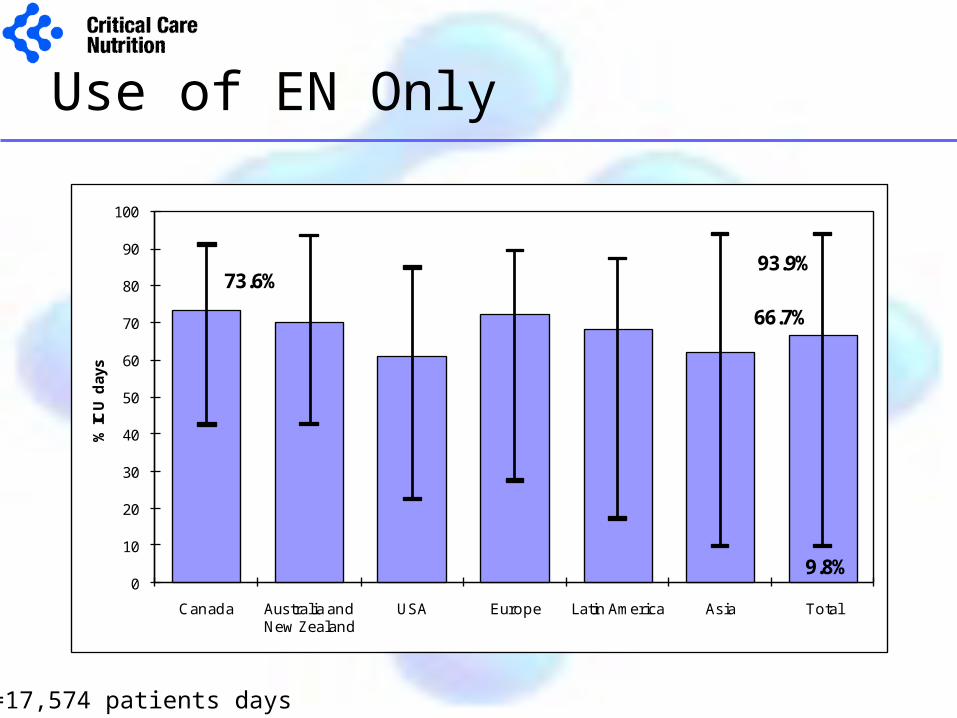
Use of EN Only
n=17,574 patients days
73.6%
66.7%
93.9%
9.8%0
10
20
30
40
50
60
70
80
90
100
Canada Australia and New Zealand
USA Europe Latin America Asia Total
% IC
U d
ays
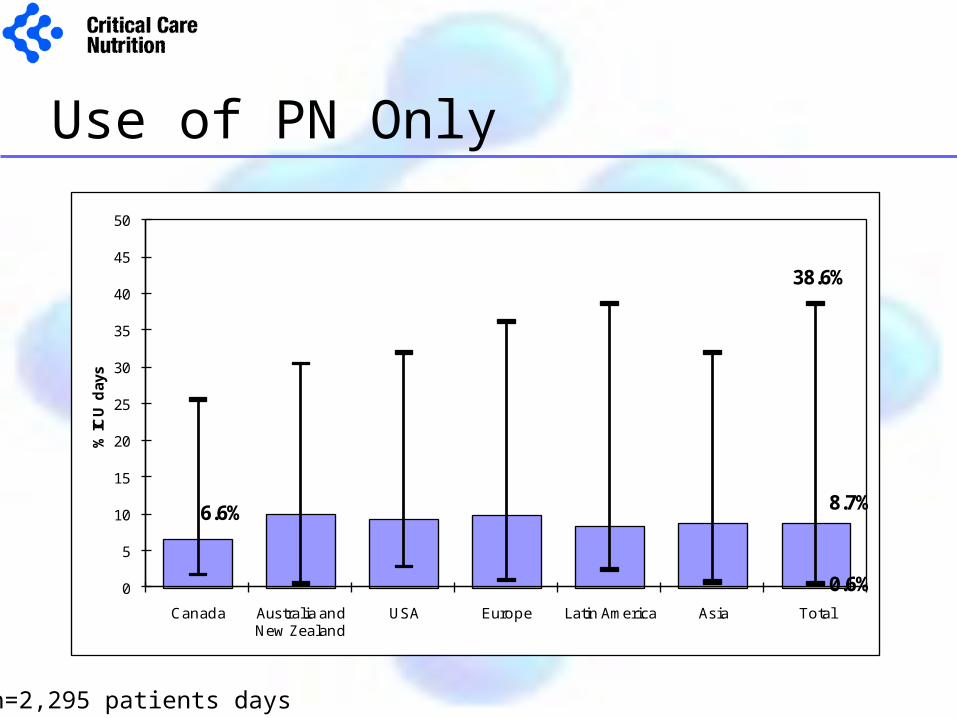
Use of PN Only
n=2,295 patients days
6.6% 8.7%
38.6%
0.6%0
5
10
15
20
25
30
35
40
45
50
Canada Australia and New Zealand
USA Europe Latin America Asia Total
% IC
U d
ays
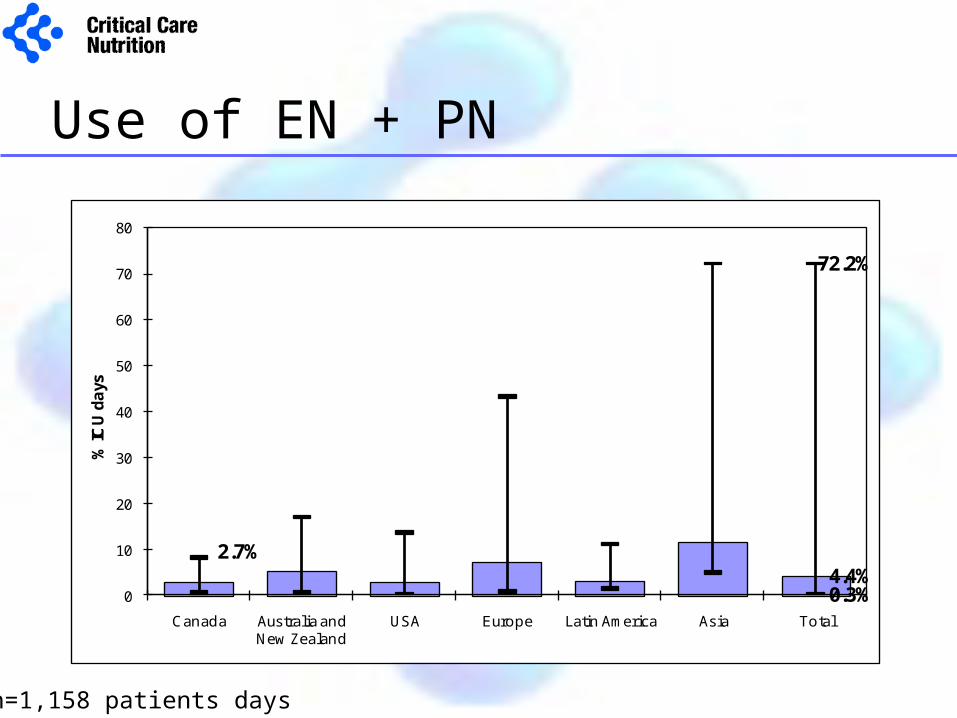
Use of EN + PN
n=1,158 patients days
2.7%4.4%
72.2%
0.3%0
10
20
30
40
50
60
70
80
Canada Australia and New Zealand
USA Europe Latin America Asia Total
% IC
U d
ays
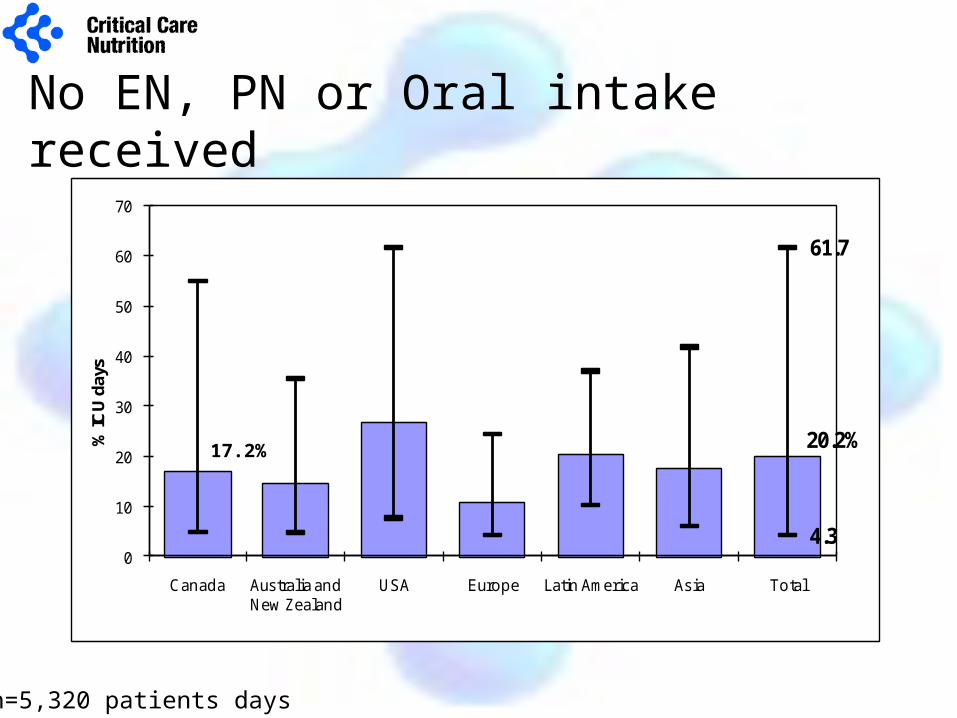
No EN, PN or Oral intake received
n=5,320 patients days
20.2%
61.7
4.30
10
20
30
40
50
60
70
Canada Australia and New Zealand
USA Europe Latin America Asia Total
% IC
U d
ays
17.2%
We recommend early enteral nutrition (within 24-48 hrs
following admission) in critically ill patients
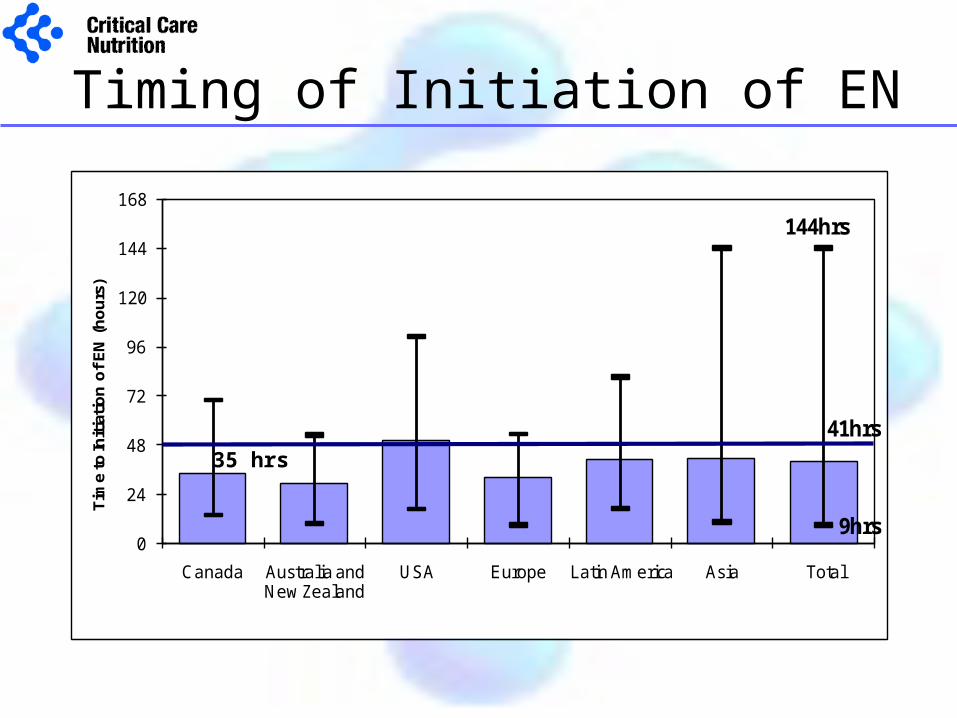
Timing of Initiation of EN
41hrs
144hrs
9hrs0
24
48
72
96
120
144
168
Canada Australia and New Zealand
USA Europe Latin America Asia Total
Tim
e to
Init
iati
on
of
EN
(h
ou
rs)
35 hrs
An evidence based feeding protocol should be considered
as a strategy to optimize delivery of enteral nutrition
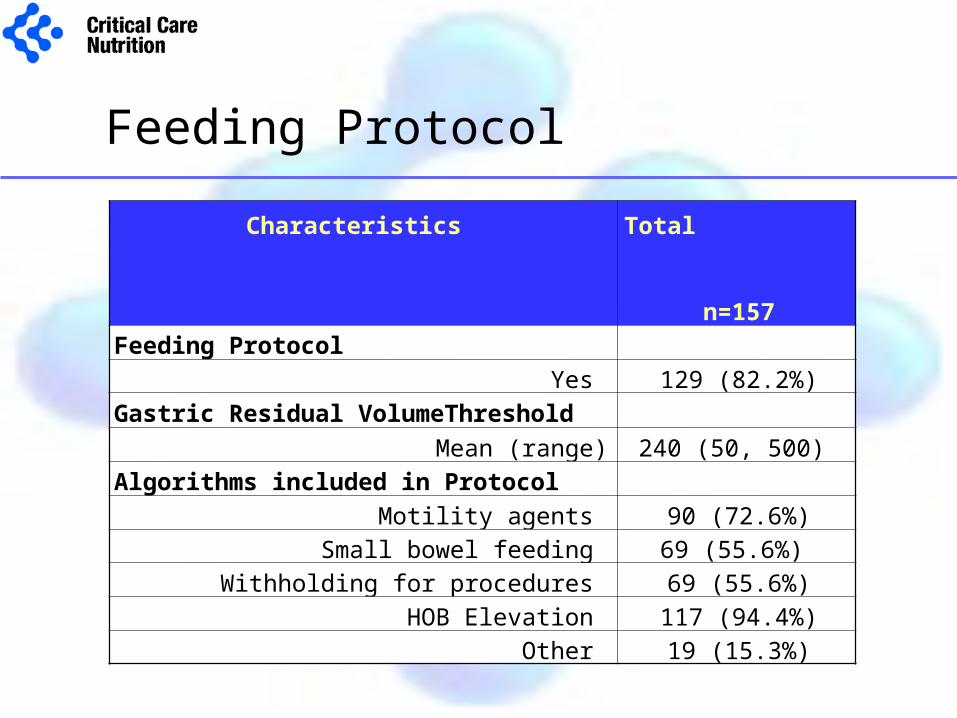
Feeding Protocol
Characteristics Total n=157
Feeding Protocol
Yes 129 (82.2%)
Gastric Residual VolumeThreshold
Mean (range) 240 (50, 500)
Algorithms included in Protocol
Motility agents 90 (72.6%)
Small bowel feeding 69 (55.6%)
Withholding for procedures 69 (55.6%)
HOB Elevation 117 (94.4%)
Other 19 (15.3%)
In critically ill patients who experience feed intolerance (high gastric residual volumes, emesis)
the use of a motility agent is recommended
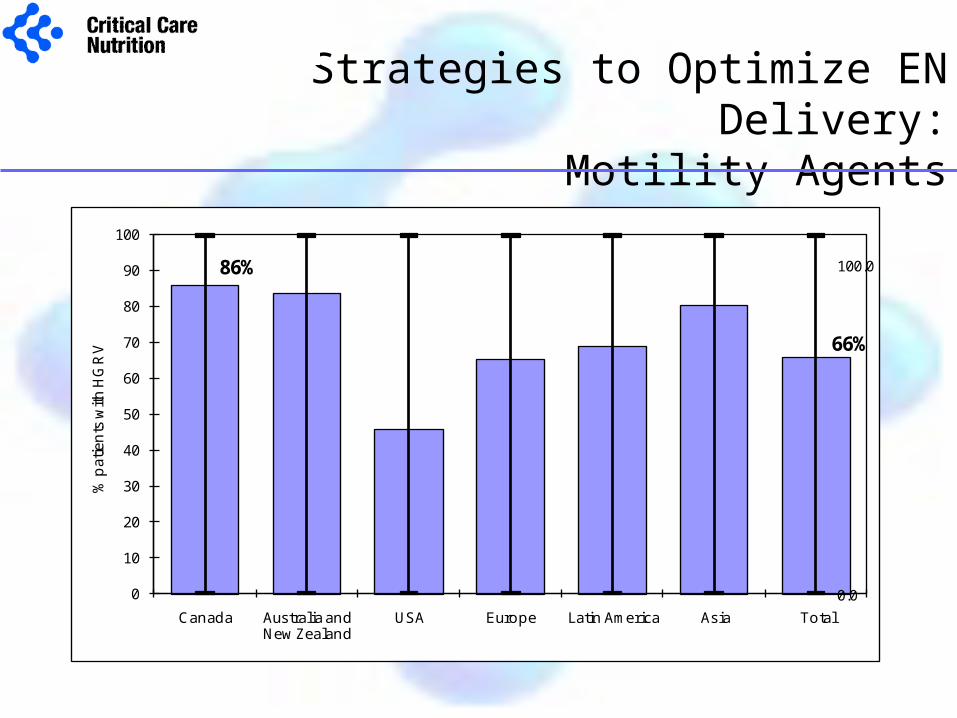
Strategies to Optimize EN Delivery:Motility Agents
86%
66%
100.0
0.00
10
20
30
40
50
60
70
80
90
100
Canada Australia and New Zealand
USA Europe Latin America Asia Total
% p
atie
nts
with
HG
RV
In units were achieving routine small bowel access is not
feasible small bowel feeding should be considered for patients who repeatedly demonstrate high gastric residual volumes and are
not tolerating EN
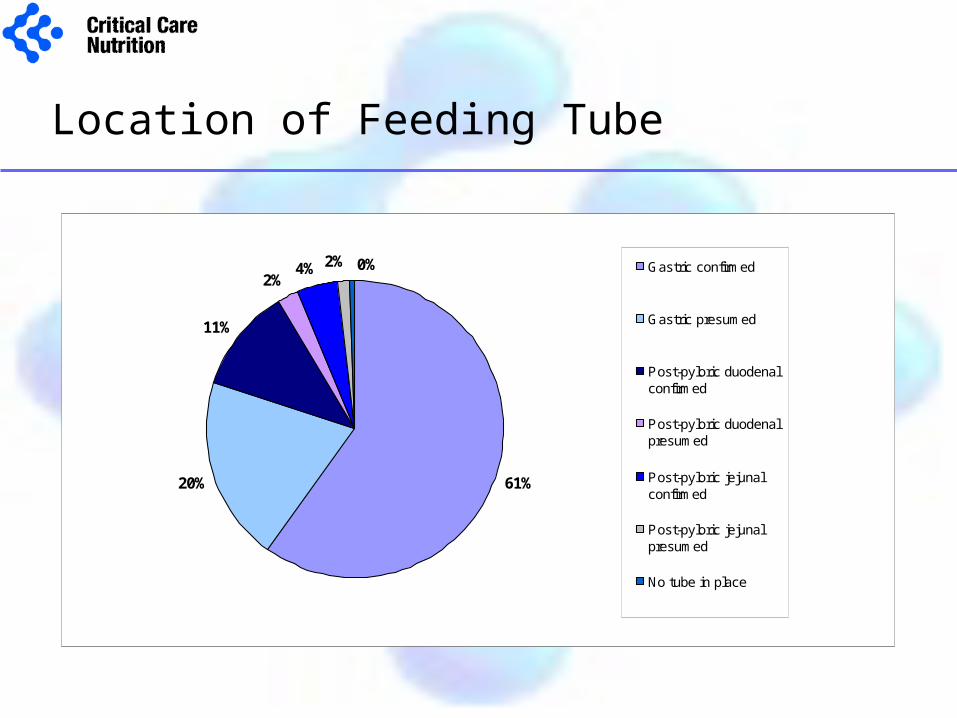
Location of Feeding Tube
61%20%
11%
2%4% 2% 0% Gastric confirmed
Gastric presumed
Post-pyloric duodenalconfirmed
Post-pyloric duodenalpresumed
Post-pyloric jejunalconfirmed
Post-pyloric jejunalpresumed
No tube in place
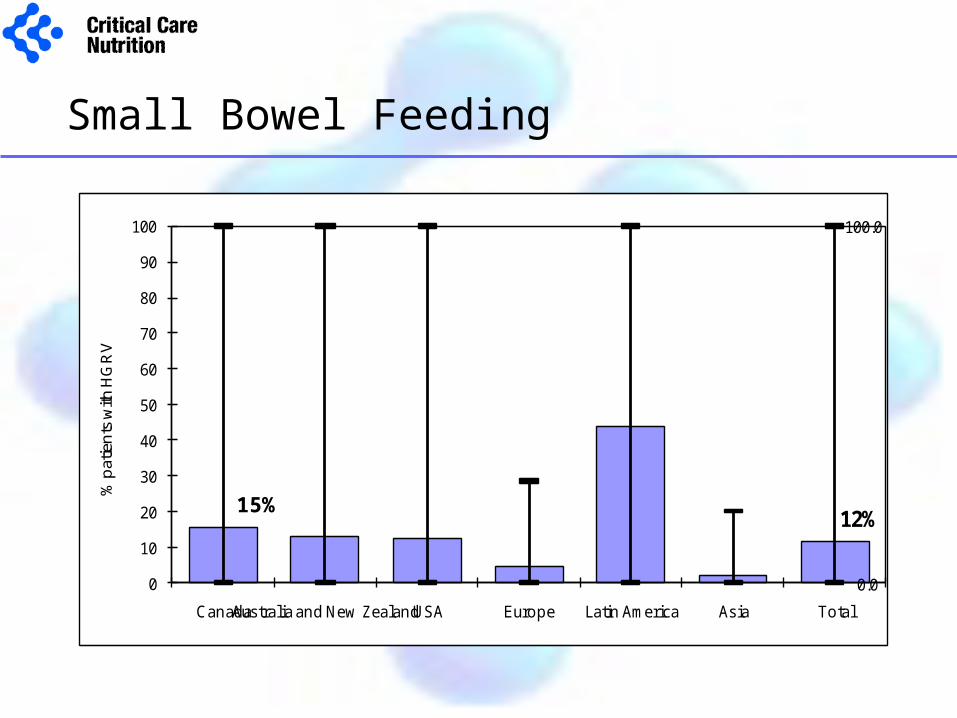
Small Bowel Feeding
12%
100.0
0.00
10
20
30
40
50
60
70
80
90
100
CanadaAustralia and New ZealandUSA Europe Latin America Asia Total
% p
atie
nts
with
HG
RV
15%
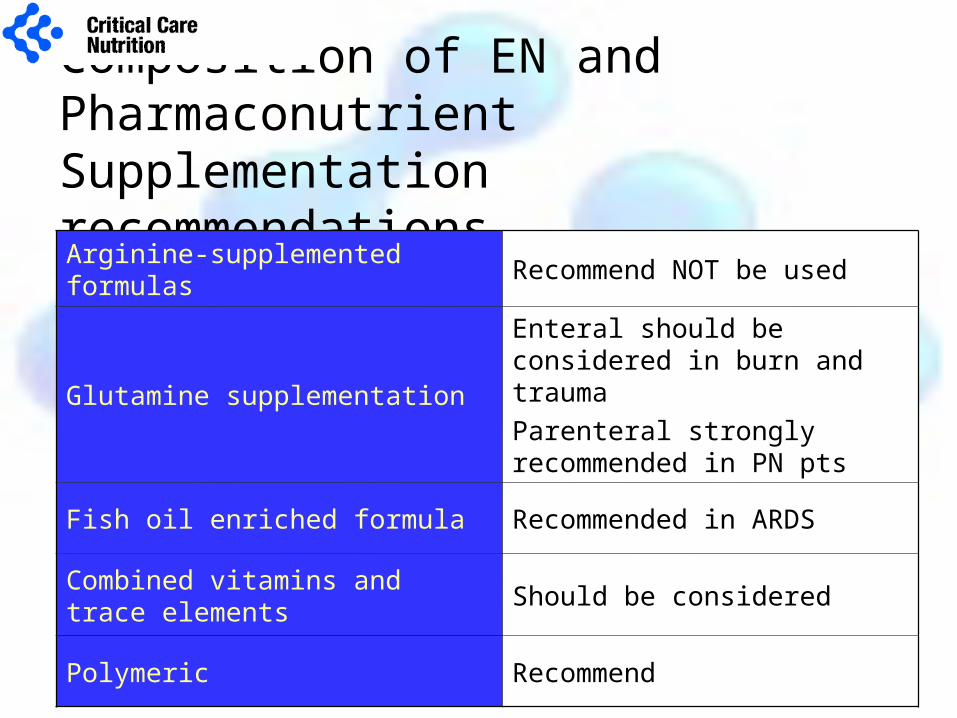
Composition of EN and Pharmaconutrient Supplementation recommendationsArginine-supplemented formulas Recommend NOT be used
Glutamine supplementation
Enteral should be considered in burn and trauma
Parenteral strongly recommended in PN pts
Fish oil enriched formula Recommended in ARDS
Combined vitamins and trace elements
Should be considered
Polymeric Recommend
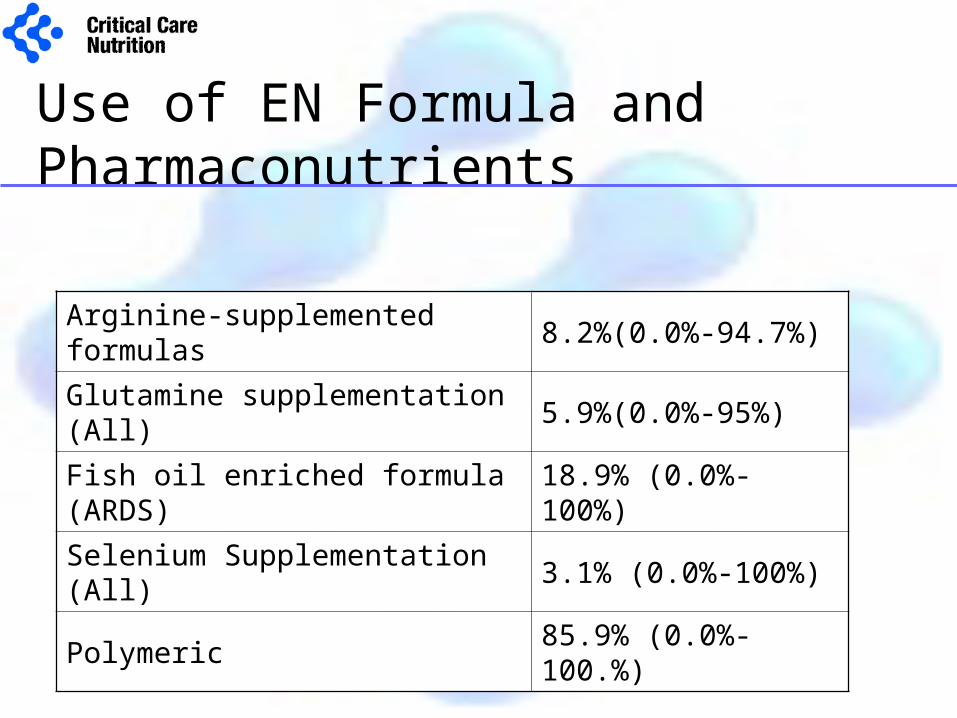
Use of EN Formula and Pharmaconutrients
Arginine-supplemented formulas 8.2%(0.0%-94.7%)
Glutamine supplementation (All) 5.9%(0.0%-95%)
Fish oil enriched formula (ARDS) 18.9% (0.0%-100%)
Selenium Supplementation (All) 3.1% (0.0%-100%)
Polymeric 85.9% (0.0%-100.%)
We recommend that hyperglycemia (blood sugars
>10mmol/l) be avoided
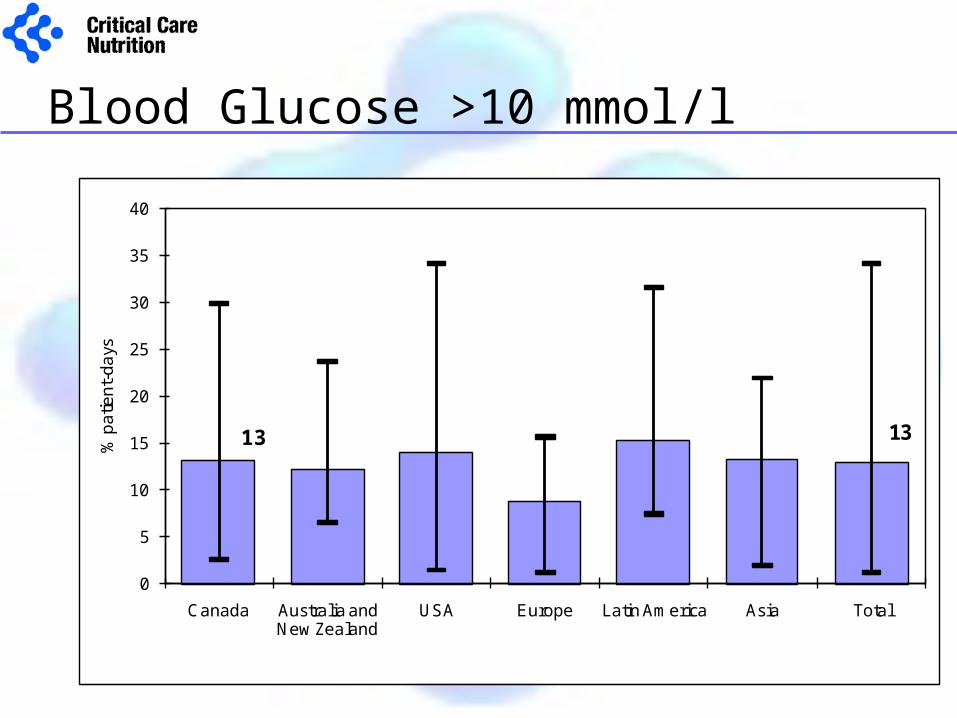
Blood Glucose >10 mmol/l
13
0
5
10
15
20
25
30
35
40
Canada Australia and New Zealand
USA Europe Latin America Asia Total
% p
atie
nt-
da
ys
13
Overall Performance
Adequacy of Nutrition Support =
Calories received from EN + appropriate PN+Propofol Calories prescribed
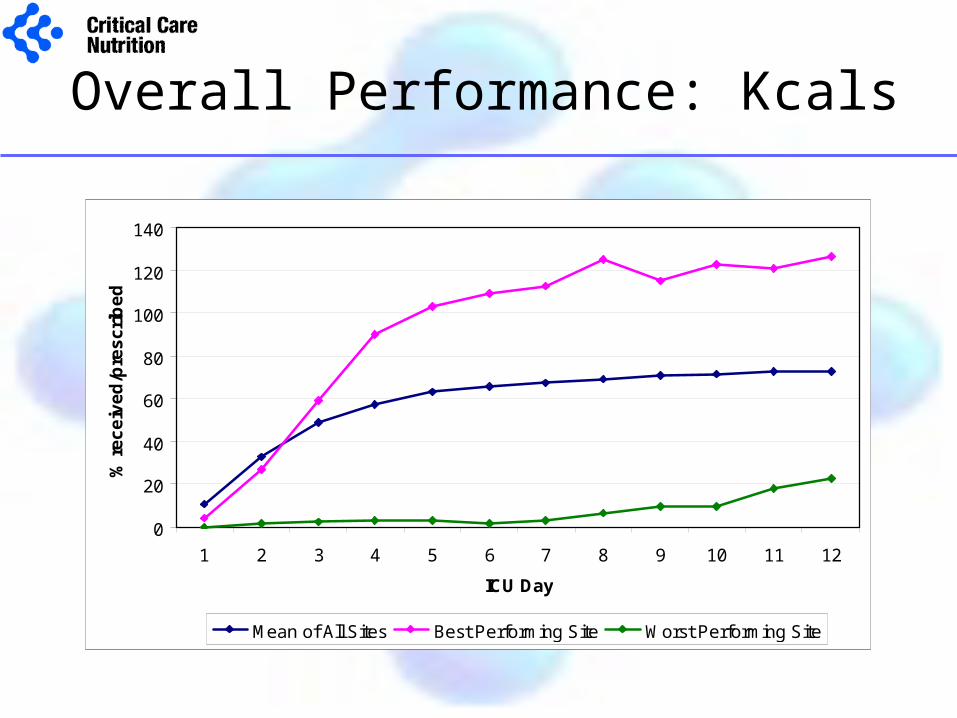
Overall Performance: Kcals
0
20
40
60
80
100
120
140
1 2 3 4 5 6 7 8 9 10 11 12
ICU Day
% r
ec
eiv
ed
/pre
sc
rib
ed
Mean of All Sites Best Performing Site Worst Performing Site
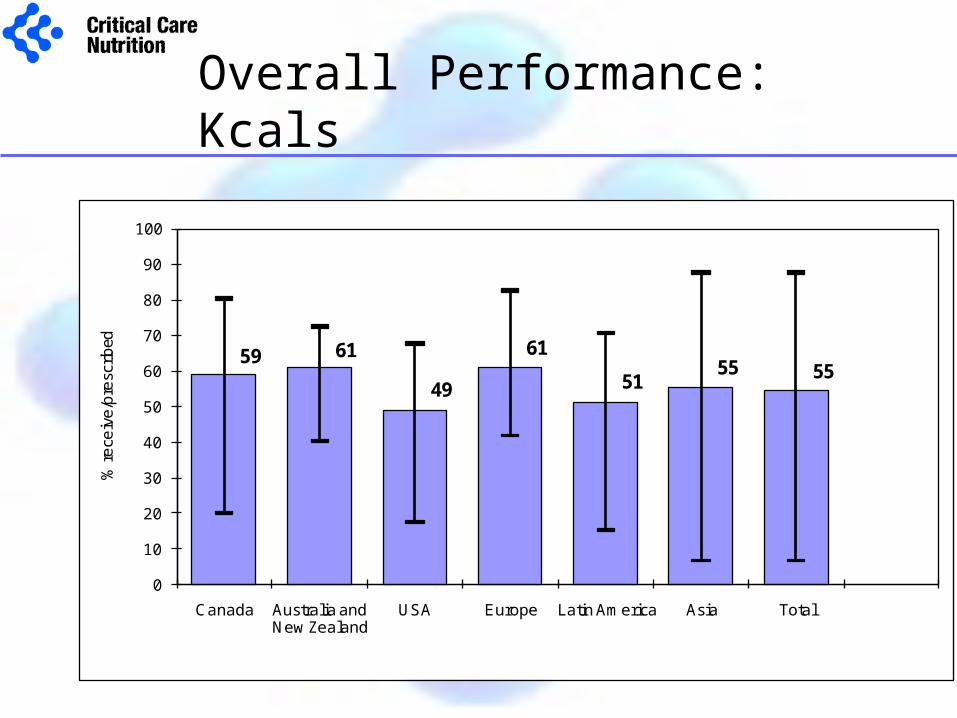
Overall Performance: Kcals
59 61
49
61
5155 55
0
10
20
30
40
50
60
70
80
90
100
Canada Australia and New Zealand
USA Europe Latin America Asia Total
% re
ceiv
e/p
resc
ribed

Where can we do better?
• Inadequate EN delivery– timing of initiation of EN– feeding protocols– small bowel feeding
• Optimize Pharmaconutrition– use of glutamine, antioxidants, omega-3 FFA.
• Tighten glycemic control
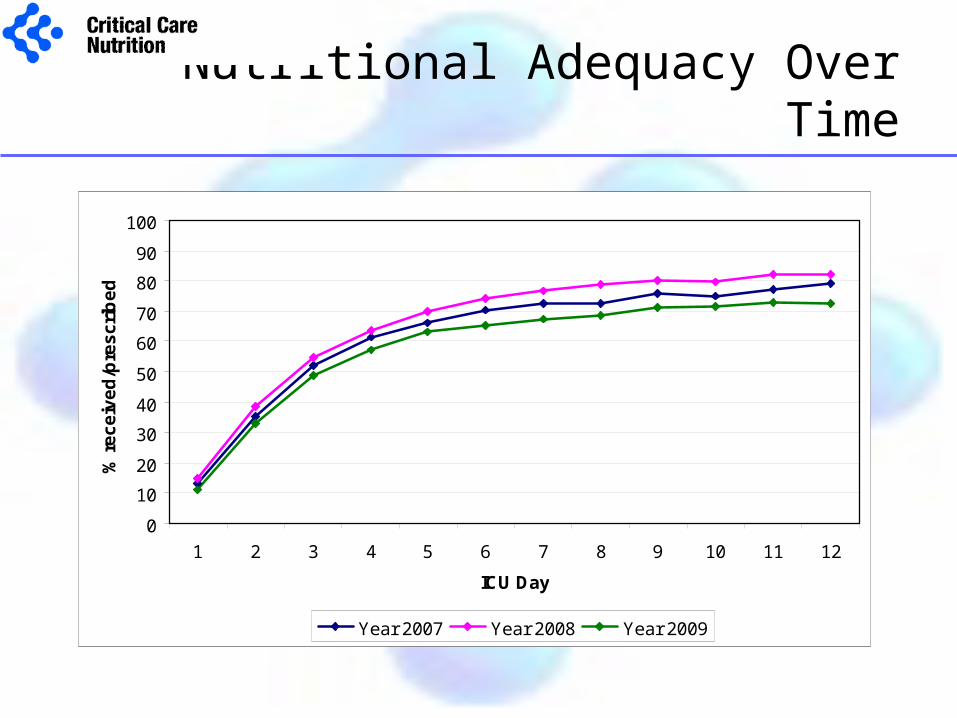
Nutritional Adequacy Over Time
0
10
20
30
40
50
60
70
80
90
100
1 2 3 4 5 6 7 8 9 10 11 12
ICU Day
% r
ec
eiv
ed
/pre
sc
rib
ed
Year 2007 Year 2008 Year 2009

Why Audit Nutrition Practice?
How are you performing at your site?
Can you be the Best of the Best?
Further Information: www.criticalcarenutrition.com