Embed Size (px)
Citation preview

International Journal of Science Arts and Commerce Vol. 2 No. 4, June-2017
www.ijsac.net 12
INTERNATIONAL JOURNAL OF SCIENCE ARTS AND COMMERCE
THE EFFECT OF COMPANY PERFORMANCE AWARDS ANNOUNCEMENT ON STOCK RETURNS OF FIRMS LISTED AT THE NAIROBI SECURITIES
EXCHANGE
BYRON OCHIENG’ OWANO KONGERE ZIPPORAH ONSOMU
AND JOAB OOKO
ABSTRACT This paper examined the effect of Company Performance Awards announcement on share returns of firms listed at the Nairobi Security Exchange, in particular the effect of the Company of the Year Awards organised by Kenya Institute of Management on share returns of firms listed at the Nairobi Security Exchange. A census was conducted and a descriptive design using the event study methodology was undertaken. The finding of this research is that the announcement of winning the Company of the Year Awards has no effect on stock returns. CHAPTER ONE: INTRODUCTION 1.1 Background of the Study Business corporations in the world are today faced with an environment that is globally competitive, complex and dynamic necessitating the implementation of programs to enhance on productivity, performance, product quality and service levels. Many companies are therefore implementing business excellence models (BEM) to improve their success in the market place .To assist firms to evaluate performance of their BEM, many quality promoting organisations today have developed national company performance awards. According to Ndirangu (2008), winning such an award enhances a company’s image because the recognition received from the media improves sales which translate to profits and in the long run shareholders wealth. This research is anchored on three theories critical in understanding how the stock market reacts to new information. These are the efficient market hypothesis (Fama, 1970) ,random walk (Fama, 1965) and behavioural finance theories (Shiller, 2000) .Fama (1970) advances in the efficient market hypothesis that at any moment in time, intrinsic value of individual
International Journal of Science Arts and Commerce Vol. 2 No. 4, June-2017
www.ijsac.net 13
securities already incorporates the effects of information based both on events that the market anticipates in the future or which have already taken place. Fama (1965) also suggests the theory of random walk which implies that a series of stock price changes does not depend on historical trends of stock performance and that sometimes prices may actually adjust in anticipation of new information even before this is available to the market and the earning prospect of the security is contingent on such fundamental factors as effectiveness of a firm’s managers, the economic environment and the industry performance etc. Emotional and psychological factors (behavioural finance) may also influence share valuation and it is important to also take them into consideration when evaluating the effect of share prices. Most companies listed at the Nairobi Securities Exchange (NSE) have embraced BEM and are consequently taking part in the Company of the Year Awards (COYA) in large numbers. Since its inception, 21 out of the 65 listed firms (or 32%) have participated in the awards; an indication of its growing popularity as a way of benchmarking on business excellence with competition to ensure a competitive edge. In that time, there have been 13 awards won by the listed firms either as winners or runners-up of the prestigious award. The winning companies have used the winning announcements to advertise themselves in the media and company websites ostensibly to send a signal to the market. In this way, the managers of these listed firms provide credible information to the market of their superiority as high quality firms and this information is important and may influence stock valuation.
1.1.1 Company Performance Awards Announcement Company performance awards are annual competitions that assess competing firms in pre-defined criterion on quality, and winning firms are those submissions that best fulfil the conditions of the award models. The model that is generally used is the Business Excellence Models (BEM) which is a management technique that support organisations to motivate thought and deed in a more methodical and organised way thus enhance performance. The models focus on all operations and processes of an organisation and precisely, factors that boost performance. Several company performance awards in the world use BEM and include The Deming Prize (DP) of Japan, European Foundation for Quality Management Excellence Model (EFQM) and Malcolm Baldrige National Quality Award (MBNQA) of the USA. Those in Africa include Egypt Quality Awards, South African Excellence Model, Company of the Year Awards in Kenya and National Quality Awards in Mauritania. According to Alonso-Almeida (2011) empirical evidence shows that participating firms are positively impacted by the process of implementing BEM and that award winners are those committed to on-going improvement and excellence. Essentially, the efforts deployed to attain the company performance awards (and the winning announcement) makes those firms more competitive and contributes to solidifying their position to operate more efficiently, and that the award also provides good marketing and helps improve the public image of the winning firm. Such a firm is perceived as more steadfast and responsible, and this enhances its profitability.

International Journal of Science Arts and Commerce Vol. 2 No. 4, June-2017
www.ijsac.net 14
1.1.2 Stock Market Returns Stock market returns are realised when an investor acquires stock from a company and in turn generates some profit from their investment in the stock. The returns could be dividend or capital in nature. Therefore depending on the dividend policy set and annual profitability, firms distribute a portion of their annual earnings as dividends to its shareholders. But the stock prices may also appreciate over time resulting in capital gains which usually crystalizes on disposal of the shares at a greater value than the acquisition cost thereby returning a profit. MacKinlay (1997) provides two categories of models for measuring the normal returns of a given security. These categories are the statistical and economic models. Statistical models include constant mean return model, market model and factor model. These models are based on the assumptions that assets returns are jointly multivariate normal, independently and identically distributed throughout the period under consideration. Economic models include the use of valuation models such as the Capital Asset Pricing Model (Sharpe, 1964) or Arbitrage Pricing Theory (Ross, 1976); it is hence possible to investigate whether the actual return on a security is in line with the security rate. According to Fama (1965) if actual price tends to move towards intrinsic value, then attempting to determine the true value of a security is equivalent to attempting to make a prediction of its future value; and this is the essence of the forecasting techniqueinherent in fundamental analysis. 1.1.3 Company Performance Awards Announcement and Stock Market Returns Company performance awards provide a framework which organisations can use to demonstrate their superiority as a result of implementing BEM. Hendricks and Singhal (1996) posits that the pronouncement of winning the prestigious awards delivers important information which is incorporated in share prices and effectively communicates to investors the value attached to the programs. Fama (1965) observed that the intrinsic values (of securities) can themselves adjustthrough time as a result of freshnews and investors will usually respond by holding on to the company’s shares, selling or buying. The reaction by investors will affect the demand or the supply of the shares resulting in price movements. Empirical evidence however suggests that it may not be possible to predict how the share prices will be impacted by the announcement of winning a company performance award. Hendricks and Singhal (1996) showed that stock markets reacted positively to the winning announcement resulting in mean abnormal returns of between 0.59 and 0.67 on the day of announcementsignifying the information content of the award, while Przasnyski and Tai (2002) results reinforced the semi strong EMH stating that winning the award was not surprizing andconsequently already reflected in the share value, therefore no price change was reported after the announcement. 1.1.4 Nairobi Securities Exchange The NSE operated as a professional body for stock brokers registered under the Societies Act until the 2012 when it was demutualised and listed under the Investments Services category. To date the NSE has 65 listed firms categorised into 11 different groups which include Telecommunication and Technology, Construction and Allied, Agriculture, Commercial & Services, Banking, Energy and Petroleum, Automobiles and Accessories, Investment,

International Journal of Science Arts and Commerce Vol. 2 No. 4, June-2017
www.ijsac.net 15
Insurance, Investment Services, Manufacturing and Allied. It is governed by the Capital Markets Authority (CMA) whose aim is to protect investor interest and develop all aspect of the capital market. The Company of the Year Awards was introduced as an assessment and reward program for organisational performance in the year 2000 by Kenya Institute of Management (KIM). It is an annual program that pursues identification and public recognition of firms that epitomise excellence and business ethics in their management practices. Company of the Year Awards uses the Organisation Performance Index (OPI) to review the performance of participating companies. This BEM uses seven global determinants (see appendix I.) designed to ensure that organisations are outlining and implementing strategies deliberate to meet the needs of all interested parties to the business.
In Kenya, many listed companies have implemented BEM and participated in the Company of the Year Awards since its inception. 21 out of the 65 listed firms have participated in the company performance awards(see appendix IV) and consequently 13 awards won by the listed firms (see appendix II) either asoverall winners or runners-up. Similarly, the firms have won numerous criteria awards including Manager of the year and CEO of the year awards. The listed companies by nature of their regulatory framework and operational standards governed by the CMA are poised to play vital part in the growth of the Company of the Year Awards especially with non-listed firms benchmarking themselves to their listed counterparts therefore improving level of competitiveness and performance. 1.2 Research Problem Firms go through a rigorous process while preparing to participate in company performance awards. In Kenya, since inception of the Company of the Year Awards in the year 2000,172 companies have participated in the award out of which 21 are listed firms. This is 32% of all the listed firms at the NSE, 13 of which have won awards. With more firms expected to participate, knowledge of the effect of winning an award on share returns becomes an important consideration for listed firms and may in fact motivate participation. This is an area that deserves further research particularly in the context of the NSE. Available finance literature is cognisant of the fact that this subject has been debated and researched by many academicians, mainly in developed countries. However the outcomes are inconsistent therefore; there is need to explore the subject further for better understanding particularly in the NSE context. There is a set of empirical studies that provide proof of significant abnormal returns on the announcement of winning a company performance award (Hendricks & Singhal, 1996; Ndirangu, 2008; Bu, Tang, & Tian, 2012; Lin & Sue, 2013; Alber, 2013). Another body of literature conversely suggests that winning the award is not unexpected and already reflected in the market prices therefore no abnormal returns are reported (Przasnyski & Tai, 2002; Cheah, 2005; Gupta & Dwivedi, 2012), while a third set of studies conclude that implementing quality programs has no significance ( Muturi, Ochieng& Njihia, 2015). On the basis of the conflicting information, it seems quite difficult to conclusively predict the effect based on available literature.The motivation of this research, is to enable a better

International Journal of Science Arts and Commerce Vol. 2 No. 4, June-2017
www.ijsac.net 16
understanding of phenomenon and to seek answers to the questions; whatis the effect of Company of the Year Awards announcement on share returns of firms listed at the NSE? 1.3 Research Objective To determine the effect of Company of the Year Awards announcement on share returns of firms listed at the NSE. 1.4 Value of the study The research provides a critical insight for policy makers at the Capital Markets Authority for initiatives focussed on identifying and discouraging speculations at the bourse. The regulations should encourage complete and timely release of information to the market, monitor trading operations and put in place programs to educate the public on the essence of proper analysis of share performance. This is fundamental to the reduction of speculative activity at the capital market, thereby eliminating tendency of investor over-reaction and under-reaction which are the recipes for burbles in the market causing price distortion. The findings also offer general impetus for listed companies to understand the financial implications of implementing BEM. These projects require large cash outlay that could result in the agency problem if not properly communicated. More so, there is no assurance that implementing BEM projects will lead to better financial performance. The study will also impart knowledge in the finance discipline, more specifically on information content of financial decisions and efficiency of the stock markets. This will be of immense benefit to scholars and students of finance and economics who may be interested in carrying out more research in this area. CHAPTER TWO: LITERATURE REVIEW 2.1 Theoretical Review Theories have been developed which explain the signalling effects of events on share returns. The models include efficient market hypothesis (Fama, 1970), random walk theory (Fama, 1965) and behavioural finance theory (Shiller, 2000; Shleifer, 2000). These are explained as follows: 2.1.1 Efficient Market Hypothesis A place in which share values always reflect available information is known as an efficient market(Fama ,1970). According to Fama (1970) in an efficient market, any anticipated effects of the price influencing factors should occur at the time of occurrence or shortly after. This is because there is no anticipation of such effects and no delay in the appearance of this effect once the announcement is made. Fama (1970) specified the forms of informational efficiency as strong form efficiency, semi-strong form and weak form. The strong form of market efficiency asserts that share values reflect information that is known to any player in the market place both in the public domain and privately while in the weak form, share values completely reflect the information

International Journal of Science Arts and Commerce Vol. 2 No. 4, June-2017
www.ijsac.net 17
contained in an array of past (historical) prices. The semi-strong form which is the focus of this study, affirms that share prices reflect all significant information that is publicly available. No market can however be perfectly efficient and what exists is a variation of the above forms of market efficiency. 2.1.2 The Random Walk Hypothesis Fama (1965) suggests that the theory of random walks which implies that a series of stock price changes does not depend on historical trends of stock performance and that sometimes prices may actually adjust in anticipation of new information even before this is available to the market. The earning prospect of the security is also contingent on such fundamental factors as effectiveness of the firms’ managers, the economic environment and the industry performance. According to Fama (1965), because there is ambiguity or doubt surrounding fresh information, the instant adjustments has two repercussions; First, security values will initially over-adjust to variations in the intrinsic values as often as they will under-adjust. Second, the delay in the complete changes in actual price to succeeding new intrinsic value will itself be independent and randomly variable with the adjustment of actual prices sometimes coming before the happening of the event, which is the basis for the adjustment in pricing (that is, when the event is foreseen by the market before it actually happens) and sometimes after it happens. This means that the instant adjustment property of an efficient market implies that succeeding price changes in individual securities will be independent. A market where successive price changes are independent is, by definition a random walk market. 2.1.3 Behavioural Finance Shleifer (2000) introduces a different approach to the study of capital markets called the behavioural finance. It starts with an observation that the assumptions of investor rationality and perfect arbitrage are significantly challenged by both psychological and institutional evidence. In actual capital markets, investors who are not fully rational trade against profit seekers whose wealth are limited by risk aversion, short horizons, and agency problems. According to Shleifer (2000), behavioural finance models elucidate the existing financial statistics better than the EMH and generate new practical predictions. By summarizing and expanding the research in behavioural finance, he builds a new theoretical and empirical foundation for the economic analysis of real-world markets. Shleifer (2000), further expounds the concept. He observed that the stock market in the nineteen nineties was facing a great swell in stockvalues, that there was something profoundly irrational but subtle. This could only be described as irrational exuberance, the psychological basis of a speculative bubble. 2.2 Empirical Review Hendricks and Singhal (1996) examined the impact of winning a quality award on the market price of the firm by estimating the average abnormal change in share prices on firms.The sample represented award winners from over 140 different award givers but restricted to 600 publicly quoted firms in the United States and an event study methodology was used.The results show that the stock market reacts positively to winning announcement.

International Journal of Science Arts and Commerce Vol. 2 No. 4, June-2017
www.ijsac.net 18
Przasnyski and Tai (2002) undertook an empirical study of stock performance of Malcolm Bridge National Quality Awards (MBNQA) winning companies in the United States between 1988 and 1998 using event study. The results supported the semi strong efficient market hypothesis and stated that since the winning companies had taken several years to transform, winning the award was not unanticipated and therefore already incorporated in the market prices. Cheah (2005) undertook an event study to examine the effect of the announcement of winning The Prime Minister Quality Award (PMQA) on stock performance. It was found that the announcement of the results did not yield any statistically significant abnormal returns to the market participants holding or trading the securities concerned. Ndirangu (2008) conducted an event study to establish whether or not the Company of the Year Awards announcements have any effect on share prices for firms listed in the Nairobi Securities Exchange. The results of the study showed that when a listed company participated in the Company of the Year Awards, the accumulative adjusted abnormal returns were affected depending on whether the company won or not. Gupta and Dwivedi (2012) undertook an empirical examination of the impact of excellence model awards on security market performance of selected Indian firms. The empirical study found that the performance of those companies that have achieved excellence awards in India or excellence prices do not show in clear terms that they gain advantage for shareholders in stock markets over benchmark indices. Bu, Tang and Tian (2012) based their empirical data from the Chinese security markets and by using an event study methodology investigated the relationship between quality awards and the market performance of quoted companies that have won quality awards from 2001 to 2009 in China. Their finding showed that in the short term, the winner would get significantly accumulated abnormal high returns, which differed due to risk in investments, the company’s size and the prestige of the awards.
Lin and Sue (2013) undertook an empirical study on the Taiwan National Quality award and market value of the firms using event study. The results show that abnormal returns reacted positively to award announcements;this however did not happen on the announcement day. Alber (2013) analysed the effects of quality announcements on performance of Egyptian quoted firms. The results showed that the information content of competitive advantage has a positive effect on abnormal returns of firms quoted in Egyptian exchange. Muturi, Ochieng and Njihia (2015) undertook an empirical study to establish effect of ISO 9001 implementation on performance of organisations in Kenya. It targeted firms quoted on the Nairobi Securities Exchange. Results of the survey reveal that ISO 9001 certification influences return on net assets of the firms, consequently impacting performance. On the other hand, for net profit and turnover, there were no significant difference between the ISO 9001 certified organisation and the ones not certified, and also no significant differences across sectors of companies reviewed in the survey. CHAPTER THREE: RESEARCH METHODOLOGY 3.1 Research Design and Population of the Study A descriptive design using Event Study Methodology was adopted in this study. According to MacKinlay (1997) event studies are well-established tools which usesecurity market data to

International Journal of Science Arts and Commerce Vol. 2 No. 4, June-2017
www.ijsac.net 19
measure the effect of specific events on shareholders’ value through changes of the share price. This research focused on listed firms that won the Company of the Year Awards either as the overall winner or first or second runner up. The research covered the 10 year period from 2006 to 2015. In total the Company of the Year Awards has attracted participation from 172 firms out of which 21were listed at the NSE (see appendix II). In the period of research 6 of the listed firms won 12awards (with 2 firms winning the award twice) and this was the sample that this research used. In effect, a census of all listed firms that won the Company of the Year Awards was conducted (see Appendix III).
3.2 Data Collection The researcher used secondary data obtained from the NSE Secretariat information database and information containing the list of companies that participated in the Company of the Year Awards as provided by KIM. The information included the announcement date of the awards and the daily stock prices before, during, and after the Company of the Year Awards announcement to monitor fluctuation of share prices. The variables examined therefore are the independent variable which is the announcement date of the Company of the Year Awards and the dependent variable which is the stock returns. The dependent variable is therefore used as a measure of the effect of the independent variable, making it possible to infer that the event, in this case the Company of the Year Awards is responsible for the change in the stock prices. For the independent variable, data was collected on the announcement dates of all company performance awards of listed companies between 2006 and 2015 from KIM while for the dependent, data was collected relating to the share prices in the period of 50 days before and after the event date from the NSE. The event window of 5 days before and after the announcement date was selected to control the results by eliminating risk of other announcements being made in the period. CHAPTER FOUR: DATA ANALYSIS, FINDINGS AND CONCLUSION 4.1 Data analysis In this study secondary data collected from NSE secretariat and information containing the list of companies that participated in the Company of the Year Awards as provided by KIM was used. A census was conducted and abnormal returns of six listed firms that participated and won the Company of the Year Awards were analysed, these were, Mumias Sugar Company Limited (MSC), Barclays Bank of Kenya Limited (BBK), Bamburi Cement Limited (BCL), Nation Media Group (NMG), British-American Investment Company (K) Limited (BRITAM), and Jubilee Holdings Limited (JHL) covering ten year period from 2006 to 2015. To determine the effect of Company of the Year Awards announcement on share returns of firms listed at the NSE, the event study methodology as described by Brown and Warner (1985) was used. Market model, which is a statistical model that relates the returns of any given security to the return of the market portfolio, was adapted to measure and analyse the abnormal returns. The abnormal returns are assumed to reflect the stock market’s reaction to

International Journal of Science Arts and Commerce Vol. 2 No. 4, June-2017
www.ijsac.net 20
the announcement of Company of the Year Awards. Microsoft Excel was used to analyse the data. The presentation and interpretation of data was done in form of graphs and tables for every firm which had won the Company of the Year Awards and average standardized abnormal returns across the six firms were computed and test statistic done to test whether the abnormal returns were significantly different from zero (its expected value). The event window was taken to be five days prior to and five days after the event, event date is the Company of the Year Awards announcement date and observed as zero.
A standard event study methodology as described by Brown and Warner (1995) was used. To construct an event study, the event, event date, event window, estimation window and estimation model was determined. The event of study in this case is the Company of the Year Awards announcement and the event date was the date on which the announcement was made, and the study was concerned with the relationship of the said event and the share price movement. The event window comprised 5 days before and after the event date. The estimation period was the period prior to occurrence of the event. Generally, estimation period and event window was chosen in such a way that they did not overlap. The estimation period for this study was 45 days. This can be expressed as t = -50 to t = -5. The selected examination model of this study is the Standard Market Model, which assumes a linear relationship between the return of the security and the return of the market portfolio. In studying the information content of Company of the Year Awards announcements, abnormal returns were computed. These abnormal returns were obtained by finding the difference between actual return of security i on day t and the expected return of security i on day t.
The following is the formula for Ordinary Least Square (OLS) market model used to compute abnormal returns:-ARit = Rit- ERit
Where ARit = Abnormal return of security i on day t Rit = Actual return on security i on day t ERit = Expected return on security i on day t Actual return on security i in period tis computed as follows:-
Where
Pit = Price of security i on day t Pit-1 = Price of security i on day prior to day t Dt = Dividends paid at time t Expected return on security i in period tis computed as follows:- E(Rit) = α i+ β iRmt

International Journal of Science Arts and Commerce Vol. 2 No. 4, June-2017
www.ijsac.net 21
Where α i= The intercept term β i= Relative riskiness of the security to market index Rmt = The rate of return on market index on the day t The t-test statistic was used to assess whether the abnormal returns were significantly different from zero (its expected value) is:
Where:
Mean paired difference =
= Hypothesized population paired mean difference (zero)
=sample standard deviation for paired differences (abnormal returns)
n = Number of paired values in the sample (number of days in the event window)
In summary, this study used101 daily returns surrounding each Company of the Year Awards announcement date, which is 45 days abnormal returns for the pre-event period and the event day and 45 days abnormal returns for the post-event period. The event window comprised of 5 days pre-event date and 5 days post-event date and to facilitate data analysis, Microsoft Excel was used. The diagram below summarizes the key parameters used in the event study methodology:
To reduce the effect of another event that may happen simultaneously along with the Company of the Year Awards announcements, the size of the event window was reduced to 5 days pre-event date and 5 days post-event date. According to Brown and Warner (1985), the small event windows increase the likelihood to manage the other events happening simultaneously. To reduce the strength of other events in the data base, data on any news around event dates and event windows was collected and analysed, to ensure that they may not impact stock returns. This ensured a precise evaluation of effect centred on the objective of the event of research and also so as to capture any insider trading during the event date which might have an impact on the stock return.
Event date
Event Window Post-vent Window
Estimation Window
0 -50 -6 +6 +50

International Journal of Science Arts and Commerce Vol. 2 No. 4, June-2017
www.ijsac.net 22
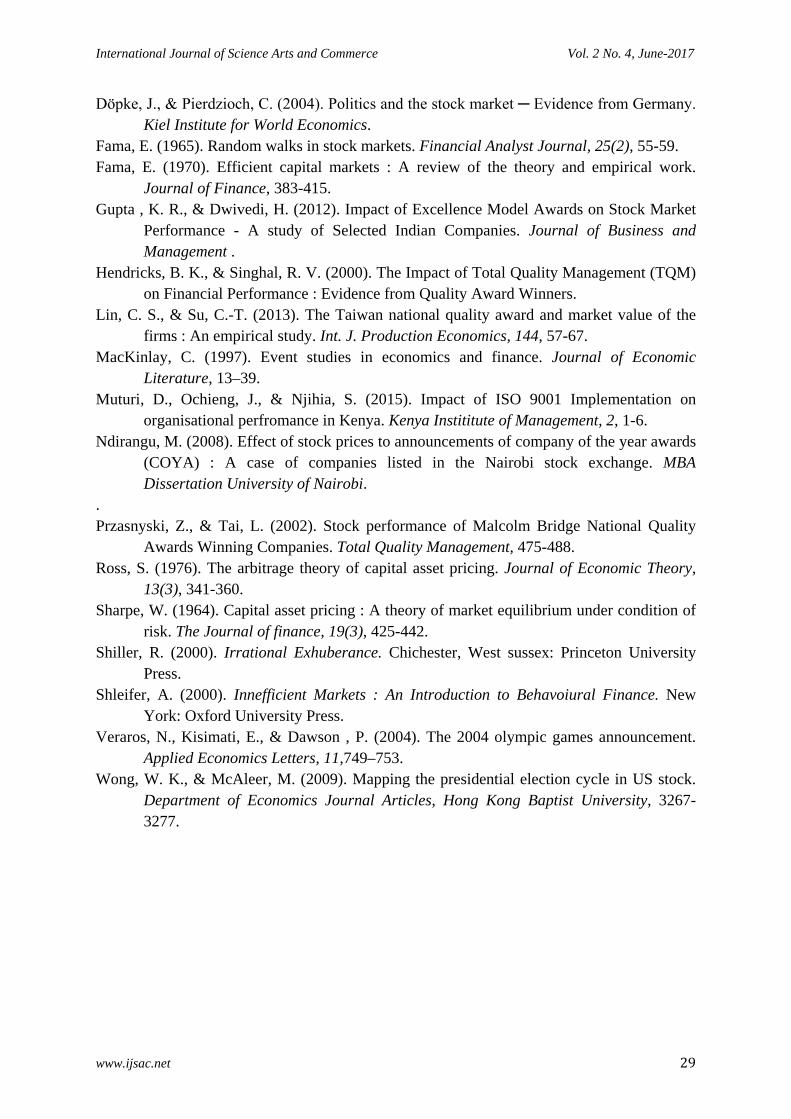
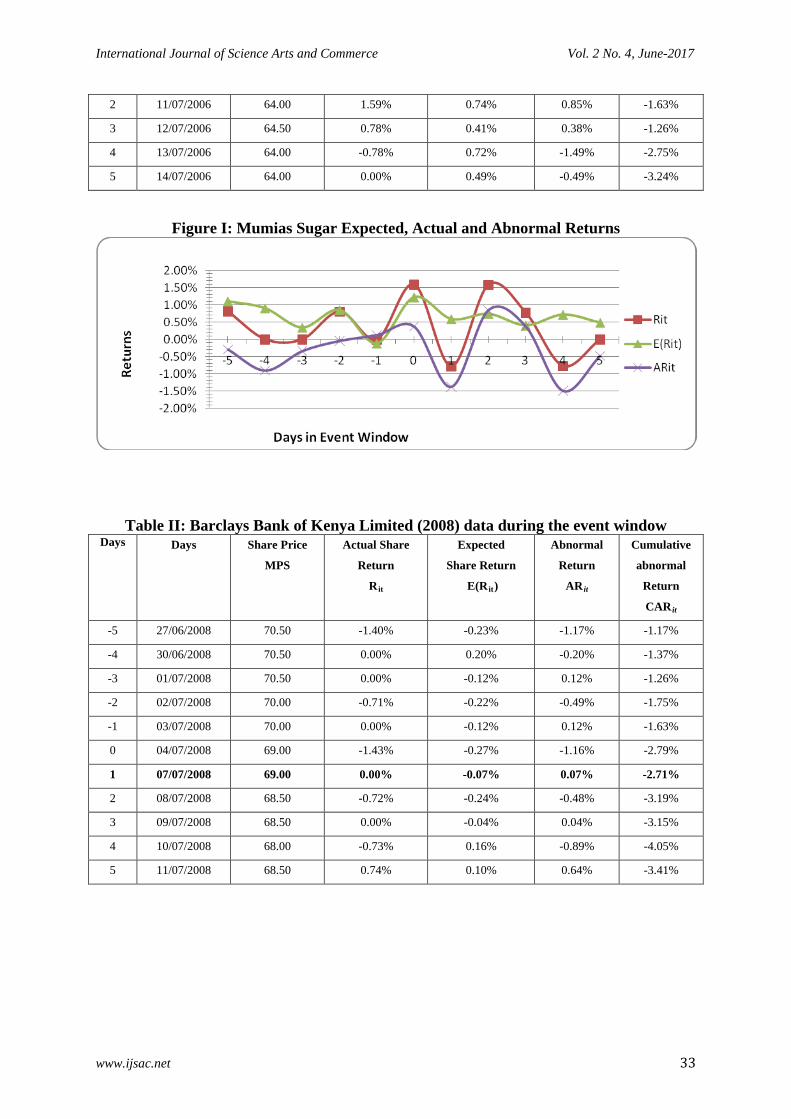
The mean abnormal returns and cumulative abnormal returns were computed and hypothesis testing of the results was thereafter undertaken. The H₀ in this research was that the Company of the Year Awards announcements have no effect on stock return verses the Hᵢ that Company of the Year Awards announcements have an effect on stock returns. 4.2 Data presentation and interpretation. The winning announcements of the Company of the Year Awards are characteristically made at the gala dinner after the stock market close for the day. In most years, the announcements were made on Friday evening, in which case the information could only be incorporated in the share price once the stock market opened on Monday morning. This is also the time that the press would release and publish information on the winning announcement for public consumption. Notwithstanding, those who closely follow the awards would have been able to receive the information earlier by attending the gala dinner, through social media, news items on television and other forms of communication. 4.2.1 Mumias Sugar Company data during the event window From the analysis of the data in Table I (see appendix), on the first day when the information was available to the market (+1), abnormal returns of -1.38% was reported. This figure is lower than the previous day’s abnormal returns of +0.37% and this rose to 0.85% on the second day but dropped to -0.49% by the fifth day. A cumulative return of -3.24% is recorded. The abnormal returns increases gradually on pre-event date after which it fluctuate more sharply after the announcement date, with a sharp decline a day after the announcement after which it rises reaching its peak on day two. It thereafter declines sharply on day four when in reaches the lowest point during the event window. This movement indicates the effect of the announcement. The market price of the share fell from Ksh.63.50 to Ksh. 63.00 at the time of the announcement of the event. This represents 0.79% decline in the stock prices. The share price rose to Ksh. 64.50 on the third day and closing at Ksh. 64.00 on the last day of the event window. 4.2.3 Barclays Bank of Kenya Limited (2008) data during the event window From the analysis of the data in Table II (see appendix) ,on the first day the information was available to the market (+1)abnormal returns of +0.07% was reported. This figure is higher than the previous day’s abnormal returns of -1.16% and this dropped to -0.48% on the second day but rose to 0.64% by the fifth day. A cumulative return of -3.41% is recorded. The abnormal returns fluctuates all through the event window achieving the lowest level on the event date, but picking up on the first day when the information concerning the event was available at the stock market, after which the normal oscillation continues to the highest level on the last day of the event window. The market price of the share fell from Ksh.69.00 to Ksh. 68.50 on the second day after the announcement of the event. This represents 0.72% decline in the stock prices. The share price dropped further to Ksh. 68.00 on the fourth day and closing at Ksh. 68.50 on the last day of the event window.
International Journal of Science Arts and Commerce Vol. 2 No. 4, June-2017
www.ijsac.net 23
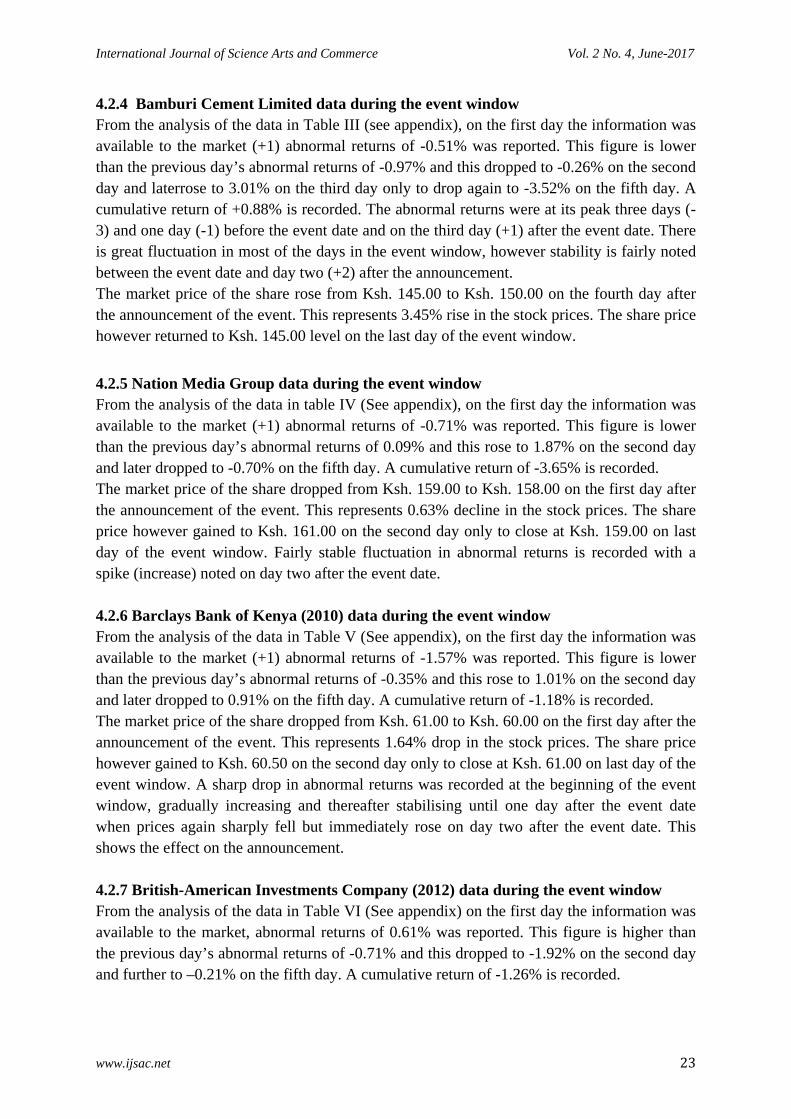
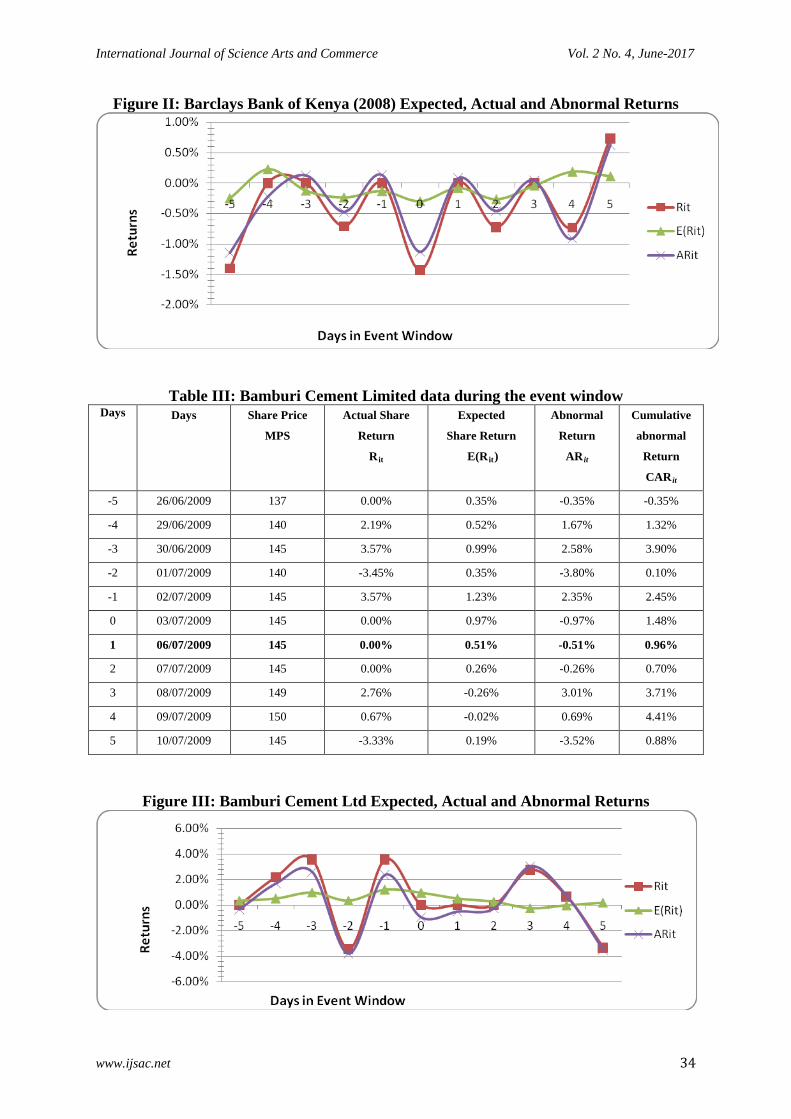
4.2.4 Bamburi Cement Limited data during the event window From the analysis of the data in Table III (see appendix), on the first day the information was available to the market (+1) abnormal returns of -0.51% was reported. This figure is lower than the previous day’s abnormal returns of -0.97% and this dropped to -0.26% on the second day and laterrose to 3.01% on the third day only to drop again to -3.52% on the fifth day. A cumulative return of +0.88% is recorded. The abnormal returns were at its peak three days (-3) and one day (-1) before the event date and on the third day (+1) after the event date. There is great fluctuation in most of the days in the event window, however stability is fairly noted between the event date and day two (+2) after the announcement. The market price of the share rose from Ksh. 145.00 to Ksh. 150.00 on the fourth day after the announcement of the event. This represents 3.45% rise in the stock prices. The share price however returned to Ksh. 145.00 level on the last day of the event window. 4.2.5 Nation Media Group data during the event window From the analysis of the data in table IV (See appendix), on the first day the information was available to the market (+1) abnormal returns of -0.71% was reported. This figure is lower than the previous day’s abnormal returns of 0.09% and this rose to 1.87% on the second day and later dropped to -0.70% on the fifth day. A cumulative return of -3.65% is recorded. The market price of the share dropped from Ksh. 159.00 to Ksh. 158.00 on the first day after the announcement of the event. This represents 0.63% decline in the stock prices. The share price however gained to Ksh. 161.00 on the second day only to close at Ksh. 159.00 on last day of the event window. Fairly stable fluctuation in abnormal returns is recorded with a spike (increase) noted on day two after the event date. 4.2.6 Barclays Bank of Kenya (2010) data during the event window From the analysis of the data in Table V (See appendix), on the first day the information was available to the market (+1) abnormal returns of -1.57% was reported. This figure is lower than the previous day’s abnormal returns of -0.35% and this rose to 1.01% on the second day and later dropped to 0.91% on the fifth day. A cumulative return of -1.18% is recorded. The market price of the share dropped from Ksh. 61.00 to Ksh. 60.00 on the first day after the announcement of the event. This represents 1.64% drop in the stock prices. The share price however gained to Ksh. 60.50 on the second day only to close at Ksh. 61.00 on last day of the event window. A sharp drop in abnormal returns was recorded at the beginning of the event window, gradually increasing and thereafter stabilising until one day after the event date when prices again sharply fell but immediately rose on day two after the event date. This shows the effect on the announcement. 4.2.7 British-American Investments Company (2012) data during the event window From the analysis of the data in Table VI (See appendix) on the first day the information was available to the market, abnormal returns of 0.61% was reported. This figure is higher than the previous day’s abnormal returns of -0.71% and this dropped to -1.92% on the second day and further to –0.21% on the fifth day. A cumulative return of -1.26% is recorded.

International Journal of Science Arts and Commerce Vol. 2 No. 4, June-2017
www.ijsac.net 24
The market price of the share dropped from Ksh. 5.70 to Ksh. 5.60 on the first day after the announcement of the event. This represents 1.75% drop in the stock prices. The share price however further dropped to Ksh. 5.55 and closed at the same price on last day of the event window. 4.2.8 Jubilee Holdings Limited data during the event window From the analysis of the data, on the first day the information was available to the market, abnormal returns of -0.45% was reported. This figure is lower than the previous day’s abnormal returns of 0.65% and this dropped to -1% on the third day only to increase to 5.21% on the fourth day and close at 0.87% on the fifth day. A cumulative return of 0.81% is recorded. The market price of the share rose from Ksh. 10.30 to Ksh. 10.35 on the second day after the announcement of the event. This represents 0.49%gain in the stock prices. The share price thereafter dropped to Ksh. 10.30 on the third day only to close at Ksh. 11.05 on final day of the event window. 4.2.9 British-American Investments Company (2013) Expected, Actual and Abnormal
Returns Looking at Figure VII(See appendix),a sharp drop in abnormal returns is recorded to the lowest level one day before the event date, theafter there is a rise stabilising between the event date and day three after the announcement. There after a sharp increase then a dip is recorded on the second last and last day of the event window respetively. Test of significance was performed at 5% significance level and p-value found to be 0.2154. From this observation, this research can conclude that there is no significant difference between the observed return and expected returns and the difference is due to chance. This research consequently fails to reject H₀; therefore concluding that the Company of the Year Awards announcement had no effect on the share returns of this particular stock. Test of significance was performed at 5% significance level and p value found to be 0.1089. From this observation, this research can conclude that there is no significant difference between the observed return and expected returns and the difference is due to chance. This research consequently fails to reject H₀; therefore concludes that the Company of the Year Awards announcement had no effect on the share returns of this particular stock. 4.3 Hypothesis testing 4.3.1 t-test data result for Mumias Sugar Company Test of significance was performed at 5% significance level and p value found to be 0.9099. From this observation, this research can conclude that there is no significant difference between the observed return and expected returns and the difference is due to chance. This research consequently fails to reject H₀; therefore concludes that the Company of the Year Awards announcement had no effect on the share returns of this particular stock.

International Journal of Science Arts and Commerce Vol. 2 No. 4, June-2017
www.ijsac.net 25
4.3.2 t-test data result for Barclays Bank of Kenya (2008) Test of significance was performed at 5% significance level and p value found to be 0.3623. From this observation, this research can conclude that there is no significant difference between the observed return and expected returns and the difference is due to chance. This research consequently fails to reject H₀; therefore concludes that the Company of the Year Awards announcement had no effect on the share returns of this particular stock. 4.3.3 t-test data result for Bamburi Cement Ltd Test of significance was performed at 5% significance level and p value found to be 0.6905. From this observation, this research can conclude that there is no significant difference between the observed return and expected returns and the difference is due to chance. This research consequently fails to reject H₀; therefore concludes that the Company of the Year Awards announcement had no effect on the share returns of this particular stock. 4.3.4 t-test data result for Nation Media Group Test of significance was performed at 5% significance level and p value found to be 0.9219. From this observation, this research can conclude that there is no significant difference between the observed return and expected returns and the difference is due to chance. This research consequently fails to reject H₀; therefore conclude that Company of the Year Awards announcement had no effect on the share returns of this particular stock. 4.3.5 t-test data result for Barclays Bank of Kenya (2010) Test of significance was performed at 5% significance level and p value found to be 0.0001. From this observation, this research can conclude that there is a significant difference between the observed return and expected returns and the difference is not due to chance. This research consequently rejects H₀; therefore concludes that the Company of the Year Awards announcement had an effect on the share returns of this particular stock. 4.3.6 t-test data result for All Firms This research fails to reject the H₀as the test for significance at 5% as the test significance performed found the p-value to be 0.9039. Similar results are obtained for all the other sampled firms when studied individually as indicated in Table III, except for JHL in2015 where p value was found to be0.0001. For this particular stock, H₀ is rejected indicating that the results are statistically significant and therefore Company of the Year Awards announcement had an effect on the share returns of this particular stock. 4.4 Discussion of Research Findings Average returns were generated for the event date and various event windows five days prior to the announcement and five days after the announcement of the Company of the Year Awards winners. Six listed firms (but eight samples as BBK and BRITAM won twice in different years) that participated and won the Company of the Year Awards were analysed and the results yielded mixed reactions.

International Journal of Science Arts and Commerce Vol. 2 No. 4, June-2017
www.ijsac.net 26
In general there is an effect on share returns as indicated by the average abnormal returns of +0.0322% post announcement and a mean cumulative abnormal returns of +0.187% in the event window period. This indicates that indeed the Company of the Year Awards announcement has information content and there is value to the shareholders, however test for significance performed at 5% significance level found the p-value to be 0.9039indicating that there is no significant difference between the observed return and expected returns and the difference may be due to chance. This means that the Company of the Year Awards announcements do not have an effect on the share return. These findings are consistent with research by Przasnyski and Tai (2010) who concluded that the lack of market reaction should not be interpreted as a negative statement regarding the award announcements but merely a confirmation that the market is semi strong efficient. That information of companies with quality improvement efforts is already available in the market and already reflected in the price of the shares which incorporated the achievements at the time of the announcement. Cheah (2005) similarly supports this hypothesis, that stock analyst expect world class companies to maintain high level of quality and winning an award is in accordance with expectations. Further, right from the onset of implementing quality improvement projects, stock markets quickly discount the information and therefore the outcome of winning an award is not surprising to the market. In our case therefore, quality listed firms that embrace the BEM already send a positive signal to the market, therefore when a firm like MSC, BBK, BCL, NMG, BRITAM and JHL participated in the Company of the Year Awards, they were expected to perform well against their peers and information of winning therefore should not jolt the market. The stocks may however have been affected by the Weekend or Monday effect; this is evident by the delay in incorporating the winning information in the stock prices. Since the winning companies are generally announced during a gala dinner on Friday night, the information cannot be incorporated in share prices until Monday morning when the market open. The daily press usually also publishes this information on Monday making it available to the general public. Ruto (2014) conducted a study to establish the existence of Monday effect of stock returns at the NSE, the result of which showed that stock prices hit the highest prices on Friday and dipped on Monday, consistent with the Monday effect theory and this is evident from the results of this study. From the empirical evidence, prices only effectively adjusted on Tuesday morning and the effect then would not be as effective as the information is already in the public domain through-out the weekend, making it obsolete and therefore would not considerably impact pricing. In the year 2015 however, when JHL won, an abnormal return of +137% and a cumulative abnormal return of +12.5% was reported and test for significance performed at 5% significance level found the p-value to be 0.0001. For this particular stock, H₀ is rejected indicating that the results are statistically significant and therefore Company of the Year Awards announcement had an effect on the share returns. This research may therefore suggest based on the findings that investors at the NSE are more recently taking cognizance of the critical need to improve organisational performance, need to remain competitive by benchmarking with the best in class, and need to assure continuous improvement. That firms that implement tools such as the BEM and win national awards in the current time send a stronger signal to the market leading to increase in shareholders’. A number of listed firms in

International Journal of Science Arts and Commerce Vol. 2 No. 4, June-2017
www.ijsac.net 27
Kenya have more recently received negative publicity due to poor management and lack of competitiveness resulting in poor share performance. There is therefore a lot of motivation to deal with the agency problem and information asymmetry and winning the Company of the Year Awards provides independent, factual and material information on the firm’s internal management that would otherwise not be available to investors. It is possible that the stock market is now appreciating the role of the BEM and Company of the Year Awards and accepting it as an important instrument in providing credible information about a firm’s management that may impact stock valuation at the NSE. 4.5 Conclusion The general conclusion in this research is that the announcement of winning the Company of the Year Awards does not result in statistically significant abnormal results at the NSE. This research therefore fails to reject the H₀, that the Company of the Year Awards announcements have no effect on stock return. This supports the semi-strong form of the EMH which affirms that share values reflects all significant information that is publicly available and random walk theory in which Fama (1965) posits that sometimes prices may actually adjust in anticipation of new information even before this is available to the market. Since stock prices of listed companies are closely monitored, announcement of winning the Company of the Year Awards after implementing the BEM is not unexpected and may not therefore surprise the market. This information may have gradually been incorporated in share prices which the winning announcement only reinforces to the market as was anticipated. 4.6 Limitation of the study Although the research achieved its objective, there were some unavoidable limitations. First, the size of the population was small, only six listed firms have won the Company of the Year Awards(with BBK and BRITAM winning twice) between 2006 and 2015 as either winners, first runners up or second runners up, therefore a census was conducted. To generalise the results to the NSE, the study should have involved more firms. Secondly, in most years, the announcements were made on Friday evening, in which case the information could only be incorporated in the share price once the stock market opened on Monday morning. This is also the time that the press would release and publish information on the winning announcement to the public. The results may therefore have been affected by stock market anomalies more specifically the Monday and weekend effect. Lastly, the research is only applicable to Company of the Year Awards announcements between 2006 to 2015 and its effect at the NSE, finding on JHL performance in 2015 must be applied with caution outside these parameters as more data on company performance awards in the period after 2015 may be necessary to generalise the conclusion made. 4.7 Recommendations Although the study concluded that the Company of the Year Awards has no effect on share returns, there was evidence of abnormal returns in all the companies sampled, which means that the announcement has some information content, but the results may have been affected

International Journal of Science Arts and Commerce Vol. 2 No. 4, June-2017
www.ijsac.net 28
by the weekend or Monday effect. The researcher recommends that the Company Performance Awards organisers consider moving the gala night to a day between Tuesday and Thursday; this effectively will result in the impact of the winning announcement to be incorporated in the share prices on the next day with little interference from the Monday or weekend effect. The outcome of the results may be different and have the effect of attracting more listed firms to participate in the awards. The effect of JHL winning the awards in 2015 on its share performance may indicate a shift in the way the market perceives Company of the Year Awards. It may seem that the investors and stock analysts are now taking note of the effort and the outcome of implementing the BEM and particularly where a listed company takes the crown. This is an important outcome, as listed companies can use this as an avenue of sending a strong signal to the market on their internal management qualities and this may have a positive influence on their share performance in the stock exchange and reinforce their commitment to continually improve the firm’s performance. 4.8 Suggestions for further research The researcher suggests a study on difference listed firms that have won different performance awards (e.g. Financial Reporting Award (FiRE), Company of the Year Awards (COYA), Energy Management Awards (EMA), The Banking Awards, Insurance Awards and other performance awards) after the year 2015 to compare the results of JHL.This will provide empirical evidence of the effect of different types of company performance awards on share returns at the NSE, in the recent years for a more comprehensive and all inclusive inference. REFERENCES Alber, N. (2013). Competitive advantage of performance of stock market : The case of Egypt.
International Journal of Economics and Finance, 5(11),133-144. Alonso-Almeida, D. M. (2011). Quality awards and excellence models in Africa : An
empirical analysis of structure and positioning. Africa Journal of Business Management.
Brown, S. J., & Warner, J. B. (1985). Using daily stock returns : The case of event studies. Journal of Financial Economics, 14, 3-31.
Bu, X., Tang, J., & Tian, S. (2012). Quality award and market performance : An Empirical Investigation about Chinese stock market. Jurnal of Applied Business and Economics 13(3), 25-35.
Cheah, E. (2005). Managing a quality and stock markey reaction : Evidence from Malasia. InternationalJournal of Applied Quality Management,2,1-9.
DeBondt, W., & Thaler, R. (1985). Does the stock market overreact. Journal of Finance, 40, 793-805.
International Journal of Science Arts and Commerce Vol. 2 No. 4, June-2017
www.ijsac.net 29
Döpke, J., & Pierdzioch, C. (2004). Politics and the stock market ─ Evidence from Germany. Kiel Institute for World Economics.
Fama, E. (1965). Random walks in stock markets. Financial Analyst Journal, 25(2), 55-59. Fama, E. (1970). Efficient capital markets : A review of the theory and empirical work.
Journal of Finance, 383-415. Gupta , K. R., & Dwivedi, H. (2012). Impact of Excellence Model Awards on Stock Market
Performance - A study of Selected Indian Companies. Journal of Business and Management .
Hendricks, B. K., & Singhal, R. V. (2000). The Impact of Total Quality Management (TQM) on Financial Performance : Evidence from Quality Award Winners.
Lin, C. S., & Su, C.-T. (2013). The Taiwan national quality award and market value of the firms : An empirical study. Int. J. Production Economics, 144, 57-67.
MacKinlay, C. (1997). Event studies in economics and finance. Journal of Economic Literature, 13–39.
Muturi, D., Ochieng, J., & Njihia, S. (2015). Impact of ISO 9001 Implementation on organisational perfromance in Kenya. Kenya Instititute of Management, 2, 1-6.
Ndirangu, M. (2008). Effect of stock prices to announcements of company of the year awards (COYA) : A case of companies listed in the Nairobi stock exchange. MBA Dissertation University of Nairobi.
. Przasnyski, Z., & Tai, L. (2002). Stock performance of Malcolm Bridge National Quality
Awards Winning Companies. Total Quality Management, 475-488. Ross, S. (1976). The arbitrage theory of capital asset pricing. Journal of Economic Theory,
13(3), 341-360. Sharpe, W. (1964). Capital asset pricing : A theory of market equilibrium under condition of
risk. The Journal of finance, 19(3), 425-442. Shiller, R. (2000). Irrational Exhuberance. Chichester, West sussex: Princeton University
Press. Shleifer, A. (2000). Innefficient Markets : An Introduction to Behavoiural Finance. New
York: Oxford University Press. Veraros, N., Kisimati, E., & Dawson , P. (2004). The 2004 olympic games announcement.
Applied Economics Letters, 11,749–753. Wong, W. K., & McAleer, M. (2009). Mapping the presidential election cycle in US stock.
Department of Economics Journal Articles, Hong Kong Baptist University, 3267-3277.

International Journal of Science Arts and Commerce Vol. 2 No. 4, June-2017
www.ijsac.net 30
APPENDICES Appendix I: Criterion for assessing companies at the COYA
Criterion Definition
Leadership Shows how the firm supports staff at different levels to
ensure continuous quality implementation
Strategic Planning Shows how the firm develops, communicates implements
and expands its business policy and strategy to ensure
competitiveness.
Customer and market orientation Shows the firm’s capability to exceed customer expectation
and understand their requirements
Knowledge measurement, analysis and management. Shows how the firm makes use of internal and external
information in making decisions and for competitiveness in
the market.
Staff Orientation Shows how the firm plans and effectively grows its human
capital to achieve enhanced performance.
Process Management Shows how the firm designs, manages, evaluates and
improves its main processes to achieve service and product
efficiency.
Results Shows how the firm attains better management outcomes
through its quality plans.
Resource Management Shows how the firm’s effectively manages its capital.
(Source: KIM)
Appendix II: List of NSE firms per category at the COYA between 2006-2013 i) Banking
1 Barclays Bank (K) Ltd 12 East African Portland Cement Company Limited
2 Equity Bank Limited. iv) Energy and Petroleum
3 I&M Holdings 13 KenGen Ltd
4 Kenya Commercial Bank Limited 14 KenolKobil Limited
5 Standard Chartered Bank Limited 15 Total Kenya Limited
ii) Commercial v) Insurance
6 Kenya Airways Ltd 16 British -American Investment Company (K) Ltd
7 Nation Media Group 17 CIC Insurance Ltd.
8 SCAN Group 18 Pan Africa Insurance Holdings
9 TPS East Africa (Serena) Ltd vi) Manufacturing and Allied
iii) Construction and Allied 19 BOC Kenya Ltd.
10 Bamburi Cement Limited 20 British -American Tobacco Ltd
11 East African Cables 21 Safaricom Limited
Appendix III: Listed firms that have won the COYA between 2006-2015
No. Year Award Category Announcement
Date Award Winner Category at the
NSE

International Journal of Science Arts and Commerce Vol. 2 No. 4, June-2017
www.ijsac.net 31
1 2006 Company of the Year – 2nd Runners Up 7th July 2006 Mumias Sugar Company
Manufacturing and Allied
2 2008 Company of the Year – 2nd Runners Up 4th July 2008 Barclays Bank Limited
Banking
3 2009 Company of the Year – 1st Runners Up 3rd July 2009 Bamburi Cement Limited
Construction and Allied
4 2010 Company of the Year 1st December 2010 Nation Media Group Commercial
5 2010 Company of the Year – 1st Runners Up 1st December 2010 Barclays Bank (K) Ltd
Banking
6 2012 Company of the Year – 1st Runners Up 2nd November 2012
British -American Investment Company (K) Ltd
Insurance
7 2013 Company of the Year 8th November 2013
British -American Investment Company (K) Ltd
Insurance
8 2015 Company of the Year 6th November 2015 Jubilee Holdings Limited
Insurance
(Source: KIM)
Appendix IV: NSE Listed firms per category at the COYA between 2006 - 2015
Category
Listed firms that have participating in
COYA Listed firms that have won COYA
No of COYA won by listed firms
Manufacturing and Allied 2 1 1
Telecommunication and Technology 1 1 1
Banking 5 1 2
Energy and Petroleum 3 0 0
Construction and Allied 3 1 1
Commercial 4 1 1
Insurance 3 2 3
Total 21 7 9 (Source: KIM)
Appendix V: British-American Investments Company (2013) data during the event
window Days Days Share Price
MPS
Actual Share
Return
Rit
Expected
Share Return
E(Rit)
Abnormal
Return
AR it
Cumulative
abnormal
Return CAR it
-5 01/11/2013 10.65 2.90% 0.68% 2.22% 2.22%
-4 04/11/2013 10.8 1.41% 0.62% 0.79% 3.01%
-3 05/11/2013 10.8 0.00% 0.50% -0.50% 2.51%
-2 06/11/2013 10.55 -2.31% 0.63% -2.94% -0.43%
-1 07/11/2013 10.2 -3.32% 0.67% -3.99% -4.41%

International Journal of Science Arts and Commerce Vol. 2 No. 4, June-2017
www.ijsac.net 32
0 08/11/2013 10.3 0.98% 0.33% 0.65% -3.77%
1 11/11/2013 10.3 0.00% 0.45% -0.45% -4.21%
2 12/11/2013 10.35 0.49% 0.53% -0.05% -4.26%
3 13/11/2013 10.3 -0.48% 0.51% -1.00% -5.26%
4 14/11/2013 10.9 5.83% 0.62% 5.21% -0.06%
5 15/11/2013 11.05 1.38% 0.51% 0.87% 0.81%
Appendix VI: Jubilee Holdings Limited data during the event window Days Days Share Price
MPS
Actual Share
Return
Rit
Expected
Share Return
E(Rit)
Abnormal
Return
AR it
Cumulative
abnormal
Return
CAR it
-5 30/10/2015 420.00 1.45% -0.77% 2.22% 2.22%
-4 31/10/2015 420.00 0.00% -0.54% 0.54% 2.76%
-3 02/11/2015 420.00 0.00% -0.64% 0.64% 3.40%
-2 03/11/2015 424.00 0.95% -0.44% 1.39% 4.79%
-1 05/11/2015 430.00 1.42% 0.09% 1.33% 6.12%
0 06/11/2015 430.00 0.00% -0.32% 0.32% 6.44%
1 10/11/2015 435.00 1.16% -0.21% 1.37% 7.81%
2 11/11/2015 440.00 1.15% -0.04% 1.18% 8.99%
3 12/11/2015 440.00 0.00% -0.35% 0.35% 9.34%
4 13/11/2015 445.00 1.14% -0.67% 1.81% 11.15%
5 15/11/2015 450.00 1.12% -0.23% 1.35% 12.50%
LIST OF TABLES AND FIGURES
Table I: Mumias Sugar Company data during the event window Days Dates Share Price
MPS
Actual Share
Return Rit
Expected
Share Return
E(Rit)
Abnormal
Return
AR it
Cumulative
abnormal
Return
CAR it
-5 30/06/2006 62.00 0.81% 1.11% -0.30% -0.30%
-4 03/07/2006 62.00 0.00% 0.91% -0.91% -1.20%
-3 04/07/2006 62.00 0.00% 0.34% -0.34% -1.54%
-2 05/07/2006 62.50 0.81% 0.86% -0.05% -1.59%
-1 06/07/2006 62.50 0.00% -0.12% 0.12% -1.47%
0 07/07/2006 63.50 1.60% 1.23% 0.37% -1.10%
1 10/07/2006 63.00 -0.79% 0.59% -1.38% -2.48%
International Journal of Science Arts and Commerce Vol. 2 No. 4, June-2017
www.ijsac.net 33
2 11/07/2006 64.00 1.59% 0.74% 0.85% -1.63%
3 12/07/2006 64.50 0.78% 0.41% 0.38% -1.26%
4 13/07/2006 64.00 -0.78% 0.72% -1.49% -2.75%
5 14/07/2006 64.00 0.00% 0.49% -0.49% -3.24%
Figure I: Mumias Sugar Expected, Actual and Abnormal Returns
Table II: Barclays Bank of Kenya Limited (2008) data during the event window Days Days Share Price
MPS
Actual Share
Return
Rit
Expected
Share Return
E(Rit)
Abnormal
Return
AR it
Cumulative
abnormal
Return
CAR it
-5 27/06/2008 70.50 -1.40% -0.23% -1.17% -1.17%
-4 30/06/2008 70.50 0.00% 0.20% -0.20% -1.37%
-3 01/07/2008 70.50 0.00% -0.12% 0.12% -1.26%
-2 02/07/2008 70.00 -0.71% -0.22% -0.49% -1.75%
-1 03/07/2008 70.00 0.00% -0.12% 0.12% -1.63%
0 04/07/2008 69.00 -1.43% -0.27% -1.16% -2.79%
1 07/07/2008 69.00 0.00% -0.07% 0.07% -2.71%
2 08/07/2008 68.50 -0.72% -0.24% -0.48% -3.19%
3 09/07/2008 68.50 0.00% -0.04% 0.04% -3.15%
4 10/07/2008 68.00 -0.73% 0.16% -0.89% -4.05%
5 11/07/2008 68.50 0.74% 0.10% 0.64% -3.41%
International Journal of Science Arts and Commerce Vol. 2 No. 4, June-2017
www.ijsac.net 34
Figure II: Barclays Bank of Kenya (2008) Expected, Actual and Abnormal Returns
Table III: Bamburi Cement Limited data during the event window Days Days Share Price
MPS
Actual Share
Return
Rit
Expected
Share Return
E(Rit)
Abnormal
Return
AR it
Cumulative
abnormal
Return
CAR it
-5 26/06/2009 137 0.00% 0.35% -0.35% -0.35%
-4 29/06/2009 140 2.19% 0.52% 1.67% 1.32%
-3 30/06/2009 145 3.57% 0.99% 2.58% 3.90%
-2 01/07/2009 140 -3.45% 0.35% -3.80% 0.10%
-1 02/07/2009 145 3.57% 1.23% 2.35% 2.45%
0 03/07/2009 145 0.00% 0.97% -0.97% 1.48%
1 06/07/2009 145 0.00% 0.51% -0.51% 0.96%
2 07/07/2009 145 0.00% 0.26% -0.26% 0.70%
3 08/07/2009 149 2.76% -0.26% 3.01% 3.71%
4 09/07/2009 150 0.67% -0.02% 0.69% 4.41%
5 10/07/2009 145 -3.33% 0.19% -3.52% 0.88%
Figure III: Bamburi Cement Ltd Expected, Actual and Abnormal Returns

International Journal of Science Arts and Commerce Vol. 2 No. 4, June-2017
www.ijsac.net 35
Table IV: Nation Media Group data during the event window Days Days Share Price
MPS
Actual Share
Return
Rit
Expected
Share Return
E(Rit)
Abnormal
Return
AR it
Cumulative
abnormal
Return CAR it
-5 24/11/2010 160 -3.03% 0.01% -3.04% -3.04%
-4 25/11/2010 160 0.00% -0.04% 0.04% -3.00%
-3 26/11/2010 160 0.00% -0.06% 0.06% -2.94%
-2 29/11/2010 160 0.00% -0.02% 0.02% -2.92%
-1 30/11/2010 159 -0.63% -0.03% -0.59% -3.51%
0 01/12/2010 159 0.00% -0.09% 0.09% -3.42%
1 02/12/2010 158 -0.63% 0.08% -0.71% -4.13%
2 03/12/2010 161 1.90% 0.03% 1.87% -2.27%
3 06/12/2010 160 -0.62% 0.03% -0.65% -2.91%
4 07/12/2010 160 0.00% 0.04% -0.04% -2.95%
5 08/12/2010 159 -0.63% 0.07% -0.70% -3.65%
Figure IV: Nation Media Group Expected, Actual and Abnormal Return
Table V: Barclays Bank of Kenya (2010) data during the event window Days Days Share Price
MPS
Actual Share
Return
Rit
Expected
Share Return
E(Rit)
Abnormal
Return
AR it
Cumulative
abnormal
Return CAR it
-5 24/11/2010 64 0.79% -0.23% 1.02% 1.02%
-4 25/11/2010 63 -1.56% -0.35% -1.22% -0.20%
-3 26/11/2010 62.5 -0.79% -0.40% -0.39% -0.59%
-2 29/11/2010 62 -0.80% -0.30% -0.50% -1.08%
-1 30/11/2010 61.5 -0.81% -0.34% -0.47% -1.55%
0 01/12/2010 61 -0.81% -0.46% -0.35% -1.90%
1 02/12/2010 60 -1.64% -0.07% -1.57% -3.47%
2 03/12/2010 60.5 0.83% -0.18% 1.01% -2.46%

International Journal of Science Arts and Commerce Vol. 2 No. 4, June-2017
www.ijsac.net 36
3 06/12/2010 60.5 0.00% -0.19% 0.19% -2.26%
4 07/12/2010 60.5 0.00% -0.17% 0.17% -2.09%
5 08/12/2010 61 0.83% -0.09% 0.91% -1.18%
Figure V: Barclays Bank of Kenya (2010) Expected, Actual and Abnormal Returns
Table VI: British-American Investments Company (2012) data during the event window
Days Days Share Price
MPS
Actual Share
Return
Rit
Expected
Share Return
E(Rit)
Abnormal
Return
AR it
Cumulative
abnormal
Return CAR it
-5 25/10/2012 5.70 -8.80% -15.18% 6.38% 6.38%
-4 26/10/2012 5.65 -0.88% 0.57% -1.45% 4.93%
-3 27/10/2012 5.60 -0.88% 0.65% -1.54% 3.40%
-2 28/10/2012 5.70 1.79% 1.18% 0.60% 4.00%
-1 31/10/2012 5.70 0.00% 1.11% -1.11% 2.89%
0 02/11/2012 5.70 0.00% 0.71% -0.71% 2.18%
1 05/11/2012 5.70 0.00% -0.61% 0.61% 2.79%
2 06/11/2012 5.60 -1.75% 0.16% -1.92% 0.87%
3 07/11/2012 5.55 -0.89% 0.01% -0.91% -0.04%
4 08/11/2012 5.50 -0.90% 0.12% -1.02% -1.06%
5 09/11/2012 5.50 0.00% 0.21% -0.21% -1.26%

International Journal of Science Arts and Commerce Vol. 2 No. 4, June-2017
www.ijsac.net 37
Figure VI: British-American Investments Company (2012) Expected, Actual and Abnormal Returns
Figure VII: British-American Investments Company (2013) Expected, Actual and Abnormal Returns
Figure VIII: Jubilee Holdings Ltd Expected, Actual and Abnormal Returns
4.3Cumulative Abnormal Returns Analysis
Table IX. Cumulative Abnormal Return for all the firms during the event window. Mean Cumulative Abnormal Returns by Event Day for all Firms during the 11-event day window

International Journal of Science Arts and Commerce Vol. 2 No. 4, June-2017
www.ijsac.net 38
N 1 2 3 4 5 6 7 8
ACARi
t Position
in COYA
3 3 2 1 2 2 1 1
Firm MSC BBK BCL NMG BBK BRITAM BRITAM JUBILEE
Year 2006 2008 2009 2010 2010 2012 2013 2015
-5 -0.30% -1.17% -0.35% -3.04% 1.02% 6.38% 2.22% 2.22% 0.87%
-4 -1.20% -1.37% 1.32% -3.00% -0.20% 4.93% 3.01% 2.76% 0.78%
-3 -1.54% -1.26% 3.90% -2.94% -0.59% 3.40% 2.51% 3.40% 0.86%
-2 -1.59% -1.75% 0.10% -2.92% -1.08% 4.00% -0.43% 4.79% 0.14%
-1 -1.47% -1.63% 2.45% -3.51% -1.55% 2.89% -4.41% 6.12% -0.14%
0 -1.10% -2.79% 1.48% -3.42% -1.90% 2.18% -3.77% 6.44% -0.36%
1 -2.48% -2.71% 0.96% -4.13% -3.47% 2.79% -4.21% 7.81% -0.68%
2 -1.63% -3.19% 0.70% -2.27% -2.46% 0.87% -4.26% 8.99% -0.41%
3 -1.26% -3.15% 3.71% -2.91% -2.26% -0.04% -5.26% 9.34% -0.23%
4 -2.75% -4.05% 4.41% -2.95% -2.09% -1.06% -0.06% 11.15% 0.32%
5 -3.24% -3.41% 0.88% -3.65% -1.18% -1.26% 0.81% 12.50% 0.18%
Figure IX.Average Cumulative Abnormal Return for all the firms during the event window.
0.87%0.78%
0.86%
0.14%
-0.14%
-0.36%
-0.68%
-0.41%
-0.23%
0.32%
0.18%
-0.80%
-0.60%
-0.40%
-0.20%
0.00%
0.20%
0.40%
0.60%
0.80%
1.00%
-5 -4 -3 -2 -1 0 1 2 3 4 5
ACARit
ACARit
4.4 Hypothesis testing. Table X: t-test data result for Mumias Sugar Company
Rit E(Rit)
Mean 0.00365947 0.006604433
Variance 6.7491E-05 1.44474E-05
Observations 11 11
Pearson Correlation 0.43875018 Hypothesized Mean Difference 0 Df 10

International Journal of Science Arts and Commerce Vol. 2 No. 4, June-2017
www.ijsac.net 39
t Stat -1.3226042 P(T<=t) one-tail 0.10770784 t Critical one-tail 1.8124611 P(T<=t) two-tail 0.21541568 t Critical two-tail 2.22813884
Table XI: t-test data result for Barclays Bank of Kenya (2008) Variable 1 Variable 2
Mean -0.00387 -0.00076871
Variance 4.45E-05 2.77642E-06
Observations 11 11
Pearson Correlation 0.592397
Hypothesized Mean Difference 0
Df 10
t Stat -1.7601
P(T<=t) one-tail 0.054443
t Critical one-tail 1.812461
P(T<=t) two-tail 0.108886
t Critical two-tail 2.228139
Table XII: t-test data result for Bamburi Cement Ltd Rit E(Rit)
Mean 0.005437082 0.004634015
Variance 0.000581157 2.01845E-05
Observations 11 11
Pearson Correlation 0.343814154 Hypothesized Mean Difference 0 Df 10 t Stat 0.116037471 P(T<=t) one-tail 0.454960012 t Critical one-tail 1.812461102 P(T<=t) two-tail 0.909920024 t Critical two-tail 2.228138842
Table XIII: t-test data result for Nation Media Group Rit E(Rit)
Mean -0.003301471 1.64831E-05
Variance 0.000131516 3.01511E-07
Observations 11 11
Pearson Correlation -0.085802576

International Journal of Science Arts and Commerce Vol. 2 No. 4, June-2017
www.ijsac.net 40
Hypothesized Mean Difference 0 Df 10 t Stat -0.954570543 P(T<=t) one-tail 0.181150075 t Critical one-tail 1.812461102 P(T<=t) two-tail 0.36230015 t Critical two-tail 2.228138842
Table XIV: t-test data result for Barclays Bank of Kenya (2010) Variable 1 Variable 2
Mean -0.003607067 -0.002533628
Variance 8.27634E-05 1.63663E-06
Observations 11 11
Pearson Correlation 0.385463778
Hypothesized Mean Difference 0
Df 10
t Stat -0.409928603
P(T<=t) one-tail 0.345251039
t Critical one-tail 1.812461123
P(T<=t) two-tail 0.690502079
t Critical two-tail 2.228138852
Table XV: t-test data result for British-American Investments Company (2012) Variable 1 Variable 2
Mean -0.011204162 -0.01005549
Variance 0.000730594 0.002236387
Observations 11 11
Pearson Correlation 0.953039241
Hypothesized Mean Difference 0
Df 10
t Stat -0.165395986
P(T<=t) one-tail 0.435964087
t Critical one-tail 1.812461123
P(T<=t) two-tail 0.871928175
t Critical two-tail 2.228138852
Table XVI: t-test data result for British-American Investments Company (2013)
Variable 1 Variable 2 Mean 0.006235253 0.005494407 Variance 0.000597305 1.09916E-06

International Journal of Science Arts and Commerce Vol. 2 No. 4, June-2017
www.ijsac.net 41
Observations 11 11 Pearson Correlation 0.021104053 Hypothesized Mean Difference 0 Df 10 t Stat 0.100535459 P(T<=t) one-tail 0.460953156 t Critical one-tail 1.812461123 P(T<=t) two-tail 0.921906312 t Critical two-tail 2.228138852
Table XVII: t-test data result for Jubilee Holdings Ltd Variable 1 Variable 2
Mean 0.007626296 -0.003736592 Variance 3.83933E-05 7.25914E-06 Observations 11 11 Pearson Correlation 0.257840867 Hypothesized Mean Difference 0 Df 10 t Stat 6.191979441 P(T<=t) one-tail 5.12616E-05 t Critical one-tail 1.812461123 P(T<=t) two-tail 0.000102523 t Critical two-tail 2.228138852
Table XVIII: t-test data result for All Firms Variable 1 Variable 2
Mean 0.000122077 -4.31355E-05
Variance 1.83227E-05 3.55393E-05
Observations 11 11
Pearson Correlation 0.67210521 Hypothesized Mean Difference 0 Df 10 t Stat 0.123894549 P(T<=t) one-tail 0.451926853 t Critical one-tail 1.812461123 P(T<=t) two-tail 0.903853705 t Critical two-tail 2.228138852