Embed Size (px)
Citation preview

INTERNATIONAL MONETARY FUND
Review of Facilities for Low-Income Countries—Supplement 1
Prepared by the Strategy, Policy, Review Department and Finance Department
In consultation with other Departments
Approved by Siddharth Tiwari and Andrew Tweedie
July 26, 2012
Contents Page
Acronyms and Abbreviations ....................................................................................................2
I. Introduction ............................................................................................................................3
II. Impact of Longer-Term Fund Engagement in LICs ..............................................................7
III. Impact of Short-Term Fund Financing in LICs .................................................................14
IV. Concluding Remarks .........................................................................................................17
Annexes
I. Propensity Score Matching (PSM) Methodology ................................................................22
II. Panel Regression on the Determinants of Long-term Growth ............................................29

2
ACRONYMS AND ABBREVIATIONS
CFF Compensatory Financing Facilities
CPIA Country Policy and Institutional Assessment
ECF Extended Credit Facility
EPA Ex Post Assessment
ENDA Emergency Natural Disaster Assistance
EPCA Emergency Post-Conflict Assistance
ESAF Enhanced Structural Adjustment Facility
ESF Exogenous Shocks Facility
FDI Foreign Direct Investment
GEE Generalized Evaluation Estimator
GRA General Resources Account
HAC High Access Component
IEO Independent Evaluation Office
LICs Low-Income Countries
PITF Political Instability Task Force
PRGF Poverty Reduction and Growth Facility
PSI Policy Support Instrument
PSM Propensity Score Matching
RCF Rapid Credit Facility
SAF Structural Adjustment Facility
SBA Stand-By Arrangement
SCF Standby Credit Facility
SMP Staff-Monitored Programs

3
REVIEW OF FACILITIES FOR LOW-INCOME COUNTRIES—SUPPLEMENT 1
ECONOMIC IMPACT OF FUND ENGAGEMENT1
This supplement aims to assess the economic impact of the Fund’s support through its
facilities for low-income countries (LICs). It relies on two complementary econometric
analyses: the first investigates the longer-term impact of Fund engagement—primarily
through successive medium-term programs under the Extended Credit Facility (ECF) and its
predecessors (and more recently the Policy Support Instrument (PSI))—on economic growth
and a range of other indicators and socio-economic outcomes; the second focuses on the role
of IMF shock-related financing—through augmentations of ECF arrangements and short-
term and emergency financing instruments—on short-term macroeconomic performance. The
empirical results shed some light on two channels through which different Fund facilities
may have helped LICs respond to the global financial crisis—(i) by supporting a gradual
buildup of macroeconomic buffers in the decades prior to the crisis and (ii) by providing
liquidity support at the height of the crisis. The combination of strong pre-crisis buffers and
crisis financing allowed LICs to pursue counter-cyclical policy responses that preserved
spending and facilitated a rapid recovery.
I. INTRODUCTION
1. Previous studies by the staff and the Independent Evaluation Office (IEO) have
identified some positive effects of Fund engagement on LICs’ macroeconomic
performance, but not in all areas. Bredenkamp and Schadler (1999) reviewed the
experience of countries that used the Fund‘s concessional lending window under three-year
Structural Adjustment Facility (SAF) and Enhanced Structural Adjustment Facility (ESAF)
arrangements during 1986–1995 and concluded that most countries pursuing reforms and
adjustment programs with the support of the SAF and ESAF strengthened their economies
materially. An IEO report (2002) based on a mixed sample of countries using General
Resources Account (GRA) and concessional Fund resources over the period 1975–1999 and
using econometric methods found that IMF lending appeared to have negative effects on
growth for some prolonged users of Fund resources, though not for those using the Fund‘s
concessional lending window. Ghosh and others (2005) reviewed the experience of LICs
with the ESAF and the Poverty Reduction and Growth Facility (PRGF) as well as that of
countries relying on GRA resources over the period 1995–2003 and found that countries with
IMF-supported programs often experienced marked reductions in inflation and higher
economic growth. The Review of Ex Post Assessments and Issues Relating to the Policy on
Longer-Term Engagement, which drew on a mixed sample of LICs and GRA countries using
1 This supplement was prepared by Linda Kaltani, Yasemin Bal Gunduz, and Christian Ebeke, with guidance
from Christian Mumssen.

4
inputs from Ex Post Assessment (EPA) teams, country mission chiefs and country
authorities, noted that macroeconomic problems were reduced in many countries with longer-
term program engagement, while structural problems often persisted. Clements, Gupta, and
Nozaki (2011) presented econometric evidence based on LICs and GRA users for the period
1985–99 and found that, among LICs, IMF-supported programs had a positive effect on
education and health outlays. The 2011 Review of Conditionality--Outcomes of Fund-
Supported Programs examined the effects of Fund-supported programs initiated during
2002–11 through multiple approaches and concluded that most Fund-supported programs
appear to have helped member countries improve macroeconomic and social conditions.
2. The academic literature has found both positive and negative effects of Fund-
supported programs on economic performance, depending on the econometric
methodology and sample used. Steinwand and Stone (2008) provide a broad overview of
the empirical literature on the IMF and the underlying theories. Specific empirical studies
that have examined the impact of Fund engagement include:
Przeworski and Vreeland (2000) examined the effect of participation in Fund-
supported programs on economic growth across all types of IMF lending facilities
over the period 1970–1990 and found that program participation lowers growth rates.
Barro and Lee (2005) looked at the effects of Fund-supported programs on economic
growth using data spanning 1975–1999, focusing mainly on the short-term
stabilization programs, and found a negative impact on growth.
Dicks-Mireaux, Mecagni, and Schadler (2000) focused on the effects of Fund-
supported programs on LICs for the period 1986–1991 and found statistically
significant beneficial effects of IMF support on output growth and the debt service
ratio but no effect on inflation.
Atoyan and Conway (2006) examined the impact of Fund-supported programs on the
real per capita GDP growth rate, the ratio of the fiscal surplus to GDP, and the ratio
of the current account surplus to GDP on a sample of developing and transition
countries over the period 1993–2002 and across GRA and LIC facilities. They found
little statistical support that Fund-supported programs contemporaneously improve
real economic growth in participating countries, but stronger evidence of an
improvement in economic growth in years following a program. Moreover, both the
fiscal ratio and the current-account ratio improved contemporaneously with IMF
participation relative to the counterfactual.
Biglaiser and DeRouen (2010), using a mixed sample of LICs and emerging
economies during 1980–2003, found that IMF borrowers tend to be more attractive to
U.S. investors but not all Fund-supported programs have the same effect. They

5
demonstrate that differences in loan duration, the extent of borrower input in policy
decisions, and loan amounts affect borrowers‘ leverage with the IMF and the U.S.
3. One important methodological challenge facing such studies is the issue of
sample selection bias. Sample selection bias stems from the fact that economic performance
under a Fund-supported program is observed only for a restricted, nonrandom sample of
countries with programs and countries in such a sample may self-select (i.e., are not random).
For instance, countries that approach the Fund often do so because they are already facing
economic difficulties or expect to experience possible problems in the near future. Similarly,
countries with institutional and structural weaknesses are more vulnerable to policy slippages
and exogenous shocks, which could increase their demand for Fund support. If countries with
weaker economic positions are more likely to seek IMF support, failing to correct for
selection bias would lead to flawed conclusions about the impact of Fund-supported
programs on growth and other macroeconomic indicators. Thus, conditions at the start of a
program need to be taken into account together with unique country characteristics. The
literature has used various approaches to address sample selection bias—all attempts having
in common the aim to construct a credible counterfactual.
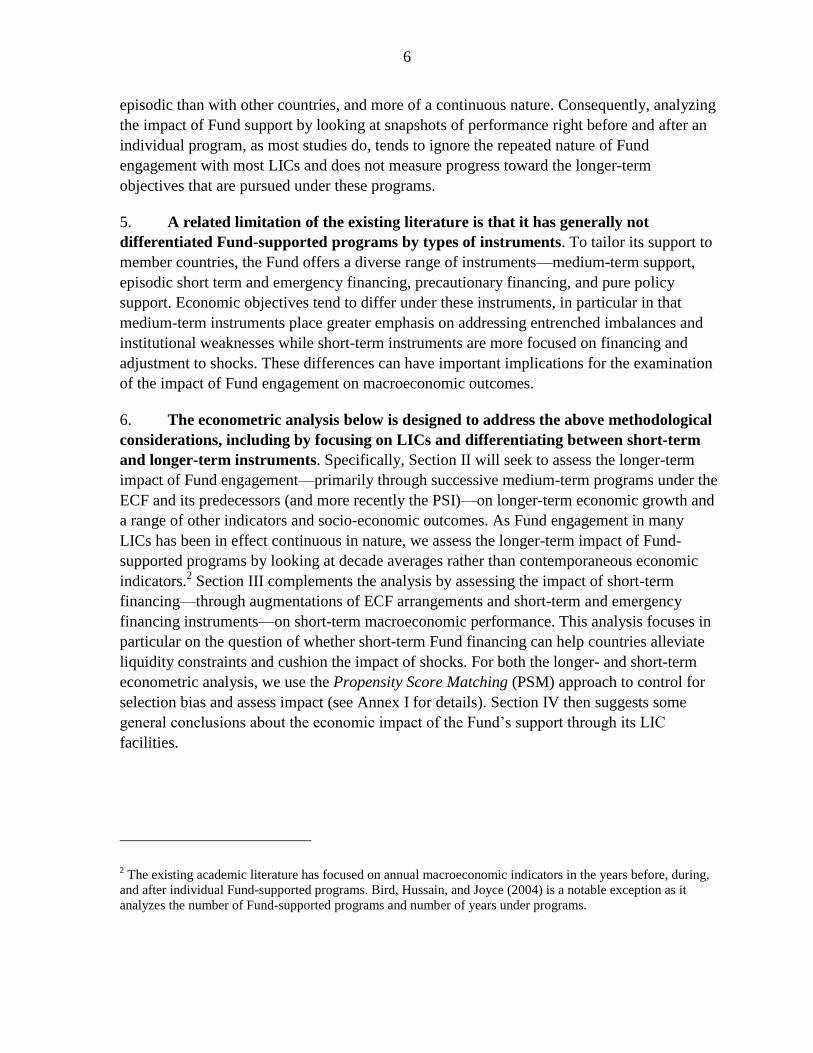
4. The academic literature has typically used country samples that mix LICs and
middle-income economies, which tends to overlook the distinct nature and objectives of
Fund engagement between these country groups. LICs face a number of challenges that
differentiate them from other economies: (i) Nature of shocks: While emerging market
countries may experience ―sudden stop‖-type capital account crises, LICs are more
vulnerable to other shocks, both domestic and external, which tend to occur more frequently
and reflect the lack of economic development and diversification; (ii) Access to financing:
LICs have less access to domestic or
external financing, making them
dependent on donor assistance and on
Fund-supported programs that can help
catalyze such assistance; and
(iii) Longer-term challenges: LIC
programs tend to focus more on
medium- or longer-term objectives that
are important for poverty reduction and
growth, which tend to extend well
beyond the duration of an individual
Fund-supported program. In this
context, LIC programs emphasize more
capacity- and institution-building rather
than just provision of financing and
short-term policies. As a result of these
factors, Fund program engagement with
most LICs has generally been less
0
5
10
15
20
25
0 1-5 6-10 11-15 16+
Number of program years for LICs,1986-2010
Program years
Num
ber
of
co
untr
ies
Notes: The sample is composed of 75. Program years are def ined as years when a country had a f inancial arrangement or PSI for at least six months.
6
episodic than with other countries, and more of a continuous nature. Consequently, analyzing
the impact of Fund support by looking at snapshots of performance right before and after an
individual program, as most studies do, tends to ignore the repeated nature of Fund
engagement with most LICs and does not measure progress toward the longer-term
objectives that are pursued under these programs.
5. A related limitation of the existing literature is that it has generally not
differentiated Fund-supported programs by types of instruments. To tailor its support to
member countries, the Fund offers a diverse range of instruments—medium-term support,
episodic short term and emergency financing, precautionary financing, and pure policy
support. Economic objectives tend to differ under these instruments, in particular in that
medium-term instruments place greater emphasis on addressing entrenched imbalances and
institutional weaknesses while short-term instruments are more focused on financing and
adjustment to shocks. These differences can have important implications for the examination
of the impact of Fund engagement on macroeconomic outcomes.
6. The econometric analysis below is designed to address the above methodological
considerations, including by focusing on LICs and differentiating between short-term
and longer-term instruments. Specifically, Section II will seek to assess the longer-term
impact of Fund engagement—primarily through successive medium-term programs under the
ECF and its predecessors (and more recently the PSI)—on longer-term economic growth and
a range of other indicators and socio-economic outcomes. As Fund engagement in many
LICs has been in effect continuous in nature, we assess the longer-term impact of Fund-
supported programs by looking at decade averages rather than contemporaneous economic
indicators.2 Section III complements the analysis by assessing the impact of short-term
financing—through augmentations of ECF arrangements and short-term and emergency
financing instruments—on short-term macroeconomic performance. This analysis focuses in
particular on the question of whether short-term Fund financing can help countries alleviate
liquidity constraints and cushion the impact of shocks. For both the longer- and short-term
econometric analysis, we use the Propensity Score Matching (PSM) approach to control for
selection bias and assess impact (see Annex I for details). Section IV then suggests some
general conclusions about the economic impact of the Fund‘s support through its LIC
facilities.
2 The existing academic literature has focused on annual macroeconomic indicators in the years before, during,
and after individual Fund-supported programs. Bird, Hussain, and Joyce (2004) is a notable exception as it
analyzes the number of Fund-supported programs and number of years under programs.
7
II. IMPACT OF LONGER-TERM FUND ENGAGEMENT IN LICS
7. Macroeconomic conditions have improved substantially over the last two
decades for most LICs.3 On average, LICs experienced significant long-term increases in
real GDP per capita growth, government balances, reserves, current account balances,
foreign direct investment (FDI), exports, institutional quality, and social spending while also
achieving noticeable reductions in economic volatility, inflation, external debt, as well as
poverty (see Figure 1). This finding holds across country sizes (small versus non-small
economies), geographical groupings (coastal versus landlocked), institutional capacity (as
measured by the World Bank‘s Country Policy and Institutional Assessment (CPIA)), and
per-capita income (see Figure 2).
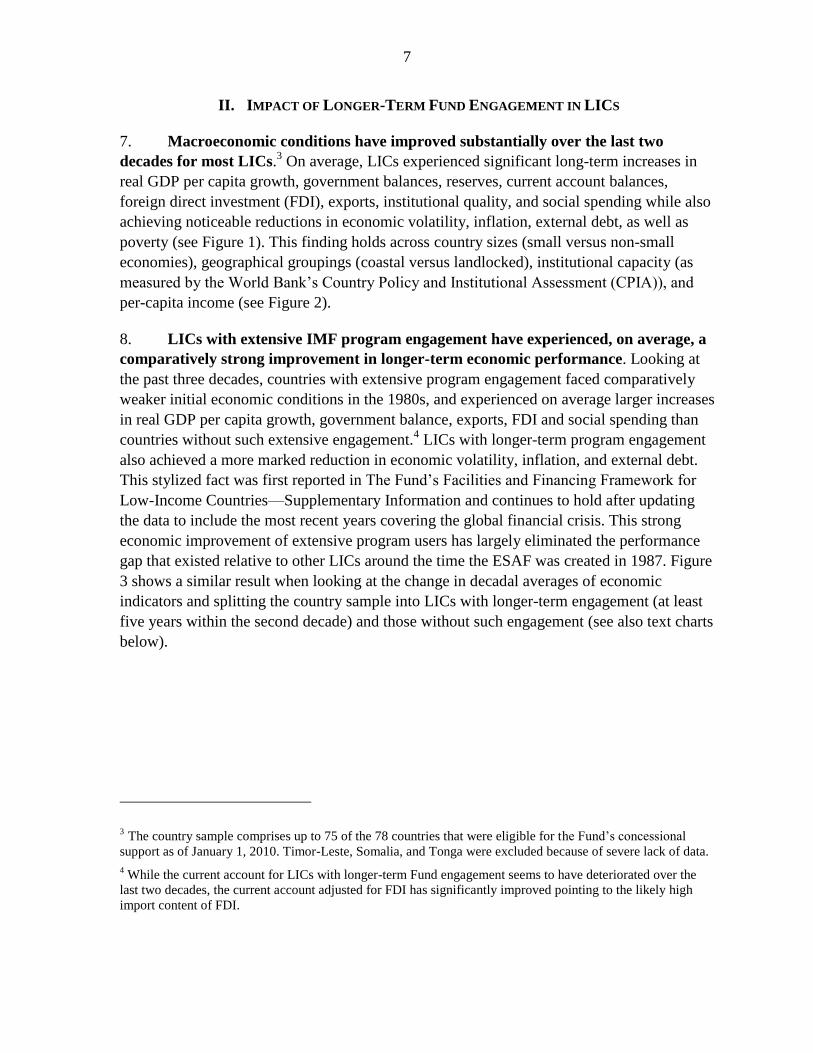
8. LICs with extensive IMF program engagement have experienced, on average, a
comparatively strong improvement in longer-term economic performance. Looking at
the past three decades, countries with extensive program engagement faced comparatively
weaker initial economic conditions in the 1980s, and experienced on average larger increases
in real GDP per capita growth, government balance, exports, FDI and social spending than
countries without such extensive engagement.4 LICs with longer-term program engagement
also achieved a more marked reduction in economic volatility, inflation, and external debt.
This stylized fact was first reported in The Fund‘s Facilities and Financing Framework for
Low-Income Countries—Supplementary Information and continues to hold after updating
the data to include the most recent years covering the global financial crisis. This strong
economic improvement of extensive program users has largely eliminated the performance
gap that existed relative to other LICs around the time the ESAF was created in 1987. Figure
3 shows a similar result when looking at the change in decadal averages of economic
indicators and splitting the country sample into LICs with longer-term engagement (at least
five years within the second decade) and those without such engagement (see also text charts
below).
3 The country sample comprises up to 75 of the 78 countries that were eligible for the Fund‘s concessional
support as of January 1, 2010. Timor-Leste, Somalia, and Tonga were excluded because of severe lack of data. 4 While the current account for LICs with longer-term Fund engagement seems to have deteriorated over the
last two decades, the current account adjusted for FDI has significantly improved pointing to the likely high
import content of FDI.

8
Econometric analysis
9. The analysis that follows investigates to what extent the positive association of
longer-term Fund engagement and economic performance holds up when controlling
for other factors and addressing the sample selection bias. The questions addressed in this
section are the following:
a. How does longer-term Fund engagement affect macroeconomic performance,
including growth, and institutional variables? The approach used is the
abovementioned PSM, which is a two-stage process where (i) a first-stage regression
estimates the propensity score (probability) of a country becoming a longer-term user
of Fund-supported programs and (ii) the average economic performance of countries
over a 10-year period is then compared between longer-term program users and
others with similar propensity scores.
b. What is the longer-term impact of IMF engagement on long-term economic growth,
and what are the associated transmission channels? We run panel regressions based
on 10-year period averages that control for the determinants of long-run growth based
on explanatory variables that have been commonly studied in the economic literature
as well as a dummy identifying longer-term Fund engagement. The goal of the panel
growth regressions is to identify the channels through which the IMF support impacts
longer-term growth performance—namely macroeconomic stabilization, institutional
development, and provision of development financing.
-3
-2
-1
0
1
2
3
4
5
6
7
No LT engagement LT engagement
Change in average decadal real GDP per capita growth, 1986-2010
Median
25th percentile
75th percentile
Median
25th percentile
75th percentile
-18
-16
-14
-12
-10
-8
-6
-4
-2
0
2
4
No LT engagement LT engagement
Change in average decadal poverty gaps, 1986-2010
Median
25th percentile
75th percentile
Median
25th percentile
75th percentile
Notes: The sample is composed of 75 LICs and four overlapping decadal period averages:1986-95; 1991-00; 1996-05; 2001-10. A country is considered to have longer-term (LT) engagement in a given decade if in f ive or more years it had a f inancial arrangement or a PSI in place, for at least six months in each of these years. The chart shows the distribution of decadal
changes across countries by quartiles. Poverty gap is def ined as the mean shortfall f rom the poverty line (counting the non-poor as having zero shortfall), expressed as a percentage of the poverty line. A more negative change in the chart implies a bigger reduction in the poverty gap.

9
10. The analysis uses a panel dataset of 75 LICs and decadal averages spanning the
period 1986–2010.5 Given the focus on longer-term engagement we work with decadal
averages where periods share a 50 percent overlap with each other.6 We also worked with
yearly rolling decadal averages but considered them suboptimal given the serial correlation
generated by the repetition of the bulk of the observations. For any given 10-year period,
longer-term Fund engagement is captured by a dummy variable that takes the value of 1 if a
country has had five or more years of Fund-supported programs in the10-year period and
zero otherwise. The qualifying programs are all Fund financial arrangements available to
LICs, primarily the ECF and its predecessors (PRGF, ESAF, SAF) but also the Stand-By
Arrangement (SBA), Exogenous Shocks Facility-High Access Component (ESF-HAC), and
Standby Credit Facility (SCF), as well as the PSI. Program years have been purged of
episodes when there were prolonged program interruptions.7
PSM approach
11. To control for selection bias, a PSM selection equation is specified to estimate the
determinants of longer-term IMF engagement.8 The independent variables are chosen
broadly in line with the literature‘s approach of including both demand and supply factors
determining IMF support, with the aim of identifying a parsimonious set of variables that
achieves a relatively good fit based on the historical data series. Longer-term Fund
engagement is assumed to be determined by a country‘s initial macroeconomic buffers, its
structural characteristics, as well as external demand conditions during the period, but also by
the role of IMF quotas in determining countries‘ available financing. Initial macroeconomic
buffers are proxied by the reserve coverage and the foreign aid to GDP ratio at the beginning
of each decade. Structural characteristics are proxied by dummy variables identifying
countries‘ geographic and institutional characteristics, the latter stemming from the more
recent empirical focus on political and institutional influences on Fund agreements. Trading
partners‘ real GDP growth captures external demand conditions that are entirely exogenous
5 For the analysis, LICs are defined as those countries that were eligible to receive the Fund‘s subsidized
resources as of January 1, 2010.
6 This allows for a larger set of observations and also reduces the possible bias from arbitrarily selecting a 10-
year period. The periods from which decadal averages are generated are: 1986–95; 1991–00; 1996–05; 2001–
10.
7 This is captured by examining cases when there was a delay of more than six months in completing a review
owing to noncompliance with macroeconomic performance criteria. The program interruptions series is taken
from Bal Gunduz (2009) and updated by the authors of this study for the period 2008–11.
8 Of the academic studies mentioned in the literature review Atoyan and Conway (2006) have used a matching
technique similar to the PSM. 2011 Review of Conditionality—Outcomes of Fund-Supported Programs,
forthcoming has also made use of the PSM.

10
to LICs. Finally, countries‘ access to IMF resources is proxied by their IMF quota. See
Annex I for additional discussion and estimation results.
12. The results of the PSM suggest that longer-term Fund engagement has been
associated with improved macroeconomic and socio-institutional outcomes. Table 1
presents the PSM results for dependent variables measured both in levels and changes in
order to capture both absolute and relative differences between countries with and without
longer-term Fund engagement in their macroeconomic outcomes.
Longer-term Fund engagement leads to significantly higher long-term real per capita
GDP growth both in levels and changes. Similarly, the poverty gap is significantly
lower and decreases more for countries with longer-term Fund engagement.
Growth volatility and external debt are lower and the CPIA is higher for countries
with longer-term Fund engagement, although the changes in these variables are not
significantly different from the control group of non-longer-term Fund users.
Changes in inflation, tax revenue, FDI, and social spending are significantly higher in
absolute terms for longer-term Fund users while the corresponding level is not
significantly different from the control group. This result corroborates the stylized
fact that strong economic improvement of longer-term program users has largely
eliminated the performance gap that existed relative to other LICs over the 1986–
2010 period.
Government balance and its changes are positive but not significantly different from
the control group of non-longer-term users. One possible explanation for this result
may be the fact that LICs are financing-constrained and Fund-supported programs
provide direct financing and catalyze donor support which allows them to address
their development needs.
Reserve coverage and its changes are positive but also not significantly different from
the control group.

11
Panel growth regression
13. Panel regressions are used as a complementary approach to estimate the impact
of longer-term Fund engagement on growth and identify the associated transmission
channels. The starting point for the growth specification follows a large strand of empirical
growth literature that seeks to link economic growth performance to economic as well as
institutional variables in a panel dataset context. Under an initial regression specification, a
two-way fixed-effects model is estimated where we include as explanatory variables certain
growth determinants that have received attention in the literature but exclude variables that
are likely to be under the direct influence of IMF-supported programs. In subsequent
regressions, we augment our specification by including explanatory variables that are likely
to be influenced by IMF engagement as identified in the PSM analysis above and study the
change in magnitude of the coefficients associated with the longer-term Fund engagement
dummy along with the changes in their statistical significance.9 A variable will be considered
as a likely transmission channel if it is significant and the coefficient associated with the
Fund dummy decreases in size and/or significance relative to the benchmark model.
14. The panel growth regressions corroborate the PSM findings that longer-term
Fund engagement appears to support higher real per capita GDP growth. They also
help to identify the transmission channels through which this impact is achieved (Table 2).
All regressions control for standard determinants of real GDP growth and also for the
9 The variables used to augment the growth regressions must have turned out to be significant in the PSM
analysis in conjunction to being common determinants of growth in the literature.
Table 1: Impact of Longer-term Fund Engagement on Economic and Insitutional Performance
Growth
Change in
growth
Growth
volatility
Change in growth
volatility Inflation
Change in
inflation
Coefficient 1.83 *** 3.448 *** -0.38 *** -1.747 -4.192 -14.072 ***
St. Error (0.48) (0.78) (0.13) (1.14) (14.65) (4.15)
Tax revenue
Change in tax
revenue
Government
balance
Change in
government balance
Reserve
coverage
Change in
reserve coverage
Coefficient 0.462 1.67 * 0.952 1.551 0.236 0.256
St. Error (1.25) (0.96) (0.66) (1.65) (0.38) (0.41)
Current
account
Change in
current
account FDI Change in FDI External debt
Change in
external debt
Coefficient -1.593 0.401 0.875 1.45 ** -25.986 ** -33.559
St. Error (1.12) (1.38) (0.86) (0.66) (13.27) (17.36)
CPIA
Change in
CPIA Poverty gap
Change in poverty
gap Social spending
Change in social
spending
Coefficient 0.302 *** 0.008 -7.47 ** -4.992 * 0.653 1.602 ***
St. Error (0.12) (0.19) (3.24) (3.06) (0.59) (0.63)
* 10 percent signif icance; **5 percent signif icance; ***1 percent significance.Notes: Bootstrapped standard errors in parentheses. Each coef f icient represents a separate estimation. All coef f icient estimates share the same f irst-
stage regression on the determinants of longer-term Fund engagement. Analysis is based on four 10-year period averages between 1986 and 2010
where periods overlap by 50 percent. A country is considered to have longer-term (LT) engagement in a given decade if in five or more years it had a financial arrangement or a PSI in place, for at least six months in each of theseyears. Changes in each varaible refer to first decadal differences .

12
endogeneity of longer-term Fund engagement through the inverse Mills ratio estimated in the
first-stage PSM selection equation model.10
The regression results confirm the PSM finding above that longer-term Fund
engagement appears to have a positive impact on long-term real per capita GDP
growth.
Based on the different specifications of the panel regression, it appears that inflation,
real per capita GDP growth volatility, debt, and institutional quality are significant
transmission channels of the Fund longer-term impact on growth.
When controlling for both the longer-term Fund engagement and the size of net IMF
disbursements in the decade, only the longer-term Fund engagement dummy is
significant. This suggests that for longer-term growth performance, it is the IMF‘s
policy support that matters rather than the overall level of financing provided in this
context.
Robustness
15. The econometric results under the PSM and panel growth regression approaches
remain broadly unchanged under a series of robustness checks. For the PSM approach,
the significance of the coefficients remains broadly similar when alternative matching
approaches are used. Furthermore, the PSM estimation results were broadly similar when
yearly rolling decadal averages were used to increase the number of observations.11
For the
panel growth regression, an alternative specification that included foreign aid as an additional
explanatory variable did not change the results substantially, and aid did not turn out to be
statistically significant.
10
The inverse Mills ratio is the ratio of the probability density function to the cumulative distribution function
of a distribution.
11 The results shown in Table 1 are based on decades with a 50 percent rather than 90 percent overlap, which
mitigates the possibility of serial correlation among the independent variables.

13
Table 2: Determinants of Long-term Real per Capita GDP Growth
Long-term Fund engagement 0.808 ** 0.794 ** 0.757 ** 0.550 0.813 ** 0.842 ** 0.566
(0.40) (0.40) (0.38) (0.38) (0.40) (0.40) (0.36)
Inflation -0.001 ** -0.002 ***
(0.00) (0.00)
Growth volatility -0.171 *** -0.102 **
(0.05) (0.05)
Institutional quality 1.656 *** 1.742 ***
(0.52) (0.61)
Debt -0.006 * 0.009
(0.00) (0.01)
IMF disbursements -0.585 -1.073
(0.77) (0.74)
Trade openness 0.030 * 0.031 * 0.03 * 0.034 * 0.028 -0.002 0.008
(0.02) (0.02) (0.02) (0.02) (0.02) (0.01) (0.01)
Education 0.044 *** 0.042 *** 0.035 ** 0.039 *** 0.042 *** 0.03 * 0.018
(0.02) (0.02) (0.02) (0.02) (0.02) (0.02) (0.02)
Inverse Mills ratio -1.639 ** -1.458 ** -1.486 ** -1.619 ** -1.481 ** -2.164 *** -1.928 ***
(0.72) (0.71) (0.69) (0.72) (0.72) (0.68) (0.64)
Constant -2.97 -2.968 -1.768 -8.198 *** -2.529 1.482 -4.089
(2.16) (2.14) (2.12) (2.43) (2.19) (1.99) (3.07)
Observations 234 234 234 234 234 199 199
* 10 percent signif icance; **5 percent signif icance; ***1 percent signif icanceNotes: Robust standard errors in parentheses. Period dummies were included in the regression specif ication (not shown). Analysis is based on four 10-year period averages between 1986 and 2010 where periods overlap by 50 percent. A country is considered to have longer-term (LT)
engagement in a given decade if in f ive or more years it had a f inancial arrangement or a PSI in place, for at least six months in each of theseyears.

14
III. IMPACT OF SHORT-TERM FUND FINANCING IN LICS
16. This section explores the short-term macroeconomic effects of Fund financial
support to LICs experiencing immediate balance of payment needs as a result of policy
slippages or external shocks.12
The nature of Fund support evaluated in this section differs
from the more extensive program support via successive medium-term arrangements
discussed above. Here, we focus on short-term Fund financial support, either through
augmentations of access under existing medium-term financial arrangements or through short
term or emergency financing instruments. Such support would often be called for when a
country faces a pressing balance of payments problem, which would require a combination of
macroeconomic adjustment and external financing. The Fund engagement in these cases
would typically involve understandings on short-term macroeconomic adjustment
accompanied by Fund financing, which could potentially have catalytic effects inducing
additional bilateral and multilateral financing.
17. Sample selection bias is an even greater methodological challenge when studying
the short-term impact of Fund-supported programs. If countries that are experiencing
balance of payments crises owing to policy slippages and/or exogenous shocks are more
likely to participate in Fund-supported programs, failing to correct for selection bias could
lead to a flawed conclusion that programs ―cause‖ these crises along with adverse effects on
macroeconomic outcomes. As in Section II, this study implements the PSM methodology: in
the first stage, the annual probability of participating in Fund-supported programs is
estimated conditional on observable economic conditions and country characteristics. The
second stage uses these probabilities, or propensity scores, to match program countries to
non-program countries, and thereby, construct a statistical comparison, or control, group (See
Annex I for details).
Empirical Analysis
18. The probability of participation in Fund-supported programs that address
policy and/or exogenous shocks increases with the deterioration in the pre-shock
macroeconomic conditions and the magnitude of the adverse external shocks. The
selection model for LIC participation in Fund-supported programs draws on Bal Gündüz
(2009). This study finds that a lower reserve coverage, a deterioration in the current account
balance, a weaker real GDP growth, increased macroeconomic instability (evident in higher
fiscal deficits, inflation and exchange market pressures), and adverse terms of trade shocks
12
The set of arrangements include those addressing an immediate balance of payments need arising from policy
and/or exogenous shocks. SBAs, SAF/ESAF/PRGF/ECF augmentations, Compensatory Financing Facilities
(CFFs), ESFs, SCFs, and Rapid Credit Facilities (RCFs) are included in this set. Sample period covers 1980–
2010. More details are provided in Annex I.

15
would increase the likelihood of Fund financing. Moreover, global conditions, including
changes in real oil and non-oil commodity prices and world trade, are also significant
determinants of participation in Fund-supported programs which could potentially create
cycles in demand for Fund financing as a result of adverse global shocks. Finally, persistent
differences in debt service burden and resource inflows among LICs seem to be significantly
associated with unobserved country heterogeneity.
19. The results suggest that Fund-supported programs lead to significantly better
outcomes for LICs experiencing substantial prior macroeconomic imbalances and/or
severe adverse external shocks. Table 3 and Figure 4 present the differences in various
macroeconomic outcomes between program countries and the control groups. Overall,
program countries have significantly higher growth, current account balances, and reserve
coverage, as well as lower inflation and fiscal deficits compared to their control groups.
The estimated impacts are higher for countries with high propensity scores, which
indicate immediate balance of payments problems brought about by existing
macroeconomic imbalances and/or external shocks.
The positive impact on growth is likely explained by Fund financing (along with its
potential catalytic effects) easing the burden of the short-term adjustment for
countries experiencing severe balance of payments difficulties.
Although program countries tend to have more depreciated real exchange rates,
differences with the control groups are not significant.
The change in growth is significantly higher and change in inflation significantly
lower than those of the control groups for countries with high propensity scores.
Reflecting the stabilization achieved under Fund-supported programs, reserves and
the current account balances improve significantly more in all program countries than
the control group.
Change in fiscal balances is positive but not significantly different than the
adjustments undertaken by their control groups, except for those with very high
propensity scores (Figure 5 and Table 3).
Changes in real health and education spending per capita are not statistically different
from those of the control group.

16
All LICs
Macroeconomic outcomes
Real GDP growth (%) 0.8 1.5 ** 1.9 ***
Inflation (%) -16.5 *** -20.4 *** -22.2 ***
Reserve coverage (in months of imports) 0.6 *** 0.8 *** 0.7 ***
Current account balance plus FDI (% of GDP) 1.2 2.5 ** 2.9 **
Government balance (% of GDP) 1.2 ** 1.7 ** 1.9 **
Change in real health spending per capita (%) 8.4 * 8.6 13.4
Change in real education spending per capita (%) 0.5 -2.3 -4.1
Change in REER -3.4 -3.4 -5.3
Change in macroeconomic outcomes (X(t)-X(t-1))
Real GDP Growth (%) 0.3 1.2 1.9 **
Inflation (%) -6.2 * -10.0 ** -12.5 **
Reserve coverage (in months of imports) 0.6 *** 0.8 *** 0.7 ***
Current account balance plus FDI (% of GDP) 2.2 *** 3.2 *** 3.6 ***
Government balance (% of GDP) 0.6 0.8 0.9 *
# of observations 1/ 790 448 357
Table 3: Impact of Short-term Fund Engagement by Propensity Score
Matching
LICs with weaker
fundamentals
PS>0.5 PS>0.7
Source: Staf f calculations.Note: PS stands for the propensity score indicating the likelihood of Fund programs addressing immediate balance of payments needs. Changes in macroeconomic outcomes
refer to f irst dif ferences of the variables in the top panel. Signif icant at 10 percent:*; 5 percent:**; and 1 percent:***. The sample is composed of 58 LICs and covers 1980-2010. 1/ All variables except for health and education spending and change in REER for which data
is more limited.

17
IV. CONCLUDING REMARKS
20. The empirical work presented above suggests that Fund program support can
benefit LICs’ economies via two distinct channels:
Longer-term policy support can help LICs gradually build macroeconomic buffers.
Longer-term program support by the Fund is positively associated with higher long-
term growth rates, less growth volatility, more rapid poverty reduction, higher tax
ratios, higher levels of social spending, higher institutional quality, higher FDI and
lower inflation and external debt. Noticeably, this result does not seem to depend on
the amount of Fund financing provided over the longer term.
Short-term liquidity support can play an important role in mitigating the impact of
shocks. Short-term Fund financial support in the context of shocks and policy
slippages is positively associated with higher short-term growth, current account
balances, and reserve coverage, as well as lower inflation and fiscal deficits compared
to their control groups.
21. These results shed some light on how Fund support may have helped LICs
weather the recent global financial crisis. First, longer-term Fund support via successive
medium-term programs primarily under the ECF and its predecessors (and more recently
under the PSI), seems to have helped LICs in raising longer-term growth and gradually
building the macroeconomic buffers and institutional capacity needed for a robust policy
response to the crisis. Second, the Fund‘s sharp increase in financial assistance in 2009—
doubling access and increasing commitments to roughly four times the historical average, in
addition to the global SDR allocation— helped relax countries‘ liquidity constraints at the
height of the crisis, which allowed them to preserve or even increase spending. 13
14
The
combination of stronger pre-crisis buffers and crisis financing allowed most LICs to mount a
countercyclical fiscal policy response in 2009—a first for LICs, which in past crises tended
to cut spending and tighten the fiscal stance.15
This domestic response facilitated a rapid
economic recovery in LICs, which in past crises had lagged behind the rest of the world.
13 This came in addition to the Fund‘s response to the food and fuel price shocks of 2008 when various new
programs and augmentations were approved and the ESF was modified to better support eligible members. 14
See Emerging from the Global Crisis: Macroeconomic Challenges Facing Low-Income Countries. For a
detailed analysis of program design and objectives, and outcomes, see 2011 Review of Conditionality-Overview
Paper, forthcoming.
15 See Fabrizio (2009) Coping with the Global Financial Crisis: Challenges Facing Low-Income Countries, for
a discussion of how LICs responded to the global financial crisis.

18
22. The empirical work also suggests that the Fund’s facilities for LICs
appropriately include a diverse set of tools, including some that focus on medium-term
policy support and some that focus on short-term financing. It highlights the benefits of
the ECF and PSI, which can provide policy support over the medium term. It also underlines
that, whether or not a country has an ECF or PSI in place, Fund financing may need to be
provided quickly and on an appropriate scale when urgent balance of payments needs arise,
either through augmentations of the ECF or support under the SCF or RCF. It can also be
inferred that, in the absence of shocks or urgent financing needs, ECF arrangements and
precautionary SCF arrangements can have a significant value for LICs, even at low access
levels, as they can provide both policy support (through well-designed macroeconomic
programs) and insurance (through the possibility of disbursements in the event that shocks
arise).

19
REFERENCES
Atoyan, Ruben, and Patrick Conway, 2006, ―Evaluating the Impact of IMF Programs: A
Comparison of Matching and Instrumental-Variable Estimators,‖ The Review of
International Organizations, Vol. 1 (2), pp. 99–124.
Bal Gunduz, Yasemin, 2009, ―Estimating Demand for IMF Financing by Low-Income
Countries in Response to Shocks,‖ IMF Working Paper No. 09/263 (Washington:
International Monetary Fund).
Barro, Robert and Jong-Wha Lee, 2005, ―IMF Programs: Who is Chosen and What Are the
Effects?‖ Journal of Monetary Economics, Vol. 52 (7), pp. 1245–69.
Biglaiser, Glen, and Karl DeRouen, 2010, ―The Effects of IMF Programs on U.S. Foreign
Direct Investment in the Developing World,‖ The Review of International
Organizations, Vol. 5 (1), pp. 73–95.
Bird, Graham, 2007, ―The IMF: A Bird‘s Eye View of its Role and Operations,‖ Journal of
Economic Surveys, Vol. 21 (4), pp 683–745.
———, Mumtaz Hussain, and Joseph P. Joyce, 2004, ―Many Happy Returns? Recidivism
and the IMF,‖ Journal of International Money and Finance, Vol. 23 (2), pp. 231–51.
———, and Dane. Rowlands, 2001, ―IMF Lending: How Is It Affected by Economic,
Political and Institutional Factors?‖ The Journal of Policy Reform, Vol. 4 (3),
pp. 243–70.
———, 2009, ―A Disaggregated Empirical Analysis of the Determinants of IMF
Arrangements: Does One Model Fit All?‖ Journal of International Development,
Vol. 21 (7), pp. 915–31.
Bredenkamp, Hugh and Susan Schadler, eds., 1999, Economic Adjustment and Reform in
Low-Income Countries: Studies by the Staff of the International Monetary Fund
(Washington: International Monetary Fund).
Butkiewicz, James, and Halit Yanikkaya, 2005, ―The Effects of IMF and World Bank
Lending on Long-Run Economic Growth: An Empirical Analysis,‖ World
Development, Vol. 33 (3), pp.371–91.
Cerutti, Eugenio, 2007, ―IMF Drawing Programs: Participation Determinants and
Forecasting,‖ IMF Working Paper No. 07/152 (Washington: International Monetary
Fund).
Chamberlain, Gary, 1982, ―Multivariate Regression Models for Panel Data,‖ Journal of
Econometrics, Vol. 18 (1), pp. 5–46.

20
Chari, Anusha, Wenjie Chen, and Kathryn Dominguez, 2012, ―Foreign Ownership and Firm
Performance: Emerging Market Acquisitions in the United States,‖ IMF Economic
Review, Vol. 60 (1), pp. 1–42.
Clements, Benedict, Sanjeev Gupta, and Masahiro Nozaki, 2011, What Happens to Social
Spending in IMF-Supported Program?, IMF Staff Discussion Note No. 11/15
(Washington: International Monetary Fund).
Dicks-Mireaux, Louis, Mauro Mecagni, and Susan Schadler, 2000, ―Evaluating the Effect of
IMF Lending to Low-Income Countries,‖ Journal of Development Economics,
Vol. 61, pp. 495-526.
Fabrizio, Stefania, 2009, Coping with the Global Financial Crisis: Challenges Facing Low-
Income Countries (Washington: International Monetary Fund).
Ghosh, Atish, Charalambos Christofides, Jun Kim, Laura Papi, Uma Ramakrishnan, Alun
Thomas, and Juan Zalduendo, 2005, The Design of IMF-Supported Programs, IMF
Occasional Paper No. 241 (Washington: International Monetary Fund).
International Monetary Fund, 2006, Review of Ex Post Assessments and Issues Relating to
the Policy on Longer-Term Program Engagement (Washington).
———, 2009, The Fund’s Facilities and Financing Framework for Low-Income Countries—
Supplementary Information (Washington).
———, 2010, Emerging from the Global Crisis: Macroeconomic Challenges Facing Low-
Income Countries (Washington).
———, 2012a, 2011 Review of Conditionality—Overview Paper, forthcomoing
(Washington).
———, 2012b, 2011 Review of Conditionality—Outcomes of Fund-Supported Programs,
forthcoming (Washington).
Independent Evaluation Office, 2002, Evaluation of Prolonged Use of IMF Resources
(Washington: International Monetary Fund).
Ivanova, Anna, Wolfgang Mayer, Alex. Mourmouras, and George Anayiotos, 2003, ―What
Determines the Implementation of IMF-Supported Programs?‖ IMF Working Paper
03/8, Published in A. Mody and A. Rebucci (eds), IMF-Supported Programs: Recent
Staff Research 2006 (Washington: International Monetary Fund).
Jaramillo, Laura and Cemile Sancak, 2009, Why Has the Grass Been Greener on One Side of
Hispaniola? A Comparative Growth Analysis of the Dominican Republic and Haiti,
IMF Staff Papers, Vol. 56 (2), pp. 323–49.

21
Lin, Shu, 2010, ―On the International Effects of Inflation Targeting,― The Review of
Economics and Statistics, Vol. 92 (1), pp. 195–99.
———, and Haichun Ye, 2007, ―Does Inflation Targeting Really Make a Difference?
Evaluating the Treatment Effect of Inflation Targeting in Seven Industrial Countries,―
Journal of Monetary Economics, Vol. 54 (8), pp. 2521–33.
———, and Haichun Ye, 2009, ―Does Inflation Targeting Make a Difference in Developing
Countries?― Journal of Development Economics, Vol. 89 (1), pp. 118–23.
Mecagni, Mauro, 1999, ―The Causes of Program Interruptions,‖ In Hugh Bredenkamp and
Susan Schadler, eds.1999, Economic Adjustment and Reform in Low-Income
Countries, Studies by the Staff of the International Monetary Fund, Chapter 9, pp
215–276 (Washington: International Monetary Fund).
Mundlak Yair, 1978, ―On the Pooling of Time Series and Cross Section Data,‖
Econometrica, Vol. 46 (1), pp. 69–85.
Przeworski, Adam and James Raymond Vreeland, 2000, ―The Effect of IMF Programs on
Economic Growth,― Journal of Development Economics, Vol. 62 (2), pp. 385–421.
Rosenbaum, Paul R., and Donald B. Rubin, 1983, ―The Central Role of the Propensity Score
in Observational Studies for Causal Effects,‖ Biometrika, Vol. 70 (1), pp. 41–55.
Steinwand, Martin and Randall Stone, 2008, ―The International Monetary Fund: A Review of
the Recent Evidence,‖ Review of International Organizations, Vol. 3 (2), pp. 123–49.
Stone, Randall, 2004, ―The Political Economy of IMF Lending in Africa,‖ American
Political Science Review,” Vol. 98 (4), .pp. 577–91.
Tapsoba, Rene, 2012, ―Do National Numerical Fiscal Rules Really Shape Fiscal Behaviours
in Developing Countries? A Treatment Effect Evaluation,‖ Economic Modelling,
Vol. 29 (4), pp. 1356–69.

22
ANNEX I. PROPENSITY SCORE MATCHING (PSM) METHODOLOGY
A. Addressing Selection Bias—Alternative Approaches
The literature on the impact of IMF-supported programs has used various approaches to address
sample selection bias, with the aim of constructing a credible counterfactual. One strategy is the
‗before-after‘ approach, which assumes that all the conditions that can affect a country‘s performance
are the same before a program is in place as they are after, hence any change in performance can be
attributed to the Fund-supported program (Ghosh and others (2005)). This method suffers from biases
associated with changes in the economic structure of the country or shocks between the two periods
that are unrelated to the decision to participate in a program. Another approach is to use instrumental
variables that are correlated with treatment selection but are not directly correlated with the outcome
variable (Barro and Lee (2005)). The identification of appropriate and truly exogenous instruments is
a major challenge for this approach. The Generalized Evaluation Estimator (GEE) uses policy
reaction functions for non-program countries to approximate the counterfactual (Dicks-Mireaux,
Mecagni, and Schadler (2000)). Identification of exogenous instruments remains a challenge under
this approach. Yet another approach is Heckman‘s selection correction model, based on unobservable
factors, where in the first stage a probit model is used to predict the probability of Fund-supported
program engagement and in the second stage, the inverse Mills‘ ratio is included as a regressor
(Przeworski and Vreeland (2000)). A final method, used in this supplement, is discussed below.
B. PSM Methodology
The econometric analyses in this supplement use the PSM approach to control for selection bias. This
is a relatively new and innovative class of statistical methods for impact evaluation.16
It involves a
statistical comparison of country groups based on two steps:
First, the probability of participating in Fund-supported programs is estimated conditional on
observable economic conditions and country characteristics (selection model).17
At the second step, these probabilities, or propensity scores, are used to match program
countries to non-program countries, and thereby, construct a statistical control group.18
16
Of the studies mentioned in the literature review Atoyan and Conway (2006) have used a matching technique
similar to the PSM. 2011 Review of Conditionality—Outcomes of Fund-Supported Programs, forthcoming has
also made use of the PSM.
17 Sections II and III estimate separate Fund participation selection models. In Section II the dependent variable
is the longer-term Fund engagement dummy, while in Section III the depend variable is the Fund program
participation dummy.
18 This study uses the nearest neighbor matching approach, which constructs a control group of countries by
choosing those three non-program countries with probability of requesting a program as close as possible to that
of the specific program country in question.

23
The matching based on the likelihood of participation in Fund-supported programs assures similarity
of initial macroeconomic conditions and country characteristics in the comparison, or control, group.
The control group provides in effect a proxy for the counterfactual, i.e., for macroeconomic outcomes
if program countries had not had a program. The effects of the Fund program are then calculated as
the mean difference in a range of macroeconomic outcomes across these two groups.
The results from this approach should be interpreted with caution as PSM is useful when only
observed pre-treatment characteristics are believed to affect program participation. Two necessary
assumptions for identification of the program effects are (i) conditional independence; and
(ii) presence of a common support. Conditional independence, also called confoundedness, implies
that the program participation is based entirely on observed pre-shock characteristics of LICs. If
unobserved characteristics determine program participation, conditional independence will be
violated, and PSM would not be an appropriate method. Using a rich set of pre-program data to
estimate the probability of participation in Fund programs helps support the conditional independence
assumption. In other words, a well-specified and comprehensive selection model explaining the
participation in Fund programs is the key to properly assess the impact of Fund programs. The second
condition, i.e., presence of a common support, ensures that treatment observations have comparison
observations ―nearby‖ in the propensity score distribution.
In the analyses of this supplement, Fund engagement is taken as a treatment status, analogous to the
program evaluation literature in microeconomic studies.19
Countries that have engagement with the
Fund are called the treatment group whereas the remaining others in the sample are called the control
group. The average treatment effect of Fund engagement on the treated group (ATT) is given by:
where is the dummy variable identifying LICs with Fund engagement in a given window period
(annual for the short-term engagement, and decadal for the long-term engagement). is the
value of the macroeconomic outcome that would have been observed if a LIC with Fund engagement
had not experienced such an engagement, and is the outcome value observed on the same
country. The key assumption needed to apply the matching method is the conditional independence
assumption which requires that, conditional on some control variables X, the outcomes be
independent of the IMF engagement dummy . Under this assumption, equation (1) can be rewritten
as
where we have replaced with , which is observable. Rosenbaum
and Rubin (1983) propose that one can match the treated units and control units on their propensity
19
The use of the PSM technique in the macroeconomic literature has been popularized by recent empirical
papers focusing on the effects of the inflation targeting arrangement on macroeconomic performances (see Lin
and Ye, 2007 and 2009; Lin, 2010), on the effects of fiscal rules on fiscal behavior in developing countries
(Tapsoba, 2012), or on the economic impacts of foreign capital flows (see Chari, Chen, and Dominguez, 2012).

24
scores, (which represent here the probabilities of being long term IMF program countries for Section
II or participants of Fund-supported programs in Section III) conditional on X and can be estimated
using simple probit or logit models. A further assumption needed to apply propensity score matching
is the common support assumption (p(Xi) < 1), which requires the existence of some comparable
control units for each treated unit. When propensity score matching is used, the ATT now can be
estimated as
The strategy then consists in computing the differences in the outcomes for observations with
similar propensity scores (the probability of having a Fund engagement). Various methods have been
proposed in the literature to match observations. In this study, we present results using the nearest
neighbor technique. The nearest neighbor matching estimator sorts all records by the estimated
propensity score, and then searches forward and backward for the closest control units. In this study
we make use of the three nearest neighbors.
C. Specification of the PSM Selection Model
Despite the vast literature on determinants of IMF arrangements, existing models are far from
definitive. Bird (2007) argues that the empirical evidence so far may imply that important
determining variables may still have been omitted, or there is no one overall explanation of IMF
arrangements. Consistent with this view, the econometric analysis in the supplement focused on the
sub-group of LICs and distinguishes longer-term engagement from short-term financing, thereby
creating more homogenous samples that allow for a more robust identification of the determinants of
participation in Fund-supported programs.
Selection model for longer-term Fund engagement
The selection model estimated is a pooled probit regression. The dependent variable is a dummy
variable identifying longer-term Fund engagement. The dummy variable takes the value of 1 if a
country has had five or more years of Fund-supported programs in a 10-year period and zero
otherwise. The qualifying programs are all Fund financial arrangements available to LICs, primarily
the ECF and its predecessors (PRGF, ESAF, SAF) but also the SBA, ESF-HAC, and SCF, as well as
the PSI. Program years have been purged of episodes when there were prolonged program
interruptions.20
Given the focus on longer-term engagement the analysis is based on decadal averages
where periods share a 50 percent overlap with each other in order to increase the number of
20
Following the approach introduced by Mecagni (1999), a delay of more than six months in completing a
review owing to noncompliance with macroeconomic performance criteria is taken as an interruption. The
program interruptions series is taken from Bal Gündüz (2009) and updated for the period 2008–11. Bal Gündüz
(2009) used the Ivanova and others (2003) dataset, identifying interruptions for the whole program as an input,
and extended it to identify specific years of interruptions and the Mecagni (1999) dataset which identified
program interruptions for SAF/ESAF. Interruption is captured by examining cases when there was a delay of
more than six months in completing a review owing to noncompliance with macroeconomic performance
criteria.

25
observations.21
Longer-term Fund engagement is determined by a country‘s initial macroeconomic
buffers, its structural characteristics, as well as external demand conditions and the size of its quota.
The independent variables are chosen broadly in line with the literature‘s approach of including both
demand and supply factors, with the aim of identifying a parsimonious set of variables that achieves a
relatively good fit based on the historical data series. Initial macroeconomic buffers are proxied by
the reserve coverage and the foreign aid to GDP ratio at the beginning of each decade. Structural
characteristics are proxied by dummy variables identifying countries‘ geographic and institutional
characteristics.22 Trading partners‘ real GDP growth captures external demand conditions that are
entirely exogenous to LICs. Finally, countries‘ access to IMF resources is proxied by their IMF quota.
The empirical findings (Annex I Table 1) indicate that countries with higher initial reserves and lower
aid have exhibited a lower propensity of longer-term Fund engagement. Moreover, the probability of
longer-term Fund engagement tends to increase with lower trading partner economic growth in the
decade. Finally, landlocked and francophone countries have had a higher propensity for longer-term
Fund engagement, while a larger quota has implied a lower probability of longer-term engagement.
21
The periods from which decadal averages are generated are: 1986–95; 1991–00; 1996–05; 2001–10.
22 Recent empirical studies have highlighted the role of institutional characteristics in explaining Fund
agreements (see Bird and Rowlands (2001); Butkiewicz and Yanikkaya (2005); Stone (2004)).
Annex I Table 1: Determinants of Longer-term Fund Engagement
Initial reserves -0.166 ***
(0.04)
Initial aid/GDP 0.025 ***
(0.01)
Trading partner growth -0.129 *
(0.07)
IMF quota/GDP -0.070 **
(0.03)
Francophone 0.436 **
(0.21)
Landlocked 0.787 ***
(0.20)
PRGF reform dummy -0.771 ***
(0.21)
Constant 0.571 *
(0.34)
Observations 236
* 10 percent significance; **5 percent significance; ***1 percent significanceNotes: Robust standard errors in parentheses. A country is considered to have longer -term (LT) engagement in a given decade if in five or more years it had a financial arrangement or a PSI in place, for at least six months in each of these years.

26
Selection model for the short-term Fund engagement
The selection model adopted in this study draws on Bal Gündüz (2009).23
This is the only study
looking into determinants of LIC participation in Fund arrangements addressing immediate balance of
payments needs in response to domestic policy and/or external shocks. Examining this more
homogenous subset of Fund arrangements significantly improves the specification of the selection
model, which is key to counter selection bias to properly assess the impact of IMF-supported
programs.
The dependent variable is a panel dummy variable, taking the value of one if a new Fund arrangement
is approved, and zero otherwise, indicating a normal episode. The set of arrangements include those
addressing an immediate balance of payments need arising from policy and/or exogenous shocks.
SBA, SAF/ESAF/PRGF/ECF augmentations, ESF, SCF, RCF and CFF are included in this set.
Several refinements are made to this basic set as follows: (i) precautionary SBA/SCF and
SBA/PRGF/ECF augmentations addressing natural disasters are excluded24
, and (ii) some SAF/
ESAF /PRGF/ECF arrangements are added if they address immediate balance of payments needs
arising from policy shocks. In order to systematically determine the latter cases, this study relied
heavily on program interruptions preceding SAF/ESAF/PRGF/ECF arrangements. For first time
SAF/ESAF/PRGF arrangements, narratives from staff reports are used to identify programs that
envisaged a drastic shift in macroeconomic policies to address an immediate financing gap. Normal
episodes are identified as the initial year of two successive years with no Fund financing for shocks
when the member is eligible to access Fund resources. Several refinements are made to normal
episodes to identify cases where supply constraints are binding.25
The effects of various economic variables on the probability of a LIC requesting Fund financing in
response to shocks are assessed by estimating a binary response model for panel data. The general
specification for panel probit models is given by
23
Before Bal Gündüz (2009), only Bird and Rowlands (2009) looked into determinants of Fund arrangements
with LICs, albeit without much success in improving the model specification. Only three variables turned
significant: the presence of previous Fund arrangements, high inflation, and the rescheduling of debt in the
current year. Other studies examined participation in Fund arrangements by MICs and emerging market
economies including Ghosh and others (2005) and Cerutti (2007).
24 The exclusion was based on the lack of immediate balance of payments need for precautionary SBAs and
different nature of the shock for SBAs/PRGF augmentations addressing natural disasters.
25 Members with overdue obligations to the Fund are ineligible to use Fund resources, therefore, observations
with arrears to the Fund are excluded from normal episodes. Observations with Fund financing for natural
disasters through Emergency Natural Disaster Assistance (ENDA) or PRGF augmentations, program
interruptions or break-up of negotiations for a program, Staff-Monitored Program (SMP), Emergency Post-
Conflict Assistance (EPCA), and three years leading up to EPCAs are also excluded. Finally, episodes during
which members incurred arrears to other bilateral and multilateral creditors and did not have adjustment
programs that would garner the Fund support and rescheduling by their major creditors are excluded from
normal episodes.

27
TtnicxcxyP
y
y
iitiitit
it
it
,...,1 and ,...,1 )(),|1(
episodes normal 0
requested is financing Fund if 1
(1)
where, y is the observed outcome, is the cumulative normal density function (c.d.f.), itx is the 1xk
vector of explanatory variables, and is kx1 vector of coefficients associated with itx . Different
estimators are constructed depending on their assumptions for the panel heterogeneity, i.e., how they
treat ic .26
The estimations are carried out step-by-step under different estimators and a correlated
random effects probit model is preferred based on the econometric tests for the significance of both
the individual specific effect and the sample average for covariates.
BG finds that a number of economic variables are significantly associated with increased probability
of Fund financing, including reserve coverage, current account balance to GDP, real GDP growth,
macroeconomic stability indicator and terms of trade shocks (Annex I Table 2).27 Moreover, it reports
that adverse global shocks to the change in real oil and non-oil commodity prices, and the cyclical
component of world trade increases the participation in Fund arrangements. Therefore, the demand
for Fund resources by LICs is likely to be cyclical in response to global conditions with its intensity
depending on the magnitude and persistence of adverse external shocks.
26
Pooled probit models assume independence of observations over both t and i. A random effects (RE) probit
model treats the individual specific effect, , as an unobserved random variable with if an
overall intercept is excluded, and imposes independence of and . A fixed effects (FE) probit model treats
as parameters to be estimated along with , and does not make any assumptions about the distribution of
given . This can be problematic in short panels as both and are inconsistently estimated owing to an
incidental parameters problem. Finally, a correlated random effects model relaxes independence between and
using the Chamberlain (1982) and Mundlak (1978) device under conditional normality. In this specification,
the time average is often used to save on degrees of freedom.
27In order to assess the macroeconomic policy stance based on a comprehensive set of complementary
indicators, this study used a variant of the composite indicator introduced by Jaramillo and Sancak (2009). The
formula for the indicator is given by:
)ln(//
1
1
)ln(
1
ln(
1 )1ln()ln(
)
)ln(
1 xr
it
gdpgbal
it
it
mgsres
t
itit
xr
it
it
cpi
it
it
it
blackprgdp
gbal
mgs
resres
xr
xr
cpi
cpi
mitot
t
where mitot is the macroeconomic stability index for country i at time t, cpi is the consumer
price index, xr is the exchange rate of national currency to U.S. dollar (an increase indicates a nominal
depreciation), res is the stock of international reserves, mgs is the imports of goods and services, gbal is the
government balance, gdp is the nominal GDP, blackpr is the black market premium, and σ is the standard
deviation of each variable. Weights are inverses of the standard deviation of each component for all countries
over the full sample after removing the outliers. Higher levels of mitot indicate increased macroeconomic
instability.

28
The ultimate objective is to distinguish the short-term impact of Fund-supported programs when a
country has an immediate external financing need. The treatment variable is identified symmetrically
to the one used in the selection equation. A panel dummy variable taking the value of one for the
approval of Fund-supported programs with LICs addressing immediate balance of payments needs,
and zero for non-program episodes, is constructed as the treatment variable. Refinements to the
program and non-program episodes are made similar to those for the dependent variable in the
selection equation. Within the set of program countries, a higher propensity score will identify the
Fund-supported programs addressing a clear financing need. Severe state failure events are excluded
from both program and non-program sets as the macroeconomic outcomes in these episodes will be
frail, independent of the impact of Fund-supported programs.28
Furthermore, in order to take account
of program implementation, years of program interruptions are excluded from the sample.
28 The severe state failure events are identified from Political Instability Task Force (PITF) dataset. Four types
of political crises are included in this dataset: revolutionary wars, ethnic wars, adverse regime changes, and
(continued…)
Current account balance to GDP (t-1) -0.076 *** (-4.61)
Reserve coverage in months of imports (CFA Franc zone) (t-1) -0.478 *** (-6.08)
Reserve coverage in months of imports (non-CFA Franc zone) (t-1) -0.769 *** (-8.71)
Macroeconomic stability indicator (t-1) 0.068 *** (2.89)
Real GDP growth (t-1) -0.113 *** (-4.24)
Change in terms of trade (t-1) -0.022 *** (-2.8)
Change in real oil prices in previous two years 0.009 *** (2.85)
Real world trade, cyclical component -0.099 ** (-2.53)
Change in real non-oil commodity prices -0.020 (-1.58)
Real growth of goods exports (t-1) -0.009 * (-1.79)
Paris Club dummy 0.774 *** (3.24)
Constant 0.551 (1.23)
Country Specific Averages
Total debt service to exports 0.044 *** (2.63)
FDI to GDP -0.105 * (-1.76)
Pseudo R2 0.58
376(0.00)
11(0.00)
# of observations 532
Sample probability 0.44
# of countries 55
Annex I Table 2: Demand for Fund Financing in Response to Policy
and/or External Shocks
Source: Staff calculations (Bal Gündüz, 2009). Notes: Demand for Fund financing in response to policy and/or exogenous shocks excluding natural disasters is estimated by a correlated random effects probit model. Significant at 10 percent:*; 5 percent:**; and 1 percent:***, t-statistics in parantheses. Country-specific averages are calculated as the sample average of variables for each country.
(Prob) 0 :test LR 2
(Prob) 0 :test LR 2
2
k

29
ANNEX II. PANEL REGRESSION ON THE DETERMINANTS OF LONG-TERM GROWTH
The impact of Fund-supported programs on per capita GDP growth also addresses the selection issue
and is computed using two-way fixed-effects models for panel data. All regression specifications
control for the inverse Mills ratio to address the selection bias discussed above. The starting
estimation does not control for macroeconomic variables which are considered possible transmission
channels of the longer-term impact of Fund-supported programs. The analysis here focuses on the
effect of longer-term Fund engagement on the long-term average real GDP per capita growth rate.
The specification is the following:
where refers to the real GDP per capita growth rate. Z is the matrix of control variables that are
chosen not to be related to Fund engagement. measures the total effect of Fund-supported
programs on the level of growth.
The study also assesses the strength of the transmission channels in the outcome equations by
controlling for those channels and looking at the behavior of the coefficients associated with the
longer-term IMF dummy. In order to assess the strength of each transmission channel of Fund
engagement, model (2) is augmented with the variables Y that were significantly affected by the IMF
program dummy in the PSM estimation. The specification is then:
If the inclusion of a potential transmission channel variable Y lowers (in absolute terms) the
magnitude and the significance of the coefficient associated with the IMF dummy, this will confirm
that the variable Y is one channel through which Fund-supported programs help foster economic
growth. One would then expect: along with changes in the significance of the two
coefficients.
genocides and politicides. From this dataset the variable SFTPMMAX, which presents the maximum magnitude
of all events in a year, exceeding 3.9 is taken as a severe state failure event.

30
-1.0
-0.5
0.0
0.5
1.0
1.5
2.0
2.5
3.0
3.5
4.0
1981-90 1991-00 2001-10
Real GDP per capita growth(Annual averages)
LICs with more than 10 program years
All LICs
0
2
4
6
8
10
12
14
16
18
20
1981-90 1991-00 2001-10
Inflation(Median of averages)
LICs with more than 10 program years
All LICs
-8
-7
-6
-5
-4
-3
-2
-1
0
1981-90 1991-00 2001-10
Government balance(In percent of GDP)
LICs with more than 10 program years
All LICs
-9
-8
-7
-6
-5
-4
-3
-2
-1
0
1981-90 1991-00 2001-10
Current account + FDI(In percent of GDP)
LICs with more than 10 program years
All LICs
0.0
0.5
1.0
1.5
2.0
2.5
3.0
3.5
4.0
4.5
5.0
1981-90 1991-00 2001-10
Reserves(In months of imports)
LICs with more than 10 program years
All LICs
0
1
2
3
4
5
6
7
1981-90 1991-00 2001-10
Real GDP per capita volatility
(Averages of standard deviations)
LICs with more than 10 program years
All LICs
Figure 1: Macroeconomic Conditions in LICs across Decades
0
2
4
6
8
10
12
14
16
1981-90 1991-00 2001-10
Tax revenue(In percent of GDP)
LICs with more than 10 program years
All LICs
0
2
4
6
8
10
12
1981-90 1991-00 2001-10
Capital spending(In percent of GDP)
LICs with more than 10 program years
All LICs
-8
-7.5
-7
-6.5
-6
-5.5
-5
-4.5
-4
-3.5
-3
1981-90 1991-00 2001-10
Current account (In percent of GDP)
LICs with more than 10 program years
All LICs

31
0
20
40
60
80
100
120
140
160
180
1990 2000 2010
External debt(In percent of GDP)
LICs with more than 10 program years
All LICs
4
6
8
10
12
14
16
18
20
1981-90 1991-00 2001-09
Aid(In percent of GDP)
LICs with more than 10 program years
All LICs
0
1
2
3
4
5
6
7
8
1985-90 1991-00 2001-09
Social spending(In percent of GDP)
LICs with more than 10 program years
All LICs
2.7
2.8
2.9
3.0
3.1
3.2
3.3
3.4
3.5
3.6
3.7
1990 2000 2009
CPIA
LICs with more than 10 program years
All LICs
0
1
2
3
4
5
6
1981-90 1991-00 2001-10
Foreign direct investment(In percent of GDP)
LICs with more than 10 program years
All LICs
0
5
10
15
20
25
30
35
40
1981-90 1991-00 2001-10
Exports(In percent of GDP)
LICs with more than 10 program years
All LICs
0
5
10
15
20
25
30
35
40
45
1981-90 1991-00 2001-09
Poverty
LICs with more than 10 program years
All LICs
0.0
0.5
1.0
1.5
2.0
2.5
3.0
3.5
4.0
4.5
1985-90 1991-00 2001-09
Education spending(In percent of GDP)
LICs with more than 10 program years
All LICs
0.0
0.5
1.0
1.5
2.0
2.5
3.0
3.5
4.0
1985-90 1991-00 2001-09
Health spending(In percent of GDP)
LICs with more than 10 program years
All LICs
Figure 1: Macroeconomic Conditions in LICs across Decades (Continued)
Notes: The sample is composed of 75 LICs. Each value represents an unweighted average (except inflation which shows the median) over each decade. Longer-term engagement is defined as 10 or more years of having an IMF financial arrangement or PSI in place during 1991-2010, for at least six months in each of these years.

32
-2
-1
0
1
2
3
4
5
1981-90 1991-00 2001-10
Landlocked
LICs with more than 10 program years
All LICs
-1
0
1
2
3
1981-90 1991-00 2001-10
Coastal
LICs with more than 10 program years
All LICs
-6
-5
-4
-3
-2
-1
0
1
2
3
4
5
1981-90 1991-00 2001-10
Fragile
LICs with more than 10 program years
All LICs
-1
0
1
2
3
4
1981-90 1991-00 2001-10
Non-Fragile
LICs with more than 10 program years
All LICs
-2
-1
0
1
2
3
1981-90 1991-00 2001-10
Per capita GDP<1175
LICs with more than 10 program years
All LICs
-3
-2
-1
0
1
2
3
4
5
6
1981-90 1991-00 2001-10
Per capita GDP>1175
LICs with more than 10 program years
All LICs
Real GDP Per Capita
(Growth in percent)
Figure 2: Macroecconomic Conditions in LICs across Decades and Country Groupings
5.6
5.8
6.0
6.2
6.4
6.6
6.8
7.0
7.2
7.4
7.6
7.8
1985-90 1991-00 2001-09
Landlocked
LICs with more than 10 program years
All LICs
0
1
2
3
4
5
6
7
8
1985-90 1991-00 2001-09
Coastal
LICs with more than 10 program years
All LICs
0
2
4
6
8
10
12
14
1985-90 1991-00 2001-09
Fragile
LICs with more than 10 program years
All LICs
0
1
2
3
4
5
6
7
8
1985-90 1991-00 2001-09
Non-Fragile
LICs with more than 10 program years
All LICs
0
1
2
3
4
5
6
7
8
1985-90 1991-00 2001-09
Per capita GDP<1175
LICs with more than 10 program years
All LICs
0
1
2
3
4
5
6
7
8
9
10
1985-90 1991-00 2001-09
Per capita GDP>1175
LICs with more than 10 program years
All LICs
Social Spending
(Percent of GDP)
Notes: The sample is composed of 75 LICs. Each value represents an unweighted average over each decade. Longer-term engagement is defined as 10 or more years of having an IMF financial arrangement or PSI in place during 1991-2010, for at least six months in each of these years.
0.0
0.5
1.0
1.5
2.0
2.5
3.0
3.5
1981-90 1991-00 2001-10
Small economies
LICs with more than 10 program years
All LICs
-1.5
-1.0
-0.5
0.0
0.5
1.0
1.5
2.0
2.5
3.0
3.5
4.0
1981-90 1991-00 2001-10
Non-small economies
LICs with more than 10 program years
All LICs
0
2
4
6
8
10
12
1985-90 1991-00 2001-09
Small economies
LICs with more than 10 program years
All LICs
0
1
2
3
4
5
6
7
1985-90 1991-00 2001-09
Non-small economies
LICs with more than 10 program years
All LICs

33
Figure 3: Changes in Macroeconomic Performance of LICs
-3
-2
-1
0
1
2
3
4
5
6
7
No LT engagement LT engagement
Change in average decadal real GDP per capita growth
Median
25th percentile
75th percentile
Median
25th percentile
75th percentile
-4
-3
-2
-1
0
1
2
No LT engagement LT engagement
Change in average decadal real GDP per capita volatility
Median
25th percentile
75th percentile
Median
25th percentile
75th percentile
-50
-45
-40
-35
-30
-25
-20
-15
-10
-5
0
5
No LT engagement LT engagement
Change in average decadal inflation
Median
25th percentile
75th percentile
Median
25th percentile
75th percentile
0
1
2
3
4
5
6
Change in average decadal FDI/GDP
Median
25th percentile
75th percentile
Median
25th percentile
75th percentile
LT engagement
-2
-1
0
1
2
3
4
5
6
No LT engagement LT engagement
Change in average decadal government balance/GDP
Median
25th percentile
75th percentile
Median
25th percentile
75th percentile
-3
-2
-1
0
1
2
3
4
5
6
7
No LT engagement LT engagement
Change in average decadal (current account + FDI)/GDP
Median
25th percentile
75th percentile
Median
25th percentile
75th percentile
No LT engagement

34
Figure 3: Changes in Macroeconomic Performance of LICs (Continued)
-4
-2
0
2
4
6
8
10
No LT engagement LT engagement
Change in average decadal exports/GDP
Median
25th percentile
75th percentile
Median
25th percentile
75th percentile
-80
-70
-60
-50
-40
-30
-20
-10
0
10
20
No LT engagement LT engagement
Median
25th percentile
75th percentile
Median
25th percentile
75th percentile
Change in external debt/GDP
-0.6
-0.4
-0.2
0.0
0.2
0.4
0.6
No LT engagement LT engagement
Change in CPIA
Median
25th percentile
75th percentile
Median
25th percentile
75th percentile
-1.5
-1.0
-0.5
0.0
0.5
1.0
1.5
2.0
No LT engagement LT engagement
Change in average decadal social spending/GDP
Median
25th percentile
75th percentile
25th percentile
75th percentile
Median
-18.0
-16.0
-14.0
-12.0
-10.0
-8.0
-6.0
-4.0
-2.0
0.0
2.0
4.0
No LT engagement LT engagement
Change in average decadal poverty gap
Median
25th percentile
75th percentile
Median
25th percentile
75th percentile
-6
-5
-4
-3
-2
-1
0
1
2
No LT engagement LT engagement
Change in average decadal aid/GDP
Median
25th percentile
75th percentile
Median
25th percentile
75th percentile

35
Figure 3: Changes in Macroeconomic Performance of LICs (Continued)
-1.0
-0.5
0.0
0.5
1.0
1.5
No LT engagement LT engagement
Change in average decadal education spending/GDP
Median
25th percentile
75th percentile
Median
25th percentile
75th percentile
-1.5
-1.0
-0.5
0.0
0.5
1.0
1.5
2.0
2.5
3.0
3.5
No LT engagement LT engagement
Change in average decadal tax revenue/GDP
Median
25th percentile
75th percentile
Median
25th percentile
75th percentile
-3
-2
-1
0
1
2
3
4
No LT engagement LT engagement
Change in average decadal capital spending/GDP
Median
25th percentile
75th percentile
Median
25th percentile
75th percentile
-5
-4
-3
-2
-1
0
1
2
3
4
5
No LT engagement LT engagement
Change in average decadal current account/GDP
Median
25th percentile
75th percentile
Median
25th percentile
75th percentile
-0.5
0.0
0.5
1.0
1.5
2.0
2.5
3.0
No LT engagement LT engagement
Change in average decadal reserve coverage(In months of imports)
Median
25th percentile
75th percentile
Median
25th percentile
75th percentile
-0.8
-0.6
-0.4
-0.2
0.0
0.2
0.4
0.6
0.8
1.0
No LT engagement LT engagement
Change in average decadal health spending/GDP
Median
25th percentile
75th percentile
Median
25th percentile
75th percentile
Notes: The sample is composed of 75 LICs and four overlapping decadal period averages:1986-95; 1991-00; 1996-05; 2001-10. A country is considered to have longer-term (LT) engagement in a given decade if in five or more years it had a financial arrangement or a PSI in place, for at least six months in each of these years. The chart shows the distribution of decadal changes across countries by quartiles.

36
Figure 4: The Impact of Short-Term Fund Engagement on Macroeconomic Outcomes (by propensity scores: Fund-supported programs minus the control group)
0.0
0.5
1.0
1.5
2.0
2.5
All PS>0.5 PS>0.7
Real GDP Growth (In percent)
-25.0
-20.0
-15.0
-10.0
-5.0
0.0
All PS>0.5 PS>0.7
Inflation (In percent)
0.0
0.1
0.2
0.3
0.4
0.5
0.6
0.7
0.8
0.9
All PS>0.5 PS>0.7
Reserve coverage (In months of imports)
0.0
0.5
1.0
1.5
2.0
2.5
All PS>0.5 PS>0.7
Government balance (In percent of GDP)
0.0
0.5
1.0
1.5
2.0
2.5
3.0
3.5
All PS>0.5 PS>0.7
Current account balance plus FDI (In percent of GDP)
Source: Staff estimates.Notes: Estimated impact of short-term Fund engagement on changes in macroeconomic outcomes relative to the control group having similar propensity scores. PS stands for the propensity score indicating the likelihood of Fund programs addressing immediate balance of payments needs. Changes in macroeconomic outcomes refer to first differences of the outcome variables. The sample is composed of 58LICs and covers 1980-2010.
-6.0
-5.0
-4.0
-3.0
-2.0
-1.0
0.0
All PS>0.5 PS>0.7
Change in REER (In percent)
0.0
2.0
4.0
6.0
8.0
10.0
12.0
14.0
16.0
All PS>0.5 PS>0.7
Real health spending per capita (Percent change)
-4.5
-4.0
-3.5
-3.0
-2.5
-2.0
-1.5
-1.0
-0.5
0.0
0.5
1.0
All PS>0.5 PS>0.7
Real education spending per capita (Percent change)

37
Figure 5: The Impact of Short-Term Fund Engagement on Changes in Macroeconomic Outcomes
(by propensity scores: Fund programs minus the control group)
0.0
0.2
0.4
0.6
0.8
1.0
1.2
1.4
1.6
1.8
2.0
All PS>0.5 PS>0.7
Real GDP growth (In percent)
-14.0
-12.0
-10.0
-8.0
-6.0
-4.0
-2.0
0.0
All PS>0.5 PS>0.7
Inflation (In percent)
0.0
0.1
0.2
0.3
0.4
0.5
0.6
0.7
0.8
0.9
All PS>0.5 PS>0.7
Reserve coverage (In months of imports)
0.0
0.1
0.2
0.3
0.4
0.5
0.6
0.7
0.8
0.9
1.0
All PS>0.5 PS>0.7
Government balance (In percent of GDP)
0.0
0.5
1.0
1.5
2.0
2.5
3.0
3.5
4.0
All PS>0.5 PS>0.7
Current account balance plus FDI (In percent of GDP)
Source: Staff estimates.Notes: Estimated impact of short-term Fund engagement on changes in macroeconomic outcomes relative to the control group having similar propensity scores. PS stands for the propensity score indicating the likelihood of Fund programs addressing immediate balance of payments needs. Changes in macroeconomic outcomes refer to first differences of the outcome variables. The sample is composed of 58 LICs and covers 1980-2010.


![Economic and Monetary Union Macroeconomic Policies [Chapter 8] (1) (1)](https://img.pdfslide.net/doc/110x75/577c7d3c1a28abe0549deff2/economic-and-monetary-union-macroeconomic-policies-chapter-8-1-1.jpg)