Embed Size (px)
Citation preview

2009 WORKSHOP AND POLICY DIALOGUE ON TECHNICAL BARRIERS TO TRADE:
PROMOTING GOOD PRACTICES IN SUPPORT OF OPEN MARKETS
OECD Headquarters
PARIS, 5-6 OCTOBER 2009
INTERNATIONAL STANDARDS AND TRADE: A REVIEW OF THE EMPIRICAL LITERATURE
by
G.M. Peter Swann Innovative Economics Limited
Nottingham, UK

2
TABLE OF CONTENTS
EXECUTIVE SUMMARY ............................................................................................................................. 4
1. Introduction ....................................................................................................................................... 6 2. Econometric Studies ......................................................................................................................... 7
2.1 Studies based on Perinorm ............................................................................................................... 10 2.2 Studies based on ISO 9000 Diffusion .............................................................................................. 19 2.3 Regional Agreements: MRAs and Harmonization ........................................................................... 21 2.4 Studies based on Measures Notified to WTO Under TBT and SPS Agreements ............................ 25 2.5 Other Measures of Standards ........................................................................................................... 27
3. Surveys ............................................................................................................................................ 30 4. Productivity, Growth and Welfare .................................................................................................. 35 5. Inside the „Black Box‟ .................................................................................................................... 38
a) Standards and Variety ........................................................................................................................ 40 b) Standards, the Division of Labour and Outsourcing .......................................................................... 40 c) Standards, Codified Knowledge and Institutions ............................................................................... 40 d) Institutions and Trade ........................................................................................................................ 41 e) Standards, Network Effects and Innovation ....................................................................................... 41 f) Measurement and Innovation ............................................................................................................. 41 g) Standards, Quality and Compliance Costs .......................................................................................... 42 h) Trust and Trade .................................................................................................................................. 42
6. Conclusions ..................................................................................................................................... 42 International Standards and Exports ....................................................................................................... 43 National Standards and Exports ............................................................................................................. 44 International Standards and Imports ....................................................................................................... 44 National Standards and Imports ............................................................................................................. 45 Other Evidence in our Survey ................................................................................................................ 45 Final Remarks ........................................................................................................................................ 46
REFERENCES .............................................................................................................................................. 47
Tables
Table 1. Effects of Standards and Regulations on Exports .......................................................................... 8 Table 2. Effects of Standards and Regulations on Imports .......................................................................... 9 Table 3. Summary of Studies in Section 2.1 .............................................................................................. 18 Table 4. Summary of Studies in Section 2.2 .............................................................................................. 21 Table 5. Summary of Studies in Section 2.3 .............................................................................................. 25 Table 6. Summary of Studies in Section 2.4 .............................................................................................. 27 Table 7. Summary of Studies in Section 2.5 .............................................................................................. 30 Table 8. Summary of Studies in Section 3 ................................................................................................. 34 Table 9. Effects of Standards and Regulations* on Exports ...................................................................... 43 Table 10. Effects of Standards and Regulations* on Imports .................................................................... 44
3
Figures
Figure 1. Trade between One Country and Rest of World ........................................................................ 11 Figure 2. Bilateral Trade between a Pair of Countries ............................................................................... 14 Figure 3. Regional Agreements and Trade ................................................................................................ 22 Figure 4. Inside the Standards–Trade „Black Box‟ .................................................................................... 39

4
INTERNATIONAL STANDARDS AND TRADE
A REVIEW OF THE EMPIRICAL LITERATURE
EXECUTIVE SUMMARY
While there is a substantial body of literature on the economic theory of international standards, and
their presumed effects, much less is known about how international standards work in practice. This paper
surveys empirical studies investigating the relationship between international standards and trade. The
main focus is on econometric studies using secondary data on international standards and trade, but
surveys and some of the literature investigating the relationship between standards and other economic
measures, such as productivity, growth and welfare are also summarised.
The paper uses a broad definition of ‚standard‟ and ‚international‟ standard. This reflects the range of
definitions used in the empirical literature. Different studies interpret these terms in a variety of ways. For
example, some studies equate international standards with standards published by ISO, IEC, ITU or
similar, whereas other studies treat a standard as international if it is common to a group of countries or a
region.
Some of the econometric studies reviewed are based on measures of standards computed from
Perinorm. Most are models of bilateral trade, but some relate to a country‟s total exports or imports.
Amongst the studies looking at all sectors, especially manufacturing, standards tend to be trade creating.
Also, some studies find that the effect of national standards on trade exceeds the effects of international
standards. But in the studies of agricultural products, and textiles and clothing, standards (especially
national standards) in a country can constrain imports into that country. Overall, the majority of studies
find the effect of standards to be trade-creating rather than trade-reducing.
Another subset of studies uses data on the diffusion of ISO 9000 in different countries. They show
that use of ISO by an exporter can increase its exports, but the effects on imports are less clear-cut. Other
econometric studies use information on mutual recognition agreements (MRAs) and/or harmonisation
measures instead of the Perinorm database or data on ISO 9000 diffusion. The overall impression of these
studies is that harmonisation and MRAs are mostly favourable to trade. Various other approaches to
measuring voluntary (and mandatory) standards for use in econometric models of trade exist. In terms of
trade effects the results of these studies are often negative.
A heterogeneous group of studies has attempted to measure directly the relationship between
standards and trade by surveying exporting firms. While it is not easy to compare the findings of the
different surveys, they contribute an interesting miscellany of insights into how standards impact on trade.
The last set of studies summarised are studies that have looked at the impact of a country‟s stock of
standards (whether national or international) on productivity and economic growth, or wages, employment
and foreign direct investment. These tend to find a positive effect.

5
How do international standards impact on trade? Do they help or hinder trade? A key finding of the
survey of empirical data is that there is no single answer to this question. If the results of the various
studies are taken at face value, the question of why the results differ from case to case, needs to be
explored.
Part of the reason is that the different studies have referred to different countries, different industries
and different measures of standards. But more generally, the relationship between standards and trade is
not a simple one and the econometric models surveyed represent, at best, „black boxes‟ that disguise a
complex of relationships.
The paper sketches some of the available evidence on some of the links within these black boxes. For
example, standards sometimes seek to reduce variety in order to exploit economies of scale, and this
reduction of variety may in some circumstances lead to a reduction in trade. On the other hand, the
reduction in variety may also lead to a reduction in transaction costs. Standards can also serve as an
important quality signal in trade and thus help promote the competitiveness of those that meet stringent
standards. On the other hand, stringent standards can raise barriers to entry by increasing compliance costs.
Also, standards are a mark of trust, and trust helps to reduce transaction costs and therefore supports trade.
There are many possibilities how a standard impacts on an economy. Some effects are positive but others
are negative, which may explain the diversity of the results of the empirical literature reviewed here.
If the effect of standards on trade is context specific, as it seems to be, then it seems essential to open
up the „black box‟ connecting standards to trade performance if we are to understand the complexities of
this relationship.
Some conclusions can nevertheless be drawn from the econometric studies that have sought to
estimate the relationship between international standards and trade:
In most studies, when exporting countries use international standards, this has in most cases a
positive (or at least neutral) effect on their export performance.
When exporting countries use national standards (i.e. standards specific to country x), that may
lead to superior export performance by x.
When the importing countries also adopt international standards, the most common effect is also
to increase imports. The exceptions can in part be explained.
When the importing country uses national standards, the results are more diffuse. For studies that
relate exclusively to voluntary standards, the effects are distributed quite evenly. For studies that
relate to regulations (i.e. mandatory standards), the effects on imports tend to be negative.

6
1. Introduction1
1. While there is quite a large literature on the economic theory of international standards, and their
presumed effects, we know a good deal less about how international standards work in practice. The
objective of this study, therefore, is to learn as much as possible from empirical data about the ways in
which international standards relate to trade and welfare. To put it another way, the objective is to
concentrate on studies that make the minimum of theoretical assumptions, to avoid an outcome where
supposedly empirical results mainly reflect theoretical assumptions.
2. For that reason, we have chosen to omit from the survey any of the work which applies
computable general equilibrium (CGE) models or partial equilibrium models to predict the effects of
harmonizing standards. While this work is clearly very valuable, it does not pass the test described in the
last paragraph. For a similar reason, we have left out of our review a number of econometric studies
which, while interesting in themselves, don‟t pass that same test.
3. The specification for the work given by the OECD Secretariat asked for omission of several other
areas of standards-related work. First, we were asked to omit any work related to SPS standards. There is
in fact quite a large empirical literature about this, and the results in that literature are undoubtedly
important.2 However, that literature contains a fairly firm consensus view about the role of SPS standards,
which is probably specific to SPS standards and will not apply to all standards. Second, we were
instructed to exclude any work on services, though in fact, there is very little literature on these.
4. How exactly do we define an „international standard‟ for the purposes of this study? In fact, this
is really two questions: How do we define „international‟, and how do we define „standard‟? The short
answer to both parts of the question is that we adopt a broad-minded definition. Given the limited
empirical literature available, and given that different studies interpret „international‟ and „standard‟ in a
wide variety of ways, there is really no alternative but to be broad-minded.
5. How should we define „international‟? Some might argue that a standard is only „international‟ if
it conforms to a standard published by the International Organisation for Standardization (ISO), the
International Electrotechnical Commission (IEC), the International Telecommunication Union (ITU) or
similar. However, only a sub-set of the available literature uses this „purist‟s‟ definition. Other parts of the
literature take a broader view: a standard is treated as „international‟ if it is common to a group of countries
or region (for example the EU) – regardless of whether it is „international‟ by the purist‟s definition. And
some studies of bilateral trade between countries A and B (say) take a very broad view: a standard is
„international‟ if it is harmonized in countries A and B – again, regardless of whether it is „international‟ by
the purist‟s definition. The reader may be unsettled by this lack of standardization in definitions, but given
the small size of the empirical literature at this time, there are pragmatic reasons why we cannot restrict our
attention just to the purist‟s definition, but need to accept studies that take a broader view. However, we
shall in all cases flag up exactly what definition of „international‟ is used in each study.
6. And how should we define a „standard‟? Trade officials and regulators are accustomed to making
a strict separation between standards and regulations. While compliance with standards is voluntary,
compliance with technical regulations is mandatory by law. However, much of the existing literature has
tended to discuss both of these together. This may reflect a rather casual attitude to an important
distinction, but more likely it reflects the fact that these authors believe the economic effects of standards
1 This paper has been prepared under contract with the OECD. I am grateful to Barbara Fliess and her
colleagues for very helpful comments on preliminary drafts of this paper.
2. The following reviews are broader in scope and cover some of the topics excluded from the present review:
Ferrantino (2006), Korinek et al (2008), Maskus et al (2001), NIST (2004), WTO (2005).

7
and regulations are not as different as trade officials and regulators think they are. The evidence surveyed
here supports that view. Indeed, there is a view that many so-called „voluntary‟ standards are not really
voluntary: even if they are not legal requirements they are commercial imperatives. In this survey we shall
discuss the evidence relating to standards and trade and also the evidence relating to regulations and trade,
though we separate these studies into different sections. We take this approach for three pragmatic
reasons. The first, as mentioned already, is that the empirical literature is limited and we can‟t really be
choosy. Second, there are similarities in the economic effects that warrant investigation. And third, this is
the approach taken in much of the research literature.
7. In what follows, we have organised our discussion of the literature into four main sections.
Section 2, which accounts for the greater part of the report, considers econometric studies based on the use
of secondary data on international standards and trade. Section 3 considers descriptive studies based on
surveys which attempt to measure directly the relationships between international standards and trade.
Section 4 addresses the rather smaller literature on the relationship between standards and various other
macroeconomic measures (e.g. productivity, growth and welfare). Section 5 notes that much of what has
come before could be described as a „black box‟ model of the relationship between standards, trade and
welfare, and that to progress in our understanding we need to open up that „black box‟. When we do this,
we see that the linkages from standards to trade and welfare are many and complex. This section contains
a few examples of empirical work on these many linkages. Section 6 concludes.
8. Some of the literature has argued for the supremacy of one specific research approach over
others. In this survey, we do not offer a critique of the different methods. Our view is that all these
different approaches play an important part in building up the full picture, and it would be unfortunate to
omit any of them.
2. Econometric Studies
9. This section describes econometric studies that use secondary data on international standards and
trade. The first paper to be reviewed in this section was published in 1996. Until about five years ago, the
econometric literature on standards and trade was very limited, but it has grown rapidly in the last few
years – and especially in the last 3-4 years.
10. One of the greatest challenges in a review of this sort is to assess the comparability of results
from different studies. To help in this, we have grouped the econometric work under five headings
according to the way in which international standards are measured in that study: (2.1) the Perinorm
database; (2.2) diffusion of ISO 9000; (2.3) regional agreements, mutual recognition agreements (MRAs)
and harmonization; (2.4) measures notified to the WTO under the TBT and SPS Agreements; (2.5) a
miscellany of other approaches. In the first two of these, studies relate to standards and not to regulations.
In the third, studies relate either to regulations alone, or to standards and regulations. In the fourth, the
approach taken measures regulations and not standards. In the fifth, we find a mixture: some studies relate
only to regulations, while others relate to standards and regulations.
11. Many of the studies that follow are sufficiently similar in design that we can plot their results in
Tables 1 and 2 below. This will help to compare the results of different studies. Each econometric study
attempts to estimate coefficients which describe the effects of standards and/or regulation on trade. In
almost all the econometric studies listed, the objective was to estimate the effects of standards in X on
exports from X, and/or the effects of standards in X on imports into X. Tables 1 and 2 summarise the
estimated coefficients describing the effects of standards in X on exports from X (Table 1) and imports into
X (Table 2). Tables 1 and 2 both have two parts to them: the top half (Part i) shows the effects of
international standards and the lower half (Part ii) shows effects of national standards.

8
12. Each part has 5 cells corresponding to five possible values of the relevant coefficients:
negative and significant (−2 ≥ t)
negative (−1 ≥ t-statistic > −2)
negligible (1 > t-statistic > −1)
positive (2 > t ≥ 1)
positive and significant (t ≥ 2)
where t is the conventional t-statistic for each coefficient, describing the degree of statistical
significance. Each study is given an acronym (M2, BJ3, etc.) and is located in the relevant cell(s) in
Tables 1 or 2. The studies to which these acronyms relate are listed in the key on Page 5. As an
illustration, let us translate two examples from Table 1. Consider the mark M2 in the left hand cell in
Table 1, Part i. The acronym M2 refers to a study by Moenius (2006a) which found a negative and
significant effect of international standards in country X on exports from country X. Now, consider the
mark BL3 in the right-hand cell in Table 1, Part ii. The acronym BL3 refers to the study by Blind (2001)
which found that national standards in country X had a positive and significant effect on exports from X.
Table 1. Effects of Standards and Regulations* on Exports
(i) Effects of International Standards* in Country X on Exports from X
(a) Negative and
Significant (b) Negative (c) Negligible (d) Positive
(e) Positive and
Significant
M2 BJ3 CG2, CG3 BJ1, ST1
BL1, CG1, G1,
G2, KR, M1, M3
BA1
HV, VW
(ii) Effects of National Standards* in Country X on Exports from X
(a) Negative and
Significant (b) Negative (c) Negligible (d) Positive
(e) Positive and
Significant
VB, WS BJ1 BJ3 BL1, M1, M2, M3,
ST1

9
Table 2. Effects of Standards and Regulations* on Imports
(i) Effects of International Standards* in Country X on Imports into X
(a) Negative and
Significant (b) Negative (c) Negligible (d) Positive
(e) Positive and
Significant
G1, M2
CM3, MH2
CG1, CG2, CZ,
ST2, TU
BA3
CG3
BL2, BJ2, BJ4,
G2, M1, M3
BA1, BA2, CM1,
CM2, MH1
HV, VW
(ii) Effects of National Standards* in Country X on Imports into X
(a) Negative and
significant (b) Negative (c) Negligible (d) Positive
(e) Positive and
Significant
CZ, M2
CW1, CW2, SA
VB, D2, F2
BJ2, TU BJ4
D1, F1
BL2
F3 M1, M3, ST2
* Studies marked in light grey refer to standards Studies marked in dark grey refer to standards and regulations Studies not marked refer to regulations
Key to Tables 1 and 2
BA1 Baller (2007, p. 38, Appendix VI.2) Effect of MRAs on Trade
BA2 Baller (2007, p. 38, Appendix VI.2) Effect of Harmonization on OECD→Region Trade
BA3 Baller (2007, p. 38, Appendix VI.2) Effect of Harmonization on non-OECD→Region Trade
BJ1 Blind & Jungmittag (2001) – cited in Blind (2004, p. 255, Table 17.9, Column 3)
BJ2 Blind & Jungmittag (2001) – cited in Blind (2004, p. 256, Table 17.10, Column 3)
BJ3 Blind & Jungmittag (2002) – cited in Blind (2004, p. 266, Table 17.13, Column 4)
BJ4 Blind & Jungmittag (2002) – cited in Blind (2004, p. 267, Table 17.14, Column 2)
BL1 Blind (2001) cited in Blind (2004, p. 281, Table 17.20, Column 4)
BL2 Blind (2001) cited in Blind (2004, p. 282, Table 17.21, Column 3)
CG1 Clougherty & Grajek (2008, Table 3, Column 1): LDC→DC Trade
CG2 Clougherty & Grajek (2008, Table 3, Column 2): DC→LDC Trade
CG3 Clougherty & Grajek (2008, Table 3, Column 3): DC→DC Trade
CM1 Chen & Mattoo (2004, p. 22, Table 3) Effect of MRAs on Trade
CM2 Chen & Mattoo (2004, p. 22, Table 3) Effect of Harmonization on OECD→Region Trade
CM3 Chen & Mattoo (2004, p. 22, Table 3) Effect of Harmonization on non-OECD→Region Trade
CW1 Chen et al (2006, p. 15, Table 2) Testing procedures, Information difficulty, Inspection times
CW2 Chen et al (2006, p. 20, Table 4) Standards
CZ Czubala et al (2007, p. 32, Table 13). In this case, „international‟ means standards harmonized to ISO, while
„national‟ means EU standards not harmonized to ISO.
D1 Disdier et al (2007, p.27, Table 6, Columns 5, 6 & 7) OECD↔OECD Trade
D2 Disdier et al (2007, p.27, Table 6, Columns 5, 6 & 7) Other Trade
F1 Fontagné et al (2005, pp. 27-28, Appendix 3) Agriculture exports from OECD
F2 Fontagné et al (2005, pp. 27-28, Appendix 3) Agriculture exports from LDCs & DCs
10
F3 Fontagné et al (2005, pp. 27-28, Appendix 3) Manufacturing exports
G1 Grajek (2004, p. 23, Table 3, Column 3) – estimate for all countries
G2 Grajek (2004, p. 25, Table 5, Column 19) – estimate for OECD countries only
HV Henry de Frahan & Vancauteren (2006, p. 351, Table 3)
KR Kim & Reinert (2009, p. 18, Table 3, Column 5 & p. 19, Table 4, Column 5)
MH1 Michalek et al (2005, p. 101, Table V-1) Harmonisation & New Approach
MH2 Michalek et al (2005, p. 101, Table V-1) MRA
M1 Moenius (2004, p. 31, Table 5)
M2 Moenius (2006a, p. 19, Table 3)
M3 Moenius (2006b, p. 62, Table 2)
SA Sánchez et al (2008, p. 26, Table 7)
ST1 Swann et al (1996, p. 1305, Table 3, Column 9)
ST2 Swann et al (1996, p. 1305, Table 3, Column 5)
TU Temple & Urga (1997, p. 220, Table 2, Column i)
VB van Beers & van den Bergh (1997, p. 40, Table 3)
VW Vancauteren & Weiserbs (2005, p. 18, Equation 13)
WS Wilson et al (2002, Table 5)
2.1 Studies based on Perinorm
13. Perinorm is a database of the standards published by the principal national and international
standards authorities. When, in 1993-4, Perinorm was used as a research tool for the first study listed
below, it covered only AFNOR, BSI and DIN standards. Today it covers the national standards bodies of
23 countries,3 as well as the leading international authorities (ISO, IEC, ITU) and European authorities
(CEN, CENELEC, ETSI).
14. Perinorm has sometimes been described as offering an inventory of standards. It tells us how
many standards are available in each country for each sector, but does not measures the extent to which
they are used. The studies that have constructed standards measures using Perinorm tend to have done so
by counting the number of standards relevant to each industrial sub-sector or each category of traded goods
and services. These count measures suffer from what is often called the „mixed bag‟ problem. It may be
that a collection of 100 standards includes a few of essential importance, and some of moderate
importance, but the majority are not very important. Moreover, the standards differ not just in importance,
but also in type: compatibility standards, quality standards, measurement standards, variety reduction
standards, and so on. The collection is therefore a veritable „mixed bag‟. In econometric terms, this means
that the count variable is not a very accurate measure of the underlying concept of standards-richness that
we want to measure. This is hardly a new problem, however, because exactly the same problem arises
with other count variables: patent counts, innovation counts, and so on.
15. For a particular country X, Perinorm can be used to construct three types of measure:
1. The number of national standards that are unique to country X
2. The number of national standards in X that are identical to or equivalent to an International
standard (from ISO, IEC, ITU)
3. For 22 countries, Perinorm covers one national standards body per country. For the 23rd
, the USA, Perinorm
covers: ANSI, API, ASME, ASTM, EIA, IEEE, NEMA, SAE and UL.
11
3. The number of national standards in X that are identical to or equivalent to those in a trading
partner (Y).
Swann, Temple & Shurmer (1996) – ST1 and ST2
16. While it may seem immodest to start a literature review with one of our own papers, we do so
because, so far as we are aware, this was the first econometric attempt to quantify the relationship between
standards and trade performance. Swann et al (1996) tried to assess the relationship between standards and
trade performance by adding standards variables into simple econometric models of UK exports and UK
imports. Note that these are models of total UK trade with the rest of the world and not bilateral trade
between pairs of trading partners.
Figure 1. Trade between One Country and Rest of World
17. The study had two additional objectives: first, to assess the relative importance of international
and national standards; and second, to compare four theoretical perspectives on the effects of standards and
see which if any of these received support. These perspectives were: (a) standards as a source of
competitive advantage; (b) standards as an unwelcome constraint (hence a source of competitive
disadvantage); (c) standards as a support for trade; and (d) standards as a constraint on trade.
18. Swann et al distinguished between national and international standards as follows. We used the
Perinorm „International Reference‟ field to check if each BSI standard was classed as either „identical to‟
or „equivalent to‟ a European or an International standard. If so, then the standard was considered to be an
international standard; if not, then it was counted as a national standard. For each industrial sector, we
identified all BSI standards that were relevant to that standard and produced a count of the number of
relevant standards – national and international.
19. As two of the hypotheses under consideration need to assess the relative number of standards in
the UK (compared to its trading partners), it was necessary to have an international comparator. The ideal
measure would have been a weighted measure of the standards of several different countries (weighted by
the volume of trade with the UK‟s different trading partners). But the construction of such a measure was
impossible, not least because at the time the research was done (1993-94), Perinorm only covered the
standards of three countries (UK, Germany, France). Instead, we used the standards counts for DIN
standards as a measure of international best practice – the justification being that the DIN catalogue could
be considered the „state of the art‟ in national standards at that time.
20. Swann et al (1996, Table 3, Columns 5 and 9) found that UK national standards had a positive
and significant effect on UK exports and UK imports,4 while UK international standards had a positive and
4. While the general principle in the paper is not to provide a detailed critique of each research approach, it is
useful here to clarify one possible misunderstanding. In reviewing the Swann et al (1996) study, Maskus et al
(2001) argued that the coefficients quoted in the Swann et al study were implausibly elastic, and suggested that
Swann et al may have misinterpreted the units in which the data were measured. In fact, I believe that there is
no error by Swann et al. The parameters (48% and 34%) estimated in the export and import equations refer to
the effects of 100 more national standards in a particular 3-digit sector on the exports and imports of that 3-
UK RoWUK RoW

12
weakly significant effect on UK exports and a negligible effect on UK imports. In Table 1 (exports), this
study is marked ST1 and located in Part i (Column d) and Part ii (Column e). In Table 2 (imports) this
study is marked ST2 and located in Part i (Column c) and Part ii (Column e).
21. On the face of it, these results are most compatible with hypothesis (c) above: standards promote
intra-industry trade. But from that point of view, it is perhaps surprising that the coefficients for the
national standards are both larger and of greater statistical significance than the coefficients for
international standards. In what follows, however, we shall find other similar examples.
Temple and Urga (1997) – TU
22. This study has some similarity to the Swann et al (1996) import model. It takes an import
equation and adds the same four standard count variables as above – computed in the same way as in
Swann et al. However, there are two important differences between the income and relative price variables
used by Temple and Urga and by Swann et al, and these two new variables are highly statistically
significant. Moreover, Temple and Urga include two additional variables that measure capacity
constraints and labour shortages and in their various formulations, at least one of those parameters emerges
as highly significant.
23. Temple and Urga find rather different parameter estimates from Swann et al. Their estimated
coefficients for UK national and international standards are numerically small and statistically
insignificant. In Table 2, this study is marked TU in Part i (Column c) and Part ii (Column b).
24. How important are the differences between Swann et al, on the one hand, and Temple and Urga
on the other? They could imply that the Swann et al (1996) results are not very robust. Or it could be that
the four other econometric differences listed above constitute enough of a change to the model that the
reduced coefficients on standards variables can be understood. To assess these possibilities, it is useful to
compare these with a series of related studies by Blind and colleagues, and by Moenius, which also use
Perinorm.
Blind and co-Authors (several studies, 2000-2002)
25. Blind (together with colleagues) has carried out a substantial number of empirical studies on the
economic effects of standards. Several of these studies provided the evidence base for the influential
report by DIN (2000) on the Economic Benefits of Standardization. All of these studies are conveniently
gathered together in Blind‟s book (2004). In all cases, Blind computes the standard count variables
(national standards and international standards) in the same way as Swann et al (1996).
Blind (2000)
26. Blind (2000) offered two improvements on Swann et al. First, he analysed bilateral trade flows
between pairs of countries. Second, his analysis looked at trade involving a total of 8 exporting countries
(German, Austria, Switzerland, UK, France, Netherlands, USA, Japan) and 3 importing countries
digit sector – and not exports and imports of the economy as a whole. At the end of our sample period (1991),
the total count of British national standards summed across our 83 sectors was 5,736. A crude average per
sector would be 69 national standards. A 100 unit increase in British national standards in a 3-digit sector is
therefore (on average) a 145% increase in national standards in that sector. If that 145% increases imports in
that sector by 34% and exports by 48%, those increases represent elasticities of about 0.23 and 0.33
respectively. These are perhaps higher than some might expect, but are in fact remarkably close to those in
Moenius (2006b).

13
(Germany, Austria and Switzerland). He was also able to offer a disaggregated analysis at sectoral level
(for 33 sectors).
27. Blind used two different specifications. The first was a model of the balance of trade between
two countries (A, B) as a function of the differences in their standards stocks. The second was a model of
the combined volume of trade between A and B (exports from A to B plus imports to A from B) as a
function of the combined numbers of standards of in countries A and B. These cross section models
obviously exclude a number of other important factors, but are nonetheless quite interesting.
28. The significance levels of results are not strong, given the low number of observations, but the
patterns are interesting. Whichever model we take, all estimates suggest either a positive relationship
between standards and trade or a statistically insignificant relationship, close to zero.5 As these models are
balance of trade and combined volume of trade, however, we cannot plot them in Tables 1 or 2.
29. One interesting observation is that when trade involves the UK, national standards stocks seem
more important than in those cases involving other countries. This observation could suggest that the
result in Swann et al (1996) is, as conjectured above, specific to the UK. However, before jumping to that
conclusion we wait to look at the results from the other studies in this section.
Blind and Jungmittag (2001)6 – BJ1 and BJ2
30. Blind and Jungmittag (2001) go beyond the Blind (2000) study by estimating panel models of
trade. There are two models in their paper. One is an overall model of how German trade with the rest of
the world is related to the German standards stock. The second, and more interesting in the present
context, is a model of bilateral trade between Germany and the UK. The results for this are somewhat
different from those in Swann et al. They are marked as BJ1 and BJ2 in Tables 1-2. German adoption of
international standards has (at least) a weakly positive effect on exports and imports while German
adoption of national standards has a weakly negative effect on both. This would be in line with the
commonly held view that international standards are supportive of trade while national standards create
barriers to trade.
Blind and Jungmittag (2002) – BJ3 and BJ4
31. This is equivalent to Blind and Jungmittag (2001), but this time relating to trade between
Germany and France. This paper just contains a single model of bilateral trade between Germany and
France. The results are somewhat different both from those in Swann et al (1996) and those in Blind and
Jungmittag (2001). They are marked as BJ3 and BJ4 in Tables 1-2. The results suggest that German
standards, whether national or international, do not play a role in promoting exports to France, but German
adoption of international standards is associated with a higher level of imports from France.
Blind (2001) – BL1 and BL2
32. This final study by Blind examines Switzerland‟s trade with Germany, France and UK in one
specific sector: instruments for measurement and testing. The results are marked as BL1 and BL2 in
Tables 1-2. Switzerland‟s stocks of standards (whether national or international) are positively associated
5. Blind also provides estimates for different sectors instead of different country pairings. As with the country
pairings, the relationships between trade balance and differences in standards counts are positive or
statistically insignificant for most sectors. There are a few exceptions, but no particularly interesting
conclusions can be drawn from these sectoral differences.
6. A revised version of this was later published as Blind and Jungmittag (2005).
14
with imports into Switzerland from these three countries, and exports from Switzerland to these three
countries. The effects are somewhat weaker for national standards than for international standards. In this
regard, the results in Blind (2001) are the closest to those in Swann et al above and the results by Moenius
to follow.
Moenius (1999/2004) 7 – M1
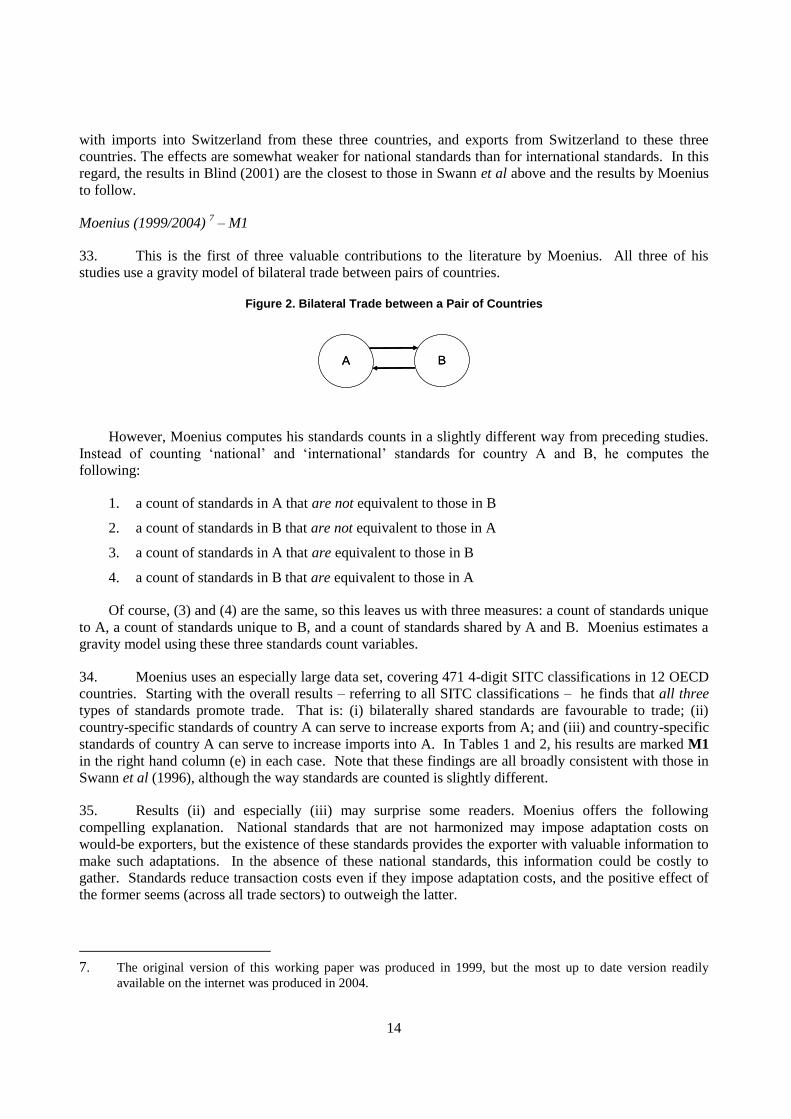
33. This is the first of three valuable contributions to the literature by Moenius. All three of his
studies use a gravity model of bilateral trade between pairs of countries.
Figure 2. Bilateral Trade between a Pair of Countries
However, Moenius computes his standards counts in a slightly different way from preceding studies.
Instead of counting „national‟ and „international‟ standards for country A and B, he computes the
following:
1. a count of standards in A that are not equivalent to those in B
2. a count of standards in B that are not equivalent to those in A
3. a count of standards in A that are equivalent to those in B
4. a count of standards in B that are equivalent to those in A
Of course, (3) and (4) are the same, so this leaves us with three measures: a count of standards unique
to A, a count of standards unique to B, and a count of standards shared by A and B. Moenius estimates a
gravity model using these three standards count variables.
34. Moenius uses an especially large data set, covering 471 4-digit SITC classifications in 12 OECD
countries. Starting with the overall results – referring to all SITC classifications – he finds that all three
types of standards promote trade. That is: (i) bilaterally shared standards are favourable to trade; (ii)
country-specific standards of country A can serve to increase exports from A; and (iii) and country-specific
standards of country A can serve to increase imports into A. In Tables 1 and 2, his results are marked M1
in the right hand column (e) in each case. Note that these findings are all broadly consistent with those in
Swann et al (1996), although the way standards are counted is slightly different.
35. Results (ii) and especially (iii) may surprise some readers. Moenius offers the following
compelling explanation. National standards that are not harmonized may impose adaptation costs on
would-be exporters, but the existence of these standards provides the exporter with valuable information to
make such adaptations. In the absence of these national standards, this information could be costly to
gather. Standards reduce transaction costs even if they impose adaptation costs, and the positive effect of
the former seems (across all trade sectors) to outweigh the latter.
7. The original version of this working paper was produced in 1999, but the most up to date version readily
available on the internet was produced in 2004.
A BA B

15
36. Moenius also disaggregates his results into 10 sectors. Here there is an important difference
across the sectors. In 4 sectors (food, beverages, crude materials and mineral fuels) country-specific
importer standards act as a barrier to trade and reduce imports into that country. But in the other sectors
(including oils, chemicals, manufacturing, machinery – the more advanced industries, technologically
speaking) country-specific importer standards seem to support imports into that country. Moenius (2004,
p. 26) explains further. “Under the assumption that transaction costs are greater in industries that are more
technologically sophisticated, country-specific standards are more important for manufacturing industries.”
In the relatively low-technology industries, the adaptation costs imposed by standards may exceed the
beneficial effect from reduced transaction costs, so the net effect of country-specific importer standards is
to reduce imports. But in the relatively high-technology industries, the adaptation costs imposed by
standards are less than the beneficial effect from reduced transaction costs, so the net effect of country-
specific importer standards is to increase imports.
Moenius (2006a) – M2
37. The second study by Moenius applies a similar methodology but this time just to trade in
agricultural products. Here he seeks to assess three common hypotheses:
1. country-specific agricultural standards discourage trade
2. harmonization of standards promotes trade in agricultural goods
3. within a trade block, harmonized and country-specific standards have different implications for
insiders and outsiders
38. Moenius (2006a) uses a similar dataset to Moenius (1999/2004), but this time relating to 5 EU
countries (Belgium, France, Germany, Netherlands and UK) and 9 other OECD countries, and restricted to
agricultural trade. Taking all agricultural products together, the overall effect of country-specific importer
standards and shared importer standards is to reduce imports. Equally, the effect of standards in country X
(shared with country Y) on exports from X to Y is negative. But the overall effect of country-specific
standards (in X) on exports to Y is positive. In Tables 1 and 2, his results are marked M2. Moenius also
shows that the estimated coefficients for different agricultural products vary substantially across different
sectors – so much so that hypotheses 1 and 2 cannot be said to hold for all types of agricultural products.
39. Moenius also disaggregates his results according to whether the exporting countries are in the EU
or not. (In his sample, the importing countries are always in the EU.) He finds that importer standards
(EU standards) have a modest positive effect on imports from other EU countries but have a clear negative
effect on imports from most non-EU countries.8 On the other hand, he finds that for the period 1980-1990,
shared importer standards tend to increase imports from non-EU countries. That effect gets weaker over
time, however, and during the period 1991-1995, it is negative (though insignificant) – suggesting that the
protective effects of EU standards are growing over time.
40. Moenius summarises the implications as follows. Country-specific agricultural standards don‟t
always block trade, nor does harmonization always increase trade. Hypotheses 1 and 2 above are too
simplistic. There are two effects at work here. First, as discussed before, the net effect of country-specific
standards depends on the balance between the beneficial information effect and the detrimental adaptation
cost. Second, while harmonization may reduce trade costs, there is a consequent reduction in variety and
that may reduce trade. Finally, Moenius concludes that standards within a particular standardization
regime will affect insiders and outsiders in different ways.
8. For simplicity, we omit the results where the US is the exporter.

16
Moenius (2006b) – M3
41. The third study by Moenius again uses a similar methodology to the first two, but this time
focuses only on electrical products. The first part looks at the effects of a subset of standards (the basic
electricity specifications such as voltage, hertz and different plug types) on trade amongst a sample of 159
countries. The second part looks at the effects of all standards relevant for those goods for a subset of 14
OECD countries.
42. Moenius finds three main results. First, national and international standards both increase trade
flows in electrical products, and indeed (by comparing the results with those from his earlier studies) he
concludes that this effect is more important for electrical products than the average manufactured product.
Second, national (or country-specific) standards seem to have more pronounced effects on trade than
international (or shared) standards. Thirdly, the size of these coefficients depends on the sizes of the
importing and exporting countries. In particular, smaller countries benefit more (than large countries) from
international harmonization. These results are marked M3 in Tables 1 and 2.
43. The first and third conclusions are consistent with much of what we have found before. But the
second conclusion may need further discussion. Referring back to the discussion above (in the context of
the first study by Moenius) it would seem that the product adaptation costs faced by a would-be exporter
are on average lower when facing a harmonized standard than when facing a country-specific standard. If
so, how can the trade creating effects of the latter exceed the trade-creating effects of the former? One
answer would be that the offsetting information effects are greater for country-specific standards than for
international standards. This is by no means implausible: country-specific standards can (and do) give
information on specific market conditions in that country, while, almost by definition, international
standards cannot do that.
Czubala, Shepherd, and Wilson (2007) – CZ
44. Most of the studies that use the Perinorm database are studies of trade between rich countries.
For that reason Czubala et al (2007) is a particularly welcome study as it uses this approach to examine
exports of textiles and clothing from 47 Sub-Saharan countries in Africa to the EU-15.9 Their approach is
broadly similar to that of Moenius except that there is a difference in the way they compute the standards
variables. For each product type, they compute the number of EU standards recognised by Perinorm and
split these into two groups: those that are harmonized to an ISO standard, and those that are not. These
two groups are used to create two variables: a count of international standards and a count of European
standards. These two variables are included in a gravity model of EU-15 imports from the 47 African
countries.
45. The authors find that EU standards which are not harmonized to ISO standards reduce African
exports of clothing and textiles (the coefficient is negative and significant), but EU standards which are
harmonized to ISO standards are much less restricting (the coefficients is close to zero with a t-statistic of
less than one). They note, however, that while the share of EU standards that are harmonized to ISO grew
until 1999, it started to decline from 2000 onwards. This study is marked CZ in Table 2, but cannot be
entered in Table 1, as there are no data on exporter standards.
9. Austria, Belgium, Denmark, Finland, France, Germany, Greece, Ireland, Italy, Luxembourg, Netherlands,
Portugal, Spain, Sweden, United Kingdom.

17
Shepherd (2007)
46. Shepherd‟s (2007) study also uses Perinorm in a similar way to Czubala et al (2007) but
estimates a somewhat different trade model. Whereas all the models so far have looked at aggregate trade
or bilateral trade, this model looks at the relationship between trade variety and standards, with specific
reference to textiles, clothing and footwear. (For that reason, it is hard to locate this study in Table 2.)
47. Shepherd‟s model examines the variety of imports to the EU-15 from approximately 200
countries. The model uses two standards variables which are slightly different from those in Czubala et al:
the first is the (natural log) of the total number of EU standards relevant to a particular product; the second
measures the proportion of that total which is harmonized with an ISO standard.
48. Shepherd makes two main findings. First, a 10 percentage point increase in the proportion of EU
standards which are harmonized to ISO standards is associated with a 0.2 percent increase in the variety of
imports from each trade partner. This is perhaps a relatively small effect, but statistically significant, and it
is found to be somewhat higher for imports from low income countries. Second, a 10 percent increase in
the total number of EU standards is associated with about a 6 percent decrease in product variety. As
Shepherd argues, the results are consistent with the view that diverse product standards impose fixed costs
of adaptation, but that harmonization reduces the size of these fixed costs.
Summary
49. Table 3 overleaf summarises the above studies. All are based on measures of standards (not
regulations) computed from Perinorm. Most are models of bilateral trade, but some relate to a country‟s
total exports and/or imports. Amongst the studies looking at all sectors, especially manufacturing,
standards tend to be trade creating. But in the studies of agricultural products, and textiles and clothing,
standards (especially national standards) in a country can constrain imports into that country. Most relate
to OECD countries, but the one study that focuses on exports from Sub-Saharan Africa finds that if EU
countries have standards that are not harmonised to ISO standards, then these can deter imports from Sub-
Saharan Africa.
50. The reader may also wish to look back to Tables 1 and 2. The studies listed above (BL1, BL2,
BJ1, BJ2, BJ3, BJ4, CZ, M1, M2, M3, ST) are all highlighted in light grey. From these it is evident that
the majority of studies listed above are located on the right hand side of each table. This means that
amongst these studies, the effects of standards tend to be trade-creating rather than trade-reducing. The
most notable exception is the effect of national standards in country X on imports into X, which are finely
balanced on both sides of Table 2.

18
Table 3. Summary of Studies in Section 2.1
Author(s) Date Dependent
Variable(s)
Standards or
Regulations? Data Trade Effect Sectors Countries
Swann
et al 1996
Total UK
trade Standards Perinorm
UK standards are trade creating, especially
national standards.
Economy
wide UK
Temple &
Urga 1997
Total UK
imports Standards Perinorm
No significant evidence that standards are trade
creating.
Economy
wide UK
Blind 2000 Bilateral
trade Standards Perinorm Standards are either trade-creating or neutral.
Economy
wide 9 OECD Countries
Blind &
Jungmittag 2001
Bilateral
trade Standards Perinorm
German international standards increase exports
and imports; German national standards reduce
both.
Economy
wide Germany, UK
Blind &
Jungmittag 2002
Bilateral
trade Standards Perinorm
German standards play no role in exports to
France, but German international standards
increase imports from France.
Economy
wide Germany, France
Blind 2001 Bilateral
trade Standards Perinorm Standardization promotes trade.
Measurement
instruments
Switzerland,
Germany, France, UK
Moenius 2004 Bilateral
trade Standards Perinorm
Standards are all (on average) trade creating, but
some important sectoral differences.
Economy
wide 12 OECD Countries
Moenius 2006a Bilateral
trade Standards Perinorm
Country-specific agricultural standards do not
always block trade, and harmonization does not
always increase trade.
Agricultural
products 14 OECD Countries
Moenius 2006b Bilateral
trade Standards Perinorm Standardization promotes trade.
Electrical
products
Part 1: 159 Countries;
Part 2: 14 OECD
Countries
Czubala
et al 2007
EU-15
imports Standards Perinorm
Standards in EU-15 not harmonized to ISO
standards can be a barrier to trade; EU standards
harmonized to ISO standards are not.
Textiles and
clothing
EU-15 and 47 Sub-
Saharan countries in
Africa
Shepherd 2007 Variety of
exports Standards Perinorm
Internationally harmonized standards in the
importing country increase the partner country's
export variety.
Textiles,
clothing and
footwear
approx. 200 countries

19
2.2 Studies based on ISO 9000 Diffusion
51. In this sub-section, we focus on three studies, by Grajek (2004), Clougherty and Grajek (2008)
and Kim and Reinert (2009).
Grajek (2004) – G1 and G2
52. Grajek‟s study is in some respects similar to those by Moenius and others, discussed in the
previous section, but it takes a different approach to measuring the standards variables. Instead of using
standards variables derived from Perinorm, Grajek uses data on the diffusion of ISO 9000 in different
countries as a measure of the standards richness of those countries.
53. Grajek estimates a gravity equation for bilateral trade using data on 101 countries (including all
OECD countries) over the period 1995-2001. In the regressions using data on all countries, he finds that
the diffusion of ISO 9000 in country A promotes exports from A but reduces imports into A. But in the
regressions using data on just the OECD countries, he finds that the diffusion of ISO 9000 in country A
promotes both exports from A and imports into A. Grajek argues that asymmetry between the overall
coefficients and the OCED coefficients can be explained by a substitution effect. He argues that ISO 9000
certified firms are more likely to trade with each other more than with other firms, and for that reason the
positive impact of ISO 9000 on trade is more pronounced among the OECD countries (which make heavy
use of ISO 9000).
54. Grajek notes that the literature has been divided on the role of ISO 9000. Some see it as a
“common language” that lowers information asymmetries between firms, and hence eases trade between
firms. Others see it as a device to raise rivals‟ costs and hence it acts as a barrier to market entry and to
trade. Grajek considers that his results on balance support the “common language” hypothesis.
55. These results are marked G1 (for the whole sample) and G2 (for OECD countries only) in the
upper parts (i) of Tables 1 and 2.
Clougherty and Grajek (2008)
56. Clougherty and Grajek‟s study has a similar design to that of Grajek, but is broader in scope. In
addition to assessing the implications of ISO900 for trade, they also examine the implications of ISO 9000
for foreign direct investment (FDI). Here we concentrate just on the first part of the study but we shall
return to the second part of the study in Section 4 below.
57. Clougherty and Grajek estimate a gravity model of trade using OECD panel data on imports into
OECD nations from a total of 52 countries over the period 1995-2002. The standards variables are
computed in the same way as in the Grajek study. They segment their data into three sub-samples: a
sample to model exports from developed countries to other developed countries (DC→DC, in their
notation); a sample to model exports from developing countries to developed countries (LDC→DC); and a
sample to model exports from developed countries to developing countries (DC→LDC).
58. Their regression results find that ISO 9000 diffusion in developed nations does not appear to
enhance trade between nations. That is, diffusion in developed countries has no apparent effect on
DC→DC, LDC→DC, or DC→LDC. But on the other hand, ISO 9000 diffusion in developing nations
does appear to enhance exports to developed nations (LDC→DC).
59. It is worth noting in passing that these results are somewhat different from those in Grajek
(2004), where using the present notation, ISO 9000 diffusion in developed countries has a positive effect

20
on DC→DC exports and DC→LDC exports, but a negative effect on LDC→DC exports. But the positive
effect of ISO 9000 diffusion in developing countries on LDC→DC exports is also found in Grajek (2004).
60. As with the previous study, these results are marked CG1 (LDC→DC), CG2 (DC→LDC) and
CG3 (DC→DC) in the upper parts (i) of Tables 1 and 2.
Kim and Reinert (2009) – KR
61. This study is somewhat different in scope from the other two in this section, but we have
included it here because it uses ISO 9000 diffusion as one of its key variables.
62. Kim and Reinert explore the hypothesis that developing countries cope better with stringent
developed country standards in food and agricultural products when they have a stronger institutional
capacity. They measure four aspects of institutional capacity: information, conformity, enforcement, and
international standard-setting. They estimate a gravity model of trade in food and agricultural products –
specifically, cereal and cereal products, and preserved or prepared nuts including groundnuts. Their data
relate to 52 countries (including 30 developing countries) for cereals and cereal products, and 49 countries
(including 25 developing countries) for nuts and nut products.
63. Their measure of informational capacity draws on three indicators: the proportion of Internet
users per thousand inhabitants, an Education Index from UNDP, and an online service delivery index from
the World Market Research Centre Global e-Government Survey. Their measure of conformity capacity is
the proportion of establishments in each country which have ISO 9000 certification. Their measure of
enforcement capacity is derived from numbers of SPS enquiry points, TBT enquiry points, and a National
Plant and Protection Organization. And finally, their measure of international standards-setting capacity is
derived from data on membership and participation in relevant international standards-setting
organisations.
64. Kim and Reinert‟s econometric results find that informational capacity and conformity capacity
have strong and significant effects on developing country exports, but the effects of enforcement and
international standard-setting are less clear. They confirm the negative and statistically significant impact
of Aflatoxin B1 standards on developing country exports, as found in earlier studies, but show that to some
degree, at least, informational and conformity capacity can offset this. In short, there is some evidence to
support the hypothesis that developing countries do cope better with stringent standards in food and
agricultural products when they have a stronger institutional capacity. We have marked this study as KR
in Part i (Column e) of Table 1.
Summary
65. Table 4 overleaf summarises the three studies of this sub-section. All are based on measures of
standards (not regulations). In each case, the studies count the use of ISO 9000 in a country as the measure
of standards use in that country. All three studies estimate models of bilateral trade. All find that use of
ISO by an exporter can increase its exports, and this seems especially relevant to exports from developing
countries. The use of ISO 9000 by an OECD importer can act as a barrier to entry to imports from non-
OECD countries, but can actually serve to increase imports from other OECD countries.
66. The reader may again wish to look back to Tables 1 and 2. The studies listed in this section
(CG1, CG2, CG3, G1, G2, KR) are again highlighted in light grey. The effects on exports (Table 1, Part
i) are either positive or neutral, but the effects on imports (Table 2, Part ii) are finely balanced.

21
Table 4. Summary of Studies in Section 2.2
Author(s) Date Dependent
Variable(s)
Standards or
Regulations? Data Trade Effect Sectors Countries
Grajek 2004 Bilateral
trade Standards
Use of ISO
9000
ISO 9000 use in country X
increases exports from X
and reduces imports into
X. But amongst OECD
countries, importer use of
ISO 9000 leads to
increased imports from
other OECD countries.
Economy
wide
101
countries
(incl. all 30
OECD
countries)
Clougherty
& Grajek 2008
Bilateral
trade Standards
Use of ISO
9000
ISO 9000 use in developed
nations does not enhance
trade. But ISO 9000 use in
developing nations
enhances exports to
developed nations.
Economy
wide 52 countries
Kim &
Reinert 2009
Bilateral
trade Standards
Measures of
institutional
capacity
(e.g. use of
ISO 9000)
Institutional capacity (e.g.
use of ISO 9000) helps to
overcome trade barriers
from stringent regulations.
Cereals,
cereal
products,
nuts
Up to 30
developing
countries
and 22
developed
countries
2.3 Regional Agreements: MRAs and Harmonization
67. Chen and Matoo (2004), Vancauteren and Weiserbs (2005), Henry de Frahan and Vancauteren
(2006), and Baller (2007) have taken a rather different approach to these questions. Instead of using the
Perinorm database or using data on ISO 9000 diffusion, they use information on mutual recognition
agreements (MRAs) and harmonization agreements to assess the degree of international harmonization of
regulations and standards. Moreover, while all the studies in sub-Sections 2.1 and 2.2 referred to standards
and not to regulations, that is no longer the case. The studies by Chen and Mattoo (2004) and by Baller
(2007) refer to standards and regulations, while the studies by Vancauteren and Weiserbs (2005) and by
Henry de Frahan and Vancauteren (2006) refer to regulations only.
68. To understand these studies, it is helpful to think of them as using a slightly different model to
the studies reviewed in sub-Sections 2.1 and 2.2.

22
Figure 3. Regional Agreements and Trade
69. In Figure 3, we identify a region in which a regional agreement (MRA or harmonisation) exists.
We also recognise two types of outsider: those in rich countries (marked here as OECD) and those in other
countries. The implication of this model is that the effect of the MRA or harmonisation within the region,
as drawn, will have different effects on the trade between A↔B, A↔C and A↔D.
Chen & Mattoo (2004) – CM1, CM2 and CM3
70. Chen and Mattoo estimate a gravity model of bilateral between pairs of countries. They use data
on 28 OECD countries and 14 non-OECD countries covering 3 digit SITC product categories from all
sectors of the economy. They create „standards‟ measures from data on MRAs and harmonization
agreements. The MRA variables are simple binary variables which indicate whether there is (1) or is not
(0) an MRA between two countries (say I and J) for product R in year T. Several different MRA variables
are constructed to capture MRAs with and without associated rules of origin. The harmonisation variables
count the total number of harmonisation directives that impinge on trade between the two countries (I and
J) for product R in year T. Several different MRA variables are constructed to capture MRAs with and
without associated rules of origin.
71. Chen and Mattoo find that such harmonisation agreements can increase trade between
participating countries (A and B in the above diagram) but will not necessarily increase trade with other
countries (C and D). They find that harmonization increases the exports from excluded developed
countries (C in the above diagram) to the region, but reduces exports from excluded developing countries
(D) to the region. They explain this difference as follows. The harmonised standard in the region is likely
to be quite strict compared to what country D is used to, and as a result any benefits of harmonisation in
the form of economies of scale are outweighed by the increased costs of meeting a stricter standard. By
contrast, for those countries that are already familiar with strict standards (C, for example) the benefits of
harmonisation outweigh the costs. Hence the net effect of harmonisation in a region is to increase exports
from C and reduce exports from D to the region.
72. By contrast, Chen and Mattoo find that Mutual Recognition Agreements (MRAs) tend to have
more symmetric benefits to countries B, C and D. This means that intra-regional trade (A↔B), exports
from developed countries outside the region (C→A) and especially exports from developing countries
(D→A) all increase, unless the MRAs contain restrictive rules of origin. When the MRAs do contain
restrictive rules of origin, however, the benefits are confined to countries within the region, and at the
expense of the rest of the world – especially developing countries.
73. These studies are located in Table 2 Part i, because they relate to the internationalisation of
standards and regulations. The implications of MRAs are marked CM1. The implications of
C
A B
D
OECD
Region
C
A B
D
OECD
Region

23
harmonization on trade from OECD countries to the region are marked CM2, and the implications of
harmonization on trade from non-OECD countries to the region are marked CM3.
Vancauteren and Weiserbs (2005) – VW
74. This study and the next are important because they focus on an issue of particular policy interest:
the effect of harmonisation of EU regulations on intra-EU trade. This study refers to manufacturing while
the next refers to trade in food products.
75. As part of a wide-ranging application of the gravity model to intra-EU trade in manufacturing,
Vancauteren and Weiserbs analyze the effects of EU harmonization of technical regulations. Their data on
technical regulations come from European Commission (1998). This indicates, at the NACE 3-digit level,
whether trade is affected by technical regulations and also lists the main approach used by the Commission
to remove such barriers. From this data they construct a trade-weighted coverage variable which measures
the proportion of a country‟s exports that satisfies the EU‟s harmonization of regulations. This variable is
normalised to measure the extent to which a country shows greater than average compliance with EU
harmonization. Using data for total manufacturing and for the period 1990-1998, they estimate a gravity
model for intra-EU trade which includes this coverage variable. Their regression results find that
harmonization of EU regulations has played a strongly positive and statistically significant role in
explaining growth of intra-EU trade in manufacturing. Their study is marked VW in Table 1 Part i and
Table 2 Part i.
Henry de Frahan and Vancauteren (2006) – HV
76. Henry de Frahan and Vancauteren estimate a gravity model of bilateral trade in a total of 1284 8-
digit products taken from 10 NACE sub-sectors covering food products. The data relate to 10 importing
countries and 14 exporting countries in the EU. They compute regulation variables from a very detailed
database on the harmonisation of technical regulations (described in Brenton et al. 2001). In the database,
harmonisation of TBT is described by a binary variable. For each product, this takes the value 1 if
harmonization rules apply to the bilateral trade in that product, and 0 otherwise. The variable is also set to
0 if one or more of the following conditions hold: (i) harmonisation is not applied and countries keep their
own national regulations, (ii) national regulations are not considered important and/or (iii) a mutual
recognition agreement is observed. The binary variables are aggregated to form export-weighted trade
coverage ratios which are used in their model as a measure of harmonisation.
77. Their regression results find that these harmonisation variables have positive and significant
coefficients for overall intra-EU trade in food products and, at a more disaggregated level, for trade in 9 out
of the 10 categories of food product. They conclude that harmonisation in food regulations has increased
intra-EU trade in all food products by about ⅔, and in fruits and vegetables by around ⅓ during the period
1990–2001. This study is marked HV in Table 1 Part i and Table 2 Part i.
Baller (2007) – BA1, BA2 and BA3
78. Baller‟s study examines bilateral trade in two sectors, telecommunications equipment and
medical devices, between 26 OECD countries and 22 non-OECD countries. She estimates a gravity model
using trade data at the 3-digit level. Baller‟s database contains information on 8 MRAs relevant to medical
devices and 14 MRAs relevant to telecommunications equipment. It also contains information on 22 EU
harmonisation agreements and 19 ASEAN harmonisation agreements. She constructs several variables to
represent the relevance of MRAs and harmonization agreements to bilateral trade between a particular pair
of countries. The MRA variable is a binary measure indicating if two countries have an MRA with each
other at a particular time (1) or not (0). The main harmonization measure is a binary variable taking the

24
value 1 if two countries have a relevant harmonization agreement at a particular time. She also creates two
other binary variables to measure whether (in the notation of Figure 3): (i) country A is part of a
harmonizing region and C is not, and C is an OECD country; (ii) country A is part of a harmonizing region
and D is not, and D is not an OECD country.
79. Baller‟s results indicate that MRAs have a positive influence on the export probabilities and trade
volumes for those countries in the MRA. The results for harmonization are less clear-cut. Baller
distinguishes three cases. First, the extent of harmonization between partners to a harmonization
agreement (A↔B) does not appear to have a significant effect in their model. Second, those third-party
OECD countries, marked C in Figure 3, benefit from the regional harmonization agreements through
increased exports (C→A). Thirdly, those third-party developing countries, marked D in Figure 3, do not
seem to benefit from the regional harmonization agreements through increased exports (D→A). The MRA
results are marked BA1 in Tables 1 and 2. The harmonisation results for exports from C→A are marked
BA2 in Table 2, and the harmonisation results for exports from D→A are marked BA3 in Table 2.
80. These results are consistent with those of Chen and Mattoo (2004). In light of these results,
Baller (2007) argues that MRAs would be a more supportive policy instrument in encouraging trade with
non-OECD countries than harmonization per se. Baller observes that at present few of these countries are
parties to MRAs.
Summary
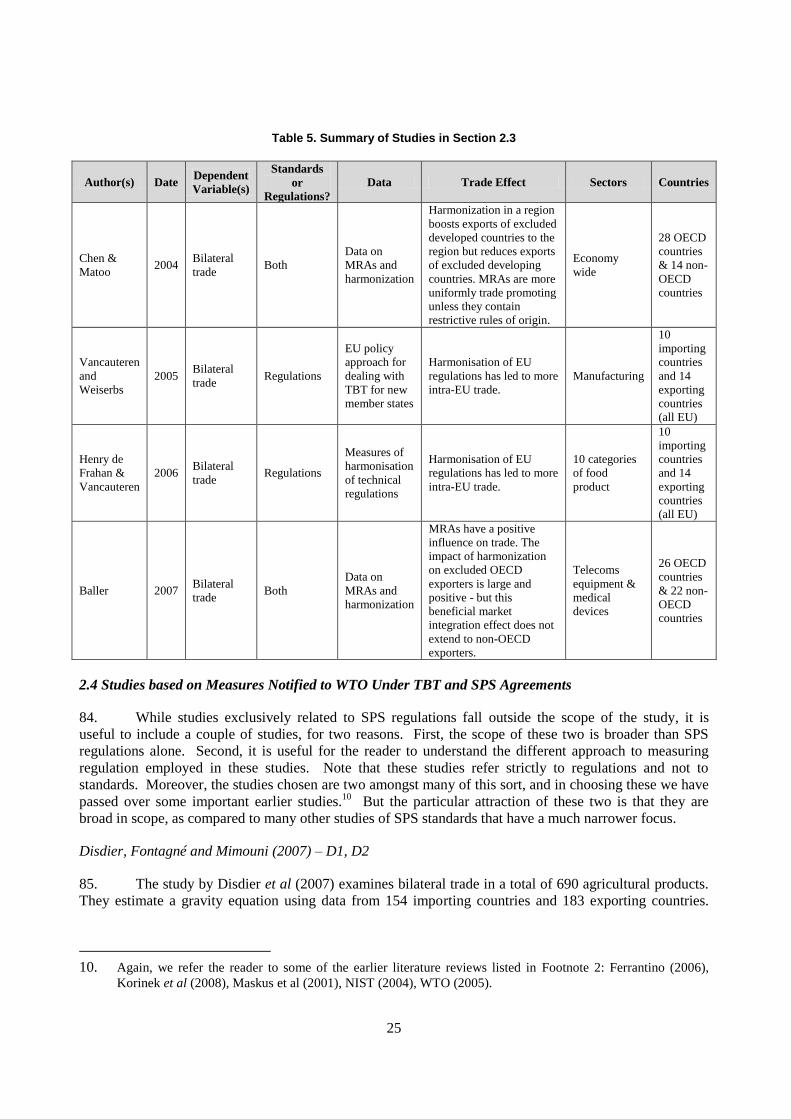
81. Table 5 overleaf summarises the four studies of this sub-section. Two are studies of the effects of
regulations (Vancauteren and Weiserbs, 2005; Henry de Frahan and Vancauteren, 2006) while two seem to
focus on both the effects of standards and or regulations (Baller, 2007; Chen and Mattoo, 2004). All four
studies estimate models of bilateral trade. Three use variables based on data on MRAs and/or
harmonisation measures. One uses a variable describing the EU policy approach to dealing with technical
barriers to trade (TBTs).
82. Two of the studies found that harmonization of EU regulations led to more intra-EU trade,
whether in manufactured goods or in food products. The other two studies found that MRAs tend to be
more uniformly trade-creating than are harmonisation measures. These latter also found that
harmonisation in a region tends to help outside OECD countries to export to the region, but may prevent
outside developing countries from exporting to the region.
83. The reader may again wish to look back to Table 2. Two of the studies listed in this section (HV,
VW) are not highlighted (related to regulations) while the others (BA1, BA2, BA3, CM1, CM2, CM3) are
highlighted in dark grey (related to standards and regulations). These studies are all located in Table 2 Part
i because they relate to the internationalisation of standards and regulations. The overall impression of
these studies is that harmonization and MRAs are mostly (though not unanimously) favourable to trade.
25
Table 5. Summary of Studies in Section 2.3
Author(s) Date Dependent
Variable(s)
Standards
or
Regulations?
Data Trade Effect Sectors Countries
Chen &
Matoo 2004
Bilateral
trade Both
Data on
MRAs and
harmonization
Harmonization in a region
boosts exports of excluded
developed countries to the
region but reduces exports
of excluded developing
countries. MRAs are more
uniformly trade promoting
unless they contain
restrictive rules of origin.
Economy
wide
28 OECD
countries
& 14 non-
OECD
countries
Vancauteren
and
Weiserbs
2005 Bilateral
trade Regulations
EU policy
approach for
dealing with
TBT for new
member states
Harmonisation of EU
regulations has led to more
intra-EU trade.
Manufacturing
10
importing
countries
and 14
exporting
countries
(all EU)
Henry de
Frahan &
Vancauteren
2006 Bilateral
trade Regulations
Measures of
harmonisation
of technical
regulations
Harmonisation of EU
regulations has led to more
intra-EU trade.
10 categories
of food
product
10
importing
countries
and 14
exporting
countries
(all EU)
Baller 2007 Bilateral
trade Both
Data on
MRAs and
harmonization
MRAs have a positive
influence on trade. The
impact of harmonization
on excluded OECD
exporters is large and
positive - but this
beneficial market
integration effect does not
extend to non-OECD
exporters.
Telecoms
equipment &
medical
devices
26 OECD
countries
& 22 non-
OECD
countries
2.4 Studies based on Measures Notified to WTO Under TBT and SPS Agreements
84. While studies exclusively related to SPS regulations fall outside the scope of the study, it is
useful to include a couple of studies, for two reasons. First, the scope of these two is broader than SPS
regulations alone. Second, it is useful for the reader to understand the different approach to measuring
regulation employed in these studies. Note that these studies refer strictly to regulations and not to
standards. Moreover, the studies chosen are two amongst many of this sort, and in choosing these we have
passed over some important earlier studies.10
But the particular attraction of these two is that they are
broad in scope, as compared to many other studies of SPS standards that have a much narrower focus.
Disdier, Fontagné and Mimouni (2007) – D1, D2
85. The study by Disdier et al (2007) examines bilateral trade in a total of 690 agricultural products.
They estimate a gravity equation using data from 154 importing countries and 183 exporting countries.
10. Again, we refer the reader to some of the earlier literature reviews listed in Footnote 2: Ferrantino (2006),
Korinek et al (2008), Maskus et al (2001), NIST (2004), WTO (2005).

26
Their specific objective is to examine the impact on trade of measures notified under the SPS and TBT
agreements.
86. WTO members are obliged to notify non-tariff measures, and these are analyzed by UNCTAD.
Disdier et al point out that while, in theory, 115 measures could be imposed for environment, wildlife,
health or safety purposes, in practice only 43 of them are enforced. Countries can cite six different
objectives when imposing measures on agricultural trade, and the distribution of these 43 measures across
the six objectives is shown in parentheses: protection of the environment (9); protection of wildlife (5);
protection of human safety (7); protection of plant health (6); protection of animal health (6); protection of
human health (10). While a majority of these relate to SPS concerns (outside the scope of this study) a
significant number relate to other objectives.
87. Disdier et al use three approaches to measuring the significance of these notifications. The first
is a binary variable equal to one if the importing country notifies at least one barrier. The second is a
frequency index defined by the proportion of disaggregated (HS6) product items notified within a more
aggregated (HS4) product category. The third is an ad-valorem equivalent using the data in Kee et al.
(2006).
88. Disdier et al‟s results suggest that, overall, SPS and TBT measures have a negative impact on
trade in agricultural products. However, they do find that OECD to OECD exports are not significantly
impeded by these measures. (This result is marked D1 in Table 2 Part ii.) But exports from developing to
OECD countries are certainly reduced by these regulations. (This result is marked D2 in Table 2 Part ii.)
And moreover, the negative impact of these measures is greatest in exports to the EU market.
Fontagné, Mimouni and Pasteels (2005) – F1, F2 and F3
89. The study by Fontagné et al (2005) is also broad in scope. It examines bilateral trade data at the
6-digit level for some 5,000 products in 61 product groups (including agricultural products and
manufactured products). In their sample, there are 61 importing countries and 114 exporting countries.
Their specific interest is in the trade effects of environment related measures (ERMs) notified under the
SPS and TBT agreements. Their econometric approach is to use a censored Tobit model with random
effects.
90. Fontagné et al construct a standards variable similar to the frequency index used by Disdier et al
(2007). They count the number of 6-digit products notified by the importer and divide that number by the
total number of product items belonging to the 4-digit product category. They distinguish between the
effects of this ERM standards measure on imports from OECD countries (OECD), developing countries
(DC) and least developed countries (LDC).
91. Fontagné et al present detailed results for their 61 different product groups. They find that for
trade in fresh and processed food, these ERM measures tend to restrict trade from developing countries
(DCs) and least developed countries (LDCs). This result is marked F2 in Table 2 Part ii. But exports from
OECD countries are not restricted (this is marked F1 in Table 2 Part ii). On the other hand, for the
majority of manufactured products, these ERM measures have either no significant effect or a positive
effect, and that observation applies to LDCs, DCs and OECD countries. This last result is marked F3 in
Table 2 Part ii. 11
11. However, they find that reported measures in some product categories are suspiciously low, which suggests
that there may be under-reporting of such measures to WTO.

27
Table 6. Summary of Studies in Section 2.4
Author(s) Date Dependent
Variable(s)
Standards
or
Regulations?
Data Trade Effect Sectors Countries
Disdier et
al 2007
Bilateral
trade Regulations
Measures
notified under
SPS and TBT
agreements
Such regulations have on the
whole a negative impact on
trade in agricultural products.
These measures do not deter
OECD→OECD exports, but
do constrain exports from
developing and least
developed countries to the
OECD.
Agricultural
products
154
importing
countries
and 183
exporting
countries
Fontagné
et al 2005
Bilateral
trade Regulations
Environmental
measures
notified under
SPS and TBT
agreements
Such regulations tend to have
a negative impact on trade in
food products, while for
manufactured products, an
insignificant or even a
positive impact is observed.
Agricultural
products and
manufactured
products
61
importing
countries
and 114
exporting
countries
Summary
92. Table 6 overleaf summarises these two studies. Given that the measures of regulations used here
are notifications under the TBT and SPS agreements, it is not surprising that they are, on the whole, not
very supportive to trade. In Table 2, these results (codes not highlighted) are located further to the left than
the majority of studies considered so far.
2.5 Other Measures of Standards
93. In this final sub-section, we note five further studies that use other approaches to measuring
standards and regulations for use in econometric models of trade. Note that, as in Section 2.3, some
studies refer only to regulations (van Beers and van den Bergh, 1997; Wilson et al, 2002) while the rest
refer to standards and regulations (Michalek et al, 2005; Chen et al, 2006; Sánchez et al, 2008).
van Beers and van den Bergh (1997) – VB
94. This pioneering study examined the impact of strict environmental regulations on a country's
exports and imports. Van Beers and van den Bergh construct their own measures of the strictness of
environmental regulations. This is an output-oriented measure, which they argue is a better indicator than
input-oriented measures. Their „narrow‟ measure is closely connected to the „polluter pays‟ principle
while their „broad‟ measure is constructed from several environmental indicators. Van Beers and van den
Bergh estimate gravity models of bilateral trade for 1992, using data for 21 OECD countries. There are
three versions of their model: (i) total bilateral trade flows; (ii) bilateral trade flows in pollution-intensive
sectors; and (iii) bilateral trade flows in pollution-intensive sectors that are „non-resource based‟ (or
„footloose‟, as described in their paper).
95. The first set of results refers to the effect of a country‟s own regulations on its exports. In the
case of model (i), they find that the broadly defined variable does not have a significant effect on exports,
while the narrow one does have a significant negative impact on exports. In case (ii), they find no evidence
that a strict environmental policy has an impact on „dirty‟ exports. In case (iii), which refers to non-
resource based (or „footloose‟) bilateral trade, they find a significant negative effect on exports. They
argue that results (ii) and (iii) are consistent with theoretical predictions. The second set of results refers to
the effect of a country‟s own regulations on its imports. Here they find that irrespective of which of the

28
three models is considered, strict environmental regulations have a significant negative impact on imports.
These results are summarised by the mark VB in Table 1 Part ii, and in Table 2 Part ii.
Wilson, Otsuki and Sewadeh (2002) – WS
96. Wilson et al explore the link between trade and environmental regulations in major pollution–
intensive industries, including metal mining, nonferrous metals, pulp and paper, iron and steel, and
chemicals. Their data refer to 6 OECD and 18 non–OECD countries over the period 1994 to 1998, and
their econometric framework follows the Hecksher–Ohlin–Vanek (HOV) model.
97. Wilson et al use data on environmental regulations collected by Dasgupta et al (2001). The latter
carried out a survey using 25 questions to analyse environmental awareness, legislation, and control
mechanisms for environmental enforcement in each country. From these Dasgupta et al developed a cross-
country index of stringency in environmental regulation, where a higher score in the index implies greater
stringency.
98. Wilson et al construct two variables from the Dasgupta et al data. One is a measure of the state
of environmental legislation, and the other is a measure of the control mechanism for environmental
enforcement. They find that the effect of „state of legislation‟ variable (in country X) on net exports (from
country X) is negative and significant in all industries but one. This result is marked WS in Table 1 Part ii.
This is in line with the view that stricter environmental standards mean lower exports from pollution–
intensive industries. They also find that a harmonization agreement on common environmental regulations
will cause a greater reduction in developing (as opposed to developed) country exports of pollution-
intensive goods.
Michalek et al (2005) – MH1 and MH2
99. Section 5 of Michalek et al (2005) offers another novel approach. Rather than count or quantify
standards or regulations as such, they analyse the effects of three different generic EU policy approaches
for dealing with technical barriers to trade for the new member states (CEEC) and the Mediterranean
countries. These three approaches are: harmonization; the new approach; and mutual recognition.
100. Michalek et al‟s econometric model uses bilateral trade data for the European Union at the 8-
digit level. Their data on technical barriers to trade is taken from European Commission (1998) which
reports what approach the European Single Market program is taking to reducing technical barriers to trade
in each 3-digit industry. For each industry they construct dummy variables reflecting the use of one (or
more) of these approaches: harmonization, new approach, mutual recognition. (In several industries, more
than one approach is used.)
101. Their results find that when the approach to removing TBT is harmonisation or the new
approach, then that is successful in increasing trade flows. This is marked MH1 in Table 2 Part i. But
when the approach is mutual recognition, the estimated effect is to reduce trade flows. This is marked
MH2 in Table 2 Part i.
102. They note that the last of these results is surprising since common sense (and other results,
described above) suggest that the mutual recognition approach is a most effective method to overcome
technical barriers to trade. Their interpretation of this result is that the observed association is not a causal
connection from the choice of policy to the effect on trade but the reverse direction of causation. The
mutual recognition approach may be introduced in sectors when trade flows are relatively low but there are
few technical barriers to trade. In that case, there would be little to be gained from a policy other than
mutual recognition.

29
Chen, Otsuki and Wilson (2006) – CW1 and CW2
103. The study by Chen et al (2006) uses the data from the World Bank Technical Barriers to Trade
Survey to estimate a firm-level model of exporting by firms in developing countries. They use this model
to estimate how standards impact on the decision to export to developed countries. The sample contains
data from 619 firms in 25 agricultural and manufacturing industries located in 17 developing countries and
considers five developed country export markets (EU, USA, Canada, Japan and Australia).
104. Five specific questions in the survey generate variables of particular importance in this study:
1. “Have quality/performance standards impacted your ability to export products?”
2. “Have testing procedures impacted your ability to export product?”
3. “Have labelling requirements impacted your ability to export products?”
4. “Do you have difficulty obtaining information about applicable regulations in the countries listed?”
5. “How many days does the conformity assessment inspection usually take?”
The answers to Questions 1-4 are used to create binary variables. The answer to 5 provides an
average time in days. These variables are included in models of export shares and market diversification
(the number of export markets in which a firm is active).
105. Chen et al find from their model of export shares that firms answering “yes” to the above
questions about testing procedures (2) and information (4) tend to have a significantly lower propensity to
export. They also find that lengthy inspection times (Question 5) will significantly reduce the propensity
to export. In particular, they find that it is agricultural rather than manufacturing firms that find these
testing procedures and inspection times especially burdensome. These results are marked CW1 in Table 2
Part ii.
106. Turning to the model of market diversification, Chen et al find that firms answering “yes” to
Question (1) above (about standards) tend to be active in a significantly lower number of export markets.
This result is marked CW1 in Table 2 Part ii. This observation is especially relevant to firms that outsource
the production of essential inputs. Chen et al interpret this to mean that the existence of multiple standards
in export markets is a challenge to would-be exporters and that may discourage the firm from entering a
particular export market. They also find that larger firms tend to export to more countries than smaller
firms: this suggests that larger firms find the need to comply with multiple standards less challenging.
Sánchez et al (2008) – SA
Sánchez et al (2008) also use data from the World Bank TBT survey to estimate a firm-level model of
exports from the manufacturing sector in Argentina to OECD countries. In the absence of detailed
standards data, they use a difference in difference estimator to capture the effect of the increased stringency
of standards and regulations in OECD countries on their imports. Their results find a marked reduction in
export shares resulting from the more stringent OECD standards and regulations.
Summary
107. The five studies listed here are summarised in Table 7 overleaf. They are all rather different,
using a variety of measures and approaches. In general however, there are many more negative results
amongst this last group of studies than in most of the earlier studies. That is quickly confirmed when we

30
take another look at Tables 1 and 2. In the case of strict environmental regulations, that is not surprising.
It is also unsurprising that the measures used in Chen et al. (2006) would have a negative effect on trade. It
seems that the mainly negative results here are not specific to particular sectors.
Table 7. Summary of Studies in Section 2.5
Author(s) Date Dependent
Variable(s)
Standards or
Regulations? Data Trade Effect Sectors Countries
van Beers
and van de
Bergh
1997 Bilateral trade Regulations Environmental
regulations
Strict
environmental
regulations have
a significant
negative impact
on trade
Economy wide 21 OECD
countries
Wilson et
al 2002
Heckscher-
Ohlin-Vanek
(HOV) model
Regulations Environmental
regulations
Strict
environmental
regulations have
a significant
negative impact
on trade
5 pollution-
intensive
industries
6 OECD
countries
and 18 non-
OECD
countries
Michalek
et al 2005 Bilateral trade Both
EU policy
approach to
correcting TBT
Harmonization
and new
approach to
dealing with
TBTs tend to
increase trade;
MRAs tend to
reduce trade
Economy wide
EU –
including
new
member
states
Chen at al 2006
Export shares
and market
diversification
Both
TBT Survey on
impact of
standards and
regulations
Some of the
standards
variables lead to
reduced exports
and reduced
market
diversification
(activity in
fewer export
markets)
25 agricultural
and
manufacturing
industries
Exporters
from 17
developing
countries;
importers
are EU,
USA,
Canada,
Japan,
Australia
Sánchez et
al 2008
Argentina
exports to
OECD
Both
Difference in
difference
approach to
measuring
structural shifts
Structural shift
has led to large
reduction in
Argentine
exports to
OECD countries
Manufacturing
Exporter is
Argentina;
importers
are OECD
countries
3. Surveys
108. The econometric evidence of the last section is often described as indirect inference. The studies
described there seek to measure the effects of relationship between standards and trade indirectly from the
pattern of correlation between them. In this section, we summarise some of the studies that have attempted
to measure directly the relationships between standards and trade, by surveying exporting firms.
109. The studies listed below are very heterogeneous, and ask rather different questions in different
contexts. For that reason, it is not easy to compare the findings of the different surveys. They should not
be seen as a series of attempts to answer a particular question, but rather they should be seen as
contributing a miscellany of important insights into how standards impact on trade. Some of these surveys

31
are, in the main, looking for the ways in which standards can act as barriers to trade (OECD, 1999; Wilson
and Otsuki, 2004), while others (DIN, 2000) are, in the main, looking at the constructive side of standards.
United States International Trade Commission (1998)
110. The purpose of this USITC study was to assess the importance of standards-related barriers to
trade in the computer hardware, software, and telecommunications equipment sectors. The particular
focus was on the following factors:
duplicative conformity assessments
onerous quality registration
testing, certification, marking and labelling requirements
strategic standards policies of some countries.
111. The study aims to provide „illustrative examples‟ rather than attempt the more ambitious task of
establishing exactly which countries, barriers, and products are most affected. The survey draws on an
extensive literature search and a series of personal and telephone interviews in the United States, Europe,
Asia, and Latin America. The interviewers sought the views of US- and foreign-based companies, officials
from government and trade associations, analysts and consultants about the importance of standards-related
measures in these sectors.
112. Duplicative conformity assessment requirements emerge as a particular matter for concern.
Suppliers of telecommunications and computer equipment often have to go through repeated conformity
assessments if they wish to sell in different countries. The problem does not lie with the technical
requirements themselves, which are usually quite reasonable, but with the cost of repeating this exercise
even for similar technical regulations, or slight variations in such regulations. Similar concerns relate to
proliferation of quality registration, testing, and certification requirements, and to inconsistent marking and
labelling requirements. The study evaluates some recent attempts to overcome some of these standards-
related barriers by the use of mutual recognition agreements (MRAs).
OECD (1999)
113. The aim of this study was also to investigate the extent to which trade is constrained by technical
standards and conformity assessment procedures. The study aimed to collect data on compliance costs in
export markets, and assess to what extent these impede trade. The study was concerned with three product
groups (telecommunications equipment, dairy products and automotive components) in trade between four
countries (the United States, the United Kingdom, Germany and Japan). Firms were questioned through
interviews and a structured questionnaire.
114. Different mandatory technical requirements exist in all four countries and in all three product
categories. However, the interviews suggested that for the majority of firms these differences are at most a
minor problem. Harmonisation of standards is generally found to be very helpful in reducing costs of
product re-design and testing, but some companies said that genuine harmonisation is quite rare. Mutual
recognition agreements (MRAs) are considered to have beneficial effect in reducing compliance costs.
MRAs increase the number of approval agencies and the competition between agencies reduces the costs
of obtaining approval.
115. The survey identified two specific compliance strategies adopted by would-be exporters. One is
described by OECD as, “incorporating into the initial product design many features demanded by target
countries”. This strategy makes it easier to export promptly to target countries. The other is “initial design
32
for the domestic market only”. This strategy keeps initial design expenditures low, but runs the risk of
greater product re-design costs downstream if a suitable export market is identified.
116. Conformity assessment costs could be substantial. Sometimes just initial approval is required
before any exporting can begin. But in the dairy sector, products must be tested both prior to export and at
the port of entry. The additional cost can be substantial for small specialist manufacturers. Time is an
additional factor in the cost of conformity assessment. When product lifecycles are short, the additional
time taken in conformity assessment can damage sales prospects. This was especially relevant to
telecommunications equipment manufacturers where life cycles could be only 18 months.
117. For many firms, moreover, the issue of meeting non-mandatory product standards was just as
much of a challenge, if not more so. This is of particular importance when a product is a component in
some other system (for example automotive components in the OEM market).
DIN (2000)
118. The DIN summary report (2000) brings together the results of a company survey and some
econometric work. The latter (by Blind and colleagues) has been discussed above. Here we concentrate
on the former.12
119. The survey selected ten sectors of industry; in eight of these, standardization is of particular
importance. The survey questionnaire (containing 49 questions) was sent to some 4,000 companies in
Germany, Austria and Switzerland, and of these, 707 completed the questionnaire. The survey focused in
particular on the effects of standards on companies, and their interaction with the business environment.
Consumer interests and government interests in standardization were assessed also in interviews carried
out with ten experts each in Germany and Austria.
120. The survey demonstrated the strategic significance of standardization is not fully appreciated by
most decision makers. Despite this, 75% of the businesses surveyed said they were involved in the
activities of DIN, ON or SNV (as relevant)13
and that 60% of this involvement is in practice at a European
or international level. The survey showed that businesses which are actively involved in standards work
see benefits in terms of costs and competitive success.
121. Of the businesses surveyed, a third could succeed in export market with products that conform to
their own national standards, but 27 per cent adapt products to foreign standards. Harmonized European
and International Standards could result in significant reductions in trading costs and simplified contractual
agreements. Over a half of the businesses surveyed stated that European and International Standards had
lowered trade barriers in their sector, and that national standards were sometimes used as non-tariff
barriers. Respondents indicated that standards have substantial and beneficial effects on transaction costs,
as they act as a source of information and are accessible to all interested parties.
122. The existence of standards means that there are a collection of harmonized technical rules. This
can help businesses cooperate with each other and create strategic alliances, and the resulting synergies can
reduce costs and increase profitability. But there can also be negative effects when such cooperation leads
to a monopolistic market structure, with consequent damage to the consumer.
123. Standards were not considered a particularly important constraint to innovation and
standardization was considered to be an effective way of reducing the economic risk of R&D activities,
12. The DIN (2000) report is just a summary. Further details are in Blind (2004, Chapter 17, Section 17.9).
13. ON and SNV are (respectively) the national standards institutes of Austria and Switzerland.

33
and of reducing R&D costs. The survey found that safety standards played a role in reducing accident
rates, but respondents emphasised that standards were not the only factor behind this trend.
World Bank TBT Survey – Wilson and Otsuki (2004)
124. The surveys listed above were specific to particular countries, and the World Bank Technical
Barriers to Trade Survey was probably the first attempt to investigate the global impacts of technical
requirements. The aim of the survey was to ask firms in agriculture, manufacturing and commerce in
developing countries about the technical barriers they encounter, and the impact of these on export success.
The data covers 689 firms in over twenty industries in 17 developing countries. The survey sought
information about the stringency and importance of technical regulations specific to five major export
markets (EU, USA, Japan, Canada, and Australia).
125. Some 70 percent of exporters encounter mandatory standards and technical regulations and the
majority of respondents consider that the obligations to meet these requirements can discourage exporting.
Of the five export markets considered, the EU is the one whose technical regulations are considered most
important, followed by the USA. A particularly large share of firms in Eastern Europe and LAC (Latin
America and Caribbean) consider technical regulations to be important. Product quality standard,
performance standards and testing/certification requirements are considered the most important for export
success. In some cases, however, it is recognised that technical regulations can reduce production costs and
therefore enhance exports.
126. Firms are usually able to manage compliance to technical regulations using existing resources,
but in those cases where firms face additional costs of compliance, this usually involves investment in
additional plant or equipment, or alternatively product re-design and additional employment. Conformity
assessment is most widely imposed in the EU. Companies tend to find that outsourcing of conformity
testing is less expensive than trying to assess conformity in house.
127. Amongst international standards, ISO is most commonly used in this sample of firms from
developing countries. The majority consider international standards are important for success both in
domestic and foreign markets. Mutual Recognition Agreements are not common among countries in this
survey, but there is some experience of these in Eastern Europe and Latin America and Caribbean. The
majority of respondents said that Mutual Recognition Agreements lead to cost savings.
NIST (2004)
128. This study contains two case studies of technical barriers to trade experienced by the US
Pharmaceuticals and Automobile industries. US pharmaceutical firms have sometimes alleged technical
barriers to trade (TBTs) when these are not actually TBTs in law. Nonetheless, NIST finds evidence that
some importers use regulations that differentially affect either the ability of U.S. firms to export or the cost
of doing so. While the regulations are not written in an explicitly discriminatory way, they are written in
such a way that they only impact on innovative pharmaceuticals. This is of particular concern to US
pharmaceutical companies as the majority of „on-patent‟ products are developed in the USA. The leading
industry association does not collect systematic data on such TBTs, but instead focus their attention on
several „priority markets‟ and that makes it hard to form a definitive assessment. In the auto industry,
NIST identified several regulations, standards, and conformity assessment procedures in some of the main
US export markets for autos which appear to show the characteristics of technical barriers to trade. Such
regulations are most common in the repair and service sector, but may also be found in some „end of life‟
regulations.

34
Michalek et al (2005)
129. Section 2 of Michalek et al compared the opinions of Polish and Israeli companies on technical
regulations and standards imposed by the European Union. The survey was carried out before the
accession of Poland to the EU (May 2004). Michalek et al carried out a series of personal, telephone and
email interviews with firms in three industries (food, chemicals and electricals). Respondents were asked
to assess the implications of technical regulations and standards for costs and export success.
130. In general, firms in all three industries in Poland had a positive (or at worst, neutral) attitude to
EU technical regulations. By contrast, Israeli firms reported many more problems in exporting to the EU.
In both countries, the greatest problems from technical regulations and standards were in the food sector,
while firms in the electrical industry were most successful in exporting to the EU. In general, Polish firms
reported that they had less need (than Israeli firms) to redesign products for exporting to the EU market,
but when they did such re-design would involve them in greater investments than Israeli firms.
131. In both countries, harmonization of standards was considered mostly beneficial and ISO
standards are popular in both – though ISO 9000 is found to be much more popular in Israel than in
Poland. Mutual Recognition Agreements are also viewed favourably. The main issue for Israeli firms in
exporting to the EU is the necessity to carry out costly additional tests and certifications. This is a
particular issue in the food industry. In general, the survey finds that many of the necessary adjustments
were made in Poland before May 2004, while Israeli firms were still in transition and therefore faced
greater obstacles in exporting to the EU.
Summary
132. As indicated at the start of this section, the studies listed below are very heterogeneous, and ask
rather different questions in different contexts. For that reason, it is not easy to compare the findings of the
different surveys. They do however contribute an interesting miscellany of insights into how standards
impact on trade. Table 8 overleaf summarises the main features and conclusions of each survey.
Table 8. Summary of Studies in Section 3
Author(s) Date Particular
Focus
Standards/
Regulations? Sectors Countries Summary of Results
USITC 1998
Explore
standards-
related
barriers to
trade
Both
Computer
hardware,
software and
telecomms
equipment
USA,
Europe,
Asia, and
Latin
America
Duplicative conformity assessment a
particular matter for concern. Suppliers
often have to go through repeated
conformity assessments to sell in different
countries, even for similar technical
regulations, or slight variations in such
regulations. Similar concerns apply to
proliferation of quality registration, testing,
and certification requirements, and to
inconsistent marking and labelling
requirements.
OECD 1999
Compliance
costs in
export
markets,
and to what
extent these
impede
trade.
Both
Telecoms
equipment,
dairy products
and
automotive
components
USA, UK,
Germany
and Japan
For most, differences in mandatory
technical requirements are a minor
problem. But conformity assessment costs
could be substantial (e.g. if products must
be tested both prior to export and at the port
of entry). Time to approval is an additional
factor in conformity costs, especially when
product lifecycles are short. The challenge
of meeting non-mandatory product
standards can be just as difficult as meeting
mandatory requirements, if not more so.

35
Author(s) Date Particular
Focus
Standards/
Regulations? Sectors Countries Summary of Results
DIN 2000
How do
standards
influence
the way
companies
interact with
the business
environment
Standards
(mostly)
Sectors where
standardization
is especially
important
Germany,
Austria and
Switzerland
International standards can reduce trading
costs. European and International Standards
can lower trade barriers. Standards have
beneficial effects on transaction costs.
Standards encourage cooperation between
businesses but can be problematic if this
leads to a monopolistic market structure.
Standards not a particularly important
constraint on innovation.
Wilson &
Otsuki
(World
Bank)
2004
The
stringency
of technical
regulations
in five
major
OECD
markets
Regulations
(mostly) 20 industries
17
developing
countries
Most exporters encounter mandatory
standards and technical regulations and find
these discourage exports. These are
especially relevant in exporting to the EU
or USA. Product quality standards,
performance standards and
testing/certification requirements are
considered the most important issues. In
some cases, however, it is recognised that
technical regulations can reduce production
costs.
NIST 2004
Do US
products
encounter
TBT in
export
markets?
What sort?
Both
Pharmaceutical
and
automobile
industries
USA
Some importers use regulations that
differentially affect the ability of U.S. firms
to export. While not written in an explicitly
discriminatory way, they only impact on
innovative producers. This is of particular
concern to producers of „on-patent‟
pharmaceuticals. In the auto industry,
several regulations, standards, and
conformity assessment procedures show the
characteristics of technical barriers to trade.
Michalek
et al 2005
To assess
the
implications
of EU
technical
regulations
and
standards
for costs
and export
success.
Both
Food,
chemicals and
electricals
Israel,
Poland
Polish firms had a more positive attitude to
EU technical regulations than did Israeli
firms. In both countries, the greatest
problems from technical regulations and
standards were in the food sector. Firms in
the electrical industry were most successful
in exporting to the EU. In both countries,
harmonization of standards was considered
mostly beneficial. Mutual Recognition
Agreements are also viewed favourably.
4. Productivity, Growth and Welfare
133. In this section, we briefly note a few of the studies that have looked at the broader economic
effects of standards. In no way is this a comprehensive review, but rather we give a few examples of some
of the approaches that have been taken in the literature and some of the effects that have been found.
134. The first group of studies use the Perinorm database and data on EU countries, and seek to
estimate the effect of standards on productivity, and hence on overall economic growth. The next group
use a variety of other approaches to explore the implications of standards for wages, employment and
foreign direct investment. One is concerned with household income and poverty in Senegal, another is
concerned with standards and FDI in a variety of developed and developing nations, and the last is
concerned with standards and wages in Argentina.

36
Blind, Grupp and Jungmittag(1999); Jungmittag, Blind and Grupp (1999) 14
135. These were, as far as we know, the first econometric studies to examine the effects on standards
on productivity. Blind and colleagues estimated an augmented production function for German business
(excluding agriculture, forestry, fishing and property rentals) using data for the period 1960-1996. In
addition to conventional factors of production, their models also include measures of patents and standards
– the latter is computed from the Perinorm database. Their results find that standards have a persistently
positive and statistically significant coefficient in their regressions. The effects are economically important
also, since over the period of their study, standards account for about one percentage point of the average
annual growth rate.
Temple, Spencer & Witt (2005)
136. This study was published alongside those by Blind and Jungmittag (2005) and Swann (2005) in
the DTI report on The Empirical Economics of Standards. Temple et al seek to estimate the contribution
of standardisation to long run productivity growth in the UK. Temple first constructed a long term series
counting the number of BSI standards in the catalogue, using data from the BSI „History Book‟ and from
Perinorm. This is a most valuable contribution in its own right. Then, using data from 1948 to 2002,
Temple et al estimate an econometric model of growth in labour productivity in which this measure of
standards shows a positive and statistically significant correlation with labour productivity. Temple et al
find that the direction of causation appears to run from standards to labour productivity growth rather than
vice-versa, and that the impact of standards on labour productivity is a long-run effect. They find that the
elasticity of labour productivity with respect to the number of standards is about 0.05.15
This means that a
10% increase in the standards catalogue is associated with a 0.5% increase in labour productivity, and that
implies that over the period 1948-2002, standards contribute about 13% of the observed growth in labour
productivity in the UK. However, Temple et al stress that standardisation tends to act in conjunction with
other factors such as innovation, and the nature of their data did not allow the role of standards to be
separated from the role of these other inputs. Finally, Temple et al examined whether the progressive
internationalisation of the BSI catalogue over the period (and especially in the 1990s) had any evident
impact on their regression estimates, but found no significant effect.
Blind and Jungmittag (2005) 16
137. This study, also published as part of the DTI report on The Empirical Economics of Standards,
examines the impact of standards on productivity in four EU countries (France, Germany, Italy and UK).
Blind and Jungmittag used data on 12 manufacturing sectors, and constructed measures of the catalogue of
standards in each sector using the Perinorm database and the International Standards Classification (ICS).
With this rich data set, it was possible to estimate a range of models, and to examine the separate impact of
standards and patents on productivity growth. Blind and Jungmittag were also able to study the different
effects of „national‟ and „international‟ standards – where the latter are counted as those standards in the
national catalogue (AFNOR, DIN, UNI and BSI respectively) which are equivalent either to EU standards
(CEN, CENELEC, and ETSI) or to international standards (ISO, IEC, ITU, etc).
14. The results from the papers are conveniently summarised in Blind (2004, Chapter 18).
15. Standards Australia (2007) replicated this model for Australia, but did not find the same results. Using a
different formulation, however, they demonstrated that growth in standards (when combined with growth in
the R&D stock) was correlated with productivity growth.
16. A revised version of this was recently published as Blind and Jungmittag (2008).

37
138. Blind and Jungmittag‟s results are encouragingly similar to those of Temple et al described
above. In most cases, the elasticity of output with respect to standards is positive and statistically
significant, and this is the case whether or patents are also included in the regression model. Their cross-
industry comparisons find an interesting result: in mature (and less R&D intensive) industries, the impact
of standards is important, but in the more R&D intensive industries, patents are more important than
standards. Finally, their attempt to distinguish between the impact of national and international standards
finds an unexpected result. While the estimated effects of the former are positive and significant, the
estimated effects of the latter are minimal and statistically insignificant. However, the authors argue that
this last result needs to be treated with caution because the estimates cover a period of transition.
Maertens and Swinnen (2006)
139. Maertens and Swinnen examine how tightening food standards have impacted on fruit and
vegetable exports from Senegal, and the implications of this for welfare and poverty. They used three
sources of data: (a) statistics on horticulture production and exports from existing data sources; (b)
interviews with nine of the 20 horticulture exporting companies in the Dakar region of Senegal; (c) a large
survey of smallholder farm-households.
140. Maertens and Swinnen make several important findings. First, food and vegetable exports from
Senegal to the EU have increased sharply, despite stricter EU food standards. Second, increased exports
have had a positive impact on incomes of poor households. Third, stricter food standards have led to
structural changes in the supply chain. In particular, they describe a shift from smallholder farming to
large-scale estate production. But fourth, despite this last change, the welfare effects of export growth for
rural households are still positive. Structural change in the supply chain means that local households now
benefit through labour markets rather than through product markets, and indeed the gains within rural
communities have been equitable.
Clougherty and Grajek (2008)
141. We have discussed this study already in sub-Section 2.2. But in addition to its findings on the
implications of ISO 9000 diffusion for trade patterns, they also examine the implications of ISO 9000 for
FDI flows. Clougherty and Grajek argue that the ability of ISO 9000 to act as a quality signal, a common
language, and a device for conflict settling will reduce the transaction costs involved in cross-border
investment, just as in trade. For that reason, they posit that ISO 9000 diffusion should have a similar effect
on FDI as it has on trade. Their empirical work, based on FDI data of OECD countries find that: (a) ISO
9000 diffusion in developed countries does not increase FDI; but (b) ISO 9000 diffusion in developing
countries increases inward FDI (from developed countries into developing countries).
Sanchez et al (2008)
142. The study by Sánchez et al was noted above (sub-Section 2.5). In addition to estimating the
effects of stricter standards on exports from Argentina to OECD countries, Sánchez et al also examine the
consequent implications for labour markets. Once again, using a difference in difference estimator, they
find that more stringent standards led to a marked reduction in export shares, and an associated increase in
the level of skills required by exporting firms. The overall effect on average wages in exporting firms is
negative. They interpret this as follows. Stricter standards raise compliance costs and that reduces the net
prices received by producers. These reductions are passed on to workers in the form of lower wages.
Summary
143. This section is relatively easy to summarise as most of results seem to point in a similar direction.
For that reason, we do not attempt to copy the summary tables as used in Sections 2 and 3 (Tables 3-8).

38
The first three studies of standards and productivity all find a positive relationship between the two in some
EU countries (Germany, UK, France, Italy). The fourth study finds that international standards have lead to
increased exports and household incomes in Senegal. The fifth study found that ISO 9000 diffusion in
developing countries increases FDI (from developed countries into developing countries). Only the last
study finds a negative result: more stringent standards in OECD countries leads to a decline in average
wages in Argentina‟s exporting firms.
5. Inside the ‘Black Box’
144. It was readily apparent from Tables 1 and 2 in Section 2 that there is no single answer to the
question, “how do standards impact on trade?” If we take all those results at face value, then we need to
explore why the results differ from case to case. Part of the reason is that the different studies referred to
different countries, different industries and different measures of standards. But more generally, we shall
see below that the relationship between standards and trade is by no means a simple one and that the
econometric models surveyed in Section 2 represent, at best, very simple „black boxes‟ that disguise a
complex of relationships.
145. Figure 4 overleaf shows an (incomplete) representation of what is to be found inside the „black
box‟. This is based on the author‟s knowledge of the theoretical, empirical and anecdotal evidence on how
standards impact on the economy. We say „incomplete‟, because surely there will be other linkages that
are not made explicit here. But those shown in Figure 4 are probably some of the most important. The
first thing to note is that there are immediately five different routes by which a standard may start to
impact on the economy. And there are many possibilities after that. The simple standards stocks used in
the various studies surveyed here do not (and indeed cannot) distinguish between which of these five initial
routes and which of the subsequent routes an additional standard may take. As we said before, this sort of
„count‟ variable is very much a „mixed bag‟, and will presumably contain a mix of standards that follow
quite different routes through Figure 4. From this, it is readily apparent that according to the mix of
standards counted in any particular stock, we can expect to obtain a different average result. While
perhaps the majority of effects in our diagram are positive, some of those effects are negative. When we
look at the results in Section 2 (Tables 1 and 2) from this perspective, the diversity of results is not
necessarily surprising.
146. For this reason, we believe that a priority for future research must be to open up the „black box‟
and to gather empirical evidence on all the linkages within Figure 4. In what follows, we provide a
preliminary sketch of some of the available empirical evidence on some of the links, in no particular order.
A full elaboration of all the relevant evidence would be a long report in its own right. Some of the items
below refer to one link only while others may refer to several linkages together.17
17. Swann (2000) lists some other evidence relating to some of the other linkages, but obviously this does not
cover material published since 2000.

39
Figure 4. Inside the Standards–Trade ‘Black Box’
Standards
Outsourcing
Prices
Wealth & Welfare
Trade
Barriers to Entry
Transaction Costs
Trust & Risk
Network Effects
Precision
Scale Economies
Compatibility
Measurement
Quality & Safety
Codified Knowledge
Variety Reduction
Competencies
Division of Labour Productivity
Entry / Competition
Innovation
Market Failure
* ‘competencies’ encompass institutions, innovation- and productivity-relevant knowledge, and vision ** ‘barriers to entry’ include compliance costs *** ‘precision’ includes uniformity and consistency
40
a) Standards and Variety
147. In the usual typologies of standards, one is the „variety reduction‟ standard. This may be a
slightly misleading label in that variety reduction is not necessarily an explicit objective of the standards,
but rather the net effect of the standard. Nonetheless, this outcome is highly relevant in this context.
Standards sometimes seek to reduce variety in order to exploit economies of scale. Bongers (1982) gives a
striking example of this in the context of concrete posts. That reduction in variety may in some
circumstances lead to a reduction in trade.
148. On the other hand, the reduction in variety may also lead to a reduction in transaction costs. A
good example of that is given by Raballand and Aldaz-Carroll (2005). They note that the multiplicity of
different standards in pallet sizes increases the transaction costs of would-be exporters. When there is such
a multiplicity, the exporter must unload the traded items from one size of pallet onto another which is
compatible with the destination country standard. Raballand and Aldaz-Carroll show that traders must
therefore carry a stock of pallets of different sizes, and that poses a particular problem for the least
developed countries (LDCs), when there is neither a rental market, nor an exchange market for pallets.
Moreover, exports from the LDCs tend to have a low value per tonne or per unit volume, which means that
LDC exporters are more sensitive to the cost of pallets.
149. An interesting counterpoint to this is the standardization of container sizes, which has
dramatically reduced transaction costs and the shipper‟s transport costs, and has radically changed the
worldwide transport infrastructure (Butter et al, 2007). In the container case, moreover, network
externalities play a major role in the use of standards.
b) Standards, the Division of Labour and Outsourcing
150. A commonplace in economic theory is that is standards can reduce transaction costs, then they
will support the division of labour and the outsourcing (and in some cases, off-shoring) of various
activities. Steinmueller (2005) discusses the role of standards in co-ordinating the division of labour in
industries that produce complex systems (such as civil engineering projects). Grimaldi and Torrisi (2001)
describe the same process at work in the software industry. They also describe the relationship between
standards and codified knowledge – a theme that will recur below.
151. Butter (2007) shows that the fragmentation of production into ever more complex supply chains
is one of the key features of globalisation, and the steady reduction of transaction costs is an important
element in that. Swann (2009, p. 179) illustrates this with particular reference to the globalisation of
personal computer manufacture. Butter and Pattipeilohy (2007) estimate a production function for the
Netherlands covering the period 1972-2001, and find that off-shoring has a clearly positive effect on total
factor productivity (TFP) – indeed this effect is larger than the effect of R&D on productivity.
c) Standards, Codified Knowledge and Institutions
152. Several of the econometric papers described in Sections 2 and 4 suggested that standards can play
an important role as the carrier of codified knowledge. Cowan et al (2000) pay particular attention to the
role of standards in the codification of knowledge. Bénézech et al (2001) look at similar issues, but this
time in the specific context of the ISO 9000 registration process. The ISO 9000 standards provide a
common language, which can be used within firms to help their process of knowledge codification.
Bénézech et al break the standards implementation process into three steps: (1) the starting point of the
implementation; (2) the substance and behavioural characteristics of the production process; and (3) the
impact of ISO 9000 implementation on the firm‟s capacity to accumulate knowledge. When standards are
not consistent and implementation is incomplete, knowledge about products and production does not travel
41
easily. Velkar‟s (2007) case study of wire standards in the nineteenth-century British iron and steel
industry shows how inconsistent standards inhibited the transport and communication of facts about wire
products.
d) Institutions and Trade
153. A popular theme in recent trade studies has been the role of institutions in breaking down barriers
to trade. In Section 2.2, we referred to the work of Kim and Reinert (2009) who found that two aspects of
institutional capacity (informational capacity and conformity capacity) have strong and significant effects
on developing country exports, and that developing countries cope better with stringent standards in food
products when they have stronger institutional capacity. They measured a country‟s conformity capacity by
the extent of diffusion in certification to the ISO 9000 standards.
154. Two other recent studies have also examined the role of institutions in promoting trade.
Berkowitz et al (2006) show how good institutions in the exporter country enhance international trade.
They argue, from a theoretical point of view, that this is of special relevance in the case of trade in
complex products, where it is hard to write a complete contract covering all relevant characteristics of the
product. They find strong empirical evidence for their arguments: countries with good institutions (by their
measures) tend to export more complex products and import more simple products. Islam and Reshef
(2006) also show that good institutional quality can help to promote international trade by reducing
transaction costs. Using a gravity model of bilateral trade, they find that the trade-promoting effects of
good institutions outweigh any trade-reducing effects that arise from differences in legal systems.
e) Standards, Network Effects and Innovation
155. It is well known that in industries such as the information and communication technologies,
standards play an essential role in ensuring compatibility. Such standards can serve to increase network
effects and that in turn supports innovation. Swann (1990) provides a striking example of this in the
context of the PC software industry. Following the emergence of Lotus 1-2-3 as the industry standard
spreadsheet software package during the MS-DOS era (i.e. up to early 1990s), and the decision by Lotus to
open up some of its code to third party software developers, there was a rapid growth in innovative add-ons
for 1-2-3, produced by third party software houses which took advantage of the large network of 1-2-3
users. Langlois and Robertson (1992) find a similar phenomenon in personal computers and stereo
systems.
156. However, this is not the only route by which standards can support innovation. The Community
Innovation Survey for the UK has repeatedly found that standards are an important course of (codified)
knowledge for the innovator. But equally, standards that reduce variety or raise quality standards can act
as a constraint on innovation. Surprisingly, perhaps, Swann (2005) found that the informative role of
standards and the constraining role of standards and regulations are positively correlated. This means that
those innovators who find standards an important source of information for innovation are more likely than
not to find standards and regulations a constraint on innovation. Swann also calculated an optimum age
profile for the standards stock which would maximize the information content of the standards while
minimising the constraining influence of those standards.
f) Measurement and Innovation
157. In addition, those standards that support accurate measurement can also support innovation.
Swann (1999) conjectured that the innovator‟s incentives to produce products with particular
characteristics hinged on the ability of the innovator and the customer to measure (and verify) those
characteristics. King et al (2006) tested this hypothesis using data from the Community Innovation survey

42
and data on the use of the National Measurement System (NMS) by different industrial sectors. They
found that NMS activity has a clear positive and statistically significant influence on product innovation,
but the effects on process innovation are less clear.
g) Standards, Quality and Compliance Costs
158. Jones and Hudson (1996) and Hudson and Jones (2001, 2003) provided important explanations
for some of the econometric results in Section 2 – especially those that find the effects of national
standards on trade exceed the effects of international standards. They show how standards can serve as an
important quality signal in trade and thus help to promote the competitiveness of those that meet stringent
standards. Leland (1979) showed that stringent standards can help to overcome the „lemons‟ problem,
where incomplete and asymmetric information on the quality of products leads to a market failure and a
reduction in average product quality.
159. That is the good side of having stringent standards. The bad side is that they can raise barriers to
entry by increasing compliance costs. The World Bank TBT Survey, discussed in Section 3 has already
shed some light on this, and the econometric study by Maskus et al (2005) estimates the costs of complying
with standards. Such compliance costs will influence whether some exporters find it profitable to start
trading or whether instead they find the barriers to trade are too great. The Maskus et al study uses firm-
level data from 16 developing countries in the World Bank Technical Barriers to Trade (TBT) Survey
Database. They find that standards do increase short-run production costs, and that a 10 percent increase in
investment required to meet compliance costs will raise the variable costs of production by around 1
percent. They also find that the fixed costs of compliance are by no means trivial.
h) Trust and Trade
160. Standards are a mark of trust. Hudson and Jones (2003) use data from the NOP National
Random Omnibus Survey of September 1995 which asked a sample of about 1000 adults in the UK: “How
would you reassure yourself that the household products you buy are safe enough for your purposes?”
Consumers were allowed to cite one or more reassuring factors, and the four most important were:
producer‟s name (30%), self-assessment (26%), the Kite Mark ® symbol of quality (24%) and the fact that
a product conforms with a British Standard (18%). Conformity with other standards was only mentioned
by a small proportion of the sample, leading Jones and Hudson to conclude that UK citizens tended (at that
time) to put more weight on UK standards than international standards.
161. The Kitemark® symbol is perhaps the oldest and best known symbol of trust, integrity and
quality. Kitemark® schemes have been running since 1902 and cover a wide variety of products and
services, including electrical contractors, double glazed windows, printed circuit boards and cattle tags.
Recent research for Kitemark® (2006) found that about 82 percent of customers recognise the Kitemark®
symbol, and of these, 93 percent believe the product is safer as a result of carrying this symbol, and 88
percent consider it is a sign of trust and integrity.
162. Butter and Mosch (2003) have studied the hypothesis that trust helps to reduce transaction costs
and therefore supports trade. They estimate a gravity model of bilateral trade for 25 countries and find that
different measures of trust (taken from the Eurobarometer Survey) have a positive role to play in
promoting trade. They find, moreover, that the causal relationship runs primarily from trust to trade.
6. Conclusions
163. The main purpose of this review has been to ask whether international standards help or hinder
trade. While it might be convenient if there were a unanimous answer to this question, in reality it is not
that simple. However, Tables 1-2 (in Section 2) provided a useful summary of the econometric studies that

43
have sought to estimate that relationship. These are repeated here as Tables 9 and 10, and we try to draw
out as strong a group of conclusions as we can from these tables.
International Standards and Exports
164. Table 9 (Part i) indicates that in most studies, when exporting countries use international
standards, this has in most cases a positive (or at least neutral) effect on their export performance. There
are only two exceptions: M2 (Moenius, 2006a) and BJ3 (Blind and Jungmittag, 2002). The first of these
exceptions refers to trade in agricultural products, and this is one of the sectors in which it is quite often
found that standards restrict trade. Moreover, while the overall effect across all agricultural products is
negative, Moenius also shows that the estimated effects differ substantially between individual products.
The second of these exceptions is a study of bilateral trade between Germany and France, which finds that
German use of international standards has a negative effect on exports to France. This exception is harder
to explain unless one argues, as some do, that DIN standards are often superior to typical international
standards, and hence a switch from DIN to international standards in Germany does not help German
exports. But despite these exceptions, the weight of evidence here is very much towards a positive effect.
Table 9. Effects of Standards and Regulations* on Exports
(i) Effects of International Standards* in Country X on Exports from X
(a) Negative and
Significant (b) Negative (c) Negligible (d) Positive
(e) Positive and
Significant
M2 BJ3 CG2, CG3 BJ1, ST1
BL1, CG1, G1, G2,
KR, M1, M3 BA1
HV, VW
(ii) Effects of National Standards* in Country X on Exports from X
(a) Negative and
Significant (b) Negative (c) Negligible (d) Positive
(e) Positive and
Significant
VB, WS BJ1 BJ3 BL1, M1, M2, M3,
ST1

44
Table 10. Effects of Standards and Regulations* on Imports
(i) Effects of International Standards* in Country X on Imports into X
(a) Negative and
Significant (b) Negative (c) Negligible (d) Positive
(e) Positive and
Significant
G1, M2
CM3, MH2
CG1, CG2, CZ, ST2,
T
BA3
CG3
BL2, BJ2, BJ4, G2,
M1, M3
BA1, BA2, CM1,
CM2, MH1
HV, VW
(ii) Effects of National Standards* in Country X on Imports into X
(a) Negative and
Significant (b) Negative (c) Negligible (d) Positive
(e) Positive and
Significant
CZ, M2
CW1, CW2, SA
VB, D2, F2
BJ2, T BJ4
D1, F1
BL2
F3 M1, M3, ST2
* Studies marked in light grey refer to standards Studies marked in dark grey refer to standards and regulations Studies not marked refer to regulations
National Standards and Exports
165. Table 9 (Part ii) also indicates that when an exporter from country X uses national standards (i.e.
standards specific to country X) that may lead to superior export performance by X. This time there are
just three exceptions: VB (van Beers and van den Bergh, 1997), WS (Wilson et al, 2002), and BJ1 (Blind
and Jungmittag, 2001). The first two exceptions are relatively easy to explain. These are both studies on
the effects of environmental regulations in country X on exports from X. The reason for the negative
effect here is not that these regulations make the products of country X less attractive in export markets,
but that the regulations make it harder for producers in X to remain competitive while also observing strict
environmental regulations. So these two exceptions really are rather different from all the other estimates
in Table 9 Part ii. The third exception is harder to explain – being equivalent to the exception BJ3 in Table
9 Part i. But despite this last, we can once again claim that the weight of evidence here is once again
towards a positive effect.
International Standards and Imports
166. Turning to Table 10, Part i, when the importing countries also adopt international standards, the
most common effect is also to increase imports. But this time, there are four exceptions: M2 (Moenius,
2006a), G1 (Grajek, 2004), CM3 (Chen and Matoo, 2004), MH2 (Michelak et al, 2005). The first of these
(M2) has already arisen as an exception above, and the same comments also apply here.
167. The second exception (G1) has already been discussed in Section 2.2 In regressions using data
on all countries, the diffusion of ISO 9000 in country X promotes exports from X but reduces imports into
X, while in regressions using data on just the OECD countries (G2), the diffusion of ISO 9000 in country
X promotes both exports from X and imports into X. Grajek argues that asymmetry between G1 and G2
can be explained by a substitution effect: ISO 9000 certified firms are more likely to trade with each other

45
more than with other firms, and for that reason the positive impact of ISO 9000 on trade is more
pronounced among the OECD countries (which make heavy use of ISO 9000).
168. The third exception (CM3) was, once again, explained in Section 2.3. Harmonization increases
exports from excluded developed countries but reduces exports from excluded developing countries. Chen
and Mattoo argue that harmonised standards in a region are likely to be quite strict compared to what
developing countries are used to, and as a result any benefits of harmonisation in the form of economies of
scale are outweighed by the increased costs of meeting a stricter standard. By contrast, in developed
countries that are already familiar with strict standards, the benefits of harmonisation outweigh the costs.
The fourth exception (MH2) was discussed in Section 2.5: Michelak et al (2005) offer an explanation for
what seems a rather anomalous result.
169. Despite these exceptions, which can in part be explained, once again we can claim that the weight
of evidence here is very much towards a positive effect.
National Standards and Imports
170. When we turn to Table 10 Part ii, however, the results are much more diffuse. If an importer
uses national standards, that may either facilitate imports or constrain imports: it depends on the study in
question. Focussing on the studies that relate exclusively to standards, the effects are distributed pretty
evenly across Table 10, part ii: four positive effects, four negative, and one negligible. But when we turn
to the studies concerned with regulations (or regulations and standards) the weight of evidence is definitely
towards a negative effect on national standards on imports.
171. Rather than discuss exceptions, it seems more sensible to discuss why the studies involving
regulations find negative effects here. The VB result refers to environmental regulation, as has been
discussed already. The CZ result Czubala et al (2007) finds that EU standards that are not harmonised to
ISO standards tend to constrain imports of clothing and textiles from Africa – which is not really
surprising. The CW1 and CW2 findings (Chen et al, 2006) use standards measures based on survey
results: the variables measure the companies who find that standards and regulations in their export
markets constrain their ability to trade. It is perhaps not surprising that the estimated coefficients from a
regression of imports on these variables should be negative. The SA results (Sánchez et al, 2008) are
based on a difference in difference estimator, and while the results are plausible enough, it is also possible
that the strong negative effect results in part from the way such an estimator will pick up all the factors that
have reduced exports from Argentina. The D2 and F2 results (respectively, Disdier et al, 2007; Fontagné
et al, 2005) relate to the effects of TBT and SPS notifications on imports of agricultural and food products,
and here it is not surprising to find negative effects.
172. In short, whereas the weight of evidence in the three previous categories (international standards
and exports, national standards and exports, international standards and imports) was that the relationships
were positive, here we can‟t make such a claim. Instead, it seems best to conclude that:
the effects on national standards on imports are uncertain: they can be positive or negative;
the effects of national regulations on imports are generally negative.
Other Evidence in our Survey
173. While the main focus of the survey has been on econometric studies of the relationship between
standards and trade, we have also summarised (Section 3) a few surveys of technical barriers to trade. For
the most part, these tend to be preoccupied with standards and regulations as barriers to trade and with the
46
costs that a multiplicity of standards or stringent standards can impose on would-be exporters. Only the
DIN (2000) study focuses mainly on the benefits from standardization. While this miscellany of results is
important and interesting, it is probably fair to say that these findings reflect the specific focus of each
survey.
174. We have also summarised (in Section 4) a few of the studies that look at the impact of a
country‟s standards stock (whether national or international) on its own growth and productivity, on
household incomes and on inward FDI, and these tend to find a positive effect.
175. If the effect of standards on trade is context specific, as it seems to be, then it seems essential to
open up the „black box‟ connecting standards to trade performance if we are to understand the complexities
of this relationship. We do this in Section 5 of the report. This shows a complex of linkages and helps to
explain why there can be no simple answer in the econometric studies described above. We provide a
brief sketch of some of the evidence on a few of the linkages inside the „black box‟, but a full survey of
that evidence would be an invaluable contribution in future research.
Final Remarks
176. It is arguable that to form a balanced opinion of the empirical relationship between standards and
trade, the trade economist must consult with development economists and agricultural economists, on the
one hand, and industrial economists and innovation economists18
on the other. As a broad generalisation,
development and agricultural economists are better placed to see the bad side of standards. They can see
the barriers to trade created, in the main, by rich countries that restrict imports from poor countries –
whether by accident or design. By contrast, industrial economists and innovation economists are better
placed to see the good side of standards. They can see how such standards can open up opportunities for
firms in poor countries to export to the richest countries.19
There is a good side and a bad side to the effects
of standards on trade, and we need to understand when we expect to see the good side, and when by
contrast we expect to see the bad.
18. The present author is best described by this last category: innovation economist.
19. For example, the globalisation of standards in the personal computer industry has allowed firms in the
Philippines to provide some of the components for personal computers sold in Europe.

47
REFERENCES
Baller, S. (2007), “Trade Effects of Regional Standards Liberalization”, Policy Research Working Papers, No. 4124,
World Bank, Washington, DC.
Bénézech, D., G. Lambert, B. Lanoux, C. Lerch and J. Loos-Baroin (2001), “Completion of Knowledge Codification:
An Illustration through the ISO 9000 Standards Implementation Process”, Research Policy, 30 (9), 1395-1407.
Berkowitz, D., J. Moenius and K. Pistor (2006), “Trade, Law and Product Complexity”, The Review of Economics
and Statistics, 88 (2), 363–373.
Blind, K. (2000), The Impact of Technical Standards and Innovative Capacity on Bilateral Trade Flows, Fraunhofer
Institute for Systems and Innovation Research, Karlsruhe.
Blind, K. (2001), “The Impacts of Innovation and Standards on Trade of Measurement and Testing Products:
Empirical Results of Switzerland's Bilateral Trade Flows with Germany, France and the United Kingdom”,
Information Economics and Policy, 13 (4), 439-460.
Blind, K. (2004), The Economics of Standards: Theory, Evidence and Policy, Edward Elgar, Cheltenham.
Blind, K. and A. Jungmittag (2001), The Impacts of Innovation and Standards on German Trade in General and on
Trade with the UK in Particular: A Step Further on Swann, Temple and Shurmer, Fraunhofer Institute for
Systems and Innovation Research, Karlsruhe.
Blind, K. and A. Jungmittag (2002), The Impacts of Innovation and Standards on German-France Trade Flows,
Fraunhofer Institute for Systems and Innovation Research, Karlsruhe.
Blind, K. and J. Jungmittag (2005a), “The Impact of Standards on Productivity in Manufacturing: A Panel Approach
Covering Four Countries and Twelve Sectors”, in The Empirical Economics of Standards, Department of
Trade and Industry, London.
Blind, K. and J. Jungmittag (2005b), “Trade and the Impact of Innovations and Standards: the Case of Germany and
the UK”, Applied Economics, 37 (12), 1385–1398.
Blind, K. and J. Jungmittag (2008), “The impact of patents and standards on macroeconomic growth: a panel
approach covering four countries and 12 sectors”, Journal of Productivity Analysis, 29 (1), 51–60
Blind, K., Grupp, H. and Jungmittag, A. (1999), “The Influence of Innovation and Standardization on
Macroeconomic Development: the case of Germany”, in Jakobs, K. and Williams, R. (eds.), Proceedings of
the First IEEE Conference on Standardization and Innovation in Information Technology, IEEE Service
Center, Piscataway.
Bongers, C. (1982), “Optimal Size Selection in Standardization: A Case Study”, Journal of the Operational Research
Society, 33 (9), 793-799.
Brenton, P., Sheehy, J. and Vancauteren, M. (2001), “Technical Barriers to Trade in the European Union: Importance
for Accession Countries”, Journal of Common Market Studies, 39 (2), 265–284.

48
Butter, Frank A. G. den (2007), “Procurement: The Transaction Costs Perspective in a Globalizing World”,
Tinbergen Institute Discussion Papers, 2007-091/3, Tinbergen Institute, Amsterdam.
Butter, F.A.G. den, S.P.T. Groot, and F. Lazrak (2007), “The Transaction Costs Perspective on Standards as a Source
of Trade and Productivity Growth”, Tinbergen Institute Discussion Papers, 2007-090/3, Tinbergen Institute,
Amsterdam.
Butter, F.A.G. den and R.H.J. Mosch (2003), “Trade, Trust and Transaction Costs”, Tinbergen Institute Discussion
Papers, 2003-082/3, Tinbergen Institute, Amsterdam.
Butter, F.A.G. den and C. Pattipeilohy (2007), “Productivity Gains from Offshoring”, Tinbergen Institute Discussion
Papers, 2007-089/3, Tinbergen Institute, Amsterdam.
Chen, M.X. and A. Mattoo (2004), “Regionalism in Standards: Good or Bad for Trade”, Policy Research Working
Papers, No. 3458, World Bank, Washington, DC.
Chen, M.X., T. Otsuki, J.S. Wilson (2006), “Do Standards Matter for Export Success?”, Policy Research Working
Papers, No. 3809, World Bank, Washington, DC.
Clougherty, J.A. and M. Grajek (2008), “The Impact of ISO 9000 Diffusion on Trade and FDI: A New Institutional
Analysis”, Journal of International Business Studies, 39 (4), 613-633.
Cowan, R., P.A. David and D Foray (2000) “The Explicit Economics of Knowledge Codification and Tacitness”,
Industrial and Corporate Change, 9 (2), 211-253.
Czubala, W., B. Shepherd, and J.S. Wilson (2007), “Help or Hindrance? The Impact of Harmonized Standards on
African Exports”, Policy Research Working Papers, No. 4400, World Bank, Washington, DC.
Dasgupta, S., Mody, A., Roy, S., and D. Wheeler (2001), “Environmental Regulation and Development: A Cross-
Country Empirical Analysis”, Oxford Development Studies, 29 (2), 173-187.
Deutsches Institut für Normung (2000), Economic Benefits of Standardization: Summary of Results, Beuth Verlag
GmbH, Berlin.
Disdier, A.-C., Fontagné, L. and M. Mimouni (2007) “The Impact of Regulations on Agricultural Trade: Evidence
from SPS and TBT Agreements,” CEPII Working Papers, No. 2007-04, Centre d‟Études Prospectives et
d‟Informations Internationelles, Paris.
European Commission (1998), The Single Market Review, Dismantling of Barriers. Technical Barriers to Trade, Sub-
series III: Volume 1, Office for Official Publications of the European Communities. Luxembourg.
Ferrantino, M. (2006), “Quantifying the Trade and Economic Effects of Non-Tariff Measures”, OECD Trade Policy
Working Papers, No. 28, OECD Publishing, Paris.
Fontagné, L., Mimouni, M. and J.-M. Pasteels (2005), “Estimating the Impact of Environmental SPS and TBT on
International Trade”, Integration and Trade Journal, 28 (19), 7-37.
Grajek, M (2004), “Diffusion of ISO 9000 Standards and International Trade”, Discussion Papers, No. SP II 2004 –
16, Wissenschaftszentrum, Berlin.
Grimaldi, R. and S. Torrisi (2001), “Codified-Tacit and General-Specific Knowledge in the Division of Labour
among Firms: A Study of the Software Industry”, Research Policy, 30 (9), 1425-1442.
Henry de Frahan, B. and M. Vancauteren (2006), “Harmonization of Food Regulations and Trade in the Single
Market: Evidence from Disaggregated Data”, European Review of Agricultural Economics, 33 (3), 337-360.

49
Hudson, J. and P. Jones (2001), “Measuring the Efficiency of Stochastic Signals of Product Quality”, Information
Economics and Policy, 13 (1), 35-49,
Hudson, J. and P Jones (2003), International trade in „Quality Goods‟: Signalling Problems for Developing
Countries”, Journal of International Development, 15 (8), 999-1013.
Hudson, J. and P. Jones (2003), “The Impact of Standardization on International Trade”, Homo Oeconomics, 20, 1-
19.
Islam, R., and A. Reshef (2006), “Trade and Harmonization; If your Institutions are Good, does it Matter if they are
Different”, Policy Research Working Papers, No. 3907, World Bank, Washington, DC.
Jones, P. and J. Hudson (1996), “Standardization and the Costs of Assessing Quality”, European Journal of Political
Economy, 12 (2), 355-361.
Jungmittag, A., K. Blind and H. Grupp (1999), “Innovation, Standardisation and the Long-term Production Funtion:
A Co-integration Analysis for Germany 1960-1996”, Zeitschrift für Wirtschafts-und-Sozialwissenschaften,
119, 205-222.
Kee, H.L., A. Nicita and M. Olarreaga (2006), “Estimating Trade Restrictiveness Indices”, Policy Research Working
Papers, No. 3840, World Bank, Washington, DC.
Kim, S.J. and K.A. Reinert (2009), “Standards and Institutional Capacity: An Examination of Trade in Food and
Agricultural Products”, The International Trade Journal, 23 (1), 54 -77.
King, M., R. Lambert, P. Temple and R. Witt (2006), The Impact of the Measurement Infrastructure on Innovation in
the UK, Unpublished Paper, Department of Economics, University of Surrey, Guildford.
Kitemark (2006), Business Standards – Kitemark Research, http://www.bsi-global.com/en/ProductServices/ About-
Kitemark/
Korinek, J., M. Melatos and M.-L. Rau (2008), “A Review of Methods for Quantifying the Trade Effects of Standards
in the Agri-Food Sector”, OECD Trade Policy Working Papers, No. 79, OECD Publishing, Paris.
Langlois, R N. and P L. Robertson (1992), “Networks and Innovation in a Modular System: Lessons from the
Microcomputer and Stereo Component Industries”, Research Policy, 21 (4), 297-313.
Leland, H.E. (1979), “Quacks, Lemons, and Licensing: A Theory of Minimum Quality Standards”, Journal of
Political Economy, 87 (6) , 1328-1346.
Maertens, M. and J.F.M. Swinnen (2006), “Trade, Standards, and Poverty: Evidence from Senegal”, LICOS
Discussion Papers, No. 177/2006, Katholieke Universiteit, Leuven.
Maskus, K.E., T. Otsuki and J.S. Wilson (2001), “An Empirical Framework for Analyzing Technical Regulations and
Trade”, in K.E. Maskus and J.S. Wilson (eds.), Quantifying the Impact of Technical Barriers to Trade: Can it
be Done?, University of Michigan Press, Ann Arbor.
Maskus, K.E., T. Otsuki and J.S. Wilson (2005), “The Cost of Compliance with Product Standards for Firms in
Developing Countries: An Econometric Study”, Policy Research Working Papers, No. 3590, World Bank,
Washington, DC.
Michalek, J.J., J. Hagemejer, V. Roshal, J. Rothert, A. Tovias, A. Pugacewicz, M.. Vancauteren (2005),
“Comparative Analysis of Importance of Technical Barriers to Trade (TBT) for Central and Eastern European
Countries‟ and Mediterranean Partner Countries‟ Exports to the EU”, FEMISE Research Paper, No. FEM 22-
03, Warsaw University, Warsaw.

50
Moenius, J. (1999) “Information Versus Product Adaptation: The Role of Standards in Trade”, Working Paper, No.
11/2499, University of California, San Diego.
Moenius, J. (2004), “Information Versus Product Adaptation: The Role of Standards in Trade”, International
Business and Markets Research Center Working Paper, Kellogg School of Management Working Paper,
Northwestern University, Evanston.
Moenius, J. (2006a) “The Good, the Bad and the Ambiguous: Standards and Trade in Agricultural Products,” IATRC
Summer Symposium, May 28-30, Bonn.
Moenius, J. (2006b), “Do National Standards Hinder or Promote Trade in Electrical Products”, Commended Paper,
IEC Centenary Challenge, http://www.iecchallenge.org/papers/
NIST (2004), Measuring Economic Effects of Technical Barriers to Trade on U.S. Exporters, Planning Report 04-3,
National Institute of Standards and Technology, Washington, DC.
OECD (1999), An assessment of the costs for international trade in meeting regulatory requirements,”
TD/TC/WP(99)8/FINAL, OECD, Paris.
Raballand, G. and E. Aldaz-Carroll (2007), “How Do Differing Standards Increase Trade Costs? The Case of
Pallets”, World Economy, 30 (4), 685-702.
Sánchez, G., M.L. Alzúa and I. Butler (2008), “Impact of Technical Barriers to Trade on Argentine Exports and
Labor Markets”, Documento de Trabajo, No. 79, Centro de Estudios Distributivos, Laborales y Sociales,
Universidad Nacional de La Plata, Buenos Aires.
Shepherd, B. (2007) “Product Standards, Harmonization, and Trade: Evidence from the Extensive Margin”, Policy
Research Working Papers, No. 4390, World Bank, Washington, DC.
Standards Australia (2007), Standards, Innovation and the Australian Economy, Standards Australia, Sydney.
Steinmueller, W. E. (2005), “The Role of Technical Standards in Coordinating the Division of Labour”, in A.
Prencipe, A. Davies and M. Hobday (eds.), The Business of System Integration, Oxford University Press,
Oxford.
Swann, G.M.P. (1990), “Standards and the Growth of a Software Network: A Case Study of PC Applications
Software”, in J. Berg and H. Schumny (eds.), An Analysis of the IT Standardisation Process, Amsterdam:
Elsevier Science Publishers
Swann, G.M.P. (1999), The Economics of Measurement, Department of Trade and Industry, London.
Swann, G.M.P. (2000), The Economics of Standardization, Department of Trade and Industry, London.
Swann, G.M.P. (2005), “Do Standards Enable or Constrain Innovation?”, in The Empirical Economics of Standards,
Department of Trade and Industry, London.
Swann, G.M.P. (2009), The Economics of Innovation: An Introduction, Edward Elgar, Cheltenham.
Swann, G.M.P., P. Temple and M. Shurmer (1996), “Standards and Trade Performance: The British Experience‟,
Economic Journal, 106, 1297-1313.
Temple, P., C. Spencer and R. Witt (2005), “Long Run Growth in the UK: The Role of Standards”, in The Empirical
Economics of Standards, Department of Trade and Industry, London.
51
Temple, P. and G. Urga (1997), “The Competitiveness of UK Manufacturing: Evidence from Imports”, Oxford
Economic Papers, 49 (2), 207-227.
United States International Trade Commission (1998), Global Assessment of Standards Barriers to Trade in the
Information Technology Industry, Publication 3141, United States International Trade Commission,
Washington, DC.
van Beers, C. and J.C.J.M. van den Bergh (1997), “An empirical multi-country analysis of the impact of
environmental regulation on foreign trade flows”, Kyklos, 50 (1), 29-46.
Vancauteren, M. and Weiserbs, D. (2005), “Intra-European Trade of Manufacturing Goods: An Extension of the
Gravity model”, Discussion Paper, No. 2005-26, Département des Sciences Économiques, Université
Catholique, Louvain.
Velkar, A. (2007), “Accurate Measurement and Design Standards: Consistency of Design and the Travel of „Facts‟
Between Heterogeneous Groups”, Working Papers on The Nature of Evidence, No. 18/07, Department of
Economic History, London School of Economics.
Wilson, J.S. and T. Otsuki (2004), “Standards and Technical Regulations and Firms in Developing Countries: New
Evidence from a World Bank Technical Barrier to Trade Survey”, http://siteresources.worldbank.org/
INTRANETTRADE/Resources/Topics/Services/TBT_Data_Description.pdf
Wilson, J.S., T. Otsuki and M. Sewadeh (2002), “Dirty Exports and Environmental Regulation: Do Standards Matter
to Trade?”, Policy Research Working Papers, No. 2806, World Bank, Washington, DC.
WTO (2005) World Trade Report 2005: Exploring the links between Trade, Standards and the WTO, World Trade
Organisation, Geneva.