Embed Size (px)
Citation preview

HE
UN
IE U R O P E A N I N S T I T U T E F O R
CRIME PREVENTION AND CONTROL,
AFFILIATED WITH THE UNITED NATIONS
Edited byS. Harrendorf, M. Heiskanen, S. Malby
INTERNATIONAL STATISTICS on CRIME AND JUSTICE
1
European Institute for United Nations Office on Drugs and Crime (UNODC)Crime Prevention and Control, PO Box 500Affiliated with the United Nations (HEUNI) 1400 ViennaP.O. Box 444 AustriaFIN 00531 HelsinkiFinland HEUNI Publication Series No. 64
Stefan Harrendorf, Markku Heiskanen, Steven Malby (eds.)
International Statistics on Crime and Justice
Helsinki 2010
2
ISBN 978 952 5333 78 7ISSN 1237 4741
Disclaimers
This report has not been formally edited.
The contents of this publication do not necessarily reflect the views or policies of the United Nations, UNODC orcontributory organizations and neither do they imply any endorsement. The designations employed and thepresentation of material in this publication do not imply the expression of any opinion whatsoever on the part ofthe United Nations or UNODC concerning the legal status of any country, territory or city or its authorities, orconcerning the delimitation of its frontiers or boundaries.
3
International Statistics on Crime and Criminal Justice
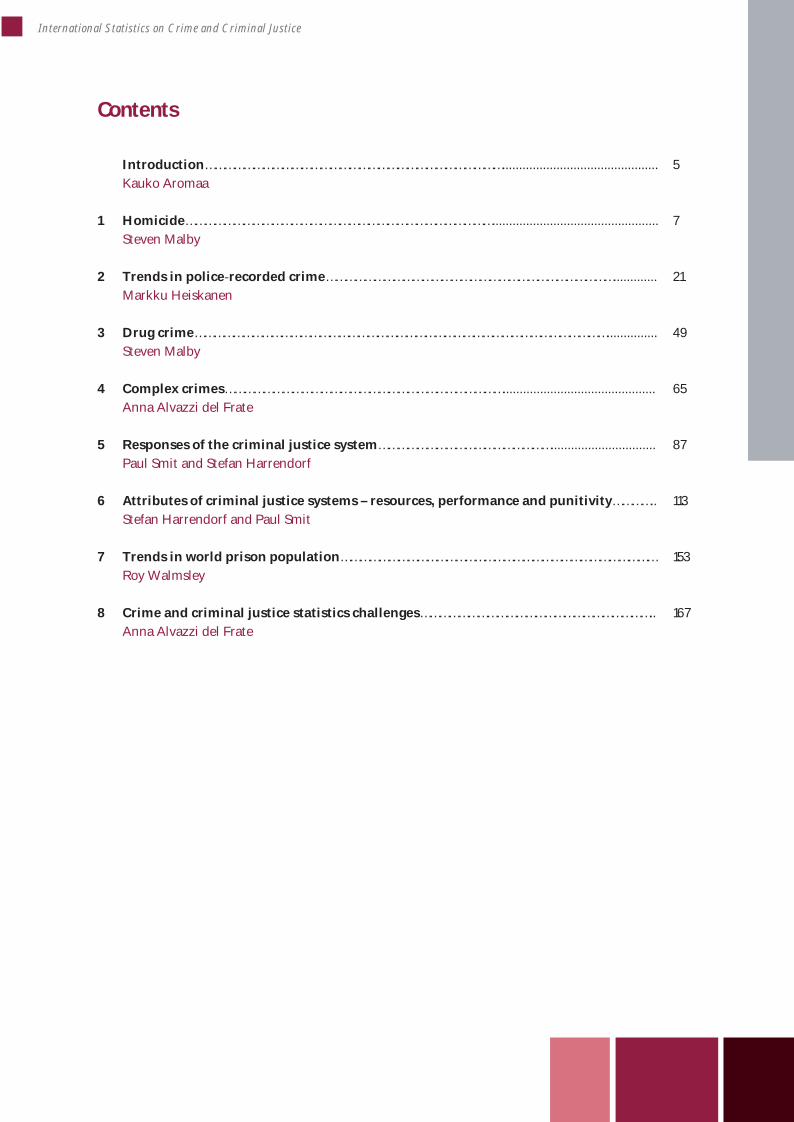
Contents
Introduction…………………………………………………………………………………..............................................Kauko Aromaa
5
1 Homicide…………………………………………………………………………………….................................................Steven Malby
7
2 Trends in police recorded crime……………………………………………………………………………….............Markku Heiskanen
21
3 Drug crime…………………………………………………………………………………………………………………...............Steven Malby
49
4 Complex crimes…………………………………………………………………………….............................................Anna Alvazzi del Frate
65
5 Responses of the criminal justice system………………………………………………...............................Paul Smit and Stefan Harrendorf
87
6 Attributes of criminal justice systems – resources, performance and punitivity…………..Stefan Harrendorf and Paul Smit
113
7 Trends in world prison population………………………………………………………………………………………Roy Walmsley
153
8 Crime and criminal justice statistics challenges………………………………………………………………..Anna Alvazzi del Frate
167

4
5
International Statistics on Crime and Criminal Justice
Intr
oduc
tion
Introduction
Kauko Aromaa*
The United Nations Surveys on Crime Trends andthe Operations Criminal Justice Systems (denotedUN CTS below for the sake of brevity) collectbasic information on recorded crime and onresources of criminal justice systems in the
Its mandate being Europe andNorth America, HEUNI has analysed andreported on the surveys for this part of the worldfrom the very beginning. For other regions of theworld, such reporting has not been achieved.
The present volume, prepared in partnership ofHEUNI and the UNODC, for the first time pullstogether global responses to the UN CTSquestionnaire, the most recent one included hereis UN CTS 10 that allows the analysis of data upto 2006.
In the current report, the improvementintroduced in the previous one (looking only atEurope and North America; Aromaa andHeiskanen 2008) was retained: also this time, thereport addresses a time period of about ten yearsin order to provide more stability to the situationassessment. In a global report, it is more difficultto keep to the ten year framework since manycountries have not responded regularly but datagaps are frequent. In this case, the basic solutionhas been that data for 1996, 2000, and 2006 areused for the ten year (actually, eleven year)perspective to be covered. For many countries,this could be achieved, for many others, one ormore of these years had to be complemented bydata for adjacent years because the countryresponse for one (or several) of the required yearshad not been made available.
Reporting for more recent years has not beenpossible. This may not be satisfactory to thosewho require more up to date information.However, the timeliness of large scalecomparative data has always been a significantproblem and remains one. First of
all, statistical data on crime and criminal justiceare typically not available until after the relevantyear. Country level data on police recorded crimeare often released relatively soon after the shift ofthe year, but statistics on later stages of thecriminal justice procedure are more delayed.Next, disseminating the UN CTS data collectioninstrument to collecting andvalidating the responses, drafting a reporting planand creating a database necessary for the analysis,analysing the data and writing up the report arestages in the process that cannot be avoided, andthey do consume time.
As a consequence, reports of this kind are alwaysproviding results that do not refer to the currentyear or the previous one but will shed light on thesituation 3 4 years back in time. So far, ways tointroduce significant improvements to thisdilemma have not been found. For many, a delayof 3 4 years would seem to be too long for an upto date assessment of the current situation,whether globally or for one region only, evenconsidering that experience has shown that crimedata of the kind analysed here usually do not varyradically over short time periods. A markedimprovement would however require much moreadvanced statistical systems in manytates, and a much higher priority to be given to
the UN data collection exercise than is the casetoday.
Another, even more disturbing observation thathas been made repeatedly is that many
continue to be unable to answer the UNCTS questionnaire at all, or are only able toprovide a partial response. This state of affairs isin part due to a very basic reason: some or all ofthe required data are not available. However, lessexcusable is the situation for many othercountries that are known to possess the requireddata but do not respond.
* Director, European Institute for Crime Prevention and Control, affiliated with the United Nations
states.member
member states,
memberstates
members
6
For those in need of improving their statistics, theUNODC has been working on a support andassistance approach which is also bearing fruit inthe long term. Those that, for amultiplicity of reasons, have failed to respond tothe Surveys although they are in the possession ofthe relevant data, should take this task moreseriously in the future. This would also be in theirown interest as they would benefit from knowingtheir position in a global dataset. Also others inthe global community would be keen to knowhow others have been doing in core issues ofcrime and criminal justice.
Some of the unavoidable delay problems havebeen partially resolved by the UNODC in thatthey publish some data from the countryresponses on their website as soon as they aremade available by the Theadvantage is that the delay is as short as it can beunder the circumstances, where nationalresponses are the basis. Of course, before there isa national response, nothing can be madeavailable. It is therefore of paramount importancethat delays caused by tates areminimized. –The drawback of the UNODCsolution is that the information on the website isnot – and cannot be – validated and processed,leaving the potential user without expertassistance when trying to interpret the data. It ishighly problematic and perhaps not advisable atall to publish raw data of this kind withoutadequate commentary regarding known problemsrelated to its validity and interpretationproblems.
The ten year time span applied should illustratethat for many criteria, it is often of no massiveimportance that the data are never fully up todate: many of the trends displayed can be seen tobe rather stable, meaning that simple basicindicators of features of recorded crime andoperations of the criminal justice system are oftenof a rather robust nature. Consequently, a largeproportion of the presented data and findings,even if outdated, are unlikely to changesignificantly from one year to another.Consequently, the current delay in the timelinessof the presented data is mostly of no majorconcern. The most obvious exceptions are
countries undergoing irregular rapidtransformations – for such countries, however, aUN CTS is hardly of immediate interest anyway.
We have not reproduced the data collectioninstruments in this volume. Due to variouschanges over time, each UN CTS questionnaire isslightly different. The questionnaires can befound in all UN languages at the address:
http://www.unodc.org/unodc/en/data andanalysis/Ninth(Tenth) United Nations Surveyon Crime Trends and the Operations ofCriminal Justice Systems.html
The report comprises eight chapters. They aredesigned to deal with all central issues addressedin the questionnaires. First, police recorded crimeis discussed, with separate chapters on homicides(chapter 1), other police recorded crimes(chapter 2), and drug related crime and drugtrafficking (chapter 3). Also, complex crimes areanalysed separately, such as organised crime, andtrafficking in human beings ( hapter 4). Suchoffences have played a marginal role in traditionalcrime statistics, and in order to improve therelevance of the data on such offences, newsolutions need to be developed. Chapter 5,shifting to the next stage of the criminal justicesystem, presents data on responses of thecriminal justice system, including an innovationwhere attrition issues are being discussed. Aparallel issue to responses of the criminal justicesystem are resources and performance. These arediscussed in 6 where also a discussion onthe punitivity of criminal justice systems isincluded. Next, a presentation on prisonpopulations of the world closes the analysis ofcriminal justice data. The last chapter, finallydiscusses challenges with crime and criminaljustice statistics, arguing for the importance offurther improvements in the area.
The objective of this report is to show potentialusers of international crime data what they couldlearn from these, and provide guidance as torestrictions, pitfalls and strengths of the uniqueset of data that is now available thanks to thecountries that have responded to the UN Surveys.
chapter
c
member states
member states.
member s
7
International Statistics on Crime and Criminal Justice
Hom
icid
e Steven Malby*
Abstract
This chapter presents available data on the crime of intentional homicide – the intentional killing of aperson by another. As one of the most effectively recorded crimes, law enforcement data on intentionalhomicide is typically more readily available than for other crimes. As such, rates of intentional homicide per100,000 population have sometimes been used as a proxy for levels of violent crime or even overall crime.Data from both law enforcement and public health sources may be combined to increase data availabilityand geographic coverage. Results suggest that the highest homicide levels are found in the Americas andAfrica region, with the lowest homicide levels generally in countries in Europe. For those countries wheretrend data is available, the majority show decreasing or stable homicide rates, with the exception of anumber of countries, predominantly in the Americas that show high and increasing rates. Such increasesmay be linked to the challenges of organized crime, drug trafficking, and gang activity. Significant datachallenges remain however, particularly in Africa, where criminal justice data on intentional homicide ispresently very limited.
Introduction
The intentional killing of a person by another(‘intentional homicide’) represents the mostserious end of the spectrum of violent crime.Recent attention on the issue of armed violenceand the growing importance of homicide as anindicator has resulted in increased efforts toimprove statistics at international, regional andnational levels.
The results presented in this chapter deriveprimarily from criminal justice data. Despitevarying definitions, ‘homicide’ is perhaps themost widely collected and reported crime in lawenforcement and criminal justice statistics. Dueto its seriousness, the killing of a person tends tobe recorded more effectively than other crimes.
Nonetheless, the challenges of cross nationalcomparability are considerable. National legalsystems may have different thresholds forcategorising a death as intentional homicide.Whilst intentional homicide usually requires thatthe perpetrator purposefully intends to cause thedeath or serious injury of a victim, in somecountries a death that occurs in the act orattempted act of another serious crime may also
qualify as ‘intentional’ homicide or murder.Infanticide, assault leading to death and killingscarried out by law enforcement officers (actinglegitimately in the line of duty or not) all may ormay not be included in police recorded statistics.In addition, differences in police recordingpractices such as differences in counting units(offences, suspects or cases), whether or notattempted homicide or non intentionalhomicides are included in published figures, andthe point in the investigation at which asuspicious death is classified as homicide all varyas between countries.
Moreover, as forms of organized criminality andstate insecurity become increasingly intertwined,the line between violent deaths that occur inarmed conflict and those that can be labelled‘crime’ is often blurred. Acts which are likely to berecorded by law enforcement and criminal justiceinstitutions as intentional homicide can takeplace in a wide range of contexts, including thehome, family, social or domestic setting, in thecourse of burglary, theft or robbery, or associatedwith gang, organized, or drug related crime.
*Research Officer, United Nations Office on Drugs and Crime (UNODC)
Chapter 1 – Homicide
8
Combining data sources
This chapter differs from others in thispublication in that – for criminal justiceinformation – it draws on data wider than thatreported through the United Nations Survey ofCrime Trends and Operations of Criminal JusticeSystems (UN CTS).
Whilst UN CTS data is included in the analysis,in order to provide as wide a geographic coverageas possible the chapter uses data from otheravailable criminal justice sources. These includeother cross national data sources, such as datacollected and published by the Statistical Officeof the European Communities (Eurostat), theUnited Nations Children’s Fund (UNICEF), theInternational Police Organization (Interpol), andthe Observatorio Centroamericano sobreViolencia (OCAVI). The analysis also makes useof data available at the national level, includingthat published on national police, Ministry ofInterior and Ministry of Justice websites. Prioritywas given to data available at the regional orinternational level over national data due to thefact that cross national data collections (such asthe UN CTS and Eurostat) make use ofstandardized definitions of intentional homicideand are usually supported by extensive metadatathat allows the user to better understand thecontent of reported numbers.
Although this chapter derives its results primarilyfrom such ‘multi source’ police recorded crimestatistics, the fact of a death means thathomicides are usually processed both by themedical system and the criminal justice system,creating two potential sources of administrativestatistics. These two systems measure subtlydifferent phenomenon and – whilst figures can beexpected to show reasonable levels of agreement– they are unlikely to generate identical numbers.In order to provide as complete a picture ofpossible of the level and trend of homicides in theworld, and for comparative purposes, this chapterprovides data available from public health sourcesalongside those from criminal justice. The publichealth sources used are predominantly crossnational, including data published by the WorldHealth Organization (WHO) and the Pan
American Health Organization (PAHO). Publichealth statistics on intentional homicide typicallyconsist of data recorded under the InternationalClassification of Disease (ICD 10) codescorresponding to ‘injuries inflicted by anotherperson with intent to injure or kill, by any means’.For a death to be classified in this category, theremust be sufficient evidence for a medicalprofessional to determine that the cause of deathwas assault and not an accident or self harm.
Whether from criminal justice or public healthsources, it must be remembered that officialstatistics rarely capture the number of actualcriminal events that have occurred. Homicide canbe reported by relatives and witnesses, butobviously cannot be measured through reports byvictims. The quality of homicide figures is alsoaffected by approaches to case recording and thecapacity of national institutions to gather dataand accurately record events.
The capacity gap between developed anddeveloping countries particularly affects thecross national comparison of police recordedcrime statistics, with the result thatadministrative statistics are not a particularlystrong basis for the study of cross nationaldifferences in criminal activity. As shown in thisChapter, the differences between health andpolice statistics are especially marked indeveloping countries. In higher income countries,such as those in West and Central Europe,significant differences also remain for countriesbetween police and health statistics. Suchdifferences may be linked to limitations in thecapacity of police and law enforcement agenciesto identify and record homicide events, and toother factors such as the lethality of assaults.Indeed, the lethality of assaults can be aparticularly important factor in understandingcross national differences and long term trendsin homicides. Evidence suggests that the lethalityof assaults in North America and Western Europefor example has dropped dramatically due todevelopments in medical technology and medicalsupport services (Aebi 2004).
Global homicide levels
Data previously published by the United NationsOffice on Drugs and Crime suggests thatapproximately 490,000 deaths from intentionalhomicide occurred in 2004 (Geneva Declaration2008). This represented a world average homicide
rate in 2004 of 7.6 per 100,000 population. Thedataset used for this calculation focused onmaximum geographic coverage at the expense ofmore recently available data for some countries in
9
International Statistics on Crime and Criminal Justice
Hom
icid
e
order to produce a single global dataset for onepoint in time (UNODC 2008).
In contrast, this chapter takes the approach of‘latest available year’ data in order to provide astimely information as possible, whilst alsomaintaining wide geographic coverage.
In order to represent the distribution of thisnearly half a million annual homicides by regionsof the world, figure 1 below shows the average of a
limited set of countries in each sub region (144countries in total); being those for which at leastone criminal justice and public health value forintentional homicide are available during theperiod 2003 to 2008. The range of countries forwhich data is available for each source alone issomewhat greater and it should be noted thataverage rates calculated on this wider set ofcountries would be different.
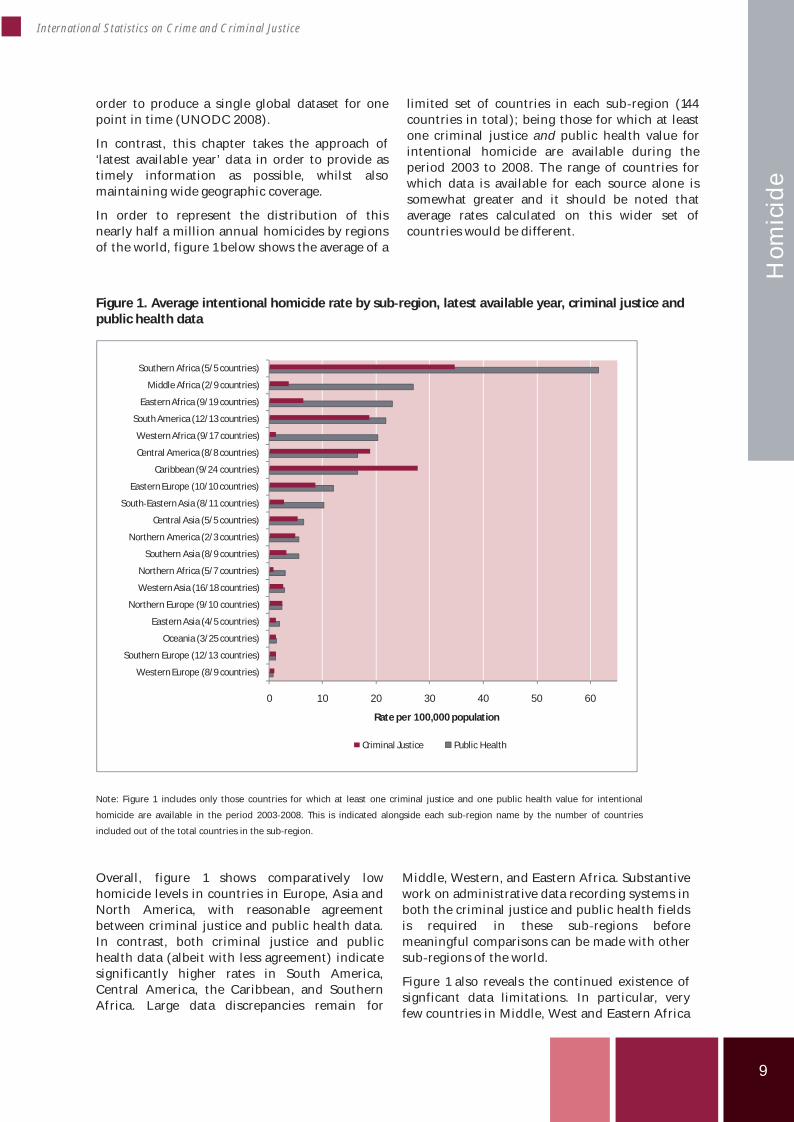
Figure 1. Average intentional homicide rate by sub region, latest available year, criminal justice andpublic health data
Note: Figure 1 includes only those countries for which at least one criminal justice and one public health value for intentional
homicide are available in the period 2003 2008. This is indicated alongside each sub region name by the number of countries
included out of the total countries in the sub region.
Overall, figure 1 shows comparatively lowhomicide levels in countries in Europe, Asia andNorth America, with reasonable agreementbetween criminal justice and public health data.In contrast, both criminal justice and publichealth data (albeit with less agreement) indicatesignificantly higher rates in South America,Central America, the Caribbean, and SouthernAfrica. Large data discrepancies remain for
Middle, Western, and Eastern Africa. Substantivework on administrative data recording systems inboth the criminal justice and public health fieldsis required in these sub regions beforemeaningful comparisons can be made with othersub regions of the world.
Figure 1 also reveals the continued existence ofsignficant data limitations. In particular, veryfew countries in Middle, West and Eastern Africa
0 10 20 30 40 50 60
WesternEurope (8/9 countries)
Southern Europe (12/13 countries)
Oceania (3/25 countries)
Eastern Asia (4/5 countries)
Northern Europe (9/10 countries)
WesternAsia (16/18 countries)
Northern Africa (5/7 countries)
Southern Asia (8/9 countries)
Northern America (2/3 countries)
Central Asia (5/5 countries)
South EasternAsia (8/11 countries)
Eastern Europe (10/10 countries)
Caribbean (9/24 countries)
Central America (8/8 countries)
WesternAfrica (9/17 countries)
South America (12/13 countries)
EasternAfrica (9/19 countries)
Middle Africa (2/9 countries)
Southern Africa (5/5 countries)
Rate per 100,000 population
Criminal Justice Public Health
10
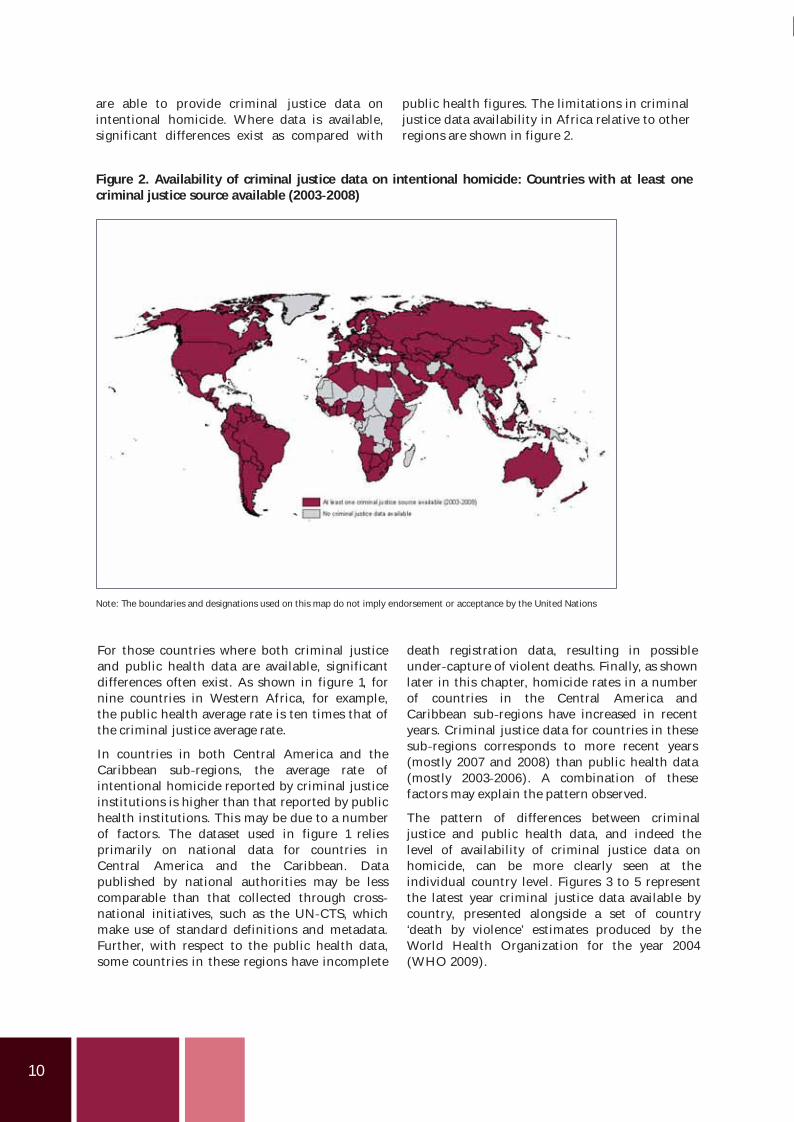
are able to provide criminal justice data onintentional homicide. Where data is available,significant differences exist as compared with
public health figures. The limitations in criminaljustice data availability in Africa relative to otherregions are shown in figure 2.
Figure 2. Availability of criminal justice data on intentional homicide: Countries with at least onecriminal justice source available (2003 2008)
Note: The boundaries and designations used on this map do not imply endorsement or acceptance by the United Nations
For those countries where both criminal justiceand public health data are available, significantdifferences often exist. As shown in figure 1, fornine countries in Western Africa, for example,the public health average rate is ten times that ofthe criminal justice average rate.
In countries in both Central America and theCaribbean sub regions, the average rate ofintentional homicide reported by criminal justiceinstitutions is higher than that reported by publichealth institutions. This may be due to a numberof factors. The dataset used in figure 1 reliesprimarily on national data for countries inCentral America and the Caribbean. Datapublished by national authorities may be lesscomparable than that collected through crossnational initiatives, such as the UN CTS, whichmake use of standard definitions and metadata.Further, with respect to the public health data,some countries in these regions have incomplete
death registration data, resulting in possibleunder capture of violent deaths. Finally, as shownlater in this chapter, homicide rates in a numberof countries in the Central America andCaribbean sub regions have increased in recentyears. Criminal justice data for countries in thesesub regions corresponds to more recent years(mostly 2007 and 2008) than public health data(mostly 2003 2006). A combination of thesefactors may explain the pattern observed.
The pattern of differences between criminaljustice and public health data, and indeed thelevel of availability of criminal justice data onhomicide, can be more clearly seen at theindividual country level. Figures 3 to 5 representthe latest year criminal justice data available bycountry, presented alongside a set of country‘death by violence’ estimates produced by theWorld Health Organization for the year 2004(WHO 2009).
11
International Statistics on Crime and Criminal Justice
Hom
icid
e
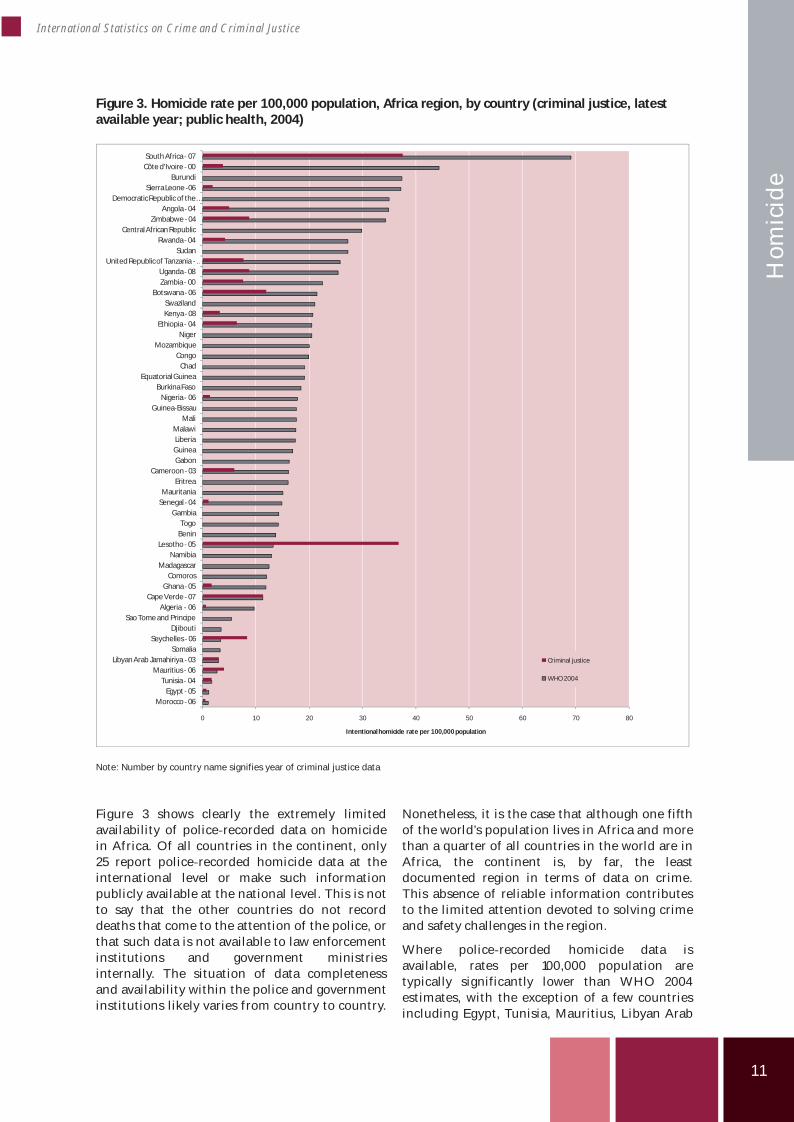
Figure 3. Homicide rate per 100,000 population, Africa region, by country (criminal justice, latestavailable year; public health, 2004)
Note: Number by country name signifies year of criminal justice data
Figure 3 shows clearly the extremely limitedavailability of police recorded data on homicidein Africa. Of all countries in the continent, only25 report police recorded homicide data at theinternational level or make such informationpublicly available at the national level. This is notto say that the other countries do not recorddeaths that come to the attention of the police, orthat such data is not available to law enforcementinstitutions and government ministriesinternally. The situation of data completenessand availability within the police and governmentinstitutions likely varies from country to country.
Nonetheless, it is the case that although one fifthof the world’s population lives in Africa and morethan a quarter of all countries in the world are inAfrica, the continent is, by far, the leastdocumented region in terms of data on crime.This absence of reliable information contributesto the limited attention devoted to solving crimeand safety challenges in the region.
Where police recorded homicide data isavailable, rates per 100,000 population aretypically significantly lower than WHO 2004estimates, with the exception of a few countriesincluding Egypt, Tunisia, Mauritius, Libyan Arab
0 10 20 30 40 50 60 70 80
Morocco 06Egypt 05
Tunisia 04Mauritius 06
Libyan Arab Jamahiriya 03Somalia
Seychelles 06Djibouti
Sao Tome and PrincipeAlgeria 06
Cape Verde 07Ghana 05
ComorosMadagascar
NamibiaLesotho 05
BeninTogo
GambiaSenegal 04Mauritania
EritreaCameroon 03
GabonGuineaLiberiaMalawi
MaliGuinea Bissau
Nigeria 06BurkinaFaso
EquatorialGuineaChad
CongoMozambique
NigerEthiopia 04
Kenya 08Swaziland
Botswana 06Zambia 00Uganda 08
United Republicof Tanzania …Sudan
Rwanda 04CentralAfrican Republic
Zimbabwe 04Angola 04
DemocraticRepublic of the…Sierra Leone 06
BurundiCôte d'Ivoire 00South Africa 07
Intentionalhomicide rate per 100,000 population
Criminal justice
WHO 2004

12
Jamahiriya, and Cape Verde. Further research isneeded to identify ‘true’ underlying homiciderates in countries in Africa. WHO estimates ofdeath by violence rates for the majority ofcountries on the continent (with the exceptionmostly of countries in North Africa) are typicallyhigh, ranging from around 7 to 40 times that ofaverages in Western Europe. Country informationon mortality is not available for the majority ofcountries in Africa and public health values forthese countries are mostly derived from estimatesusing cause of death models. (WHO 2009) Onlyin very few countries are estimates based on causeof death registration data with complete oralmost complete geographic coverage. Whilst theaccuracy of WHO estimates is unknown, at thesame time it is likely that law enforcement andcriminal justice institutions in these countries dosignificantly under capture levels of violentdeaths. This can be due to factors includinglimitations in the capacity of police and lawenforcement agencies to identify and recordhomicide events.
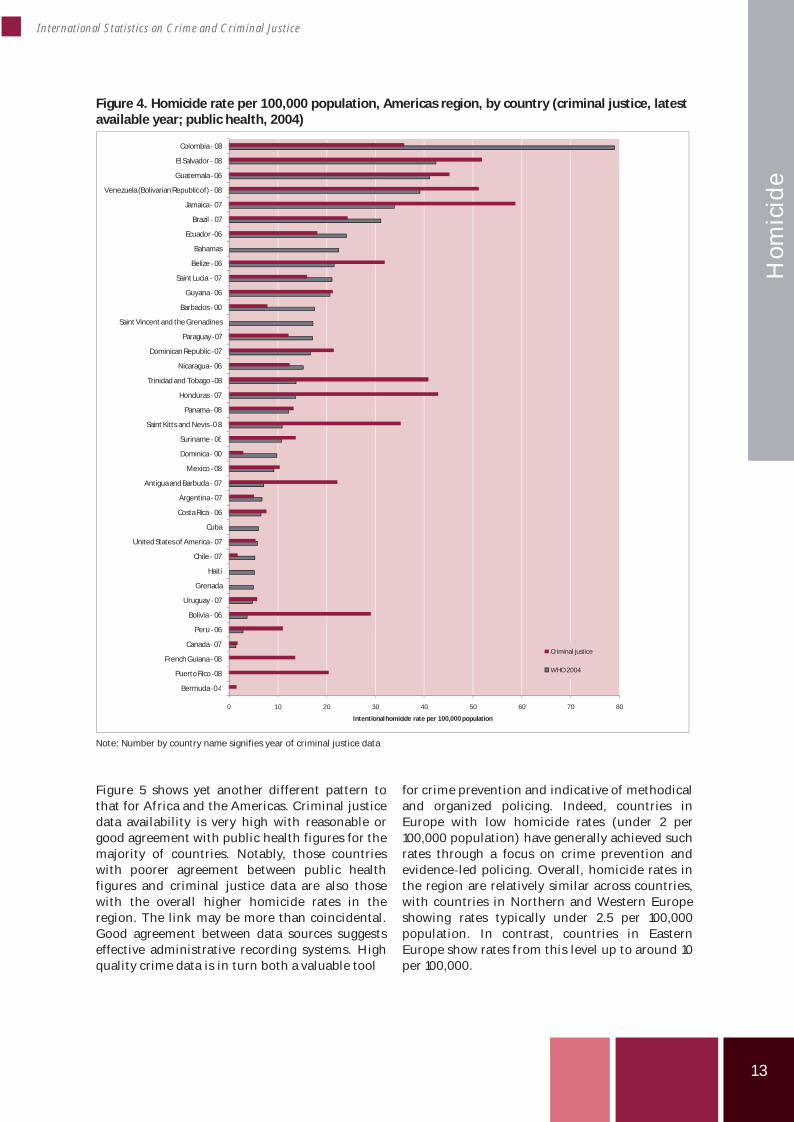
Figure 4 shows significantly greater criminaljustice data availability in the Americas but alsosome significant differences at the country levelas between criminal justice and public healthdata. As noted above, this may be due to anumber of factors, including the fact that someWHO country estimates are not based oncomplete cause of death recording systems andthe fact that a number of countries in theAmericas show significantly increased homiciderates as between 2004 and 2006/2007. As shownlater in this chapter, increasing homicide rates
may explain the significant publichealth/criminal justice differences for Belize,Trinidad and Tobago, Honduras, and Jamaica inparticular.
Both criminal justice and public health data areclear, however, that some of the countries withthe highest homicide rates in the world can befound in the Americas region. El Salvador,Guatemala, Venezuela, Honduras, Trinidad andTobago and Jamaica all show police recordedhomicide rates over 40 per 100,000 population.Colombia has shown declines in police recordedhomicide rates in recent years and according topolice data for 2008 is now well under 40homicides per 100,000 population. WHO 2004data for Colombia estimates a far higher figureand this may be due to both the difference in yearof measurement and the possibility that a higherproportion of conflict related deaths (as opposedto criminal homicide) are captured by publichealth figures.
As shown later in this chapter, a number of thecountries with some of the highest homiciderates have shown significant increases inhomicide rate over the last five years. Researchsuggests that homicide related to intimate, familyor other close/known persons tends to stayrelatively stable, or only change slowly over time.As such, it is likely that particularly high andincreasing homicide rates in a number ofcountries in the Americas are due on the mostpart to increasing presence of organized crime,drug trafficking and gang activity (UNODC2007).
13
International Statistics on Crime and Criminal Justice
Hom
icid
e
Figure 4. Homicide rate per 100,000 population, Americas region, by country (criminal justice, latestavailable year; public health, 2004)
Note: Number by country name signifies year of criminal justice data
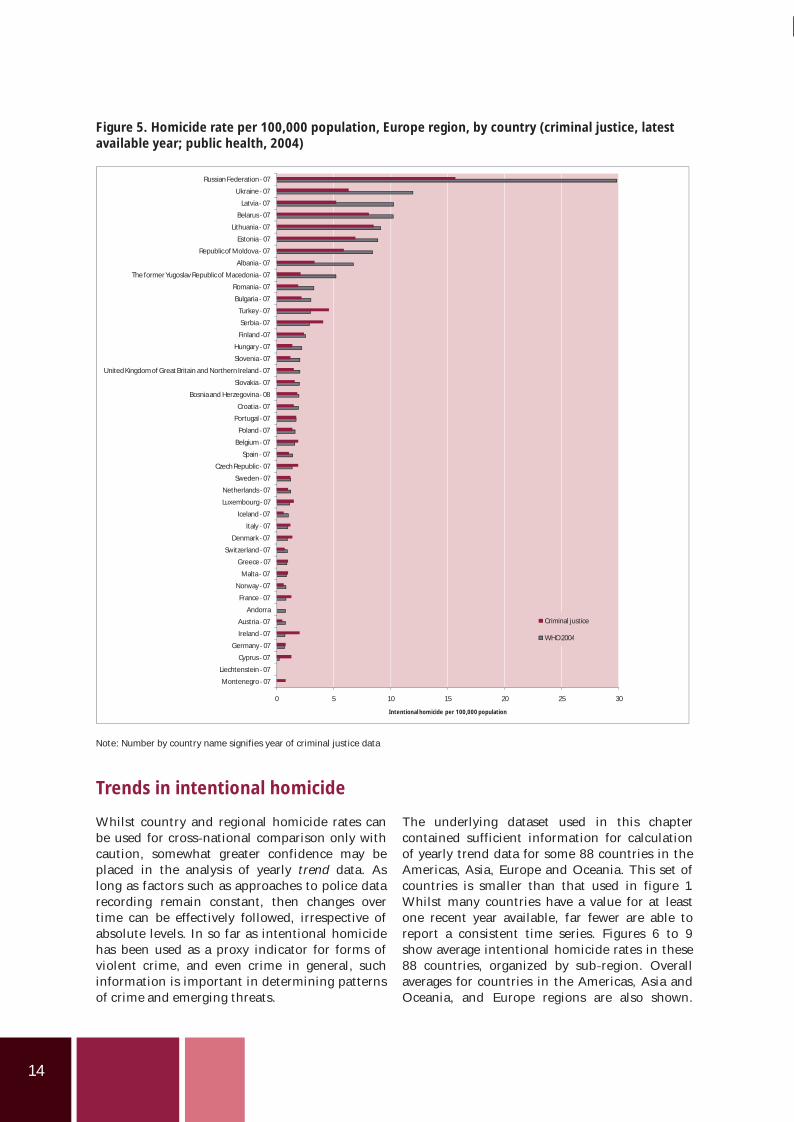
Figure 5 shows yet another different pattern tothat for Africa and the Americas. Criminal justicedata availability is very high with reasonable orgood agreement with public health figures for themajority of countries. Notably, those countrieswith poorer agreement between public healthfigures and criminal justice data are also thosewith the overall higher homicide rates in theregion. The link may be more than coincidental.Good agreement between data sources suggestseffective administrative recording systems. Highquality crime data is in turn both a valuable tool
for crime prevention and indicative of methodicaland organized policing. Indeed, countries inEurope with low homicide rates (under 2 per100,000 population) have generally achieved suchrates through a focus on crime prevention andevidence led policing. Overall, homicide rates inthe region are relatively similar across countries,with countries in Northern and Western Europeshowing rates typically under 2.5 per 100,000population. In contrast, countries in EasternEurope show rates from this level up to around 10per 100,000.
0 10 20 30 40 50 60 70 80
Bermuda 04
PuertoRico 08
FrenchGuiana 08
Canada 07
Peru 06
Bolivia 06
Uruguay 07
Grenada
Haiti
Chile 07
UnitedStates of America 07
Cuba
CostaRica 06
Argentina 07
AntiguaandBarbuda 07
Mexico 08
Dominica 00
Suriname 06
SaintKitts and Nevis 0 8
Panama 08
Honduras 07
Trinidad and Tobago 08
Nicaragua 06
Dominican Republic 07
Paraguay 07
SaintVincent and the Grenadines
Barbados 00
Guyana 06
Saint Lucia 07
Belize 06
Bahamas
Ecuador 06
Brazil 07
Jamaica 07
Venezuela (Bolivarian Republicof) 08
Guatemala 06
El Salvador 08
Colombia 08
Intentionalhomicide rate per 100,000 population
Criminal justice
WHO 2004
14
Figure 5. Homicide rate per 100,000 population, Europe region, by country (criminal justice, latestavailable year; public health, 2004)
Note: Number by country name signifies year of criminal justice data
Trends in ntentional omicide
Whilst country and regional homicide rates canbe used for cross national comparison only withcaution, somewhat greater confidence may beplaced in the analysis of yearly trend data. Aslong as factors such as approaches to police datarecording remain constant, then changes overtime can be effectively followed, irrespective ofabsolute levels. In so far as intentional homicidehas been used as a proxy indicator for forms ofviolent crime, and even crime in general, suchinformation is important in determining patternsof crime and emerging threats.
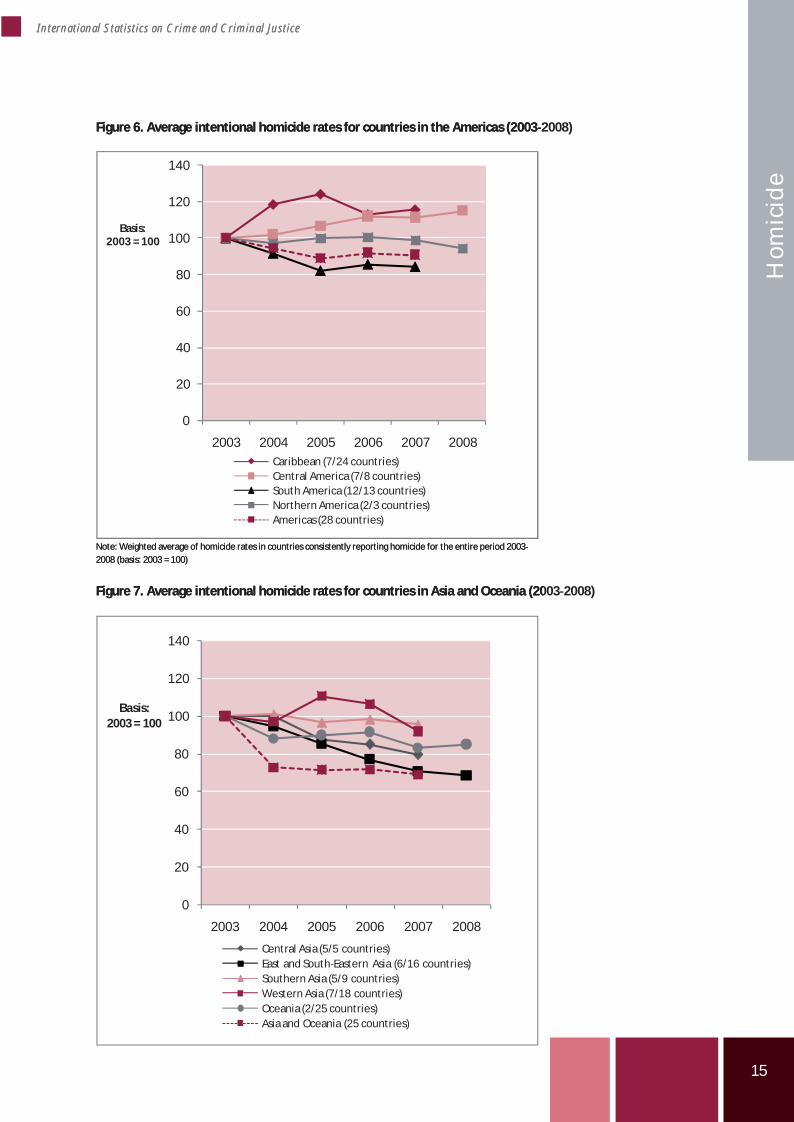
The underlying dataset used in this chaptercontained sufficient information for calculationof yearly trend data for some 88 countries in theAmericas, Asia, Europe and Oceania. This set ofcountries is smaller than that used in figure 1.Whilst many countries have a value for at leastone recent year available, far fewer are able toreport a consistent time series. Figures 6 to 9show average intentional homicide rates in these88 countries, organized by sub region. Overallaverages for countries in the Americas, Asia andOceania, and Europe regions are also shown.
0 5 10 15 20 25 30
Montenegro 07
Liechtenstein 07
Cyprus 07
Germany 07
Ireland 07
Austria 07
Andorra
France 07
Norway 07
Malta 07
Greece 07
Switzerland 07
Denmark 07
Italy 07
Iceland 07
Luxembourg 07
Netherlands 07
Sweden 07
CzechRepublic 07
Spain 07
Belgium 07
Poland 07
Portugal 07
Croatia 07
Bosniaand Herzegovina 08
Slovakia 07
United Kingdomof GreatBritain and Northern Ireland 07
Slovenia 07
Hungary 07
Finland 07
Serbia 07
Turkey 07
Bulgaria 07
Romania 07
The formerYugoslav Republicof Macedonia 07
Albania 07
Republicof Moldova 07
Estonia 07
Lithuania 07
Belarus 07
Latvia 07
Ukraine 07
Russian Federation 07
Intentionalhomicide per 100,000 population
Criminal justice
WHO2004
i h
15
International Statistics on Crime and Criminal Justice
Hom
icid
e
Figure 6. Average intentional homicide rates for countries in the Americas (2003 2008)
Note: Weighted average of homicide rates in countries consistently reporting homicide for the entire period 20032008 (basis: 2003 = 100)
Figure 7. Average intentional homicide rates for countries in Asia and Oceania (2003 2008)
0
20
40
60
80
100
120
140
2003 2004 2005 2006 2007 2008
Basis:2003 = 100
Caribbean (7/24 countries)Central America (7/8 countries)South America (12/13 countries)Northern America (2/3 countries)Americas (28 countries)
International Statistics on Crime and Criminal Justice
Figure 6. Average intentional homicide rates for countries in the Americas (2003 2
Note: Weighted average of homicide rates in countries consistently reporting homicide for the entire period 20032008 (basis: 2003 = 100)
Figure 7. Average intentional homicide rates for countries in Asia and Oceania (20
0
20
40
60
80
100
120
140
2003 2004 2005 2006 2007 2008
Basis:2003 = 100
Caribbean (7/24 countries)Central America (7/8 countries)South America (12/13 countries)Northern America (2/3 countries)Americas (28 countries)
0
20
40
60
80
100
120
140
2003 2004 2005 2006 2007 2008
Basis:2003 = 100
Central Asia (5/5 countries)East and South Eastern Asia (6/16 countries)Southern Asia (5/9 countries)Western Asia (7/18 countries)Oceania (2/25 countries)Asia and Oceania (25 countries)

16
Figure 8. Average intentional homicide rates for countries in Europe (2003 – 2008)
At the regional level, average intentionalhomicide rates recorded by criminal justiceinstitutions decreased over the time period forcounties in Asia and Oceania and Europe. Theystayed largely constant for countries in theAmericas. At the sub regional level however,sub regions with high homicide rates such asCentral America and the Caribbean showedaverage increases over time. Nonetheless, subregional rates in general changed reasonableslowly and did not exhibit unpredictable largeincreases or decreases from year to year.
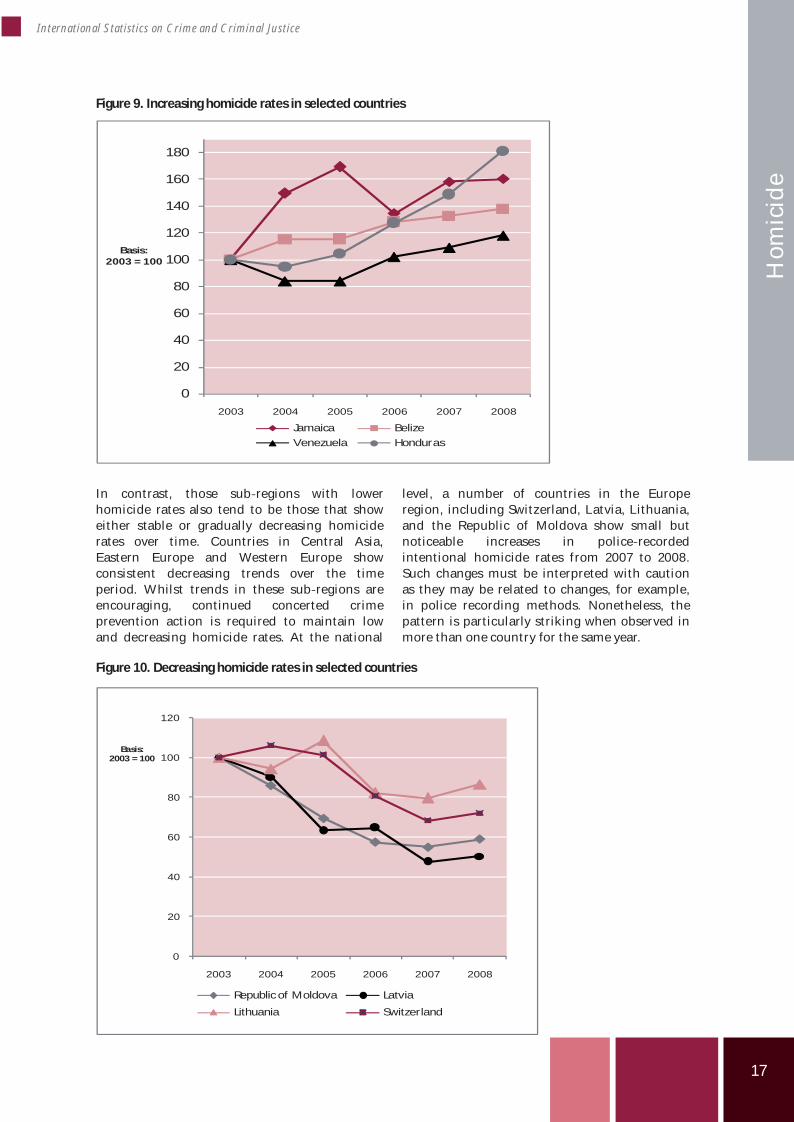
The story can be different at national level. Asshown in figure 9, countries in the CentralAmerica and Caribbean sub regions such as
Belize, Guatemala, Honduras, Jamaica, Trinidadand Tobago, as well as in Venezuela, showsignificant increases in homicide rates in recentyears. According to police statistics, thehomicide rate in Honduras, for example,approximately doubled between 2004 and 2008.(UNODC 2010) Increases in homicide rates inthe Central America and Caribbean sub regionsmay be linked to homicide associated with gang,drug related or organized crime. The drug tradefuels crime in numerous ways, through violencelinked to trafficking, by normalizing illegalbehaviour, by diverting criminal justice resourcesfrom other activities, and importantly withrespect to homicide, by contributing to thewidespread availability of firearms.
0
20
40
60
80
100
120
140
2003 2004 2005 2006 2007 2008
Basis:2003 = 100
Eastern Europe (10/10 countries)Northern Europe (10/10 countries)Southern Europe (9/13 countries)Western Europe (6/9 countries)Europe (35 countries)
17
0
20
40
60
80
100
120
2003 2004 2005 2006 2007 2008
Basis:2003 = 100
Republic of Moldova Latvia
Lithuania Switzerland
International Statistics on Crime and Criminal Justice
Hom
icid
e
Figure 9. Increasing homicide rates in selected countries
In contrast, those sub regions with lowerhomicide rates also tend to be those that showeither stable or gradually decreasing homiciderates over time. Countries in Central Asia,Eastern Europe and Western Europe showconsistent decreasing trends over the timeperiod. Whilst trends in these sub regions areencouraging, continued concerted crimeprevention action is required to maintain lowand decreasing homicide rates. At the national
level, a number of countries in the Europeregion, including Switzerland, Latvia, Lithuania,and the Republic of Moldova show small butnoticeable increases in police recordedintentional homicide rates from 2007 to 2008.Such changes must be interpreted with cautionas they may be related to changes, for example,in police recording methods. Nonetheless, thepattern is particularly striking when observed inmore than one country for the same year.
Figure 10. Decreasing homicide rates in selected countries
0
20
40
60
80
100
120
140
160
180
2003 2004 2005 2006 2007 2008
Basis:2003 = 100
Jamaica Belize
Venezuela Honduras
18
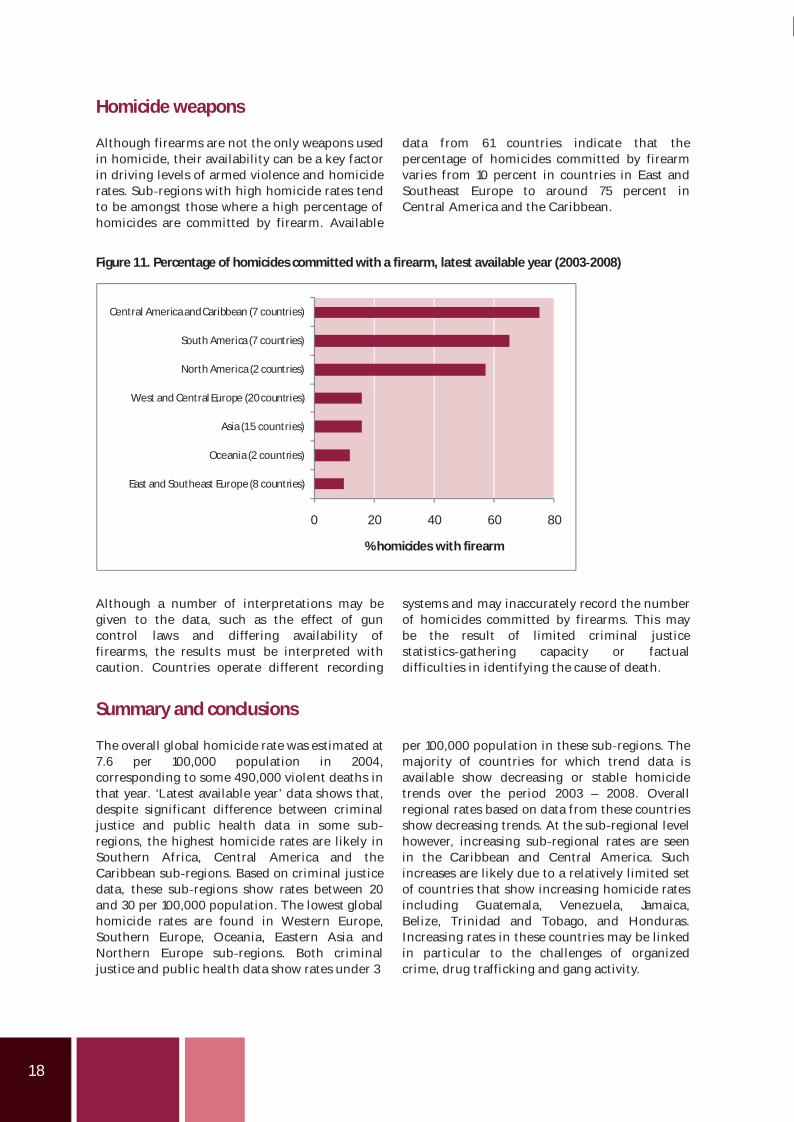
Homicide weapons
Although firearms are not the only weapons usedin homicide, their availability can be a key factorin driving levels of armed violence and homiciderates. Sub regions with high homicide rates tendto be amongst those where a high percentage ofhomicides are committed by firearm. Available
data from 61 countries indicate that thepercentage of homicides committed by firearmvaries from 10 percent in countries in East andSoutheast Europe to around 75 percent inCentral America and the Caribbean.
Figure 11. Percentage of homicides committed with a firearm, latest available year (2003 2008)
Although a number of interpretations may begiven to the data, such as the effect of guncontrol laws and differing availability offirearms, the results must be interpreted withcaution. Countries operate different recording
systems and may inaccurately record the numberof homicides committed by firearms. This maybe the result of limited criminal justicestatistics gathering capacity or factualdifficulties in identifying the cause of death.
Summary and conclusions
The overall global homicide rate was estimated at7.6 per 100,000 population in 2004,corresponding to some 490,000 violent deaths inthat year. ‘Latest available year’ data shows that,despite significant difference between criminaljustice and public health data in some subregions, the highest homicide rates are likely inSouthern Africa, Central America and theCaribbean sub regions. Based on criminal justicedata, these sub regions show rates between 20and 30 per 100,000 population. The lowest globalhomicide rates are found in Western Europe,Southern Europe, Oceania, Eastern Asia andNorthern Europe sub regions. Both criminaljustice and public health data show rates under 3
per 100,000 population in these sub regions. Themajority of countries for which trend data isavailable show decreasing or stable homicidetrends over the period 2003 – 2008. Overallregional rates based on data from these countriesshow decreasing trends. At the sub regional levelhowever, increasing sub regional rates are seenin the Caribbean and Central America. Suchincreases are likely due to a relatively limited setof countries that show increasing homicide ratesincluding Guatemala, Venezuela, Jamaica,Belize, Trinidad and Tobago, and Honduras.Increasing rates in these countries may be linkedin particular to the challenges of organizedcrime, drug trafficking and gang activity.
0 20 40 60 80
East and Southeast Europe (8 countries)
Oceania (2 countries)
Asia (15 countries)
West and Central Europe (20countries)
North America (2 countries)
South America (7 countries)
Central America andCaribbean (7 countries)
% homicides with firearm
19
International Statistics on Crime and Criminal Justice
Hom
icid
e
References
Aebi M F 2004. Crime Trends in Western Europefrom 1990 to 2000. European Journal on CriminalPolicy and Research, Vol. 10, Nos. 2 3, 163 86
Geneva Declaration 2009. Global Burden ofArmed Violence Report, Geneva DeclarationSecretariat. Available at:www.genevadeclaration.org
UNODC 2007. Crime and Development inCentral America: Caught in the crossfire. UnitedNations Publication Sales No. B.07.IV.5
UNODC 2008. United Nations Office on Drugsand Crime, International Homicide Statistics
2004. Available at:http://www.unodc.org/unodc/en/data andanalysis/ihs.html
UNODC 2010. United Nations Office on Drugsand Crime, homicide statistics. Available at:http://www.unodc.org/unodc/en/data andanalysis/homicide.html
WHO 2009. World Health Organization diseaseand injury country estimates. Available at:http://www.who.int/healthinfo/global_burden_disease/estimates_country/en/index.html

20
21
International Statistics on Crime and Criminal Justice
Polic
e Re
cord
ed C
rim
e Chapter 2 – Trends in Police Recorded Crime
Markku Heiskanen*
Abstract
This chapter presents prevalence rates and trends on five “traditional” crimes: assault, rape, robbery,burglary and motor vehicle theft. Also data on kidnapping and crime suspects are shown. The source ofinformation is the United Nations Survey of Crime Trends and Operations of Criminal Justice Systems (UNCTS) covering the years 1996 2006. The results of this chapter are based on police data and describetherefore only those crimes that are recorded by the police. In general, it seems that recorded propertycrimes, burglaries and motor vehicle thefts, have decreased. Rapes and robberies have slightly increased, andassaults have increased considerably. The average level of kidnappings has not changed. The largedifferences in crime between regions and countries can partly be explained by diverging criminalisation,efficiency of the criminal justice systems and recording practices. Country level results show that especiallythe latest data is often from Western Europe, North America and Oceania. A smaller number of countriesare represented from Africa and Latin America, but even the scarce available information shows that crimeis common in these areas. In the Asian region, the level of recorded crimes is lower than in other regions.
Introduction
Police recorded crime is, as known, notequivalent to “all” crime. A well known fact isthat a large proportion of “all” crime remainsunrecorded. Recorded crime may varysignificantly as a consequence of dissimilarreporting rates and recording practices. In theUN CTS, the total of all recorded crimes wasincluded. However, the crimes comprised in thefigure for total crime are in practice incomparableacross countries, because the scope of criminalcodes in different countries is far from identical.Furthermore, the concept of total crime is veryabstract making it very difficult to interpret anyfigures on this level.
Data on recorded crime, collected by the UNCTS, is available for over 100 countries. Thenumber of countries to be included in theanalysis can be maximised if we focus on certaincommon crime categories. Both rate comparisonsand trends of those particular crimes can bepresented. Country level figures should, however,rather be seen as examples than as comparableindicators.
Levels and trends of the following recordedcrimes are described in this chapter: assault, rape,robbery, burglary, motor vehicle theft andkidnapping. Assault, rape, robbery, burglary and
motor vehicle theft represent types of offencesthat are common in many countries. Kidnappingis a more serious crime that violates severely thepersonal integrity of the victim. In the end of thechapter, also total rates of persons suspected areanalysed. Analysis of homicide has not beenincluded here, because a separate chapter hasbeen devoted to lethal violence.
The crimes are reported first by presentingregional estimates of the volume of recordedoffences. Non weighted median values of thecrime rates (crimes / 100,000 population) areused in the analysis. This means that the rates oflarge and small countries have equal weight whencalculating the median. The choice is based onthe argument that we often compare crime ratesbetween countries without taking into accountthe size of the country. On the other hand, ifcountries would be represented by the actualnumber of crimes, very large countries wouldtotally dominate their regions. The disadvantageof the chosen method is that we cannot say, forinstance, how common rapes are in Europeoverall. Accurate regional comparisons arehowever impossible, because not all countrieshave responded to the UN CTS. Furthermore,countries with a population of less than 100,000were excluded from the analysis.
* Senior Research Officer, European Institute for Crime Prevention and Control,affiliated with the United Nations (HEUNI)
22
Figures are presented also on the country level.These comparisons are based on latest availabledata since the year 2000. The results areinterpreted against the metadata collected in thesurvey. Crime definitions differ between thecountries because of different penal codes, anddissimilar reporting behaviour and recordingpractices; consequently the differences of crimelevels in different countries may be based ondifferent definitions, reporting behaviour andrecording practices rather than differences inactual crime. Therefore trend analysis is a morefruitful approach as it shows how crime hasdeveloped. The problem in trend analysis is that
the available data will be considerably reducedwhen describing the trends between 1996 20012006 because of missing data from manycountries.
Victim surveys (e.g. van Dijk et al. 2007) providemore extensive and comparable data of criminalvictimisation of households than the policerecords, since they capture also crimes that arenot reported to the police, and because similarcrime definitions can be applied in theparticipating countries. This Chapter focuses onan overview of the results of the UN CTS,comprising police data only.
Assault
According to the definition in the Crime TrendsSurvey questionnaire: “Assault may beunderstood to mean physical attack against thebody of another person, including battery butexcluding indecent assault”. The respondentswere asked whether the definition was applied intheir countries in the 2005 2006 survey. One halfof the 80 countries that provided data on assaultsin the 2005 2006 survey replied that they hadapplied this standard definition. Many of thosecountries that did not say that they used the basicdefinition did also not specify the difference inthe definition they had applied. Therefore theproportion of the countries that were followingthe standard definition is probably higher than 50per cent. However, applying the standarddefinition does not yet guarantee thecomparability; 20 per cent of the countries repliedthat their data on assault included threats, andalmost 60 per cent said that they includedpunching and/or slapping. The inclusion ofthreats and punching/slapping may increase thenumber of assaults. On the other hand, in somecountries the penal code limits assaults tocomprise incidents causing visible injuries. Thebasic standard definition is therefore not accurateenough for reliable comparison.
In the 10th UN CTS, the respondents were askedwhether a distinction was made in their countrybetween aggravated and simple assault,depending on the degree of the resulting injury. Ifyes, they were asked for the main criteria for thedistinction. Nearly one half of the countriesmade the distinction, but the criteria for thedistinction differed. For instance, the Canadianresponse stated that “simple assault is the least
serious form of assault and includes pushing,slapping, punching and face to face verbalthreats. Aggravated assault involves wounding,maiming, disfiguring or endangering the life ofsomeone.” Some countries defined the distinctionby the resulting days of medical care or disabilityto work. Because some countries did not make thedistinction between simple and major assault,there are fewer data on major assault and theseare also less comparable.
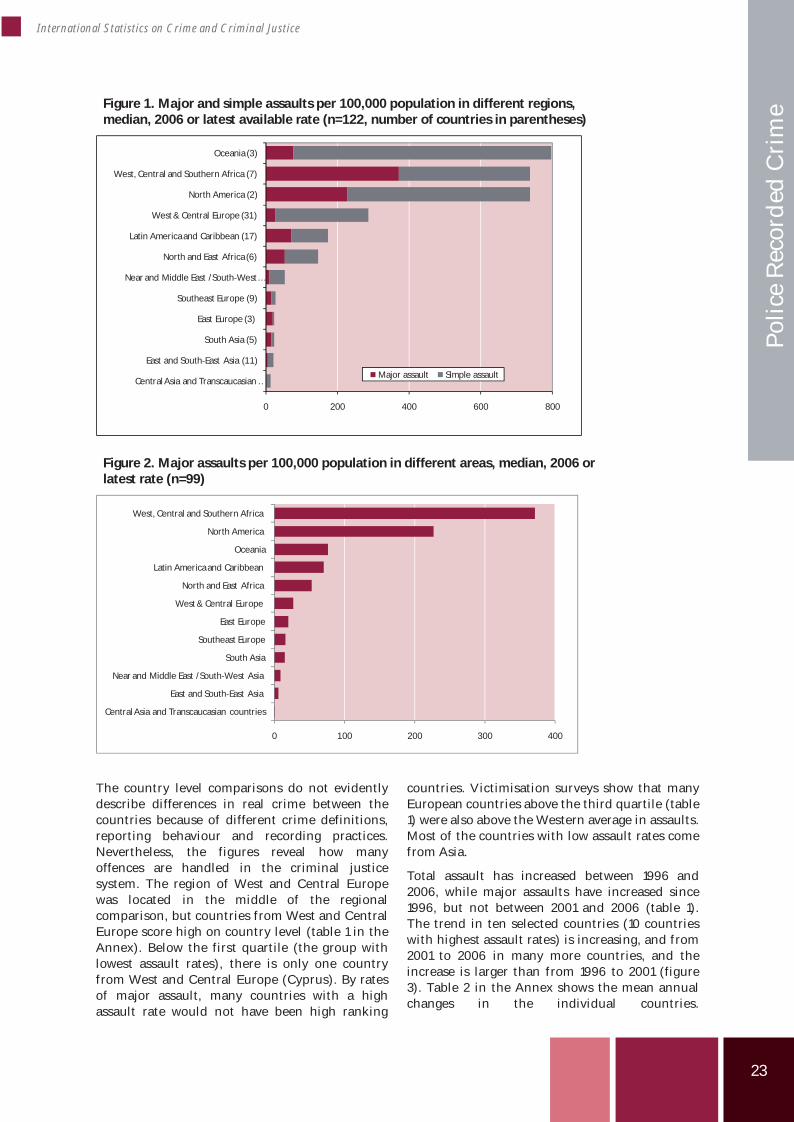
Large differences in the police recorded assaultsexist between Oceania, West, Central andSouthern Africa, North America and Asia,Southeast and East Europe. West and CentralEurope are located between these extremes(figure 1). West, Central and Southern Africashow the highest rates of reported major assault(nearly 50 % of all assaults in the region), while inOceania nine out of ten assaults were simpleassaults. The difference between the Europeansub regions that was clearly visible in all assaultsdecreases considerably for major assaults (figure2). Simple assault recorded by the police isuncommon in East and Southeast Europe, but inWest and Central Europe over 90 per cent ofassaults were simple ones.
According to victimisation surveys, thedifferences in assaults and threats between NorthAmerica and West & Central Europe are small,and the figures from the countries of Oceania aresomewhat higher. Unfortunately, the lastinternational crime victimisation surveys areavailable for these regions only (van Dijk et al.2007, 81).
23
International Statistics on Crime and Criminal Justice
Polic
e Re
cord
ed C
rim
e Figure 1. Major and simple assaults per 100,000 population in different regions,median, 2006 or latest available rate (n=122, number of countries in parentheses)
0 200 400 600 800
Central Asia and Transcaucasian …
East and South East Asia (11)
South Asia (5)
East Europe (3)
Southeast Europe (9)
Near and Middle East /South West…
North and East Africa (6)
Latin Americaand Caribbean (17)
West& Central Europe (31)
North America (2)
West, Central and Southern Africa (7)
Oceania (3)
Major assault Simple assault
Figure 2. Major assaults per 100,000 population in different areas, median, 2006 orlatest rate (n=99)
0 100 200 300 400
Central Asia and Transcaucasian countries
East and South East Asia
Near and Middle East /South West Asia
South Asia
Southeast Europe
East Europe
West& Central Europe
North and East Africa
Latin Americaand Caribbean
Oceania
North America
West, Central and Southern Africa
The country level comparisons do not evidentlydescribe differences in real crime between thecountries because of different crime definitions,reporting behaviour and recording practices.Nevertheless, the figures reveal how manyoffences are handled in the criminal justicesystem. The region of West and Central Europewas located in the middle of the regionalcomparison, but countries from West and CentralEurope score high on country level (table 1 in theAnnex). Below the first quartile (the group withlowest assault rates), there is only one countryfrom West and Central Europe (Cyprus). By ratesof major assault, many countries with a highassault rate would not have been high ranking
countries. Victimisation surveys show that manyEuropean countries above the third quartile (table1) were also above the Western average in assaults.Most of the countries with low assault rates comefrom Asia.
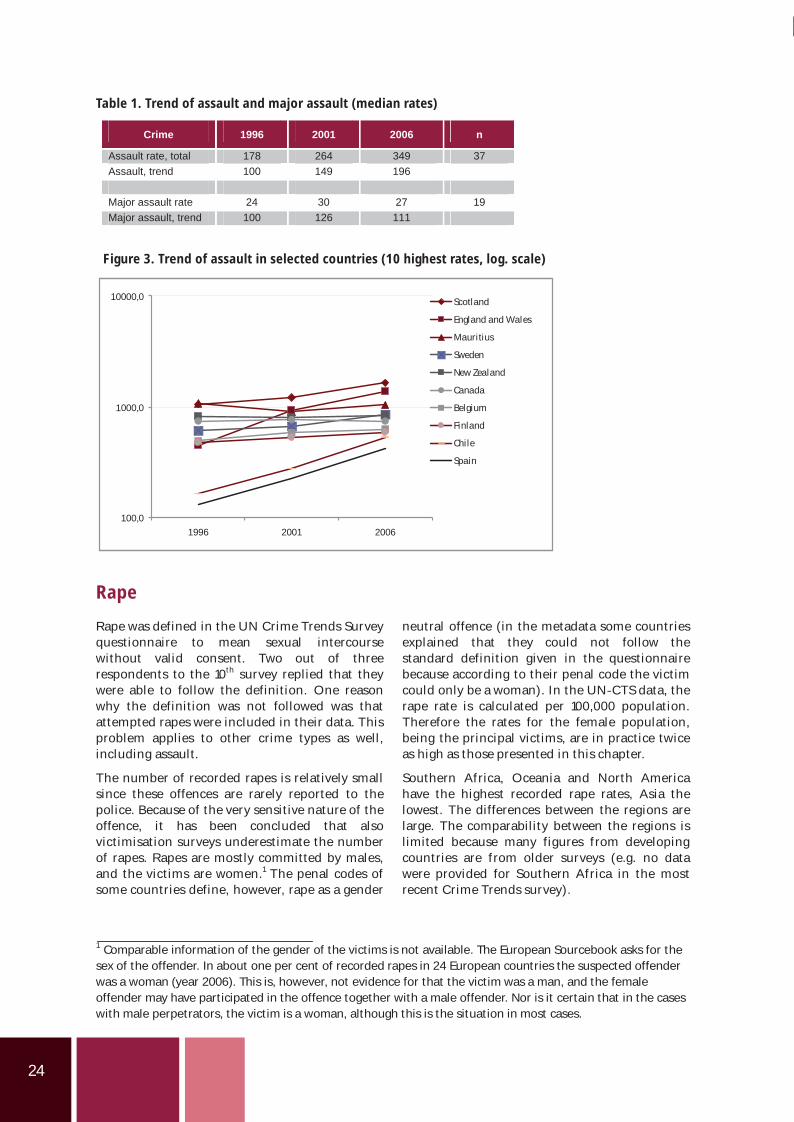
Total assault has increased between 1996 and2006, while major assaults have increased since1996, but not between 2001 and 2006 (table 1).The trend in ten selected countries (10 countrieswith highest assault rates) is increasing, and from2001 to 2006 in many more countries, and theincrease is larger than from 1996 to 2001 (figure3). Table 2 in the Annex shows the mean annualchanges in the individual countries.
24
Table 1. Trend of assault and major assault (median rates)
Crime 1996 2001 2006 n
Assault rate, total 178 264 349 37Assault, trend 100 149 196
Major assault rate 24 30 27 19 Major assault, trend 100 126 111
Figure 3. Trend of assault in selected countries (10 highest rates, log. scale)
Rape
Rape was defined in the UN Crime Trends Surveyquestionnaire to mean sexual intercoursewithout valid consent. Two out of threerespondents to the 10th survey replied that theywere able to follow the definition. One reasonwhy the definition was not followed was thatattempted rapes were included in their data. Thisproblem applies to other crime types as well,including assault.
The number of recorded rapes is relatively smallsince these offences are rarely reported to thepolice. Because of the very sensitive nature of theoffence, it has been concluded that alsovictimisation surveys underestimate the numberof rapes. Rapes are mostly committed by males,and the victims are women.1 The penal codes ofsome countries define, however, rape as a gender
neutral offence (in the metadata some countriesexplained that they could not follow thestandard definition given in the questionnairebecause according to their penal code the victimcould only be a woman). In the UN CTS data, therape rate is calculated per 100,000 population.Therefore the rates for the female population,being the principal victims, are in practice twiceas high as those presented in this chapter.
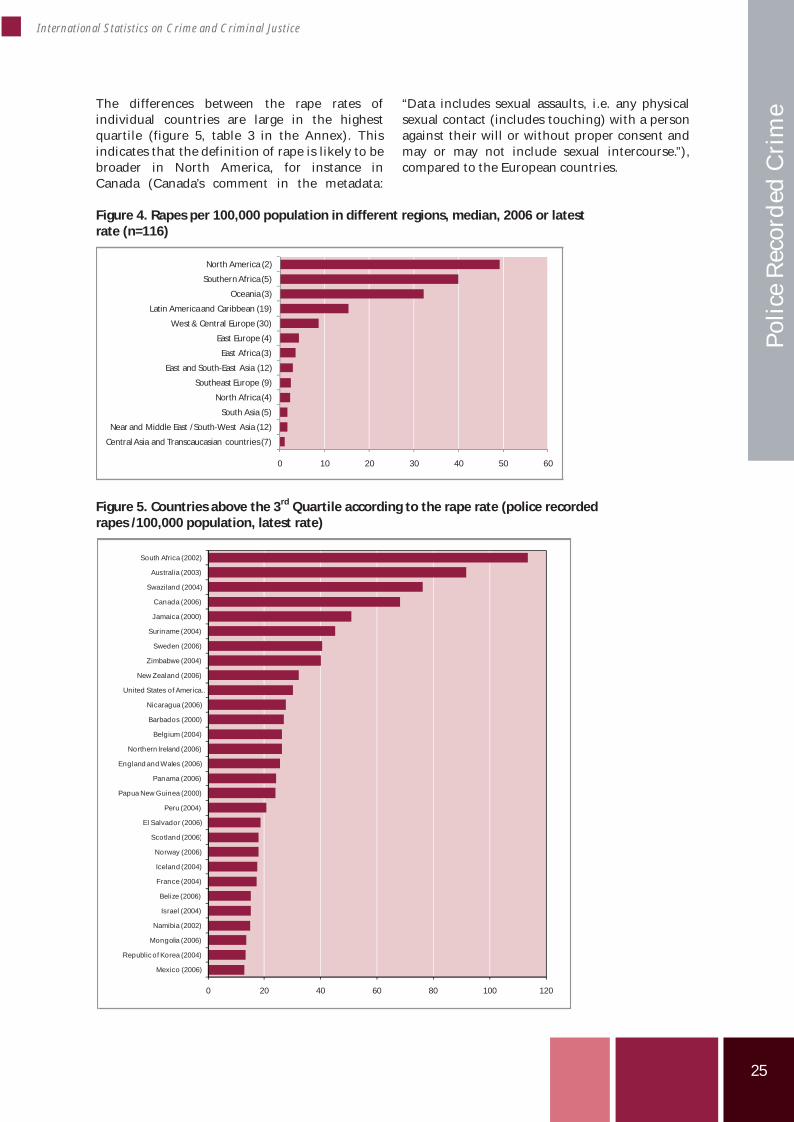
Southern Africa, Oceania and North Americahave the highest recorded rape rates, Asia thelowest. The differences between the regions arelarge. The comparability between the regions islimited because many figures from developingcountries are from older surveys (e.g. no datawere provided for Southern Africa in the mostrecent Crime Trends survey).
1 Comparable information of the gender of the victims is not available. The European Sourcebook asks for thesex of the offender. In about one per cent of recorded rapes in 24 European countries the suspected offenderwas a woman (year 2006). This is, however, not evidence for that the victim was a man, and the femaleoffender may have participated in the offence together with a male offender. Nor is it certain that in the caseswith male perpetrators, the victim is a woman, although this is the situation in most cases.
100,0
1000,0
10000,0
1996 2001 2006
Scotland
England and Wales
Mauritius
Sweden
New Zealand
Canada
Belgium
Finland
Chile
Spain
25
International Statistics on Crime and Criminal Justice
Polic
e Re
cord
ed C
rim
e The differences between the rape rates ofindividual countries are large in the highestquartile (figure 5, table 3 in the Annex). Thisindicates that the definition of rape is likely to bebroader in North America, for instance inCanada (Canada’s comment in the metadata:
“Data includes sexual assaults, i.e. any physicalsexual contact (includes touching) with a personagainst their will or without proper consent andmay or may not include sexual intercourse.”),compared to the European countries.
Figure 4. Rapes per 100,000 population in different regions, median, 2006 or latestrate (n=116)
0 10 20 30 40 50 60
Central Asia and Transcaucasian countries (7)
Near and Middle East /South West Asia (12)
South Asia (5)
North Africa (4)
Southeast Europe (9)
East and South East Asia (12)
East Africa (3)
East Europe (4)
West& Central Europe (30)
Latin Americaand Caribbean (19)
Oceania (3)
Southern Africa (5)
North America (2)
Figure 5. Countries above the 3rd Quartile according to the rape rate (police recordedrapes /100,000 population, latest rate)
0 20 40 60 80 100 120
Mexico (2006)
Republic of Korea (2004)
Mongolia (2006)
Namibia (2002)
Israel (2004)
Belize (2006)
France (2004)
Iceland (2004)
Norway (2006)
Scotland (2006)
El Salvador (2006)
Peru (2004)
Papua New Guinea (2000)
Panama (2006)
England and Wales (2006)
Northern Ireland (2006)
Belgium (2004)
Barbados (2000)
Nicaragua (2006)
United States of America …
New Zealand (2006)
Zimbabwe (2004)
Sweden (2006)
Suriname (2004)
Jamaica (2000)
Canada (2006)
Swaziland (2004)
Australia (2003)
South Africa (2002)
26
From the lowest quartile the developed countriesare missing. Some developing countries have nearto zero rates of rape, and some of these countrieshave also been recently in a state of war2 andsuffered from internal conflicts. In thesecountries rapes may not be recorded in a waycomparable to other countries.
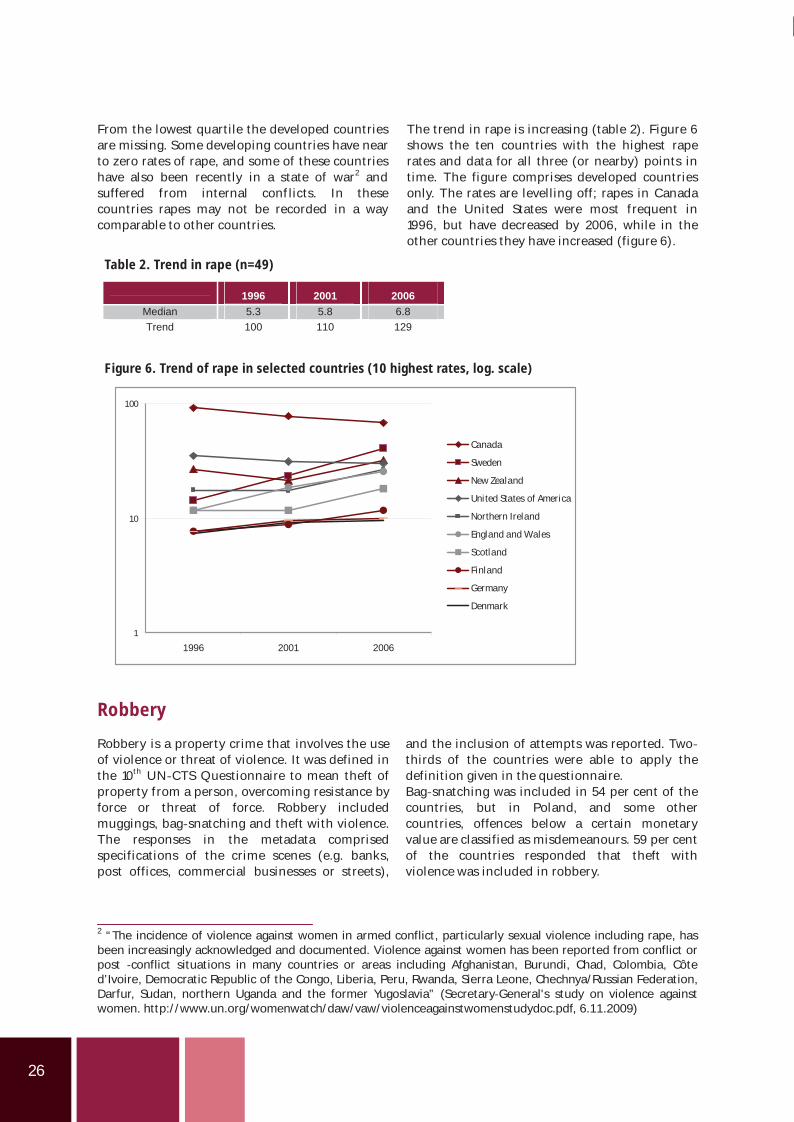
The trend in rape is increasing (table 2). Figure 6shows the ten countries with the highest raperates and data for all three (or nearby) points intime. The figure comprises developed countriesonly. The rates are levelling off; rapes in Canadaand the United States were most frequent in1996, but have decreased by 2006, while in theother countries they have increased (figure 6).
Table 2. Trend in rape (n=49)
1996 2001 2006Median 5.3 5.8 6.8Trend 100 110 129
Figure 6. Trend of rape in selected countries (10 highest rates, log. scale)
Robbery
Robbery is a property crime that involves the useof violence or threat of violence. It was defined inthe 10th UN CTS Questionnaire to mean theft ofproperty from a person, overcoming resistance byforce or threat of force. Robbery includedmuggings, bag snatching and theft with violence.The responses in the metadata comprisedspecifications of the crime scenes (e.g. banks,post offices, commercial businesses or streets),
and the inclusion of attempts was reported. Twothirds of the countries were able to apply thedefinition given in the questionnaire.Bag snatching was included in 54 per cent of thecountries, but in Poland, and some othercountries, offences below a certain monetaryvalue are classified as misdemeanours. 59 per centof the countries responded that theft withviolence was included in robbery.
2 “The incidence of violence against women in armed conflict, particularly sexual violence including rape, hasbeen increasingly acknowledged and documented. Violence against women has been reported from conflict orpost conflict situations in many countries or areas including Afghanistan, Burundi, Chad, Colombia, Côted’Ivoire, Democratic Republic of the Congo, Liberia, Peru, Rwanda, Sierra Leone, Chechnya/Russian Federation,Darfur, Sudan, northern Uganda and the former Yugoslavia” (Secretary General's study on violence againstwomen. http://www.un.org/womenwatch/daw/vaw/violenceagainstwomenstudydoc.pdf, 6.11.2009)
1
10
100
1996 2001 2006
Canada
Sweden
New Zealand
United States of America
Northern Ireland
England and Wales
Scotland
Finland
Germany
Denmark
27
International Statistics on Crime and Criminal Justice
Polic
e Re
cord
ed C
rim
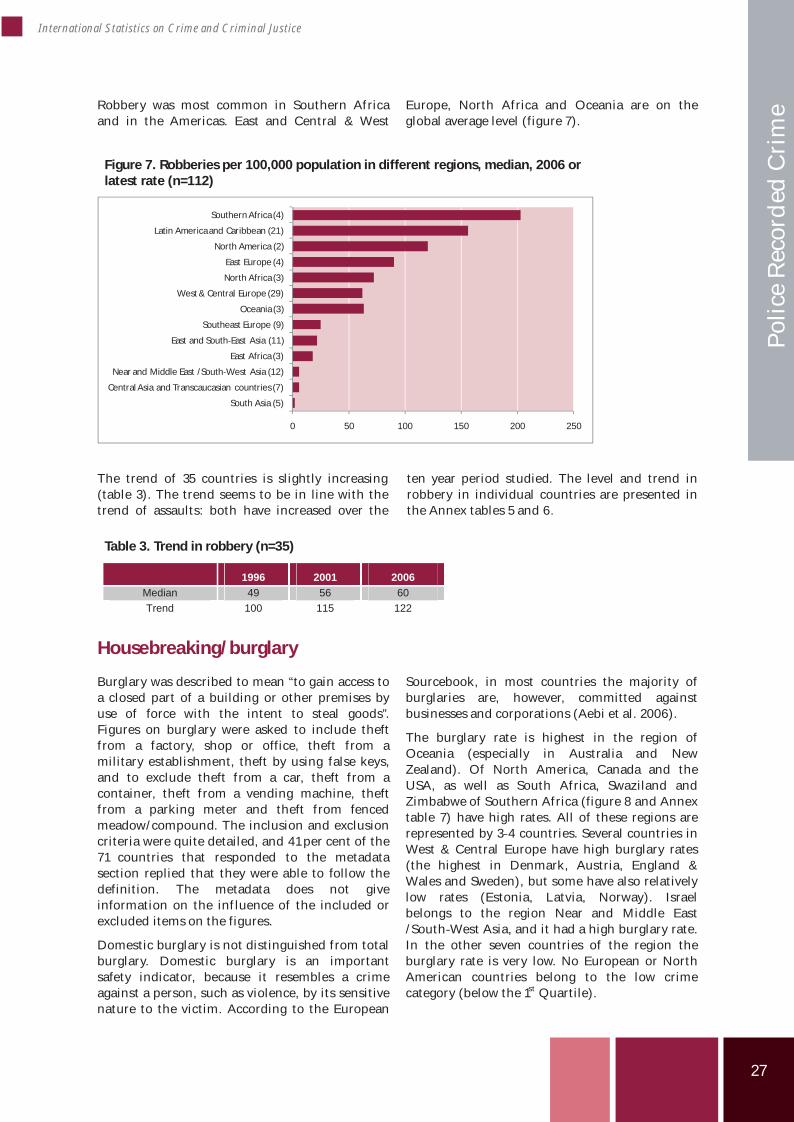
e Robbery was most common in Southern Africaand in the Americas. East and Central & West
Europe, North Africa and Oceania are on theglobal average level (figure 7).
Figure 7. Robberies per 100,000 population in different regions, median, 2006 orlatest rate (n=112)
0 50 100 150 200 250
South Asia (5)
Central Asia and Transcaucasian countries (7)
Near and Middle East /South West Asia (12)
East Africa (3)
East and South East Asia (11)
Southeast Europe (9)
Oceania (3)
West& Central Europe (29)
North Africa (3)
East Europe (4)
North America (2)
Latin Americaand Caribbean (21)
Southern Africa (4)
The trend of 35 countries is slightly increasing(table 3). The trend seems to be in line with thetrend of assaults: both have increased over the
ten year period studied. The level and trend inrobbery in individual countries are presented inthe Annex tables 5 and 6.
Table 3. Trend in robbery (n=35)
1996 2001 2006Median 49 56 60Trend 100 115 122
Housebreaking/ urglary
Burglary was described to mean “to gain access toa closed part of a building or other premises byuse of force with the intent to steal goods”.Figures on burglary were asked to include theftfrom a factory, shop or office, theft from amilitary establishment, theft by using false keys,and to exclude theft from a car, theft from acontainer, theft from a vending machine, theftfrom a parking meter and theft from fencedmeadow/compound. The inclusion and exclusioncriteria were quite detailed, and 41 per cent of the71 countries that responded to the metadatasection replied that they were able to follow thedefinition. The metadata does not giveinformation on the influence of the included orexcluded items on the figures.
Domestic burglary is not distinguished from totalburglary. Domestic burglary is an importantsafety indicator, because it resembles a crimeagainst a person, such as violence, by its sensitivenature to the victim. According to the European
Sourcebook, in most countries the majority ofburglaries are, however, committed againstbusinesses and corporations (Aebi et al. 2006).
The burglary rate is highest in the region ofOceania (especially in Australia and NewZealand). Of North America, Canada and theUSA, as well as South Africa, Swaziland andZimbabwe of Southern Africa (figure 8 and Annextable 7) have high rates. All of these regions arerepresented by 3 4 countries. Several countries inWest & Central Europe have high burglary rates(the highest in Denmark, Austria, England &Wales and Sweden), but some have also relativelylow rates (Estonia, Latvia, Norway). Israelbelongs to the region Near and Middle East/South West Asia, and it had a high burglary rate.In the other seven countries of the region theburglary rate is very low. No European or NorthAmerican countries belong to the low crimecategory (below the 1st Quartile).
b
28
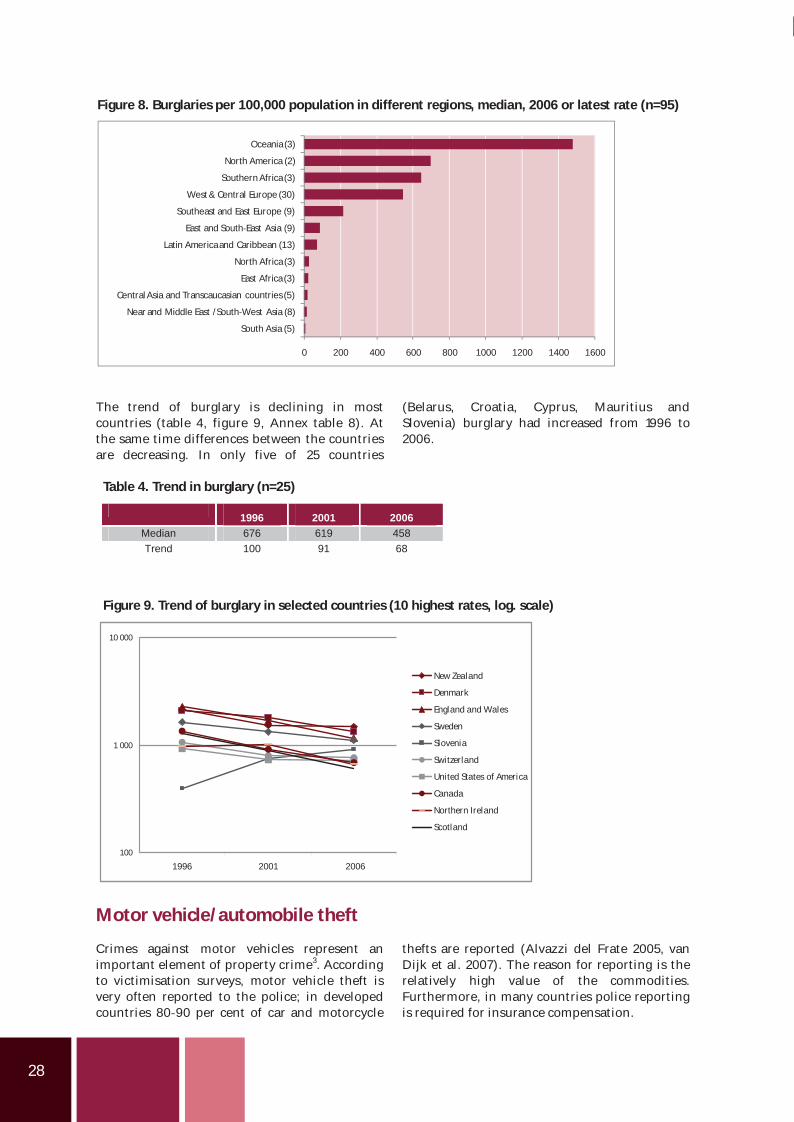
Figure 8. Burglaries per 100,000 population in different regions, median, 2006 or latest rate (n=95)
0 200 400 600 800 1000 1200 1400 1600
South Asia (5)
Near and Middle East /South West Asia (8)
Central Asia and Transcaucasian countries (5)
East Africa (3)
North Africa (3)
Latin Americaand Caribbean (13)
East and South East Asia (9)
Southeast and East Europe (9)
West& Central Europe (30)
Southern Africa (3)
North America (2)
Oceania (3)
The trend of burglary is declining in mostcountries (table 4, figure 9, Annex table 8). Atthe same time differences between the countriesare decreasing. In only five of 25 countries
(Belarus, Croatia, Cyprus, Mauritius andSlovenia) burglary had increased from 1996 to2006.
Table 4. Trend in burglary (n=25)
1996 2001 2006Median 676 619 458Trend 100 91 68
Figure 9. Trend of burglary in selected countries (10 highest rates, log. scale)
Motor vehicle/automobile theft
Crimes against motor vehicles represent animportant element of property crime3. Accordingto victimisation surveys, motor vehicle theft isvery often reported to the police; in developedcountries 80 90 per cent of car and motorcycle
thefts are reported (Alvazzi del Frate 2005, vanDijk et al. 2007). The reason for reporting is therelatively high value of the commodities.Furthermore, in many countries police reportingis required for insurance compensation.
100
1 000
10 000
1996 2001 2006
New Zealand
Denmark
England and Wales
Sweden
Slovenia
Switzerland
United States of America
Canada
Northern Ireland
Scotland
29
International Statistics on Crime and Criminal Justice
Polic
e Re
cord
ed C
rim
e Automobile theft was defined as “the removal ofa motor vehicle without the consent of the ownerof the vehicle”. 47 of the 74 countries reportedthat the definition could be applied in theircountries in 2005/2006. For most countries, itwas not clear, what the difference was, if thesuggested definition was not applied. Also somecountries that followed the definition reported ofdifferences, for instance that attempts wereincluded, and limitations in counting differenttypes of motor vehicles (e.g. Canada: “Refers onlyto theft of automobiles and station wagons;excludes vans, trucks, and motorcycles”). Themetadata collected on the questionnaire suggestthat most countries do not record separately
different types of motor vehicles (motorcyclewas, however, recorded separately in 22 of 74countries).
Reasons for motor vehicle thefts differ. Some carsare stolen for joyriding, and the vehicle isabandoned after a short term driving.Sometimes, a stolen car has been used in thecontext of committing other crimes. Somevehicles are stolen with the purpose of keepingthe commodity. Organised crime groups maymove the stolen vehicles abroad. In differentparts of the world, the structure of vehicle theftsdiffers, and so do the chances for the stolenproperty to be retrieved.
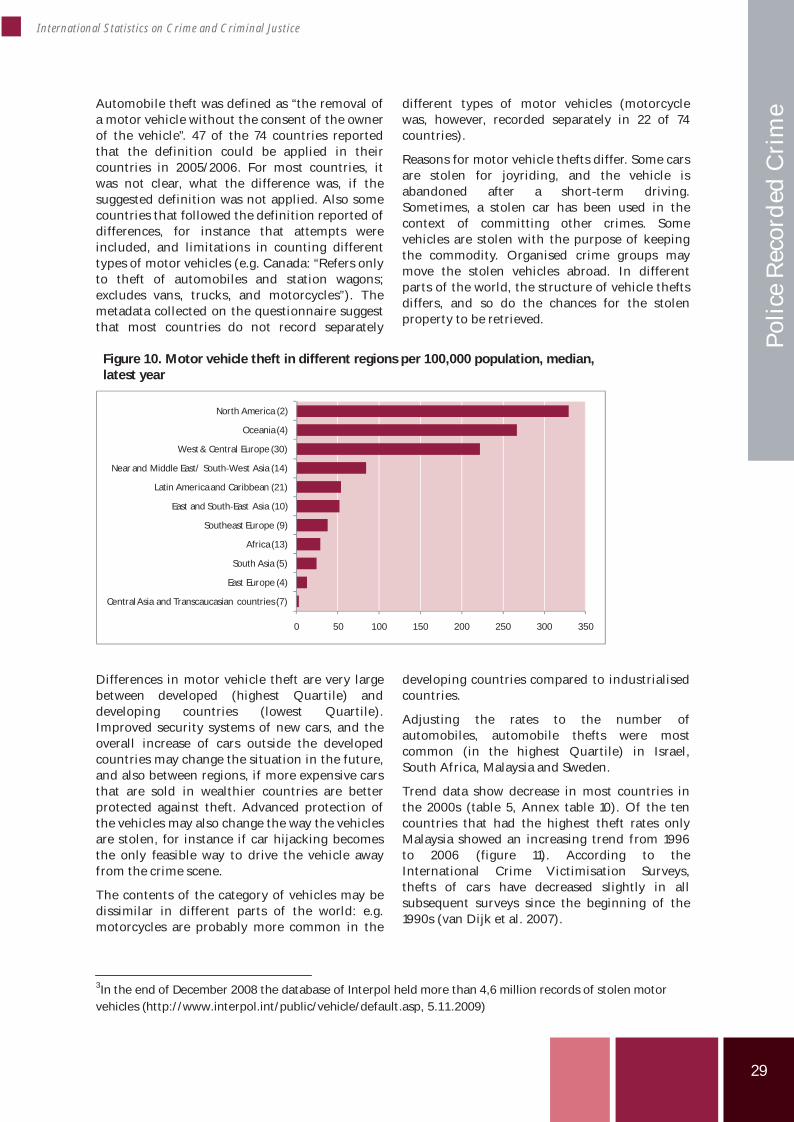
Figure 10. Motor vehicle theft in different regions per 100,000 population, median,latest year
0 50 100 150 200 250 300 350
Central Asia and Transcaucasian countries (7)
East Europe (4)
South Asia (5)
Africa (13)
Southeast Europe (9)
East and South East Asia (10)
Latin Americaand Caribbean (21)
Near and Middle East/ South West Asia (14)
West& Central Europe (30)
Oceania (4)
North America (2)
Differences in motor vehicle theft are very largebetween developed (highest Quartile) anddeveloping countries (lowest Quartile).Improved security systems of new cars, and theoverall increase of cars outside the developedcountries may change the situation in the future,and also between regions, if more expensive carsthat are sold in wealthier countries are betterprotected against theft. Advanced protection ofthe vehicles may also change the way the vehiclesare stolen, for instance if car hijacking becomesthe only feasible way to drive the vehicle awayfrom the crime scene.
The contents of the category of vehicles may bedissimilar in different parts of the world: e.g.motorcycles are probably more common in the
developing countries compared to industrialisedcountries.
Adjusting the rates to the number ofautomobiles, automobile thefts were mostcommon (in the highest Quartile) in Israel,South Africa, Malaysia and Sweden.
Trend data show decrease in most countries inthe 2000s (table 5, Annex table 10). Of the tencountries that had the highest theft rates onlyMalaysia showed an increasing trend from 1996to 2006 (figure 11). According to theInternational Crime Victimisation Surveys,thefts of cars have decreased slightly in allsubsequent surveys since the beginning of the1990s (van Dijk et al. 2007).
3In the end of December 2008 the database of Interpol held more than 4,6 million records of stolen motorvehicles (http://www.interpol.int/public/vehicle/default.asp, 5.11.2009)
30
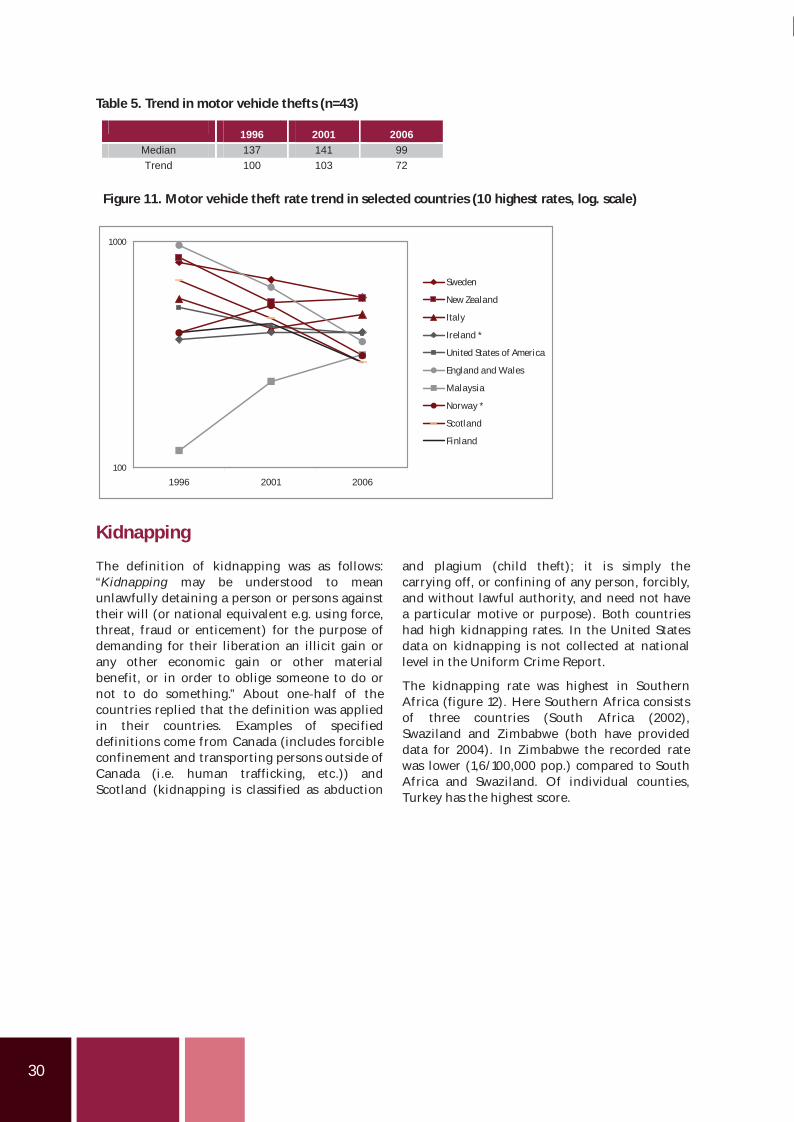
Table 5. Trend in motor vehicle thefts (n=43)
1996 2001 2006Median 137 141 99Trend 100 103 72
Figure 11. Motor vehicle theft rate trend in selected countries (10 highest rates, log. scale)
Kidnapping
The definition of kidnapping was as follows:“Kidnapping may be understood to meanunlawfully detaining a person or persons againsttheir will (or national equivalent e.g. using force,threat, fraud or enticement) for the purpose ofdemanding for their liberation an illicit gain orany other economic gain or other materialbenefit, or in order to oblige someone to do ornot to do something.” About one half of thecountries replied that the definition was appliedin their countries. Examples of specifieddefinitions come from Canada (includes forcibleconfinement and transporting persons outside ofCanada (i.e. human trafficking, etc.)) andScotland (kidnapping is classified as abduction
and plagium (child theft); it is simply thecarrying off, or confining of any person, forcibly,and without lawful authority, and need not havea particular motive or purpose). Both countrieshad high kidnapping rates. In the United Statesdata on kidnapping is not collected at nationallevel in the Uniform Crime Report.
The kidnapping rate was highest in SouthernAfrica (figure 12). Here Southern Africa consistsof three countries (South Africa (2002),Swaziland and Zimbabwe (both have provideddata for 2004). In Zimbabwe the recorded ratewas lower (1,6/100,000 pop.) compared to SouthAfrica and Swaziland. Of individual counties,Turkey has the highest score.
100
1000
1996 2001 2006
Sweden
New Zealand
Italy
Ireland *
United States of America
England and Wales
Malaysia
Norway *
Scotland
Finland
31
International Statistics on Crime and Criminal Justice
Polic
e Re
cord
ed C
rim
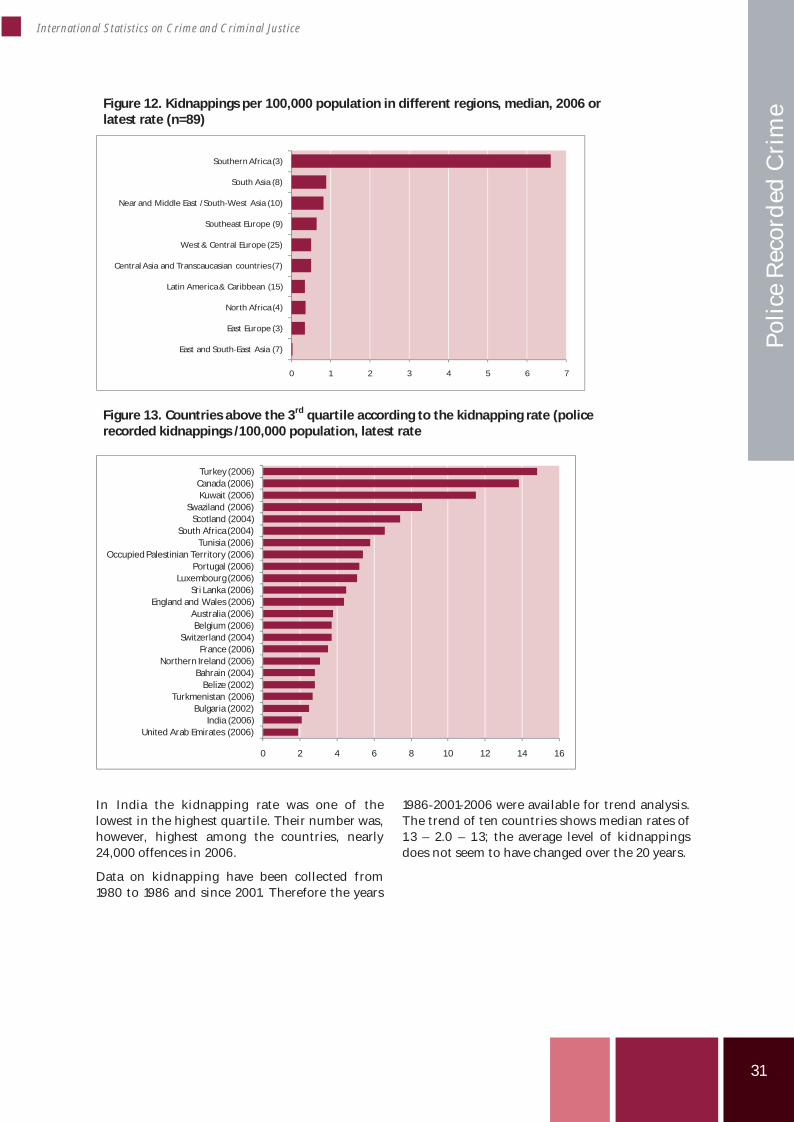
e Figure 12. Kidnappings per 100,000 population in different regions, median, 2006 orlatest rate (n=89)
0 1 2 3 4 5 6 7
East and South East Asia (7)
East Europe (3)
North Africa (4)
Latin America& Caribbean (15)
Central Asia and Transcaucasian countries (7)
West& Central Europe (25)
Southeast Europe (9)
Near and Middle East /South West Asia (10)
South Asia (8)
Southern Africa (3)
Figure 13. Countries above the 3rd quartile according to the kidnapping rate (policerecorded kidnappings /100,000 population, latest rate
0 2 4 6 8 10 12 14 16
United Arab Emirates (2006)India (2006)
Bulgaria (2002)Turkmenistan (2006)
Belize (2002)Bahrain (2004)
Northern Ireland (2006)France (2006)
Switzerland (2004)Belgium (2006)
Australia (2006)England and Wales (2006)
Sri Lanka (2006)Luxembourg (2006)
Portugal (2006)Occupied Palestinian Territory (2006)
Tunisia (2006)South Africa (2004)
Scotland (2004)Swaziland (2006)
Kuwait (2006)Canada (2006)Turkey (2006)
In India the kidnapping rate was one of thelowest in the highest quartile. Their number was,however, highest among the countries, nearly24,000 offences in 2006.
Data on kidnapping have been collected from1980 to 1986 and since 2001. Therefore the years
1986 2001 2006 were available for trend analysis.The trend of ten countries shows median rates of1.3 – 2.0 – 1.3; the average level of kidnappingsdoes not seem to have changed over the 20 years.
32
Suspects
The total number of persons brought intocontact with the police or otherwise contacted bythe criminal justice system – persons suspected,arrested or cautioned – were defined in a similarmanner as the number of recorded crimes,excluding minor traffic offences and other pettyoffences. The number of suspects is in mostcountries smaller than the number of recordedcrimes, because many crimes are not cleared, i.e.a suspect for the offence has not been found. Onthe other hand, one crime may involve more thanone offender, and one offender may have
committed many crimes. On the average, theratio between offenders and offences is less thanone (mean=0.69, median=0.48, in the highestquartile 0.85). The total number of offenders hasbeen increasing steadily since 1996 (table 9).According to the 9th UN CTS (detailedinformation on suspects was not asked in the10th Survey) in Europe and North America 14 percent of suspects were women in 2004 (theproportion varied between 2 and 26 per centbetween the countries; Heiskanen 2008).
Table 9. Trend of suspects (n=104)
1996 2001 2006
Median 765 842 876Trend 100 110 115
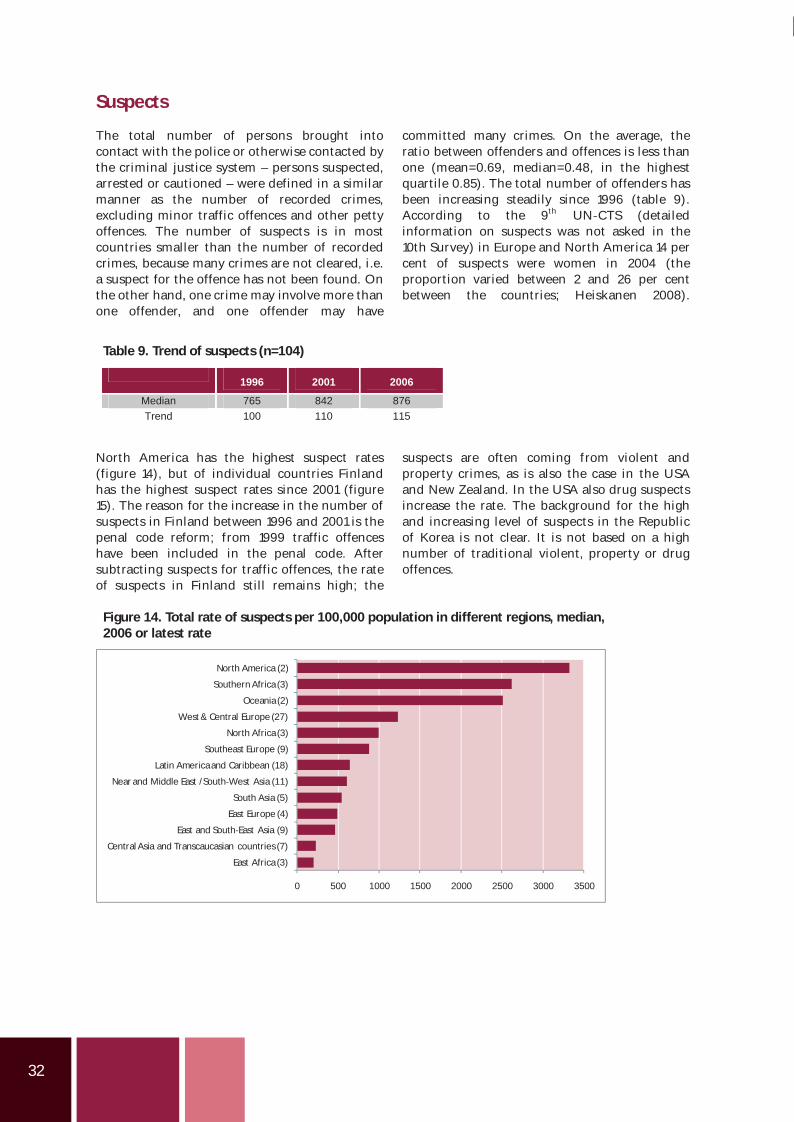
North America has the highest suspect rates(figure 14), but of individual countries Finlandhas the highest suspect rates since 2001 (figure15). The reason for the increase in the number ofsuspects in Finland between 1996 and 2001 is thepenal code reform; from 1999 traffic offenceshave been included in the penal code. Aftersubtracting suspects for traffic offences, the rateof suspects in Finland still remains high; the
suspects are often coming from violent andproperty crimes, as is also the case in the USAand New Zealand. In the USA also drug suspectsincrease the rate. The background for the highand increasing level of suspects in the Republicof Korea is not clear. It is not based on a highnumber of traditional violent, property or drugoffences.
Figure 14. Total rate of suspects per 100,000 population in different regions, median,2006 or latest rate
0 500 1000 1500 2000 2500 3000 3500
East Africa (3)
Central Asia and Transcaucasian countries (7)
East and South East Asia (9)
East Europe (4)
South Asia (5)
Near and Middle East /South West Asia (11)
Latin Americaand Caribbean (18)
Southeast Europe (9)
North Africa (3)
West& Central Europe (27)
Oceania (2)
Southern Africa (3)
North America (2)
33
International Statistics on Crime and Criminal Justice
Polic
e Re
cord
ed C
rim
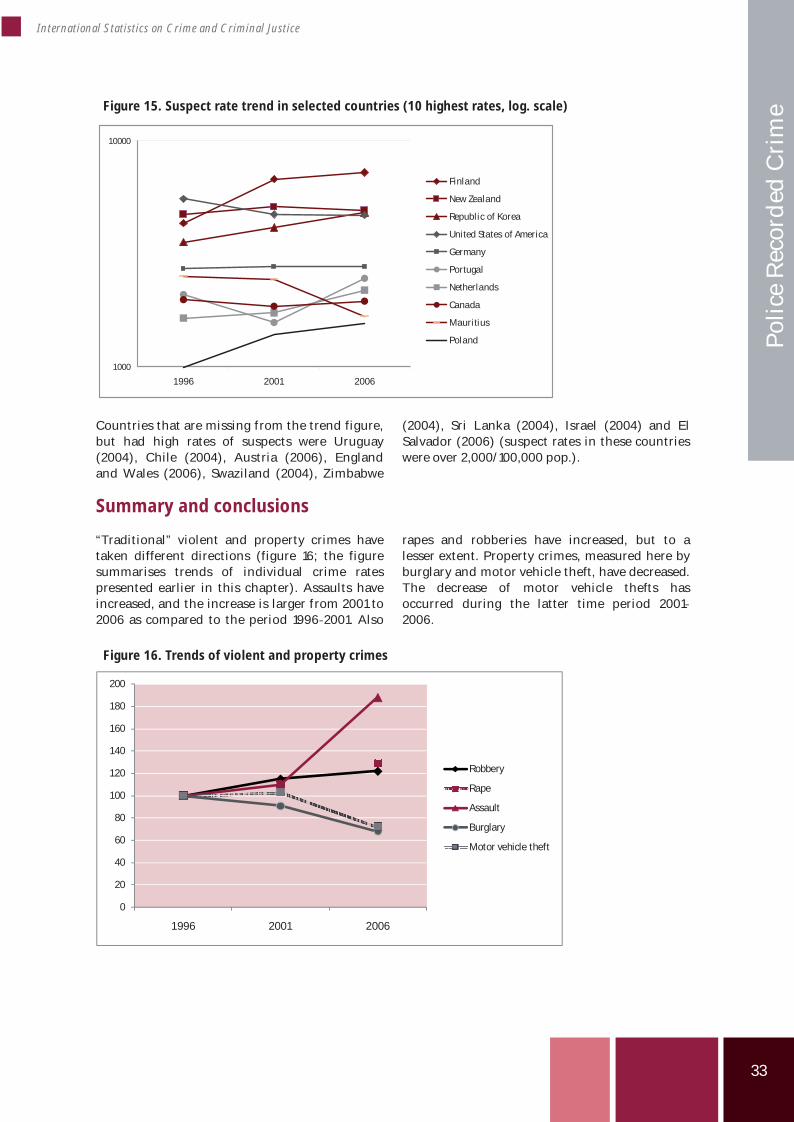
e Figure 15. Suspect rate trend in selected countries (10 highest rates, log. scale)
Countries that are missing from the trend figure,but had high rates of suspects were Uruguay(2004), Chile (2004), Austria (2006), Englandand Wales (2006), Swaziland (2004), Zimbabwe
(2004), Sri Lanka (2004), Israel (2004) and ElSalvador (2006) (suspect rates in these countrieswere over 2,000/100,000 pop.).
Summary and conclusions
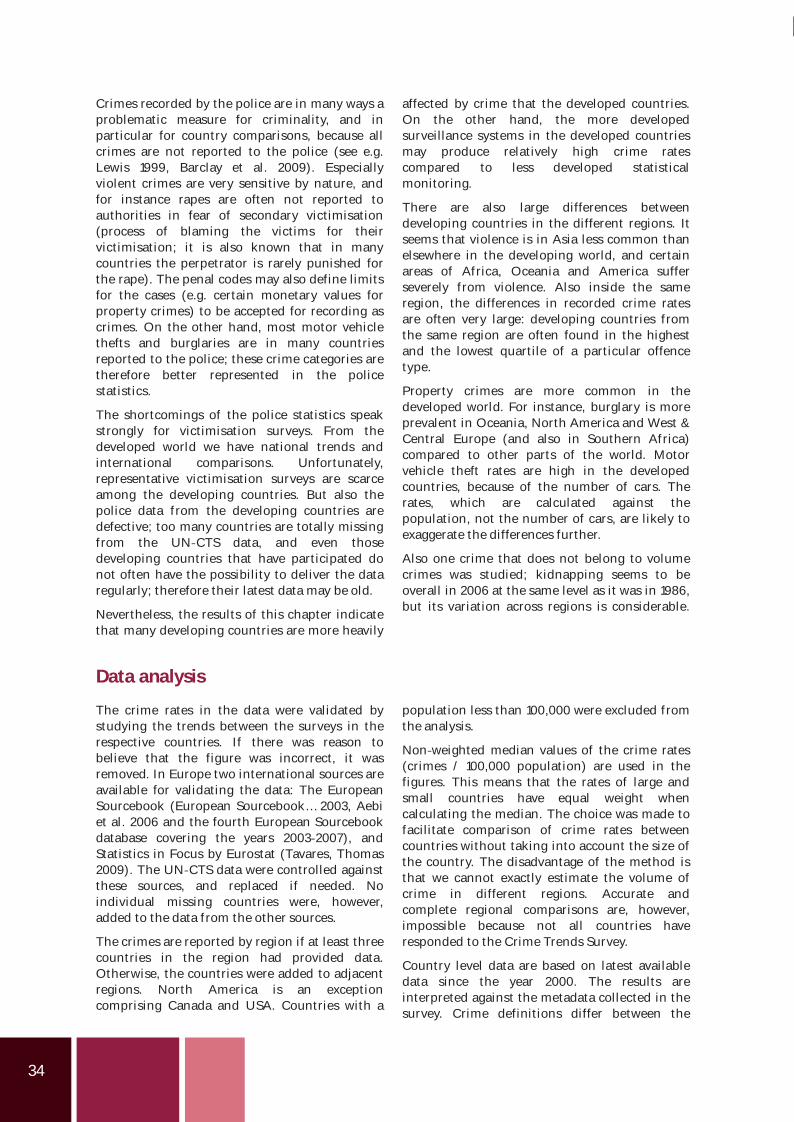
“Traditional” violent and property crimes havetaken different directions (figure 16; the figuresummarises trends of individual crime ratespresented earlier in this chapter). Assaults haveincreased, and the increase is larger from 2001 to2006 as compared to the period 1996 2001. Also
rapes and robberies have increased, but to alesser extent. Property crimes, measured here byburglary and motor vehicle theft, have decreased.The decrease of motor vehicle thefts hasoccurred during the latter time period 20012006.
Figure 16. Trends of violent and property crimes
0
20
40
60
80
100
120
140
160
180
200
1996 2001 2006
Robbery
Rape
Assault
Burglary
Motor vehicle theft
1000
10000
1996 2001 2006
Finland
New Zealand
Republic of Korea
United States of America
Germany
Portugal
Netherlands
Canada
Mauritius
Poland
34
Crimes recorded by the police are in many ways aproblematic measure for criminality, and inparticular for country comparisons, because allcrimes are not reported to the police (see e.g.Lewis 1999, Barclay et al. 2009). Especiallyviolent crimes are very sensitive by nature, andfor instance rapes are often not reported toauthorities in fear of secondary victimisation(process of blaming the victims for theirvictimisation; it is also known that in manycountries the perpetrator is rarely punished forthe rape). The penal codes may also define limitsfor the cases (e.g. certain monetary values forproperty crimes) to be accepted for recording ascrimes. On the other hand, most motor vehiclethefts and burglaries are in many countriesreported to the police; these crime categories aretherefore better represented in the policestatistics.
The shortcomings of the police statistics speakstrongly for victimisation surveys. From thedeveloped world we have national trends andinternational comparisons. Unfortunately,representative victimisation surveys are scarceamong the developing countries. But also thepolice data from the developing countries aredefective; too many countries are totally missingfrom the UN CTS data, and even thosedeveloping countries that have participated donot often have the possibility to deliver the dataregularly; therefore their latest data may be old.
Nevertheless, the results of this chapter indicatethat many developing countries are more heavily
affected by crime that the developed countries.On the other hand, the more developedsurveillance systems in the developed countriesmay produce relatively high crime ratescompared to less developed statisticalmonitoring.
There are also large differences betweendeveloping countries in the different regions. Itseems that violence is in Asia less common thanelsewhere in the developing world, and certainareas of Africa, Oceania and America sufferseverely from violence. Also inside the sameregion, the differences in recorded crime ratesare often very large: developing countries fromthe same region are often found in the highestand the lowest quartile of a particular offencetype.
Property crimes are more common in thedeveloped world. For instance, burglary is moreprevalent in Oceania, North America and West &Central Europe (and also in Southern Africa)compared to other parts of the world. Motorvehicle theft rates are high in the developedcountries, because of the number of cars. Therates, which are calculated against thepopulation, not the number of cars, are likely toexaggerate the differences further.
Also one crime that does not belong to volumecrimes was studied; kidnapping seems to beoverall in 2006 at the same level as it was in 1986,but its variation across regions is considerable.
Data analysis
The crime rates in the data were validated bystudying the trends between the surveys in therespective countries. If there was reason tobelieve that the figure was incorrect, it wasremoved. In Europe two international sources areavailable for validating the data: The EuropeanSourcebook (European Sourcebook… 2003, Aebiet al. 2006 and the fourth European Sourcebookdatabase covering the years 2003 2007), andStatistics in Focus by Eurostat (Tavares, Thomas2009). The UN CTS data were controlled againstthese sources, and replaced if needed. Noindividual missing countries were, however,added to the data from the other sources.
The crimes are reported by region if at least threecountries in the region had provided data.Otherwise, the countries were added to adjacentregions. North America is an exceptioncomprising Canada and USA. Countries with a
population less than 100,000 were excluded fromthe analysis.
Non weighted median values of the crime rates(crimes / 100,000 population) are used in thefigures. This means that the rates of large andsmall countries have equal weight whencalculating the median. The choice was made tofacilitate comparison of crime rates betweencountries without taking into account the size ofthe country. The disadvantage of the method isthat we cannot exactly estimate the volume ofcrime in different regions. Accurate andcomplete regional comparisons are, however,impossible because not all countries haveresponded to the Crime Trends Survey.
Country level data are based on latest availabledata since the year 2000. The results areinterpreted against the metadata collected in thesurvey. Crime definitions differ between the
35
International Statistics on Crime and Criminal Justice
Polic
e Re
cord
ed C
rim
e countries because of different penal codes,reporting behaviour, and recording practices,and consequently differences in the crime levelsin different countries may depend more ondifferent definitions and features of the systemthan on actual crime. Therefore trend analysisrepresents a more fruitful approach: it showshow crime has changed in the countries undercomparable circumstances.
The mean annual change in crime rates has beencalculated using the formula
(x2 / x1)1/(t2 t1) 1,
where x1 is the value at year t1 and x2 the value atyear t2.
In describing the trends between 1996 20012006, missing data is replaced by adjacentobservation, if available. E.g. if valid data wasavailable for the years 1996, 2000 and 2006, butnot for 2001, data for 2000 was used as a proxy forthe year 2001.
ReferencesAebi M F, Aromaa K, Aubusson de Cavarlay B,
Barclay G, Gruszczynska B, Hofer H von, HysiV, Jehle J M, Killias M, Smit P, Tavares C 2003.European Sourcebook of Crime and CriminalJustice Statistics – 2003, 2nd edition. Den Haag:Boom.
Aebi M F, Aromaa K, Aubusson de Cavarlay B,Barclay G, Gruszczynska B, Hofer H von, HysiV, Jehle J M, Smit P and Tavares C 2006.European Sourcebook of Crime and CriminalJustice Statistics – 2006. Den Haag: Boom.
Alvazzi del Frate A 2005. Trends in Crime. InTrends in Crime and Justice. March 2005. (Notpublished), 55 100.
Aromaa K, Heiskanen M (eds.) 2008. Crime andCriminal Justice Systems in Europe and NorthAmerica 1995 2004. HEUNI Publication SeriesNo. 55. Helsinki: Hakapaino Oy.
Barclay G, Rose M, Rubin M 2009. Police data.Forum on Crime and Society. Volume 5,Number 1, 2006. UNODC, 131 135.
Heiskanen M 2008. Persons Brought into InitialContact with the Police. In Aromaa K,Heiskanen M (eds.) 2008. Crime and Criminal
Justice Systems in Europe and North America1995 2004. HEUNI Publication Series No. 55.Helsinki: Hakapaino Oy, 70 93.
Lewis C 1999. Police records of crime. InNewman G (ed.): Global Report on Crime andJustice. United Nations Office for DrugControl and Crime Prevention. USA: OxfordUniversity Press, 43 64.
Tavares C, Thomas G 2009. Crime and CriminalJustice. Population and social conditions.Statistics in Focus 36/2009. Eurostat.
van Dijk J, van Kesteren J, Smit P 2007. CriminalVictimisation in International Perspective.Key Findings from the 2004 2005 ICVS andEU ICS. Onderzoek en beleid 257. WODC:Den Haag.
http://www.interpol.int/public/vehicle/default.asp, 5.11.2009.
Secretary General's study on violence againstwomen. http://www.un.org/womenwatch/daw/vaw/violenceagainstwomenstudydoc.pdf, 6.11.2009. Secretary General's study onviolence against women.
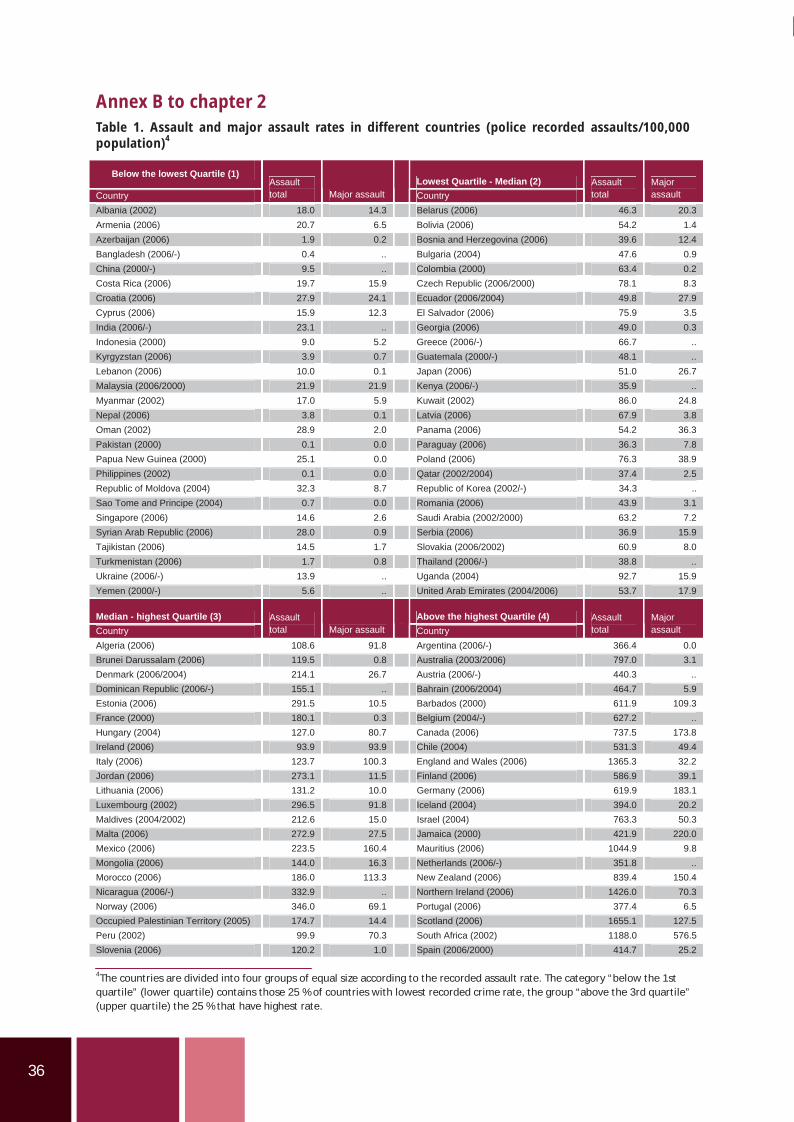
36
Annex B to hapter 2Table 1. Assault and major assault rates in different countries (police recorded assaults/100,000population)4
Below the lowest Quartile (1)Lowest Quartile - Median (2)
Country Assaulttotal Major assault Country
Assaulttotal
Majorassault
Albania (2002) 18.0 14.3 Belarus (2006) 46.3 20.3Armenia (2006) 20.7 6.5 Bolivia (2006) 54.2 1.4 Azerbaijan (2006) 1.9 0.2 Bosnia and Herzegovina (2006) 39.6 12.4Bangladesh (2006/-) 0.4 .. Bulgaria (2004) 47.6 0.9 China (2000/-) 9.5 .. Colombia (2000) 63.4 0.2Costa Rica (2006) 19.7 15.9 Czech Republic (2006/2000) 78.1 8.3 Croatia (2006) 27.9 24.1 Ecuador (2006/2004) 49.8 27.9Cyprus (2006) 15.9 12.3 El Salvador (2006) 75.9 3.5 India (2006/-) 23.1 .. Georgia (2006) 49.0 0.3Indonesia (2000) 9.0 5.2 Greece (2006/-) 66.7 .. Kyrgyzstan (2006) 3.9 0.7 Guatemala (2000/-) 48.1 ..Lebanon (2006) 10.0 0.1 Japan (2006) 51.0 26.7 Malaysia (2006/2000) 21.9 21.9 Kenya (2006/-) 35.9 ..Myanmar (2002) 17.0 5.9 Kuwait (2002) 86.0 24.8 Nepal (2006) 3.8 0.1 Latvia (2006) 67.9 3.8Oman (2002) 28.9 2.0 Panama (2006) 54.2 36.3 Pakistan (2000) 0.1 0.0 Paraguay (2006) 36.3 7.8Papua New Guinea (2000) 25.1 0.0 Poland (2006) 76.3 38.9 Philippines (2002) 0.1 0.0 Qatar (2002/2004) 37.4 2.5Republic of Moldova (2004) 32.3 8.7 Republic of Korea (2002/-) 34.3 .. Sao Tome and Principe (2004) 0.7 0.0 Romania (2006) 43.9 3.1Singapore (2006) 14.6 2.6 Saudi Arabia (2002/2000) 63.2 7.2 Syrian Arab Republic (2006) 28.0 0.9 Serbia (2006) 36.9 15.9Tajikistan (2006) 14.5 1.7 Slovakia (2006/2002) 60.9 8.0 Turkmenistan (2006) 1.7 0.8 Thailand (2006/-) 38.8 ..Ukraine (2006/-) 13.9 .. Uganda (2004) 92.7 15.9 Yemen (2000/-) 5.6 .. United Arab Emirates (2004/2006) 53.7 17.9
Median - highest Quartile (3) Above the highest Quartile (4) Country
Assaulttotal Major assault Country
Assaulttotal
Majorassault
Algeria (2006) 108.6 91.8 Argentina (2006/-) 366.4 0.0 Brunei Darussalam (2006) 119.5 0.8 Australia (2003/2006) 797.0 3.1Denmark (2006/2004) 214.1 26.7 Austria (2006/-) 440.3 .. Dominican Republic (2006/-) 155.1 .. Bahrain (2006/2004) 464.7 5.9Estonia (2006) 291.5 10.5 Barbados (2000) 611.9 109.3 France (2000) 180.1 0.3 Belgium (2004/-) 627.2 ..Hungary (2004) 127.0 80.7 Canada (2006) 737.5 173.8 Ireland (2006) 93.9 93.9 Chile (2004) 531.3 49.4Italy (2006) 123.7 100.3 England and Wales (2006) 1365.3 32.2 Jordan (2006) 273.1 11.5 Finland (2006) 586.9 39.1Lithuania (2006) 131.2 10.0 Germany (2006) 619.9 183.1 Luxembourg (2002) 296.5 91.8 Iceland (2004) 394.0 20.2Maldives (2004/2002) 212.6 15.0 Israel (2004) 763.3 50.3 Malta (2006) 272.9 27.5 Jamaica (2000) 421.9 220.0Mexico (2006) 223.5 160.4 Mauritius (2006) 1044.9 9.8 Mongolia (2006) 144.0 16.3 Netherlands (2006/-) 351.8 ..Morocco (2006) 186.0 113.3 New Zealand (2006) 839.4 150.4 Nicaragua (2006/-) 332.9 .. Northern Ireland (2006) 1426.0 70.3Norway (2006) 346.0 69.1 Portugal (2006) 377.4 6.5 Occupied Palestinian Territory (2005) 174.7 14.4 Scotland (2006) 1655.1 127.5Peru (2002) 99.9 70.3 South Africa (2002) 1188.0 576.5 Slovenia (2006) 120.2 1.0 Spain (2006/2000) 414.7 25.2
4The countries are divided into four groups of equal size according to the recorded assault rate. The category “below the 1stquartile” (lower quartile) contains those 25 % of countries with lowest recorded crime rate, the group “above the 3rd quartile”(upper quartile) the 25 % that have highest rate.
c
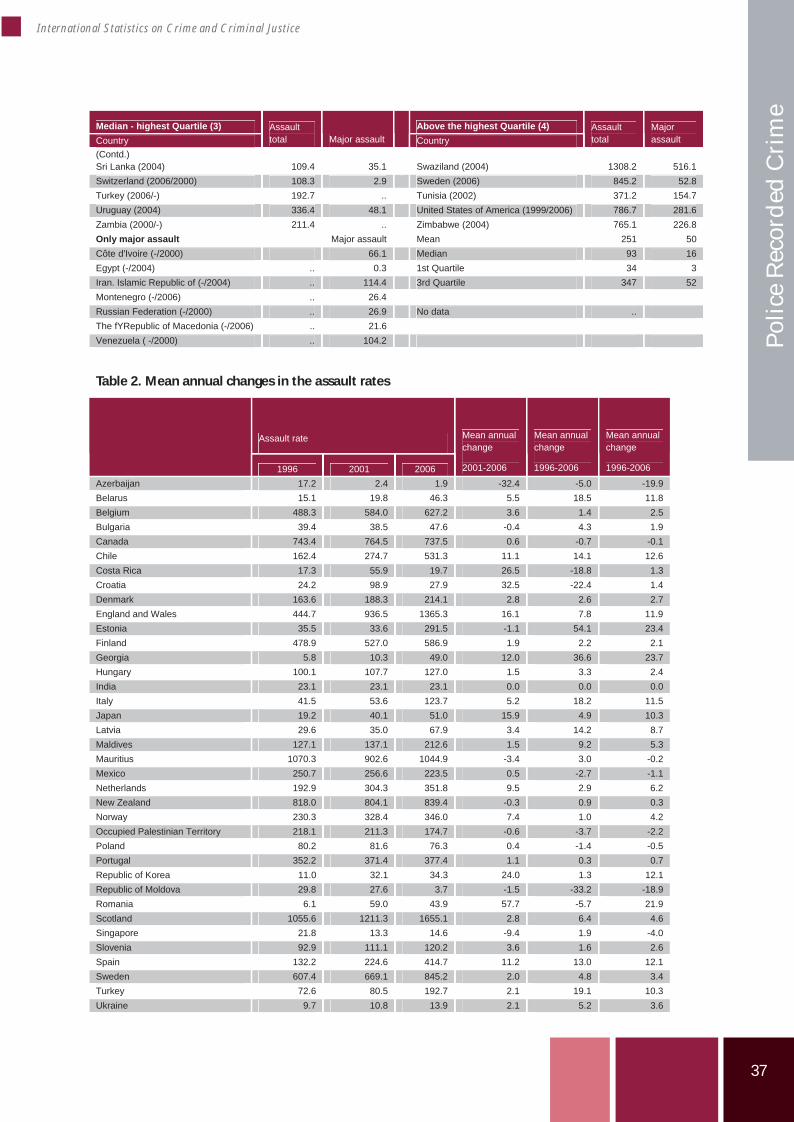
37
International Statistics on Crime and Criminal Justice
Polic
e Re
cord
ed C
rim
e
Median - highest Quartile (3) Above the highest Quartile (4) Country
Assaulttotal Major assault Country
Assaulttotal
Majorassault
(Contd.)Sri Lanka (2004) 109.4 35.1 Swaziland (2004) 1308.2 516.1 Switzerland (2006/2000) 108.3 2.9 Sweden (2006) 845.2 52.8Turkey (2006/-) 192.7 .. Tunisia (2002) 371.2 154.7 Uruguay (2004) 336.4 48.1 United States of America (1999/2006) 786.7 281.6Zambia (2000/-) 211.4 .. Zimbabwe (2004) 765.1 226.8 Only major assault Major assault Mean 251 50 Côte d'Ivoire (-/2000) 66.1 Median 93 16Egypt (-/2004) .. 0.3 1st Quartile 34 3 Iran. Islamic Republic of (-/2004) .. 114.4 3rd Quartile 347 52Montenegro (-/2006) .. 26.4 Russian Federation (-/2000) .. 26.9 No data ..The fYRepublic of Macedonia (-/2006) .. 21.6 Venezuela ( -/2000) .. 104.2
Table 2. Mean annual changes in the assault rates
Assault rate
1996 2001 2006
Mean annual change
2001-2006
Mean annual change
1996-2006
Mean annual change
1996-2006
Azerbaijan 17.2 2.4 1.9 -32.4 -5.0 -19.9Belarus 15.1 19.8 46.3 5.5 18.5 11.8 Belgium 488.3 584.0 627.2 3.6 1.4 2.5Bulgaria 39.4 38.5 47.6 -0.4 4.3 1.9 Canada 743.4 764.5 737.5 0.6 -0.7 -0.1Chile 162.4 274.7 531.3 11.1 14.1 12.6 Costa Rica 17.3 55.9 19.7 26.5 -18.8 1.3Croatia 24.2 98.9 27.9 32.5 -22.4 1.4 Denmark 163.6 188.3 214.1 2.8 2.6 2.7England and Wales 444.7 936.5 1365.3 16.1 7.8 11.9 Estonia 35.5 33.6 291.5 -1.1 54.1 23.4Finland 478.9 527.0 586.9 1.9 2.2 2.1 Georgia 5.8 10.3 49.0 12.0 36.6 23.7Hungary 100.1 107.7 127.0 1.5 3.3 2.4 India 23.1 23.1 23.1 0.0 0.0 0.0Italy 41.5 53.6 123.7 5.2 18.2 11.5 Japan 19.2 40.1 51.0 15.9 4.9 10.3Latvia 29.6 35.0 67.9 3.4 14.2 8.7 Maldives 127.1 137.1 212.6 1.5 9.2 5.3Mauritius 1070.3 902.6 1044.9 -3.4 3.0 -0.2 Mexico 250.7 256.6 223.5 0.5 -2.7 -1.1Netherlands 192.9 304.3 351.8 9.5 2.9 6.2 New Zealand 818.0 804.1 839.4 -0.3 0.9 0.3Norway 230.3 328.4 346.0 7.4 1.0 4.2 Occupied Palestinian Territory 218.1 211.3 174.7 -0.6 -3.7 -2.2Poland 80.2 81.6 76.3 0.4 -1.4 -0.5 Portugal 352.2 371.4 377.4 1.1 0.3 0.7Republic of Korea 11.0 32.1 34.3 24.0 1.3 12.1 Republic of Moldova 29.8 27.6 3.7 -1.5 -33.2 -18.9Romania 6.1 59.0 43.9 57.7 -5.7 21.9 Scotland 1055.6 1211.3 1655.1 2.8 6.4 4.6Singapore 21.8 13.3 14.6 -9.4 1.9 -4.0 Slovenia 92.9 111.1 120.2 3.6 1.6 2.6Spain 132.2 224.6 414.7 11.2 13.0 12.1 Sweden 607.4 669.1 845.2 2.0 4.8 3.4Turkey 72.6 80.5 192.7 2.1 19.1 10.3 Ukraine 9.7 10.8 13.9 2.1 5.2 3.6
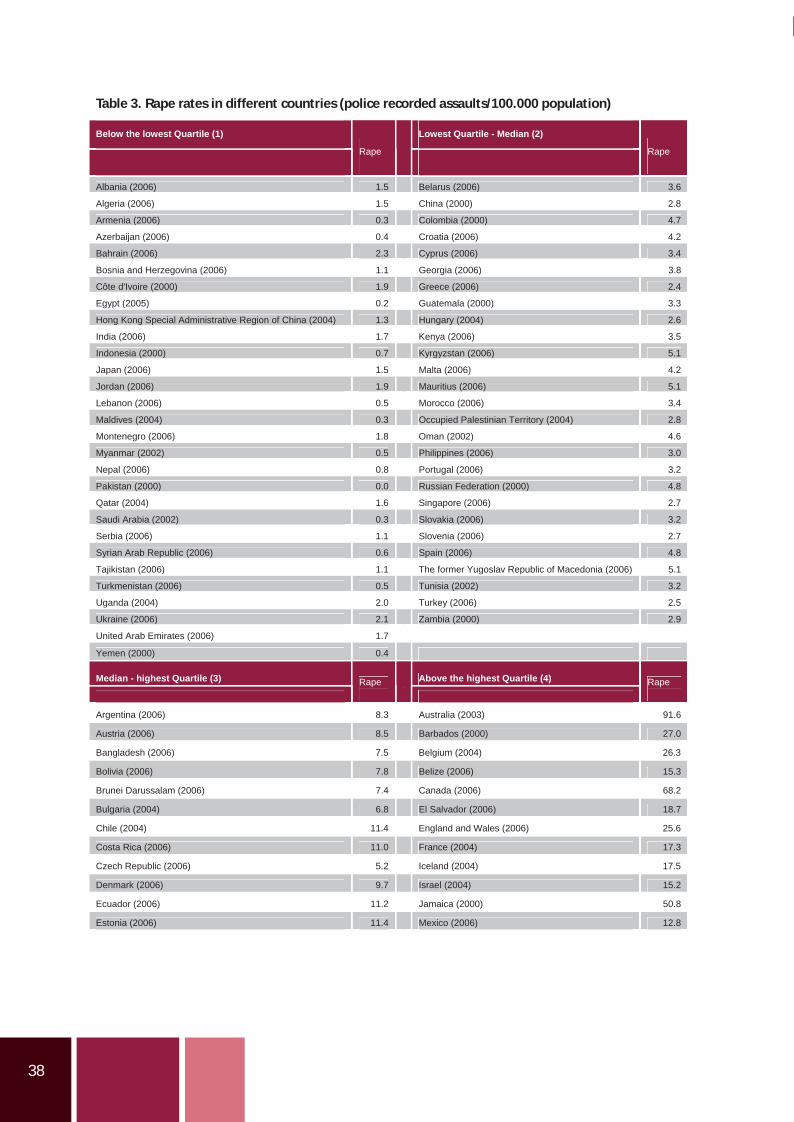
38
Table 3. Rape rates in different countries (police recorded assaults/100.000 population)
Below the lowest Quartile (1) Lowest Quartile - Median (2)
Rape Rape
Albania (2006) 1.5 Belarus (2006) 3.6
Algeria (2006) 1.5 China (2000) 2.8
Armenia (2006) 0.3 Colombia (2000) 4.7
Azerbaijan (2006) 0.4 Croatia (2006) 4.2
Bahrain (2006) 2.3 Cyprus (2006) 3.4
Bosnia and Herzegovina (2006) 1.1 Georgia (2006) 3.8
Côte d'Ivoire (2000) 1.9 Greece (2006) 2.4
Egypt (2005) 0.2 Guatemala (2000) 3.3
Hong Kong Special Administrative Region of China (2004) 1.3 Hungary (2004) 2.6
India (2006) 1.7 Kenya (2006) 3.5
Indonesia (2000) 0.7 Kyrgyzstan (2006) 5.1
Japan (2006) 1.5 Malta (2006) 4.2
Jordan (2006) 1.9 Mauritius (2006) 5.1
Lebanon (2006) 0.5 Morocco (2006) 3.4
Maldives (2004) 0.3 Occupied Palestinian Territory (2004) 2.8
Montenegro (2006) 1.8 Oman (2002) 4.6
Myanmar (2002) 0.5 Philippines (2006) 3.0
Nepal (2006) 0.8 Portugal (2006) 3.2
Pakistan (2000) 0.0 Russian Federation (2000) 4.8
Qatar (2004) 1.6 Singapore (2006) 2.7
Saudi Arabia (2002) 0.3 Slovakia (2006) 3.2
Serbia (2006) 1.1 Slovenia (2006) 2.7
Syrian Arab Republic (2006) 0.6 Spain (2006) 4.8
Tajikistan (2006) 1.1 The former Yugoslav Republic of Macedonia (2006) 5.1
Turkmenistan (2006) 0.5 Tunisia (2002) 3.2
Uganda (2004) 2.0 Turkey (2006) 2.5
Ukraine (2006) 2.1 Zambia (2000) 2.9
United Arab Emirates (2006) 1.7
Yemen (2000) 0.4
Median - highest Quartile (3) Above the highest Quartile (4) Rape Rape
Argentina (2006) 8.3 Australia (2003) 91.6
Austria (2006) 8.5 Barbados (2000) 27.0
Bangladesh (2006) 7.5 Belgium (2004) 26.3
Bolivia (2006) 7.8 Belize (2006) 15.3
Brunei Darussalam (2006) 7.4 Canada (2006) 68.2
Bulgaria (2004) 6.8 El Salvador (2006) 18.7
Chile (2004) 11.4 England and Wales (2006) 25.6
Costa Rica (2006) 11.0 France (2004) 17.3
Czech Republic (2006) 5.2 Iceland (2004) 17.5
Denmark (2006) 9.7 Israel (2004) 15.2
Ecuador (2006) 11.2 Jamaica (2000) 50.8
Estonia (2006) 11.4 Mexico (2006) 12.8
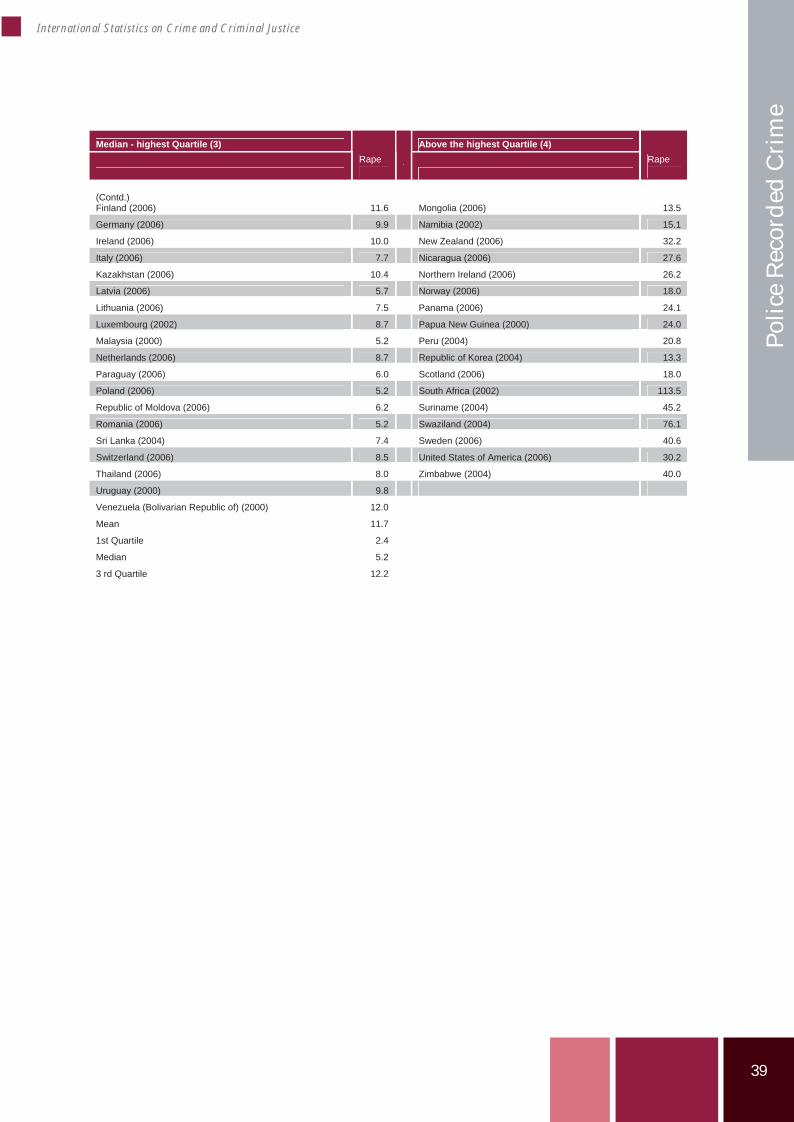
39
International Statistics on Crime and Criminal Justice
Polic
e Re
cord
ed C
rim
e
Median - highest Quartile (3) Above the highest Quartile (4) Rape Rape
(Contd.)Finland (2006) 11.6 Mongolia (2006) 13.5
Germany (2006) 9.9 Namibia (2002) 15.1
Ireland (2006) 10.0 New Zealand (2006) 32.2
Italy (2006) 7.7 Nicaragua (2006) 27.6
Kazakhstan (2006) 10.4 Northern Ireland (2006) 26.2
Latvia (2006) 5.7 Norway (2006) 18.0
Lithuania (2006) 7.5 Panama (2006) 24.1
Luxembourg (2002) 8.7 Papua New Guinea (2000) 24.0
Malaysia (2000) 5.2 Peru (2004) 20.8
Netherlands (2006) 8.7 Republic of Korea (2004) 13.3
Paraguay (2006) 6.0 Scotland (2006) 18.0
Poland (2006) 5.2 South Africa (2002) 113.5
Republic of Moldova (2006) 6.2 Suriname (2004) 45.2
Romania (2006) 5.2 Swaziland (2004) 76.1
Sri Lanka (2004) 7.4 Sweden (2006) 40.6
Switzerland (2006) 8.5 United States of America (2006) 30.2
Thailand (2006) 8.0 Zimbabwe (2004) 40.0
Uruguay (2000) 9.8
Venezuela (Bolivarian Republic of) (2000) 12.0 Mean 11.7
1st Quartile 2.4
Median 5.2
3 rd Quartile 12.2
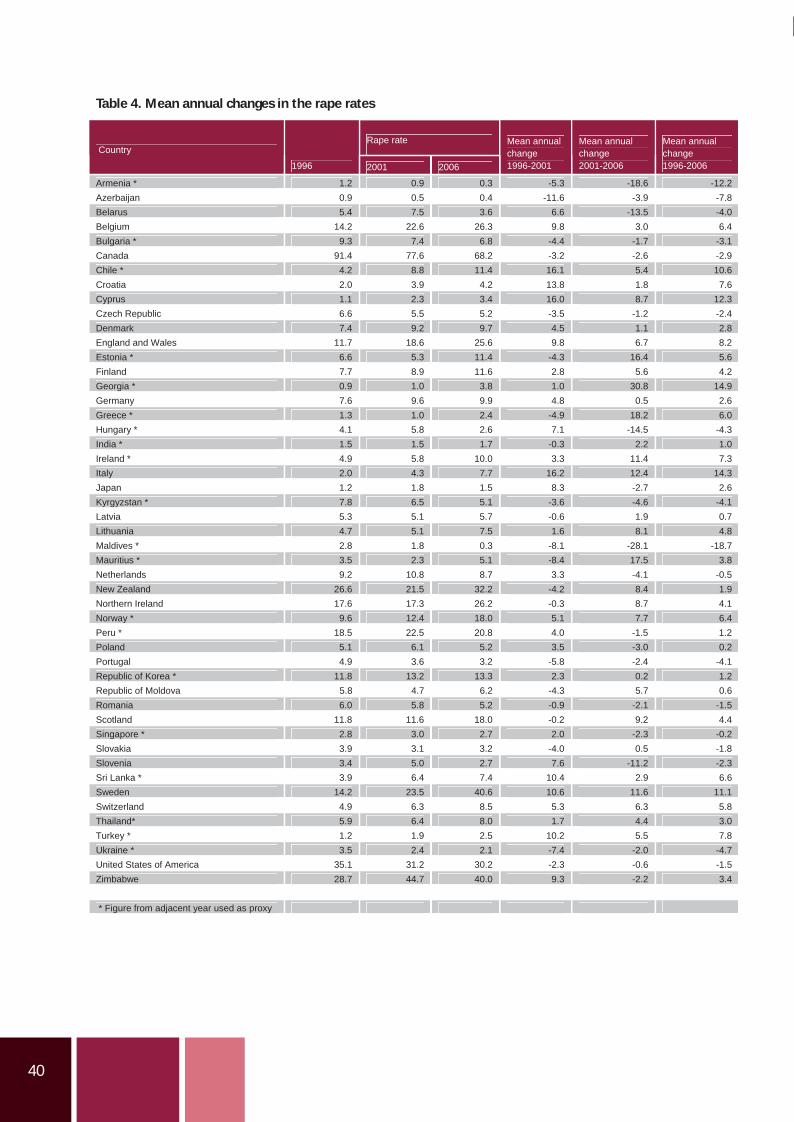
40
Table 4. Mean annual changes in the rape rates
Rape rate Country
1996 2001 2006
Mean annual change1996-2001
Mean annual change2001-2006
Mean annual change1996-2006
Armenia * 1.2 0.9 0.3 -5.3 -18.6 -12.2Azerbaijan 0.9 0.5 0.4 -11.6 -3.9 -7.8 Belarus 5.4 7.5 3.6 6.6 -13.5 -4.0Belgium 14.2 22.6 26.3 9.8 3.0 6.4 Bulgaria * 9.3 7.4 6.8 -4.4 -1.7 -3.1Canada 91.4 77.6 68.2 -3.2 -2.6 -2.9 Chile * 4.2 8.8 11.4 16.1 5.4 10.6Croatia 2.0 3.9 4.2 13.8 1.8 7.6 Cyprus 1.1 2.3 3.4 16.0 8.7 12.3Czech Republic 6.6 5.5 5.2 -3.5 -1.2 -2.4 Denmark 7.4 9.2 9.7 4.5 1.1 2.8England and Wales 11.7 18.6 25.6 9.8 6.7 8.2 Estonia * 6.6 5.3 11.4 -4.3 16.4 5.6Finland 7.7 8.9 11.6 2.8 5.6 4.2 Georgia * 0.9 1.0 3.8 1.0 30.8 14.9Germany 7.6 9.6 9.9 4.8 0.5 2.6 Greece * 1.3 1.0 2.4 -4.9 18.2 6.0Hungary * 4.1 5.8 2.6 7.1 -14.5 -4.3 India * 1.5 1.5 1.7 -0.3 2.2 1.0Ireland * 4.9 5.8 10.0 3.3 11.4 7.3 Italy 2.0 4.3 7.7 16.2 12.4 14.3Japan 1.2 1.8 1.5 8.3 -2.7 2.6 Kyrgyzstan * 7.8 6.5 5.1 -3.6 -4.6 -4.1Latvia 5.3 5.1 5.7 -0.6 1.9 0.7 Lithuania 4.7 5.1 7.5 1.6 8.1 4.8Maldives * 2.8 1.8 0.3 -8.1 -28.1 -18.7 Mauritius * 3.5 2.3 5.1 -8.4 17.5 3.8Netherlands 9.2 10.8 8.7 3.3 -4.1 -0.5 New Zealand 26.6 21.5 32.2 -4.2 8.4 1.9Northern Ireland 17.6 17.3 26.2 -0.3 8.7 4.1 Norway * 9.6 12.4 18.0 5.1 7.7 6.4Peru * 18.5 22.5 20.8 4.0 -1.5 1.2 Poland 5.1 6.1 5.2 3.5 -3.0 0.2Portugal 4.9 3.6 3.2 -5.8 -2.4 -4.1 Republic of Korea * 11.8 13.2 13.3 2.3 0.2 1.2Republic of Moldova 5.8 4.7 6.2 -4.3 5.7 0.6 Romania 6.0 5.8 5.2 -0.9 -2.1 -1.5Scotland 11.8 11.6 18.0 -0.2 9.2 4.4 Singapore * 2.8 3.0 2.7 2.0 -2.3 -0.2Slovakia 3.9 3.1 3.2 -4.0 0.5 -1.8 Slovenia 3.4 5.0 2.7 7.6 -11.2 -2.3Sri Lanka * 3.9 6.4 7.4 10.4 2.9 6.6 Sweden 14.2 23.5 40.6 10.6 11.6 11.1Switzerland 4.9 6.3 8.5 5.3 6.3 5.8 Thailand* 5.9 6.4 8.0 1.7 4.4 3.0Turkey * 1.2 1.9 2.5 10.2 5.5 7.8 Ukraine * 3.5 2.4 2.1 -7.4 -2.0 -4.7United States of America 35.1 31.2 30.2 -2.3 -0.6 -1.5 Zimbabwe 28.7 44.7 40.0 9.3 -2.2 3.4 * Figure from adjacent year used as proxy
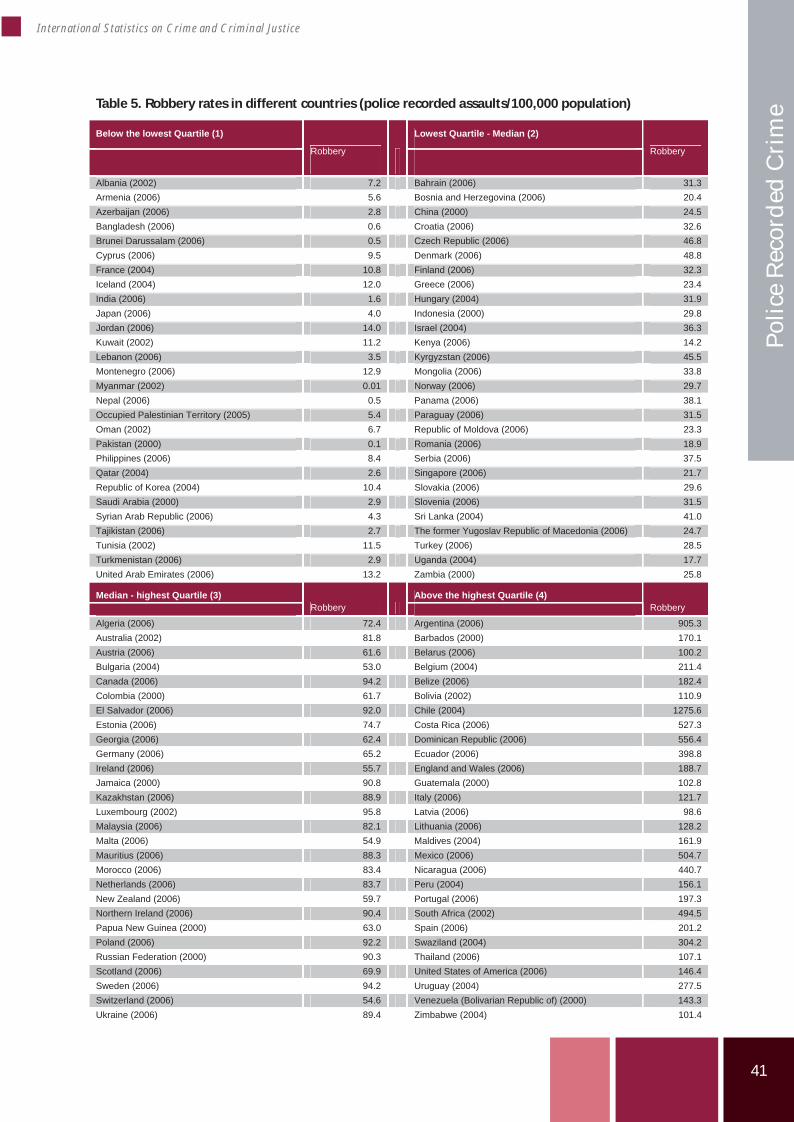
41
International Statistics on Crime and Criminal Justice
Polic
e Re
cord
ed C
rim
e Table 5. Robbery rates in different countries (police recorded assaults/100,000 population)
Below the lowest Quartile (1) Lowest Quartile - Median (2)
Robbery Robbery
Albania (2002) 7.2 Bahrain (2006) 31.3Armenia (2006) 5.6 Bosnia and Herzegovina (2006) 20.4 Azerbaijan (2006) 2.8 China (2000) 24.5Bangladesh (2006) 0.6 Croatia (2006) 32.6 Brunei Darussalam (2006) 0.5 Czech Republic (2006) 46.8Cyprus (2006) 9.5 Denmark (2006) 48.8 France (2004) 10.8 Finland (2006) 32.3Iceland (2004) 12.0 Greece (2006) 23.4 India (2006) 1.6 Hungary (2004) 31.9Japan (2006) 4.0 Indonesia (2000) 29.8 Jordan (2006) 14.0 Israel (2004) 36.3Kuwait (2002) 11.2 Kenya (2006) 14.2 Lebanon (2006) 3.5 Kyrgyzstan (2006) 45.5Montenegro (2006) 12.9 Mongolia (2006) 33.8 Myanmar (2002) 0.01 Norway (2006) 29.7Nepal (2006) 0.5 Panama (2006) 38.1 Occupied Palestinian Territory (2005) 5.4 Paraguay (2006) 31.5Oman (2002) 6.7 Republic of Moldova (2006) 23.3 Pakistan (2000) 0.1 Romania (2006) 18.9Philippines (2006) 8.4 Serbia (2006) 37.5 Qatar (2004) 2.6 Singapore (2006) 21.7Republic of Korea (2004) 10.4 Slovakia (2006) 29.6 Saudi Arabia (2000) 2.9 Slovenia (2006) 31.5Syrian Arab Republic (2006) 4.3 Sri Lanka (2004) 41.0 Tajikistan (2006) 2.7 The former Yugoslav Republic of Macedonia (2006) 24.7Tunisia (2002) 11.5 Turkey (2006) 28.5 Turkmenistan (2006) 2.9 Uganda (2004) 17.7United Arab Emirates (2006) 13.2 Zambia (2000) 25.8
Median - highest Quartile (3) Above the highest Quartile (4) Robbery Robbery
Algeria (2006) 72.4 Argentina (2006) 905.3Australia (2002) 81.8 Barbados (2000) 170.1 Austria (2006) 61.6 Belarus (2006) 100.2Bulgaria (2004) 53.0 Belgium (2004) 211.4 Canada (2006) 94.2 Belize (2006) 182.4Colombia (2000) 61.7 Bolivia (2002) 110.9 El Salvador (2006) 92.0 Chile (2004) 1275.6Estonia (2006) 74.7 Costa Rica (2006) 527.3 Georgia (2006) 62.4 Dominican Republic (2006) 556.4Germany (2006) 65.2 Ecuador (2006) 398.8 Ireland (2006) 55.7 England and Wales (2006) 188.7Jamaica (2000) 90.8 Guatemala (2000) 102.8 Kazakhstan (2006) 88.9 Italy (2006) 121.7Luxembourg (2002) 95.8 Latvia (2006) 98.6 Malaysia (2006) 82.1 Lithuania (2006) 128.2Malta (2006) 54.9 Maldives (2004) 161.9 Mauritius (2006) 88.3 Mexico (2006) 504.7Morocco (2006) 83.4 Nicaragua (2006) 440.7 Netherlands (2006) 83.7 Peru (2004) 156.1New Zealand (2006) 59.7 Portugal (2006) 197.3 Northern Ireland (2006) 90.4 South Africa (2002) 494.5Papua New Guinea (2000) 63.0 Spain (2006) 201.2 Poland (2006) 92.2 Swaziland (2004) 304.2Russian Federation (2000) 90.3 Thailand (2006) 107.1 Scotland (2006) 69.9 United States of America (2006) 146.4Sweden (2006) 94.2 Uruguay (2004) 277.5 Switzerland (2006) 54.6 Venezuela (Bolivarian Republic of) (2000) 143.3Ukraine (2006) 89.4 Zimbabwe (2004) 101.4
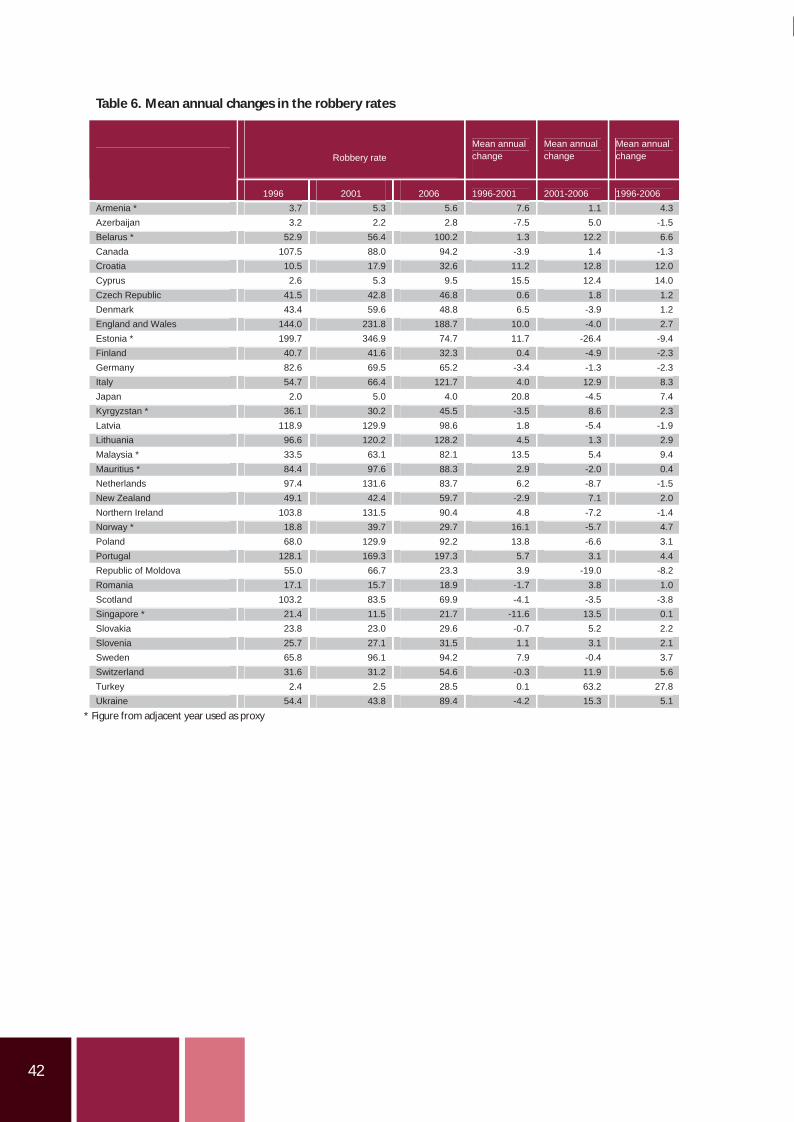
42
Table 6. Mean annual changes in the robbery rates
Robbery rate Mean annual change
Mean annual change
Mean annual change
1996 2001 2006 1996-2001 2001-2006 1996-2006Armenia * 3.7 5.3 5.6 7.6 1.1 4.3Azerbaijan 3.2 2.2 2.8 -7.5 5.0 -1.5 Belarus * 52.9 56.4 100.2 1.3 12.2 6.6Canada 107.5 88.0 94.2 -3.9 1.4 -1.3 Croatia 10.5 17.9 32.6 11.2 12.8 12.0Cyprus 2.6 5.3 9.5 15.5 12.4 14.0 Czech Republic 41.5 42.8 46.8 0.6 1.8 1.2Denmark 43.4 59.6 48.8 6.5 -3.9 1.2 England and Wales 144.0 231.8 188.7 10.0 -4.0 2.7Estonia * 199.7 346.9 74.7 11.7 -26.4 -9.4 Finland 40.7 41.6 32.3 0.4 -4.9 -2.3Germany 82.6 69.5 65.2 -3.4 -1.3 -2.3 Italy 54.7 66.4 121.7 4.0 12.9 8.3Japan 2.0 5.0 4.0 20.8 -4.5 7.4 Kyrgyzstan * 36.1 30.2 45.5 -3.5 8.6 2.3Latvia 118.9 129.9 98.6 1.8 -5.4 -1.9 Lithuania 96.6 120.2 128.2 4.5 1.3 2.9Malaysia * 33.5 63.1 82.1 13.5 5.4 9.4 Mauritius * 84.4 97.6 88.3 2.9 -2.0 0.4Netherlands 97.4 131.6 83.7 6.2 -8.7 -1.5 New Zealand 49.1 42.4 59.7 -2.9 7.1 2.0Northern Ireland 103.8 131.5 90.4 4.8 -7.2 -1.4 Norway * 18.8 39.7 29.7 16.1 -5.7 4.7Poland 68.0 129.9 92.2 13.8 -6.6 3.1 Portugal 128.1 169.3 197.3 5.7 3.1 4.4Republic of Moldova 55.0 66.7 23.3 3.9 -19.0 -8.2 Romania 17.1 15.7 18.9 -1.7 3.8 1.0Scotland 103.2 83.5 69.9 -4.1 -3.5 -3.8 Singapore * 21.4 11.5 21.7 -11.6 13.5 0.1Slovakia 23.8 23.0 29.6 -0.7 5.2 2.2 Slovenia 25.7 27.1 31.5 1.1 3.1 2.1Sweden 65.8 96.1 94.2 7.9 -0.4 3.7 Switzerland 31.6 31.2 54.6 -0.3 11.9 5.6Turkey 2.4 2.5 28.5 0.1 63.2 27.8 Ukraine 54.4 43.8 89.4 -4.2 15.3 5.1
* Figure from adjacent year used as proxy
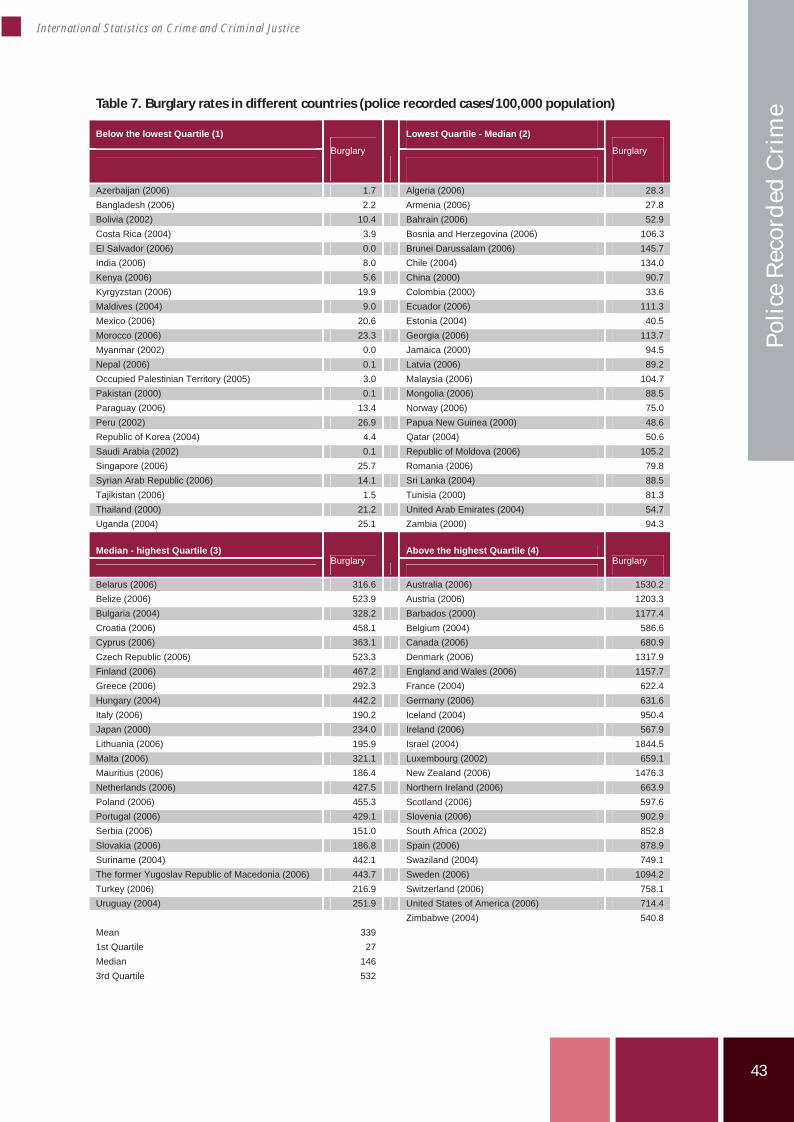
43
International Statistics on Crime and Criminal Justice
Polic
e Re
cord
ed C
rim
e Table 7. Burglary rates in different countries (police recorded cases/100,000 population)
Below the lowest Quartile (1) Lowest Quartile - Median (2)
Burglary Burglary
Azerbaijan (2006) 1.7 Algeria (2006) 28.3Bangladesh (2006) 2.2 Armenia (2006) 27.8 Bolivia (2002) 10.4 Bahrain (2006) 52.9Costa Rica (2004) 3.9 Bosnia and Herzegovina (2006) 106.3 El Salvador (2006) 0.0 Brunei Darussalam (2006) 145.7India (2006) 8.0 Chile (2004) 134.0 Kenya (2006) 5.6 China (2000) 90.7Kyrgyzstan (2006) 19.9 Colombia (2000) 33.6 Maldives (2004) 9.0 Ecuador (2006) 111.3Mexico (2006) 20.6 Estonia (2004) 40.5 Morocco (2006) 23.3 Georgia (2006) 113.7Myanmar (2002) 0.0 Jamaica (2000) 94.5 Nepal (2006) 0.1 Latvia (2006) 89.2Occupied Palestinian Territory (2005) 3.0 Malaysia (2006) 104.7 Pakistan (2000) 0.1 Mongolia (2006) 88.5Paraguay (2006) 13.4 Norway (2006) 75.0 Peru (2002) 26.9 Papua New Guinea (2000) 48.6Republic of Korea (2004) 4.4 Qatar (2004) 50.6 Saudi Arabia (2002) 0.1 Republic of Moldova (2006) 105.2Singapore (2006) 25.7 Romania (2006) 79.8 Syrian Arab Republic (2006) 14.1 Sri Lanka (2004) 88.5Tajikistan (2006) 1.5 Tunisia (2000) 81.3 Thailand (2000) 21.2 United Arab Emirates (2004) 54.7Uganda (2004) 25.1 Zambia (2000) 94.3
Median - highest Quartile (3) Above the highest Quartile (4) Burglary Burglary
Belarus (2006) 316.6 Australia (2006) 1530.2Belize (2006) 523.9 Austria (2006) 1203.3 Bulgaria (2004) 328.2 Barbados (2000) 1177.4Croatia (2006) 458.1 Belgium (2004) 586.6 Cyprus (2006) 363.1 Canada (2006) 680.9Czech Republic (2006) 523.3 Denmark (2006) 1317.9 Finland (2006) 467.2 England and Wales (2006) 1157.7Greece (2006) 292.3 France (2004) 622.4 Hungary (2004) 442.2 Germany (2006) 631.6Italy (2006) 190.2 Iceland (2004) 950.4 Japan (2000) 234.0 Ireland (2006) 567.9Lithuania (2006) 195.9 Israel (2004) 1844.5 Malta (2006) 321.1 Luxembourg (2002) 659.1Mauritius (2006) 186.4 New Zealand (2006) 1476.3 Netherlands (2006) 427.5 Northern Ireland (2006) 663.9Poland (2006) 455.3 Scotland (2006) 597.6 Portugal (2006) 429.1 Slovenia (2006) 902.9Serbia (2006) 151.0 South Africa (2002) 852.8 Slovakia (2006) 186.8 Spain (2006) 878.9Suriname (2004) 442.1 Swaziland (2004) 749.1 The former Yugoslav Republic of Macedonia (2006) 443.7 Sweden (2006) 1094.2Turkey (2006) 216.9 Switzerland (2006) 758.1 Uruguay (2004) 251.9 United States of America (2006) 714.4 Zimbabwe (2004) 540.8 Mean 3391st Quartile 27Median 1463rd Quartile 532
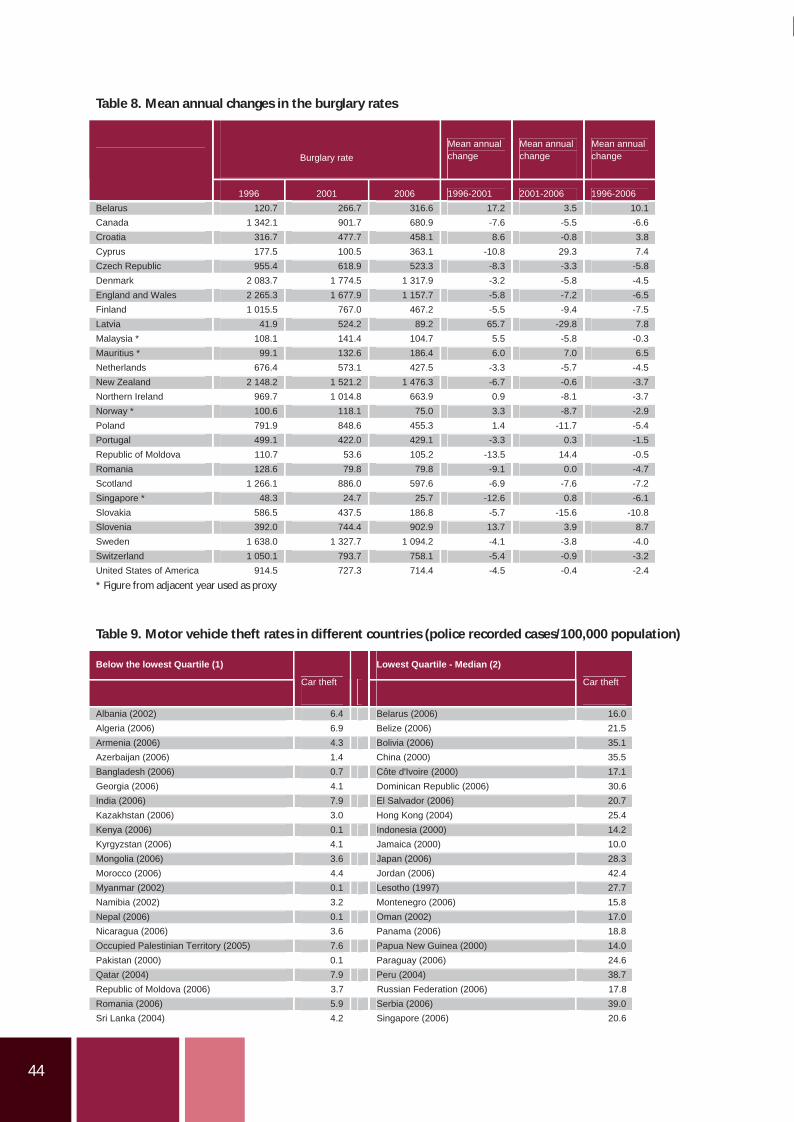
44
Table 8. Mean annual changes in the burglary rates
Burglary rate Mean annual change
Mean annual change
Mean annual change
1996 2001 2006 1996-2001 2001-2006 1996-2006Belarus 120.7 266.7 316.6 17.2 3.5 10.1Canada 1 342.1 901.7 680.9 -7.6 -5.5 -6.6 Croatia 316.7 477.7 458.1 8.6 -0.8 3.8Cyprus 177.5 100.5 363.1 -10.8 29.3 7.4 Czech Republic 955.4 618.9 523.3 -8.3 -3.3 -5.8Denmark 2 083.7 1 774.5 1 317.9 -3.2 -5.8 -4.5 England and Wales 2 265.3 1 677.9 1 157.7 -5.8 -7.2 -6.5Finland 1 015.5 767.0 467.2 -5.5 -9.4 -7.5 Latvia 41.9 524.2 89.2 65.7 -29.8 7.8Malaysia * 108.1 141.4 104.7 5.5 -5.8 -0.3 Mauritius * 99.1 132.6 186.4 6.0 7.0 6.5Netherlands 676.4 573.1 427.5 -3.3 -5.7 -4.5 New Zealand 2 148.2 1 521.2 1 476.3 -6.7 -0.6 -3.7Northern Ireland 969.7 1 014.8 663.9 0.9 -8.1 -3.7 Norway * 100.6 118.1 75.0 3.3 -8.7 -2.9Poland 791.9 848.6 455.3 1.4 -11.7 -5.4 Portugal 499.1 422.0 429.1 -3.3 0.3 -1.5Republic of Moldova 110.7 53.6 105.2 -13.5 14.4 -0.5 Romania 128.6 79.8 79.8 -9.1 0.0 -4.7Scotland 1 266.1 886.0 597.6 -6.9 -7.6 -7.2 Singapore * 48.3 24.7 25.7 -12.6 0.8 -6.1Slovakia 586.5 437.5 186.8 -5.7 -15.6 -10.8 Slovenia 392.0 744.4 902.9 13.7 3.9 8.7Sweden 1 638.0 1 327.7 1 094.2 -4.1 -3.8 -4.0 Switzerland 1 050.1 793.7 758.1 -5.4 -0.9 -3.2United States of America 914.5 727.3 714.4 -4.5 -0.4 -2.4 * Figure from adjacent year used as proxy
Table 9. Motor vehicle theft rates in different countries (police recorded cases/100,000 population)
Below the lowest Quartile (1) Lowest Quartile - Median (2)
Car theft Car theft
Albania (2002) 6.4 Belarus (2006) 16.0Algeria (2006) 6.9 Belize (2006) 21.5 Armenia (2006) 4.3 Bolivia (2006) 35.1Azerbaijan (2006) 1.4 China (2000) 35.5 Bangladesh (2006) 0.7 Côte d'Ivoire (2000) 17.1Georgia (2006) 4.1 Dominican Republic (2006) 30.6 India (2006) 7.9 El Salvador (2006) 20.7Kazakhstan (2006) 3.0 Hong Kong (2004) 25.4 Kenya (2006) 0.1 Indonesia (2000) 14.2Kyrgyzstan (2006) 4.1 Jamaica (2000) 10.0 Mongolia (2006) 3.6 Japan (2006) 28.3Morocco (2006) 4.4 Jordan (2006) 42.4 Myanmar (2002) 0.1 Lesotho (1997) 27.7Namibia (2002) 3.2 Montenegro (2006) 15.8 Nepal (2006) 0.1 Oman (2002) 17.0Nicaragua (2006) 3.6 Panama (2006) 18.8 Occupied Palestinian Territory (2005) 7.6 Papua New Guinea (2000) 14.0Pakistan (2000) 0.1 Paraguay (2006) 24.6 Qatar (2004) 7.9 Peru (2004) 38.7Republic of Moldova (2006) 3.7 Russian Federation (2006) 17.8 Romania (2006) 5.9 Serbia (2006) 39.0Sri Lanka (2004) 4.2 Singapore (2006) 20.6
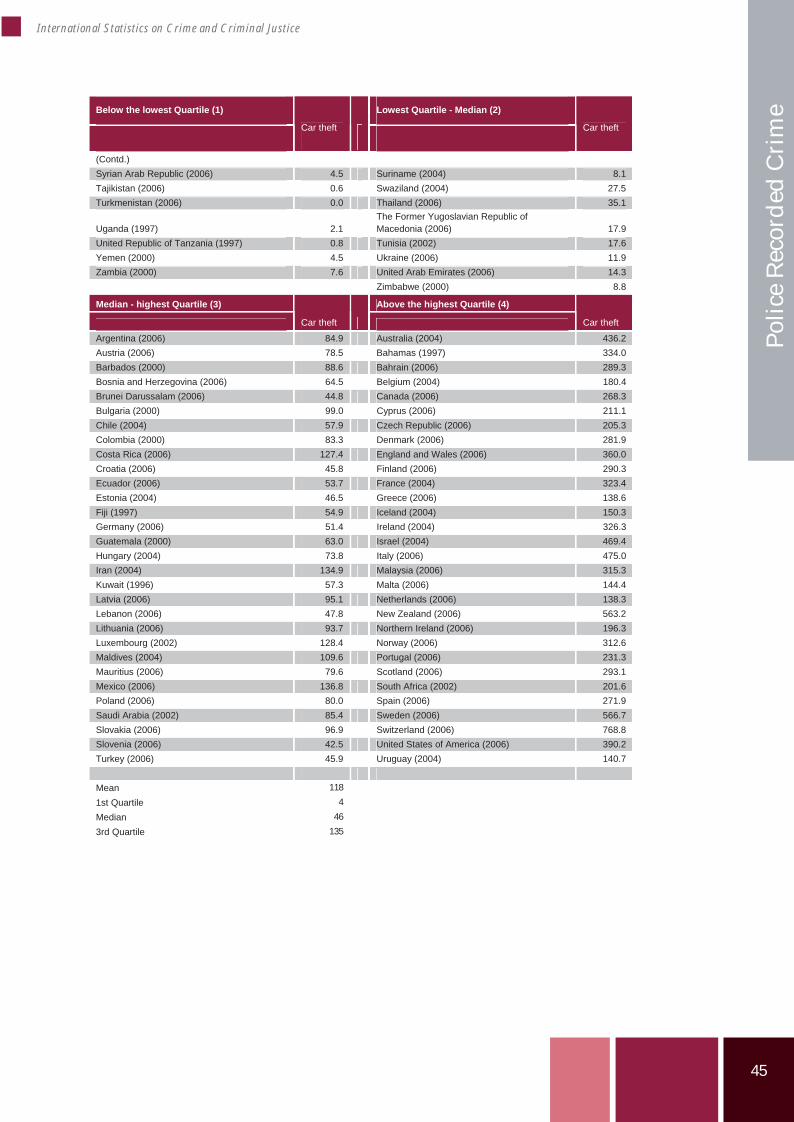
45
International Statistics on Crime and Criminal Justice
Polic
e Re
cord
ed C
rim
e Below the lowest Quartile (1) Lowest Quartile - Median (2)
Car theft Car theft
(Contd.) Syrian Arab Republic (2006) 4.5 Suriname (2004) 8.1Tajikistan (2006) 0.6 Swaziland (2004) 27.5 Turkmenistan (2006) 0.0 Thailand (2006) 35.1
Uganda (1997) 2.1 The Former Yugoslavian Republic of Macedonia (2006) 17.9
United Republic of Tanzania (1997) 0.8 Tunisia (2002) 17.6Yemen (2000) 4.5 Ukraine (2006) 11.9 Zambia (2000) 7.6 United Arab Emirates (2006) 14.3 Zimbabwe (2000) 8.8
Median - highest Quartile (3) Above the highest Quartile (4)
Car theft Car theft
Argentina (2006) 84.9 Australia (2004) 436.2Austria (2006) 78.5 Bahamas (1997) 334.0 Barbados (2000) 88.6 Bahrain (2006) 289.3Bosnia and Herzegovina (2006) 64.5 Belgium (2004) 180.4 Brunei Darussalam (2006) 44.8 Canada (2006) 268.3Bulgaria (2000) 99.0 Cyprus (2006) 211.1 Chile (2004) 57.9 Czech Republic (2006) 205.3Colombia (2000) 83.3 Denmark (2006) 281.9 Costa Rica (2006) 127.4 England and Wales (2006) 360.0Croatia (2006) 45.8 Finland (2006) 290.3 Ecuador (2006) 53.7 France (2004) 323.4Estonia (2004) 46.5 Greece (2006) 138.6 Fiji (1997) 54.9 Iceland (2004) 150.3Germany (2006) 51.4 Ireland (2004) 326.3 Guatemala (2000) 63.0 Israel (2004) 469.4Hungary (2004) 73.8 Italy (2006) 475.0 Iran (2004) 134.9 Malaysia (2006) 315.3Kuwait (1996) 57.3 Malta (2006) 144.4 Latvia (2006) 95.1 Netherlands (2006) 138.3Lebanon (2006) 47.8 New Zealand (2006) 563.2 Lithuania (2006) 93.7 Northern Ireland (2006) 196.3Luxembourg (2002) 128.4 Norway (2006) 312.6 Maldives (2004) 109.6 Portugal (2006) 231.3Mauritius (2006) 79.6 Scotland (2006) 293.1 Mexico (2006) 136.8 South Africa (2002) 201.6Poland (2006) 80.0 Spain (2006) 271.9 Saudi Arabia (2002) 85.4 Sweden (2006) 566.7Slovakia (2006) 96.9 Switzerland (2006) 768.8 Slovenia (2006) 42.5 United States of America (2006) 390.2Turkey (2006) 45.9 Uruguay (2004) 140.7
Mean 118 1st Quartile 4 Median 46 3rd Quartile 135
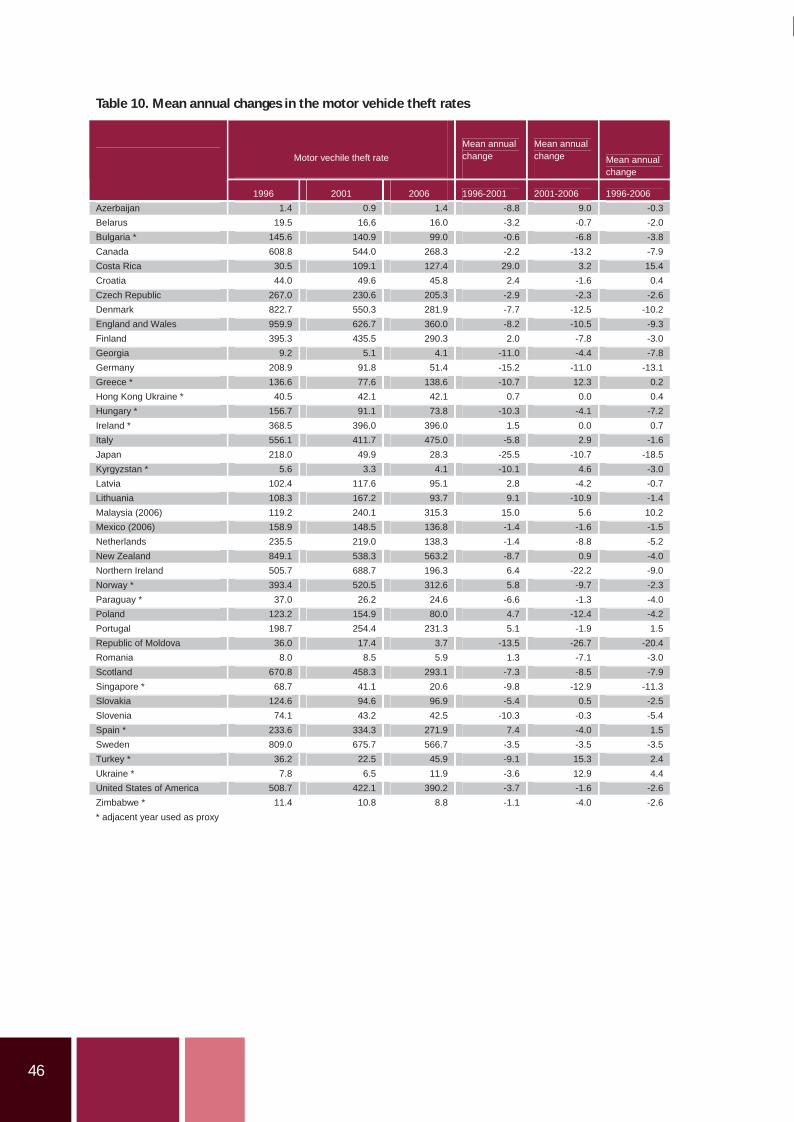
46
Table 10. Mean annual changes in the motor vehicle theft rates
Motor vechile theft rate Mean annual change
Mean annual change Mean annual
change
1996 2001 2006 1996-2001 2001-2006 1996-2006Azerbaijan 1.4 0.9 1.4 -8.8 9.0 -0.3Belarus 19.5 16.6 16.0 -3.2 -0.7 -2.0 Bulgaria * 145.6 140.9 99.0 -0.6 -6.8 -3.8Canada 608.8 544.0 268.3 -2.2 -13.2 -7.9 Costa Rica 30.5 109.1 127.4 29.0 3.2 15.4Croatia 44.0 49.6 45.8 2.4 -1.6 0.4 Czech Republic 267.0 230.6 205.3 -2.9 -2.3 -2.6Denmark 822.7 550.3 281.9 -7.7 -12.5 -10.2 England and Wales 959.9 626.7 360.0 -8.2 -10.5 -9.3Finland 395.3 435.5 290.3 2.0 -7.8 -3.0 Georgia 9.2 5.1 4.1 -11.0 -4.4 -7.8Germany 208.9 91.8 51.4 -15.2 -11.0 -13.1 Greece * 136.6 77.6 138.6 -10.7 12.3 0.2Hong Kong Ukraine * 40.5 42.1 42.1 0.7 0.0 0.4 Hungary * 156.7 91.1 73.8 -10.3 -4.1 -7.2Ireland * 368.5 396.0 396.0 1.5 0.0 0.7 Italy 556.1 411.7 475.0 -5.8 2.9 -1.6Japan 218.0 49.9 28.3 -25.5 -10.7 -18.5 Kyrgyzstan * 5.6 3.3 4.1 -10.1 4.6 -3.0Latvia 102.4 117.6 95.1 2.8 -4.2 -0.7 Lithuania 108.3 167.2 93.7 9.1 -10.9 -1.4Malaysia (2006) 119.2 240.1 315.3 15.0 5.6 10.2 Mexico (2006) 158.9 148.5 136.8 -1.4 -1.6 -1.5Netherlands 235.5 219.0 138.3 -1.4 -8.8 -5.2 New Zealand 849.1 538.3 563.2 -8.7 0.9 -4.0Northern Ireland 505.7 688.7 196.3 6.4 -22.2 -9.0 Norway * 393.4 520.5 312.6 5.8 -9.7 -2.3Paraguay * 37.0 26.2 24.6 -6.6 -1.3 -4.0 Poland 123.2 154.9 80.0 4.7 -12.4 -4.2Portugal 198.7 254.4 231.3 5.1 -1.9 1.5 Republic of Moldova 36.0 17.4 3.7 -13.5 -26.7 -20.4Romania 8.0 8.5 5.9 1.3 -7.1 -3.0 Scotland 670.8 458.3 293.1 -7.3 -8.5 -7.9Singapore * 68.7 41.1 20.6 -9.8 -12.9 -11.3 Slovakia 124.6 94.6 96.9 -5.4 0.5 -2.5Slovenia 74.1 43.2 42.5 -10.3 -0.3 -5.4 Spain * 233.6 334.3 271.9 7.4 -4.0 1.5Sweden 809.0 675.7 566.7 -3.5 -3.5 -3.5 Turkey * 36.2 22.5 45.9 -9.1 15.3 2.4Ukraine * 7.8 6.5 11.9 -3.6 12.9 4.4 United States of America 508.7 422.1 390.2 -3.7 -1.6 -2.6Zimbabwe * 11.4 10.8 8.8 -1.1 -4.0 -2.6 * adjacent year used as proxy
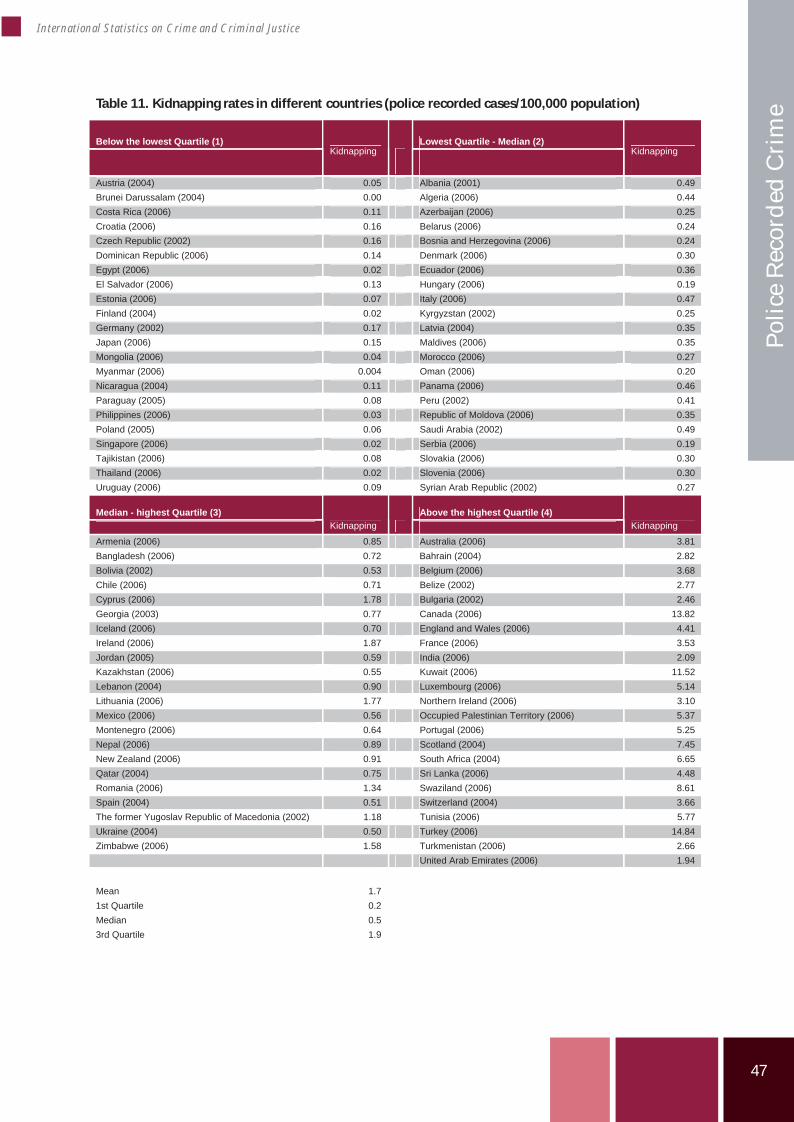
47
International Statistics on Crime and Criminal Justice
Polic
e Re
cord
ed C
rim
e Table 11. Kidnapping rates in different countries (police recorded cases/100,000 population)
Below the lowest Quartile (1) Lowest Quartile - Median (2) Kidnapping Kidnapping
Austria (2004) 0.05 Albania (2001) 0.49Brunei Darussalam (2004) 0.00 Algeria (2006) 0.44 Costa Rica (2006) 0.11 Azerbaijan (2006) 0.25Croatia (2006) 0.16 Belarus (2006) 0.24 Czech Republic (2002) 0.16 Bosnia and Herzegovina (2006) 0.24Dominican Republic (2006) 0.14 Denmark (2006) 0.30 Egypt (2006) 0.02 Ecuador (2006) 0.36El Salvador (2006) 0.13 Hungary (2006) 0.19 Estonia (2006) 0.07 Italy (2006) 0.47Finland (2004) 0.02 Kyrgyzstan (2002) 0.25 Germany (2002) 0.17 Latvia (2004) 0.35Japan (2006) 0.15 Maldives (2006) 0.35 Mongolia (2006) 0.04 Morocco (2006) 0.27Myanmar (2006) 0.004 Oman (2006) 0.20 Nicaragua (2004) 0.11 Panama (2006) 0.46Paraguay (2005) 0.08 Peru (2002) 0.41 Philippines (2006) 0.03 Republic of Moldova (2006) 0.35Poland (2005) 0.06 Saudi Arabia (2002) 0.49 Singapore (2006) 0.02 Serbia (2006) 0.19Tajikistan (2006) 0.08 Slovakia (2006) 0.30 Thailand (2006) 0.02 Slovenia (2006) 0.30Uruguay (2006) 0.09 Syrian Arab Republic (2002) 0.27
Median - highest Quartile (3) Above the highest Quartile (4) Kidnapping Kidnapping
Armenia (2006) 0.85 Australia (2006) 3.81Bangladesh (2006) 0.72 Bahrain (2004) 2.82 Bolivia (2002) 0.53 Belgium (2006) 3.68Chile (2006) 0.71 Belize (2002) 2.77 Cyprus (2006) 1.78 Bulgaria (2002) 2.46Georgia (2003) 0.77 Canada (2006) 13.82 Iceland (2006) 0.70 England and Wales (2006) 4.41Ireland (2006) 1.87 France (2006) 3.53 Jordan (2005) 0.59 India (2006) 2.09Kazakhstan (2006) 0.55 Kuwait (2006) 11.52 Lebanon (2004) 0.90 Luxembourg (2006) 5.14Lithuania (2006) 1.77 Northern Ireland (2006) 3.10 Mexico (2006) 0.56 Occupied Palestinian Territory (2006) 5.37Montenegro (2006) 0.64 Portugal (2006) 5.25 Nepal (2006) 0.89 Scotland (2004) 7.45New Zealand (2006) 0.91 South Africa (2004) 6.65 Qatar (2004) 0.75 Sri Lanka (2006) 4.48Romania (2006) 1.34 Swaziland (2006) 8.61 Spain (2004) 0.51 Switzerland (2004) 3.66The former Yugoslav Republic of Macedonia (2002) 1.18 Tunisia (2006) 5.77 Ukraine (2004) 0.50 Turkey (2006) 14.84Zimbabwe (2006) 1.58 Turkmenistan (2006) 2.66
United Arab Emirates (2006) 1.94
Mean 1.71st Quartile 0.2Median 0.53rd Quartile 1.9

48
49
International Statistics on Crime and Criminal Justice
Dru
g cr
ime
Chapter 3 – Drug crime
Steven Malby*
Abstract
This chapter presents available police recorded data on drug crime. Whilst many forms of crime mayultimately be driven by or related in some way to the use or effects of narcotic drugs or psychotropicsubstances, most countries also employ specific laws concerning the production, use, purchase and sale ofdrugs. It is offences under these specific laws with which this is concerned. Thedemonstrates the challenges of collection and cross national comparability of data on drug crime withreference to applicable international definitions and the translation of such definitions into national laws. Itexplores regional differences between the proportion of major to minor police recorded drug offences andexamines available trends in drug crime. It concludes that levels of police recorded drug offences are likelydriven as much by law enforcement policies and priorities concerning narcotic drugs and psychotropicsubstances as they are by underlying levels of drug use and markets.
Introduction
Crime recorded by law enforcement agencies maybe directly or indirectly related to drugs. Aproportion of crimes such as robbery, theft,assault or burglary are driven by underlyingfactors such as drug use. However, from astatistical point of view, the extent to which druguse is responsible for such crimes is not easilycaptured and rarely forms part of official reports.On the other hand, law enforcement agencies inmost countries produce and retain informationon offences that directly involve narcotic drugs orpsychotropic substances.
Collecting and analyzing such data on a crossnational basis presents a considerable challenge.National drug laws show significant variations inthe extent to which the range of possible actionsinvolving drugs (such as cultivation, possession,use, or sale) are made into criminal offences.National laws further differ on the extent towhich criminal sanctions apply according to theparticular drug and the specific amount inquestion.
Guidance on appropriate definitions in thisrespect may be obtained from the internationalframework for drug control. This consists of threedrug related treaties: The Single Convention onNarcotic Drugs of 1961 (as amended by the 1972
Protocol), the Convention on PsychotropicSubstances of 1971, and the United NationsConvention against Illicit Traffic in NarcoticDrugs and Psychotropic Substances of 1988. Over95 percent of all States have chosen to becomeparties to the conventions. The conventionsrequire parties to establish a wide range of drugrelated activities as criminal offences under theirdomestic law.
The Conventions do, however, grant somelatitude with regard to the penalization ofpersonal consumption related offences. Parties tothe 1961 Convention, for example, are underobligation not to permit the possession of drugsfor personal non medical consumption. Parties tothe 1988 Convention are required to establish ascriminal offences activities preparatory topersonal consumption (possession, purchase orcultivation), subject to each party’s constitutionalprinciples and basic legal concepts.
Analysis of the wording of the Conventionsindicates that there is a sharp distinctionbetween offences related to drug trafficking andoffences related to personal use of illicit drugs.This distinction can be used to define three broadcategories for data collection on offencesinvolving drugs:
*Research Officer, United Nations Office on Drugs and Crime (UNODC)
chapter chapter
50
Drug related crime (corresponding to alloffences involving drugs);
Drug possession/use (the ‘less serious’offence corresponding most closely topersonal use offences); and
Drug trafficking (the ‘more serious’ offencecorresponding more closely to theproduction, manufacture, delivery or sale ofdrugs not for personal use).
The Sixth to Tenth United Nations Surveys ofCrime Trends and Operations of Criminal JusticeSystems (UN CTS), covering the years 1995 to2006, collected data on the first of thesecategories; total drug related crime. The
definition supplied was drawn from theinternational drug conventions and includedcultivation, production, manufacture, extraction,preparation, offering for sale, distribution,purchase, sale, delivery on any terms whatsoever,brokerage, dispatch, dispatch in transit,transport, importation, exportation, possession ortrafficking of internationally controlled drugs.
The Tenth UN CTS (2005 2006) collected databoth on total drug related crime, and also ondrug trafficking, which it defined as ‘drugoffences, which are not in connection withpersonal use’. The Eleventh UN CTS (2007 2008)(data from which is not included in this analysis)expanded the questions further to cover all threecategories – total drug related crime,possession/use, and drug trafficking.
Drug crime data collection at the national and international level
Whilst the exact border between possession/useand trafficking offences will differ as betweencountries, the use of these categories offers abroad approach to data collection on less andmore serious drug offences. In national law andpractice, the distinction is likely to be madeeither by reference to the quantity of drugsinvolved or through the way in which the offenderoperates (such as part of organized criminaloperations). The distinction may be set out in aseparate ‘trafficking’ offence, or simply by anadditional criterion applied to a single generaldrug related crime offence.
For example, in Austria, offences akin to‘trafficking’ are distinguished based on thequantity of drug involved and an ‘intention to putit on the market’. The ‘trafficking’ offence is setout separately in law (Articles 28 (narcotic drugs)and 31 (psychotropic substances) of the NarcoticSubstances Act (Suchtmittelgesetz)) and Austriareports offences recorded under Articles 28 and 31at the international level when asked for drug‘trafficking’ offences under the definition ‘notsolely in connection with personal use’. A generalprimary offence (Article 27) covers possession,production, import, export and purchase ofquantities that do not qualify for the more seriousArticle 28 offence. Article 27 further includes a‘personal use’ exception that allows for a lessersentence in the case of personal use.
In Germany, a general primary offence (Article 29Narcotic Substances Act(Betäubungsmittelgesetz)) covers all drug relatedactivities, including cultivation, production,trade, import, export, sale, transfer, making
available, buying and possession. The law allowsthe prosecutor or the court to drop a case withrespect to small quantities for personalconsumption only. In addition to the ‘smallquantity’ provisions, the Act also specifies ‘largequantities’ (most important in Article 29a). Inorder to construct the number of drug‘trafficking’ offences it is necessary to add therelevant criminological categories of policestatistics together from the general primaryoffence and the different qualified offences(Articles 29a to 30b, mainly covering aggravatedforms of trafficking, such as trafficking of largequantities). These statistical categories includeillegal trade or smuggling, illegal importation oflarge quantities, cultivation, production ortrading, giving drugs to minors, and irresponsiblycausing the death of another by giving him or herdrugs. Moreover, the distinction for thesecategories can be made with respect to either‘medium’ quantities of drugs (not ‘small’ or‘large’) or only in respect of ‘large quantities’. Asshown in ox 2 in this chapter, this distinctioncan cause difficulties in the comparability of data,depending upon the approach adopted toreporting of data at the international or regionallevel.
Such examples illustrate the complexity oftranslating data recorded under national offencedefinitions into figures with some degree of crossnational comparability. Such differences are notlimited to the national level only however. At theinternational and regional level, a range ofapproaches to data collection on drug crime exist.
b
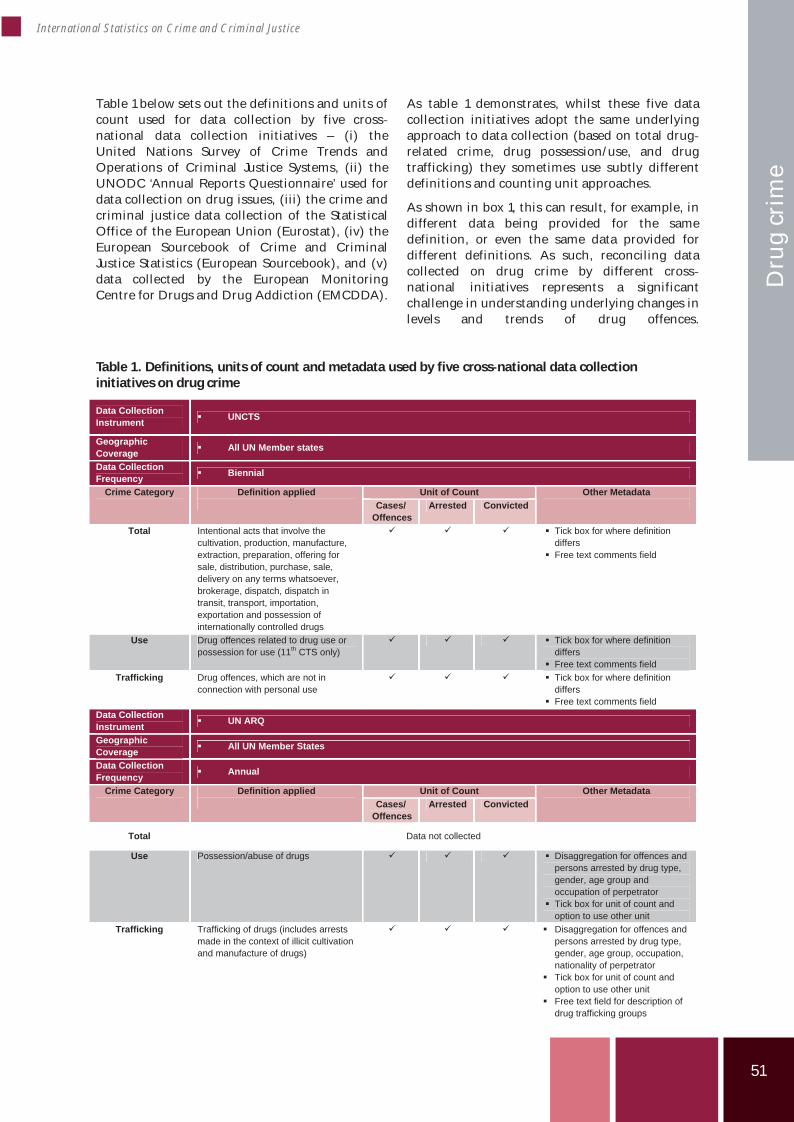
51
International Statistics on Crime and Criminal Justice
Dru
g cr
ime
Table 1 below sets out the definitions and units ofcount used for data collection by five crossnational data collection initiatives – (i) theUnited Nations Survey of Crime Trends andOperations of Criminal Justice Systems, (ii) theUNODC ‘Annual Reports Questionnaire’ used fordata collection on drug issues, (iii) the crime andcriminal justice data collection of the StatisticalOffice of the European Union (Eurostat), (iv) theEuropean Sourcebook of Crime and CriminalJustice Statistics (European Sourcebook), and (v)data collected by the European MonitoringCentre for Drugs and Drug Addiction (EMCDDA).
As table 1 demonstrates, whilst these five datacollection initiatives adopt the same underlyingapproach to data collection (based on total drugrelated crime, drug possession/use, and drugtrafficking) they sometimes use subtly differentdefinitions and counting unit approaches.
As shown in box 1, this can result, for example, indifferent data being provided for the samedefinition, or even the same data provided fordifferent definitions. As such, reconciling datacollected on drug crime by different crossnational initiatives represents a significantchallenge in understanding underlying changes inlevels and trends of drug offences.
Table 1. Definitions, units of count and metadata used by five cross national data collectioninitiatives on drug crime
Data Collection Instrument UNCTS
Geographic Coverage All UN Member states
Data Collection Frequency Biennial
Unit of Count Crime Category Definition applied Cases/
OffencesArrested Convicted
Other Metadata
Total Intentional acts that involve the cultivation, production, manufacture, extraction, preparation, offering for sale, distribution, purchase, sale, delivery on any terms whatsoever, brokerage, dispatch, dispatch in transit, transport, importation, exportation and possession of internationally controlled drugs
Tick box for where definition differs
Free text comments field
Use Drug offences related to drug use or possession for use (11th CTS only)
Tick box for where definition differs
Free text comments field Trafficking Drug offences, which are not in
connection with personal use Tick box for where definition differs
Free text comments field Data Collection Instrument UN ARQ
Geographic Coverage All UN Member States
Data Collection Frequency Annual
Unit of Count Crime Category Definition applied Cases/
OffencesArrested Convicted
Other Metadata
Total Data not collected
Use Possession/abuse of drugs Disaggregation for offences and persons arrested by drug type, gender, age group and occupation of perpetrator
Tick box for unit of count and option to use other unit
Trafficking Trafficking of drugs (includes arrests made in the context of illicit cultivation and manufacture of drugs)
Disaggregation for offences and persons arrested by drug type, gender, age group, occupation, nationality of perpetrator
Tick box for unit of count and option to use other unit
Free text field for description of drug trafficking groups
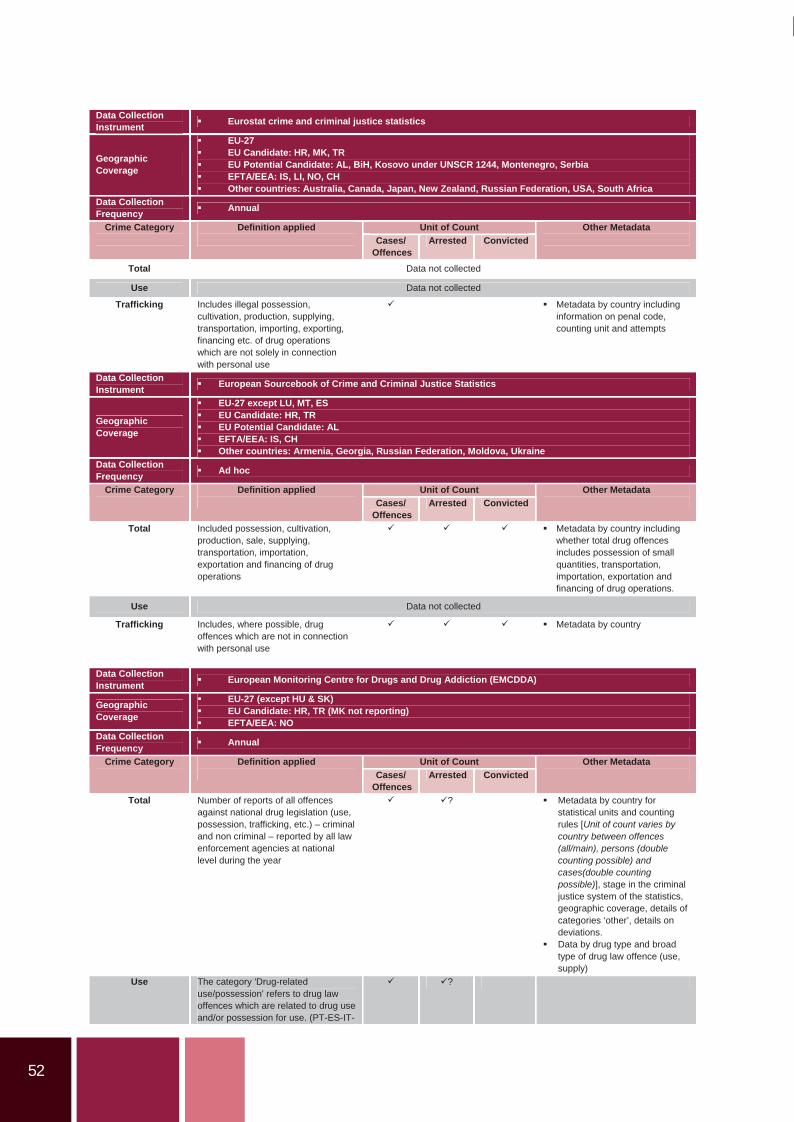
52
Data Collection Instrument Eurostat crime and criminal justice statistics
Geographic Coverage
EU-27EU Candidate: HR, MK, TR EU Potential Candidate: AL, BiH, Kosovo under UNSCR 1244, Montenegro, Serbia EFTA/EEA: IS, LI, NO, CH Other countries: Australia, Canada, Japan, New Zealand, Russian Federation, USA, South Africa
Data Collection Frequency Annual
Unit of Count Crime Category Definition applied Cases/
OffencesArrested Convicted
Other Metadata
Total Data not collected
Use Data not collected
Trafficking Includes illegal possession, cultivation, production, supplying, transportation, importing, exporting, financing etc. of drug operations which are not solely in connection with personal use
Metadata by country including information on penal code, counting unit and attempts
Data Collection Instrument European Sourcebook of Crime and Criminal Justice Statistics
Geographic Coverage
EU-27 except LU, MT, ES EU Candidate: HR, TR EU Potential Candidate: AL EFTA/EEA: IS, CH Other countries: Armenia, Georgia, Russian Federation, Moldova, Ukraine
Data Collection Frequency Ad hoc
Unit of Count Crime Category Definition applied Cases/
OffencesArrested Convicted
Other Metadata
Total Included possession, cultivation, production, sale, supplying, transportation, importation, exportation and financing of drug operations
Metadata by country including whether total drug offences includes possession of small quantities, transportation, importation, exportation and financing of drug operations.
Use Data not collected
Trafficking Includes, where possible, drug offences which are not in connection with personal use
Metadata by country
Data Collection Instrument European Monitoring Centre for Drugs and Drug Addiction (EMCDDA)
Geographic Coverage
EU-27 (except HU & SK) EU Candidate: HR, TR (MK not reporting) EFTA/EEA: NO
Data Collection Frequency Annual
Unit of Count Crime Category Definition applied Cases/
OffencesArrested Convicted
Other Metadata
Total Number of reports of all offences against national drug legislation (use, possession, trafficking, etc.) – criminal and non criminal – reported by all law enforcement agencies at national level during the year
? Metadata by country for statistical units and counting rules [Unit of count varies by country between offences (all/main), persons (double counting possible) and cases(double counting possible)], stage in the criminal justice system of the statistics, geographic coverage, details of categories ‘other’, details on deviations.
Data by drug type and broad type of drug law offence (use, supply)
Use The category 'Drug-related use/possession' refers to drug law offences which are related to drug use and/or possession for use. (PT-ES-IT-
?
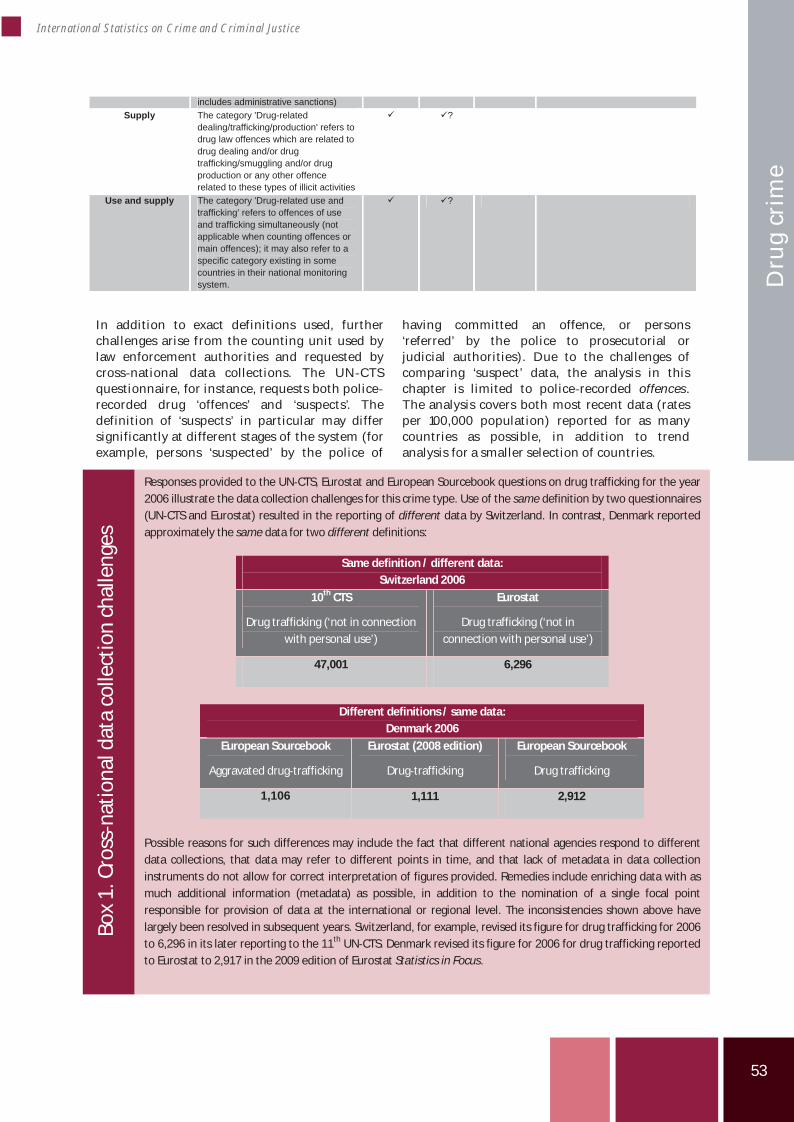
53
International Statistics on Crime and Criminal Justice
Dru
g cr
ime
includes administrative sanctions) Supply The category 'Drug-related
dealing/trafficking/production' refers to drug law offences which are related to drug dealing and/or drug trafficking/smuggling and/or drug production or any other offence related to these types of illicit activities
?
Use and supply The category 'Drug-related use and trafficking' refers to offences of use and trafficking simultaneously (not applicable when counting offences or main offences); it may also refer to a specific category existing in some countries in their national monitoring system.
?
In addition to exact definitions used, furtherchallenges arise from the counting unit used bylaw enforcement authorities and requested bycross national data collections. The UN CTSquestionnaire, for instance, requests both policerecorded drug ‘offences’ and ‘suspects’. Thedefinition of ‘suspects’ in particular may differsignificantly at different stages of the system (forexample, persons ‘suspected’ by the police of
having committed an offence, or persons‘referred’ by the police to prosecutorial orjudicial authorities). Due to the challenges ofcomparing ‘suspect’ data, the analysis in thischapter is limited to police recorded offences.The analysis covers both most recent data (ratesper 100,000 population) reported for as manycountries as possible, in addition to trendanalysis for a smaller selection of countries.
Box
1.Cr
oss
natio
nald
ata
colle
ctio
nch
alle
nges
Responses provided to the UN CTS, Eurostat and European Sourcebook questions on drug trafficking for the year2006 illustrate the data collection challenges for this crime type. Use of the same definition by two questionnaires(UN CTS and Eurostat) resulted in the reporting of different data by Switzerland. In contrast, Denmark reportedapproximately the same data for two different definitions:
Same definition / different data:Switzerland 2006
10th CTS
Drug trafficking (‘not in connectionwith personal use’)
Eurostat
Drug trafficking (‘not inconnection with personal use’)
47,001 6,296
Different definitions / same data:Denmark 2006
European Sourcebook
Aggravated drug trafficking
Eurostat (2008 edition)
Drug trafficking
European Sourcebook
Drug trafficking
1,106 1,111 2,912
Possible reasons for such differences may include the fact that different national agencies respond to differentdata collections, that data may refer to different points in time, and that lack of metadata in data collectioninstruments do not allow for correct interpretation of figures provided. Remedies include enriching data with asmuch additional information (metadata) as possible, in addition to the nomination of a single focal pointresponsible for provision of data at the international or regional level. The inconsistencies shown above havelargely been resolved in subsequent years. Switzerland, for example, revised its figure for drug trafficking for 2006to 6,296 in its later reporting to the 11th UN CTS. Denmark revised its figure for 2006 for drug trafficking reportedto Eurostat to 2,917 in the 2009 edition of Eurostat Statistics in Focus.
54
Relationship between total drug related crime and drug trafficking
Despite the challenges of drug crime datarecording and collection at national andinternational level, it nonetheless remainspossible to carry out some analysis, at least whendealing with a single data source such as the UNCTS.
A first approach to analysis that may proveinformative concerns the relationship betweenoverall, or total, drug related crime, and the moreserious end of the spectrum of drug crime, suchas drug trafficking. Whilst drug traffickingoffences are themselves often included in thetotal number of drug related crime offencesreported, examination of the relative size of thetwo numbers (total offences and traffickingoffences) nonetheless provides some indicationof the response of the criminal justice system todrug issues.
Where a large number of, more minor, drugpersonal use offences are recorded, the totalnumber of recorded drug related offences islikely to be relatively large in comparison to drugtrafficking offences. In comparison, where thecriminal justice system does not focus on moreminor offences, drug trafficking offences mayconstitute a greater proportion of overall drugrelated crime.
The table in the Annex to this chapter shows ratesper 100,000 population of police recorded totaldrug related crime and drug trafficking asreported to the UN CTS, for the latest availableyear after 2000. As noted above, data for drugtrafficking were only collected by the Tenth UNCTS, covering the years 2005 and 2006.
Data from some 109 countries for whichinformation is available indicates that the medianrate for total drug related offences (latestavailable year, 2002 2006) is 45 per 100,000population.
In contrast, the median rate for drug traffickingoffences (55 countries, latest available year, 20052006) is 20 per 100,000 population.
Both measures, however, show a huge range ofvalues. Total drug related offences show amaximum of 868 per 100,000 population and aminimum reported value of 0.15 per 100,000
population. The range of responses for drugtrafficking offences shows a maximum of 628 per100,000 population and a minimum of 0.07 per100,000 population.
Caution must however be exercised in theinterpretation of results. The number of drugoffences recorded is a product both of the extentof underlying drug activity and the extent of drugenforcement activities. As a result, it is possiblethat countries with relatively minor drugproblems can have drug offence rates higher thanthose with very severe ones.
Data published by UNODC in the World DrugReport 2009, for example, suggests that lawenforcement priorities play a particularlyimportant role when it comes to levels of policerecorded drug offences. Of all countries whichshowed an increase in drug trafficking offencesover a two year period, for example, almost 70percent also showed an increase in possessionoffences (UNODC 2009). This strong associationsuggests that overall levels of recorded offencesmay be driven by law enforcement priorities asmuch as changes in the drug situation itself.
At the regional level, despite the limited numberof countries for which data is available (Africa, 4countries; Americas, 6 countries; Asia, 14countries; Europe, 26 countries) some patternscan nonetheless be identified.
Figure 1 shows police recorded rates per 100,000population for both total drug related offencesand drug trafficking offences.
Median rates of police recorded drug traffickingoffences are reasonably comparable. This is likelydue to the somewhat more restricted definitionof this crime, than the more general ‘total drugrelated offences’.
Police recorded drug trafficking rates per 100,000population were highest in Europe (around 30per 100,000 population) and lowest in Asia(around 10 per 100,000 population). Rates of totalpolice recorded drug related crime showedconsiderably greater variability with a particularlyhigh number of drug related crime offences inEurope (over 80 per 100,000 population) ascompared with other regions.
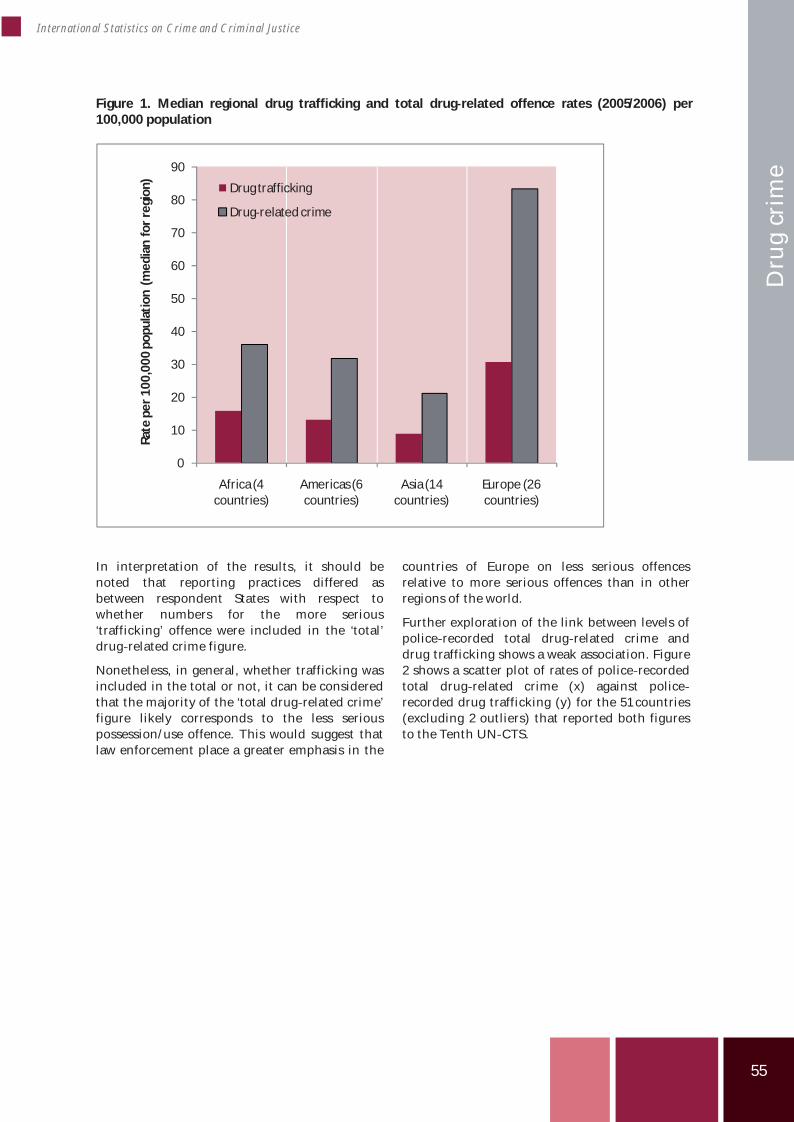
55
International Statistics on Crime and Criminal Justice
Dru
g cr
ime
Figure 1. Median regional drug trafficking and total drug related offence rates (2005/2006) per100,000 population
In interpretation of the results, it should benoted that reporting practices differed asbetween respondent States with respect towhether numbers for the more serious‘trafficking’ offence were included in the ‘total’drug related crime figure.
Nonetheless, in general, whether trafficking wasincluded in the total or not, it can be consideredthat the majority of the ‘total drug related crime’figure likely corresponds to the less seriouspossession/use offence. This would suggest thatlaw enforcement place a greater emphasis in the
countries of Europe on less serious offencesrelative to more serious offences than in otherregions of the world.
Further exploration of the link between levels ofpolice recorded total drug related crime anddrug trafficking shows a weak association. Figure2 shows a scatter plot of rates of police recordedtotal drug related crime (x) against policerecorded drug trafficking (y) for the 51 countries(excluding 2 outliers) that reported both figuresto the Tenth UN CTS.
0
10
20
30
40
50
60
70
80
90
Africa (4countries)
Americas (6countries)
Asia (14countries)
Europe (26countries)
Rate
per
100,
000
popu
lati
on(m
edia
nfo
rre
gion
)
Drug trafficking
Drug related crime
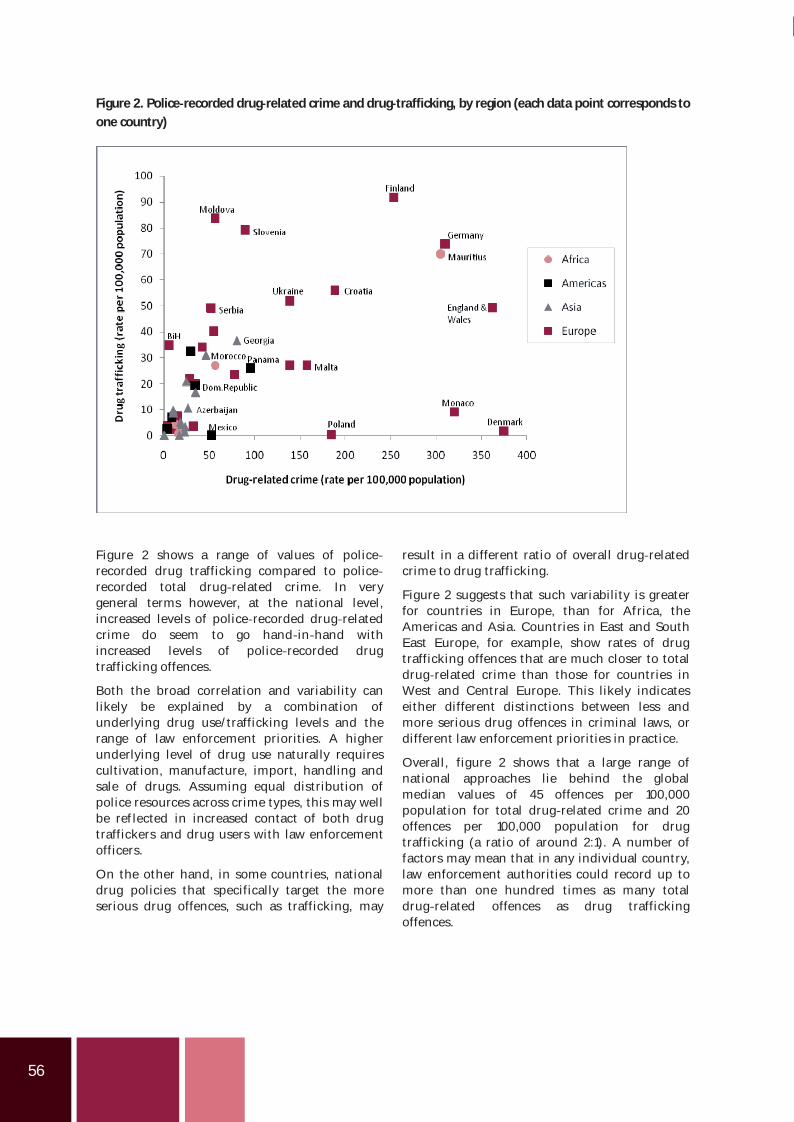
56
Figure 2. Police recorded drug related crime and drug trafficking, by region (each data point corresponds toone country)
Figure 2 shows a range of values of policerecorded drug trafficking compared to policerecorded total drug related crime. In verygeneral terms however, at the national level,increased levels of police recorded drug relatedcrime do seem to go hand in hand withincreased levels of police recorded drugtrafficking offences.
Both the broad correlation and variability canlikely be explained by a combination ofunderlying drug use/trafficking levels and therange of law enforcement priorities. A higherunderlying level of drug use naturally requirescultivation, manufacture, import, handling andsale of drugs. Assuming equal distribution ofpolice resources across crime types, this may wellbe ref lected in increased contact of both drugtraffickers and drug users with law enforcementofficers.
On the other hand, in some countries, nationaldrug policies that specifically target the moreserious drug offences, such as trafficking, may
result in a different ratio of overall drug relatedcrime to drug trafficking.
Figure 2 suggests that such variability is greaterfor countries in Europe, than for Africa, theAmericas and Asia. Countries in East and SouthEast Europe, for example, show rates of drugtrafficking offences that are much closer to totaldrug related crime than those for countries inWest and Central Europe. This likely indicateseither different distinctions between less andmore serious drug offences in criminal laws, ordifferent law enforcement priorities in practice.
Overall, figure 2 shows that a large range ofnational approaches lie behind the globalmedian values of 45 offences per 100,000population for total drug related crime and 20offences per 100,000 population for drugtrafficking (a ratio of around 2:1). A number offactors may mean that in any individual country,law enforcement authorities could record up tomore than one hundred times as many totaldrug related offences as drug traffickingoffences.
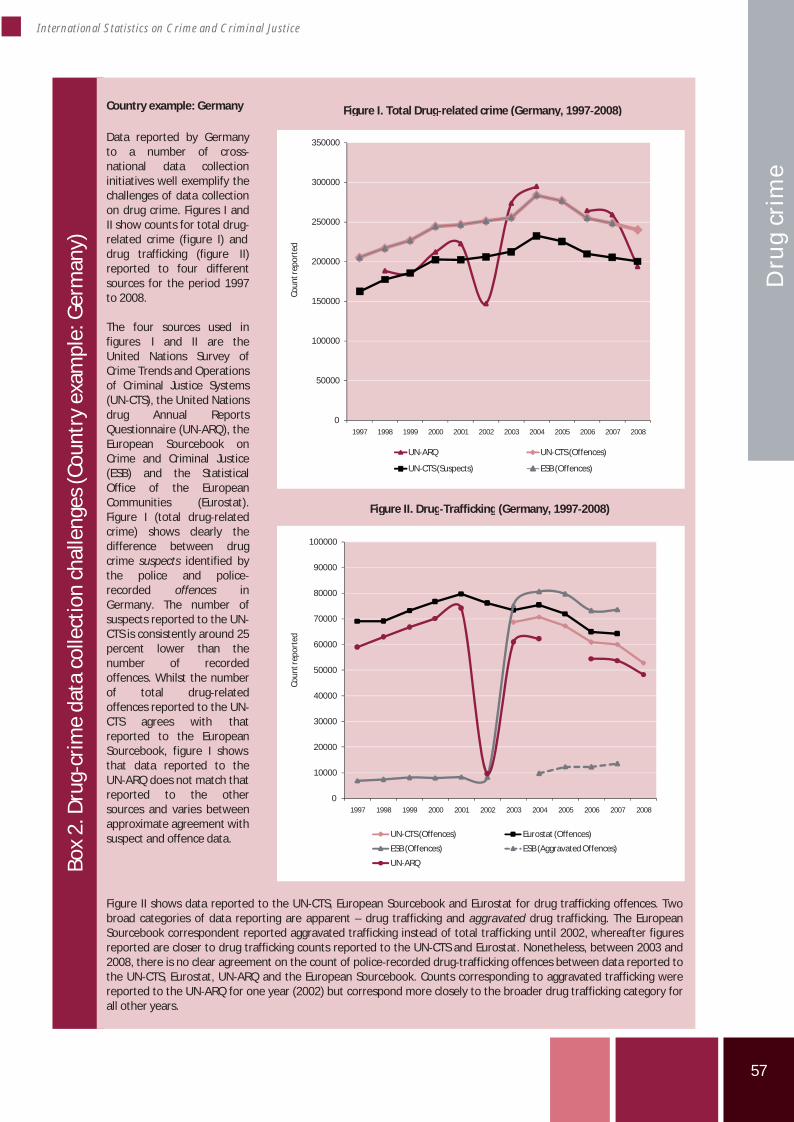
57
International Statistics on Crime and Criminal Justice
Dru
g cr
ime
Box
2.D
rug
crim
eda
taco
llect
ion
chal
leng
es(C
ount
ryex
ampl
e:G
erm
any)
Country example: Germany
Data reported by Germanyto a number of crossnational data collectioninitiatives well exemplify thechallenges of data collectionon drug crime. Figures I andII show counts for total drugrelated crime (figure I) anddrug trafficking (figure II)reported to four differentsources for the period 1997to 2008.
The four sources used inI and II are the
United Nations Survey ofCrime Trends and Operationsof Criminal Justice Systems(UN CTS), the United Nationsdrug Annual ReportsQuestionnaire (UN ARQ), theEuropean Sourcebook onCrime and Criminal Justice(ESB) and the StatisticalOffice of the EuropeanCommunities (Eurostat).Figure I (total drug relatedcrime) shows clearly thedifference between drugcrime suspects identified bythe police and policerecorded offences inGermany. The number ofsuspects reported to the UNCTS is consistently around 25percent lower than thenumber of recordedoffences. Whilst the numberof total drug relatedoffences reported to the UNCTS agrees with thatreported to the EuropeanSourcebook, igure I showsthat data reported to theUN ARQ does not match thatreported to the othersources and varies betweenapproximate agreement withsuspect and offence data.
Figure II shows data reported to the UN CTS, European Sourcebook and Eurostat for drug trafficking offences. Twobroad categories of data reporting are apparent – drug trafficking and aggravated drug trafficking. The EuropeanSourcebook correspondent reported aggravated trafficking instead of total trafficking until 2002, whereafter figuresreported are closer to drug trafficking counts reported to the UN CTS and Eurostat. Nonetheless, between 2003 and2008, there is no clear agreement on the count of police recorded drug trafficking offences between data reported tothe UN CTS, Eurostat, UN ARQ and the European Sourcebook. Counts corresponding to aggravated trafficking werereported to the UN ARQ for one year (2002) but correspond more closely to the broader drug trafficking category forall other years.
0
10000
20000
30000
40000
50000
60000
70000
80000
90000
100000
1997 1998 1999 2000 2001 2002 2003 2004 2005 2006 2007 2008
Coun
trep
orte
d
UN CTS (Offences) Eurostat (Offences)
ESB (Offences) ESB (Aggravated Offences)
UN ARQ
Figure I. Total Drug related crime (Germany, 1997 2008)
Figure II. Drug Trafficking (Germany, 1997 2008)
0
50000
100000
150000
200000
250000
300000
350000
1997 1998 1999 2000 2001 2002 2003 2004 2005 2006 2007 2008
Coun
trep
orte
d
UN ARQ UN CTS (Offences)
UN CTS (Suspects) ESB (Offences)
figures
f
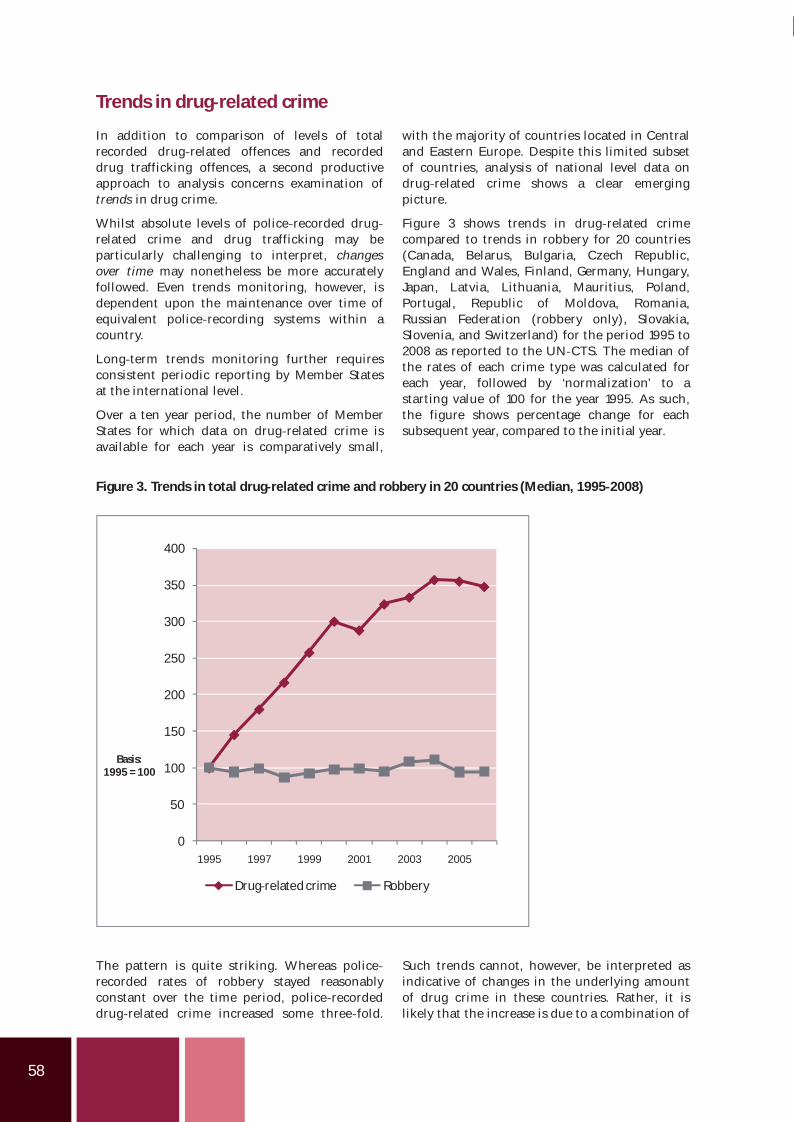
58
Trends in drug related crime
In addition to comparison of levels of totalrecorded drug related offences and recordeddrug trafficking offences, a second productiveapproach to analysis concerns examination oftrends in drug crime.
Whilst absolute levels of police recorded drugrelated crime and drug trafficking may beparticularly challenging to interpret, changesover time may nonetheless be more accuratelyfollowed. Even trends monitoring, however, isdependent upon the maintenance over time ofequivalent police recording systems within acountry.
Long term trends monitoring further requiresconsistent periodic reporting by Member Statesat the international level.
Over a ten year period, the number of MemberStates for which data on drug related crime isavailable for each year is comparatively small,
with the majority of countries located in Centraland Eastern Europe. Despite this limited subsetof countries, analysis of national level data ondrug related crime shows a clear emergingpicture.
Figure 3 shows trends in drug related crimecompared to trends in robbery for 20 countries(Canada, Belarus, Bulgaria, Czech Republic,England and Wales, Finland, Germany, Hungary,Japan, Latvia, Lithuania, Mauritius, Poland,Portugal, Republic of Moldova, Romania,Russian Federation (robbery only), Slovakia,Slovenia, and Switzerland) for the period 1995 to2008 as reported to the UN CTS. The median ofthe rates of each crime type was calculated foreach year, followed by ‘normalization’ to astarting value of 100 for the year 1995. As such,the figure shows percentage change for eachsubsequent year, compared to the initial year.
Figure 3. Trends in total drug related crime and robbery in 20 countries (Median, 1995 2008)
The pattern is quite striking. Whereas policerecorded rates of robbery stayed reasonablyconstant over the time period, police recordeddrug related crime increased some three fold.
Such trends cannot, however, be interpreted asindicative of changes in the underlying amountof drug crime in these countries. Rather, it islikely that the increase is due to a combination of
0
50
100
150
200
250
300
350
400
1995 1997 1999 2001 2003 2005
Basis:1995 = 100
Drug related crime Robbery
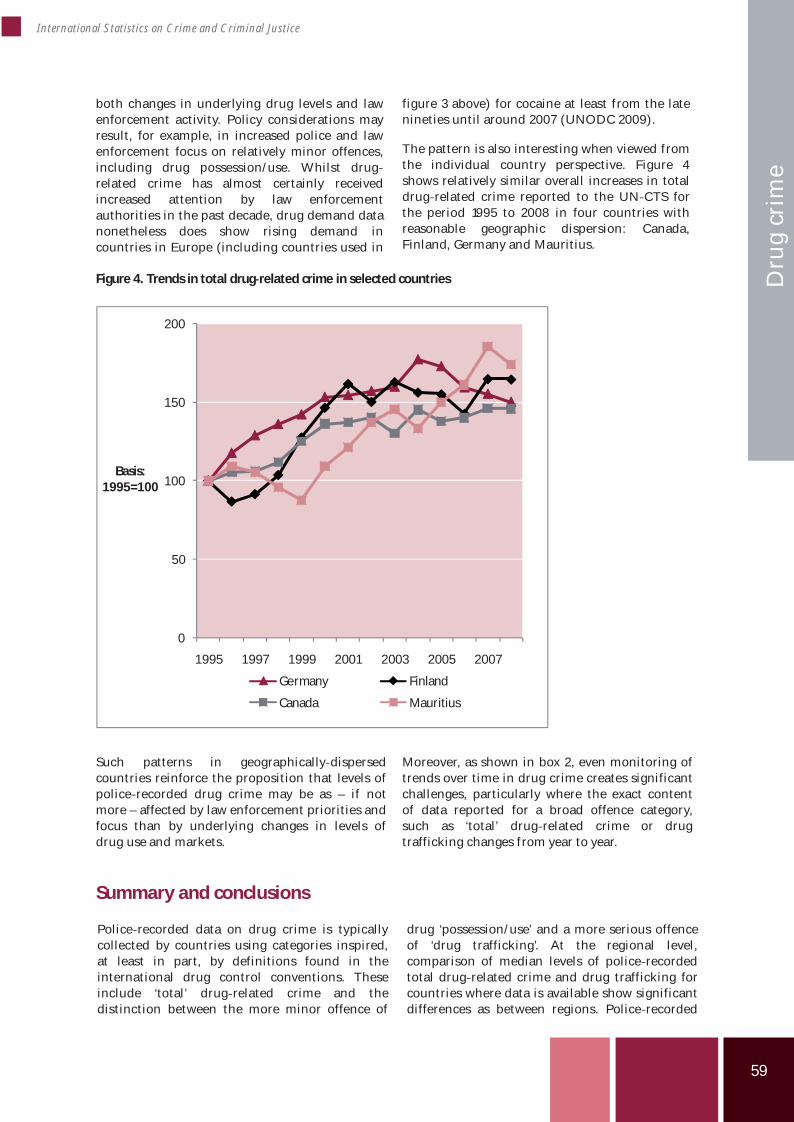
59
International Statistics on Crime and Criminal Justice
Dru
g cr
ime
both changes in underlying drug levels and lawenforcement activity. Policy considerations mayresult, for example, in increased police and lawenforcement focus on relatively minor offences,including drug possession/use. Whilst drugrelated crime has almost certainly receivedincreased attention by law enforcementauthorities in the past decade, drug demand datanonetheless does show rising demand incountries in Europe (including countries used in
figure 3 above) for cocaine at least from the latenineties until around 2007 (UNODC 2009).
The pattern is also interesting when viewed fromthe individual country perspective. Figure 4shows relatively similar overall increases in totaldrug related crime reported to the UN CTS forthe period 1995 to 2008 in four countries withreasonable geographic dispersion: Canada,Finland, Germany and Mauritius.
Figure 4. Trends in total drug related crime in selected countries
Such patterns in geographically dispersedcountries reinforce the proposition that levels ofpolice recorded drug crime may be as – if notmore – affected by law enforcement priorities andfocus than by underlying changes in levels ofdrug use and markets.
Moreover, as shown in box 2, even monitoring oftrends over time in drug crime creates significantchallenges, particularly where the exact contentof data reported for a broad offence category,such as ‘total’ drug related crime or drugtrafficking changes from year to year.
Summary and conclusions
Police recorded data on drug crime is typicallycollected by countries using categories inspired,at least in part, by definitions found in theinternational drug control conventions. Theseinclude ‘total’ drug related crime and thedistinction between the more minor offence of
drug ‘possession/use’ and a more serious offenceof ‘drug trafficking’. At the regional level,comparison of median levels of police recordedtotal drug related crime and drug trafficking forcountries where data is available show significantdifferences as between regions. Police recorded
0
50
100
150
200
1995 1997 1999 2001 2003 2005 2007
Basis:1995=100
Germany Finland
Canada Mauritius
60
drug trafficking rates per 100,000 populationwere highest in Europe (around 30 per 100,000population) and lowest in Asia (around 10 per100,000 population). Rates of total policerecorded drug related crime showed considerablygreater variability with a particularly highnumber of drug related crime offences in Europe(over 80 per 100,000 population) as comparedwith other regions. Caution must be exercised ininterpretation of such results however. Thecontent of data reported as drug traffickingoffences differs significantly as between countriesin terms of the range of actions (such asproduction, selling, transport) that are includedand the seriousness threshold (such asweight/amount of drug or intent to supply). Inaddition, overall numbers of police recordedoffences are likely to be as related to lawenforcement policies and activities as they are tounderlying levels of drug use and markets.
Indeed, trend analysis in countries with availabledata suggests that a number of geographicallydispersed countries show broadly equivalentincreasing trends in drug related crime,supporting the proposition that such changesmay be related to law enforcement activity.Analysis of trend data from individual countriesusing multiple sources further highlights thechallenges in collection and reporting of drugcrime data. A number of cross national sourcesare seen to report non identical data for the samedefinition and same year for the same country.
Improvement of data accuracy and availability ondrug crime requires careful use of definitions incross national data collection instruments andthe inclusion of additional questions (metadata)in order to understand the content of offencecounts reported by national law enforcementauthorities.
References
Aebi MF, Aromaa K, Aubusson de Cavarlay B,Barclay G, Gruszczyñska B, Hofer H von, Hysi V,Jehle J M, Killias M, Smit P, Tavares C 2003.European Sourcebook of Crime and CriminalJustice Statistics – 2003, 2nd edition. Den Haag:Boom.
Aebi MF, Aromaa K, Aubusson de Cavarlay, B,Barclay, G, Gruszczyñska B, von Hofer H, Hysi V,Jehle J M, Killias M, Smit P, Tavares C .EuropeanSourcebook of Crime and Criminal JusticeStatistics 2006. 3rd edition. Den Haag: Boom.
Aebi MF, Aubusson de Cavarlay B, Barclay G,Gruszczyñska B, Harrendorf S, Heiskanen M,Hysi V, Jaquier V, Jehle J M, Killias M, Shostko O,
Smit P and Thorisdottir R 2010. EuropeanSourcebook of Crime and Criminal JusticeStatistics – 2010, 4th edition. Den Haag: Boom.
European Monitoring Centre for Drugs and DrugAddiction 2009. Drug law offences. Available at:http://www.emcdda.europa.eu/stats09/dlo
Eurostat 2009. Statistics in Focus 36/2009, Crimeand Criminal Justice.
Eurostat 2008. Statistics in Focus 19/2008, Crimeand Criminal Justice.
UNODC 2009 World Drug Report. Drug relatedcrime data published in Statistical Annex.
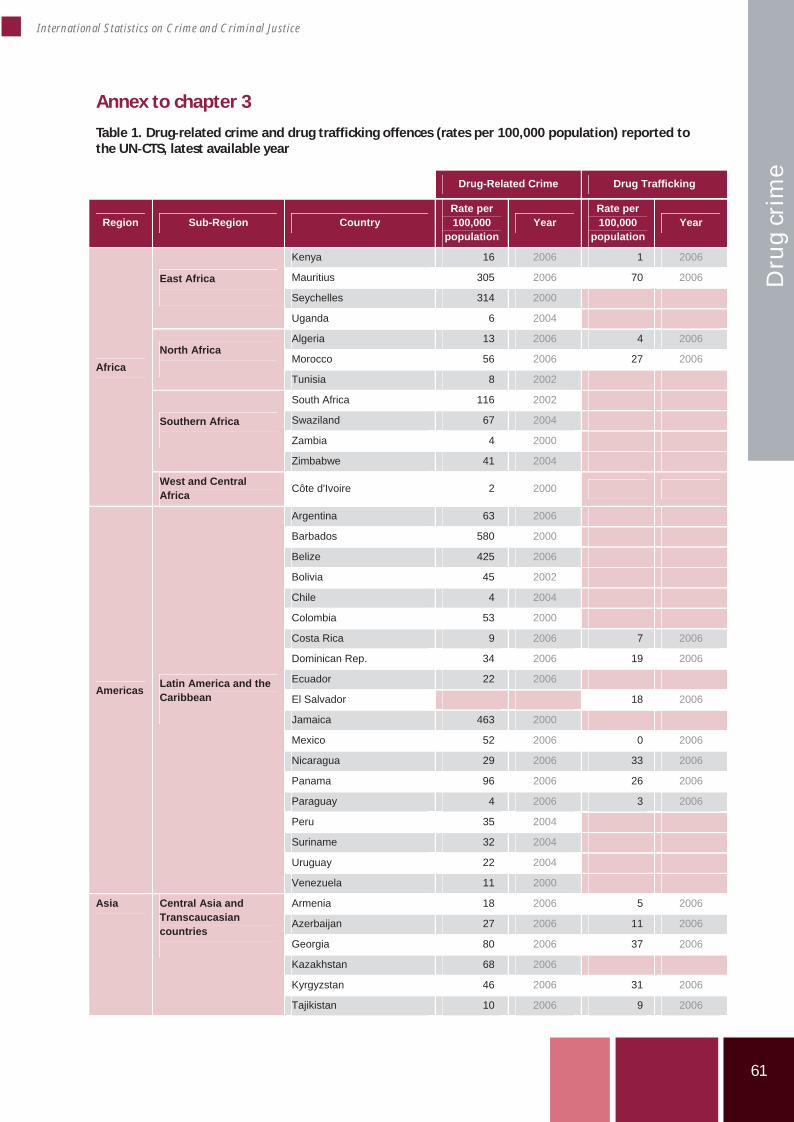
61
International Statistics on Crime and Criminal Justice
Dru
g cr
ime
Annex to hapter 3
Table 1. Drug related crime and drug trafficking offences (rates per 100,000 population) reported tothe UN CTS, latest available year
Drug-Related Crime Drug Trafficking
Region Sub-Region Country Rate per 100,000
population Year
Rate per 100,000
population Year
Kenya 16 2006 1 2006
Mauritius 305 2006 70 2006
Seychelles 314 2000
East Africa
Uganda 6 2004
Algeria 13 2006 4 2006
Morocco 56 2006 27 2006North Africa
Tunisia 8 2002
South Africa 116 2002
Swaziland 67 2004
Zambia 4 2000
Southern Africa
Zimbabwe 41 2004
Africa
West and Central Africa Côte d'Ivoire 2 2000
Argentina 63 2006
Barbados 580 2000
Belize 425 2006
Bolivia 45 2002
Chile 4 2004
Colombia 53 2000
Costa Rica 9 2006 7 2006
Dominican Rep. 34 2006 19 2006
Ecuador 22 2006
El Salvador 18 2006
Jamaica 463 2000
Mexico 52 2006 0 2006
Nicaragua 29 2006 33 2006
Panama 96 2006 26 2006
Paraguay 4 2006 3 2006
Peru 35 2004
Suriname 32 2004
Uruguay 22 2004
Americas Latin America and the Caribbean
Venezuela 11 2000
Armenia 18 2006 5 2006
Azerbaijan 27 2006 11 2006
Georgia 80 2006 37 2006
Kazakhstan 68 2006
Kyrgyzstan 46 2006 31 2006
Asia Central Asia and Transcaucasian countries
Tajikistan 10 2006 9 2006
c
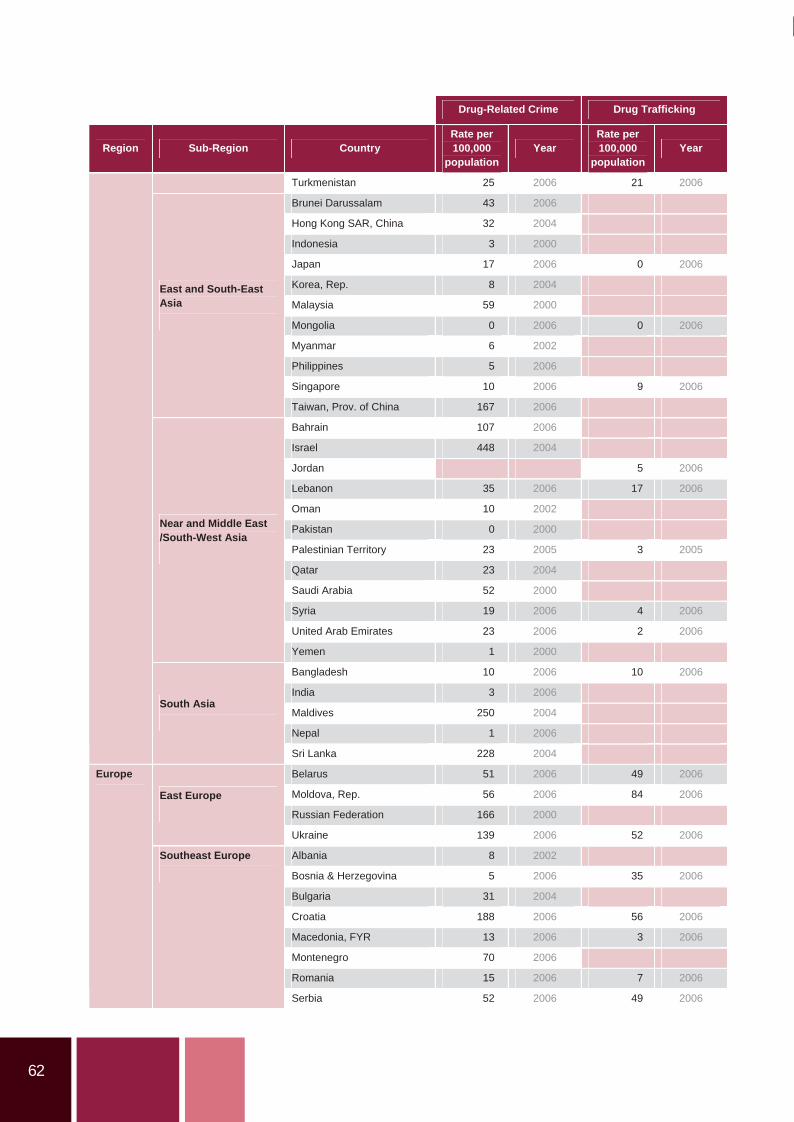
62
Drug-Related Crime Drug Trafficking
Region Sub-Region Country Rate per 100,000
population Year
Rate per 100,000
population Year
Turkmenistan 25 2006 21 2006
Brunei Darussalam 43 2006
Hong Kong SAR, China 32 2004
Indonesia 3 2000
Japan 17 2006 0 2006
Korea, Rep. 8 2004
Malaysia 59 2000
Mongolia 0 2006 0 2006
Myanmar 6 2002
Philippines 5 2006
Singapore 10 2006 9 2006
East and South-East Asia
Taiwan, Prov. of China 167 2006
Bahrain 107 2006
Israel 448 2004
Jordan 5 2006
Lebanon 35 2006 17 2006
Oman 10 2002
Pakistan 0 2000
Palestinian Territory 23 2005 3 2005
Qatar 23 2004
Saudi Arabia 52 2000
Syria 19 2006 4 2006
United Arab Emirates 23 2006 2 2006
Near and Middle East /South-West Asia
Yemen 1 2000
Bangladesh 10 2006 10 2006
India 3 2006
Maldives 250 2004
Nepal 1 2006
South Asia
Sri Lanka 228 2004
Belarus 51 2006 49 2006
Moldova, Rep. 56 2006 84 2006
Russian Federation 166 2000
East Europe
Ukraine 139 2006 52 2006
Albania 8 2002
Bosnia & Herzegovina 5 2006 35 2006
Bulgaria 31 2004
Croatia 188 2006 56 2006
Macedonia, FYR 13 2006 3 2006
Montenegro 70 2006
Romania 15 2006 7 2006
Europe
Southeast Europe
Serbia 52 2006 49 2006
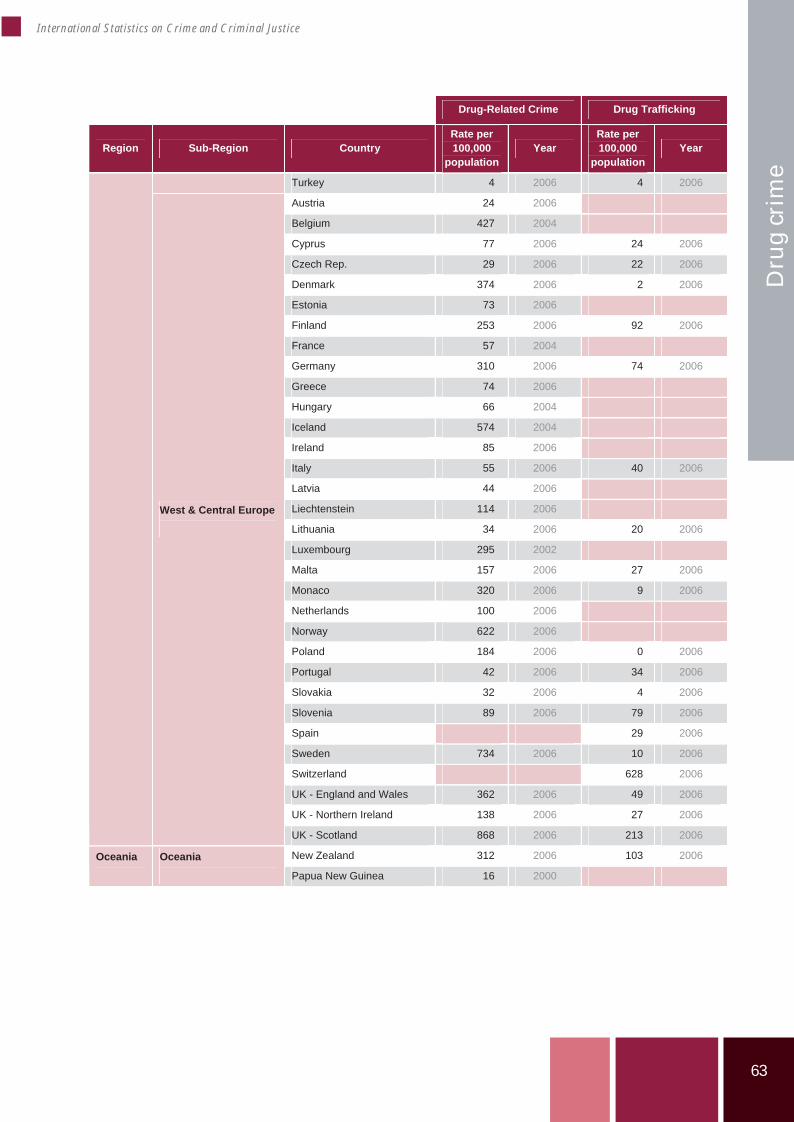
63
International Statistics on Crime and Criminal Justice
Dru
g cr
ime
Drug-Related Crime Drug Trafficking
Region Sub-Region Country Rate per 100,000
population Year
Rate per 100,000
population Year
Turkey 4 2006 4 2006
Austria 24 2006
Belgium 427 2004
Cyprus 77 2006 24 2006
Czech Rep. 29 2006 22 2006
Denmark 374 2006 2 2006
Estonia 73 2006
Finland 253 2006 92 2006
France 57 2004
Germany 310 2006 74 2006
Greece 74 2006
Hungary 66 2004
Iceland 574 2004
Ireland 85 2006
Italy 55 2006 40 2006
Latvia 44 2006
Liechtenstein 114 2006
Lithuania 34 2006 20 2006
Luxembourg 295 2002
Malta 157 2006 27 2006
Monaco 320 2006 9 2006
Netherlands 100 2006
Norway 622 2006
Poland 184 2006 0 2006
Portugal 42 2006 34 2006
Slovakia 32 2006 4 2006
Slovenia 89 2006 79 2006
Spain 29 2006
Sweden 734 2006 10 2006
Switzerland 628 2006
UK - England and Wales 362 2006 49 2006
UK - Northern Ireland 138 2006 27 2006
West & Central Europe
UK - Scotland 868 2006 213 2006
New Zealand 312 2006 103 2006Oceania Oceania
Papua New Guinea 16 2000

64
65
International Statistics on Crime and Criminal Justice
Com
plex
cri
mes
Chapter 4 – Complex crimes
Anna Alvazzi del Frate*
AbstractThis chapter presents available data on ‘complex crimes’, i.e. a category of crimes which are legally definedand identified by national and international law, but hardly fall into the category of ‘volume’ crime. Yet,such crimes are highly relevant from a policy point of view, since they may be considered among the mostserious threats to stability of any country, and are often transnational in their nature, thus affecting morethan one country at the same time. Organized crime, trafficking in persons, smuggling of migrants,currency counterfeiting and corruption are surely considered among the most dangerous crimes affectingsocieties but their seriousness cannot be assessed by their frequency in administrative statistics.Nevertheless, awareness of the dimensions of such phenomena may be crucial for the development of anyprevention and control strategy. However, the current availability of data, especially administrativestatistics, on such crimes is particularly limited, thus making the analysis and understanding of thedimensions and characteristics of crime problems a very difficult task.
Introduction
An accurate description of the crime situationrequires development of statistics and researchthat reveal the nature and extent of both‘conventional’ crime and organized, transnationalor complex crimes. Organized crime, traffickingin persons, smuggling of migrants, bribery/corruption and counterfeited currency werecovered by the Tenth United Nations Survey ofCrime Trends and Operations of Criminal JusticeSystems (UN CTS) for the first time.
These types of crime are frequently composed bymore than a single action, often a combination ofdifferent illicit behaviours (thus ‘complex’crimes). It is not easy, and actually not advisable,to measure them by using administrativestatistics. Indeed, in depth research andpopulation based surveys may be better tools toassess the extent of these phenomena. Whilemost ‘conventional’ crimes correspond to quitesimple behaviours (killing, stealing and rapingare almost universal concepts), some crimedefinitions are so complex that it is extremelydifficult to translate them into single acts.
Simpler acts are more likely to be measured asthey occur. In practice, whilst it is relatively
simple to count how many homicides arecommitted, counting episodes in trafficking inpersons requires either a legislative construct thatcriminalizes trafficking or splitting the conceptinto the different crimes which may becommitted in the course of the more complextrafficking action. Administrative data are usefulto analyse the availability of statistics on criminaljustice response to these phenomena. Some ofthese crimes have recently been defined byinternational law (UN Convention againstTransnational Organized Crime and its Protocols,UN Convention Against Corruption), whichforesees criminalization of specific illicitbehaviours. Once the new types of crime aretranslated into domestic criminal law – as is thecase, for example, when countries introduce aspecific crime of trafficking in persons afterratifying the TOC convention – the newlegislation may be used in some cases instead ofother types of crime. On the other hand, it mayhappen that courts tend to continue using oldlegislation even in the presence of new specificforms of crime.
*Research Officer, United Nations Office on Drugs and Crime (UNODC)
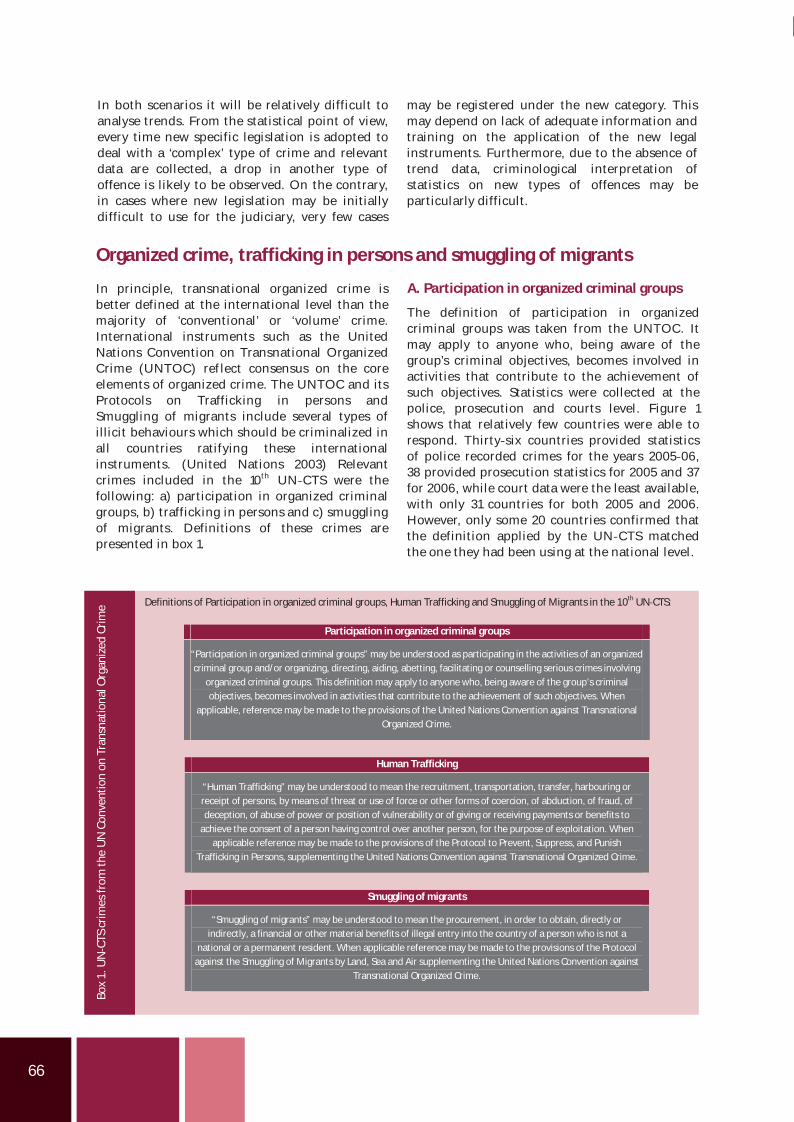
66
In both scenarios it will be relatively difficult toanalyse trends. From the statistical point of view,every time new specific legislation is adopted todeal with a ‘complex’ type of crime and relevantdata are collected, a drop in another type ofoffence is likely to be observed. On the contrary,in cases where new legislation may be initiallydifficult to use for the judiciary, very few cases
may be registered under the new category. Thismay depend on lack of adequate information andtraining on the application of the new legalinstruments. Furthermore, due to the absence oftrend data, criminological interpretation ofstatistics on new types of offences may beparticularly difficult.
Organized crime, trafficking in persons and smuggling of migrants
In principle, transnational organized crime isbetter defined at the international level than themajority of ‘conventional’ or ‘volume’ crime.International instruments such as the UnitedNations Convention on Transnational OrganizedCrime (UNTOC) reflect consensus on the coreelements of organized crime. The UNTOC and itsProtocols on Trafficking in persons andSmuggling of migrants include several types ofillicit behaviours which should be criminalized inall countries ratifying these internationalinstruments. (United Nations 2003) Relevantcrimes included in the 10th UN CTS were thefollowing: a) participation in organized criminalgroups, b) trafficking in persons and c) smugglingof migrants. Definitions of these crimes arepresented in box 1.
A. Participation in organized criminal groups
The definition of participation in organizedcriminal groups was taken from the UNTOC. Itmay apply to anyone who, being aware of thegroup’s criminal objectives, becomes involved inactivities that contribute to the achievement ofsuch objectives. Statistics were collected at thepolice, prosecution and courts level. Figure 1shows that relatively few countries were able torespond. Thirty six countries provided statisticsof police recorded crimes for the years 2005 06,38 provided prosecution statistics for 2005 and 37for 2006, while court data were the least available,with only 31 countries for both 2005 and 2006.However, only some 20 countries confirmed thatthe definition applied by the UN CTS matchedthe one they had been using at the national level.
Box
1.U
NCT
Scr
imes
from
the
UN
Conv
entio
non
Tran
snat
iona
lOrg
aniz
edCr
ime Definitions of Participation in organized criminal groups, Human Trafficking and Smuggling of Migrants in the 10th UN CTS:
Participation in organized criminal groups
“Participation in organized criminal groups” may be understood as participating in the activities of an organizedcriminal group and/or organizing, directing, aiding, abetting, facilitating or counselling serious crimes involving
organized criminal groups. This definition may apply to anyone who, being aware of the group’s criminalobjectives, becomes involved in activities that contribute to the achievement of such objectives. When
applicable, reference may be made to the provisions of the United Nations Convention against TransnationalOrganized Crime.
Human Trafficking
“Human Trafficking” may be understood to mean the recruitment, transportation, transfer, harbouring orreceipt of persons, by means of threat or use of force or other forms of coercion, of abduction, of fraud, ofdeception, of abuse of power or position of vulnerability or of giving or receiving payments or benefits to
achieve the consent of a person having control over another person, for the purpose of exploitation. Whenapplicable reference may be made to the provisions of the Protocol to Prevent, Suppress, and Punish
Trafficking in Persons, supplementing the United Nations Convention against Transnational Organized Crime.
Smuggling of migrants
“Smuggling of migrants” may be understood to mean the procurement, in order to obtain, directly orindirectly, a financial or other material benefits of illegal entry into the country of a person who is not a
national or a permanent resident. When applicable reference may be made to the provisions of the Protocolagainst the Smuggling of Migrants by Land, Sea and Air supplementing the United Nations Convention against
Transnational Organized Crime.

67
International Statistics on Crime and Criminal Justice
Com
plex
cri
mes
Figure 1. Number of countries responding to the10th UN CTS question on participation inorganized criminal groups
It is difficult to draw conclusions about thefrequency of this crime on the basis of theavailable statistics. At the police level, highvariations can be observed between countries,with a median rate of 0.9 crimes per 100,000population in 2005 and 1.4 in 2006. Figure 2shows the distribution of countries in fivecategories depending on the observed rate in2006, with the category below 1 crime per 100,000population counting 18 countries, i.e. half of theresponses received. Approximately one third ofthe countries showed rates above 2 per 100,000population, with 7 countries (19%) above five. Theobserved trend towards increase, although limitedto two years, is determined by half of thecountries, while in the other half the observedrates were mostly stable.
Figure 2. Participation in organized criminalgroups, police recorded offences. Number andpercentage of countries responding to the TenthUnited Nations Survey of Crime Trends andOperations of Criminal Justice Systems (UN CTS),by category, 2006
Similar rates were observed in prosecutionstatistics, with a median rate of approximately 1person prosecuted per 100,000 population (0.9 in2005 and 1.0 in 2006). Only 13 out of 31 reportingcountries showed an increase between 2005 and2006. The distribution across the categorieslargely reflected that observed at the police level,with 40% of the countries below 1 per 100,000pop., 40% between 1 and 5, and 20% above 5 per100,000 population. Participation in organizedcriminal groups is of high relevance for thecriminal justice system, and is more likely toappear in person based rather than offence basedstatistics. As the type of crime would suggest, thenumber of offenders is likely to be larger than thenumber of offences, thus explaining the relativelyhigh rates and no attrition observed at theprosecution level. However, at the court level,rates of persons convicted fall to a median of 0.3per 100,000 population (both in 2005 and 2006).
B. Trafficking in persons
Specific legislation on trafficking in persons waspassed in many countries pursuant to the entryinto force of the Protocol to Prevent, Suppress andPunish Trafficking in Persons (December 2003).The number of countries having specific antitrafficking legislation more than doubled between2003 and 2008 (UNODC 2009). Still, manycountries may use legislation on specific forms oraspects of trafficking in persons to criminalizethis phenomenon. For example, laws on slavery,sexual or labour exploitation, or child protection,may be applied instead or in the absence ofspecific legislation on trafficking.
The measurement of trafficking in persons is theobject of considerable attention at theinternational level. Criminal justice data alonecannot measure the extent of human traffickingflows, which would require a broader approach toinclude survey based information. Criminaljustice statistics may deal with victims (traffickedpersons) and offenders. By collecting informationfrom a wide range of sources in 111 countries, theUNODC Global Report on Trafficking in Personsfound over 21,400 identified victims of humantrafficking for the year 2006.
The 10th UN CTS only covered statistics onrecorded offences and offenders arrested,prosecuted and convicted, based on the UNTOCProtocol definition. Data were collected at thepolice, prosecution and court level. The numberof police recorded cases is highly dependent uponthe extent of law enforcement activities andcounter trafficking operations. Figure 3 shows
18, 50.0%
5, 13.9%
6, 16.7%
4, 11.1%
3, 8.3%
Below 1 per 100,000 population
Between 1 and 2 per 100,000 population
Between 2 and 5 per 100,000 population
Between 5 and 10 per 100,000 population
More than 10 per 100,000 population
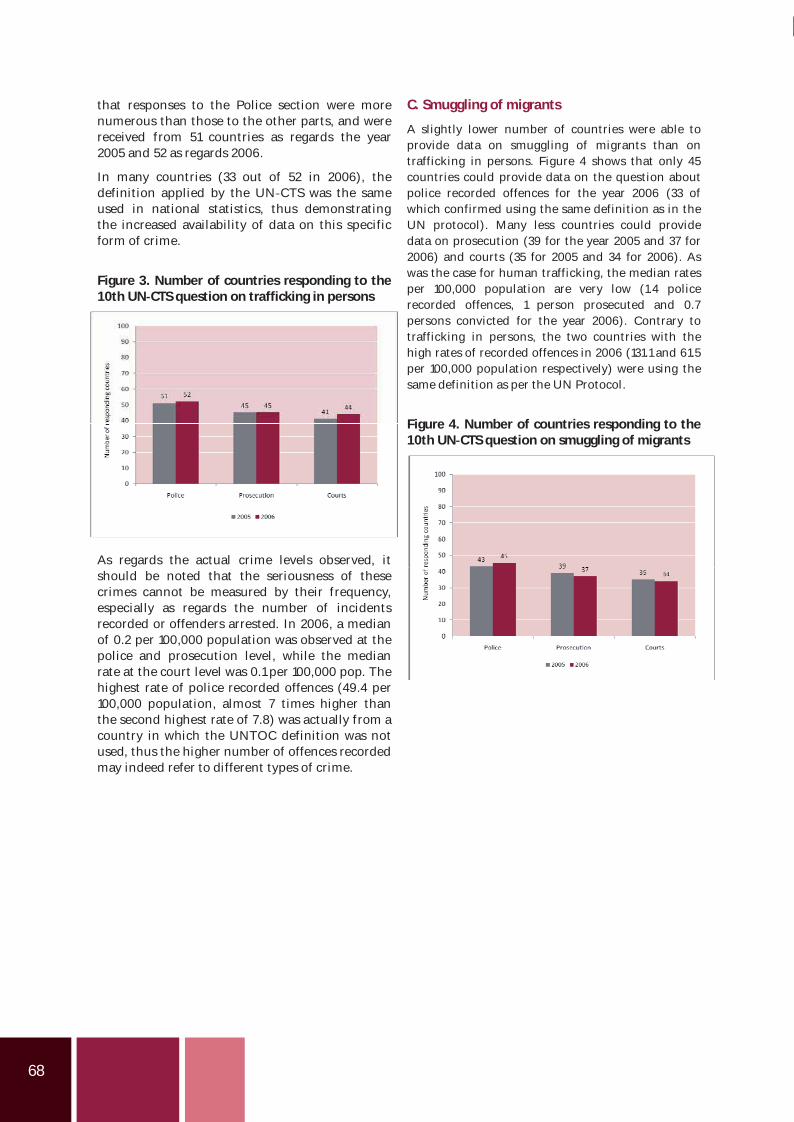
68
that responses to the Police section were morenumerous than those to the other parts, and werereceived from 51 countries as regards the year2005 and 52 as regards 2006.
In many countries (33 out of 52 in 2006), thedefinition applied by the UN CTS was the sameused in national statistics, thus demonstratingthe increased availability of data on this specificform of crime.
Figure 3. Number of countries responding to the10th UN CTS question on trafficking in persons
As regards the actual crime levels observed, itshould be noted that the seriousness of thesecrimes cannot be measured by their frequency,especially as regards the number of incidentsrecorded or offenders arrested. In 2006, a medianof 0.2 per 100,000 population was observed at thepolice and prosecution level, while the medianrate at the court level was 0.1 per 100,000 pop. Thehighest rate of police recorded offences (49.4 per100,000 population, almost 7 times higher thanthe second highest rate of 7.8) was actually from acountry in which the UNTOC definition was notused, thus the higher number of offences recordedmay indeed refer to different types of crime.
C. Smuggling of migrants
A slightly lower number of countries were able toprovide data on smuggling of migrants than ontrafficking in persons. Figure 4 shows that only 45countries could provide data on the question aboutpolice recorded offences for the year 2006 (33 ofwhich confirmed using the same definition as in theUN protocol). Many less countries could providedata on prosecution (39 for the year 2005 and 37 for2006) and courts (35 for 2005 and 34 for 2006). Aswas the case for human trafficking, the median ratesper 100,000 population are very low (1.4 policerecorded offences, 1 person prosecuted and 0.7persons convicted for the year 2006). Contrary totrafficking in persons, the two countries with thehigh rates of recorded offences in 2006 (131.1 and 61.5per 100,000 population respectively) were using thesame definition as per the UN Protocol.
Figure 4. Number of countries responding to the10th UN CTS question on smuggling of migrants
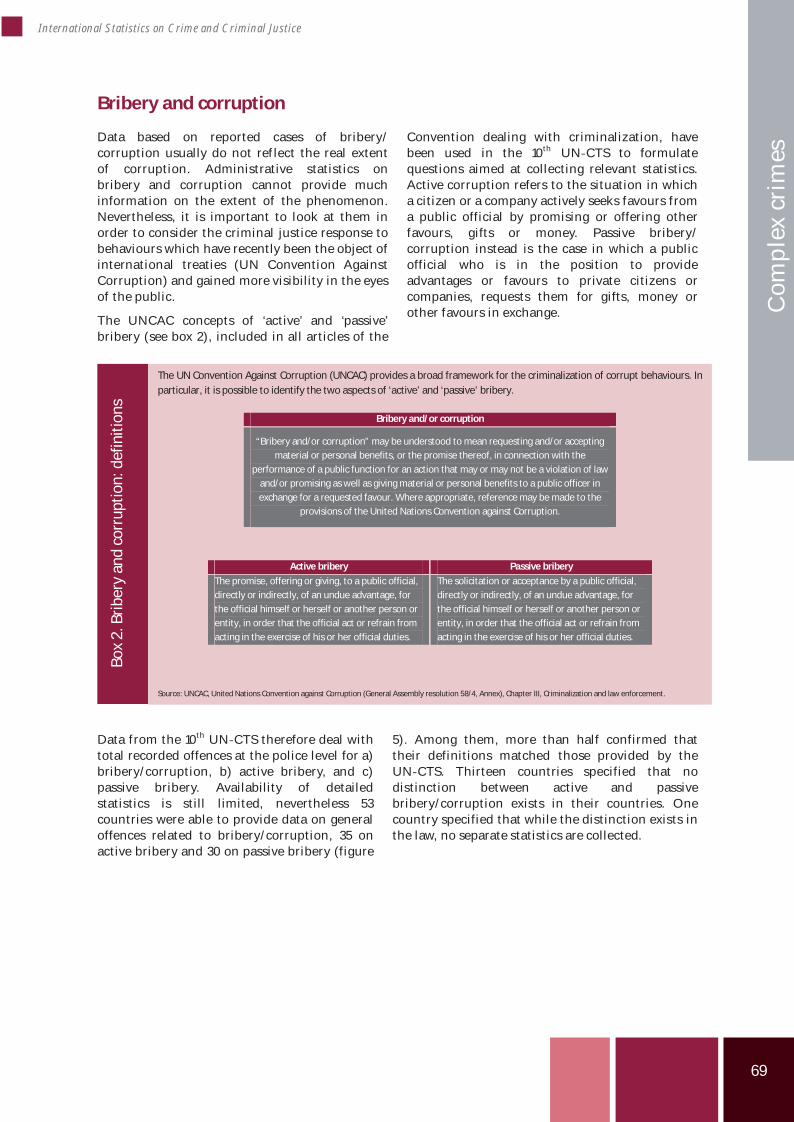
69
International Statistics on Crime and Criminal Justice
Com
plex
cri
mes
Bribery and corruption
Data based on reported cases of bribery/corruption usually do not reflect the real extentof corruption. Administrative statistics onbribery and corruption cannot provide muchinformation on the extent of the phenomenon.Nevertheless, it is important to look at them inorder to consider the criminal justice response tobehaviours which have recently been the object ofinternational treaties (UN Convention AgainstCorruption) and gained more visibility in the eyesof the public.
The UNCAC concepts of ‘active’ and ‘passive’bribery (see box 2), included in all articles of the
Convention dealing with criminalization, havebeen used in the 10th UN CTS to formulatequestions aimed at collecting relevant statistics.Active corruption refers to the situation in whicha citizen or a company actively seeks favours froma public official by promising or offering otherfavours, gifts or money. Passive bribery/corruption instead is the case in which a publicofficial who is in the position to provideadvantages or favours to private citizens orcompanies, requests them for gifts, money orother favours in exchange.
Data from the 10th UN CTS therefore deal withtotal recorded offences at the police level for a)bribery/corruption, b) active bribery, and c)passive bribery. Availability of detailedstatistics is still limited, nevertheless 53countries were able to provide data on generaloffences related to bribery/corruption, 35 onactive bribery and 30 on passive bribery (figure
5). Among them, more than half confirmed thattheir definitions matched those provided by theUN CTS. Thirteen countries specified that nodistinction between active and passivebribery/corruption exists in their countries. Onecountry specified that while the distinction exists inthe law, no separate statistics are collected.
Box
2.Br
iber
yan
dco
rrup
tion:
defin
ition
s
The UN Convention Against Corruption (UNCAC) provides a broad framework for the criminalization of corrupt behaviours. Inparticular, it is possible to identify the two aspects of ‘active’ and ‘passive’ bribery.
Bribery and/or corruption
“Bribery and/or corruption” may be understood to mean requesting and/or acceptingmaterial or personal benefits, or the promise thereof, in connection with the
performance of a public function for an action that may or may not be a violation of lawand/or promising as well as giving material or personal benefits to a public officer inexchange for a requested favour. Where appropriate, reference may be made to the
provisions of the United Nations Convention against Corruption.
Active bribery Passive bribery
The promise, offering or giving, to a public official,directly or indirectly, of an undue advantage, forthe official himself or herself or another person orentity, in order that the official act or refrain fromacting in the exercise of his or her official duties.
The solicitation or acceptance by a public official,directly or indirectly, of an undue advantage, forthe official himself or herself or another person orentity, in order that the official act or refrain fromacting in the exercise of his or her official duties.
Source: UNCAC, United Nations Convention against Corruption (General Assembly resolution 58/4, Annex), Chapter III, Criminalization and law enforcement.
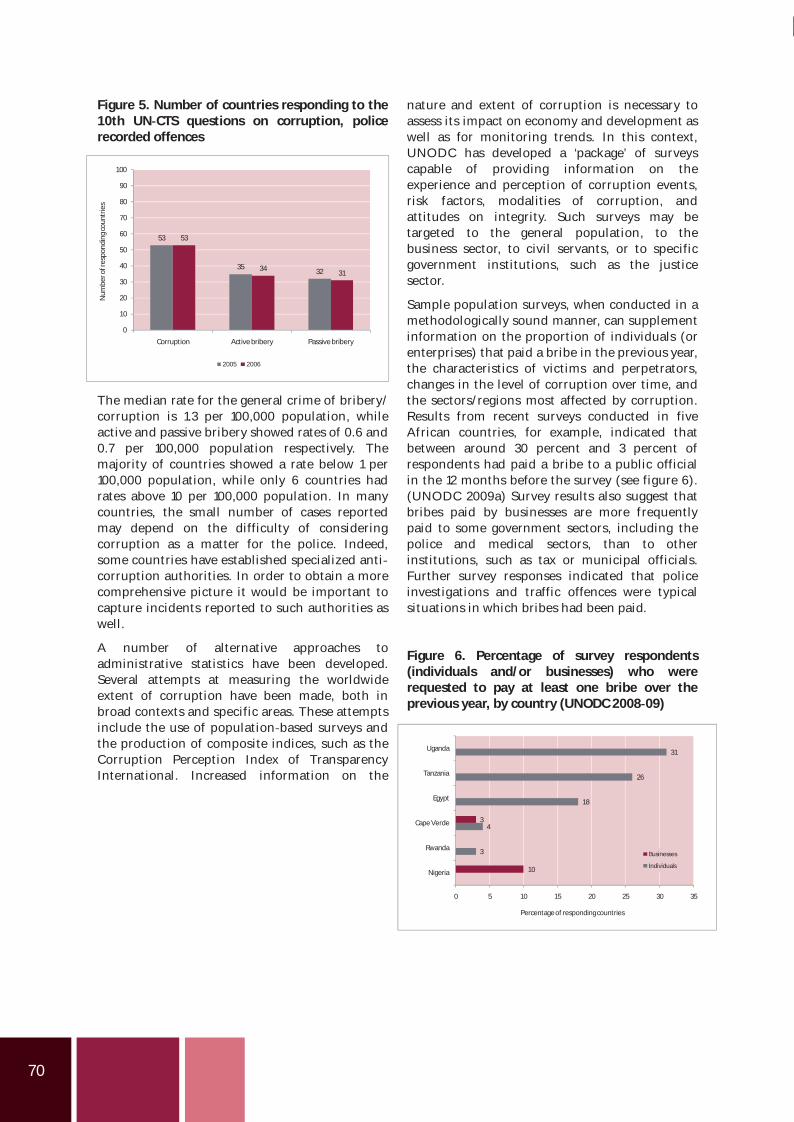
70
Figure 5. Number of countries responding to the10th UN CTS questions on corruption, policerecorded offences
The median rate for the general crime of bribery/corruption is 1.3 per 100,000 population, whileactive and passive bribery showed rates of 0.6 and0.7 per 100,000 population respectively. Themajority of countries showed a rate below 1 per100,000 population, while only 6 countries hadrates above 10 per 100,000 population. In manycountries, the small number of cases reportedmay depend on the difficulty of consideringcorruption as a matter for the police. Indeed,some countries have established specialized anticorruption authorities. In order to obtain a morecomprehensive picture it would be important tocapture incidents reported to such authorities aswell.
A number of alternative approaches toadministrative statistics have been developed.Several attempts at measuring the worldwideextent of corruption have been made, both inbroad contexts and specific areas. These attemptsinclude the use of population based surveys andthe production of composite indices, such as theCorruption Perception Index of TransparencyInternational. Increased information on the
nature and extent of corruption is necessary toassess its impact on economy and development aswell as for monitoring trends. In this context,UNODC has developed a ‘package’ of surveyscapable of providing information on theexperience and perception of corruption events,risk factors, modalities of corruption, andattitudes on integrity. Such surveys may betargeted to the general population, to thebusiness sector, to civil servants, or to specificgovernment institutions, such as the justicesector.
Sample population surveys, when conducted in amethodologically sound manner, can supplementinformation on the proportion of individuals (orenterprises) that paid a bribe in the previous year,the characteristics of victims and perpetrators,changes in the level of corruption over time, andthe sectors/regions most affected by corruption.Results from recent surveys conducted in fiveAfrican countries, for example, indicated thatbetween around 30 percent and 3 percent ofrespondents had paid a bribe to a public officialin the 12 months before the survey (see figure 6).(UNODC 2009a) Survey results also suggest thatbribes paid by businesses are more frequentlypaid to some government sectors, including thepolice and medical sectors, than to otherinstitutions, such as tax or municipal officials.Further survey responses indicated that policeinvestigations and traffic offences were typicalsituations in which bribes had been paid.
Figure 6. Percentage of survey respondents(individuals and/or businesses) who wererequested to pay at least one bribe over theprevious year, by country (UNODC 2008 09)
53
3532
53
3431
0
10
20
30
40
50
60
70
80
90
100
Corruption Active bribery Passive bribery
Num
bero
fres
pond
ing
coun
trie
s
2005 2006
3
4
18
26
31
10
3
0 5 10 15 20 25 30 35
Nigeria
Rwanda
Cape Verde
Egypt
Tanzania
Uganda
Percentage of respondingcountries
Businesses
Individuals
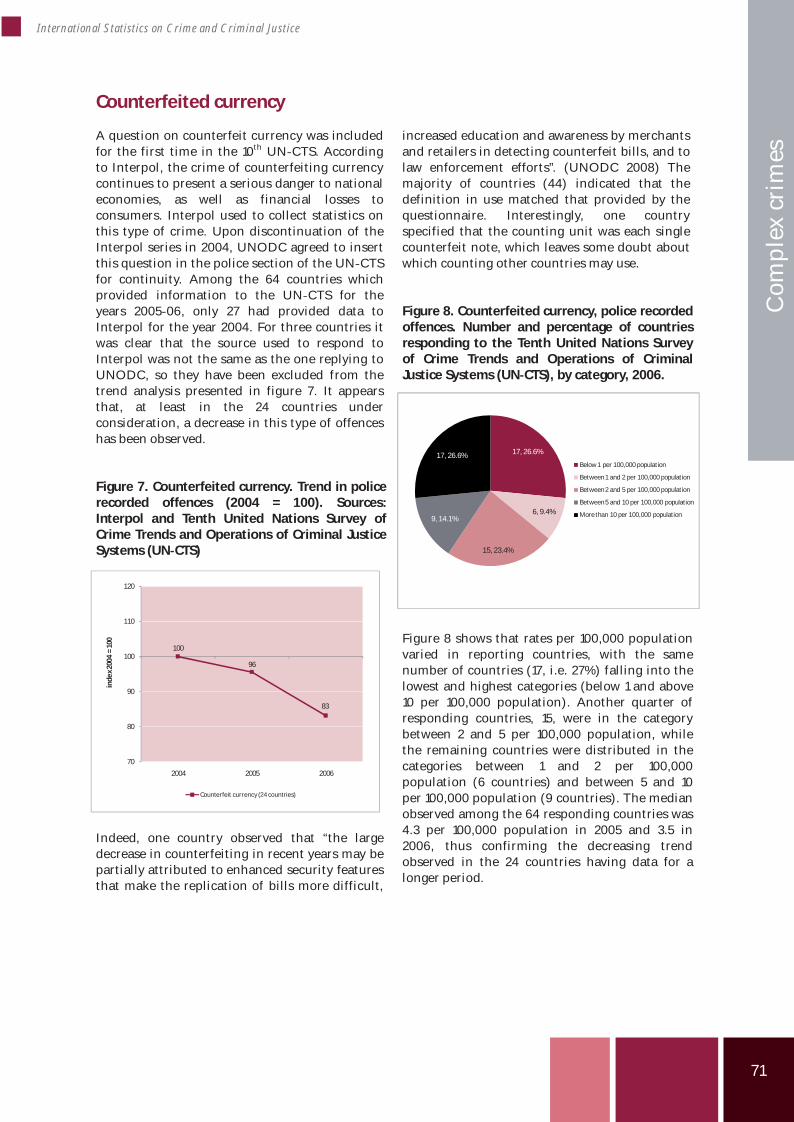
71
International Statistics on Crime and Criminal Justice
Com
plex
cri
mes
Counterfeited currency
A question on counterfeit currency was includedfor the first time in the 10th UN CTS. Accordingto Interpol, the crime of counterfeiting currencycontinues to present a serious danger to nationaleconomies, as well as financial losses toconsumers. Interpol used to collect statistics onthis type of crime. Upon discontinuation of theInterpol series in 2004, UNODC agreed to insertthis question in the police section of the UN CTSfor continuity. Among the 64 countries whichprovided information to the UN CTS for theyears 2005 06, only 27 had provided data toInterpol for the year 2004. For three countries itwas clear that the source used to respond toInterpol was not the same as the one replying toUNODC, so they have been excluded from thetrend analysis presented in figure 7. It appearsthat, at least in the 24 countries underconsideration, a decrease in this type of offenceshas been observed.
Figure 7. Counterfeited currency. Trend in policerecorded offences (2004 = 100). Sources:Interpol and Tenth United Nations Survey ofCrime Trends and Operations of Criminal JusticeSystems (UN CTS)
Indeed, one country observed that “the largedecrease in counterfeiting in recent years may bepartially attributed to enhanced security featuresthat make the replication of bills more difficult,
increased education and awareness by merchantsand retailers in detecting counterfeit bills, and tolaw enforcement efforts”. (UNODC 2008) Themajority of countries (44) indicated that thedefinition in use matched that provided by thequestionnaire. Interestingly, one countryspecified that the counting unit was each singlecounterfeit note, which leaves some doubt aboutwhich counting other countries may use.
Figure 8. Counterfeited currency, police recordedoffences. Number and percentage of countriesresponding to the Tenth United Nations Surveyof Crime Trends and Operations of CriminalJustice Systems (UN CTS), by category, 2006.
Figure 8 shows that rates per 100,000 populationvaried in reporting countries, with the samenumber of countries (17, i.e. 27%) falling into thelowest and highest categories (below 1 and above10 per 100,000 population). Another quarter ofresponding countries, 15, were in the categorybetween 2 and 5 per 100,000 population, whilethe remaining countries were distributed in thecategories between 1 and 2 per 100,000population (6 countries) and between 5 and 10per 100,000 population (9 countries). The medianobserved among the 64 responding countries was4.3 per 100,000 population in 2005 and 3.5 in2006, thus confirming the decreasing trendobserved in the 24 countries having data for alonger period.
100
96
83
70
80
90
100
110
120
2004 2005 2006
inde
x20
04=
100
Counterfeit currency (24 countries)
17, 26.6%
6, 9.4%
15, 23.4%
9, 14.1%
17, 26.6%Below1 per 100,000 population
Between1 and 2 per 100,000 population
Between2 and 5 per 100,000 population
Between5 and 10 per 100,000 population
More than 10 per 100,000 population
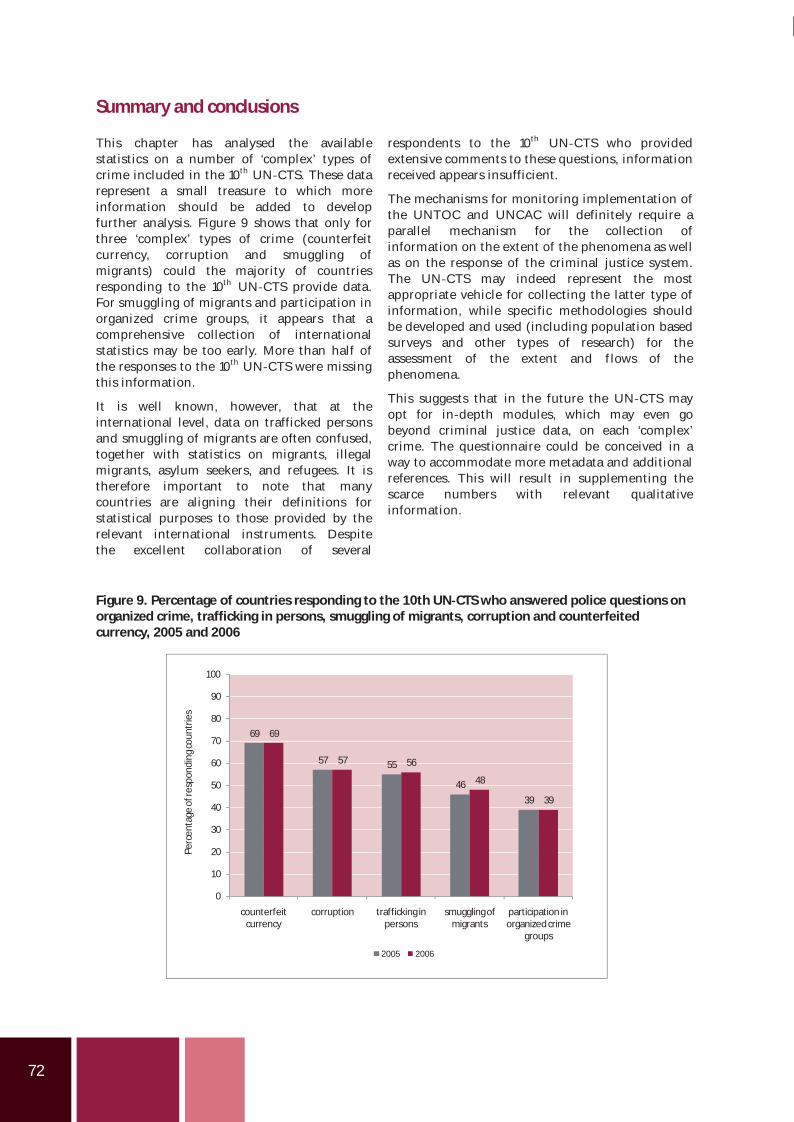
72
Summary and conclusions
This chapter has analysed the availablestatistics on a number of ‘complex’ types ofcrime included in the 10th UN CTS. These datarepresent a small treasure to which moreinformation should be added to developfurther analysis. Figure 9 shows that only forthree ‘complex’ types of crime (counterfeitcurrency, corruption and smuggling ofmigrants) could the majority of countriesresponding to the 10th UN CTS provide data.For smuggling of migrants and participation inorganized crime groups, it appears that acomprehensive collection of internationalstatistics may be too early. More than half ofthe responses to the 10th UN CTS were missingthis information.
It is well known, however, that at theinternational level, data on trafficked personsand smuggling of migrants are often confused,together with statistics on migrants, illegalmigrants, asylum seekers, and refugees. It istherefore important to note that manycountries are aligning their definitions forstatistical purposes to those provided by therelevant international instruments. Despitethe excellent collaboration of several
respondents to the 10th UN CTS who providedextensive comments to these questions, informationreceived appears insufficient.
The mechanisms for monitoring implementation ofthe UNTOC and UNCAC will definitely require aparallel mechanism for the collection ofinformation on the extent of the phenomena as wellas on the response of the criminal justice system.The UN CTS may indeed represent the mostappropriate vehicle for collecting the latter type ofinformation, while specific methodologies shouldbe developed and used (including population basedsurveys and other types of research) for theassessment of the extent and flows of thephenomena.
This suggests that in the future the UN CTS mayopt for in depth modules, which may even gobeyond criminal justice data, on each ‘complex’crime. The questionnaire could be conceived in away to accommodate more metadata and additionalreferences. This will result in supplementing thescarce numbers with relevant qualitativeinformation.
Figure 9. Percentage of countries responding to the 10th UN CTS who answered police questions onorganized crime, trafficking in persons, smuggling of migrants, corruption and counterfeitedcurrency, 2005 and 2006
69
57 55
46
39
69
57 56
48
39
0
10
20
30
40
50
60
70
80
90
100
counterfeitcurrency
corruption trafficking inpersons
smugglingofmigrants
participation inorganized crime
groups
Perc
enta
geof
resp
ondi
ngco
untr
ies
2005 2006
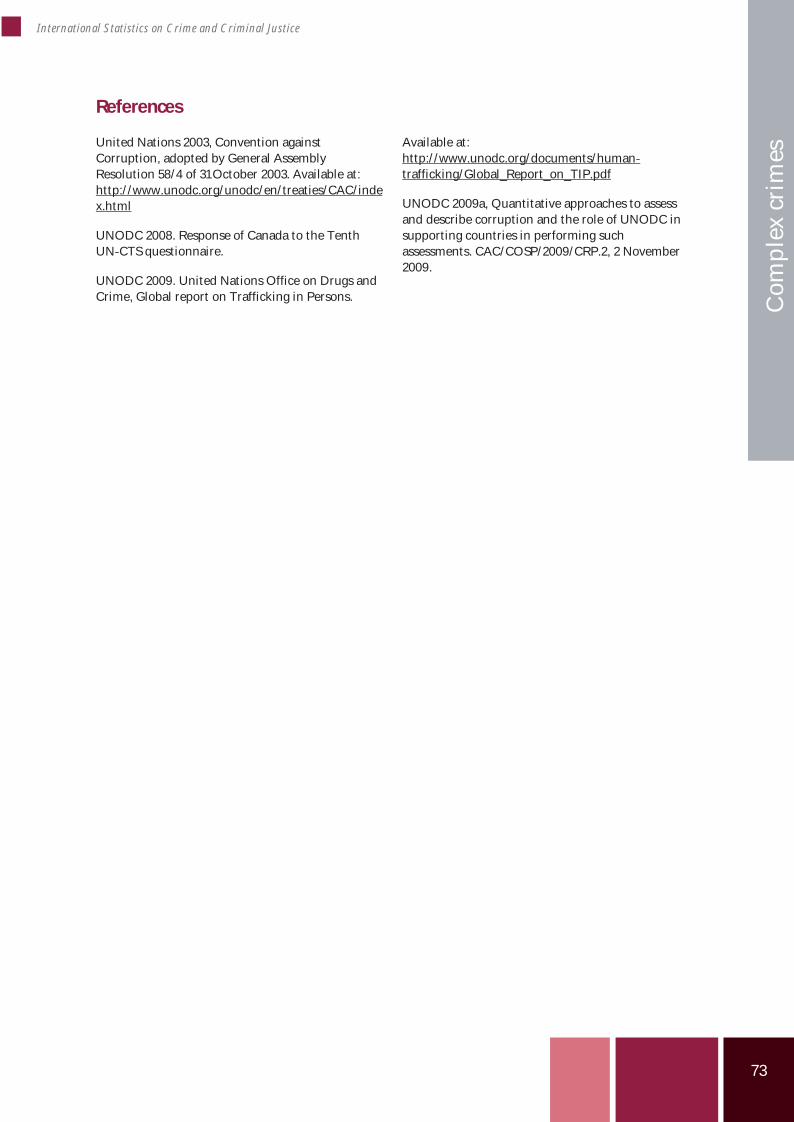
73
International Statistics on Crime and Criminal Justice
Com
plex
cri
mes
References
United Nations 2003, Convention againstCorruption, adopted by General AssemblyResolution 58/4 of 31 October 2003. Available at:http://www.unodc.org/unodc/en/treaties/CAC/index.html
UNODC 2008. Response of Canada to the TenthUN CTS questionnaire.
UNODC 2009. United Nations Office on Drugs andCrime, Global report on Trafficking in Persons.
Available at:http://www.unodc.org/documents/humantrafficking/Global_Report_on_TIP.pdf
UNODC 2009a, Quantitative approaches to assessand describe corruption and the role of UNODC insupporting countries in performing suchassessments. CAC/COSP/2009/CRP.2, 2 November2009.
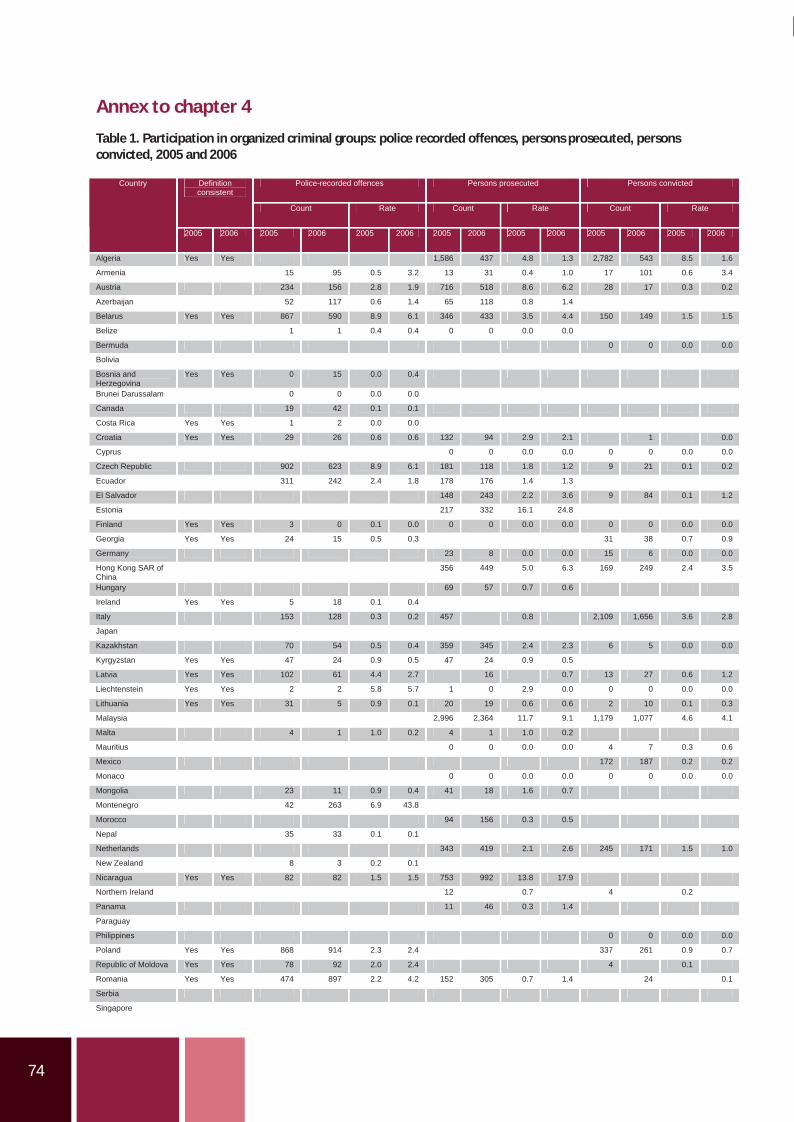
74
Annex to chapter 4
Table 1. Participation in organized criminal groups: police recorded offences, persons prosecuted, personsconvicted, 2005 and 2006
Police-recorded offences Persons prosecuted Persons convicted Definition consistent
Count Rate Count Rate Count Rate
Country
2005 2006 2005 2006 2005 2006 2005 2006 2005 2006 2005 2006 2005 2006
Algeria Yes Yes 1,586 437 4.8 1.3 2,782 543 8.5 1.6
Armenia 15 95 0.5 3.2 13 31 0.4 1.0 17 101 0.6 3.4
Austria 234 156 2.8 1.9 716 518 8.6 6.2 28 17 0.3 0.2
Azerbaijan 52 117 0.6 1.4 65 118 0.8 1.4
Belarus Yes Yes 867 590 8.9 6.1 346 433 3.5 4.4 150 149 1.5 1.5
Belize 1 1 0.4 0.4 0 0 0.0 0.0
Bermuda 0 0 0.0 0.0
Bolivia
Bosnia and Herzegovina
Yes Yes 0 15 0.0 0.4
Brunei Darussalam 0 0 0.0 0.0
Canada 19 42 0.1 0.1
Costa Rica Yes Yes 1 2 0.0 0.0
Croatia Yes Yes 29 26 0.6 0.6 132 94 2.9 2.1 1 0.0
Cyprus 0 0 0.0 0.0 0 0 0.0 0.0
Czech Republic 902 623 8.9 6.1 181 118 1.8 1.2 9 21 0.1 0.2
Ecuador 311 242 2.4 1.8 178 176 1.4 1.3
El Salvador 148 243 2.2 3.6 9 84 0.1 1.2
Estonia 217 332 16.1 24.8
Finland Yes Yes 3 0 0.1 0.0 0 0 0.0 0.0 0 0 0.0 0.0
Georgia Yes Yes 24 15 0.5 0.3 31 38 0.7 0.9
Germany 23 8 0.0 0.0 15 6 0.0 0.0
Hong Kong SAR of China
356 449 5.0 6.3 169 249 2.4 3.5
Hungary 69 57 0.7 0.6
Ireland Yes Yes 5 18 0.1 0.4
Italy 153 128 0.3 0.2 457 0.8 2,109 1,656 3.6 2.8
Japan
Kazakhstan 70 54 0.5 0.4 359 345 2.4 2.3 6 5 0.0 0.0
Kyrgyzstan Yes Yes 47 24 0.9 0.5 47 24 0.9 0.5
Latvia Yes Yes 102 61 4.4 2.7 16 0.7 13 27 0.6 1.2
Liechtenstein Yes Yes 2 2 5.8 5.7 1 0 2.9 0.0 0 0 0.0 0.0
Lithuania Yes Yes 31 5 0.9 0.1 20 19 0.6 0.6 2 10 0.1 0.3
Malaysia 2,996 2,364 11.7 9.1 1,179 1,077 4.6 4.1
Malta 4 1 1.0 0.2 4 1 1.0 0.2
Mauritius 0 0 0.0 0.0 4 7 0.3 0.6
Mexico 172 187 0.2 0.2
Monaco 0 0 0.0 0.0 0 0 0.0 0.0
Mongolia 23 11 0.9 0.4 41 18 1.6 0.7
Montenegro 42 263 6.9 43.8
Morocco 94 156 0.3 0.5
Nepal 35 33 0.1 0.1
Netherlands 343 419 2.1 2.6 245 171 1.5 1.0
New Zealand 8 3 0.2 0.1
Nicaragua Yes Yes 82 82 1.5 1.5 753 992 13.8 17.9
Northern Ireland 12 0.7 4 0.2
Panama 11 46 0.3 1.4
Paraguay
Philippines 0 0 0.0 0.0
Poland Yes Yes 868 914 2.3 2.4 337 261 0.9 0.7
Republic of Moldova Yes Yes 78 92 2.0 2.4 4 0.1
Romania Yes Yes 474 897 2.2 4.2 152 305 0.7 1.4 24 0.1
Serbia
Singapore
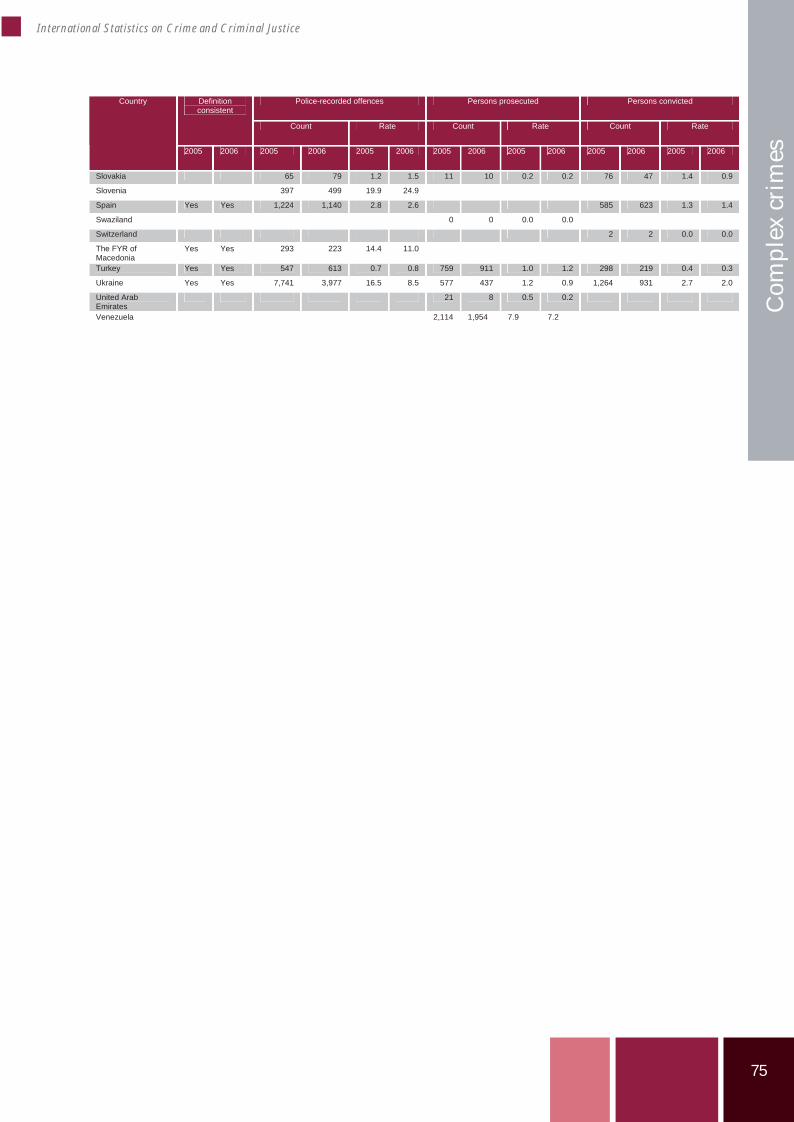
75
International Statistics on Crime and Criminal Justice
Com
plex
cri
mes
Police-recorded offences Persons prosecuted Persons convicted Definition consistent
Count Rate Count Rate Count Rate
Country
2005 2006 2005 2006 2005 2006 2005 2006 2005 2006 2005 2006 2005 2006
Slovakia 65 79 1.2 1.5 11 10 0.2 0.2 76 47 1.4 0.9
Slovenia 397 499 19.9 24.9
Spain Yes Yes 1,224 1,140 2.8 2.6 585 623 1.3 1.4
Swaziland 0 0 0.0 0.0
Switzerland 2 2 0.0 0.0
The FYR of Macedonia
Yes Yes 293 223 14.4 11.0
Turkey Yes Yes 547 613 0.7 0.8 759 911 1.0 1.2 298 219 0.4 0.3
Ukraine Yes Yes 7,741 3,977 16.5 8.5 577 437 1.2 0.9 1,264 931 2.7 2.0
United Arab Emirates
21 8 0.5 0.2
Venezuela 2,114 1,954 7.9 7.2
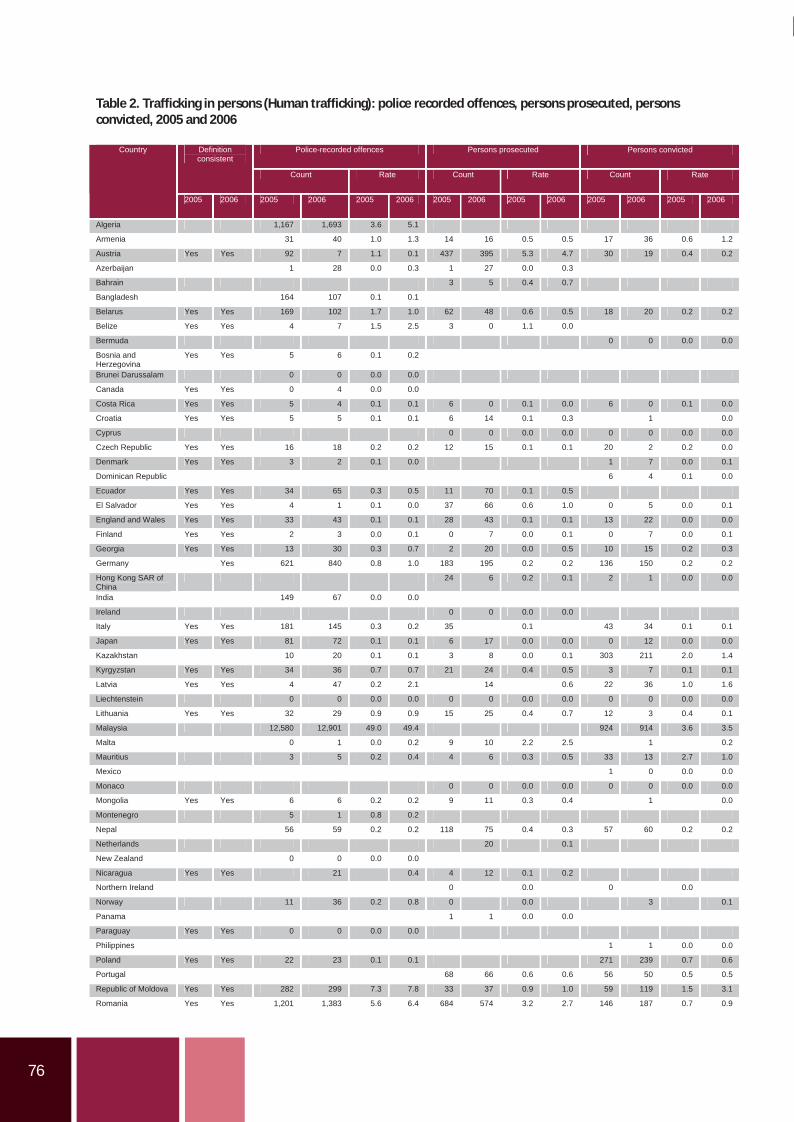
76
Table 2. Trafficking in persons (Human trafficking): police recorded offences, persons prosecuted, personsconvicted, 2005 and 2006
Police-recorded offences Persons prosecuted Persons convicted Definition consistent
Count Rate Count Rate Count Rate
Country
2005 2006 2005 2006 2005 2006 2005 2006 2005 2006 2005 2006 2005 2006
Algeria 1,167 1,693 3.6 5.1
Armenia 31 40 1.0 1.3 14 16 0.5 0.5 17 36 0.6 1.2
Austria Yes Yes 92 7 1.1 0.1 437 395 5.3 4.7 30 19 0.4 0.2
Azerbaijan 1 28 0.0 0.3 1 27 0.0 0.3
Bahrain 3 5 0.4 0.7
Bangladesh 164 107 0.1 0.1
Belarus Yes Yes 169 102 1.7 1.0 62 48 0.6 0.5 18 20 0.2 0.2
Belize Yes Yes 4 7 1.5 2.5 3 0 1.1 0.0
Bermuda 0 0 0.0 0.0
Bosnia and Herzegovina
Yes Yes 5 6 0.1 0.2
Brunei Darussalam 0 0 0.0 0.0
Canada Yes Yes 0 4 0.0 0.0
Costa Rica Yes Yes 5 4 0.1 0.1 6 0 0.1 0.0 6 0 0.1 0.0
Croatia Yes Yes 5 5 0.1 0.1 6 14 0.1 0.3 1 0.0
Cyprus 0 0 0.0 0.0 0 0 0.0 0.0
Czech Republic Yes Yes 16 18 0.2 0.2 12 15 0.1 0.1 20 2 0.2 0.0
Denmark Yes Yes 3 2 0.1 0.0 1 7 0.0 0.1
Dominican Republic 6 4 0.1 0.0
Ecuador Yes Yes 34 65 0.3 0.5 11 70 0.1 0.5
El Salvador Yes Yes 4 1 0.1 0.0 37 66 0.6 1.0 0 5 0.0 0.1
England and Wales Yes Yes 33 43 0.1 0.1 28 43 0.1 0.1 13 22 0.0 0.0
Finland Yes Yes 2 3 0.0 0.1 0 7 0.0 0.1 0 7 0.0 0.1
Georgia Yes Yes 13 30 0.3 0.7 2 20 0.0 0.5 10 15 0.2 0.3
Germany Yes 621 840 0.8 1.0 183 195 0.2 0.2 136 150 0.2 0.2
Hong Kong SAR of China
24 6 0.2 0.1 2 1 0.0 0.0
India 149 67 0.0 0.0
Ireland 0 0 0.0 0.0
Italy Yes Yes 181 145 0.3 0.2 35 0.1 43 34 0.1 0.1
Japan Yes Yes 81 72 0.1 0.1 6 17 0.0 0.0 0 12 0.0 0.0
Kazakhstan 10 20 0.1 0.1 3 8 0.0 0.1 303 211 2.0 1.4
Kyrgyzstan Yes Yes 34 36 0.7 0.7 21 24 0.4 0.5 3 7 0.1 0.1
Latvia Yes Yes 4 47 0.2 2.1 14 0.6 22 36 1.0 1.6
Liechtenstein 0 0 0.0 0.0 0 0 0.0 0.0 0 0 0.0 0.0
Lithuania Yes Yes 32 29 0.9 0.9 15 25 0.4 0.7 12 3 0.4 0.1
Malaysia 12,580 12,901 49.0 49.4 924 914 3.6 3.5
Malta 0 1 0.0 0.2 9 10 2.2 2.5 1 0.2
Mauritius 3 5 0.2 0.4 4 6 0.3 0.5 33 13 2.7 1.0
Mexico 1 0 0.0 0.0
Monaco 0 0 0.0 0.0 0 0 0.0 0.0
Mongolia Yes Yes 6 6 0.2 0.2 9 11 0.3 0.4 1 0.0
Montenegro 5 1 0.8 0.2
Nepal 56 59 0.2 0.2 118 75 0.4 0.3 57 60 0.2 0.2
Netherlands 20 0.1
New Zealand 0 0 0.0 0.0
Nicaragua Yes Yes 21 0.4 4 12 0.1 0.2
Northern Ireland 0 0.0 0 0.0
Norway 11 36 0.2 0.8 0 0.0 3 0.1
Panama 1 1 0.0 0.0
Paraguay Yes Yes 0 0 0.0 0.0
Philippines 1 1 0.0 0.0
Poland Yes Yes 22 23 0.1 0.1 271 239 0.7 0.6
Portugal 68 66 0.6 0.6 56 50 0.5 0.5
Republic of Moldova Yes Yes 282 299 7.3 7.8 33 37 0.9 1.0 59 119 1.5 3.1
Romania Yes Yes 1,201 1,383 5.6 6.4 684 574 3.2 2.7 146 187 0.7 0.9
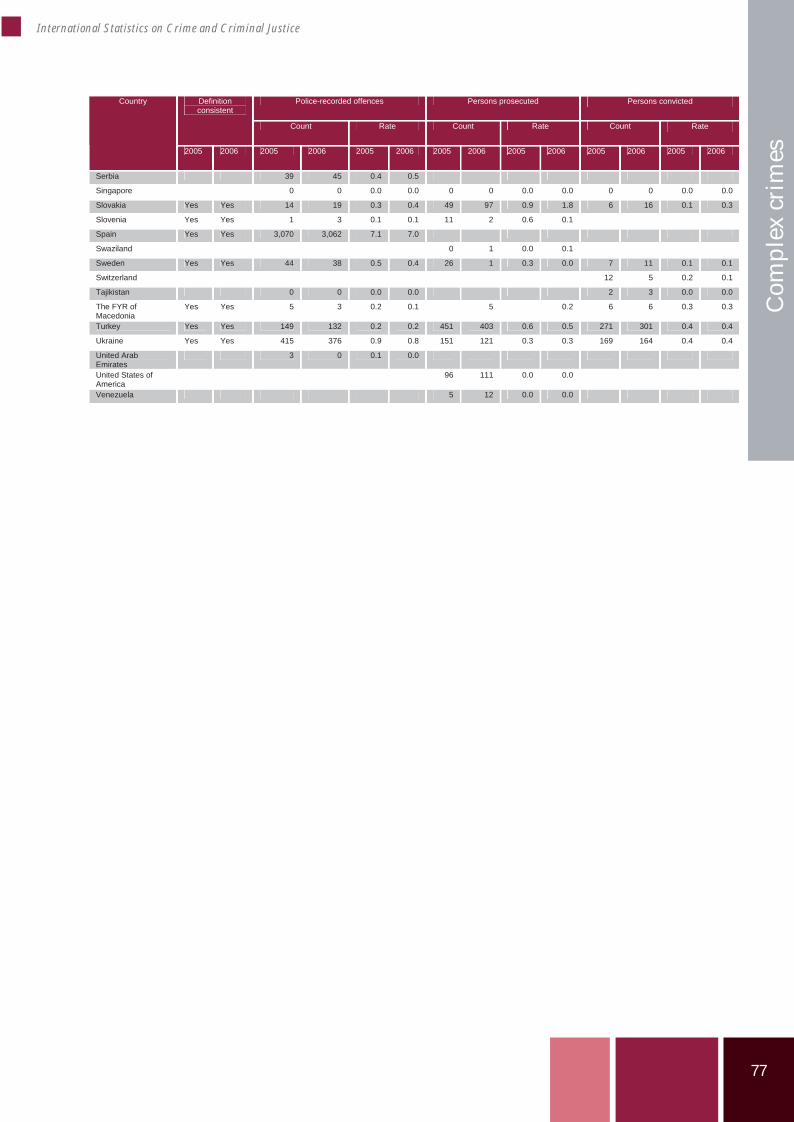
77
International Statistics on Crime and Criminal Justice
Com
plex
cri
mes
Police-recorded offences Persons prosecuted Persons convicted Definition consistent
Count Rate Count Rate Count Rate
Country
2005 2006 2005 2006 2005 2006 2005 2006 2005 2006 2005 2006 2005 2006
Serbia 39 45 0.4 0.5
Singapore 0 0 0.0 0.0 0 0 0.0 0.0 0 0 0.0 0.0
Slovakia Yes Yes 14 19 0.3 0.4 49 97 0.9 1.8 6 16 0.1 0.3
Slovenia Yes Yes 1 3 0.1 0.1 11 2 0.6 0.1
Spain Yes Yes 3,070 3,062 7.1 7.0
Swaziland 0 1 0.0 0.1
Sweden Yes Yes 44 38 0.5 0.4 26 1 0.3 0.0 7 11 0.1 0.1
Switzerland 12 5 0.2 0.1
Tajikistan 0 0 0.0 0.0 2 3 0.0 0.0
The FYR of Macedonia
Yes Yes 5 3 0.2 0.1 5 0.2 6 6 0.3 0.3
Turkey Yes Yes 149 132 0.2 0.2 451 403 0.6 0.5 271 301 0.4 0.4
Ukraine Yes Yes 415 376 0.9 0.8 151 121 0.3 0.3 169 164 0.4 0.4
United Arab Emirates
3 0 0.1 0.0
United States of America
96 111 0.0 0.0
Venezuela 5 12 0.0 0.0
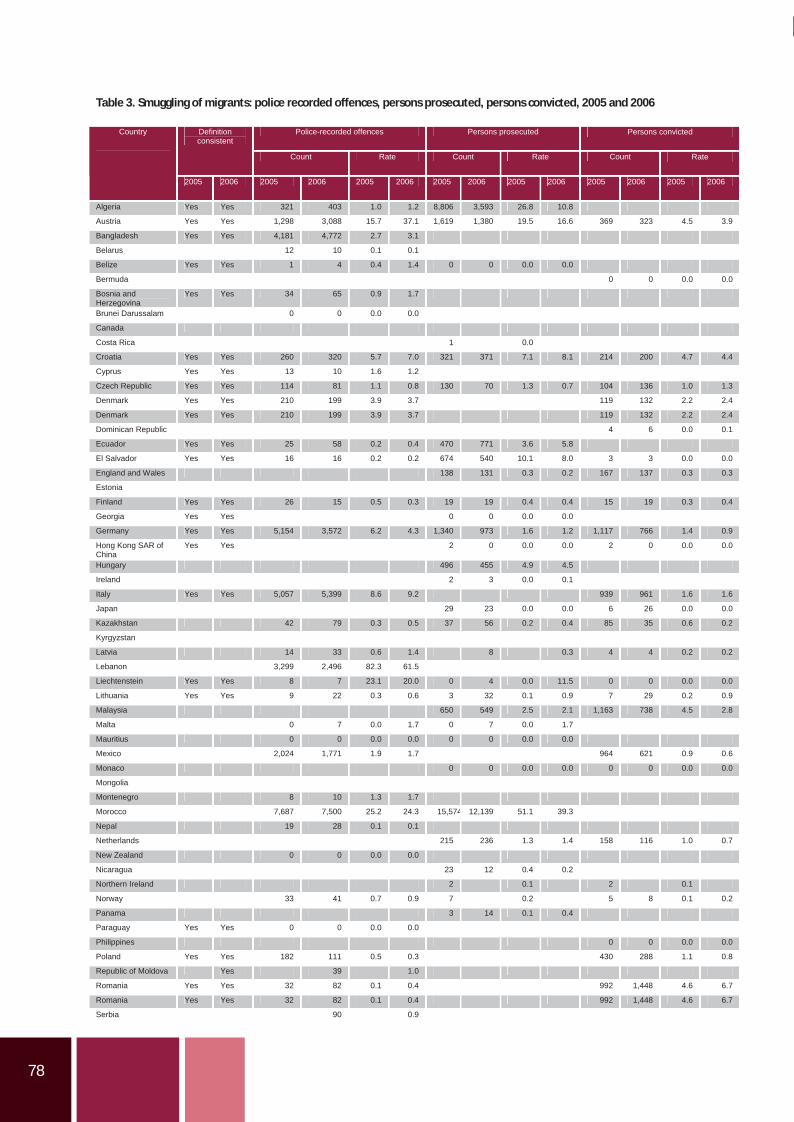
78
Table 3. Smuggling of migrants: police recorded offences, persons prosecuted, persons convicted, 2005 and 2006
Police-recorded offences Persons prosecuted Persons convicted Definition consistent
Count Rate Count Rate Count Rate
Country
2005 2006 2005 2006 2005 2006 2005 2006 2005 2006 2005 2006 2005 2006
Algeria Yes Yes 321 403 1.0 1.2 8,806 3,593 26.8 10.8
Austria Yes Yes 1,298 3,088 15.7 37.1 1,619 1,380 19.5 16.6 369 323 4.5 3.9
Bangladesh Yes Yes 4,181 4,772 2.7 3.1
Belarus 12 10 0.1 0.1
Belize Yes Yes 1 4 0.4 1.4 0 0 0.0 0.0
Bermuda 0 0 0.0 0.0
Bosnia and Herzegovina
Yes Yes 34 65 0.9 1.7
Brunei Darussalam 0 0 0.0 0.0
Canada
Costa Rica 1 0.0
Croatia Yes Yes 260 320 5.7 7.0 321 371 7.1 8.1 214 200 4.7 4.4
Cyprus Yes Yes 13 10 1.6 1.2
Czech Republic Yes Yes 114 81 1.1 0.8 130 70 1.3 0.7 104 136 1.0 1.3
Denmark Yes Yes 210 199 3.9 3.7 119 132 2.2 2.4
Denmark Yes Yes 210 199 3.9 3.7 119 132 2.2 2.4
Dominican Republic 4 6 0.0 0.1
Ecuador Yes Yes 25 58 0.2 0.4 470 771 3.6 5.8
El Salvador Yes Yes 16 16 0.2 0.2 674 540 10.1 8.0 3 3 0.0 0.0
England and Wales 138 131 0.3 0.2 167 137 0.3 0.3
Estonia
Finland Yes Yes 26 15 0.5 0.3 19 19 0.4 0.4 15 19 0.3 0.4
Georgia Yes Yes 0 0 0.0 0.0
Germany Yes Yes 5,154 3,572 6.2 4.3 1,340 973 1.6 1.2 1,117 766 1.4 0.9
Hong Kong SAR of China
Yes Yes 2 0 0.0 0.0 2 0 0.0 0.0
Hungary 496 455 4.9 4.5
Ireland 2 3 0.0 0.1
Italy Yes Yes 5,057 5,399 8.6 9.2 939 961 1.6 1.6
Japan 29 23 0.0 0.0 6 26 0.0 0.0
Kazakhstan 42 79 0.3 0.5 37 56 0.2 0.4 85 35 0.6 0.2
Kyrgyzstan
Latvia 14 33 0.6 1.4 8 0.3 4 4 0.2 0.2
Lebanon 3,299 2,496 82.3 61.5
Liechtenstein Yes Yes 8 7 23.1 20.0 0 4 0.0 11.5 0 0 0.0 0.0
Lithuania Yes Yes 9 22 0.3 0.6 3 32 0.1 0.9 7 29 0.2 0.9
Malaysia 650 549 2.5 2.1 1,163 738 4.5 2.8
Malta 0 7 0.0 1.7 0 7 0.0 1.7
Mauritius 0 0 0.0 0.0 0 0 0.0 0.0
Mexico 2,024 1,771 1.9 1.7 964 621 0.9 0.6
Monaco 0 0 0.0 0.0 0 0 0.0 0.0
Mongolia
Montenegro 8 10 1.3 1.7
Morocco 7,687 7,500 25.2 24.3 15,574 12,139 51.1 39.3
Nepal 19 28 0.1 0.1
Netherlands 215 236 1.3 1.4 158 116 1.0 0.7
New Zealand 0 0 0.0 0.0
Nicaragua 23 12 0.4 0.2
Northern Ireland 2 0.1 2 0.1
Norway 33 41 0.7 0.9 7 0.2 5 8 0.1 0.2
Panama 3 14 0.1 0.4
Paraguay Yes Yes 0 0 0.0 0.0
Philippines 0 0 0.0 0.0
Poland Yes Yes 182 111 0.5 0.3 430 288 1.1 0.8
Republic of Moldova Yes 39 1.0
Romania Yes Yes 32 82 0.1 0.4 992 1,448 4.6 6.7
Romania Yes Yes 32 82 0.1 0.4 992 1,448 4.6 6.7
Serbia 90 0.9

79
International Statistics on Crime and Criminal Justice
Com
plex
cri
mes
Police-recorded offences Persons prosecuted Persons convicted Definition consistent
Count Rate Count Rate Count Rate
Country
2005 2006 2005 2006 2005 2006 2005 2006 2005 2006 2005 2006 2005 2006
Singapore Yes Yes 7,865 5,744 181.7 131.1 6,146 4,987 142.0 113.8
Slovakia Yes Yes 93 130 1.7 2.4 116 93 2.2 1.7 63 52 1.2 1.0
Slovenia Yes Yes 463 348 23.2 17.4 162 300 8.1 15.0
Spain Yes Yes 806 669 1.9 1.5
Swaziland 0 0 0.0 0.0
Sweden 1,478 1,131 16.4 12.5 23 15 0.3 0.2 383 435 4.2 4.8
Switzerland 47 20 0.6 0.3
Syrian Arab Republic
227 272 1.2 1.4
Thailand 34,241 38,025 54.3 59.9
The FYR of Macedonia
Yes Yes 35 23 1.7 1.1 14 25 0.7 1.2 11 9 0.5 0.4
Turkey Yes Yes 2,257 2,633 3.1 3.6 3,794 2,181 5.2 3.0 2,042 1,585 2.8 2.1
Ukraine Yes Yes 0 19 0.0 0.0
United Arab Emirates
83 44 2.0 1.0 114 477 2.8 11.2
United States of America
3,773 3,831 1.3 1.3
Venezuela 307 86 1.1 0.3
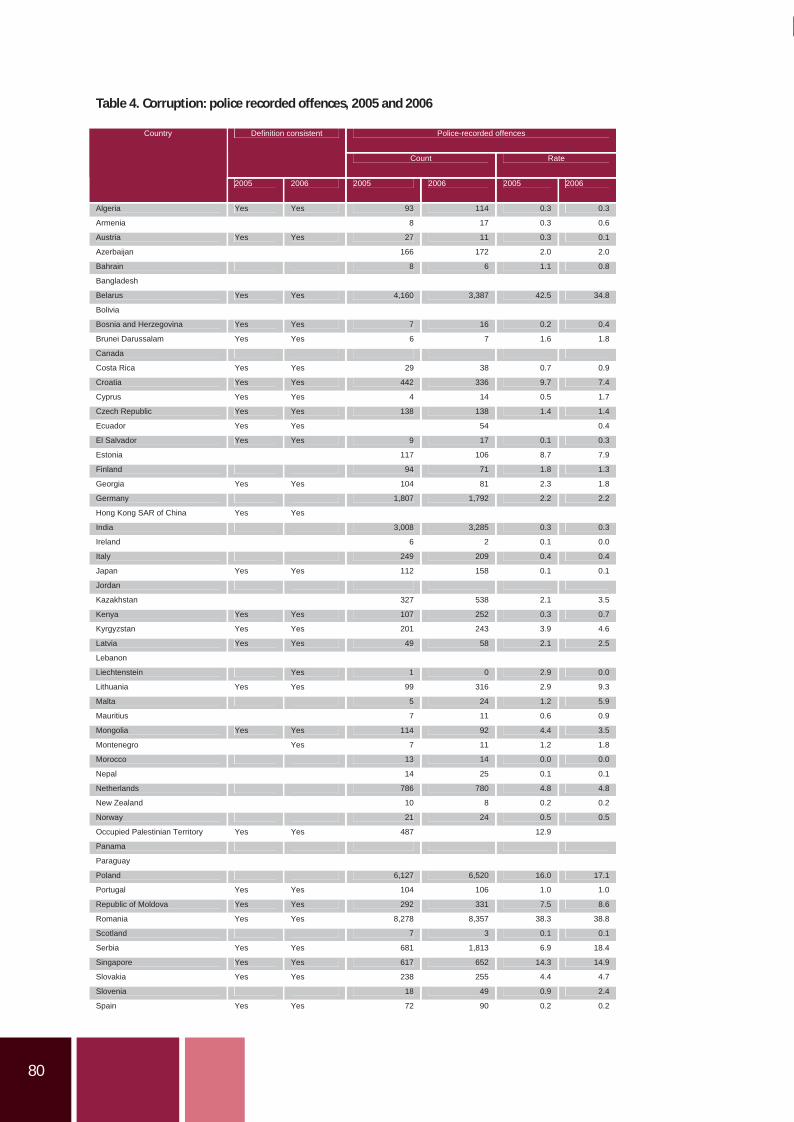
80
Table 4. Corruption: police recorded offences, 2005 and 2006
Police-recorded offences Definition consistent
Count Rate
Country
2005 2006 2005 2006 2005 2006
Algeria Yes Yes 93 114 0.3 0.3
Armenia 8 17 0.3 0.6
Austria Yes Yes 27 11 0.3 0.1
Azerbaijan 166 172 2.0 2.0
Bahrain 8 6 1.1 0.8
Bangladesh
Belarus Yes Yes 4,160 3,387 42.5 34.8
Bolivia
Bosnia and Herzegovina Yes Yes 7 16 0.2 0.4
Brunei Darussalam Yes Yes 6 7 1.6 1.8
Canada
Costa Rica Yes Yes 29 38 0.7 0.9
Croatia Yes Yes 442 336 9.7 7.4
Cyprus Yes Yes 4 14 0.5 1.7
Czech Republic Yes Yes 138 138 1.4 1.4
Ecuador Yes Yes 54 0.4
El Salvador Yes Yes 9 17 0.1 0.3
Estonia 117 106 8.7 7.9
Finland 94 71 1.8 1.3
Georgia Yes Yes 104 81 2.3 1.8
Germany 1,807 1,792 2.2 2.2
Hong Kong SAR of China Yes Yes
India 3,008 3,285 0.3 0.3
Ireland 6 2 0.1 0.0
Italy 249 209 0.4 0.4
Japan Yes Yes 112 158 0.1 0.1
Jordan
Kazakhstan 327 538 2.1 3.5
Kenya Yes Yes 107 252 0.3 0.7
Kyrgyzstan Yes Yes 201 243 3.9 4.6
Latvia Yes Yes 49 58 2.1 2.5
Lebanon
Liechtenstein Yes 1 0 2.9 0.0
Lithuania Yes Yes 99 316 2.9 9.3
Malta 5 24 1.2 5.9
Mauritius 7 11 0.6 0.9
Mongolia Yes Yes 114 92 4.4 3.5
Montenegro Yes 7 11 1.2 1.8
Morocco 13 14 0.0 0.0
Nepal 14 25 0.1 0.1
Netherlands 786 780 4.8 4.8
New Zealand 10 8 0.2 0.2
Norway 21 24 0.5 0.5
Occupied Palestinian Territory Yes Yes 487 12.9
Panama
Paraguay
Poland 6,127 6,520 16.0 17.1
Portugal Yes Yes 104 106 1.0 1.0
Republic of Moldova Yes Yes 292 331 7.5 8.6
Romania Yes Yes 8,278 8,357 38.3 38.8
Scotland 7 3 0.1 0.1
Serbia Yes Yes 681 1,813 6.9 18.4
Singapore Yes Yes 617 652 14.3 14.9
Slovakia Yes Yes 238 255 4.4 4.7
Slovenia 18 49 0.9 2.4
Spain Yes Yes 72 90 0.2 0.2
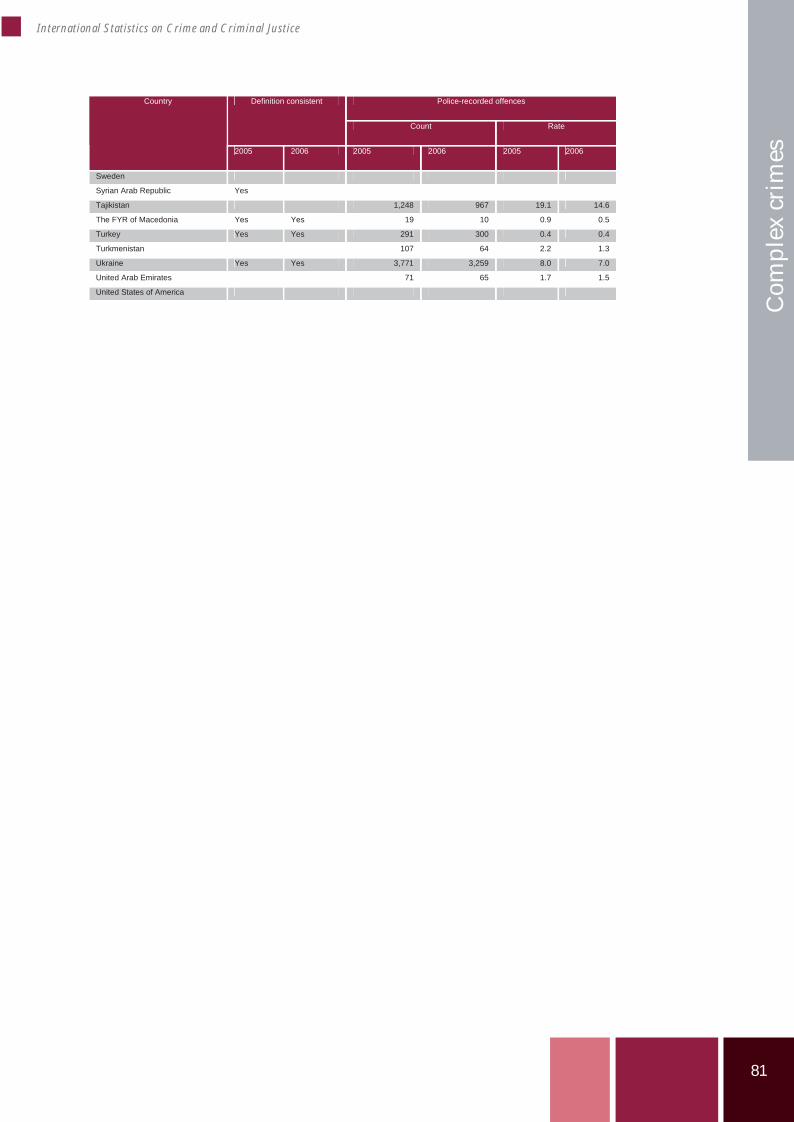
81
International Statistics on Crime and Criminal Justice
Com
plex
cri
mes
Police-recorded offences Definition consistent
Count Rate
Country
2005 2006 2005 2006 2005 2006
Sweden
Syrian Arab Republic Yes
Tajikistan 1,248 967 19.1 14.6
The FYR of Macedonia Yes Yes 19 10 0.9 0.5
Turkey Yes Yes 291 300 0.4 0.4
Turkmenistan 107 64 2.2 1.3
Ukraine Yes Yes 3,771 3,259 8.0 7.0
United Arab Emirates 71 65 1.7 1.5
United States of America
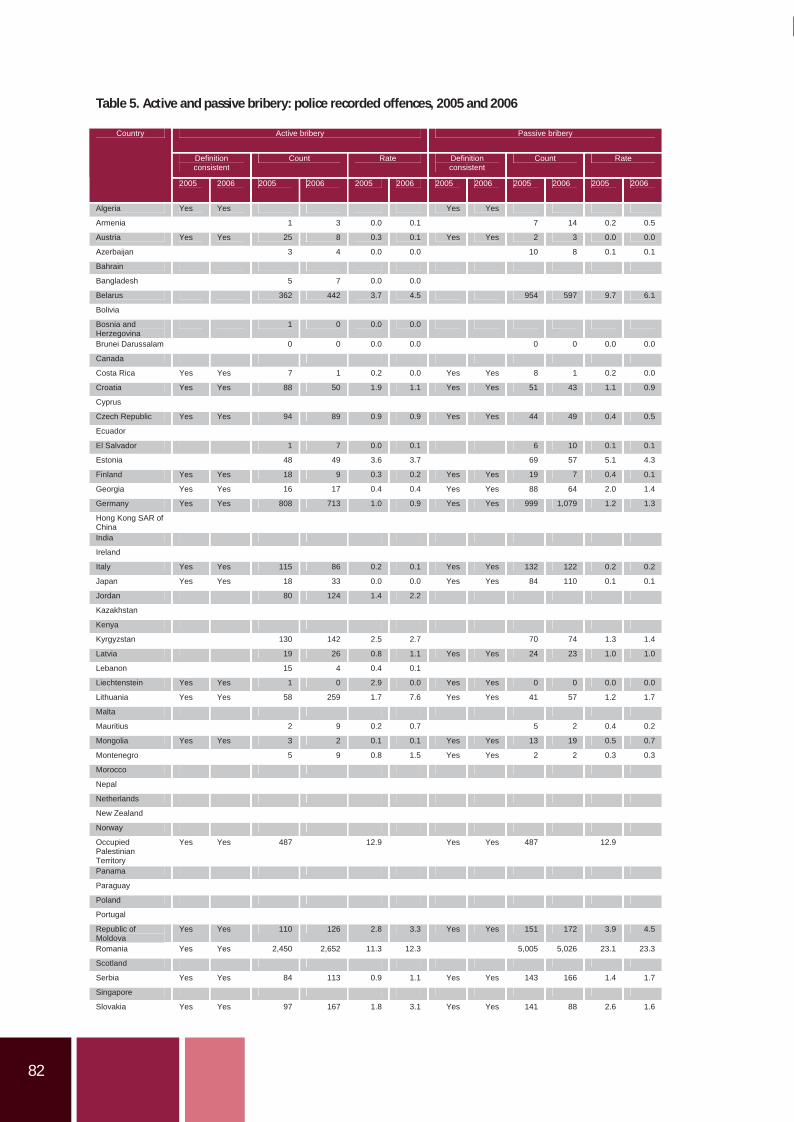
82
Table 5. Active and passive bribery: police recorded offences, 2005 and 2006
Active bribery Passive bribery
Definition consistent
Count Rate Definition consistent
Count Rate
Country
2005 2006 2005 2006 2005 2006 2005 2006 2005 2006 2005 2006
Algeria Yes Yes Yes Yes
Armenia 1 3 0.0 0.1 7 14 0.2 0.5
Austria Yes Yes 25 8 0.3 0.1 Yes Yes 2 3 0.0 0.0
Azerbaijan 3 4 0.0 0.0 10 8 0.1 0.1
Bahrain
Bangladesh 5 7 0.0 0.0
Belarus 362 442 3.7 4.5 954 597 9.7 6.1
Bolivia
Bosnia and Herzegovina
1 0 0.0 0.0
Brunei Darussalam 0 0 0.0 0.0 0 0 0.0 0.0
Canada
Costa Rica Yes Yes 7 1 0.2 0.0 Yes Yes 8 1 0.2 0.0
Croatia Yes Yes 88 50 1.9 1.1 Yes Yes 51 43 1.1 0.9
Cyprus
Czech Republic Yes Yes 94 89 0.9 0.9 Yes Yes 44 49 0.4 0.5
Ecuador
El Salvador 1 7 0.0 0.1 6 10 0.1 0.1
Estonia 48 49 3.6 3.7 69 57 5.1 4.3
Finland Yes Yes 18 9 0.3 0.2 Yes Yes 19 7 0.4 0.1
Georgia Yes Yes 16 17 0.4 0.4 Yes Yes 88 64 2.0 1.4
Germany Yes Yes 808 713 1.0 0.9 Yes Yes 999 1,079 1.2 1.3
Hong Kong SAR of China
India
Ireland
Italy Yes Yes 115 86 0.2 0.1 Yes Yes 132 122 0.2 0.2
Japan Yes Yes 18 33 0.0 0.0 Yes Yes 84 110 0.1 0.1
Jordan 80 124 1.4 2.2
Kazakhstan
Kenya
Kyrgyzstan 130 142 2.5 2.7 70 74 1.3 1.4
Latvia 19 26 0.8 1.1 Yes Yes 24 23 1.0 1.0
Lebanon 15 4 0.4 0.1
Liechtenstein Yes Yes 1 0 2.9 0.0 Yes Yes 0 0 0.0 0.0
Lithuania Yes Yes 58 259 1.7 7.6 Yes Yes 41 57 1.2 1.7
Malta
Mauritius 2 9 0.2 0.7 5 2 0.4 0.2
Mongolia Yes Yes 3 2 0.1 0.1 Yes Yes 13 19 0.5 0.7
Montenegro 5 9 0.8 1.5 Yes Yes 2 2 0.3 0.3
Morocco
Nepal
Netherlands
New Zealand
Norway
Occupied Palestinian Territory
Yes Yes 487 12.9 Yes Yes 487 12.9
Panama
Paraguay
Poland
Portugal
Republic of Moldova
Yes Yes 110 126 2.8 3.3 Yes Yes 151 172 3.9 4.5
Romania Yes Yes 2,450 2,652 11.3 12.3 5,005 5,026 23.1 23.3
Scotland
Serbia Yes Yes 84 113 0.9 1.1 Yes Yes 143 166 1.4 1.7
Singapore
Slovakia Yes Yes 97 167 1.8 3.1 Yes Yes 141 88 2.6 1.6
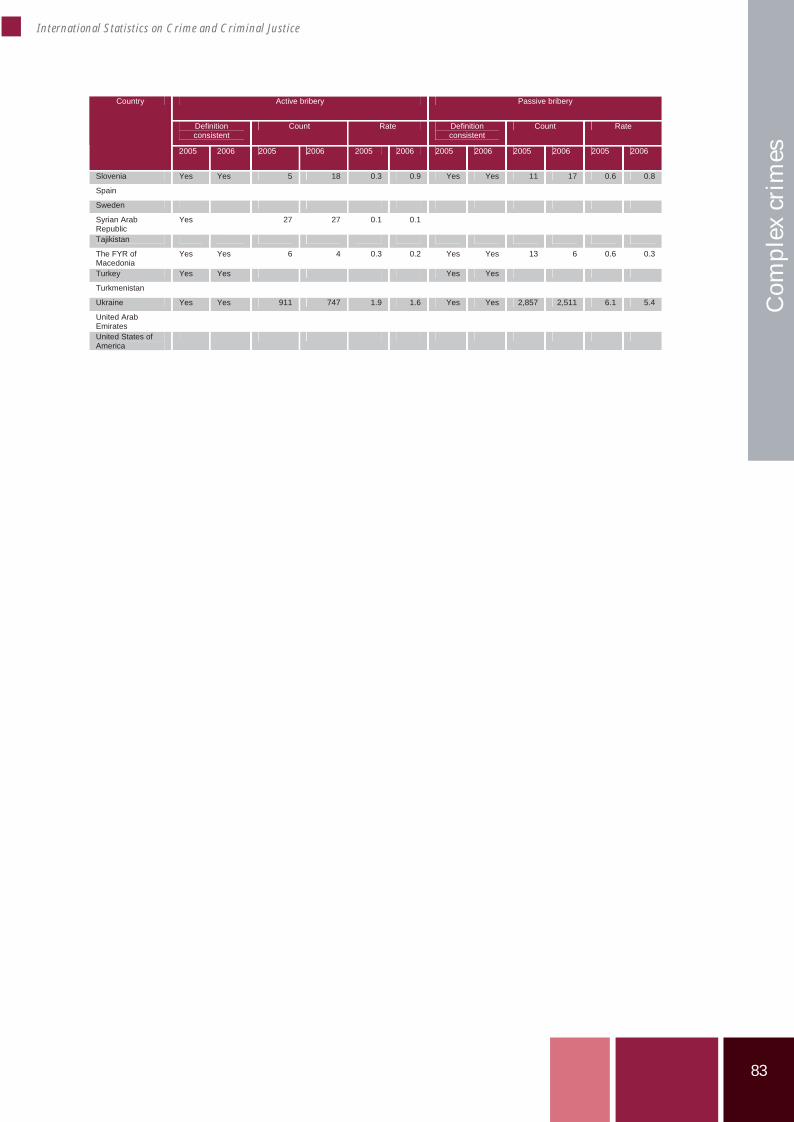
83
International Statistics on Crime and Criminal Justice
Com
plex
cri
mes
Active bribery Passive bribery
Definition consistent
Count Rate Definition consistent
Count Rate
Country
2005 2006 2005 2006 2005 2006 2005 2006 2005 2006 2005 2006
Slovenia Yes Yes 5 18 0.3 0.9 Yes Yes 11 17 0.6 0.8
Spain
Sweden
Syrian Arab Republic
Yes 27 27 0.1 0.1
Tajikistan
The FYR of Macedonia
Yes Yes 6 4 0.3 0.2 Yes Yes 13 6 0.6 0.3
Turkey Yes Yes Yes Yes
Turkmenistan
Ukraine Yes Yes 911 747 1.9 1.6 Yes Yes 2,857 2,511 6.1 5.4
United Arab Emirates
United States of America
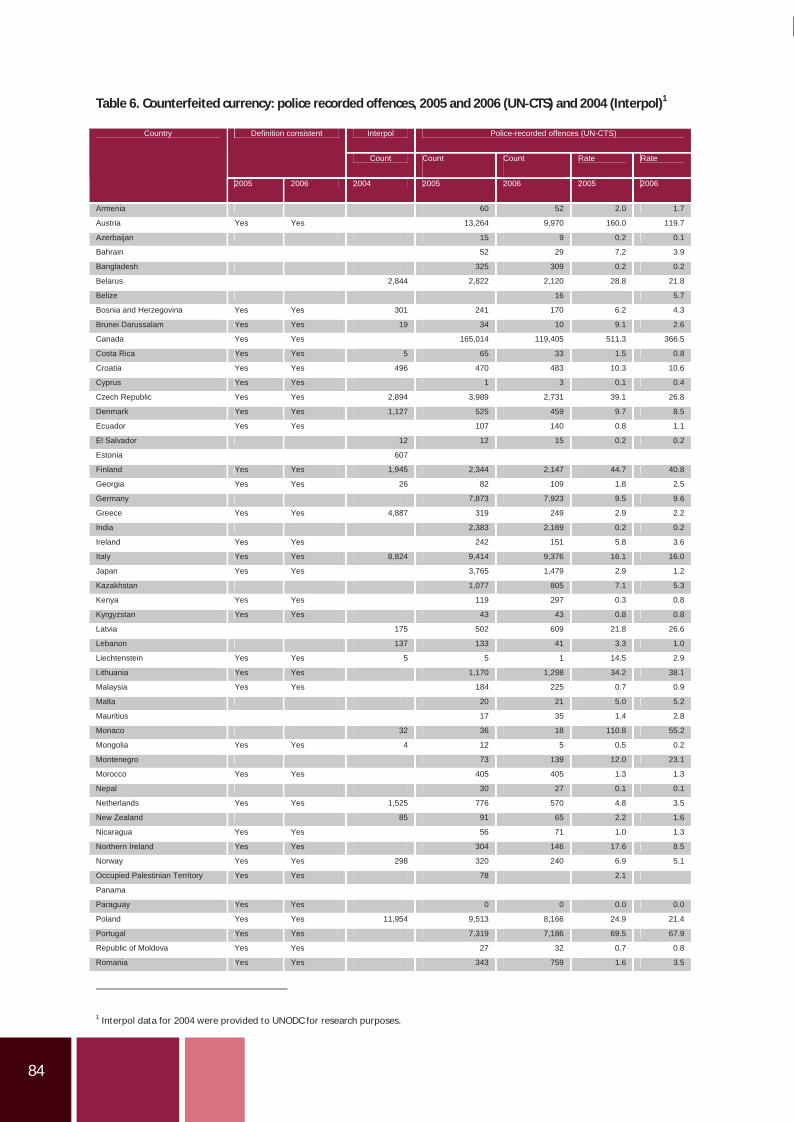
84
Table 6. Counterfeited currency: police recorded offences, 2005 and 2006 (UN CTS) and 2004 (Interpol)1
Interpol Police-recorded offences (UN-CTS) Definition consistent
Count Count Count Rate Rate
Country
2005 2006 2004 2005 2006 2005 2006
Armenia 60 52 2.0 1.7
Austria Yes Yes 13,264 9,970 160.0 119.7
Azerbaijan 15 9 0.2 0.1
Bahrain 52 29 7.2 3.9
Bangladesh 325 309 0.2 0.2
Belarus 2,844 2,822 2,120 28.8 21.8
Belize 16 5.7
Bosnia and Herzegovina Yes Yes 301 241 170 6.2 4.3
Brunei Darussalam Yes Yes 19 34 10 9.1 2.6
Canada Yes Yes 165,014 119,405 511.3 366.5
Costa Rica Yes Yes 5 65 33 1.5 0.8
Croatia Yes Yes 496 470 483 10.3 10.6
Cyprus Yes Yes 1 3 0.1 0.4
Czech Republic Yes Yes 2,894 3,989 2,731 39.1 26.8
Denmark Yes Yes 1,127 525 459 9.7 8.5
Ecuador Yes Yes 107 140 0.8 1.1
El Salvador 12 12 15 0.2 0.2
Estonia 607
Finland Yes Yes 1,945 2,344 2,147 44.7 40.8
Georgia Yes Yes 26 82 109 1.8 2.5
Germany 7,873 7,923 9.5 9.6
Greece Yes Yes 4,887 319 249 2.9 2.2
India 2,383 2,169 0.2 0.2
Ireland Yes Yes 242 151 5.8 3.6
Italy Yes Yes 8,824 9,414 9,376 16.1 16.0
Japan Yes Yes 3,765 1,479 2.9 1.2
Kazakhstan 1,077 805 7.1 5.3
Kenya Yes Yes 119 297 0.3 0.8
Kyrgyzstan Yes Yes 43 43 0.8 0.8
Latvia 175 502 609 21.8 26.6
Lebanon 137 133 41 3.3 1.0
Liechtenstein Yes Yes 5 5 1 14.5 2.9
Lithuania Yes Yes 1,170 1,298 34.2 38.1
Malaysia Yes Yes 184 225 0.7 0.9
Malta 20 21 5.0 5.2
Mauritius 17 35 1.4 2.8
Monaco 32 36 18 110.8 55.2
Mongolia Yes Yes 4 12 5 0.5 0.2
Montenegro 73 139 12.0 23.1
Morocco Yes Yes 405 405 1.3 1.3
Nepal 30 27 0.1 0.1
Netherlands Yes Yes 1,525 776 570 4.8 3.5
New Zealand 85 91 65 2.2 1.6
Nicaragua Yes Yes 56 71 1.0 1.3
Northern Ireland Yes Yes 304 146 17.6 8.5
Norway Yes Yes 298 320 240 6.9 5.1
Occupied Palestinian Territory Yes Yes 78 2.1
Panama
Paraguay Yes Yes 0 0 0.0 0.0
Poland Yes Yes 11,954 9,513 8,166 24.9 21.4
Portugal Yes Yes 7,319 7,186 69.5 67.9
Republic of Moldova Yes Yes 27 32 0.7 0.8
Romania Yes Yes 343 759 1.6 3.5
1 Interpol data for 2004 were provided to UNODC for research purposes.
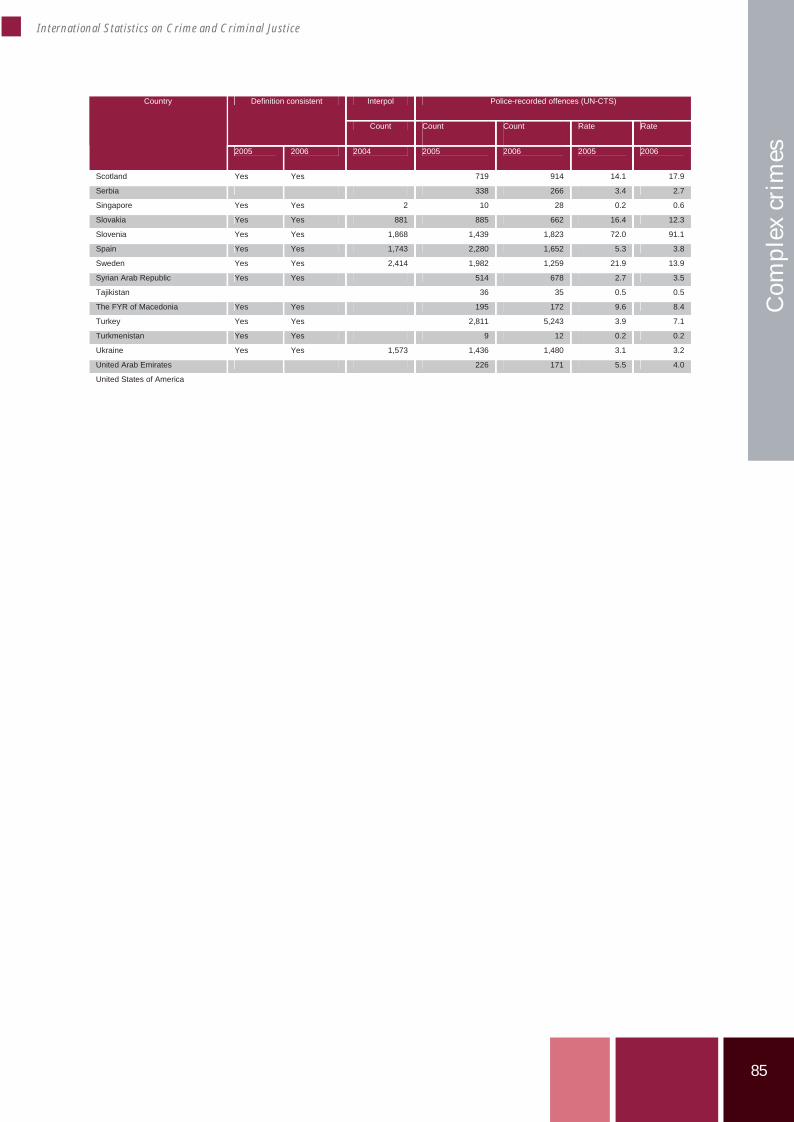
85
International Statistics on Crime and Criminal Justice
Com
plex
cri
mes
Interpol Police-recorded offences (UN-CTS) Definition consistent
Count Count Count Rate Rate
Country
2005 2006 2004 2005 2006 2005 2006
Scotland Yes Yes 719 914 14.1 17.9
Serbia 338 266 3.4 2.7
Singapore Yes Yes 2 10 28 0.2 0.6
Slovakia Yes Yes 881 885 662 16.4 12.3
Slovenia Yes Yes 1,868 1,439 1,823 72.0 91.1
Spain Yes Yes 1,743 2,280 1,652 5.3 3.8
Sweden Yes Yes 2,414 1,982 1,259 21.9 13.9
Syrian Arab Republic Yes Yes 514 678 2.7 3.5
Tajikistan 36 35 0.5 0.5
The FYR of Macedonia Yes Yes 195 172 9.6 8.4
Turkey Yes Yes 2,811 5,243 3.9 7.1
Turkmenistan Yes Yes 9 12 0.2 0.2
Ukraine Yes Yes 1,573 1,436 1,480 3.1 3.2
United Arab Emirates 226 171 5.5 4.0
United States of America

86

87
International Statistics on Crime and Criminal Justice
Cri
min
al Ju
stic
e Sy
stem
Chapter 5 – Responses of the criminal justicesystem
Paul Smit* and Stefan Harrendorf**
Abstract
In this chapter the responses of the criminal justice system on crime are described, from the moment anoffender is found until a decision of a judge at a penal court. The number of persons prosecuted andconvicted are analysed, both adults and juveniles as well as the proportion of females. This is done for totaloffences and separately for intentional homicide. Where possible, data are given by country and bycontinent. Next, the attrition process is discussed in two ways. Firstly the number of offenders convicted arecompared to the offenders found. Secondly, the attrition process is shown in more detail with four momentsin the criminal justice system, i.e. crimes recorded, offenders found, offenders prosecuted and offendersconvicted.
Introduction
This chapter describes the reaction from thecriminal justice system on crime. Although thiscan start at the moment a victim reports a crimeto the police or one can argue maybe evenbefore that with general preventive measuresthe starting point for this chapter is when asuspected offender is found. And the end pointwill be the decision of a judge at a penal court.Again, one could also consider the types ofsanctions and the prison population as part ofthe criminal justice system. However,information on types of sanctions was not askedfor in the 8th, 9th and 10th survey of the UNCTS. Information on prisons and prisoners willbe dealt with in chapter 7.
This means that the main theme in this chapteris what happens in the prosecution stage and atthe court level. Some attention is given to thepolice level as well, but mainly from theperspective of the prosecution (i.e. as potentialinput for the prosecution). The main indicatorsin this chapter are the number of persons thathave been prosecuted and the number of personsthat have been convicted. For both indicators theproportions of females and juveniles will beconsidered as well. Prosecutions and convictions
will be given regardless of the crime type withone exception: intentional homicide will be dealtwith separately.
At every phase in the criminal justice systemsome attrition is expected to take place. This iscaused both by technical / legal reasons (e.g. notenough evidence for an alleged offender found)and by efficiency reasons where police and/orprosecution make a case ending decisionthemselves. In this chapter the attrition processwill be described between the moment a crime isregistered and the conviction by a court.
Data are taken from the UN CTS exclusively,from the 6th to the 10th survey (and for somecountries the 5th survey was used as well). Wherepossible, data from the three years 1996, 2001 and2006 were used. However, in order to minimizethe number of ‘missing values’, other years weretaken instead if there were no data available forone or more of these three years for a specificcountry. Besides, a quality check was made on thedata. This could have resulted in using anotheryear for a country as well (or in not consideringthe data at all). See Annex B and C for a completedescription of the data selection process.
* Program Supervisor Modelling and Jus ce Sta s cs WODC, Ministry of Jus ce, the Netherlands** Senior researcher at the Department of Criminology, Ins tute of Criminal Law and Jus ce,University of Gö ngen, Germany
88
In the following sections the number of personsprosecuted and convicted will be described, boththe most recent data available and the trends overthe last ten years. Median values per continentwill be presented where possible (see Annex B)
while data will also be given by country. Finally,the attrition process will be described, startingwith the relation between alleged offenders andrecorded crime and ending with convictedoffenders.
Prosecutions
In the 10th UN CTS the following definition wasused for ‘persons prosecuted’:
“Persons prosecuted” may be understood to meanalleged offenders prosecuted by means of anofficial charge, initiated by the public prosecutoror the law enforcement agency responsible forprosecution.
In many countries the general procedure in thecriminal justice system is that, after an offenderis found, the Prosecution Service will be theinstitution that brings the offender to the court.The court then decides on the guilt of theoffender and the appropriate punishment.Within this general scheme many variations arepossible, depending on the precise function ofthe Prosecution Service: whether the country hasa legality or opportunity principle or whether theProsecution Service in a country has a monopolyto prosecute. Other variations can be found inthe options the police has to end proceedingswithout any involvement of the ProsecutionService. For a more detailed discussion on theseissues see (Elsner, Smit, Zila 2008; Jehle, Smit,Zila 2008; Smit 2008; Wade 2006) Thesevariations obviously have a considerable impactin the figures presented here.
But other, more technical or statistical factorsare responsible for variations in the figures aswell: three offences by one suspected offendercould be counted as one or three, depending onthe statistical counting choice made in a country.And although in the UN definition ‘other lawenforcement agencies’ are explicitly included,presumably not every country would be able toprovide figures for these besides the PublicProsecutor.
Another factor, probably causing considerablevariation in the total number of personsprosecuted is the precise operationalisation ofwhat is included in ‘all offences’ in the context ofthe prosecution process. Are only the mostserious crimes considered here? Or also minorcrimes (even infractions)? That this is probablyan important factor is also shown by thecorrelation between the total number of personsprosecuted and the number of prosecutions for
intentional homicide which is remarkably low(0.25).
In table 1 the latest available figures for personprosecuted are given. Unless otherwisementioned (in the columns ‘yr’), the data are for2006. The earliest year possible is 2000. Only the92 countries that were able to provide at leastone figure for ‘persons prosecuted’ are in thetable. The countries are grouped by continentand if at least five responses were available in acontinent the median was computed. Both for alloffences and for intentional homicide the totalnumber of persons prosecuted are given (in thecase of ‘all offences’ the total number was splitbetween adults and juveniles) as well as the ratesper 100,000 inhabitants. Both for adults andjuveniles the proportion of females wascomputed.
As expected, when looking at the rates per100,000 there is considerable variation in thenumber of persons prosecuted. Nepal andPakistan are the lowest with 5 and 6 personsprosecuted per 100,000 inhabitants. Othercountries with less than 50 are Guatemala,Venezuela, the Republic of Moldova and PapuaNew Guinea. For most of these countries, bycomparing with the persons prosecuted forintentional homicide, there is a strong suspicionthat only the most serious crimes are includedhere. As an example, in Venezuela almost half ofthe 9,550 persons prosecuted are prosecuted forhomicide.
Countries with the highest number of personsprosecuted are Belgium (6,512) and Turkey(4,588). Other countries with numbers of 2,000or more are South Africa, the Republic of Korea,Austria, Finland, England & Wales and NewZealand.
Clearly, most countries with higher numbers ofpersons prosecuted can be found in Europe, witha median of 973. America has the lowest median(191). However, due to the considerable variationand the low number of countries responding insome continents (only 6 in Africa) it is veryproblematic to draw conclusions from this.
89
International Statistics on Crime and Criminal Justice
Cri
min
al Ju
stic
e Sy
stem
Less variation can be seen in the proportion ofjuveniles among persons prosecuted. Howeverthere is one outlier at the high end (Ukraine with44% juveniles). Also there are several countrieswith very low percentages (3% or less) whichshould be interpreted with some caution: inmany countries juveniles committing a crime arefor a large part dealt with outside the CriminalJustice System. Generally the highest percentagesof juveniles can be found in America and Europe(median 8%).
The proportion of females prosecuted is typicallybetween 10% and 15%, again with some outlierssuch as Singapore with 28% and Hong Kong andSlovenia with 27% adult females, or Barbadosand Swaziland with more than 30% juvenilefemales. And on the low end Pakistan with 0%adult females, Jordan with 0% juvenile femalesand Georgia with 1% for both adults andjuveniles. Some of the outliers are possibly due tolow absolute numbers. The proportion of femalestend to be a little higher in Europe, particularlyfor adult females. And within Europe mainly theNorthern and Western countries have a higherproportion of females, possibly due toshoplifting (Smit 2008).
For homicide again the variation is considerable.Partly this is because some countries could havepresented the data including attempts (seeAnnex B). In Asia and Europe most countrieshave a low number of persons prosecuted forintentional homicide per 100,000, typicallybetween 1.0 and 3.0. However, some countries inthese continents do have much higher numbers,from 8.0 upwards. This is the case forKazakhstan, Mongolia, Sri Lanka, Albania,
Belgium, Belarus, Estonia, Lithuania, theRussian federation, and Turkey. Still the medianfor Asia is 2.1 and for Europe 2.3 which is lowerthan for Africa and America.
In table 2 (Annex A) the trends in personsprosecuted are shown. Trends for adults andjuveniles are computed separately, as well astrends for homicides. For two periods the averageannual change is given: for the most recent years2001 to 2006, and for the whole period 1996 to2006. It was not possible to use these exactperiods for every country, in some cases otheryears we taken as substitute. See Annex B for adetailed description. However, by computing theaverage annual change the figures in the table arecomparable. For 44 countries at least one trendfigure could be computed.
In general the number of adults prosecutedseems to increase over the years, particularly inthe last few years. Some of the increases areremarkable, such as for Georgia and Iceland. Theincreases in Finland, England & Wales andNorthern Ireland have mainly occurred in the1996 – 2001 period.
The trends in juveniles prosecuted is completelydifferent. Here there is a decrease, again mainlyin the last few years. There are some exceptionssuch as the very high increase in juvenilesprosecuted in Portugal, most probably this couldbe explained by a change in the system there.
For homicide a decrease can be seen as well,although the variation seems to be somewhathigher between countries.
Convictions
In the 10th UN CTS the following definition wasused for ‘persons convicted’:
“Persons convicted” may be understood to meanpersons found guilty by any legal body dulyauthorized to pronounce them convicted undernational law, whether the conviction was laterupheld or not.
Not all persons against whom a prosecution hasstarted will be convicted. Apart from a – usuallysmall – percentage of alleged offenders foundnot guilty in court, in many countries this ismainly dependent on the possibilities for theprosecutor to end a case, either with or withoutconsequences for the alleged offender. For someEuropean countries the different options for theprosecutor has been shown in (Jehle, Smit, Zila
2008; Wade 2006). Other factors, like specialprocedures for juveniles or for minor offenceswill also cause some variation in the figures.
As was the case with persons prosecuted,technical or statistical factors could beresponsible for variations in the figures as well.And also here, the issue of which offences areexactly included in ‘all offences’ is important.The more so as the correlation between the totalnumber of persons convicted and the number ofpersons convicted for intentional homicide isalmost zero ( 0.07).
In table 3 (Annex A) the latest available figuresfor person convicted are given. Unless otherwisementioned (in the columns ‘yr’), the data are for2006. The earliest year possible is 2000. Only the
90
95 countries that were able to provide at leastone figure for ‘persons convicted’ are in the table.The countries are grouped by continent and if atleast five responses were available in a continentthe median was computed. Both for all offencesand for intentional homicide the total number ofpersons convicted are given (in the case of ‘alloffences’ the total number was split betweenadults and juveniles) as well as the rates per100,000 inhabitants. Both for adults andjuveniles the proportion of females wascomputed.
Generally and for most countries, looking at therates per 100,000, the number of personsconvicted is somewhat lower than personsprosecuted. This will be discussed more in detailbelow. Still, there is a considerable variation inthe rates. Colombia with a rate of 0 and Ethiopiaand Papua New Guinea with 4 are the lowest.Other countries with a rate less than 30 areZambia, Bolivia, Ecuador, Venezuela,Afghanistan, Nepal, the Philippines and Malta.As we also saw with the prosecutions in table 5.1,by comparing with the persons convicted forintentional homicide, there is a strong suspicionfor some of these countries that only the mostserious crimes are included here. As an example,in Papua New Guinea almost all (220 of the 283)persons convicted are convicted for homicide.
Countries with the highest number of personsconvicted are Mauritius (10,762) and Egypt(7,105). Other countries with numbers of 2,000or more are Finland, England & Wales and NewZealand.
Clearly, most countries with higher numbers ofpersons convicted can be found in Europe, with amedian of 698. America has the lowest median(75). However, due to the considerable variationand the low number of countries responding insome continents (only 7 in Africa) it is veryproblematic to draw conclusions from this.
The highest percentages of juveniles compared tothe total number of persons convicted can befound in Malta (60%) and Australia (46%). Inthe case of Malta this could well be caused by thelow absolute numbers. The highest percentagescan be found in America (median 11%) andEurope (median 7%). In general the proportionof juveniles convicted is somewhat lower thanjuveniles prosecuted. A possible explanationcould be that a prosecutor is more inclined toend a case with juveniles outside the court.
The percentage of females convicted is generallyabout 10%, for adults somewhat higher than forjuveniles. Outliers are Barbados (53%, possibly
due to low absolute numbers), Hong Kong (28%for adults) and Thailand (26% for adults).Mauritius, Afghanistan, Armenia, the OccupiedPalestinian Territory, the Philippines and Qatarhave very low proportions of females convicted,either for adults, juveniles or both. The highestpercentages can be found in Europe andAmerica. The median proportion of femalesconvicted is considerably lower than femalesprosecuted. This could well be explained by thefact that crimes committed by female offenderstend to be less serious and thus have a greaterchance to get a settlement outside the court.
As with prosecution, possibly because somecountries could have presented the dataincluding attempts (see Annex B), the variationin persons convicted for intentional homicide isconsiderable. Guatemala (26.3), Turkey (18.6),the Russian Federation (13.2) Mongolia (11.0) andBelarus (10.0) are the highest while on the otherhand for 15 countries the rate is 0.5 or less. Themedian is about 1 for all continents except forAmerica where it is 3.6.
In table 4 the trends in persons convicted areshown. Trends for adults and juveniles arecomputed separately, as well as trends forhomicides. For two periods the average annualchange is given: for the most recent years 2001 to2006, and for the whole period 1996 to 2006. Itwas not possible to use these exact periods forevery country, in some cases other years we takenas substitute. See Annex B for a detaileddescription. However, by computing the averageannual change the figures in the table arecomparable. For 57 countries at least one trendfigure could be computed.
In most countries the number of adultsconvicted seems to increase over the years,particularly in the last few years (the median ofthe average annual increase is 3.0%). The largestincreases can be seen in Malaysia (24.4% in thewhole period 1996 – 2006), England & Wales(20.2% in 1996 – 2006) and Northern Ireland(37.6% in the period 2001 – 2006). Kazakhstan( 13.6%) and Armenia ( 11.8%) show a decrease inthe period 2001 – 2006. With some exceptions(Georgia, Spain, Sweden and Northern Ireland)the trends in juveniles convicted is downward.This is consistent with what we saw forprosecutions: for adults an increase and forjuveniles a decrease.
For homicide however there is an increase in thenumber of persons convicted in the last period(2001–2006). But the variation between countriesis considerable.
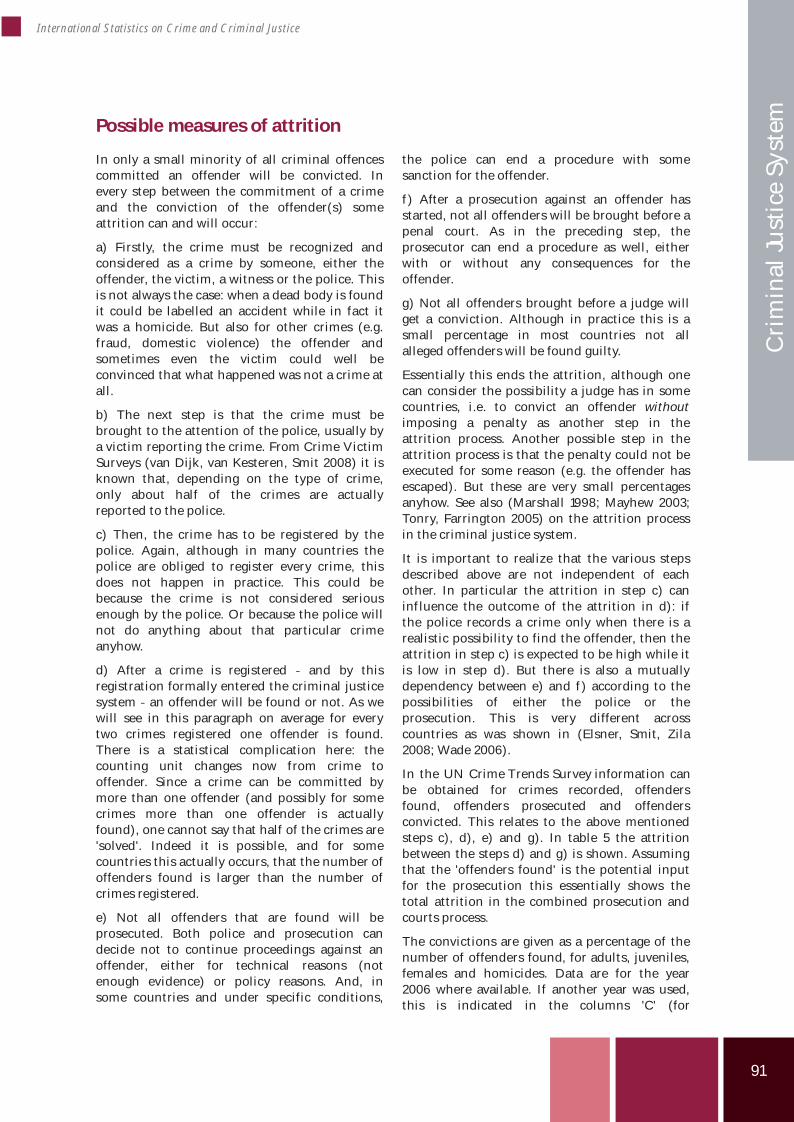
91
International Statistics on Crime and Criminal Justice
Cri
min
al Ju
stic
e Sy
stem
Possible measures of attrition
In only a small minority of all criminal offencescommitted an offender will be convicted. Inevery step between the commitment of a crimeand the conviction of the offender(s) someattrition can and will occur:
a) Firstly, the crime must be recognized andconsidered as a crime by someone, either theoffender, the victim, a witness or the police. Thisis not always the case: when a dead body is foundit could be labelled an accident while in fact itwas a homicide. But also for other crimes (e.g.fraud, domestic violence) the offender andsometimes even the victim could well beconvinced that what happened was not a crime atall.
b) The next step is that the crime must bebrought to the attention of the police, usually bya victim reporting the crime. From Crime VictimSurveys (van Dijk, van Kesteren, Smit 2008) it isknown that, depending on the type of crime,only about half of the crimes are actuallyreported to the police.
c) Then, the crime has to be registered by thepolice. Again, although in many countries thepolice are obliged to register every crime, thisdoes not happen in practice. This could bebecause the crime is not considered seriousenough by the police. Or because the police willnot do anything about that particular crimeanyhow.
d) After a crime is registered and by thisregistration formally entered the criminal justicesystem an offender will be found or not. As wewill see in this paragraph on average for everytwo crimes registered one offender is found.There is a statistical complication here: thecounting unit changes now from crime tooffender. Since a crime can be committed bymore than one offender (and possibly for somecrimes more than one offender is actuallyfound), one cannot say that half of the crimes are'solved'. Indeed it is possible, and for somecountries this actually occurs, that the number ofoffenders found is larger than the number ofcrimes registered.
e) Not all offenders that are found will beprosecuted. Both police and prosecution candecide not to continue proceedings against anoffender, either for technical reasons (notenough evidence) or policy reasons. And, insome countries and under specific conditions,
the police can end a procedure with somesanction for the offender.
f ) After a prosecution against an offender hasstarted, not all offenders will be brought before apenal court. As in the preceding step, theprosecutor can end a procedure as well, eitherwith or without any consequences for theoffender.
g) Not all offenders brought before a judge willget a conviction. Although in practice this is asmall percentage in most countries not allalleged offenders will be found guilty.
Essentially this ends the attrition, although onecan consider the possibility a judge has in somecountries, i.e. to convict an offender withoutimposing a penalty as another step in theattrition process. Another possible step in theattrition process is that the penalty could not beexecuted for some reason (e.g. the offender hasescaped). But these are very small percentagesanyhow. See also (Marshall 1998; Mayhew 2003;Tonry, Farrington 2005) on the attrition processin the criminal justice system.
It is important to realize that the various stepsdescribed above are not independent of eachother. In particular the attrition in step c) caninfluence the outcome of the attrition in d): ifthe police records a crime only when there is arealistic possibility to find the offender, then theattrition in step c) is expected to be high while itis low in step d). But there is also a mutuallydependency between e) and f ) according to thepossibilities of either the police or theprosecution. This is very different acrosscountries as was shown in (Elsner, Smit, Zila2008; Wade 2006).
In the UN Crime Survey information canbe obtained for crimes recorded, offendersfound, offenders prosecuted and offendersconvicted. This relates to the above mentionedsteps c), d), e) and g). In table 5 the attritionbetween the steps d) and g) is shown. Assumingthat the 'offenders found' is the potential inputfor the prosecution this essentially shows thetotal attrition in the combined prosecution andcourts process.
The convictions are given as a percentage of thenumber of offenders found, for adults, juveniles,females and homicides. Data are for the year2006 where available. If another year was used,this is indicated in the columns 'C' (for
Trends
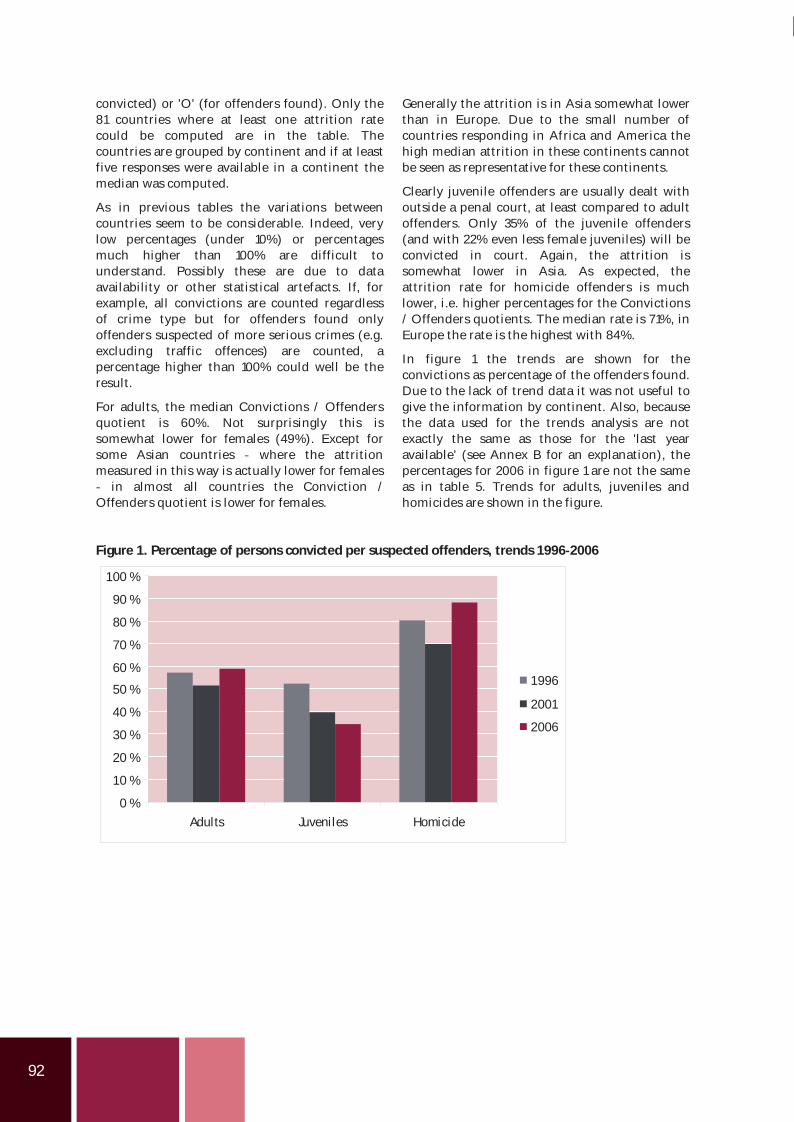
92
convicted) or 'O' (for offenders found). Only the81 countries where at least one attrition ratecould be computed are in the table. Thecountries are grouped by continent and if at leastfive responses were available in a continent themedian was computed.
As in previous tables the variations betweencountries seem to be considerable. Indeed, verylow percentages (under 10%) or percentagesmuch higher than 100% are difficult tounderstand. Possibly these are due to dataavailability or other statistical artefacts. If, forexample, all convictions are counted regardlessof crime type but for offenders found onlyoffenders suspected of more serious crimes (e.g.excluding traffic offences) are counted, apercentage higher than 100% could well be theresult.
For adults, the median Convictions / Offendersquotient is 60%. Not surprisingly this issomewhat lower for females (49%). Except forsome Asian countries where the attritionmeasured in this way is actually lower for females
in almost all countries the Conviction /Offenders quotient is lower for females.
Generally the attrition is in Asia somewhat lowerthan in Europe. Due to the small number ofcountries responding in Africa and America thehigh median attrition in these continents cannotbe seen as representative for these continents.
Clearly juvenile offenders are usually dealt withoutside a penal court, at least compared to adultoffenders. Only 35% of the juvenile offenders(and with 22% even less female juveniles) will beconvicted in court. Again, the attrition issomewhat lower in Asia. As expected, theattrition rate for homicide offenders is muchlower, i.e. higher percentages for the Convictions/ Offenders quotients. The median rate is 71%, inEurope the rate is the highest with 84%.
In figure 1 the trends are shown for theconvictions as percentage of the offenders found.Due to the lack of trend data it was not useful togive the information by continent. Also, becausethe data used for the trends analysis are notexactly the same as those for the 'last yearavailable' (see Annex B for an explanation), thepercentages for 2006 in figure 1 are not the sameas in table 5. Trends for adults, juveniles andhomicides are shown in the figure.
Figure 1. Percentage of persons convicted per suspected offenders, trends 1996 2006
0 %
10 %
20 %
30 %
40 %
50 %
60 %
70 %
80 %
90 %
100 %
Adults Juveniles Homicide
1996
2001
2006
93
International Statistics on Crime and Criminal Justice
Cri
min
al Ju
stic
e Sy
stem
Both for adults and for homicides attritionseemed to increase (i.e. lower percentages) in theperiod 1996 2001. This trend was reversed in theperiod 2001 2006 resulting in a levelcomparable to 1996. For juveniles however theattrition increased during the whole 10 yearperiod. This possibly indicates that there hasbeen a change in attitude towards juveniles, i.e. atendency to deal with juvenile offenders moreand more outside a penal court.
Tables 6 and 7 look into the attrition process inmore detail. Here, the number of offendersfound, offenders prosecuted and convicted (stepsd), e) and g) as earlier described) are related tothe number of offences recorded (step c)). Table6 gives the information for all offences, table 7for homicide. In table 6 the offenders areseparated into adult and juveniles. Where
available, the year 2006 is taken, otherwiseanother year (but not before 2000) is used. Thisis indicated in the tables. In the 'recorded'column the rates of offences recorded per100,000 inhabitants are given. The other columnsgive the number of offenders ('found','prosecuted' and 'convicted') per 100 offencesrecorded. Since the counting unit has changedfrom offences to offenders these are notpercentages and could well be more than 100.The countries are grouped by continent and if atleast five responses were available in a continentthe median was computed.
Figure 2 shows the medians over all countriesand all offences, for adults and juveniles. This isa graphical representation of the last line in table6.
Figure 2. Attrition in the criminal justice system for all offences, 2006. Median of all countries.Indexed with Recorded = 100
On average or, more precisely, by taking themedian over all countries one offender is foundfor every two crimes recorded. In both steps thatfollow the attrition is about one third: two of thethree offenders found are prosecuted and two ofthe three offenders prosecuted are convicted. Atthe individual country level the attrition
between offenders found and offendersprosecuted can be very different from theattrition between offenders prosecuted andconvicted. As an example in Finland 41 of the 68adult offenders found are prosecuted, but thenalmost all (40) are convicted. But in Slovakia theattrition mainly takes place in the last part:
0
10
20
30
40
50
60
70
80
90
100
Recorded Offenders Prosecuted Convicted
Juveniles
Adults
94
almost all (37 out of 41) adult offenders found areprosecuted, but only 21 are convicted.
In Asia the attrition is less than in the othercontinents. However, the rate of offencesrecorded is low for Asia. A possible mechanismhere could be that crimes with a low chance offinding an offender are not always recorded. InAmerica the overall attrition is very high withonly 4.6 adult and 0.5 juvenile offendersconvicted per 100 crimes recorded.
For homicide the attrition is much less.Obviously because the criminal justice system,starting with a police investigation, will give ahigher priority to homicides than to less seriousoffences. Also, when an offender is found thecase will usually be brought before a penal court.In many countries more offenders are found thanoffences recorded. One of the reasons is that,
while some homicides will never be solved (andno offenders will be found) there will also behomicides with more than one offender. Hardlyany attrition is found for the prosecution: almostall (102 out of 108) offenders found will beprosecuted. But in the next stage there is someattrition: three out of four prosecutions end in aconviction.
Different from other offences, the attrition forhomicide is less in Europe than in Asia. The datain the other continents are too unstable to drawany conclusions. Remarkably, in many Europeancountries the number of persons prosecuted ishigher than the number of offenders found. Thiscould be due to the fact that where a case startsas a 'threat' or 'assault' case, the prosecutor coulddecide to prosecute for (attempted) homicideinstead.
Summary and conclusions
In this chapter the responses of the criminaljustice system on crime are described, inparticular from the moment an alleged offenderis found until the decision of a judge at a penalcourt. The main indicators are personsprosecuted and persons convicted. Both thelatest information available and trend data overthe last 10 years are used.
Due to organisational, technical and statisticalfactors the variation in the number of personsprosecuted and convicted is very high. Countrieswith the highest rate per 100,000 inhabitantshave a rate of more than 1,000 times of countrieswith the lowest rate, both for prosecutions andfor convictions. Countries in Europe show thehighest rates, in America the lowest.
The proportion of juveniles is about 7% forpersons prosecuted and 6% for personsconvicted. The highest proportions can be foundin Europe and America. The proportion offemales prosecuted is typically between 10% and15% and about 10% for convictions. Theproportion of adult females is somewhat largerthan for juveniles, and the highest proportioncan be seen in Europe. For juveniles the lowerpercentages for convictions could be explainedby the fact that a prosecutor will be moreinclined to end a case with juveniles outside thecourt. For female offenders this is probablybecause crimes committed by female offenderstend to be less serious and thus have a greaterchance to get a settlement outside the court.
Looking at trends, for both prosecutions andconvictions there is an increase in the number ofadults, mainly in the last 5 years and a decreasein the number of juveniles, also mainly in thelast 5 years. Differences between continents aresmall.
The variations in persons prosecuted andconvicted for intentional homicide are also large.Partly this is because probably some countriesincluded attempts as well in their responses.Although some countries in Europe and Asiahave very high rates per 100,000 inhabitants, themedian values for these two continents are lowerthan in America and Africa. While there is adecrease of persons prosecuted for homicide, thetrend for convictions is upward.
In every step between the commitment of acrime and the conviction of the offender(s) someattrition can and will occur. This can be due totechnical or legal reasons – e.g. the offender isnot found, or there is not enough evidence – orbecause of efficiency reasons. In many countriesthe prosecution and/or the police have thepossibility to end a proceeding, with or withoutconsequences for the alleged offender.
Looking at persons convicted as a percentage ofsuspected offenders, the median for all countriesthat answered both questions in the UN CTS is60% for adults and 35% for juveniles. For femalesthese percentages are considerably lower: 49%for adults and 22% for females. But, notsurprisingly, for homicide it is higher: 71%.Because of the scarcity of data it is hard to show
95
International Statistics on Crime and Criminal Justice
Cri
min
al Ju
stic
e Sy
stem
differences between continents. It seems that thepercentages are somewhat higher (meaning lessattrition) in Asia. Remarkably, the attrition foradult females in Asia is less than for adults total.For adults and for homicide the trends over thelast ten years are similar: more attrition in theperiod 1996 – 2001 and less attrition in theperiod 2001 – 2006. For juveniles there seems tobe more attrition for the whole period.
Looking in more detail at the attrition process(considering the number of persons prosecutedas well) and starting one step before offendersfound, i.e. crimes recorded we find the followingresults:
For every 100 crimes recorded:
45.4 adult and 4.1 juvenile allegedoffenders are found
30.4 adult and 2.2 juvenile allegedoffenders are prosecuted
18.5 adult and 1.4 juvenile offenders areconvicted
In Asia the figures are higher, particularly foradults and for offenders found, while in Americathe figures are somewhat lower. For homicide,the figures are much higher: for every 100homicides recorded 108 offenders are found, 102prosecuted and 76 convicted.
References
van Dijk J, van Kesteren J, Smit P 2007. CriminalVictimisation in International Perspective; Keyfindings from the 2004 2005 ICVS and EU ICS.Juridische Uitgevers. Reeks Onderzoek en Beleid,nr. 257. Den Haag: Boom.
Elsner B, Smit P, Zila J 2008. Police Case endingPossibilities within Criminal Investigations, inEuropean Journal of Criminal Policy andResearch, 14.2 3, 191 – 201.
Jehle J M 2000. Prosecutions in Europe: Varyingstructures, convergent trends, in EuropeanJournal of Criminal Policy and Research, 8.1, 3 –12.
Jehle J M, Smit P, Zila J 2008. The publicprosecutor as the key player: Prosecutorial caseending decisions. European Journal on CriminalPolicy and Research, 14(2–3), 161–179.
Marshall I H 1998. Operation of the CriminalJustice System 1998, in Kangaspunta K, JoutsenM, Ollus N (eds.), Crime and Criminal JusticeSystems in Europe and North America 19901994. Helsinki: HEUNI.
Mayhew P 2003. Operation of the CriminalJustice System, in Aromaa K, Leppä S, Nevala S,Ollus N (eds.), Crime and Criminal JusticeSystems in Europe and North America 19951997. Helsinki: HEUNI.
Smit P 2008. Prosecution and Courts, in AromaaK, Heiskanen M (eds.), Crime and CriminalJustice Systems in Europe and North America1995 – 2004. Helsinki: HEUNI: 94 – 117.
Tonry M, Farrington D 2005. Punishment andCrime across Space and Time. In Tonry M,Farrington D (eds.), Crime and Punishment inWestern Countries 1980 1999. Crime andJustice, vol. 33. Chicago.
Wade M 2006. The Power to Decide –Prosecutorial Control, Diversion andPunishment in European Criminal JusticeSystems Today, in Jehle J M, Wade M (eds.),Coping with Overloaded Criminal JusticeSystems, The Rise of Prosecutorial Power acrossEurope. Berlin, Heidelberg: Springer, 27 – 126.
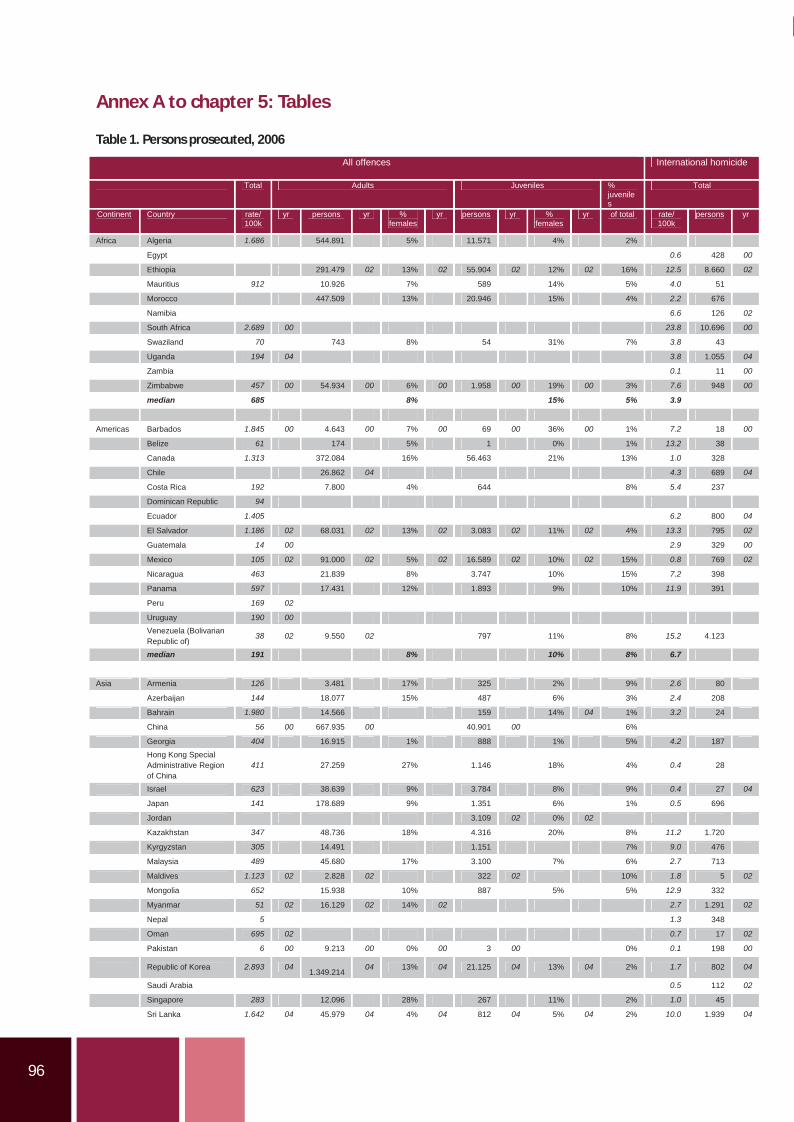
96
Annex A to hapter 5: Tables
Table 1. Persons prosecuted, 2006
All offences International homicide
Total Adults Juveniles %juveniles
Total
Continent Country rate/ 100k
yr persons yr %females
yr persons yr %females
yr of total rate/ 100k
persons yr
Africa Algeria 1.686 544.891 5% 11.571 4% 2%
Egypt 0.6 428 00
Ethiopia 291.479 02 13% 02 55.904 02 12% 02 16% 12.5 8.660 02
Mauritius 912 10.926 7% 589 14% 5% 4.0 51
Morocco 447.509 13% 20.946 15% 4% 2.2 676
Namibia 6.6 126 02
South Africa 2.689 00 23.8 10.696 00
Swaziland 70 743 8% 54 31% 7% 3.8 43
Uganda 194 04 3.8 1.055 04
Zambia 0.1 11 00
Zimbabwe 457 00 54.934 00 6% 00 1.958 00 19% 00 3% 7.6 948 00
median 685 8% 15% 5% 3.9
Americas Barbados 1.845 00 4.643 00 7% 00 69 00 36% 00 1% 7.2 18 00
Belize 61 174 5% 1 0% 1% 13.2 38
Canada 1.313 372.084 16% 56.463 21% 13% 1.0 328
Chile 26.862 04 4.3 689 04
Costa Rica 192 7.800 4% 644 8% 5.4 237
Dominican Republic 94
Ecuador 1.405 6.2 800 04
El Salvador 1.186 02 68.031 02 13% 02 3.083 02 11% 02 4% 13.3 795 02
Guatemala 14 00 2.9 329 00
Mexico 105 02 91.000 02 5% 02 16.589 02 10% 02 15% 0.8 769 02
Nicaragua 463 21.839 8% 3.747 10% 15% 7.2 398
Panama 597 17.431 12% 1.893 9% 10% 11.9 391
Peru 169 02
Uruguay 190 00
Venezuela (Bolivarian Republic of)
38 02 9.550 02 797 11% 8% 15.2 4.123
median 191 8% 10% 8% 6.7
Asia Armenia 126 3.481 17% 325 2% 9% 2.6 80
Azerbaijan 144 18.077 15% 487 6% 3% 2.4 208
Bahrain 1.980 14.566 159 14% 04 1% 3.2 24
China 56 00 667.935 00 40.901 00 6%
Georgia 404 16.915 1% 888 1% 5% 4.2 187 Hong Kong Special Administrative Region of China
411 27.259 27% 1.146 18% 4% 0.4 28
Israel 623 38.639 9% 3.784 8% 9% 0.4 27 04
Japan 141 178.689 9% 1.351 6% 1% 0.5 696
Jordan 3.109 02 0% 02
Kazakhstan 347 48.736 18% 4.316 20% 8% 11.2 1.720
Kyrgyzstan 305 14.491 1.151 7% 9.0 476
Malaysia 489 45.680 17% 3.100 7% 6% 2.7 713
Maldives 1.123 02 2.828 02 322 02 10% 1.8 5 02
Mongolia 652 15.938 10% 887 5% 5% 12.9 332
Myanmar 51 02 16.129 02 14% 02 2.7 1.291 02
Nepal 5 1.3 348
Oman 695 02 0.7 17 02
Pakistan 6 00 9.213 00 0% 00 3 00 0% 0.1 198 00
Republic of Korea 2.893 041.349.214
04 13% 04 21.125 04 13% 04 2% 1.7 802 04
Saudi Arabia 0.5 112 02
Singapore 283 12.096 28% 267 11% 2% 1.0 45
Sri Lanka 1.642 04 45.979 04 4% 04 812 04 5% 04 2% 10.0 1.939 04
c
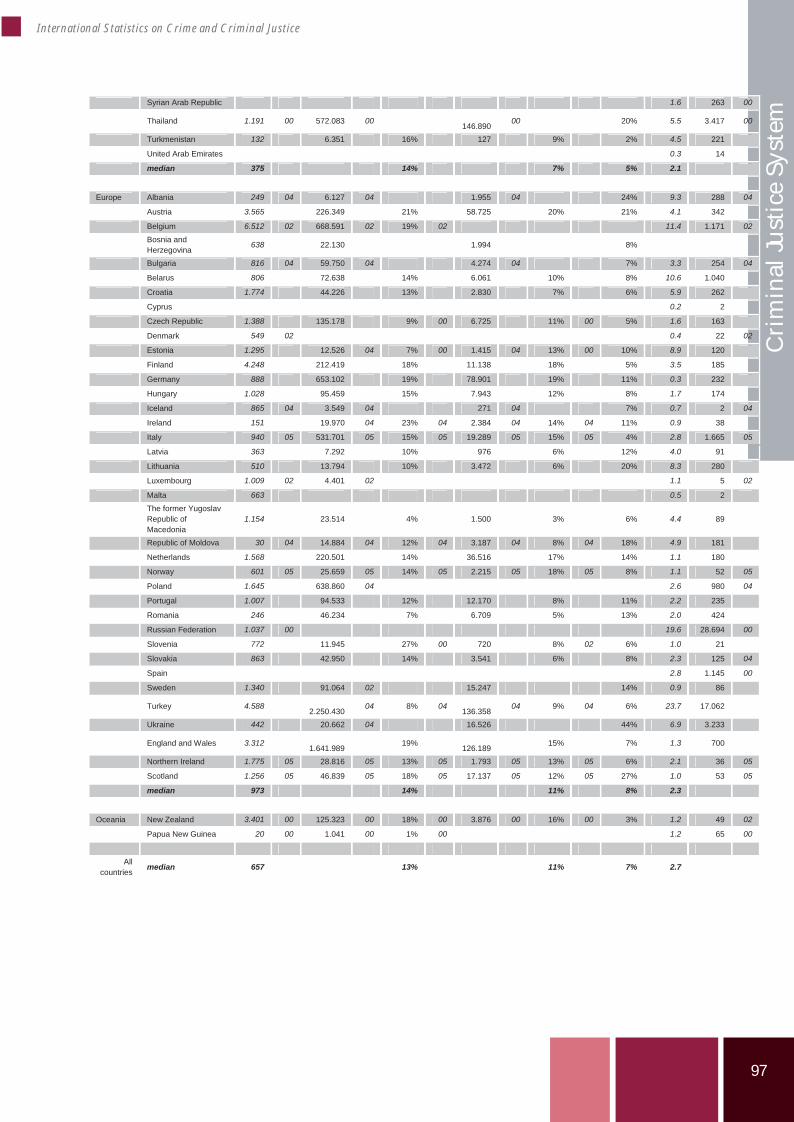
97
International Statistics on Crime and Criminal Justice
Cri
min
al Ju
stic
e Sy
stem
Syrian Arab Republic 1.6 263 00
Thailand 1.191 00 572.083 00146.890
00 20% 5.5 3.417 00
Turkmenistan 132 6.351 16% 127 9% 2% 4.5 221
United Arab Emirates 0.3 14
median 375 14% 7% 5% 2.1
Europe Albania 249 04 6.127 04 1.955 04 24% 9.3 288 04
Austria 3.565 226.349 21% 58.725 20% 21% 4.1 342
Belgium 6.512 02 668.591 02 19% 02 11.4 1.171 02
Bosnia and Herzegovina
638 22.130 1.994 8%
Bulgaria 816 04 59.750 04 4.274 04 7% 3.3 254 04
Belarus 806 72.638 14% 6.061 10% 8% 10.6 1.040
Croatia 1.774 44.226 13% 2.830 7% 6% 5.9 262
Cyprus 0.2 2
Czech Republic 1.388 135.178 9% 00 6.725 11% 00 5% 1.6 163
Denmark 549 02 0.4 22 02
Estonia 1.295 12.526 04 7% 00 1.415 04 13% 00 10% 8.9 120
Finland 4.248 212.419 18% 11.138 18% 5% 3.5 185
Germany 888 653.102 19% 78.901 19% 11% 0.3 232
Hungary 1.028 95.459 15% 7.943 12% 8% 1.7 174
Iceland 865 04 3.549 04 271 04 7% 0.7 2 04
Ireland 151 19.970 04 23% 04 2.384 04 14% 04 11% 0.9 38
Italy 940 05 531.701 05 15% 05 19.289 05 15% 05 4% 2.8 1.665 05
Latvia 363 7.292 10% 976 6% 12% 4.0 91
Lithuania 510 13.794 10% 3.472 6% 20% 8.3 280
Luxembourg 1.009 02 4.401 02 1.1 5 02
Malta 663 0.5 2 The former Yugoslav Republic of Macedonia
1.154 23.514 4% 1.500 3% 6% 4.4 89
Republic of Moldova 30 04 14.884 04 12% 04 3.187 04 8% 04 18% 4.9 181
Netherlands 1.568 220.501 14% 36.516 17% 14% 1.1 180
Norway 601 05 25.659 05 14% 05 2.215 05 18% 05 8% 1.1 52 05
Poland 1.645 638.860 04 2.6 980 04
Portugal 1.007 94.533 12% 12.170 8% 11% 2.2 235
Romania 246 46.234 7% 6.709 5% 13% 2.0 424
Russian Federation 1.037 00 19.6 28.694 00
Slovenia 772 11.945 27% 00 720 8% 02 6% 1.0 21
Slovakia 863 42.950 14% 3.541 6% 8% 2.3 125 04
Spain 2.8 1.145 00
Sweden 1.340 91.064 02 15.247 14% 0.9 86
Turkey 4.588 2.250.430
04 8% 04136.358
04 9% 04 6% 23.7 17.062
Ukraine 442 20.662 04 16.526 44% 6.9 3.233
England and Wales 3.312 1.641.989 19% 126.189 15% 7% 1.3 700
Northern Ireland 1.775 05 28.816 05 13% 05 1.793 05 13% 05 6% 2.1 36 05
Scotland 1.256 05 46.839 05 18% 05 17.137 05 12% 05 27% 1.0 53 05
median 973 14% 11% 8% 2.3
Oceania New Zealand 3.401 00 125.323 00 18% 00 3.876 00 16% 00 3% 1.2 49 02
Papua New Guinea 20 00 1.041 00 1% 00 1.2 65 00
All countries median 657 13% 11% 7% 2.7
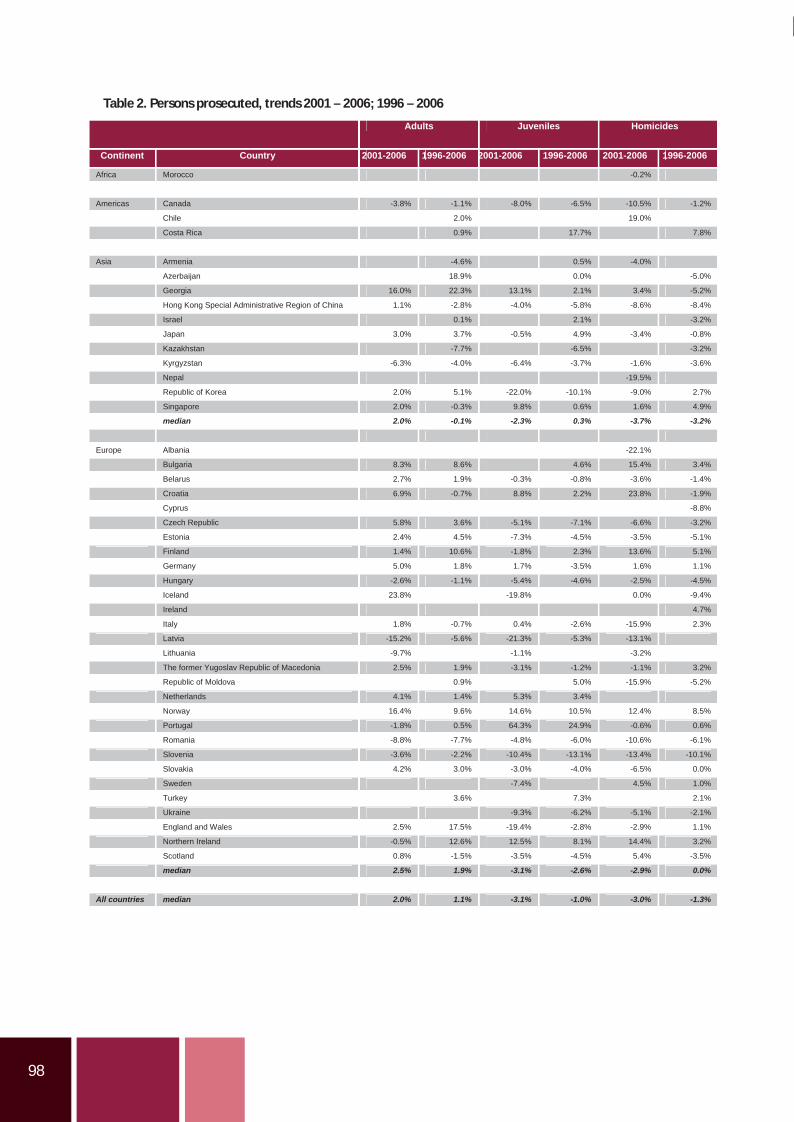
98
Table 2. Persons prosecuted, trends 2001 – 2006; 1996 – 2006
Adults Juveniles Homicides
Continent Country 2001-2006 1996-2006 2001-2006 1996-2006 2001-2006 1996-2006
Africa Morocco -0.2%
Americas Canada -3.8% -1.1% -8.0% -6.5% -10.5% -1.2%
Chile 2.0% 19.0%
Costa Rica 0.9% 17.7% 7.8%
Asia Armenia -4.6% 0.5% -4.0%
Azerbaijan 18.9% 0.0% -5.0%
Georgia 16.0% 22.3% 13.1% 2.1% 3.4% -5.2%
Hong Kong Special Administrative Region of China 1.1% -2.8% -4.0% -5.8% -8.6% -8.4%
Israel 0.1% 2.1% -3.2%
Japan 3.0% 3.7% -0.5% 4.9% -3.4% -0.8%
Kazakhstan -7.7% -6.5% -3.2%
Kyrgyzstan -6.3% -4.0% -6.4% -3.7% -1.6% -3.6%
Nepal -19.5%
Republic of Korea 2.0% 5.1% -22.0% -10.1% -9.0% 2.7%
Singapore 2.0% -0.3% 9.8% 0.6% 1.6% 4.9%
median 2.0% -0.1% -2.3% 0.3% -3.7% -3.2%
Europe Albania -22.1%
Bulgaria 8.3% 8.6% 4.6% 15.4% 3.4%
Belarus 2.7% 1.9% -0.3% -0.8% -3.6% -1.4%
Croatia 6.9% -0.7% 8.8% 2.2% 23.8% -1.9%
Cyprus -8.8%
Czech Republic 5.8% 3.6% -5.1% -7.1% -6.6% -3.2%
Estonia 2.4% 4.5% -7.3% -4.5% -3.5% -5.1%
Finland 1.4% 10.6% -1.8% 2.3% 13.6% 5.1%
Germany 5.0% 1.8% 1.7% -3.5% 1.6% 1.1%
Hungary -2.6% -1.1% -5.4% -4.6% -2.5% -4.5%
Iceland 23.8% -19.8% 0.0% -9.4%
Ireland 4.7%
Italy 1.8% -0.7% 0.4% -2.6% -15.9% 2.3%
Latvia -15.2% -5.6% -21.3% -5.3% -13.1%
Lithuania -9.7% -1.1% -3.2%
The former Yugoslav Republic of Macedonia 2.5% 1.9% -3.1% -1.2% -1.1% 3.2%
Republic of Moldova 0.9% 5.0% -15.9% -5.2%
Netherlands 4.1% 1.4% 5.3% 3.4%
Norway 16.4% 9.6% 14.6% 10.5% 12.4% 8.5%
Portugal -1.8% 0.5% 64.3% 24.9% -0.6% 0.6%
Romania -8.8% -7.7% -4.8% -6.0% -10.6% -6.1%
Slovenia -3.6% -2.2% -10.4% -13.1% -13.4% -10.1%
Slovakia 4.2% 3.0% -3.0% -4.0% -6.5% 0.0%
Sweden -7.4% 4.5% 1.0%
Turkey 3.6% 7.3% 2.1%
Ukraine -9.3% -6.2% -5.1% -2.1%
England and Wales 2.5% 17.5% -19.4% -2.8% -2.9% 1.1%
Northern Ireland -0.5% 12.6% 12.5% 8.1% 14.4% 3.2%
Scotland 0.8% -1.5% -3.5% -4.5% 5.4% -3.5%
median 2.5% 1.9% -3.1% -2.6% -2.9% 0.0%
All countries median 2.0% 1.1% -3.1% -1.0% -3.0% -1.3%

99
International Statistics on Crime and Criminal Justice
Cri
min
al Ju
stic
e Sy
stem
Table 3. Persons convicted, 2006
All offences International homicide
Total Adults Juveniles %juveniles
Total
Continent Country rate/ 100k
yr persons yr %females
yr persons yr %females
yr of total
rate/ 100k
persons yr
Africa Algeria 1.3 406 04
Egypt 7.105 5.548.300 12% 36.758 3% 00 1% 4.0 3.123
Ethiopia 4 02 0.4 310 02
Mauritius 10.762 135.557 1% 263 11% 0% 0.8 10
Morocco 26.539 04 3% 04 364 04 5% 04 1%
Swaziland 1.291 00 0.9 10 00
Uganda 68 04 0.0 6 04
Zambia 19 00 1.309 00 1% 00 1 00 0% 0.9 98 00
Zimbabwe 277 04 53.782 04 12% 04 1.710 04 22% 04 3% 1.0 130 00
Median 277 3% 1% 0.9
Americas Argentina 68 02
Barbados 15 00 53% 00 8.3 21 00
Bolivia 20 1.735 13% 180 13% 9% 2.3 198 02
Canada 849 242.988 14% 34.065 19% 12% 0.5 161
Chile 318 04 15.494 04 10% 04 2.845 04 6% 04 16% 2.7 432 04
Colombia 0 04 38 04 16% 04
Costa Rica 82 3.586 10% 236 2% 00 6% 2.9 128 Dominican Republic
38 3.416 17% 213 17% 6% 5.0 485
Ecuador 18 04 2.345 04 2.5 325 04
El Salvador 39 02 2.059 02 5% 02 270 02 7% 02 12% 7.2 429 02
Guatemala 312 00 34.115 00 14% 00 26.3 2.954 00
Mexico 135 143.214 9% 3.6 3.846
Panama 141 4.130 8% 499 6% 11% 2.6 85
Uruguay 147 00 7.704 00 8% 00 7.3 243 00
Venezuela (Bolivarian Republic of)
18 00 4.294 00 4% 00 6.4 1.555 00
Median 75 10% 10% 11% 3.6
Asia Afghanistan 12 02 738 02 1% 02 80 02 10% 1.0 215 02
Armenia 106 3.070 6% 168 1% 5% 1.1 34
Azerbaijan 159 04 13.054 04 10% 04 299 04 3% 04 2% 3.7 311 04
Bahrain 302 04 0.1 1 03
China 51 00 598.106 00
Georgia 383 15.909 6% 1.002 2% 6% 7.1 311 Hong Kong Special Administrative Region of China
341 22.763 28% 843 18% 4% 0.2 16
Indonesia 1.088.678
00 3% 00 29.106 00 3% 0.9 1.912 00
Israel 578 35.835 9% 3.563 8% 9% 0.4 26 04
Japan 68 86.218 164 0% 0.5 696
Jordan 399 02
Kazakhstan 213 30.176 11% 2.406 8% 7% 8.4 1.287
Kyrgyzstan 255 12.606 12% 874 7% 6% 7.6 403
Malaysia 321 64.687 11% 2.908 6% 4% 0.6 159
Mongolia 302 7.065 9% 727 5% 9% 11.0 284
Myanmar 33 02 15.848 02 15% 02 1.444 02 20% 02 8% 1.4 673 02
Nepal 11 2.908 6% 23 4% 1% 0.9 261 Occupied Palestinian Territory
52 1.530 0% 498 3% 25% 0.9 35
Philippines 6 5.240 23% 32 0% 1% 0.1 72
Qatar 423 00 3.387 00 1% 00 107 00 3%Republic of Korea
451 04 233.253 04 13% 04 3.817 04 8% 04 2%
Saudi Arabia 273 02 59.875 02
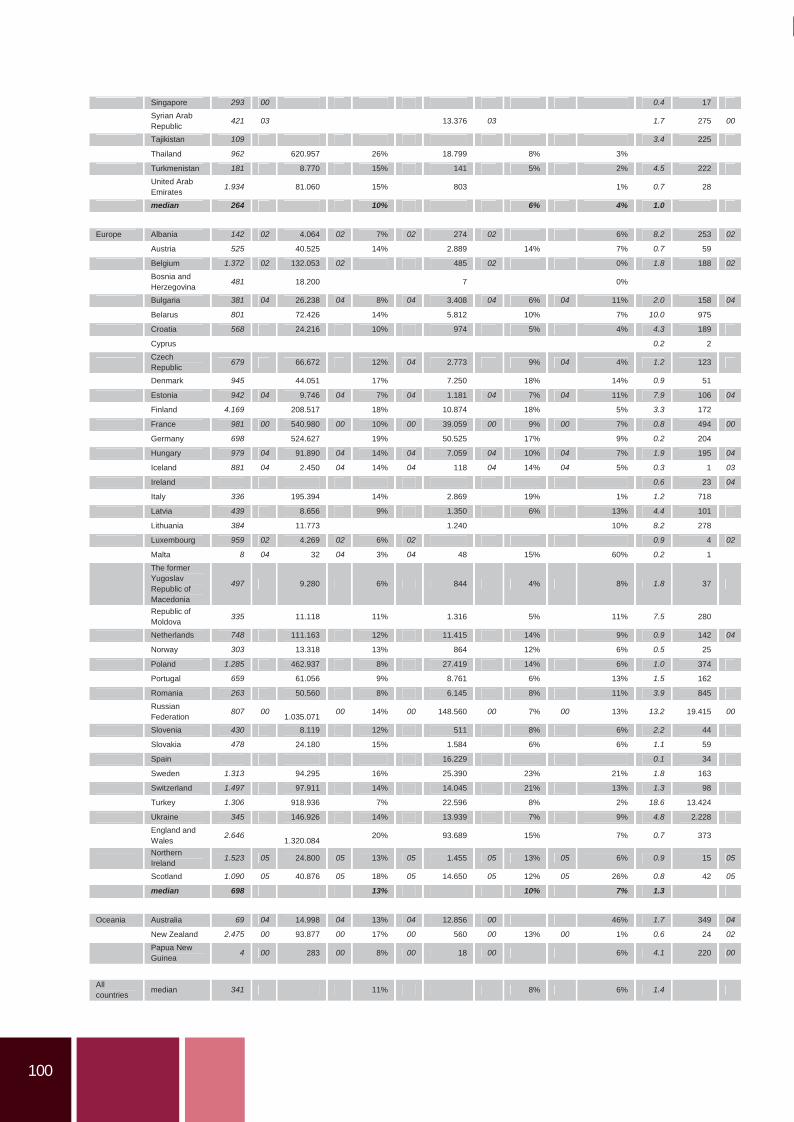
100
Singapore 293 00 0.4 17 Syrian Arab Republic
421 03 13.376 03 1.7 275 00
Tajikistan 109 3.4 225
Thailand 962 620.957 26% 18.799 8% 3%
Turkmenistan 181 8.770 15% 141 5% 2% 4.5 222 United Arab Emirates
1.934 81.060 15% 803 1% 0.7 28
median 264 10% 6% 4% 1.0
Europe Albania 142 02 4.064 02 7% 02 274 02 6% 8.2 253 02
Austria 525 40.525 14% 2.889 14% 7% 0.7 59
Belgium 1.372 02 132.053 02 485 02 0% 1.8 188 02
Bosnia and Herzegovina
481 18.200 7 0%
Bulgaria 381 04 26.238 04 8% 04 3.408 04 6% 04 11% 2.0 158 04
Belarus 801 72.426 14% 5.812 10% 7% 10.0 975
Croatia 568 24.216 10% 974 5% 4% 4.3 189
Cyprus 0.2 2 Czech Republic
679 66.672 12% 04 2.773 9% 04 4% 1.2 123
Denmark 945 44.051 17% 7.250 18% 14% 0.9 51
Estonia 942 04 9.746 04 7% 04 1.181 04 7% 04 11% 7.9 106 04
Finland 4.169 208.517 18% 10.874 18% 5% 3.3 172
France 981 00 540.980 00 10% 00 39.059 00 9% 00 7% 0.8 494 00
Germany 698 524.627 19% 50.525 17% 9% 0.2 204
Hungary 979 04 91.890 04 14% 04 7.059 04 10% 04 7% 1.9 195 04
Iceland 881 04 2.450 04 14% 04 118 04 14% 04 5% 0.3 1 03
Ireland 0.6 23 04
Italy 336 195.394 14% 2.869 19% 1% 1.2 718
Latvia 439 8.656 9% 1.350 6% 13% 4.4 101
Lithuania 384 11.773 1.240 10% 8.2 278
Luxembourg 959 02 4.269 02 6% 02 0.9 4 02
Malta 8 04 32 04 3% 04 48 15% 60% 0.2 1 The former Yugoslav Republic of Macedonia
497 9.280 6% 844 4% 8% 1.8 37
Republic of Moldova
335 11.118 11% 1.316 5% 11% 7.5 280
Netherlands 748 111.163 12% 11.415 14% 9% 0.9 142 04
Norway 303 13.318 13% 864 12% 6% 0.5 25
Poland 1.285 462.937 8% 27.419 14% 6% 1.0 374
Portugal 659 61.056 9% 8.761 6% 13% 1.5 162
Romania 263 50.560 8% 6.145 8% 11% 3.9 845 RussianFederation
807 00 1.035.071
00 14% 00 148.560 00 7% 00 13% 13.2 19.415 00
Slovenia 430 8.119 12% 511 8% 6% 2.2 44
Slovakia 478 24.180 15% 1.584 6% 6% 1.1 59
Spain 16.229 0.1 34
Sweden 1.313 94.295 16% 25.390 23% 21% 1.8 163
Switzerland 1.497 97.911 14% 14.045 21% 13% 1.3 98
Turkey 1.306 918.936 7% 22.596 8% 2% 18.6 13.424
Ukraine 345 146.926 14% 13.939 7% 9% 4.8 2.228 England and Wales
2.646 1.320.084
20% 93.689 15% 7% 0.7 373
Northern Ireland
1.523 05 24.800 05 13% 05 1.455 05 13% 05 6% 0.9 15 05
Scotland 1.090 05 40.876 05 18% 05 14.650 05 12% 05 26% 0.8 42 05
median 698 13% 10% 7% 1.3
Oceania Australia 69 04 14.998 04 13% 04 12.856 00 46% 1.7 349 04
New Zealand 2.475 00 93.877 00 17% 00 560 00 13% 00 1% 0.6 24 02
Papua New Guinea
4 00 283 00 8% 00 18 00 6% 4.1 220 00
All countries median 341 11% 8% 6% 1.4
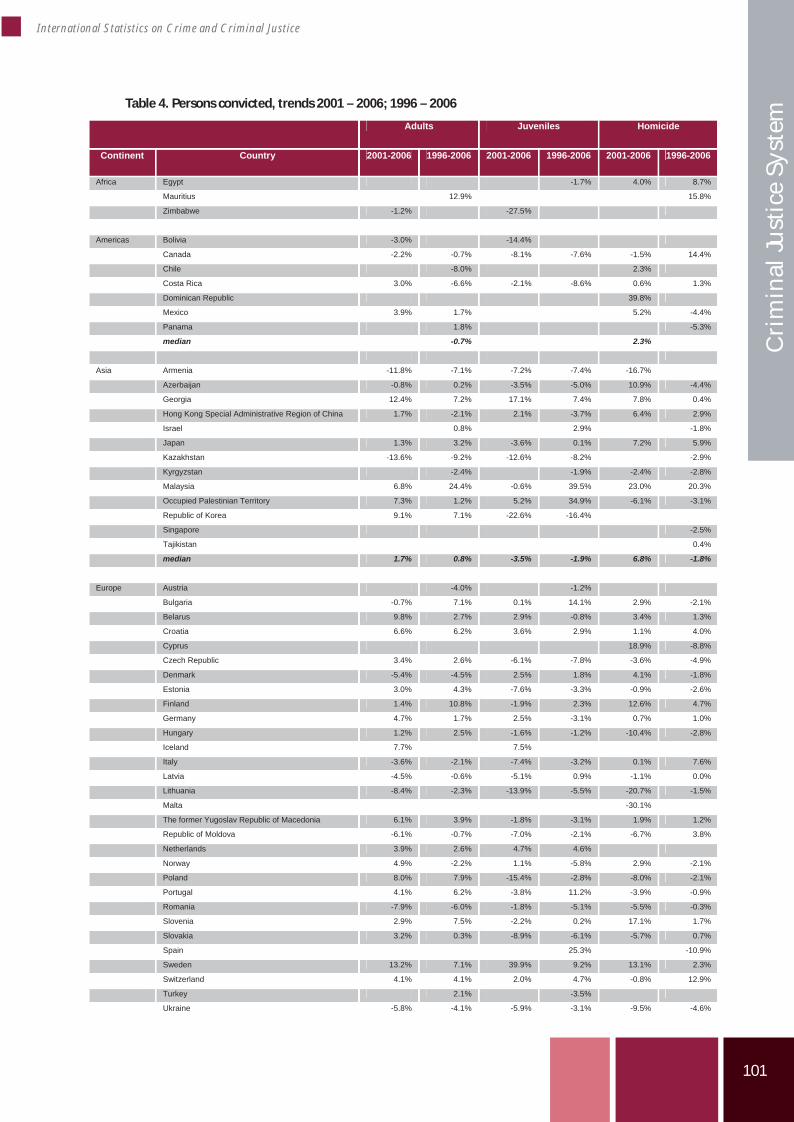
101
International Statistics on Crime and Criminal Justice
Cri
min
al Ju
stic
e Sy
stem
Table 4. Persons convicted, trends 2001 – 2006; 1996 – 2006
Adults Juveniles Homicide
Continent Country 2001-2006 1996-2006 2001-2006 1996-2006 2001-2006 1996-2006
Africa Egypt -1.7% 4.0% 8.7%
Mauritius 12.9% 15.8%
Zimbabwe -1.2% -27.5%
Americas Bolivia -3.0% -14.4%
Canada -2.2% -0.7% -8.1% -7.6% -1.5% 14.4%
Chile -8.0% 2.3%
Costa Rica 3.0% -6.6% -2.1% -8.6% 0.6% 1.3%
Dominican Republic 39.8%
Mexico 3.9% 1.7% 5.2% -4.4%
Panama 1.8% -5.3%
median -0.7% 2.3%
Asia Armenia -11.8% -7.1% -7.2% -7.4% -16.7%
Azerbaijan -0.8% 0.2% -3.5% -5.0% 10.9% -4.4%
Georgia 12.4% 7.2% 17.1% 7.4% 7.8% 0.4%
Hong Kong Special Administrative Region of China 1.7% -2.1% 2.1% -3.7% 6.4% 2.9%
Israel 0.8% 2.9% -1.8%
Japan 1.3% 3.2% -3.6% 0.1% 7.2% 5.9%
Kazakhstan -13.6% -9.2% -12.6% -8.2% -2.9%
Kyrgyzstan -2.4% -1.9% -2.4% -2.8%
Malaysia 6.8% 24.4% -0.6% 39.5% 23.0% 20.3%
Occupied Palestinian Territory 7.3% 1.2% 5.2% 34.9% -6.1% -3.1%
Republic of Korea 9.1% 7.1% -22.6% -16.4%
Singapore -2.5%
Tajikistan 0.4%
median 1.7% 0.8% -3.5% -1.9% 6.8% -1.8%
Europe Austria -4.0% -1.2%
Bulgaria -0.7% 7.1% 0.1% 14.1% 2.9% -2.1%
Belarus 9.8% 2.7% 2.9% -0.8% 3.4% 1.3%
Croatia 6.6% 6.2% 3.6% 2.9% 1.1% 4.0%
Cyprus 18.9% -8.8%
Czech Republic 3.4% 2.6% -6.1% -7.8% -3.6% -4.9%
Denmark -5.4% -4.5% 2.5% 1.8% 4.1% -1.8%
Estonia 3.0% 4.3% -7.6% -3.3% -0.9% -2.6%
Finland 1.4% 10.8% -1.9% 2.3% 12.6% 4.7%
Germany 4.7% 1.7% 2.5% -3.1% 0.7% 1.0%
Hungary 1.2% 2.5% -1.6% -1.2% -10.4% -2.8%
Iceland 7.7% 7.5%
Italy -3.6% -2.1% -7.4% -3.2% 0.1% 7.6%
Latvia -4.5% -0.6% -5.1% 0.9% -1.1% 0.0%
Lithuania -8.4% -2.3% -13.9% -5.5% -20.7% -1.5%
Malta -30.1%
The former Yugoslav Republic of Macedonia 6.1% 3.9% -1.8% -3.1% 1.9% 1.2%
Republic of Moldova -6.1% -0.7% -7.0% -2.1% -6.7% 3.8%
Netherlands 3.9% 2.6% 4.7% 4.6%
Norway 4.9% -2.2% 1.1% -5.8% 2.9% -2.1%
Poland 8.0% 7.9% -15.4% -2.8% -8.0% -2.1%
Portugal 4.1% 6.2% -3.8% 11.2% -3.9% -0.9%
Romania -7.9% -6.0% -1.8% -5.1% -5.5% -0.3%
Slovenia 2.9% 7.5% -2.2% 0.2% 17.1% 1.7%
Slovakia 3.2% 0.3% -8.9% -6.1% -5.7% 0.7%
Spain 25.3% -10.9%
Sweden 13.2% 7.1% 39.9% 9.2% 13.1% 2.3%
Switzerland 4.1% 4.1% 2.0% 4.7% -0.8% 12.9%
Turkey 2.1% -3.5%
Ukraine -5.8% -4.1% -5.9% -3.1% -9.5% -4.6%
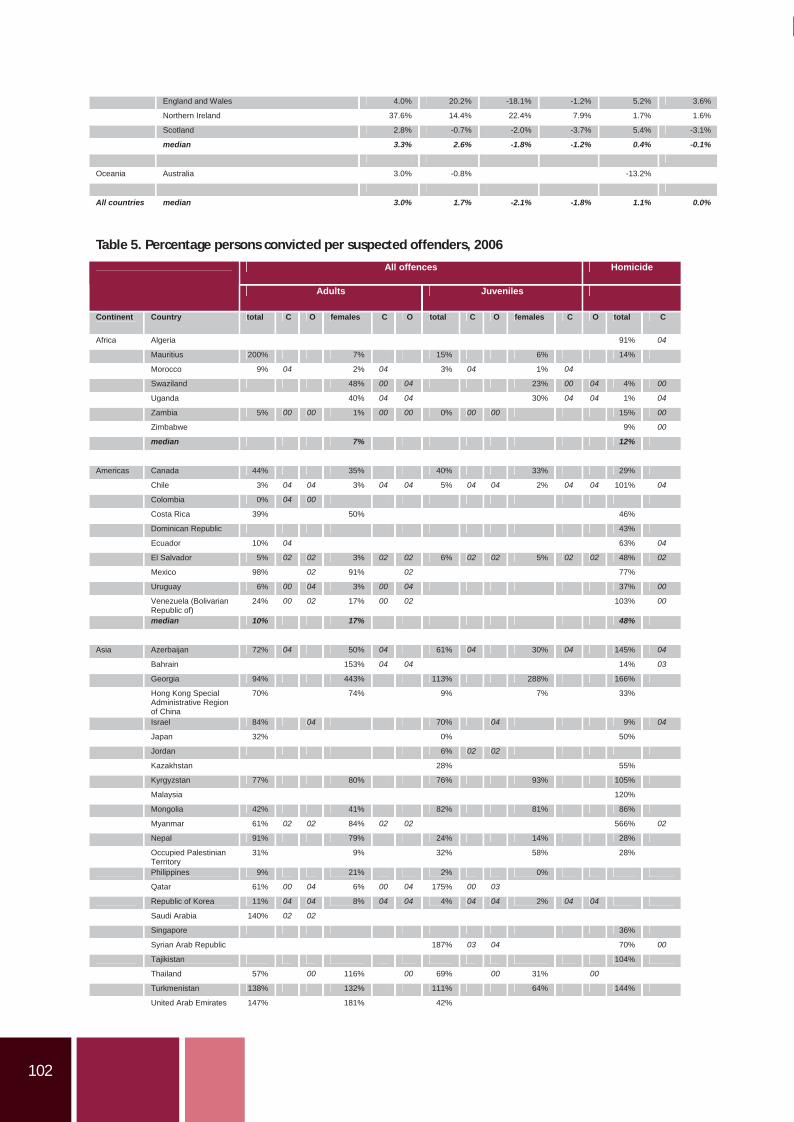
102
England and Wales 4.0% 20.2% -18.1% -1.2% 5.2% 3.6%
Northern Ireland 37.6% 14.4% 22.4% 7.9% 1.7% 1.6%
Scotland 2.8% -0.7% -2.0% -3.7% 5.4% -3.1%
median 3.3% 2.6% -1.8% -1.2% 0.4% -0.1%
Oceania Australia 3.0% -0.8% -13.2%
All countries median 3.0% 1.7% -2.1% -1.8% 1.1% 0.0%
Table 5. Percentage persons convicted per suspected offenders, 2006
All offences Homicide
Adults Juveniles
Continent Country total C O females C O total C O females C O total C
Africa Algeria 91% 04
Mauritius 200% 7% 15% 6% 14%
Morocco 9% 04 2% 04 3% 04 1% 04
Swaziland 48% 00 04 23% 00 04 4% 00
Uganda 40% 04 04 30% 04 04 1% 04
Zambia 5% 00 00 1% 00 00 0% 00 00 15% 00
Zimbabwe 9% 00
median 7% 12%
Americas Canada 44% 35% 40% 33% 29%
Chile 3% 04 04 3% 04 04 5% 04 04 2% 04 04 101% 04
Colombia 0% 04 00
Costa Rica 39% 50% 46%
Dominican Republic 43%
Ecuador 10% 04 63% 04
El Salvador 5% 02 02 3% 02 02 6% 02 02 5% 02 02 48% 02
Mexico 98% 02 91% 02 77%
Uruguay 6% 00 04 3% 00 04 37% 00
Venezuela (Bolivarian Republic of)
24% 00 02 17% 00 02 103% 00
median 10% 17% 48%
Asia Azerbaijan 72% 04 50% 04 61% 04 30% 04 145% 04
Bahrain 153% 04 04 14% 03
Georgia 94% 443% 113% 288% 166%
Hong Kong Special Administrative Region of China
70% 74% 9% 7% 33%
Israel 84% 04 70% 04 9% 04
Japan 32% 0% 50%
Jordan 6% 02 02
Kazakhstan 28% 55%
Kyrgyzstan 77% 80% 76% 93% 105%
Malaysia 120%
Mongolia 42% 41% 82% 81% 86%
Myanmar 61% 02 02 84% 02 02 566% 02
Nepal 91% 79% 24% 14% 28%
Occupied Palestinian Territory
31% 9% 32% 58% 28%
Philippines 9% 21% 2% 0%
Qatar 61% 00 04 6% 00 04 175% 00 03
Republic of Korea 11% 04 04 8% 04 04 4% 04 04 2% 04 04
Saudi Arabia 140% 02 02
Singapore 36%
Syrian Arab Republic 187% 03 04 70% 00
Tajikistan 104%
Thailand 57% 00 116% 00 69% 00 31% 00
Turkmenistan 138% 132% 111% 64% 144%
United Arab Emirates 147% 181% 42%
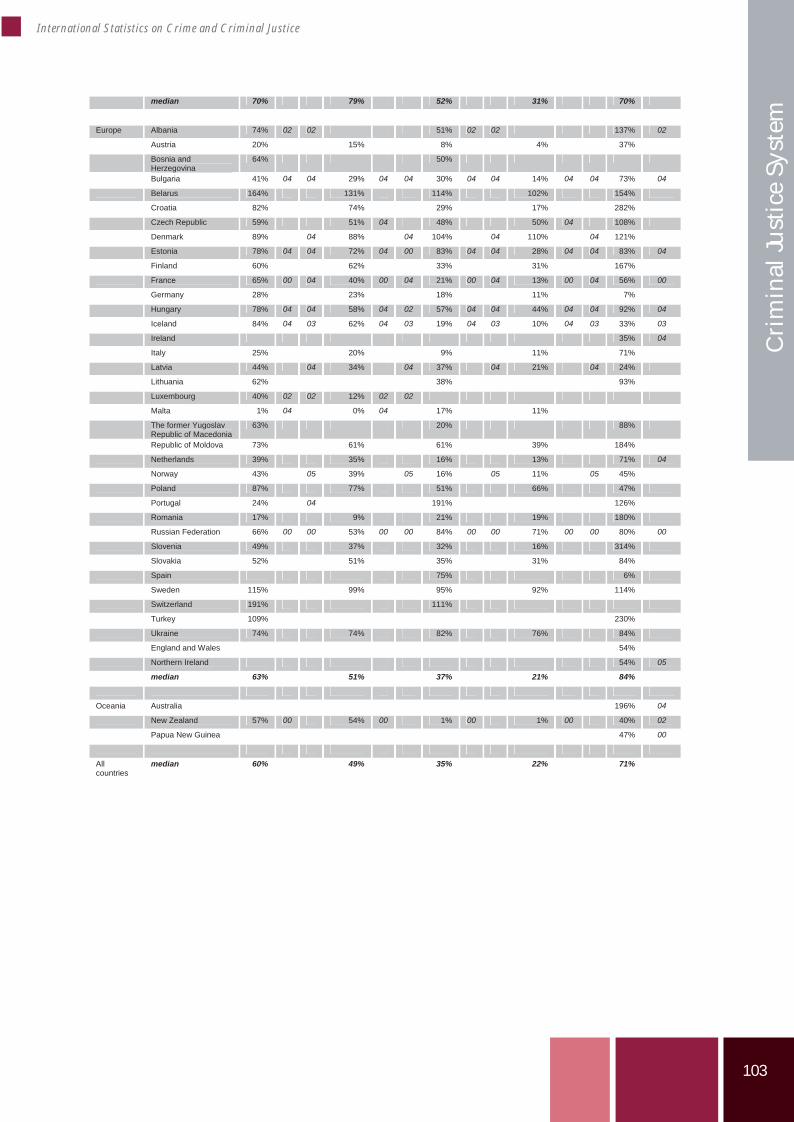
103
International Statistics on Crime and Criminal Justice
Cri
min
al Ju
stic
e Sy
stem
median 70% 79% 52% 31% 70%
Europe Albania 74% 02 02 51% 02 02 137% 02
Austria 20% 15% 8% 4% 37%
Bosnia and Herzegovina
64% 50%
Bulgaria 41% 04 04 29% 04 04 30% 04 04 14% 04 04 73% 04
Belarus 164% 131% 114% 102% 154%
Croatia 82% 74% 29% 17% 282%
Czech Republic 59% 51% 04 48% 50% 04 108%
Denmark 89% 04 88% 04 104% 04 110% 04 121%
Estonia 78% 04 04 72% 04 00 83% 04 04 28% 04 04 83% 04
Finland 60% 62% 33% 31% 167%
France 65% 00 04 40% 00 04 21% 00 04 13% 00 04 56% 00
Germany 28% 23% 18% 11% 7%
Hungary 78% 04 04 58% 04 02 57% 04 04 44% 04 04 92% 04
Iceland 84% 04 03 62% 04 03 19% 04 03 10% 04 03 33% 03
Ireland 35% 04
Italy 25% 20% 9% 11% 71%
Latvia 44% 04 34% 04 37% 04 21% 04 24%
Lithuania 62% 38% 93%
Luxembourg 40% 02 02 12% 02 02
Malta 1% 04 0% 04 17% 11%
The former Yugoslav Republic of Macedonia
63% 20% 88%
Republic of Moldova 73% 61% 61% 39% 184%
Netherlands 39% 35% 16% 13% 71% 04
Norway 43% 05 39% 05 16% 05 11% 05 45%
Poland 87% 77% 51% 66% 47%
Portugal 24% 04 191% 126%
Romania 17% 9% 21% 19% 180%
Russian Federation 66% 00 00 53% 00 00 84% 00 00 71% 00 00 80% 00
Slovenia 49% 37% 32% 16% 314%
Slovakia 52% 51% 35% 31% 84%
Spain 75% 6%
Sweden 115% 99% 95% 92% 114%
Switzerland 191% 111%
Turkey 109% 230%
Ukraine 74% 74% 82% 76% 84%
England and Wales 54%
Northern Ireland 54% 05
median 63% 51% 37% 21% 84%
Oceania Australia 196% 04
New Zealand 57% 00 54% 00 1% 00 1% 00 40% 02
Papua New Guinea 47% 00
All countries
median 60% 49% 35% 22% 71%
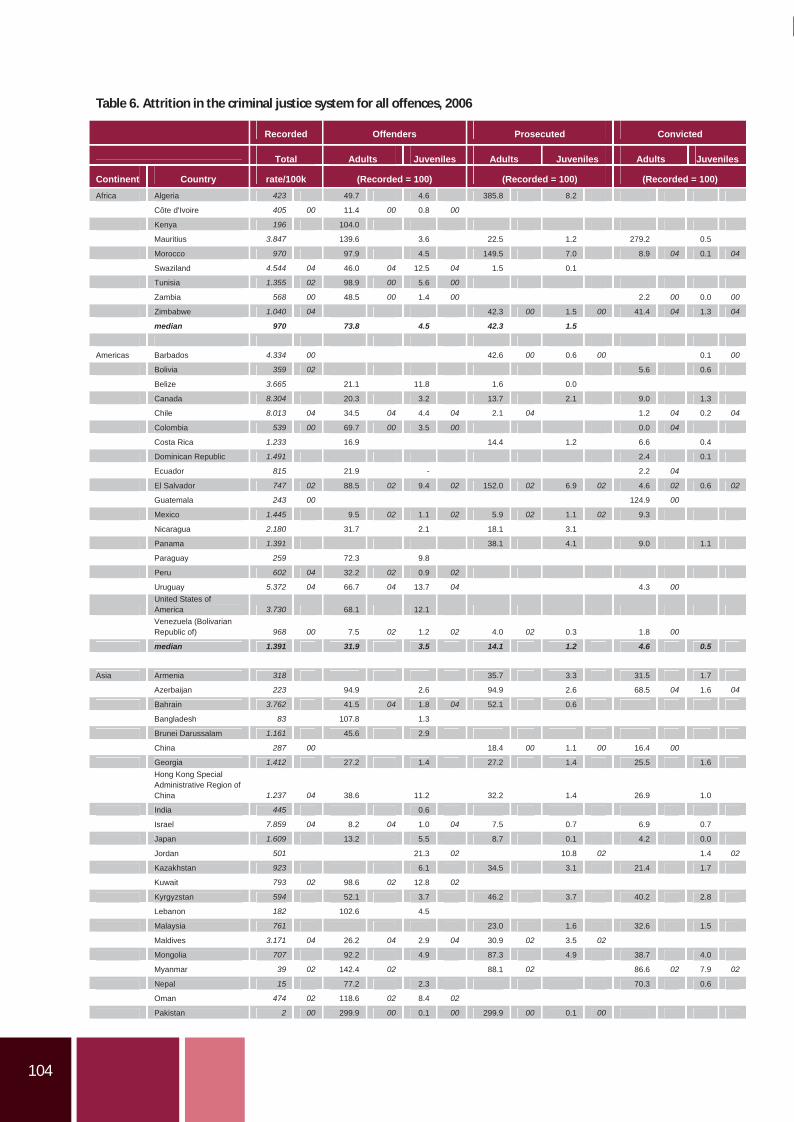
104
Table 6. Attrition in the criminal justice system for all offences, 2006
Recorded Offenders Prosecuted Convicted
Total Adults Juveniles Adults Juveniles Adults Juveniles
Continent Country rate/100k (Recorded = 100) (Recorded = 100) (Recorded = 100) Africa Algeria 423 49.7 4.6 385.8 8.2
Côte d'Ivoire 405 00 11.4 00 0.8 00
Kenya 196 104.0
Mauritius 3.847 139.6 3.6 22.5 1.2 279.2 0.5
Morocco 970 97.9 4.5 149.5 7.0 8.9 04 0.1 04
Swaziland 4.544 04 46.0 04 12.5 04 1.5 0.1
Tunisia 1.355 02 98.9 00 5.6 00
Zambia 568 00 48.5 00 1.4 00 2.2 00 0.0 00
Zimbabwe 1.040 04 42.3 00 1.5 00 41.4 04 1.3 04
median 970 73.8 4.5 42.3 1.5
Americas Barbados 4.334 00 42.6 00 0.6 00 0.1 00
Bolivia 359 02 5.6 0.6
Belize 3.665 21.1 11.8 1.6 0.0
Canada 8.304 20.3 3.2 13.7 2.1 9.0 1.3
Chile 8.013 04 34.5 04 4.4 04 2.1 04 1.2 04 0.2 04
Colombia 539 00 69.7 00 3.5 00 0.0 04
Costa Rica 1.233 16.9 14.4 1.2 6.6 0.4
Dominican Republic 1.491 2.4 0.1
Ecuador 815 21.9 - 2.2 04
El Salvador 747 02 88.5 02 9.4 02 152.0 02 6.9 02 4.6 02 0.6 02
Guatemala 243 00 124.9 00
Mexico 1.445 9.5 02 1.1 02 5.9 02 1.1 02 9.3
Nicaragua 2.180 31.7 2.1 18.1 3.1
Panama 1.391 38.1 4.1 9.0 1.1
Paraguay 259 72.3 9.8
Peru 602 04 32.2 02 0.9 02
Uruguay 5.372 04 66.7 04 13.7 04 4.3 00United States of America 3.730 68.1 12.1 Venezuela (Bolivarian Republic of) 968 00 7.5 02 1.2 02 4.0 02 0.3 1.8 00
median 1.391 31.9 3.5 14.1 1.2 4.6 0.5
Asia Armenia 318 35.7 3.3 31.5 1.7
Azerbaijan 223 94.9 2.6 94.9 2.6 68.5 04 1.6 04
Bahrain 3.762 41.5 04 1.8 04 52.1 0.6
Bangladesh 83 107.8 1.3
Brunei Darussalam 1.161 45.6 2.9
China 287 00 18.4 00 1.1 00 16.4 00
Georgia 1.412 27.2 1.4 27.2 1.4 25.5 1.6 Hong Kong Special Administrative Region of China 1.237 04 38.6 11.2 32.2 1.4 26.9 1.0
India 445 0.6
Israel 7.859 04 8.2 04 1.0 04 7.5 0.7 6.9 0.7
Japan 1.609 13.2 5.5 8.7 0.1 4.2 0.0
Jordan 501 21.3 02 10.8 02 1.4 02
Kazakhstan 923 6.1 34.5 3.1 21.4 1.7
Kuwait 793 02 98.6 02 12.8 02
Kyrgyzstan 594 52.1 3.7 46.2 3.7 40.2 2.8
Lebanon 182 102.6 4.5
Malaysia 761 23.0 1.6 32.6 1.5
Maldives 3.171 04 26.2 04 2.9 04 30.9 02 3.5 02
Mongolia 707 92.2 4.9 87.3 4.9 38.7 4.0
Myanmar 39 02 142.4 02 88.1 02 86.6 02 7.9 02
Nepal 15 77.2 2.3 70.3 0.6
Oman 474 02 118.6 02 8.4 02
Pakistan 2 00 299.9 00 0.1 00 299.9 00 0.1 00
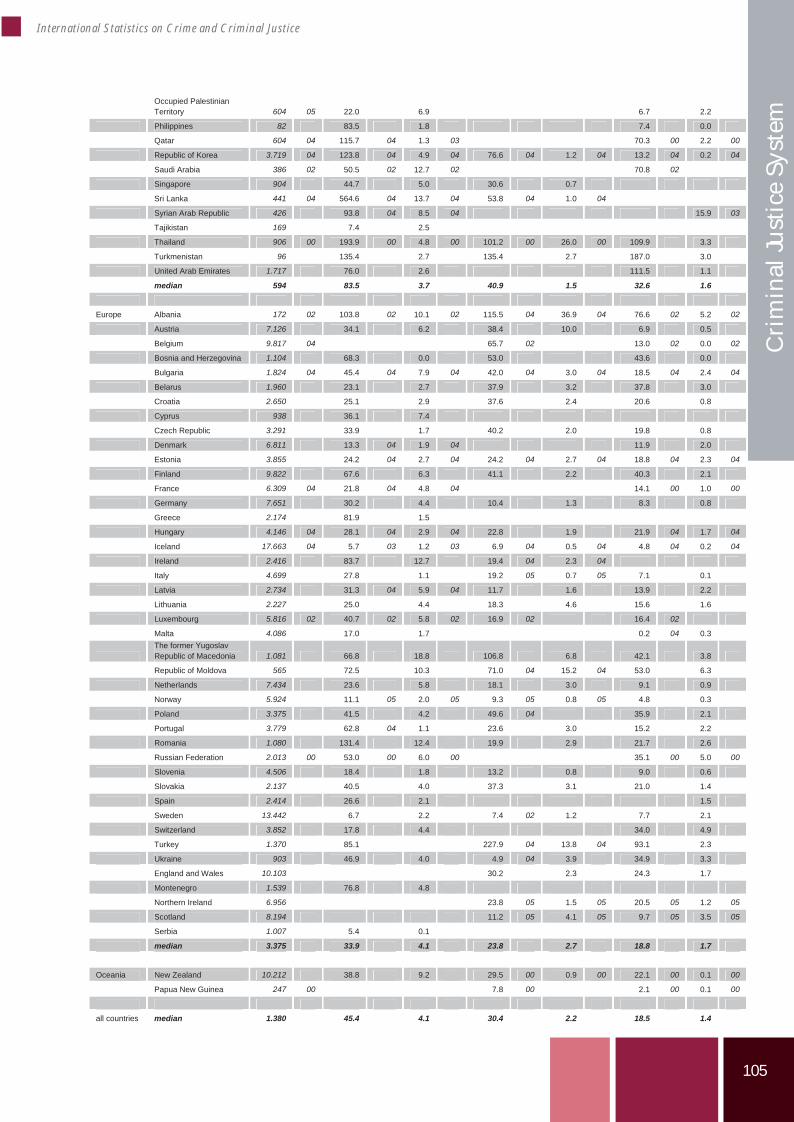
105
International Statistics on Crime and Criminal Justice
Cri
min
al Ju
stic
e Sy
stem
Occupied Palestinian Territory 604 05 22.0 6.9 6.7 2.2
Philippines 82 83.5 1.8 7.4 0.0
Qatar 604 04 115.7 04 1.3 03 70.3 00 2.2 00
Republic of Korea 3.719 04 123.8 04 4.9 04 76.6 04 1.2 04 13.2 04 0.2 04
Saudi Arabia 386 02 50.5 02 12.7 02 70.8 02
Singapore 904 44.7 5.0 30.6 0.7
Sri Lanka 441 04 564.6 04 13.7 04 53.8 04 1.0 04
Syrian Arab Republic 426 93.8 04 8.5 04 15.9 03
Tajikistan 169 7.4 2.5
Thailand 906 00 193.9 00 4.8 00 101.2 00 26.0 00 109.9 3.3
Turkmenistan 96 135.4 2.7 135.4 2.7 187.0 3.0
United Arab Emirates 1.717 76.0 2.6 111.5 1.1
median 594 83.5 3.7 40.9 1.5 32.6 1.6
Europe Albania 172 02 103.8 02 10.1 02 115.5 04 36.9 04 76.6 02 5.2 02
Austria 7.126 34.1 6.2 38.4 10.0 6.9 0.5
Belgium 9.817 04 65.7 02 13.0 02 0.0 02
Bosnia and Herzegovina 1.104 68.3 0.0 53.0 43.6 0.0
Bulgaria 1.824 04 45.4 04 7.9 04 42.0 04 3.0 04 18.5 04 2.4 04
Belarus 1.960 23.1 2.7 37.9 3.2 37.8 3.0
Croatia 2.650 25.1 2.9 37.6 2.4 20.6 0.8
Cyprus 938 36.1 7.4
Czech Republic 3.291 33.9 1.7 40.2 2.0 19.8 0.8
Denmark 6.811 13.3 04 1.9 04 11.9 2.0
Estonia 3.855 24.2 04 2.7 04 24.2 04 2.7 04 18.8 04 2.3 04
Finland 9.822 67.6 6.3 41.1 2.2 40.3 2.1
France 6.309 04 21.8 04 4.8 04 14.1 00 1.0 00
Germany 7.651 30.2 4.4 10.4 1.3 8.3 0.8
Greece 2.174 81.9 1.5
Hungary 4.146 04 28.1 04 2.9 04 22.8 1.9 21.9 04 1.7 04
Iceland 17.663 04 5.7 03 1.2 03 6.9 04 0.5 04 4.8 04 0.2 04
Ireland 2.416 83.7 12.7 19.4 04 2.3 04
Italy 4.699 27.8 1.1 19.2 05 0.7 05 7.1 0.1
Latvia 2.734 31.3 04 5.9 04 11.7 1.6 13.9 2.2
Lithuania 2.227 25.0 4.4 18.3 4.6 15.6 1.6
Luxembourg 5.816 02 40.7 02 5.8 02 16.9 02 16.4 02
Malta 4.086 17.0 1.7 0.2 04 0.3 The former Yugoslav Republic of Macedonia 1.081 66.8 18.8 106.8 6.8 42.1 3.8
Republic of Moldova 565 72.5 10.3 71.0 04 15.2 04 53.0 6.3
Netherlands 7.434 23.6 5.8 18.1 3.0 9.1 0.9
Norway 5.924 11.1 05 2.0 05 9.3 05 0.8 05 4.8 0.3
Poland 3.375 41.5 4.2 49.6 04 35.9 2.1
Portugal 3.779 62.8 04 1.1 23.6 3.0 15.2 2.2
Romania 1.080 131.4 12.4 19.9 2.9 21.7 2.6
Russian Federation 2.013 00 53.0 00 6.0 00 35.1 00 5.0 00
Slovenia 4.506 18.4 1.8 13.2 0.8 9.0 0.6
Slovakia 2.137 40.5 4.0 37.3 3.1 21.0 1.4
Spain 2.414 26.6 2.1 1.5
Sweden 13.442 6.7 2.2 7.4 02 1.2 7.7 2.1
Switzerland 3.852 17.8 4.4 34.0 4.9
Turkey 1.370 85.1 227.9 04 13.8 04 93.1 2.3
Ukraine 903 46.9 4.0 4.9 04 3.9 34.9 3.3
England and Wales 10.103 30.2 2.3 24.3 1.7
Montenegro 1.539 76.8 4.8
Northern Ireland 6.956 23.8 05 1.5 05 20.5 05 1.2 05
Scotland 8.194 11.2 05 4.1 05 9.7 05 3.5 05
Serbia 1.007 5.4 0.1
median 3.375 33.9 4.1 23.8 2.7 18.8 1.7
Oceania New Zealand 10.212 38.8 9.2 29.5 00 0.9 00 22.1 00 0.1 00
Papua New Guinea 247 00 7.8 00 2.1 00 0.1 00
all countries median 1.380 45.4 4.1 30.4 2.2 18.5 1.4
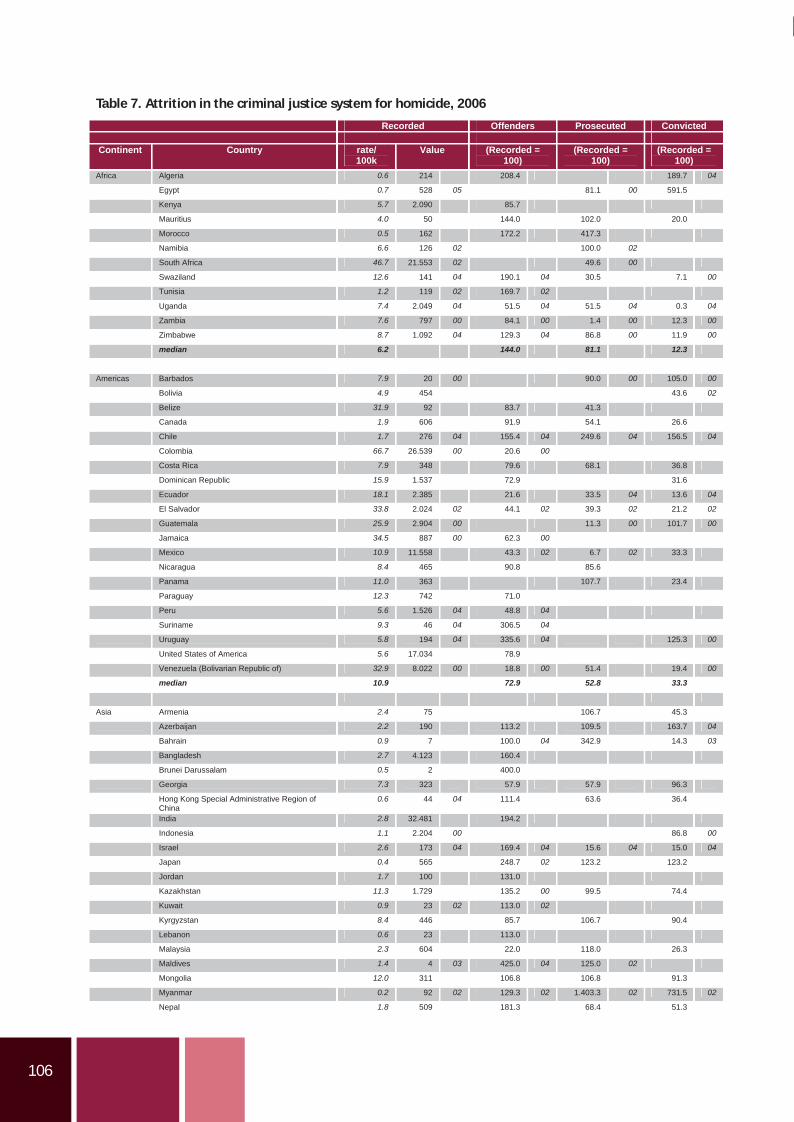
106
Table 7. Attrition in the criminal justice system for homicide, 2006
Recorded Offenders Prosecuted Convicted
Continent Country rate/ 100k
Value (Recorded =100)
(Recorded =100)
(Recorded =100)
Africa Algeria 0.6 214 208.4 189.7 04
Egypt 0.7 528 05 81.1 00 591.5
Kenya 5.7 2.090 85.7
Mauritius 4.0 50 144.0 102.0 20.0
Morocco 0.5 162 172.2 417.3
Namibia 6.6 126 02 100.0 02
South Africa 46.7 21.553 02 49.6 00
Swaziland 12.6 141 04 190.1 04 30.5 7.1 00
Tunisia 1.2 119 02 169.7 02
Uganda 7.4 2.049 04 51.5 04 51.5 04 0.3 04
Zambia 7.6 797 00 84.1 00 1.4 00 12.3 00
Zimbabwe 8.7 1.092 04 129.3 04 86.8 00 11.9 00
median 6.2 144.0 81.1 12.3
Americas Barbados 7.9 20 00 90.0 00 105.0 00
Bolivia 4.9 454 43.6 02
Belize 31.9 92 83.7 41.3
Canada 1.9 606 91.9 54.1 26.6
Chile 1.7 276 04 155.4 04 249.6 04 156.5 04
Colombia 66.7 26.539 00 20.6 00
Costa Rica 7.9 348 79.6 68.1 36.8
Dominican Republic 15.9 1.537 72.9 31.6
Ecuador 18.1 2.385 21.6 33.5 04 13.6 04
El Salvador 33.8 2.024 02 44.1 02 39.3 02 21.2 02
Guatemala 25.9 2.904 00 11.3 00 101.7 00
Jamaica 34.5 887 00 62.3 00
Mexico 10.9 11.558 43.3 02 6.7 02 33.3
Nicaragua 8.4 465 90.8 85.6
Panama 11.0 363 107.7 23.4
Paraguay 12.3 742 71.0
Peru 5.6 1.526 04 48.8 04
Suriname 9.3 46 04 306.5 04
Uruguay 5.8 194 04 335.6 04 125.3 00
United States of America 5.6 17.034 78.9
Venezuela (Bolivarian Republic of) 32.9 8.022 00 18.8 00 51.4 19.4 00
median 10.9 72.9 52.8 33.3
Asia Armenia 2.4 75 106.7 45.3
Azerbaijan 2.2 190 113.2 109.5 163.7 04
Bahrain 0.9 7 100.0 04 342.9 14.3 03
Bangladesh 2.7 4.123 160.4
Brunei Darussalam 0.5 2 400.0
Georgia 7.3 323 57.9 57.9 96.3
Hong Kong Special Administrative Region of China
0.6 44 04 111.4 63.6 36.4
India 2.8 32.481 194.2
Indonesia 1.1 2.204 00 86.8 00
Israel 2.6 173 04 169.4 04 15.6 04 15.0 04
Japan 0.4 565 248.7 02 123.2 123.2
Jordan 1.7 100 131.0
Kazakhstan 11.3 1.729 135.2 00 99.5 74.4
Kuwait 0.9 23 02 113.0 02
Kyrgyzstan 8.4 446 85.7 106.7 90.4
Lebanon 0.6 23 113.0
Malaysia 2.3 604 22.0 118.0 26.3
Maldives 1.4 4 03 425.0 04 125.0 02
Mongolia 12.0 311 106.8 106.8 91.3
Myanmar 0.2 92 02 129.3 02 1.403.3 02 731.5 02
Nepal 1.8 509 181.3 68.4 51.3
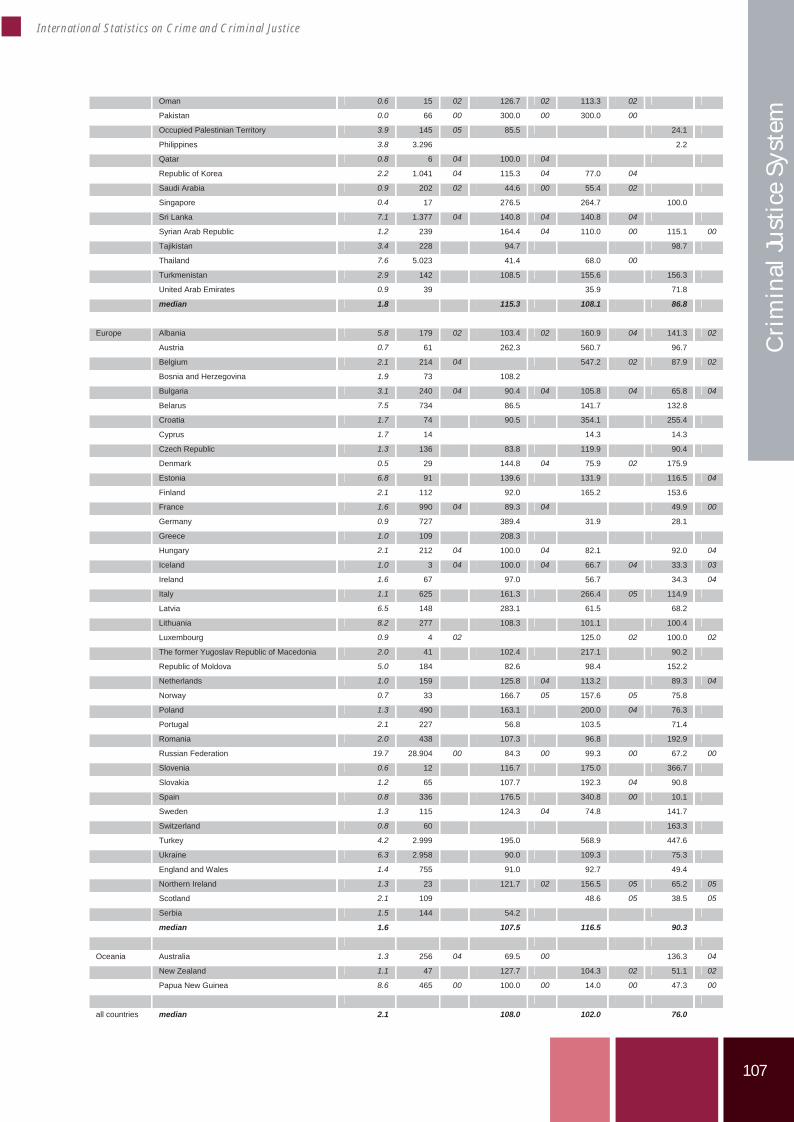
107
International Statistics on Crime and Criminal Justice
Cri
min
al Ju
stic
e Sy
stem
Oman 0.6 15 02 126.7 02 113.3 02
Pakistan 0.0 66 00 300.0 00 300.0 00
Occupied Palestinian Territory 3.9 145 05 85.5 24.1
Philippines 3.8 3.296 2.2
Qatar 0.8 6 04 100.0 04
Republic of Korea 2.2 1.041 04 115.3 04 77.0 04
Saudi Arabia 0.9 202 02 44.6 00 55.4 02
Singapore 0.4 17 276.5 264.7 100.0
Sri Lanka 7.1 1.377 04 140.8 04 140.8 04
Syrian Arab Republic 1.2 239 164.4 04 110.0 00 115.1 00
Tajikistan 3.4 228 94.7 98.7
Thailand 7.6 5.023 41.4 68.0 00
Turkmenistan 2.9 142 108.5 155.6 156.3
United Arab Emirates 0.9 39 35.9 71.8
median 1.8 115.3 108.1 86.8
Europe Albania 5.8 179 02 103.4 02 160.9 04 141.3 02
Austria 0.7 61 262.3 560.7 96.7
Belgium 2.1 214 04 547.2 02 87.9 02
Bosnia and Herzegovina 1.9 73 108.2
Bulgaria 3.1 240 04 90.4 04 105.8 04 65.8 04
Belarus 7.5 734 86.5 141.7 132.8
Croatia 1.7 74 90.5 354.1 255.4
Cyprus 1.7 14 14.3 14.3
Czech Republic 1.3 136 83.8 119.9 90.4
Denmark 0.5 29 144.8 04 75.9 02 175.9
Estonia 6.8 91 139.6 131.9 116.5 04
Finland 2.1 112 92.0 165.2 153.6
France 1.6 990 04 89.3 04 49.9 00
Germany 0.9 727 389.4 31.9 28.1
Greece 1.0 109 208.3
Hungary 2.1 212 04 100.0 04 82.1 92.0 04
Iceland 1.0 3 04 100.0 04 66.7 04 33.3 03
Ireland 1.6 67 97.0 56.7 34.3 04
Italy 1.1 625 161.3 266.4 05 114.9
Latvia 6.5 148 283.1 61.5 68.2
Lithuania 8.2 277 108.3 101.1 100.4
Luxembourg 0.9 4 02 125.0 02 100.0 02
The former Yugoslav Republic of Macedonia 2.0 41 102.4 217.1 90.2
Republic of Moldova 5.0 184 82.6 98.4 152.2
Netherlands 1.0 159 125.8 04 113.2 89.3 04
Norway 0.7 33 166.7 05 157.6 05 75.8
Poland 1.3 490 163.1 200.0 04 76.3
Portugal 2.1 227 56.8 103.5 71.4
Romania 2.0 438 107.3 96.8 192.9
Russian Federation 19.7 28.904 00 84.3 00 99.3 00 67.2 00
Slovenia 0.6 12 116.7 175.0 366.7
Slovakia 1.2 65 107.7 192.3 04 90.8
Spain 0.8 336 176.5 340.8 00 10.1
Sweden 1.3 115 124.3 04 74.8 141.7
Switzerland 0.8 60 163.3
Turkey 4.2 2.999 195.0 568.9 447.6
Ukraine 6.3 2.958 90.0 109.3 75.3
England and Wales 1.4 755 91.0 92.7 49.4
Northern Ireland 1.3 23 121.7 02 156.5 05 65.2 05
Scotland 2.1 109 48.6 05 38.5 05
Serbia 1.5 144 54.2
median 1.6 107.5 116.5 90.3
Oceania Australia 1.3 256 04 69.5 00 136.3 04
New Zealand 1.1 47 127.7 104.3 02 51.1 02
Papua New Guinea 8.6 465 00 100.0 00 14.0 00 47.3 00
all countries median 2.1 108.0 102.0 76.0
108
Annex B to chapter 5: Methodological notes
Four data points in time
For every country and for every variable four figures, representing four different points in time, were takenfrom the UN Crime Survey dataset.One of these figures was used for all analyses, tables and graphsthat are based on the latest year available, the other three were used for the tables, graphs and analyses thatdeal with trends. Since not every country responded to all surveys these points in time can differ fromcountry to country. The following decision rules were used to obtain the four figures:
Latest year available
If available, the year 2006 from the 10th survey was taken. Otherwise the last available year wastaken, provided this year was 2000 or later. If the last available year was 1999 or earlier this datapoint had a missing value.
Trends
For trends three points in time were taken. If available these were the years 1996 (designated'Start'), 2001 ('Mid') and 2006 ('End').
If 2006 was not available for a specific variable and country, the year 2005 was taken as 'End'point or alternatively the year 2004, if 2005 was not available either.If 2001 was not available for a specific variable and country, the year 2000 was taken as 'Mid'point or alternatively the year 2002, if 2000 was not available either.If 1996 was not available for a specific variable and country, the year 1995 was taken as 'Start'point or alternatively the year 1994, if 1995 was not available either. If none of these threeyears were available, 1997 was taken as an alternative.
This was done because using only the years 1996, 2001 and 2006 would have resulted in too manymissing values.
Data quality checking
After determining the 'Latest', 'Start', 'Mid' and 'End' points a quality check was carried out on the data.
Firstly, because of the instability of the data due to small numbers, all data from countries with less than100,000 inhabitants were removed.
Next for the other countries it was found that some of the data were not stable or clearly not consistent withother data (either in other surveys or in the same survey compared to other variables). Examples ofsuspected inconsistencies were:
The data given for one survey were clearly different from the data given for other surveys.The sum of the number of adults plus the number of juveniles was completely different from the totalnumber of suspects/prosecuted/convicted persons. Although this sum does not necessarily need tobe exactly the same (due to other data sources used, or due to counting also companies as offenders),if the difference is too large this could be a sign that the figures given indicate something differentfrom what was meant in the questionnaire.The number of persons prosecuted was from a different order of magnitude compared to the numberof suspected offenders and/or the number of convicted persons. This would probably reflect anunusual organisation or function of the prosecution service and could therefore not be used forattrition analyses.The number of persons prosecuted and/or convicted for homicide was much larger than the numberof suspects. Actually this was most probably due to the fact that apparently the questionnaire was notclear on this point: many countries included the number of attempted homicides in the prosecutionand conviction parts of the questionnaire.
When a suspected inconsistency was found a decision had to be made how to deal with it. Basically therewere three possibilities:
Trends
109
International Statistics on Crime and Criminal Justice
Cri
min
al Ju
stic
e Sy
stem
1. The suspected figure was removed2. The suspected figure was replaced by another figure for the same variable from another
year if more consistent figures could be found. This was only possible within therestricions for the points in time as described in above.
3. An estimate was made based on other variables. As an example, the number of juvenilescould sometimes be estimated by subtracting the number of adults from the total.
A complete listing of all inconsistencies found and the actions taken can be found in nnex C.
Computing trends
When presenting and comparing trends, the complication is that the period is not the same for everycountry: e.g. for some countries the 'Start' year could be 1996 and the 'End' year 2006, for others this couldbe 1997 and 2004. To circumvent this the mean annual change was computed with the following formula:
If x1 is the value at year t1 and x2 the value at year t2 (with t2 > t1), the mean annual change is:
(x2 / x1)1/(t2 t1) 1
This mean annual change was computed for two periods, i.e. between 'Start' and 'End' (for most countries1996 2006) and between 'Mid' and 'End' (for most countries between 2001 and 2006).
Figures by continent
When computing figures per continent the median was calculated. This was done on the continental leveland not on the subcontinental level because otherwise the number of observations (countries) would havebeen too low for almost all subcontinents. Also, the median was only computed when there were at leastfive observations. This meant that no medians are given for Oceania, where only four countries couldprovide data for this chapter. For the trends analyses usually only Asia and Europe had at least 5 countrieswith sufficient trend data. When comparing medians between tables or between columns within one tableone should be aware that in every table and column different countries contribute to the median.
A
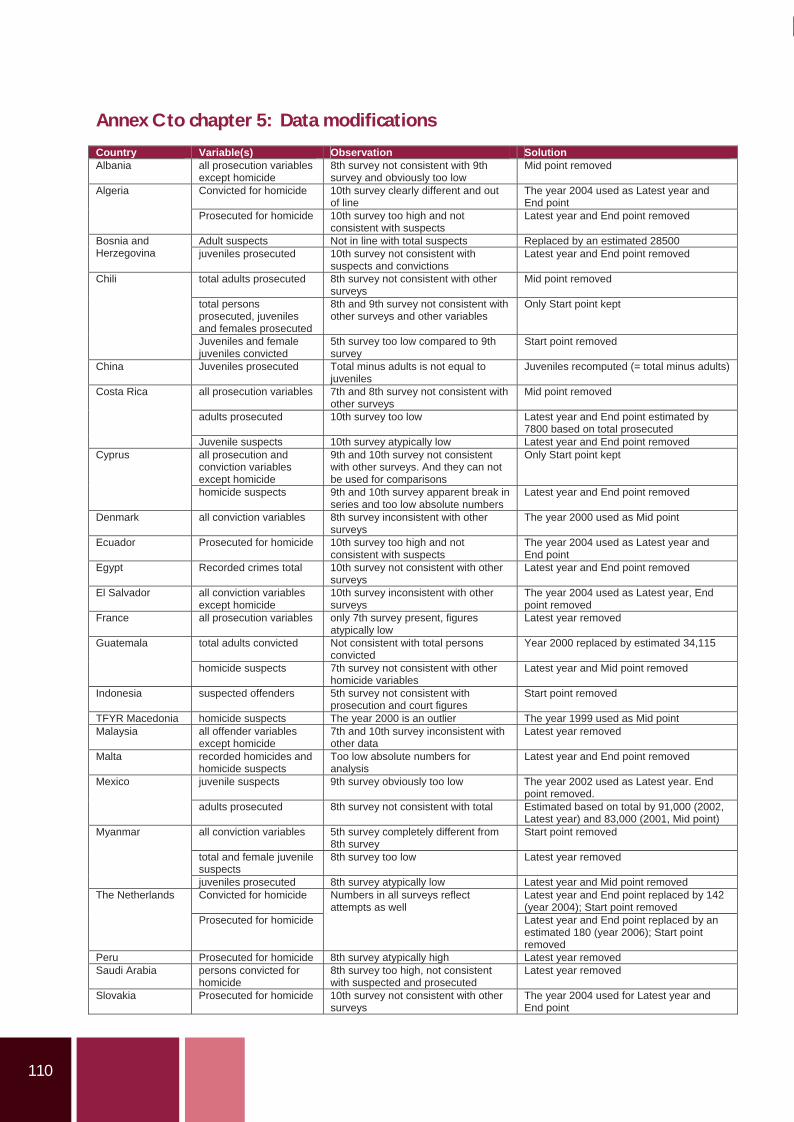
110
Annex C to chapter 5: Data modifications
Country Variable(s) Observation Solution Albania all prosecution variables
except homicide 8th survey not consistent with 9th survey and obviously too low
Mid point removed
Convicted for homicide 10th survey clearly different and out of line
The year 2004 used as Latest year and End point
Algeria
Prosecuted for homicide 10th survey too high and not consistent with suspects
Latest year and End point removed
Adult suspects Not in line with total suspects Replaced by an estimated 28500 Bosnia and Herzegovina juveniles prosecuted 10th survey not consistent with
suspects and convictions Latest year and End point removed
total adults prosecuted 8th survey not consistent with other surveys
Mid point removed
total persons prosecuted, juveniles and females prosecuted
8th and 9th survey not consistent with other surveys and other variables
Only Start point kept
Chili
Juveniles and female juveniles convicted
5th survey too low compared to 9th survey
Start point removed
China Juveniles prosecuted Total minus adults is not equal to juveniles
Juveniles recomputed (= total minus adults)
all prosecution variables 7th and 8th survey not consistent with other surveys
Mid point removed
adults prosecuted 10th survey too low Latest year and End point estimated by 7800 based on total prosecuted
Costa Rica
Juvenile suspects 10th survey atypically low Latest year and End point removed all prosecution and conviction variables except homicide
9th and 10th survey not consistent with other surveys. And they can not be used for comparisons
Only Start point kept Cyprus
homicide suspects 9th and 10th survey apparent break in series and too low absolute numbers
Latest year and End point removed
Denmark all conviction variables 8th survey inconsistent with other surveys
The year 2000 used as Mid point
Ecuador Prosecuted for homicide 10th survey too high and not consistent with suspects
The year 2004 used as Latest year and End point
Egypt Recorded crimes total 10th survey not consistent with other surveys
Latest year and End point removed
El Salvador all conviction variables except homicide
10th survey inconsistent with other surveys
The year 2004 used as Latest year, End point removed
France all prosecution variables only 7th survey present, figures atypically low
Latest year removed
total adults convicted Not consistent with total persons convicted
Year 2000 replaced by estimated 34,115 Guatemala
homicide suspects 7th survey not consistent with other homicide variables
Latest year and Mid point removed
Indonesia suspected offenders 5th survey not consistent with prosecution and court figures
Start point removed
TFYR Macedonia homicide suspects The year 2000 is an outlier The year 1999 used as Mid point Malaysia all offender variables
except homicide 7th and 10th survey inconsistent with other data
Latest year removed
Malta recorded homicides and homicide suspects
Too low absolute numbers for analysis
Latest year and End point removed
juvenile suspects 9th survey obviously too low The year 2002 used as Latest year. End point removed.
Mexico
adults prosecuted 8th survey not consistent with total Estimated based on total by 91,000 (2002, Latest year) and 83,000 (2001, Mid point)
all conviction variables 5th survey completely different from 8th survey
Start point removed
total and female juvenile suspects
8th survey too low Latest year removed
Myanmar
juveniles prosecuted 8th survey atypically low Latest year and Mid point removed Convicted for homicide Latest year and End point replaced by 142
(year 2004); Start point removed The Netherlands
Prosecuted for homicide
Numbers in all surveys reflect attempts as well
Latest year and End point replaced by an estimated 180 (year 2006); Start point removed
Peru Prosecuted for homicide 8th survey atypically high Latest year removed Saudi Arabia persons convicted for
homicide8th survey too high, not consistent with suspected and prosecuted
Latest year removed
Slovakia Prosecuted for homicide 10th survey not consistent with other surveys
The year 2004 used for Latest year and End point
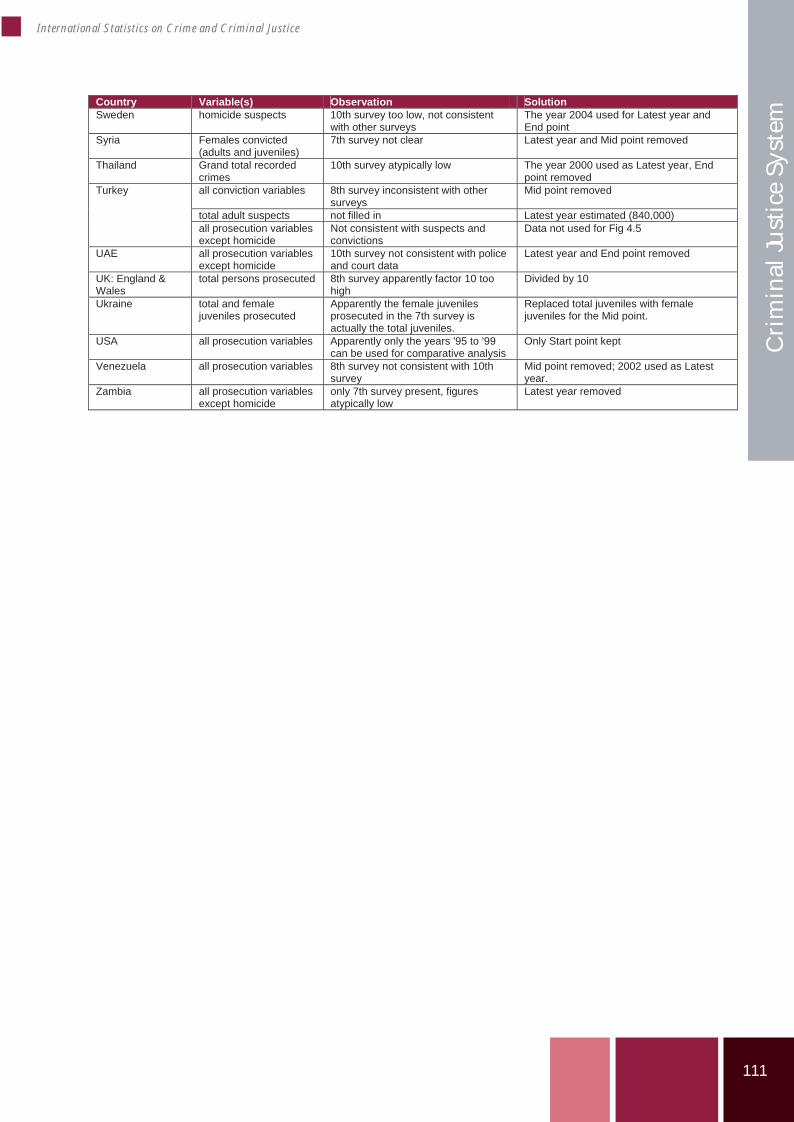
111
International Statistics on Crime and Criminal Justice
Cri
min
al Ju
stic
e Sy
stem
Country Variable(s) Observation Solution Sweden homicide suspects 10th survey too low, not consistent
with other surveys The year 2004 used for Latest year and End point
Syria Females convicted (adults and juveniles)
7th survey not clear Latest year and Mid point removed
Thailand Grand total recorded crimes
10th survey atypically low The year 2000 used as Latest year, End point removed
all conviction variables 8th survey inconsistent with other surveys
Mid point removed
total adult suspects not filled in Latest year estimated (840,000)
Turkey
all prosecution variables except homicide
Not consistent with suspects and convictions
Data not used for Fig 4.5
UAE all prosecution variables except homicide
10th survey not consistent with police and court data
Latest year and End point removed
UK: England & Wales
total persons prosecuted 8th survey apparently factor 10 too high
Divided by 10
Ukraine total and female juveniles prosecuted
Apparently the female juveniles prosecuted in the 7th survey is actually the total juveniles.
Replaced total juveniles with female juveniles for the Mid point.
USA all prosecution variables Apparently only the years '95 to '99 can be used for comparative analysis
Only Start point kept
Venezuela all prosecution variables 8th survey not consistent with 10th survey
Mid point removed; 2002 used as Latest year.
Zambia all prosecution variables except homicide
only 7th survey present, figures atypically low
Latest year removed

112
113
International Statistics on Crime and Criminal Justice
Cri
min
al Ju
stic
e Sy
stem
Chapter 6 – Attributes of criminal justice systems:resources, performance andpunitivity
Stefan Harrendorf* and Paul Smit**
Abstract
This chapter focuses on attributes of the criminal justice system itself, namely on resources of the system, itsperformance and the systemic punitivity. Regarding resources, it focuses on police and prosecutionpersonnel, professional judges and the staff in adult prisons. With respect to performance, quantitativeproductivity of the different criminal justice systems is analyzed, focusing on the rates of persons suspectedper police officer, persons prosecuted per prosecutor, persons brought before a criminal court per prosecutorand persons convicted per prosecutor. Finally, systemic punitivity is estimated by the rate of total personsincarcerated per total persons convicted. The chapter covers data not only from the 10th UN CTS, but alsofrom earlier waves, back as late as to the 6th wave for trend analysis. As in the other chapters, the scale isworldwide. Trying to cover as many countries as possible, data for the analysis of the most recent status quowas not only taken from the 10th UN CTS survey, but also from the 7th to 9th waves, with the year 2000being the earliest “latest available” year covered here. For trend analysis, the preferred starting year was 1995,the first point in time in the 6th wave. If necessary, trend analysis was made for shorter periods of timeinstead.
Criminal justice system resources
Firstly, we will take a close look at criminal justicesystem resources. As in preceding publicationsbased on UN CTS data (Marshall 1998; Mayhew2003; Gruszczynska, Marshall 2008), once againthe resources variables analyzed have beenrestricted to personnel variables. While the UNCTS questionnaire also asks for data on financialresources in all its sections (police, prosecution,courts, and prisons), these data have beenexcluded from analysis due to problemsregarding the interpretation: The resources wereto be added up to a single variable per chapter.The value had to be given in millions of localcurrency units. Such a value would be extremelyhard to compare between countries. First of all,the comparability of a single monetary value
representing the whole police (etc.) budget wouldbe extremely questionable, as long as it is notclear which budget posts have been includedthere and which not. Moreover, the exchange rateproblem will render comparison betweencountries almost impossible, especially withrespect to countries with a large variance in therates.
Small countries with a population of less than100,000 persons have been excluded fromanalysis (except where noted otherwise) becauseit could be feared that these data might bemisleadingly different from results for largercountries because of the special structure andnecessities of very small countries.
* Senior researcher at the Department of Criminology, Institute of Criminal Law and Justice,University of Göttingen, Germany** Program Supervisor Modelling and Jus ce Sta s cs WODC, Ministry of Justice, the Netherlands
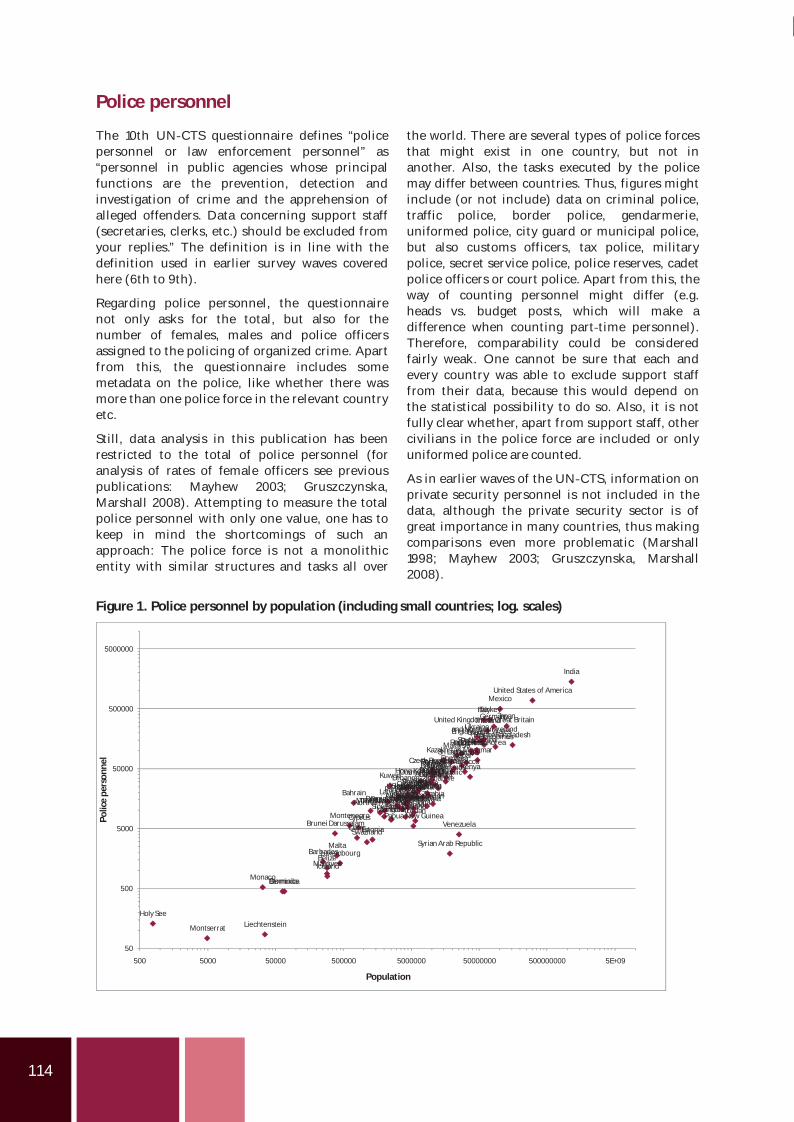
114
Police personnel
The 10th UN CTS questionnaire defines “policepersonnel or law enforcement personnel” as“personnel in public agencies whose principalfunctions are the prevention, detection andinvestigation of crime and the apprehension ofalleged offenders. Data concerning support staff(secretaries, clerks, etc.) should be excluded fromyour replies.” The definition is in line with thedefinition used in earlier survey waves coveredhere (6th to 9th).
Regarding police personnel, the questionnairenot only asks for the total, but also for thenumber of females, males and police officersassigned to the policing of organized crime. Apartfrom this, the questionnaire includes somemetadata on the police, like whether there wasmore than one police force in the relevant countryetc.
Still, data analysis in this publication has beenrestricted to the total of police personnel (foranalysis of rates of female officers see previouspublications: Mayhew 2003; Gruszczynska,Marshall 2008). Attempting to measure the totalpolice personnel with only one value, one has tokeep in mind the shortcomings of such anapproach: The police force is not a monolithicentity with similar structures and tasks all over
the world. There are several types of police forcesthat might exist in one country, but not inanother. Also, the tasks executed by the policemay differ between countries. Thus, figures mightinclude (or not include) data on criminal police,traffic police, border police, gendarmerie,uniformed police, city guard or municipal police,but also customs officers, tax police, militarypolice, secret service police, police reserves, cadetpolice officers or court police. Apart from this, theway of counting personnel might differ (e.g.heads vs. budget posts, which will make adifference when counting part time personnel).Therefore, comparability could be consideredfairly weak. One cannot be sure that each andevery country was able to exclude support stafffrom their data, because this would depend onthe statistical possibility to do so. Also, it is notfully clear whether, apart from support staff, othercivilians in the police force are included or onlyuniformed police are counted.
As in earlier waves of the UN CTS, information onprivate security personnel is not included in thedata, although the private security sector is ofgreat importance in many countries, thus makingcomparisons even more problematic (Marshall1998; Mayhew 2003; Gruszczynska, Marshall2008).
Figure 1. Police personnel by population (including small countries; log. scales)
Holy See
Bahrain
Monaco
Montserrat
Brunei Darussalam
Kuwait
Montenegro
Mauritius
BermudaDominica
Cyprus
Latvia
Lebanon
Italy
Barbados
Northern Ireland
UruguayPanama
Mexico
TFYR Macedonia
KazakhstanCzech Republic
Hong Kong SARCSerbia
Qatar
Malta
Croatia
Portugal
Singapore
Slovenia
Albania
Slovakia
Belize
Greece
Ukraine
Belgium
Malaysia
KyrgyzstanLithuania
Paraguay
Sri Lanka
IsraelAustriaBelarus
Peru
Thailand
ScotlandGeorgia
Spain
Hungary
Germany
Dominican Republic
Ireland
Maldives
Ecuador
Luxembourg
Republic of MoldovaBosnia and HerzegovinaMongolia
Costa RicaEl Salvador
Jamaica
Iceland
Swaziland
England and WalesPoland
United Kingdom of Great Britainand Northern Ireland
Norway
Liechtenstein
Estonia
Guatemala
Romania
Colombia
Bolivia
United States of America
Australia
Switzerland
South Africa
Netherlands
France
Nepal
Japan
Denmark
Republic of KoreaCanada
Sweden
Chile
New Zealand
Zimbabwe
NicaraguaFinland
Myanmar
Morocco
Azerbaijan
Philippines
India
Zambia
JordanPapua New Guinea
Kenya
Bangladesh
Venezuela
Syrian Arab Republic
Turkey
50
500
5000
50000
500000
5000000
500 5000 50000 500000 5000000 50000000 500000000 5E+09
Polic
epe
rson
nel
Population
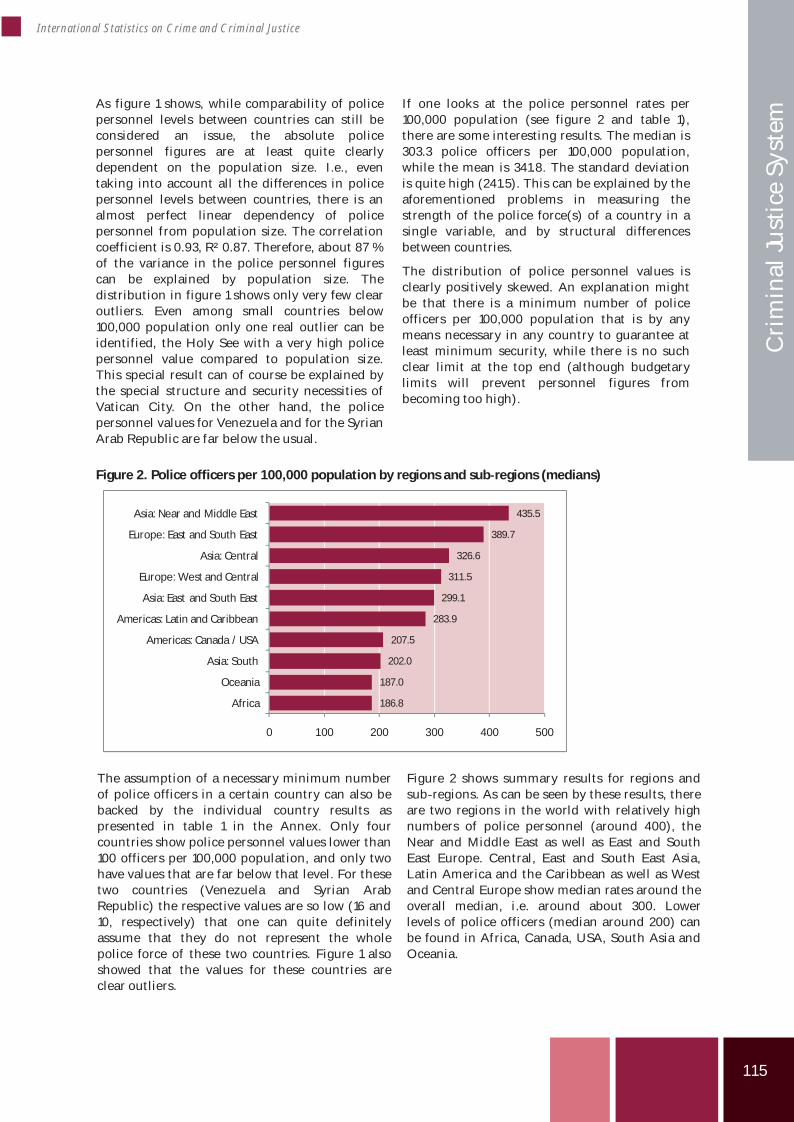
115
International Statistics on Crime and Criminal Justice
Cri
min
al Ju
stic
e Sy
stem
As figure 1 shows, while comparability of policepersonnel levels between countries can still beconsidered an issue, the absolute policepersonnel figures are at least quite clearlydependent on the population size. I.e., eventaking into account all the differences in policepersonnel levels between countries, there is analmost perfect linear dependency of policepersonnel from population size. The correlationcoefficient is 0.93, R² 0.87. Therefore, about 87 %of the variance in the police personnel figurescan be explained by population size. Thedistribution in figure 1 shows only very few clearoutliers. Even among small countries below100,000 population only one real outlier can beidentified, the Holy See with a very high policepersonnel value compared to population size.This special result can of course be explained bythe special structure and security necessities ofVatican City. On the other hand, the policepersonnel values for Venezuela and for the SyrianArab Republic are far below the usual.
If one looks at the police personnel rates per100,000 population (see figure 2 and table 1),there are some interesting results. The median is303.3 police officers per 100,000 population,while the mean is 341.8. The standard deviationis quite high (241.5). This can be explained by theaforementioned problems in measuring thestrength of the police force(s) of a country in asingle variable, and by structural differencesbetween countries.
The distribution of police personnel values isclearly positively skewed. An explanation mightbe that there is a minimum number of policeofficers per 100,000 population that is by anymeans necessary in any country to guarantee atleast minimum security, while there is no suchclear limit at the top end (although budgetarylimits will prevent personnel figures frombecoming too high).
Figure 2. Police officers per 100,000 population by regions and sub regions (medians)
The assumption of a necessary minimum numberof police officers in a certain country can also bebacked by the individual country results aspresented in table 1 in the Annex. Only fourcountries show police personnel values lower than100 officers per 100,000 population, and only twohave values that are far below that level. For thesetwo countries (Venezuela and Syrian ArabRepublic) the respective values are so low (16 and10, respectively) that one can quite definitelyassume that they do not represent the wholepolice force of these two countries. Figure 1 alsoshowed that the values for these countries areclear outliers.
Figure 2 shows summary results for regions andsub regions. As can be seen by these results, thereare two regions in the world with relatively highnumbers of police personnel (around 400), theNear and Middle East as well as East and SouthEast Europe. Central, East and South East Asia,Latin America and the Caribbean as well as Westand Central Europe show median rates around theoverall median, i.e. around about 300. Lowerlevels of police officers (median around 200) canbe found in Africa, Canada, USA, South Asia andOceania.
186.8
187.0
202.0
207.5
283.9
299.1
311.5
326.6
389.7
435.5
0 100 200 300 400 500
Africa
Oceania
Asia: South
Americas: Canada / USA
Americas: Latin and Caribbean
Asia: East and South East
Europe: West and Central
Asia: Central
Europe: East and South East
Asia: Near and Middle East
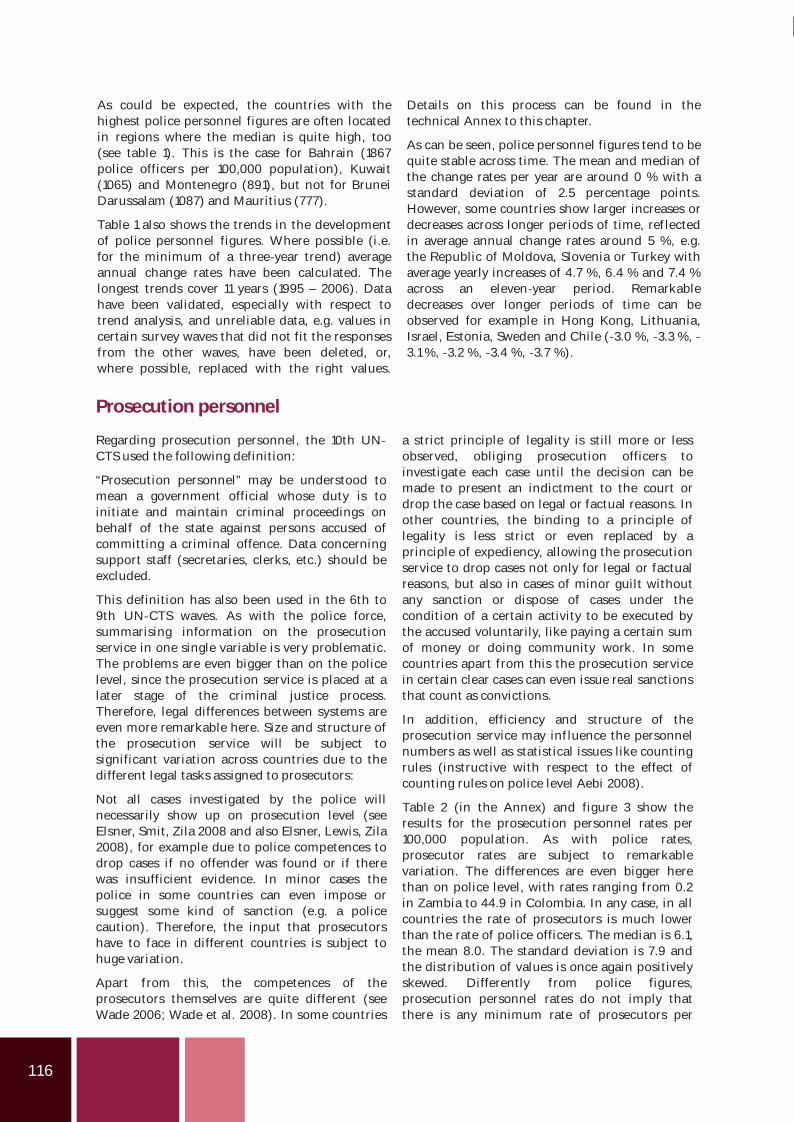
116
As could be expected, the countries with thehighest police personnel figures are often locatedin regions where the median is quite high, too(see table 1). This is the case for Bahrain (1867police officers per 100,000 population), Kuwait(1065) and Montenegro (891), but not for BruneiDarussalam (1087) and Mauritius (777).
Table 1 also shows the trends in the developmentof police personnel figures. Where possible (i.e.for the minimum of a three year trend) averageannual change rates have been calculated. Thelongest trends cover 11 years (1995 – 2006). Datahave been validated, especially with respect totrend analysis, and unreliable data, e.g. values incertain survey waves that did not fit the responsesfrom the other waves, have been deleted, or,where possible, replaced with the right values.
Details on this process can be found in thetechnical Annex to this chapter.
As can be seen, police personnel figures tend to bequite stable across time. The mean and median ofthe change rates per year are around 0 % with astandard deviation of 2.5 percentage points.However, some countries show larger increases ordecreases across longer periods of time, ref lectedin average annual change rates around 5 %, e.g.the Republic of Moldova, Slovenia or Turkey withaverage yearly increases of 4.7 %, 6.4 % and 7.4 %across an eleven year period. Remarkabledecreases over longer periods of time can beobserved for example in Hong Kong, Lithuania,Israel, Estonia, Sweden and Chile ( 3.0 %, 3.3 %,3.1 %, 3.2 %, 3.4 %, 3.7 %).
Prosecution personnel
Regarding prosecution personnel, the 10th UNCTS used the following definition:
“Prosecution personnel” may be understood tomean a government official whose duty is toinitiate and maintain criminal proceedings onbehalf of the state against persons accused ofcommitting a criminal offence. Data concerningsupport staff (secretaries, clerks, etc.) should beexcluded.
This definition has also been used in the 6th to9th UN CTS waves. As with the police force,summarising information on the prosecutionservice in one single variable is very problematic.The problems are even bigger than on the policelevel, since the prosecution service is placed at alater stage of the criminal justice process.Therefore, legal differences between systems areeven more remarkable here. Size and structure ofthe prosecution service will be subject tosignificant variation across countries due to thedifferent legal tasks assigned to prosecutors:
Not all cases investigated by the police willnecessarily show up on prosecution level (seeElsner, Smit, Zila 2008 and also Elsner, Lewis, Zila2008), for example due to police competences todrop cases if no offender was found or if therewas insufficient evidence. In minor cases thepolice in some countries can even impose orsuggest some kind of sanction (e.g. a policecaution). Therefore, the input that prosecutorshave to face in different countries is subject tohuge variation.
Apart from this, the competences of theprosecutors themselves are quite different (seeWade 2006; Wade et al. 2008). In some countries
a strict principle of legality is still more or lessobserved, obliging prosecution officers toinvestigate each case until the decision can bemade to present an indictment to the court ordrop the case based on legal or factual reasons. Inother countries, the binding to a principle oflegality is less strict or even replaced by aprinciple of expediency, allowing the prosecutionservice to drop cases not only for legal or factualreasons, but also in cases of minor guilt withoutany sanction or dispose of cases under thecondition of a certain activity to be executed bythe accused voluntarily, like paying a certain sumof money or doing community work. In somecountries apart from this the prosecution servicein certain clear cases can even issue real sanctionsthat count as convictions.
In addition, efficiency and structure of theprosecution service may influence the personnelnumbers as well as statistical issues like countingrules (instructive with respect to the effect ofcounting rules on police level Aebi 2008).
Table 2 (in the Annex) and figure 3 show theresults for the prosecution personnel rates per100,000 population. As with police rates,prosecutor rates are subject to remarkablevariation. The differences are even bigger herethan on police level, with rates ranging from 0.2in Zambia to 44.9 in Colombia. In any case, in allcountries the rate of prosecutors is much lowerthan the rate of police officers. The median is 6.1,the mean 8.0. The standard deviation is 7.9 andthe distribution of values is once again positivelyskewed. Differently from police figures,prosecution personnel rates do not imply thatthere is any minimum rate of prosecutors per
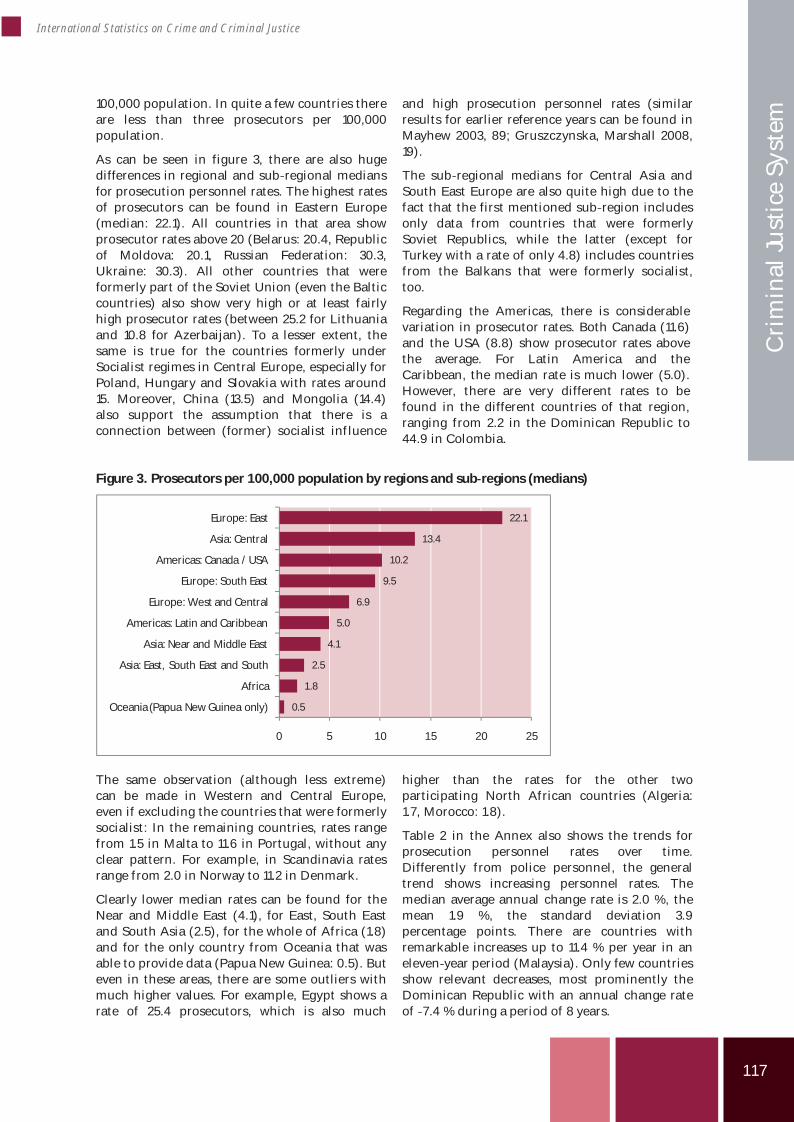
117
International Statistics on Crime and Criminal Justice
Cri
min
al Ju
stic
e Sy
stem
100,000 population. In quite a few countries thereare less than three prosecutors per 100,000population.
As can be seen in figure 3, there are also hugedifferences in regional and sub regional mediansfor prosecution personnel rates. The highest ratesof prosecutors can be found in Eastern Europe(median: 22.1). All countries in that area showprosecutor rates above 20 (Belarus: 20.4, Republicof Moldova: 20.1, Russian Federation: 30.3,Ukraine: 30.3). All other countries that wereformerly part of the Soviet Union (even the Balticcountries) also show very high or at least fairlyhigh prosecutor rates (between 25.2 for Lithuaniaand 10.8 for Azerbaijan). To a lesser extent, thesame is true for the countries formerly underSocialist regimes in Central Europe, especially forPoland, Hungary and Slovakia with rates around15. Moreover, China (13.5) and Mongolia (14.4)also support the assumption that there is aconnection between (former) socialist influence
and high prosecution personnel rates (similarresults for earlier reference years can be found inMayhew 2003, 89; Gruszczynska, Marshall 2008,19).
The sub regional medians for Central Asia andSouth East Europe are also quite high due to thefact that the first mentioned sub region includesonly data from countries that were formerlySoviet Republics, while the latter (except forTurkey with a rate of only 4.8) includes countriesfrom the Balkans that were formerly socialist,too.
Regarding the Americas, there is considerablevariation in prosecutor rates. Both Canada (11.6)and the USA (8.8) show prosecutor rates abovethe average. For Latin America and theCaribbean, the median rate is much lower (5.0).However, there are very different rates to befound in the different countries of that region,ranging from 2.2 in the Dominican Republic to44.9 in Colombia.
Figure 3. Prosecutors per 100,000 population by regions and sub regions (medians)
0.5
1.8
2.5
4.1
5.0
6.9
9.5
10.2
13.4
22.1
0 5 10 15 20 25
Oceania (Papua New Guinea only)
Africa
Asia: East, South East and South
Asia: Near and Middle East
Americas: Latin and Caribbean
Europe: West and Central
Europe: South East
Americas: Canada / USA
Asia: Central
Europe: East
The same observation (although less extreme)can be made in Western and Central Europe,even if excluding the countries that were formerlysocialist: In the remaining countries, rates rangefrom 1.5 in Malta to 11.6 in Portugal, without anyclear pattern. For example, in Scandinavia ratesrange from 2.0 in Norway to 11.2 in Denmark.
Clearly lower median rates can be found for theNear and Middle East (4.1), for East, South Eastand South Asia (2.5), for the whole of Africa (1.8)and for the only country from Oceania that wasable to provide data (Papua New Guinea: 0.5). Buteven in these areas, there are some outliers withmuch higher values. For example, Egypt shows arate of 25.4 prosecutors, which is also much
higher than the rates for the other twoparticipating North African countries (Algeria:1.7, Morocco: 1.8).
Table 2 in the Annex also shows the trends forprosecution personnel rates over time.Differently from police personnel, the generaltrend shows increasing personnel rates. Themedian average annual change rate is 2.0 %, themean 1.9 %, the standard deviation 3.9percentage points. There are countries withremarkable increases up to 11.4 % per year in aneleven year period (Malaysia). Only few countriesshow relevant decreases, most prominently theDominican Republic with an annual change rateof 7.4 % during a period of 8 years.
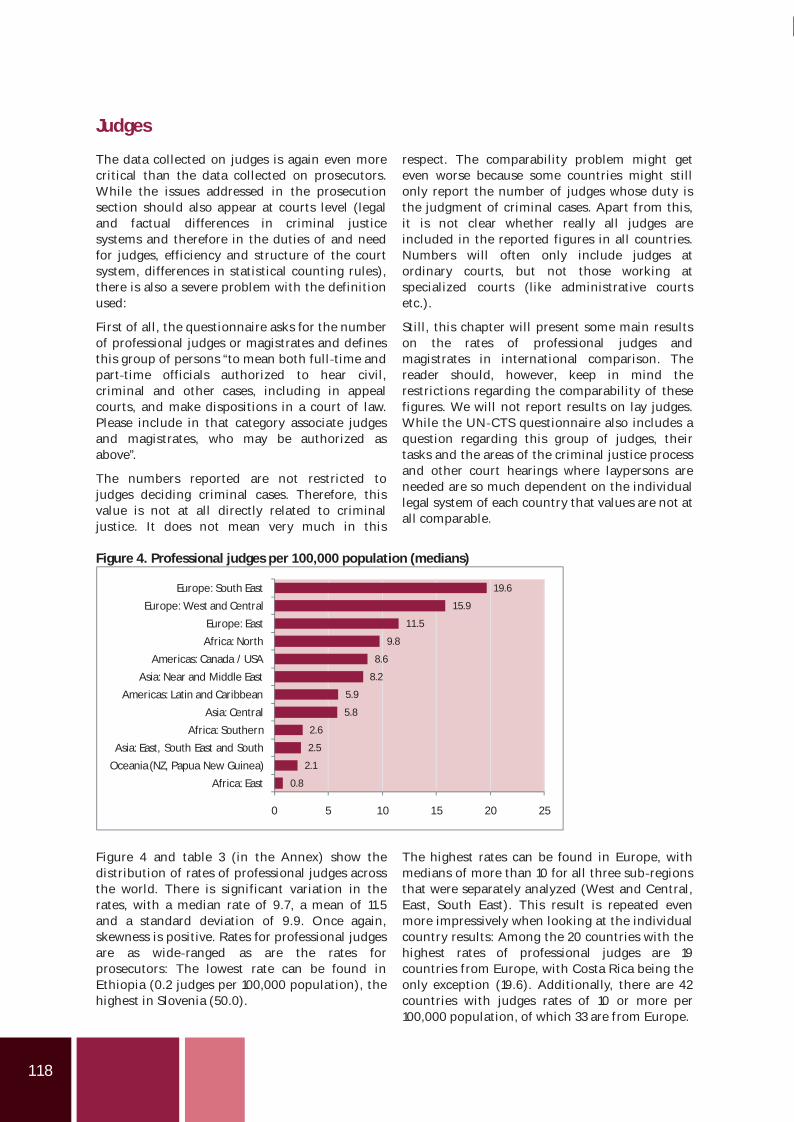
118
Judges
The data collected on judges is again even morecritical than the data collected on prosecutors.While the issues addressed in the prosecutionsection should also appear at courts level (legaland factual differences in criminal justicesystems and therefore in the duties of and needfor judges, efficiency and structure of the courtsystem, differences in statistical counting rules),there is also a severe problem with the definitionused:
First of all, the questionnaire asks for the numberof professional judges or magistrates and definesthis group of persons “to mean both full time andpart time officials authorized to hear civil,criminal and other cases, including in appealcourts, and make dispositions in a court of law.Please include in that category associate judgesand magistrates, who may be authorized asabove”.
The numbers reported are not restricted tojudges deciding criminal cases. Therefore, thisvalue is not at all directly related to criminaljustice. It does not mean very much in this
respect. The comparability problem might geteven worse because some countries might stillonly report the number of judges whose duty isthe judgment of criminal cases. Apart from this,it is not clear whether really all judges areincluded in the reported figures in all countries.Numbers will often only include judges atordinary courts, but not those working atspecialized courts (like administrative courtsetc.).
Still, this chapter will present some main resultson the rates of professional judges andmagistrates in international comparison. Thereader should, however, keep in mind therestrictions regarding the comparability of thesefigures. We will not report results on lay judges.While the UN CTS questionnaire also includes aquestion regarding this group of judges, theirtasks and the areas of the criminal justice processand other court hearings where laypersons areneeded are so much dependent on the individuallegal system of each country that values are not atall comparable.
Figure 4. Professional judges per 100,000 population (medians)
0.8
2.1
2.5
2.6
5.8
5.9
8.2
8.6
9.8
11.5
15.9
19.6
0 5 10 15 20 25
Africa: East
Oceania (NZ, Papua New Guinea)
Asia: East, South East and South
Africa: Southern
Asia: Central
Americas: Latin and Caribbean
Asia: Near and Middle East
Americas: Canada / USA
Africa: North
Europe: East
Europe: West and Central
Europe: South East
Figure 4 and table 3 (in the Annex) show thedistribution of rates of professional judges acrossthe world. There is significant variation in therates, with a median rate of 9.7, a mean of 11.5and a standard deviation of 9.9. Once again,skewness is positive. Rates for professional judgesare as wide ranged as are the rates forprosecutors: The lowest rate can be found inEthiopia (0.2 judges per 100,000 population), thehighest in Slovenia (50.0).
The highest rates can be found in Europe, withmedians of more than 10 for all three sub regionsthat were separately analyzed (West and Central,East, South East). This result is repeated evenmore impressively when looking at the individualcountry results: Among the 20 countries with thehighest rates of professional judges are 19countries from Europe, with Costa Rica being theonly exception (19.6). Additionally, there are 42countries with judges rates of 10 or more per100,000 population, of which 33 are from Europe.
119
International Statistics on Crime and Criminal Justice
Cri
min
al Ju
stic
e Sy
stem
Among the top ranking countries, there are alsoonce again quite many countries from Central,South East and East Europe with a socialisthistory, although the connection is not aspronounced as it was for the prosecutors. Butapart from a continental European legal tradition(for example the UK not only has a different legaltradition, but also lower rates of judges) asocialist history might explain high rates ofjudges. This interpretation is supported by theresults for China and Mongolia, where judgesrates are around 15.
The next highest rates of judges can be found inNorth Africa (9.8), Canada / USA (median: 8.7with 6.5 for Canada and 10.8 for the USA) and theNear and Middle East (8.2), with quite uniformresults in North Africa and USA / Canada, butquite high variation in the Near and Middle East(from 3.2 in Saudi Arabia to 16.0 in Bahrain). Theresults for Central Asia (5.8) and Latin Americaand the Caribbean (5.9) are considerably lower,although the former countries also had a socialistpast. This supports the assumption that therelationship between such a history and judgesrates is weaker than it is for prosecutor rates.
Low rates of professional judges can be found inEast (0.8) and Southern (2.6) Africa and also inEast, South East and South Asia (2.5), howeverwith some remarkable outliers. Apart from thealready named countries Mongolia and China,Zambia (9.8) is also to be mentioned here.
The trend in judges rates is overall quitecomparable with the trend in prosecutors rates,showing average annual change rates of 1.8 % inthe median and 2.2 % in the mean. The standarddeviation is higher with 4.2 percentage points.The incredible change rate for Tajikistan of 23.7per cent per year – leading to about ten timeshigher rates at the end of the eleven year period –might of course also be due to changes in thereporting of data, i.e. not necessarily only reflectchanges in the real world. However, this couldnot be confirmed due to the fact that the countryonly participated in the 6th and 10th waves. Thereare also some other countries with quiteremarkable increases (e.g.: 7.1 % per year over aneleven year period for Moldova) or decreases(e.g.: 7.7 % per year over an eight year period forMalaysia; but also note the strong increase inprosecutors rates for that country [see above]).
Prison staff
The fourth section of the UN CTS questionnaireaddresses prisons / penal institutions. Apart frombudget and staff variables, which are included inall sections of the UN CTS questionnaire, theprisons section also includes questions on thenumber of adult and juvenile prisons and thenumber of available places (withoutovercrowding). These latter variables are notevaluated here (but see Walmsley in thispublication, chapter 7, for some results onovercrowding). The sheer number of institutionsmeans nothing with respect to resources (sincethis number would also depend on the number ofavailable places per prison and is therefore not adirect indicator of the amount of resourcesspent). The number of places available withoutovercrowding is also not a measure for the extentof resources spent, because the “official capacity”of prisons is mainly subject to definition by eachand every country, which does not necessarilyimply a certain minimum standard and thusminimum standard costs.
In this publication, we are going to focus on thetotal staff in adult prisons only. The UN CTS alsoasks for data on juvenile prison staff, but this datacan also not be interpreted under the resourcesaspect. The extent to which juveniles can be sentto prison is subject to wide variation across the
world. Apart from or instead of prisons, there arereformatories, borstals and other types ofcustodial institutions for juvenile offendersavailable inside or outside of criminal law. Not allof the custodial institutions would be countedunder a prison staff heading (especially if notunder prison administration, see definitionbelow). Apart from this, many countries focusprimarily on non custodial responses to juveniledelinquency. The staff figure will therefore besubject to wide variation and cannot be validlyinterpreted without looking in detail into thedifferent systems.
Even with respect to adult prison staff, the resultshave to be interpreted carefully. The staffnumbers are only collected as a total (anddifferentiated by sex), but not differentiated byfunctions. Therefore, a high number of prisonstaff may be an outcome of a high number ofcustodial personnel or it might be an outcome ofa high number of treatment personnel. Theinterpretation would be very different, dependingon the distribution of the different functionswithin the total prison staff. With respect tocustodial personnel, the necessary number mightdramatically be reduced in prisons where securityis mainly guaranteed by technical means andarchitecture (therefore, the inmate / staff ratio is
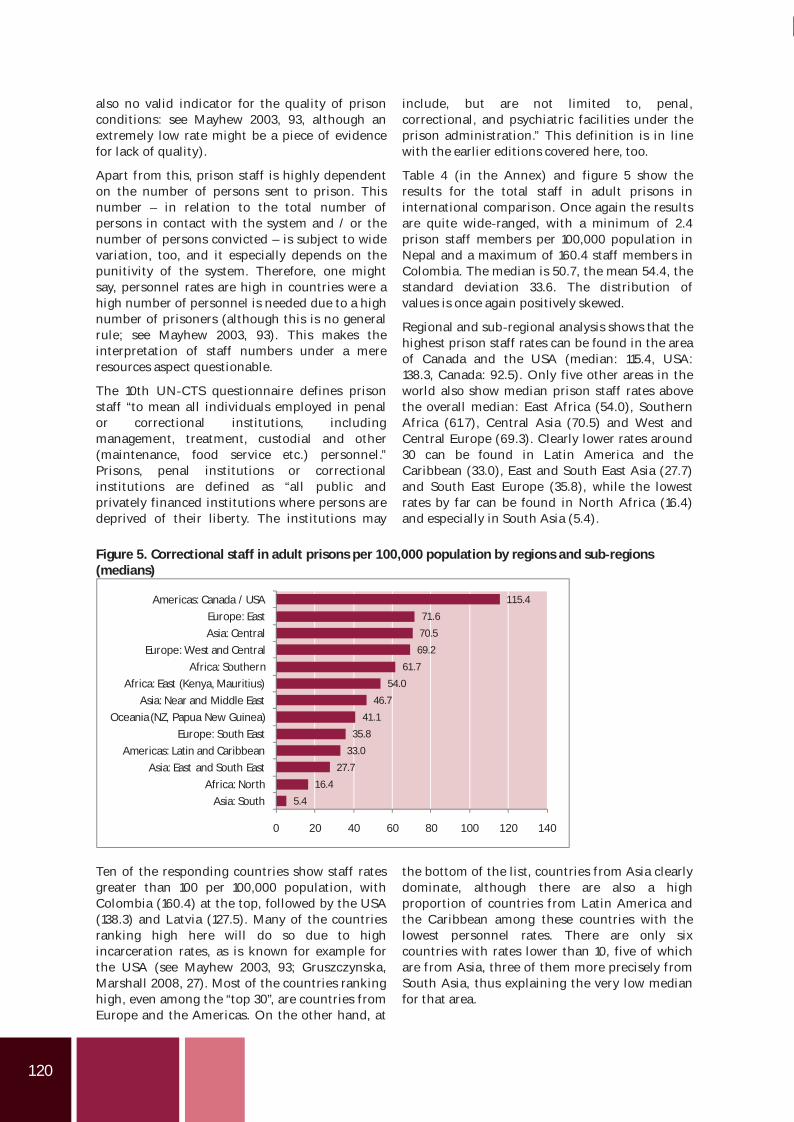
120
also no valid indicator for the quality of prisonconditions: see Mayhew 2003, 93, although anextremely low rate might be a piece of evidencefor lack of quality).
Apart from this, prison staff is highly dependenton the number of persons sent to prison. Thisnumber – in relation to the total number ofpersons in contact with the system and / or thenumber of persons convicted – is subject to widevariation, too, and it especially depends on thepunitivity of the system. Therefore, one mightsay, personnel rates are high in countries were ahigh number of personnel is needed due to a highnumber of prisoners (although this is no generalrule; see Mayhew 2003, 93). This makes theinterpretation of staff numbers under a mereresources aspect questionable.
The 10th UN CTS questionnaire defines prisonstaff “to mean all individuals employed in penalor correctional institutions, includingmanagement, treatment, custodial and other(maintenance, food service etc.) personnel.”Prisons, penal institutions or correctionalinstitutions are defined as “all public andprivately financed institutions where persons aredeprived of their liberty. The institutions may
include, but are not limited to, penal,correctional, and psychiatric facilities under theprison administration.” This definition is in linewith the earlier editions covered here, too.
Table 4 (in the Annex) and figure 5 show theresults for the total staff in adult prisons ininternational comparison. Once again the resultsare quite wide ranged, with a minimum of 2.4prison staff members per 100,000 population inNepal and a maximum of 160.4 staff members inColombia. The median is 50.7, the mean 54.4, thestandard deviation 33.6. The distribution ofvalues is once again positively skewed.
Regional and sub regional analysis shows that thehighest prison staff rates can be found in the areaof Canada and the USA (median: 115.4, USA:138.3, Canada: 92.5). Only five other areas in theworld also show median prison staff rates abovethe overall median: East Africa (54.0), SouthernAfrica (61.7), Central Asia (70.5) and West andCentral Europe (69.3). Clearly lower rates around30 can be found in Latin America and theCaribbean (33.0), East and South East Asia (27.7)and South East Europe (35.8), while the lowestrates by far can be found in North Africa (16.4)and especially in South Asia (5.4).
Figure 5. Correctional staff in adult prisons per 100,000 population by regions and sub regions(medians)
5.4
16.4
27.7
33.0
35.8
41.1
46.7
54.0
61.7
69.2
70.5
71.6
115.4
0 20 40 60 80 100 120 140
Asia: South
Africa: North
Asia: East and South East
Americas: Latin and Caribbean
Europe: South East
Oceania (NZ, Papua New Guinea)
Asia: Near and Middle East
Africa: East (Kenya, Mauritius)
Africa: Southern
Europe: West and Central
Asia: Central
Europe: East
Americas: Canada / USA
Ten of the responding countries show staff ratesgreater than 100 per 100,000 population, withColombia (160.4) at the top, followed by the USA(138.3) and Latvia (127.5). Many of the countriesranking high here will do so due to highincarceration rates, as is known for example forthe USA (see Mayhew 2003, 93; Gruszczynska,Marshall 2008, 27). Most of the countries rankinghigh, even among the “top 30”, are countries fromEurope and the Americas. On the other hand, at
the bottom of the list, countries from Asia clearlydominate, although there are also a highproportion of countries from Latin America andthe Caribbean among these countries with thelowest personnel rates. There are only sixcountries with rates lower than 10, five of whichare from Asia, three of them more precisely fromSouth Asia, thus explaining the very low medianfor that area.
121
International Statistics on Crime and Criminal Justice
Cri
min
al Ju
stic
e Sy
stem
Table 4 in the Annex also informs about thetrends in prison staff. As with prosecutionpersonnel and judges rates, prison staff rates havebeen increasing in the last years, if looking at thegeneral trend. The median average annual changerate is 1.2 %, the mean even 1.9 %. The standarddeviation is fairly high with 4.1 percentage points.Accordingly, there are some countries with verystrong increases over long periods of time. For
example, Jordan and the Dominican Republicshow average yearly increases of more than 10 %for an eleven year period. There are no countrieswith comparably strong decreases. A country withquite high decrease rates over quite a long periodof time is for example Estonia with 4.2 % peryear over a nine year period, or Panama with 5.4% per year over an eleven year period.
Possible measures of criminal justice performance
Regarding criminal justice system performance,the indicators the UN CTS data provide aresomewhat limited. However, some brief estimatescan be made by connecting data on criminaljustice personnel with the data on offenders theyhave to deal with. This is – of course – only arestricted view on performance, not looking atthe quality, but on the quantity of work done bythe different actors in the criminal justice system:Quantitative productivity defined as the relationbetween personnel strength and the outputproduced (see Mayhew 2003 and Smit 2008 withcomparable approaches).
The term “productivity” is used here without anyjudgment or quality assessment connected (forcriticism of this term see Smit 2008, 108). Thismeans: High quantitative productivity is not ameasure for the overall performance of a systemor for the quality of the results produced. Theextent of productivity is highly dependent on thestructure of a criminal justice system. Therefore,the results presented do not imply that a systemwith high productivity rates performs better thana system with low productivity rates.
In the resources section of this chapter, wediscussed data on four different actors within thecriminal justice system, namely the police,prosecution service, judges and correctional staff.In this section, we only focus on the police andprosecution service:
Judges’ output cannot be validly measured due torestrictions of the definition used. Since it is notclear to what extent the judgment of criminalcases is part of the judges’ duties (see above),their performance cannot be measured by theoutput (in convictions) they produced. Regardingprison staff, one should clearly think about themeaning of the ratio persons incarcerated perprison staff member, because incarceration is notthe product of prison staff members. Since the
distribution of functions among prison staff isnot clear, this rate can also not be interpreted as asupport or attendance rate (see above, and alsoMayhew 2003, 93, who tested this). Neither can itbe interpreted as a security rate, especially whentaking into account the other, technical andarchitectural means of achieving security, whichare not reflected in staff rates.
For the police and prosecution services there arealso many problems connected with this kind ofmeasurement. These problems will be addressedin detail within the relevant subsections.However, as a general remark, it should be notedthat the structure of the criminal justice processshould be taken into consideration whenmeasuring the productivity of a system.Therefore, police productivity can be measuredby the number of suspects they “produced”, butnot by the number of prosecutions or convictionsthat resulted afterwards. This is due to the factthat at least under usual circumstances the policehave no powers to prosecute cases in their owncompetence or present them in court (see Elsner,Smit, Zila 2008; Elsner, Lewis, Zila 2008).Therefore, the products “persons prosecuted” and“persons convicted” are not produced by thepolice.
Both of these are, however, usually produced bythe prosecution service. This is also the case forconvictions, although these fall primarily underthe duties of judges. But the prosecutor will haveto present the case in court, thus making theresulting convictions his or her product, too (seeWade, Smit, Aubusson de Cavarlay 2008 on theinfluence of prosecutors on the decisions ofcriminal courts). The same would be true for thenumber of persons brought before the criminalcourts. This product, that is located at anintermediate stage between persons prosecutedand persons convicted, is also usually producedby the prosecution service.
122
Persons suspected per police officer
Starting from these initial thoughts, a firstperformance indicator would be the number ofsuspects produced per police officer. Thisrelationship is visualized in figure 6; theconnected rates can be found in table 5 in theAnnex. Please note that the figure useslogarithmic scales for both values, due to largevariance in the respective rates. The diagram alsodoes not start with 1, but with 50 for bothvariables, due to the fact that lower values do notoccur1, and in order to allow looking at thedistribution of countries in more detail. The samehas been done with the other figures in thissection, which also use logarithmic scales andhave sometimes been trimmed, too.
As can clearly be seen from the figure, countryvalues do not suggest a simple linear relationshipbetween police personnel rates and the rate ofsuspects produced (see also Mayhew 2003, 104).The assumption that more police officers will alsoproduce a higher output must therefore berejected. This is at least the case with respect toUN CTS data with all of its methodologicalproblems, some of which have already beenaddressed above. Especially, suspects are not theonly product of the police, which have not onlyrepressive, but also preventive functions. One ofdifferent other products of the police is thereforesecurity. This part of police performance cannot,however, be measured in terms of suspects.Depending on the relationship of preventive andrepressive functions of the police personnel ofany given country, the importance of therepressive product of “suspects produced” mightvary.
Of course, the number of police recordedsuspects also depends on the definition of“suspect” and other issues of criminal law(especially the definition of what is considered a“criminal” offence), criminal procedure law(defining the fields of investigative work to bedone by police officers, in some countriesexcluding certain offence types, like tax offences,from their responsibility) and rules of statisticalrecording.
The number of suspects as a system producedvalue is also less dependent on the populationsize than is the number of police officers. Whilein the beginning of this chapter we showed thatthere is a very strong correlation between the sizeof the police force and the population size (corr.0.93, R² 0.87), the correlation between theabsolute total number of suspects and thepopulation size is much weaker (corr. 0.59, R²:0.35).
In accordance with the distribution shown infigure 6, there is no correlation between the rateof suspects and the rate of police officers in acountry (corr. 0.02). As figure 6 indicates, there isalso no clear relationship between policeproductivity and the region a country is locatedin. But it can be seen that those countries rankinglowest on the police productivity scale are mostlyfrom Latin America and Asia (countries belowthe 1st Quartile). Although there is no linearrelationship between the suspects rate and therate of police officers, there seems to exist oneclear centre in the figure.
1 With one exception: The Syrian Arab Republic has been excluded from this diagram due to an unrealistically lowpolice personnel rate of only about 10 (see above).
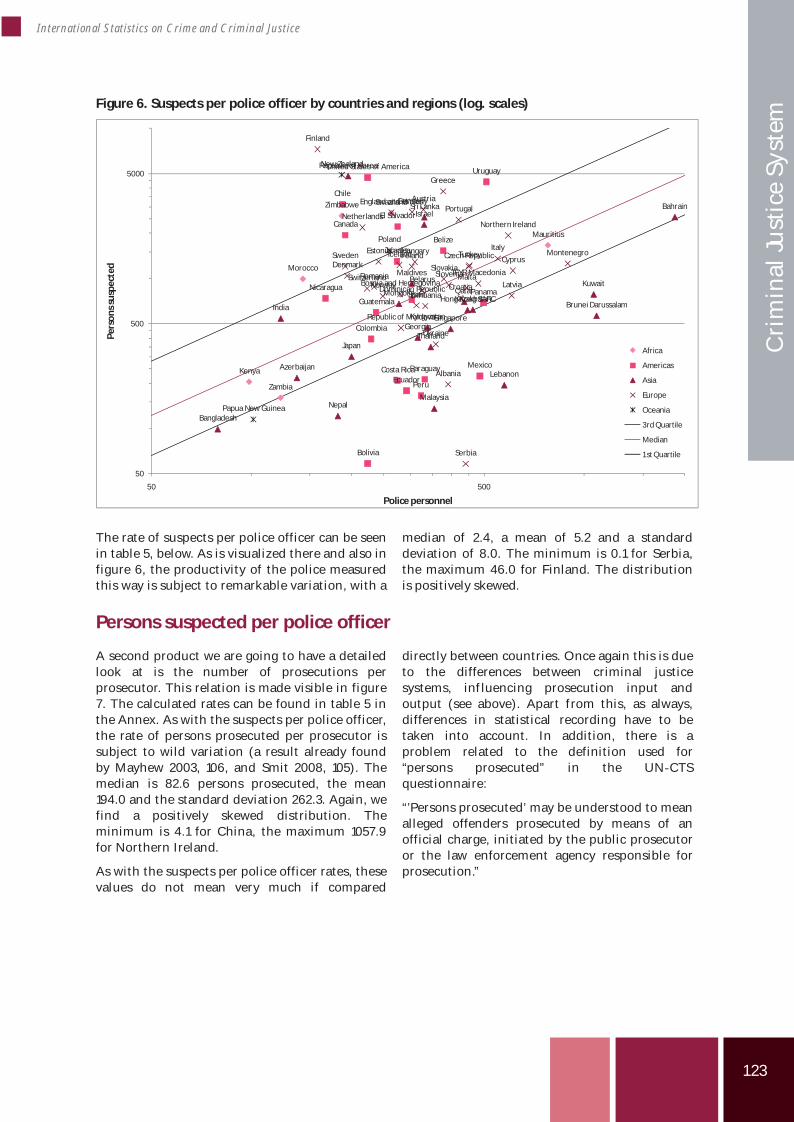
123
International Statistics on Crime and Criminal Justice
Cri
min
al Ju
stic
e Sy
stem
Figure 6. Suspects per police officer by countries and regions (log. scales)
Kenya
Mauritius
Morocco
Swaziland
Zambia
Zimbabwe
Dominican Republic
JamaicaBelize
Costa Rica
El Salvador
Guatemala
Nicaragua Panama
Canada
Mexico
United States of America
Bolivia
Chile
Colombia
EcuadorParaguay
Peru
Uruguay
Azerbaijan
Georgia
Kazakhstan
Kyrgyzstan
Brunei DarussalamHong Kong SARC
Japan
Malaysia
Mongolia
Republic of Korea
Singapore
Thailand
BahrainIsrael
Kuwait
Lebanon
Qatar
Bangladesh
India
Maldives
Nepal
Sri Lanka
Belarus
Republic of Moldova
Ukraine
Albania
Bosnia and Herzegovina Croatia
Montenegro
Romania
Serbia
TFYR Macedonia
Turkey
Austria
CyprusCzech RepublicDenmark
England and Wales
Estonia
Finland
Germany
Greece
HungaryIcelandIrelandItaly
LatviaLithuania
Malta
NetherlandsNorthern Ireland
Norway
Poland
Portugal
SlovakiaSlovenia
Spain
Sweden
Switzerland
New Zealand
Papua New Guinea
50
500
5000
50 500
Pers
onss
uspe
cted
Police personnel
Africa
Americas
Asia
Europe
Oceania
3rd Quartile
Median
1stQuartile
The rate of suspects per police officer can be seenin table 5, below. As is visualized there and also infigure 6, the productivity of the police measuredthis way is subject to remarkable variation, with a
median of 2.4, a mean of 5.2 and a standarddeviation of 8.0. The minimum is 0.1 for Serbia,the maximum 46.0 for Finland. The distributionis positively skewed.
Persons suspected per police officer
A second product we are going to have a detailedlook at is the number of prosecutions perprosecutor. This relation is made visible in figure7. The calculated rates can be found in table 5 inthe Annex. As with the suspects per police officer,the rate of persons prosecuted per prosecutor issubject to wild variation (a result already foundby Mayhew 2003, 106, and Smit 2008, 105). Themedian is 82.6 persons prosecuted, the mean194.0 and the standard deviation 262.3. Again, wefind a positively skewed distribution. Theminimum is 4.1 for China, the maximum 1057.9for Northern Ireland.
As with the suspects per police officer rates, thesevalues do not mean very much if compared
directly between countries. Once again this is dueto the differences between criminal justicesystems, inf luencing prosecution input andoutput (see above). Apart from this, as always,differences in statistical recording have to betaken into account. In addition, there is aproblem related to the definition used for“persons prosecuted” in the UN CTSquestionnaire:
“’Persons prosecuted’ may be understood to meanalleged offenders prosecuted by means of anofficial charge, initiated by the public prosecutoror the law enforcement agency responsible forprosecution.”
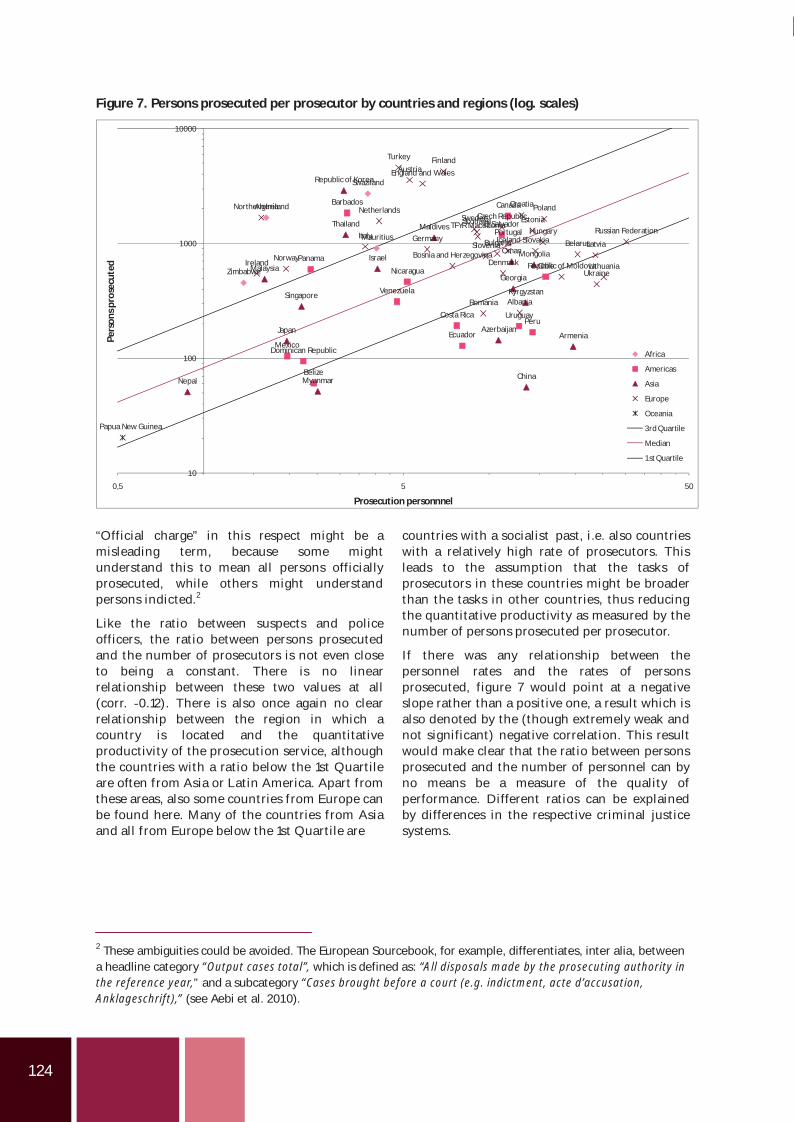
124
Figure 7. Persons prosecuted per prosecutor by countries and regions (log. scales)
Mauritius
Algeria
Swaziland
Zimbabwe
Barbados
Dominican Republic
Belize
Costa Rica
El Salvador
Nicaragua
Panama
Canada
Mexico
Chile
Ecuador
PeruUruguay
Venezuela
ArmeniaAzerbaijan
Georgia
Kyrgyzstan
China
Japan
Malaysia
Mongolia
Myanmar
Republic of Korea
Singapore
Thailand
IsraelOman
Maldives
Nepal
Belarus
Republic of Moldova
Russian Federation
Ukraine
Albania
Bosnia and Herzegovina
Bulgaria
Croatia
Romania
TFYR Macedonia
Turkey
Austria
Czech Republic
Denmark
England and Wales
Estonia
Finland
GermanyHungary
Iceland
Ireland
ItalyLatvia
Lithuania
NetherlandsNorthern Ireland
Norway
Poland
PortugalScotland
SlovakiaSlovenia
Sweden
Papua New Guinea
10
100
1000
10000
0,5 5 50
Pers
onsp
rose
cute
d
Prosecution personnnel
Africa
Americas
Asia
Europe
Oceania
3rd Quartile
Median
1stQuartile
“Official charge” in this respect might be amisleading term, because some mightunderstand this to mean all persons officiallyprosecuted, while others might understandpersons indicted.2
Like the ratio between suspects and policeofficers, the ratio between persons prosecutedand the number of prosecutors is not even closeto being a constant. There is no linearrelationship between these two values at all(corr. 0.12). There is also once again no clearrelationship between the region in which acountry is located and the quantitativeproductivity of the prosecution service, althoughthe countries with a ratio below the 1st Quartileare often from Asia or Latin America. Apart fromthese areas, also some countries from Europe canbe found here. Many of the countries from Asiaand all from Europe below the 1st Quartile are
countries with a socialist past, i.e. also countrieswith a relatively high rate of prosecutors. Thisleads to the assumption that the tasks ofprosecutors in these countries might be broaderthan the tasks in other countries, thus reducingthe quantitative productivity as measured by thenumber of persons prosecuted per prosecutor.
If there was any relationship between thepersonnel rates and the rates of personsprosecuted, figure 7 would point at a negativeslope rather than a positive one, a result which isalso denoted by the (though extremely weak andnot significant) negative correlation. This resultwould make clear that the ratio between personsprosecuted and the number of personnel can byno means be a measure of the quality ofperformance. Different ratios can be explainedby differences in the respective criminal justicesystems.
2 These ambiguities could be avoided. The European Sourcebook, for example, differentiates, inter alia, betweena headline category “Output cases total”, which is defined as: “All disposals made by the prosecuting authority inthe reference year,” and a subcategory “Cases brought before a court (e.g. indictment, acte d’accusation,Anklageschrift),” (see Aebi et al. 2010).
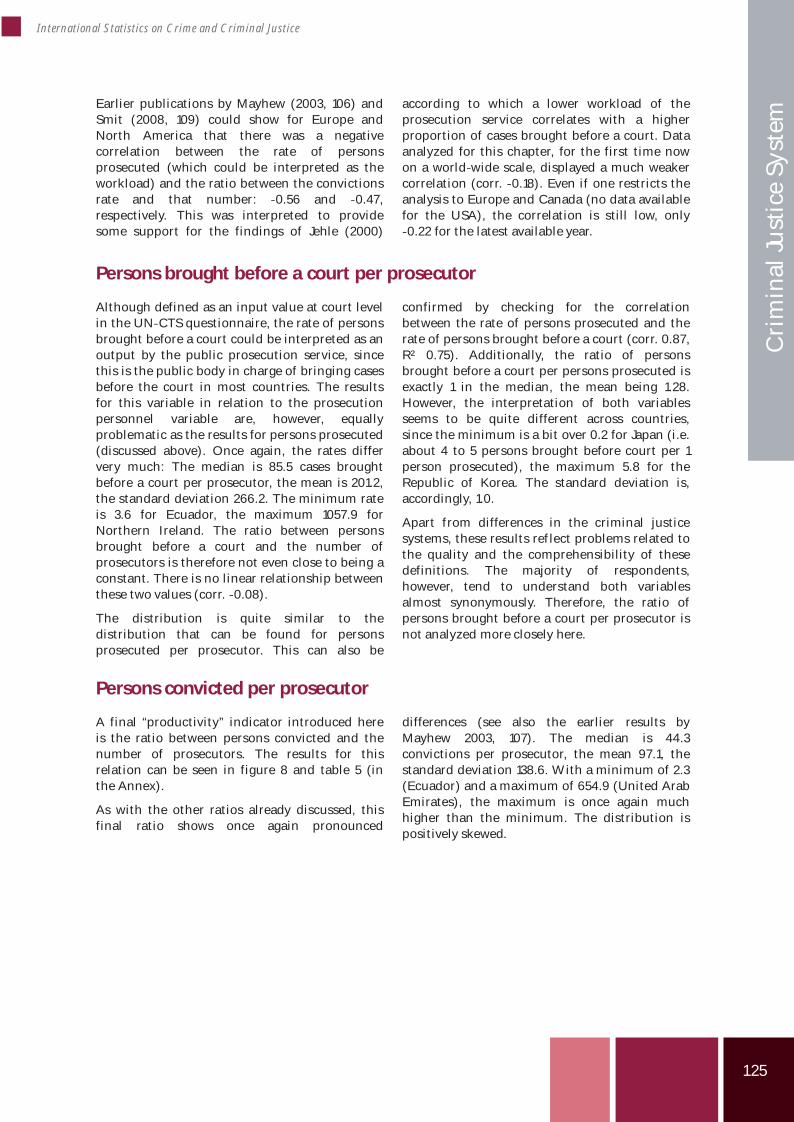
125
International Statistics on Crime and Criminal Justice
Cri
min
al Ju
stic
e Sy
stem
Earlier publications by Mayhew (2003, 106) andSmit (2008, 109) could show for Europe andNorth America that there was a negativecorrelation between the rate of personsprosecuted (which could be interpreted as theworkload) and the ratio between the convictionsrate and that number: 0.56 and 0.47,respectively. This was interpreted to providesome support for the findings of Jehle (2000)
according to which a lower workload of theprosecution service correlates with a higherproportion of cases brought before a court. Dataanalyzed for this chapter, for the first time nowon a world wide scale, displayed a much weakercorrelation (corr. 0.18). Even if one restricts theanalysis to Europe and Canada (no data availablefor the USA), the correlation is still low, only0.22 for the latest available year.
Persons brought before a court per prosecutor
Although defined as an input value at court levelin the UN CTS questionnaire, the rate of personsbrought before a court could be interpreted as anoutput by the public prosecution service, sincethis is the public body in charge of bringing casesbefore the court in most countries. The resultsfor this variable in relation to the prosecutionpersonnel variable are, however, equallyproblematic as the results for persons prosecuted(discussed above). Once again, the rates differvery much: The median is 85.5 cases broughtbefore a court per prosecutor, the mean is 201.2,the standard deviation 266.2. The minimum rateis 3.6 for Ecuador, the maximum 1057.9 forNorthern Ireland. The ratio between personsbrought before a court and the number ofprosecutors is therefore not even close to being aconstant. There is no linear relationship betweenthese two values (corr. 0.08).
The distribution is quite similar to thedistribution that can be found for personsprosecuted per prosecutor. This can also be
confirmed by checking for the correlationbetween the rate of persons prosecuted and therate of persons brought before a court (corr. 0.87,R² 0.75). Additionally, the ratio of personsbrought before a court per persons prosecuted isexactly 1 in the median, the mean being 1.28.However, the interpretation of both variablesseems to be quite different across countries,since the minimum is a bit over 0.2 for Japan (i.e.about 4 to 5 persons brought before court per 1person prosecuted), the maximum 5.8 for theRepublic of Korea. The standard deviation is,accordingly, 1.0.
Apart from differences in the criminal justicesystems, these results ref lect problems related tothe quality and the comprehensibility of thesedefinitions. The majority of respondents,however, tend to understand both variablesalmost synonymously. Therefore, the ratio ofpersons brought before a court per prosecutor isnot analyzed more closely here.
Persons convicted per prosecutor
A final “productivity” indicator introduced hereis the ratio between persons convicted and thenumber of prosecutors. The results for thisrelation can be seen in figure 8 and table 5 (inthe Annex).
As with the other ratios already discussed, thisfinal ratio shows once again pronounced
differences (see also the earlier results byMayhew 2003, 107). The median is 44.3convictions per prosecutor, the mean 97.1, thestandard deviation 138.6. With a minimum of 2.3(Ecuador) and a maximum of 654.9 (United ArabEmirates), the maximum is once again muchhigher than the minimum. The distribution ispositively skewed.
126
Figure 8. Persons convicted per prosecutor by countries and regions (log. scales)
Ethiopia
Mauritius
Zambia
Zimbabwe
Dominican Republic
Costa Rica
El Salvador
Guatemala
Panama
Canada
Mexico
Bolivia
Chile
Ecuador
Uruguay
Armenia
Azerbaijan
Georgia
Kyrgyzstan
ChinaJapan
Malaysia Mongolia
Myanmar
Republic of Korea
Singapore
Israel
Occupied Palestinian Territory
Qatar
Saudi Arabia
United Arab Emirates
Nepal
Belarus
Republic of Moldova
Russian Federation
Ukraine
Albania
Bosnia and HerzegovinaBulgaria
Croatia
Romania
TFYR Macedonia
Turkey
AustriaCzech Republic
Denmark
England and Wales
Estonia
Finland
France
Germany
HungaryIceland
ItalyLatviaLithuania
Netherlands
Norway
Poland
Portugal
Scotland
SlovakiaSlovenia
Sweden
Papua New Guinea
1
10
100
1000
10000
0,1 1 10
Pers
onsc
onvi
cted
Prosecution personnel
Africa
Americas
Asia
Europe
Oceania
3rd Quartile
Median
1stQuartile
As was already shown for the other performanceindicators, it can be clearly seen in figure 8 thatthere is also no linear relationship betweenprosecution personnel rates and conviction rates(corr. 0.02). However, the relationship betweenquantitative productivity and the region acountry is located in seems to be morepronounced: While below the 1st Quartile almostall countries are located in Asia, Latin Americaand the Caribbean, above the 3rd Quartile mostcountries are located in Europe. Apart fromthese, three out of four represented countriesfrom Africa can be found here. There are also anumber of Asian countries in the highestranking quartile.
Of course, as for the other variables discussedhere, once again comparability issues have to betaken into account, based on the differences ofthe criminal justice systems and of statistical
recording. At least, the variable of “personsconvicted” is less ambiguous than other variablesdiscussed here, especially the “personsprosecuted” variable.
The definition used by the UN CTS was:“’Persons convicted’ may be understood to meanpersons found guilty by any legal body dulyauthorized to pronounce them convicted undernational law, whether the conviction was laterupheld or not.”
However, since the conviction is located at theend of the criminal justice process of firstinstance, the differences of the legal systems arefully pronounced here. Rates are, for example,influenced by the percentage of cases that aresubject to diversion and thus not or onlyinformally sanctioned (for details on attritionwithin the criminal justice process see Smit andHarrendorf in this book, chapter 5).
Combining the measures
So far, we presented four different indicators ofquantitative productivity of criminal justicesystems. One of these measures (personsbrought before the court per prosecutor) wasrejected due to the close interrelation with anddubious connection to the ratio of personprosecuted per prosecutor. For the remaining
three ratios, we calculated correlations. Theresults are 0.45 for suspects ratio by personsprosecuted ratio, 0.65 for suspects ratio bypersons convicted ratio and 0.66 for personsprosecuted ratio by persons convicted ratio.Therefore, systems with a high quantitativeproductivity with respect to one of these
127
International Statistics on Crime and Criminal Justice
Cri
min
al Ju
stic
e Sy
stem
measures also tend to have a high quantitativeproductivity with respect to the other twomeasures. Although one has got to keep in mindthat quantitative productivity is not a measure ofoverall criminal justice performance, especiallynot a measure for quality, this relationship makesis nevertheless possible to think about acombined productivity measure, based on allthree ratios.
Such a productivity measure was calculated. Inorder to do so, the distribution of all three ratioswas standardized to the range 0 to 1. Afterwards,where all three measures were available for a
country, these were added together and theresult was divided by three. If only two measureswere available, these were added and divided bytwo, and if there was only one measure, this wasused (in the standardized version, of course).The results can be seen in table 5 in the Annex(CPM column).
Table 5 also shows the separate ratios (nonstandardized) that were used to calculate theindex. For these ratios, the table also featuresaverage annual change rates and information onthe trend length, where available.
Punitivity of the system
Punitivity is an ambiguous term that requiresdefinition. One might understand punitivity tomean an attitude within the population, ameasure for the demand for harsh punishment.This type of punitivity cannot be measured withUN CTS data. However, punitivity can also beunderstood to mean a feature of the criminaljustice system itself, e.g. measuring theharshness of sentences (juridical punitivity; seeKury, Ferdinand 2008). Punitivity with respect tothe UN CTS can only be understood in this latterway. Therefore, punitivity is regarded here as anattribute of any given criminal justice system,measuring the severity of the response tocriminal offending.
UN CTS data does not cover information onsentences imposed for survey waves after the 7thanymore. Therefore, the length and severity ofsentences cannot be directly calculated with UNCTS data. However, there is another possibleapproach: The UN CTS still covers informationon the number of sentenced personsincarcerated. It also includes data on the total
number of convictions. Systemic punitivity cannow be estimated by the ratio between the rateof sentenced persons incarcerated and the rate ofpersons convicted (see Smit 2009):
The number of sentenced persons in prison atany given date is influenced 1) by the number ofpersons sent to prison and 2) by the actuallengths of prison sentences served. The ratiobetween sentenced persons incarcerated and thetotal of persons convicted is, however, only anestimate for systemic punitivity due to the factthat 1) counting units do not exactly fit and 2)the persons actually in prison at a given date inthe reference year have been sent there before.They might have already been in prison for alonger period of time. Therefore, the estimatecalculated this way is not robust against changesin the degree of systemic punitivity over time.
Taking all this into account, we calculatedpunitivity ratios (see table 6). Additionally,figure 9 visualizes the connection between therates of sentenced persons incarcerated and therate of persons convicted.
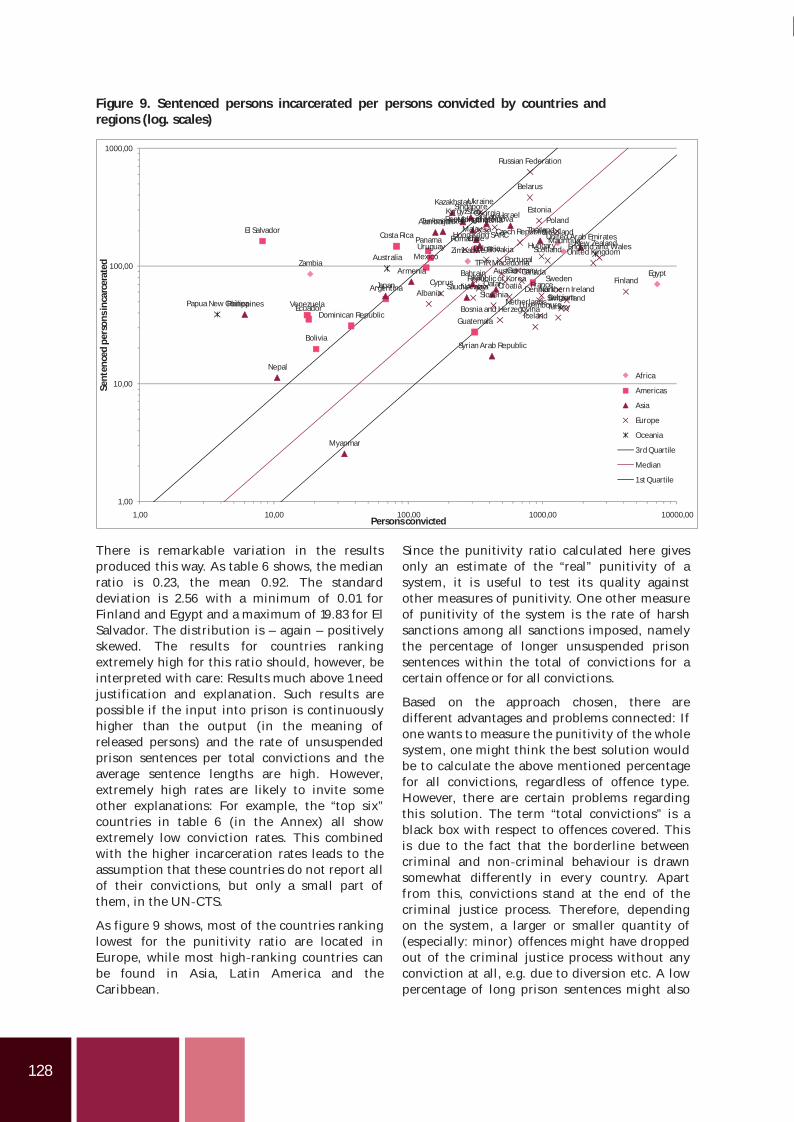
128
Figure 9. Sentenced persons incarcerated per persons convicted by countries andregions (log. scales)
There is remarkable variation in the resultsproduced this way. As table 6 shows, the medianratio is 0.23, the mean 0.92. The standarddeviation is 2.56 with a minimum of 0.01 forFinland and Egypt and a maximum of 19.83 for ElSalvador. The distribution is – again – positivelyskewed. The results for countries rankingextremely high for this ratio should, however, beinterpreted with care: Results much above 1 needjustification and explanation. Such results arepossible if the input into prison is continuouslyhigher than the output (in the meaning ofreleased persons) and the rate of unsuspendedprison sentences per total convictions and theaverage sentence lengths are high. However,extremely high rates are likely to invite someother explanations: For example, the “top six”countries in table 6 (in the Annex) all showextremely low conviction rates. This combinedwith the higher incarceration rates leads to theassumption that these countries do not report allof their convictions, but only a small part ofthem, in the UN CTS.
As figure 9 shows, most of the countries rankinglowest for the punitivity ratio are located inEurope, while most high ranking countries canbe found in Asia, Latin America and theCaribbean.
Since the punitivity ratio calculated here givesonly an estimate of the “real” punitivity of asystem, it is useful to test its quality againstother measures of punitivity. One other measureof punitivity of the system is the rate of harshsanctions among all sanctions imposed, namelythe percentage of longer unsuspended prisonsentences within the total of convictions for acertain offence or for all convictions.
Based on the approach chosen, there aredifferent advantages and problems connected: Ifone wants to measure the punitivity of the wholesystem, one might think the best solution wouldbe to calculate the above mentioned percentagefor all convictions, regardless of offence type.However, there are certain problems regardingthis solution. The term “total convictions” is ablack box with respect to offences covered. Thisis due to the fact that the borderline betweencriminal and non criminal behaviour is drawnsomewhat differently in every country. Apartfrom this, convictions stand at the end of thecriminal justice process. Therefore, dependingon the system, a larger or smaller quantity of(especially: minor) offences might have droppedout of the criminal justice process without anyconviction at all, e.g. due to diversion etc. A lowpercentage of long prison sentences might also
Egypt
MauritiusSwaziland
Zambia
Zimbabwe
Argentina
Bolivia
Canada
ChileCosta Rica
Dominican RepublicEcuador
El Salvador
Guatemala
Mexico
PanamaUruguay
Venezuela
Armenia
Azerbaijan
Bahrain
Georgia
Hong Kong SARC
Israel
Japan
KazakhstanKyrgyzstan
MalaysiaMongolia
Myanmar
Nepal
Philippines
QatarRepublic of Korea
Saudi Arabia
Singapore
Syrian Arab Republic
ThailandTurkmenistan
United Arab Emirates
Albania
Austria
Belarus
Belgium
Bosnia and Herzegovina
Bulgaria
CroatiaCyprus
Czech Republic
Denmark
England and Wales
Estonia
FinlandFrance
Germany
Hungary
Iceland
Italy
LatviaLithuania
LuxembourgNetherlands
Northern IrelandNorway
Poland
Portugal
Republic of Moldova
Romania
Russian Federation
ScotlandSlovakia
Slovenia
Sweden
Switzerland
TFYR Macedonia
Turkey
Ukraine
United KingdomAustralia
New Zealand
Papua New Guinea
1,00
10,00
100,00
1000,00
1,00 10,00 100,00 1000,00 10000,00
Sent
ence
dpe
rson
sinc
arce
rate
d
Persons convicted
Africa
Americas
Asia
Europe
Oceania
3rd Quartile
Median
1stQuartile
129
International Statistics on Crime and Criminal Justice
Cri
min
al Ju
stic
e Sy
stem
be due to an extensive criminal justice system inwhich even minor cases lead to a conviction.
One solution might be to refer to a certain,known offence that is well defined and more orless comparable instead (like theft). This wouldhelp to calibrate the punitivity measure to acertain offence severity. However, still hugeproblems remain if looking at such a minoroffence: A varying percentage of cases will neverreach the convictions level, but will be dropped,diverted or disposed of at earlier stages.
However, it would be short sighted to draw theconclusion that one should look instead at moresevere, well defined offences (like robbery). Ofcourse, for these offences the attrition rate willbe lower in all countries than for minor offences.However, another problem will arise: Theseverity of sanctions for grave offences will notnecessarily represent overall severity of thecriminal justice response. Long sentences for,e.g., robbery might also be due to severepunishment of this special crime type, and onlythis. Apart from this, with increasing severity of
the offence the punishment will increaseeverywhere. Since there is an upper limitingvalue for sentence severity, this will lead todecreasing variation in the distribution ofsentences with increasing gravity of the offence.
Due to these restrictions, we used a combinedapproach in table 6 in the Annex, calculating thepercentage of unsuspended prison sentences ofmore than one year in the total of convictions,the percentage of sentences above two years inrobbery convictions and the percentage ofsentences longer than one year in theftconvictions. The rates were calculated using theraw data of the European Sourcebook of Crimeand Criminal Justice Statistics for the referenceyear 2006 (Aebi et al. 2010).
Apart from these measures of punitivity of thesystem, we also introduced a measure ofpunitivity of the general public into table 6: Thepercentage of the general public opting forimprisonment as punishment for a recidivistburglar in 2004 / 2005 (taken from van Dijk, vanKesteren, Smit 2007, 149).
Table 1. Correlations and R² for punitivity measures
Correlations
incarceration / public opinion
incarceration / long sentences total
incarceration / long robbery sentences
incarceration / long theft sentences
0.20 0.92 0.46 0.89
public opinion / long sentences total
public opinion / long robbery sentences
public opinion / long theft sentences
-0.03 0.39 -0.01
long sentences total / long robbery sentences
long sentences total / long theft sentences
0.53 0.88
long robbery / long theft sentences
0.70
R²
incarceration / public opinion
incarceration / long sentences total
incarceration / long robbery sentences
incarceration / long theft sentences
0.04 0.85 0.21 0.78
public opinion / long sentences total
public opinion / long robbery sentences
public opinion / long theft sentences
0.00 0.15 0.00
long sentences total / long robbery sentences
long sentences total / long theft sentences
0.28 0.77
long robbery / long theft sentences
0.49
130
Correlations and R² between each pair of thesemeasures are shown in table 1. As can be seenthere, all measures of systemic punitivity arehighly correlated. There is a 0.92 correlationbetween the rate of sentenced personsincarcerated per total convictions and thepercentage of sentences longer than one year inall convictions. The punitivity measurecalculated with UN CTS data is also very stronglycorrelated with the percentage of unsuspendedtheft sentences over one year in the total of theftconvictions (corr. 0.89). As could be expected,based on the theoretical thoughts presentedabove, the correlation with long robberysentences above two years is weaker, though notirrelevant (0.46).
The correlation with the measure for thepunitivity of the general public, on the otherhand, is only 0.20. This supports the assumptionthat public punitivity and punitivity of the
system are two different issues that have to beaddressed separately (although there might be aweak relationship between them, as was alsofound in van Dijk, van Kesteren, Smit 2007, 151).This hypothesis is also supported by the fact thatmost other measures for the punitivity of thesystem used in table 6 (in the Annex) are notcorrelated with the public opinion variable.According to the results presented in table 1, thisis the case for long sentences total (corr. 0.03)and long theft sentences (corr. 0.01). Only thepunishment for more severe offences seems to bemore strongly influenced by public opinion (orin any other way interrelated): Here we can find acorrelation of 0.39. These findings support otherresearch results that show that the interrelationsbetween public opinion, lawmaking and legalpractice are complex (see i.a. Green 2008;Theodore, Kury 2008; Kury, Ferdinand,Obergfell Fuchs 2008).
Summary and conclusions
This chapter focused on three different attributesof criminal justice systems all over the world,
namely resources, performance (productivity)and punitivity.
Resources
Regarding criminal justice resources, fourpersonnel variables provided in the UN CTS datawere analyzed: police personnel, prosecutionpersonnel, professional judges and staff in adultprisons.
With respect to police personnel, the followingmain results were found: Absolute policepersonnel figures are quite clearly dependent onthe population size (corr. 0.93). Police personnelrates per 100,000 population vary significantlybetween countries. The median is 303.3, themean 341.8, the standard deviation 241.5. Thedistribution is positively skewed. Results implythat there is a minimum number of policeofficers per 100,000 population that is necessaryin any country. Only four countries worldwideshow police personnel values lower than 100officers per 100,000 population. There are tworegions in the world with relatively high medianrates of police personnel (around 400), the Nearand Middle East as well as East and South EastEurope, while the regions with the lowestmedian rates (median around 200) can be foundin Africa, Canada / USA, South Asia andOceania. Police personnel figures were quitestable across the reference period (1995 – 2006).The mean and median of the change rates per
year are around 0 % (standard deviation 2.45percentage points).
For prosecution personnel, we observed thatrates vary remarkably, ranging from 0.2 to 44.9.In all countries the rate of prosecutors is muchlower than the rate of police officers. The medianis 6.1, the mean 8.0. The standard deviation is7.9, and the distribution of values is positivelyskewed. The highest rates of prosecutionpersonnel can be found in Eastern Europe (above20). All other countries that were formerly partof the Soviet Union also show high prosecutorrates (between 25.2 and 10.8). To a lesser extent,the same is true for the countries formerly undersocialist regimes in Central Europe. Moreover,results for China and Mongolia also support theassumption that there is a connection between(former) socialist inf luence and highprosecution personnel rates. Regarding theAmericas, there is considerable variation inprosecutor rates. Both Canada (11.6) and the USA(8.8) show prosecutor rates above the average.For Latin America and the Caribbean, themedian rate is much lower (5.0). However, ratesrange from 2.2 to 44.9. A similar observation canbe made in Western and Central Europe(excluding formerly socialist countries): Rates
131
International Statistics on Crime and Criminal Justice
Cri
min
al Ju
stic
e Sy
stem
range from 1.5 to 11.6 without any clear pattern.Clearly lower median rates can be found for theNear and Middle East (4.1), for East, South Eastand South Asia (2.5), for the whole of Africa (1.8)and for Papua New Guinea (0.5). But once againthere are outliers with much higher values. Thegeneral trend shows increasing prosecutionpersonnel rates. The median average annualchange rate is 2.0 %, the mean 1.9 %, thestandard deviation 3.9 percentage points. Thereare countries with remarkable increases of up to11.4 % per year in an eleven year period, and onlyfew countries show relevant decreases.
As regards professional judges, there issignificant variation with a median rate of 9.7, amean of 11.5 and a standard deviation of 9.9.Rates range from 0.2 to 50.00. The highest ratesof judges can be found in Europe, with mediansof more than 10 for all three sub regions thatwere separately analyzed (West and Central,East, South East). Among the 20 countries withthe highest rates of professional judges are 19countries from Europe with Costa Rica being theonly exception (19.6). The lowest median rates ofprofessional judges can be found in East (0.8)and Southern (2.6) Africa and also in East, SouthEast and South Asia (2.5), however with someremarkable outliers (Mongolia and China withrates around 15 and Zambia with about 10).Trends in judges rates are overall quite
comparable with trends in prosecutors rates,showing average annual change rates of 1.8 % inthe median and 2.2 % in the mean with astandard deviation of 4.2 percentage points.
The results for staff rates in adult prisons arequite wide ranged once again with a minimum of2.4 prison staff members per 100,000 populationand a maximum of 160.4 staff members. Themedian is 50.7, the mean 54.4, the standarddeviation 33.6. Regional analysis shows that thehighest prison staff rates can be found in the areaof Canada and the USA (median: 115.4), while thelowest rates by far can be found in North Africa(16.4) and especially in South Asia (5.4). Ten ofthe responding countries show staff rates greaterthan 100. Many of the countries ranking highhere will do so due to high incarceration rates,although this is not necessarily the case. Most ofthe countries ranking high are countries fromEurope and the Americas. On the other hand,among the countries with the lowest rates,countries from Asia clearly dominate. Prisonstaff rates have been increasing in the last years,if looking at the general trend. The medianaverage annual change rate is 1.2 %, the mean 1.9%, the standard deviation 4.1 percentage points.Accordingly, there are some countries with verystrong increases (more than 10 % per year) overlong periods of time. There are no countries withcomparably strong decreases.
Productivity
Regarding criminal justice system performance,the indicators the UN CTS data provide aresomewhat limited. Estimates can be made byconnecting data on criminal justice personnelwith the data on offenders they have to dealwith: Quantitative productivity defined as therelation between personnel strength and theoutput produced. In this section, we focused onthe police and prosecution service, looking at the“products” persons suspected per police officer,persons prosecuted per prosecutor, personsbrought before the court per prosecutor andpersons convicted per prosecutor.
Regarding the ratio persons suspected per policeofficer, it should be noted that there is no linearrelationship between police personnel rates andthe rate of suspects produced (corr. 0.02). Morepolice officers will not necessarily produce ahigher output. There is also no clear relationshipbetween police productivity and the region acountry is located in, although countries rankinglowest on the police productivity scale are mostlyfrom Latin America and Asia. The number of
suspects as a system produced value is also lessdependent on the population size than is thenumber of police officers (corr. 0.59). As a result,the ratio of suspects per police officer is subjectto remarkable variation, with a median of 2.4, amean of 5.2 and a standard deviation of 8.0. Theminimum is 0.1, the maximum 46.0.
The rate of persons prosecuted per prosecutor isvarying strongly, too: The median is 82.6 personsprosecuted, the mean 194.0 and the standarddeviation 262.3. The minimum is 4.1, themaximum 1057.9. As with the suspects per policeofficer rates, these values do not mean very muchif compared directly across countries. Once againthis is due to the differences between criminaljustice systems and differences in statisticalrecording. In addition, the definition used forpersons prosecuted in the UN CTS is ambiguous,because official charge might be understood tomean all persons officially prosecuted, but mightalso alternatively be understood to mean personsindicted. Accordingly, there is no linearrelationship between the number of persons
132
prosecuted and the number of prosecutionpersonnel (corr. 0.12). There is also once againno clear relationship between the region inwhich a country is located and the quantitativeproductivity of the prosecution service. However,many of the countries from Asia and all fromEurope below the 1st Quartile are countries witha socialist past, i.e. also countries with arelatively high rate of prosecutors. Tasks ofprosecutors in these countries might be broader,thus reducing the quantitative productivity.
The distribution of the ratio of persons broughtbefore a court per prosecutor ratios is quitesimilar to the distribution that can be found forpersons prosecuted per prosecutor as regardsmean, median, standard deviation, minimumand maximum. The correlation between the rateof persons prosecuted and the rate of personsbrought before a court is 0.87. Additionally, thetest ratio of persons brought before a court perpersons prosecuted is exactly 1 in the median,the mean is 1.3. However, the interpretation ofboth variables seems to differ across countries.These results indicate problems related to thequality and the comprehensibility of thesedefinitions, although the majority ofrespondents seem to understand both variablesalmost synonymously.
For the ratio of persons convicted per prosecutor,pronounced differences can once again be found,with a median of 44.3 convictions per prosecutor,a mean of 97.1 and a standard deviation of 138.6.Accordingly, the distribution is wide ranged witha minimum of 2.3 and a maximum of 654.9.There is also no linear relationship betweenprosecution personnel rates and conviction rates
(corr. 0.02). However, the relationship betweenquantitative productivity and the region acountry is located in seems to be morepronounced: While below the 1st Quartile almostall countries are located in Asia, Latin Americaand the Caribbean, above the 3rd Quartile mostcountries are located in Europe.
The interrelation of the three ratios personssuspected per police officer, persons prosecutedper prosecutor and persons convicted perprosecutor was analyzed, too. Correlations are0.45 for suspects ratio by persons prosecutedratio, 0.65 for suspects ratio by persons convictedratio and 0.66 for persons prosecuted ratio bypersons convicted ratio. Therefore, systems witha high quantitative productivity with respect toone of these measures also tend to have a highquantitative productivity with respect to theother two measures. We calculated a combinedproductivity measure based on these three ratios(see table 5 in the Annex). This is, however, still ameasure for quantitative productivity, not forquality of the output or work of a criminal justicesystem.
As regards the overall performance of criminaljustice systems in international perspective, UNCTS data is not able to provide a valid answer.Such an overall assessment would necessarilymean an in depth look at the criminal justicesystems of the different countries in theory andpractice. And even with sufficient knowledge onall criminal justice systems of the world it wouldbe a very ambitious task to translate thisknowledge into a handy performance index,allowing for a ranking of countries based on thequality of criminal justice performance.
Punitivity
Finally, this chapter focused on the punitivity ofthe system in the meaning of the severity of theresponse to criminal offending. Systemicpunitivity was estimated by the ratio between therate of sentenced persons incarcerated and therate of persons convicted. Punitivity ratios werecalculated, with remarkable variation in theresults produced this way. The median ratio is0.23, the mean 0.92. The standard deviation is2.56 with a minimum of 0.01 and a maximum of19.83. The results for countries ranking extremelyhigh for this ratio need, however, be interpretedwith care: Results much above 1 needjustification and explanation.
Most of the countries ranking lowest for thepunitivity ratio are located in Europe, while mosthigh ranking countries can be found in Asia,
Latin America and the Caribbean. Since thepunitivity ratio calculated here gives only anestimate of the “real” punitivity of a system, itsquality was tested against other measures ofpunitivity, taken from the European Sourcebookof Crime and Criminal Justice Statistics (Aebi etal. 2010) and from EU ICS and ICVS data (takenfrom: van Dijk, van Kesteren, Smit 2007 149).Results show that we have a good measure ofsystemic punitivity that is highly correlated withpunitivity measures taken from the ESB,especially the percentage of sentences longerthan one year in all convictions (corr. 0.92) andthe percentage of unsuspended theft sentencesover one year in the total of theft convictions(corr. 0.89). The correlation with long robberysentences above two years is weaker, though not
,
133
International Statistics on Crime and Criminal Justice
Cri
min
al Ju
stic
e Sy
stem
irrelevant (0.46). There is only a weakinterrelation with the punitivity of the generalpublic, as measured by ICVS and EU ICS data(corr. 0.20). Two out of three systemic punitivitymeasures taken from the ESB are also notcorrelated with public opinion, long sentencestotal (corr. 0.03) and long theft sentences (corr.0.01). Only the punishment for more severe
offences seems to be more strongly connected
with public opinion (corr. 0.39 for long robberysentences).
These findings support other research resultsthat show that the interrelations between publicopinion, lawmaking and legal practice withrespect to punitivity are complex (Green 2008).
ReferencesAebi M 2008. Measuring the Influence of Statistical
Counting Rules on Cross National Differences inRecorded Crime. In Aromaa K, Heiskanen M (eds.),Crime and Criminal Justice Systems in Europe andNorth America 1995–2004. Helsinki: HEUNI: 200 –218.
Aebi M Aromaa K, Aubusson de Cavarlay B, Barclay G,Gruszczynska B, Hofer H von, Hysi V, Jehle J M,Killias M, Smit P, Tavares C 2003. EuropeanSourcebook of Crime and Criminal Justice Statistics– 2003, 2nd edition. Den Haag: Boom.
Aromaa K, Aubusson de Cavarlay B, Barclay G,Gruszczynska, Hofer H von, Hysi V, Jehle J M,Killias M, Smit P, Tavares C 2006. EuropeanSourcebook of Crime and Criminal Justice Statistics– 2006, 3rd edition. Den Haag: Boom.
Aebi M Aubusson de Cavarlay B, Barclay G,Gruszczynska B, Harrendorf S, Heiskanen M, HysiV, Jaquier V, Jehle J M, Killias M, Shostko O, Smit P,Thorisdottir R 2010. European Sourcebook of Crimeand Criminal Justice Statistics – 2010, 4th edition.Den Haag: Boom.
Council of Europe (ed.) 2000. European sourcebook ofcrime and criminal justice statistics. Strasbourg:Council of Europe.
van Dijk J, van Kesteren J, Smit P 2007. CriminalVictimisation in International Perspective. Keyfindings from the 2004 – 2005 ICVS and EU ICS.Den Haag: Boom.
Elsner B, Lewis C, Zila J 2008. Police ProsecutionService Relationship within Criminal Investigation.European Journal of Criminal Policy and Research,14.2 3: 203 – 224.
Elsner B, Smit P, Zila J 2008. Police Case endingPossibilities within Criminal Investigations.European Journal of Criminal Policy and Research,14.2 3: 191 – 201.
Ferdinand T N, Kury H 2008. Punitivity in the UnitedStates. In Kury H, Ferdinand T N (eds.),
International Perspectives on Punitivity. Bochum:Universitätsverlag Brockmeyer: 79 – 105.
Green D A 2008. When Children Kill Children, Penalpopulism and political culture. New York: OxfordUniversity Press.
Gruszczynska B, Marshall I H 2008. Trends in CriminalJustice System Resources 1995 – 2004. In Aromaa K,Heiskanen M (eds.), Crime and Criminal JusticeSystems in Europe and North America 1995 – 2004.Helsinki: HEUNI: 9 – 52.
Jehle J M 2000. Prosecutions in Europe: Varyingstructures, convergent trends. European Journal ofCriminal Policy and Research, 8.1: 3 – 12.
Kury H, Ferdinand T N 2008. Punitivity. AnIntroduction. In Kury H, Ferdinand T N (eds.),International Perspectives on Punitivity. Bochum:Universitätsverlag Brockmeyer: 1 – 12.
Kury H, Ferdinand T N, Obergfell Fuchs J 2008.Punitivity in Germany: Attitudes to Punishment,Sentencing, and Prison Rates. In Kury H, FerdinandT N (eds.), International Perspectives on Punitivity.Bochum: Universitätsverlag Brockmeyer: 107 – 137.
Marshall I H 1998. Operation of the Criminal JusticeSystem. In Kangaspunta K, Joutsen M, Ollus N(eds.), Crime and Criminal Justice Systems inEurope and North America, 1990 – 1994. Helsinki:HEUNI: 54 – 114.
Mayhew P 2003. The Operation of Criminal JusticeSystems. In Aromaa K, Leppä S, Nevala S, Ollus N(eds.) Crime and Criminal Justice in Europe andNorth America 1995–1997, Report on the SixthUnited Nations Survey on Crime Trends andCriminal Justice Systems. Helsinki: HEUNI: 84 – 149.
Smit P 2008. Prosecution and Courts. In Aromaa K,Heiskanen M (eds.), Crime and Criminal JusticeSystems in Europe and North America 1995 – 2004.Helsinki: HEUNI: 94 – 117.
Smit P 2009. Nederland in internationaal perspectief(the Netherlands in International Perspective). In
F
F,
Aebi MF,
F,
134
Kalidien S N, Eggen A Th J (eds.), Criminaliteit enRechtshandhaving 2008. Den Haag: Boom: 261 –282.
Smit P, Harrendorf S 2010. Responses of the CriminalJustice System (in this publication, chapter 5).
Statistisches Bundesamt (ed.) 2007. AusgewählteZahlen für die Rechtspflege 2006. Wiesbaden:Statistisches Bundesamt.
Statistisches Bundesamt (ed.) 2008. AusgewählteZahlen für die Rechtspflege 2007. Wiesbaden:Statistisches Bundesamt.
Wade M 2006. The Power to Decide – ProsecutorialControl, Diversion and Punishment in EuropeanCriminal Justice Systems Today. In Jehle J M, WadeM (eds.), Coping with Overloaded Criminal Justice
Systems, The Rise of Prosecutorial Power acrossEurope. Berlin, Heidelberg: Springer:27 – 126.
Wade M, Aebi M Aubusson de Cavarlay B, Balcells M,Gilliéron G, Hakeri H, Killias M, Lewis C, Roth E,Smit P, Sobota P, Turkovic K, Zila J 2008. When theLine is Crossed... Paths to Control and SanctionBehaviour Necessitating a State Reaction. EuropeanJournal on Criminal Policy and Research, 14.2 3: 101– 122.
Wade M, Smit P, Aubusson de Cavarlay B 2008. TheProsecution Role where Courts Decide Cases. InEuropean Journal on Criminal Policy and Research,14.2 3: 133 – 143.
Walmsley R 2010. Trends in world prison population(in this publication, chapter 7).
F,
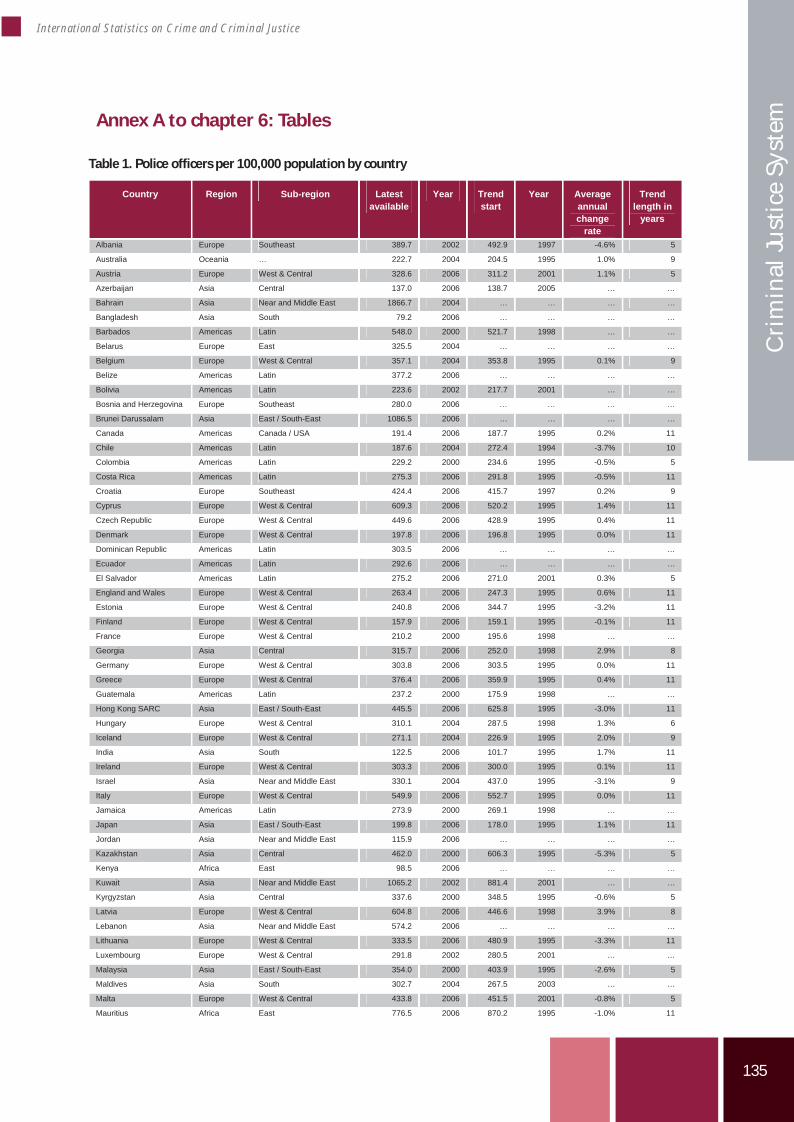
135
International Statistics on Crime and Criminal Justice
Cri
min
al Ju
stic
e Sy
stem
Annex A to chapter 6: Tables
Table 1. Police officers per 100,000 population by country
Country Region Sub-region Latestavailable
Year Trend start
Year Average annual change
rate
Trend length in
years
Albania Europe Southeast 389.7 2002 492.9 1997 -4.6% 5
Australia Oceania … 222.7 2004 204.5 1995 1.0% 9
Austria Europe West & Central 328.6 2006 311.2 2001 1.1% 5
Azerbaijan Asia Central 137.0 2006 138.7 2005 … …
Bahrain Asia Near and Middle East 1866.7 2004 … … … …
Bangladesh Asia South 79.2 2006 … … … …
Barbados Americas Latin 548.0 2000 521.7 1998 … …
Belarus Europe East 325.5 2004 … … … …
Belgium Europe West & Central 357.1 2004 353.8 1995 0.1% 9
Belize Americas Latin 377.2 2006 … … … …
Bolivia Americas Latin 223.6 2002 217.7 2001 … …
Bosnia and Herzegovina Europe Southeast 280.0 2006 … … … …
Brunei Darussalam Asia East / South-East 1086.5 2006 … … … …
Canada Americas Canada / USA 191.4 2006 187.7 1995 0.2% 11
Chile Americas Latin 187.6 2004 272.4 1994 -3.7% 10
Colombia Americas Latin 229.2 2000 234.6 1995 -0.5% 5
Costa Rica Americas Latin 275.3 2006 291.8 1995 -0.5% 11
Croatia Europe Southeast 424.4 2006 415.7 1997 0.2% 9
Cyprus Europe West & Central 609.3 2006 520.2 1995 1.4% 11
Czech Republic Europe West & Central 449.6 2006 428.9 1995 0.4% 11
Denmark Europe West & Central 197.8 2006 196.8 1995 0.0% 11
Dominican Republic Americas Latin 303.5 2006 … … … …
Ecuador Americas Latin 292.6 2006 … … … …
El Salvador Americas Latin 275.2 2006 271.0 2001 0.3% 5
England and Wales Europe West & Central 263.4 2006 247.3 1995 0.6% 11
Estonia Europe West & Central 240.8 2006 344.7 1995 -3.2% 11
Finland Europe West & Central 157.9 2006 159.1 1995 -0.1% 11
France Europe West & Central 210.2 2000 195.6 1998 … …
Georgia Asia Central 315.7 2006 252.0 1998 2.9% 8
Germany Europe West & Central 303.8 2006 303.5 1995 0.0% 11
Greece Europe West & Central 376.4 2006 359.9 1995 0.4% 11
Guatemala Americas Latin 237.2 2000 175.9 1998 … …
Hong Kong SARC Asia East / South-East 445.5 2006 625.8 1995 -3.0% 11
Hungary Europe West & Central 310.1 2004 287.5 1998 1.3% 6
Iceland Europe West & Central 271.1 2004 226.9 1995 2.0% 9
India Asia South 122.5 2006 101.7 1995 1.7% 11
Ireland Europe West & Central 303.3 2006 300.0 1995 0.1% 11
Israel Asia Near and Middle East 330.1 2004 437.0 1995 -3.1% 9
Italy Europe West & Central 549.9 2006 552.7 1995 0.0% 11
Jamaica Americas Latin 273.9 2000 269.1 1998 … …
Japan Asia East / South-East 199.8 2006 178.0 1995 1.1% 11
Jordan Asia Near and Middle East 115.9 2006 … … … …
Kazakhstan Asia Central 462.0 2000 606.3 1995 -5.3% 5
Kenya Africa East 98.5 2006 … … … …
Kuwait Asia Near and Middle East 1065.2 2002 881.4 2001 … …
Kyrgyzstan Asia Central 337.6 2000 348.5 1995 -0.6% 5
Latvia Europe West & Central 604.8 2006 446.6 1998 3.9% 8
Lebanon Asia Near and Middle East 574.2 2006 … … … …
Lithuania Europe West & Central 333.5 2006 480.9 1995 -3.3% 11
Luxembourg Europe West & Central 291.8 2002 280.5 2001 … …
Malaysia Asia East / South-East 354.0 2000 403.9 1995 -2.6% 5
Maldives Asia South 302.7 2004 267.5 2003 … …
Malta Europe West & Central 433.8 2006 451.5 2001 -0.8% 5
Mauritius Africa East 776.5 2006 870.2 1995 -1.0% 11
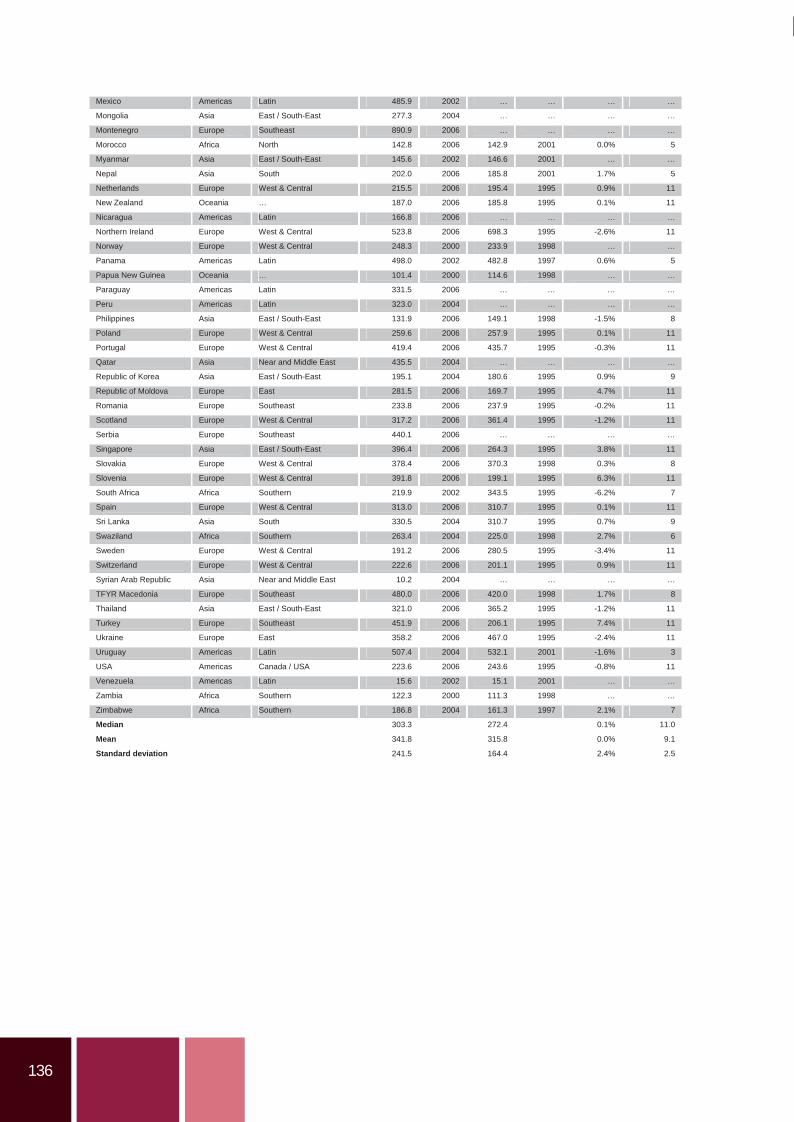
136
Mexico Americas Latin 485.9 2002 … … … …
Mongolia Asia East / South-East 277.3 2004 … … … …
Montenegro Europe Southeast 890.9 2006 … … … …
Morocco Africa North 142.8 2006 142.9 2001 0.0% 5
Myanmar Asia East / South-East 145.6 2002 146.6 2001 … …
Nepal Asia South 202.0 2006 185.8 2001 1.7% 5
Netherlands Europe West & Central 215.5 2006 195.4 1995 0.9% 11
New Zealand Oceania … 187.0 2006 185.8 1995 0.1% 11
Nicaragua Americas Latin 166.8 2006 … … … …
Northern Ireland Europe West & Central 523.8 2006 698.3 1995 -2.6% 11
Norway Europe West & Central 248.3 2000 233.9 1998 … …
Panama Americas Latin 498.0 2002 482.8 1997 0.6% 5
Papua New Guinea Oceania … 101.4 2000 114.6 1998 … …
Paraguay Americas Latin 331.5 2006 … … … …
Peru Americas Latin 323.0 2004 … … … …
Philippines Asia East / South-East 131.9 2006 149.1 1998 -1.5% 8
Poland Europe West & Central 259.6 2006 257.9 1995 0.1% 11
Portugal Europe West & Central 419.4 2006 435.7 1995 -0.3% 11
Qatar Asia Near and Middle East 435.5 2004 … … … …
Republic of Korea Asia East / South-East 195.1 2004 180.6 1995 0.9% 9
Republic of Moldova Europe East 281.5 2006 169.7 1995 4.7% 11
Romania Europe Southeast 233.8 2006 237.9 1995 -0.2% 11
Scotland Europe West & Central 317.2 2006 361.4 1995 -1.2% 11
Serbia Europe Southeast 440.1 2006 … … … …
Singapore Asia East / South-East 396.4 2006 264.3 1995 3.8% 11
Slovakia Europe West & Central 378.4 2006 370.3 1998 0.3% 8
Slovenia Europe West & Central 391.8 2006 199.1 1995 6.3% 11
South Africa Africa Southern 219.9 2002 343.5 1995 -6.2% 7
Spain Europe West & Central 313.0 2006 310.7 1995 0.1% 11
Sri Lanka Asia South 330.5 2004 310.7 1995 0.7% 9
Swaziland Africa Southern 263.4 2004 225.0 1998 2.7% 6
Sweden Europe West & Central 191.2 2006 280.5 1995 -3.4% 11
Switzerland Europe West & Central 222.6 2006 201.1 1995 0.9% 11
Syrian Arab Republic Asia Near and Middle East 10.2 2004 … … … …
TFYR Macedonia Europe Southeast 480.0 2006 420.0 1998 1.7% 8
Thailand Asia East / South-East 321.0 2006 365.2 1995 -1.2% 11
Turkey Europe Southeast 451.9 2006 206.1 1995 7.4% 11
Ukraine Europe East 358.2 2006 467.0 1995 -2.4% 11
Uruguay Americas Latin 507.4 2004 532.1 2001 -1.6% 3
USA Americas Canada / USA 223.6 2006 243.6 1995 -0.8% 11
Venezuela Americas Latin 15.6 2002 15.1 2001 … …
Zambia Africa Southern 122.3 2000 111.3 1998 … …
Zimbabwe Africa Southern 186.8 2004 161.3 1997 2.1% 7
Median 303.3 272.4 0.1% 11.0
Mean 341.8 315.8 0.0% 9.1
Standard deviation 241.5 164.4 2.4% 2.5
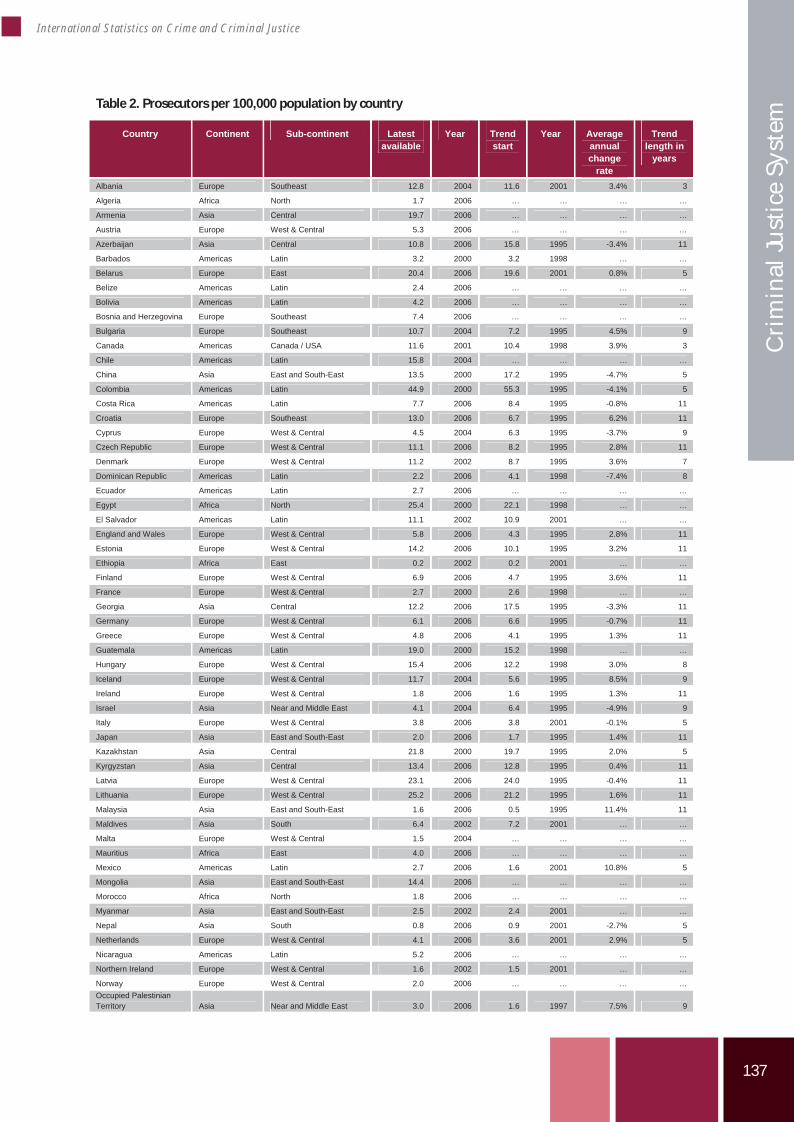
137
International Statistics on Crime and Criminal Justice
Cri
min
al Ju
stic
e Sy
stem
Table 2. Prosecutors per 100,000 population by country
Country Continent Sub-continent Latestavailable
Year Trend start
Year Average annual change
rate
Trend length in
years
Albania Europe Southeast 12.8 2004 11.6 2001 3.4% 3
Algeria Africa North 1.7 2006 … … … …
Armenia Asia Central 19.7 2006 … … … …
Austria Europe West & Central 5.3 2006 … … … …
Azerbaijan Asia Central 10.8 2006 15.8 1995 -3.4% 11
Barbados Americas Latin 3.2 2000 3.2 1998 … …
Belarus Europe East 20.4 2006 19.6 2001 0.8% 5
Belize Americas Latin 2.4 2006 … … … …
Bolivia Americas Latin 4.2 2006 … … … …
Bosnia and Herzegovina Europe Southeast 7.4 2006 … … … …
Bulgaria Europe Southeast 10.7 2004 7.2 1995 4.5% 9
Canada Americas Canada / USA 11.6 2001 10.4 1998 3.9% 3
Chile Americas Latin 15.8 2004 … … … …
China Asia East and South-East 13.5 2000 17.2 1995 -4.7% 5
Colombia Americas Latin 44.9 2000 55.3 1995 -4.1% 5
Costa Rica Americas Latin 7.7 2006 8.4 1995 -0.8% 11
Croatia Europe Southeast 13.0 2006 6.7 1995 6.2% 11
Cyprus Europe West & Central 4.5 2004 6.3 1995 -3.7% 9
Czech Republic Europe West & Central 11.1 2006 8.2 1995 2.8% 11
Denmark Europe West & Central 11.2 2002 8.7 1995 3.6% 7
Dominican Republic Americas Latin 2.2 2006 4.1 1998 -7.4% 8
Ecuador Americas Latin 2.7 2006 … … … …
Egypt Africa North 25.4 2000 22.1 1998 … …
El Salvador Americas Latin 11.1 2002 10.9 2001 … …
England and Wales Europe West & Central 5.8 2006 4.3 1995 2.8% 11
Estonia Europe West & Central 14.2 2006 10.1 1995 3.2% 11
Ethiopia Africa East 0.2 2002 0.2 2001 … …
Finland Europe West & Central 6.9 2006 4.7 1995 3.6% 11
France Europe West & Central 2.7 2000 2.6 1998 … …
Georgia Asia Central 12.2 2006 17.5 1995 -3.3% 11
Germany Europe West & Central 6.1 2006 6.6 1995 -0.7% 11
Greece Europe West & Central 4.8 2006 4.1 1995 1.3% 11
Guatemala Americas Latin 19.0 2000 15.2 1998 … …
Hungary Europe West & Central 15.4 2006 12.2 1998 3.0% 8
Iceland Europe West & Central 11.7 2004 5.6 1995 8.5% 9
Ireland Europe West & Central 1.8 2006 1.6 1995 1.3% 11
Israel Asia Near and Middle East 4.1 2004 6.4 1995 -4.9% 9
Italy Europe West & Central 3.8 2006 3.8 2001 -0.1% 5
Japan Asia East and South-East 2.0 2006 1.7 1995 1.4% 11
Kazakhstan Asia Central 21.8 2000 19.7 1995 2.0% 5
Kyrgyzstan Asia Central 13.4 2006 12.8 1995 0.4% 11
Latvia Europe West & Central 23.1 2006 24.0 1995 -0.4% 11
Lithuania Europe West & Central 25.2 2006 21.2 1995 1.6% 11
Malaysia Asia East and South-East 1.6 2006 0.5 1995 11.4% 11
Maldives Asia South 6.4 2002 7.2 2001 … …
Malta Europe West & Central 1.5 2004 … … … …
Mauritius Africa East 4.0 2006 … … … …
Mexico Americas Latin 2.7 2006 1.6 2001 10.8% 5
Mongolia Asia East and South-East 14.4 2006 … … … …
Morocco Africa North 1.8 2006 … … … …
Myanmar Asia East and South-East 2.5 2002 2.4 2001 … …
Nepal Asia South 0.8 2006 0.9 2001 -2.7% 5
Netherlands Europe West & Central 4.1 2006 3.6 2001 2.9% 5
Nicaragua Americas Latin 5.2 2006 … … … …
Northern Ireland Europe West & Central 1.6 2002 1.5 2001 … …
Norway Europe West & Central 2.0 2006 … … … … Occupied Palestinian Territory Asia Near and Middle East 3.0 2006 1.6 1997 7.5% 9
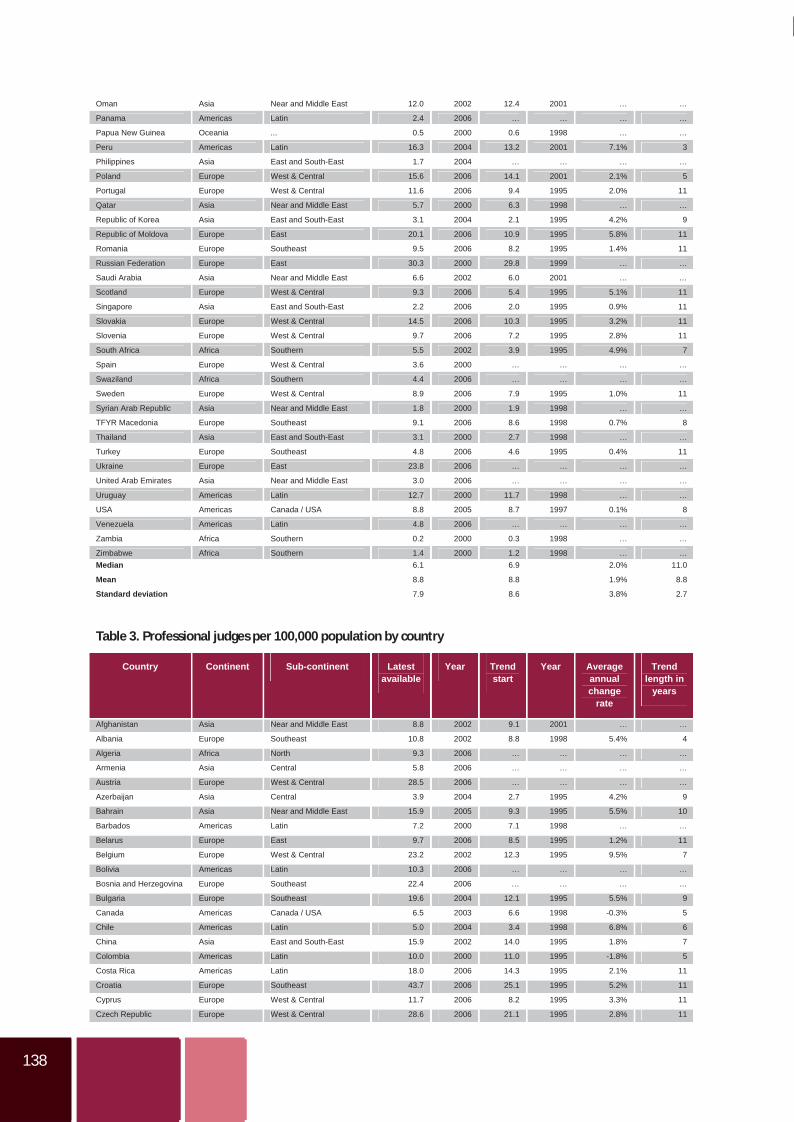
138
138
Oman Asia Near and Middle East 12.0 2002 12.4 2001 … …
Panama Americas Latin 2.4 2006 … … … …
Papua New Guinea Oceania ... 0.5 2000 0.6 1998 … …
Peru Americas Latin 16.3 2004 13.2 2001 7.1% 3
Philippines Asia East and South-East 1.7 2004 … … … …
Poland Europe West & Central 15.6 2006 14.1 2001 2.1% 5
Portugal Europe West & Central 11.6 2006 9.4 1995 2.0% 11
Qatar Asia Near and Middle East 5.7 2000 6.3 1998 … …
Republic of Korea Asia East and South-East 3.1 2004 2.1 1995 4.2% 9
Republic of Moldova Europe East 20.1 2006 10.9 1995 5.8% 11
Romania Europe Southeast 9.5 2006 8.2 1995 1.4% 11
Russian Federation Europe East 30.3 2000 29.8 1999 … …
Saudi Arabia Asia Near and Middle East 6.6 2002 6.0 2001 … …
Scotland Europe West & Central 9.3 2006 5.4 1995 5.1% 11
Singapore Asia East and South-East 2.2 2006 2.0 1995 0.9% 11
Slovakia Europe West & Central 14.5 2006 10.3 1995 3.2% 11
Slovenia Europe West & Central 9.7 2006 7.2 1995 2.8% 11
South Africa Africa Southern 5.5 2002 3.9 1995 4.9% 7
Spain Europe West & Central 3.6 2000 … … … …
Swaziland Africa Southern 4.4 2006 … … … …
Sweden Europe West & Central 8.9 2006 7.9 1995 1.0% 11
Syrian Arab Republic Asia Near and Middle East 1.8 2000 1.9 1998 … …
TFYR Macedonia Europe Southeast 9.1 2006 8.6 1998 0.7% 8
Thailand Asia East and South-East 3.1 2000 2.7 1998 … …
Turkey Europe Southeast 4.8 2006 4.6 1995 0.4% 11
Ukraine Europe East 23.8 2006 … … … …
United Arab Emirates Asia Near and Middle East 3.0 2006 … … … …
Uruguay Americas Latin 12.7 2000 11.7 1998 … …
USA Americas Canada / USA 8.8 2005 8.7 1997 0.1% 8
Venezuela Americas Latin 4.8 2006 … … … …
Zambia Africa Southern 0.2 2000 0.3 1998 … …
Zimbabwe Africa Southern 1.4 2000 1.2 1998 … …Median 6.1 6.9 2.0% 11.0
Mean 8.8 8.8 1.9% 8.8
Standard deviation 7.9 8.6 3.8% 2.7
Table 3. Professional judges per 100,000 population by country
Country Continent Sub-continent Latestavailable
Year Trend start
Year Average annual change
rate
Trend length in
years
Afghanistan Asia Near and Middle East 8.8 2002 9.1 2001 … …
Albania Europe Southeast 10.8 2002 8.8 1998 5.4% 4
Algeria Africa North 9.3 2006 … … … …
Armenia Asia Central 5.8 2006 … … … …
Austria Europe West & Central 28.5 2006 … … … …
Azerbaijan Asia Central 3.9 2004 2.7 1995 4.2% 9
Bahrain Asia Near and Middle East 15.9 2005 9.3 1995 5.5% 10
Barbados Americas Latin 7.2 2000 7.1 1998 … …
Belarus Europe East 9.7 2006 8.5 1995 1.2% 11
Belgium Europe West & Central 23.2 2002 12.3 1995 9.5% 7
Bolivia Americas Latin 10.3 2006 … … … …
Bosnia and Herzegovina Europe Southeast 22.4 2006 … … … …
Bulgaria Europe Southeast 19.6 2004 12.1 1995 5.5% 9
Canada Americas Canada / USA 6.5 2003 6.6 1998 -0.3% 5
Chile Americas Latin 5.0 2004 3.4 1998 6.8% 6
China Asia East and South-East 15.9 2002 14.0 1995 1.8% 7
Colombia Americas Latin 10.0 2000 11.0 1995 -1.8% 5
Costa Rica Americas Latin 18.0 2006 14.3 1995 2.1% 11
Croatia Europe Southeast 43.7 2006 25.1 1995 5.2% 11
Cyprus Europe West & Central 11.7 2006 8.2 1995 3.3% 11
Czech Republic Europe West & Central 28.6 2006 21.1 1995 2.8% 11
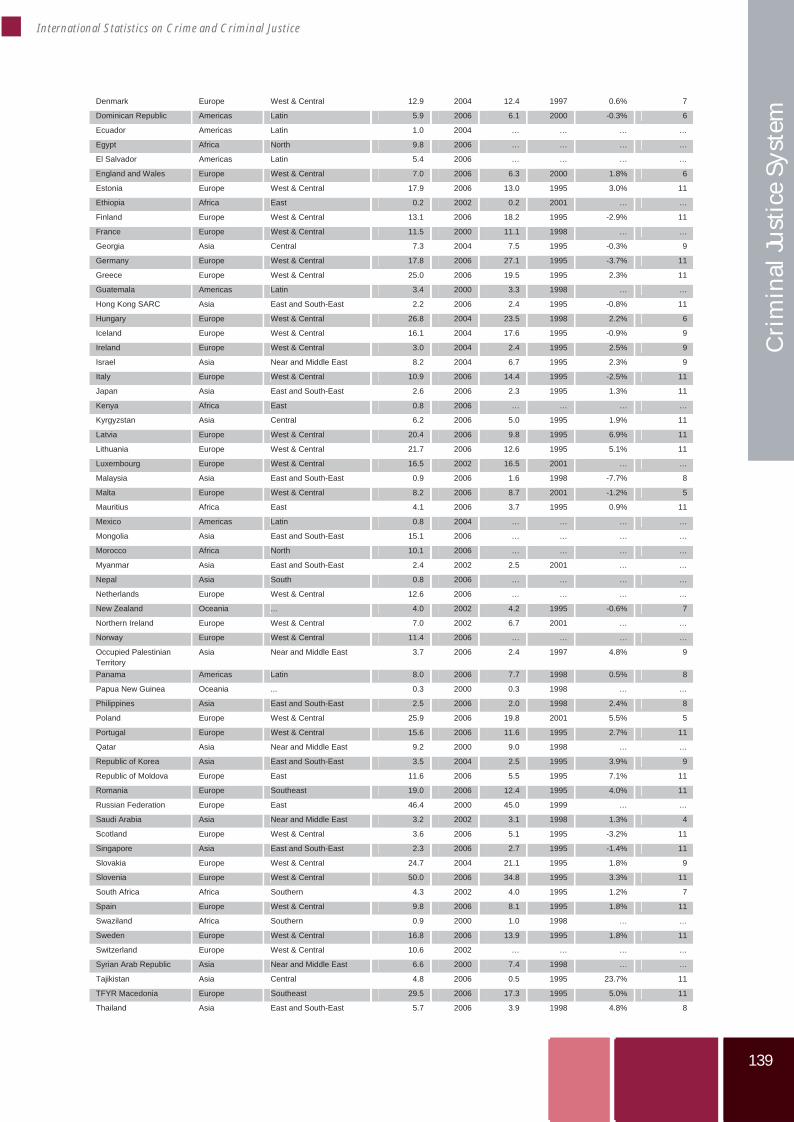
139
139
International Statistics on Crime and Criminal Justice
Cri
min
al Ju
stic
e Sy
stem
Denmark Europe West & Central 12.9 2004 12.4 1997 0.6% 7
Dominican Republic Americas Latin 5.9 2006 6.1 2000 -0.3% 6
Ecuador Americas Latin 1.0 2004 … … … …
Egypt Africa North 9.8 2006 … … … …
El Salvador Americas Latin 5.4 2006 … … … …
England and Wales Europe West & Central 7.0 2006 6.3 2000 1.8% 6
Estonia Europe West & Central 17.9 2006 13.0 1995 3.0% 11
Ethiopia Africa East 0.2 2002 0.2 2001 … …
Finland Europe West & Central 13.1 2006 18.2 1995 -2.9% 11
France Europe West & Central 11.5 2000 11.1 1998 … …
Georgia Asia Central 7.3 2004 7.5 1995 -0.3% 9
Germany Europe West & Central 17.8 2006 27.1 1995 -3.7% 11
Greece Europe West & Central 25.0 2006 19.5 1995 2.3% 11
Guatemala Americas Latin 3.4 2000 3.3 1998 … …
Hong Kong SARC Asia East and South-East 2.2 2006 2.4 1995 -0.8% 11
Hungary Europe West & Central 26.8 2004 23.5 1998 2.2% 6
Iceland Europe West & Central 16.1 2004 17.6 1995 -0.9% 9
Ireland Europe West & Central 3.0 2004 2.4 1995 2.5% 9
Israel Asia Near and Middle East 8.2 2004 6.7 1995 2.3% 9
Italy Europe West & Central 10.9 2006 14.4 1995 -2.5% 11
Japan Asia East and South-East 2.6 2006 2.3 1995 1.3% 11
Kenya Africa East 0.8 2006 … … … …
Kyrgyzstan Asia Central 6.2 2006 5.0 1995 1.9% 11
Latvia Europe West & Central 20.4 2006 9.8 1995 6.9% 11
Lithuania Europe West & Central 21.7 2006 12.6 1995 5.1% 11
Luxembourg Europe West & Central 16.5 2002 16.5 2001 … …
Malaysia Asia East and South-East 0.9 2006 1.6 1998 -7.7% 8
Malta Europe West & Central 8.2 2006 8.7 2001 -1.2% 5
Mauritius Africa East 4.1 2006 3.7 1995 0.9% 11
Mexico Americas Latin 0.8 2004 … … … …
Mongolia Asia East and South-East 15.1 2006 … … … …
Morocco Africa North 10.1 2006 … … … …
Myanmar Asia East and South-East 2.4 2002 2.5 2001 … …
Nepal Asia South 0.8 2006 … … … …
Netherlands Europe West & Central 12.6 2006 … … … …
New Zealand Oceania ... 4.0 2002 4.2 1995 -0.6% 7
Northern Ireland Europe West & Central 7.0 2002 6.7 2001 … …
Norway Europe West & Central 11.4 2006 … … … …
Occupied Palestinian Territory
Asia Near and Middle East 3.7 2006 2.4 1997 4.8% 9
Panama Americas Latin 8.0 2006 7.7 1998 0.5% 8
Papua New Guinea Oceania ... 0.3 2000 0.3 1998 … …
Philippines Asia East and South-East 2.5 2006 2.0 1998 2.4% 8
Poland Europe West & Central 25.9 2006 19.8 2001 5.5% 5
Portugal Europe West & Central 15.6 2006 11.6 1995 2.7% 11
Qatar Asia Near and Middle East 9.2 2000 9.0 1998 … …
Republic of Korea Asia East and South-East 3.5 2004 2.5 1995 3.9% 9
Republic of Moldova Europe East 11.6 2006 5.5 1995 7.1% 11
Romania Europe Southeast 19.0 2006 12.4 1995 4.0% 11
Russian Federation Europe East 46.4 2000 45.0 1999 … …
Saudi Arabia Asia Near and Middle East 3.2 2002 3.1 1998 1.3% 4
Scotland Europe West & Central 3.6 2006 5.1 1995 -3.2% 11
Singapore Asia East and South-East 2.3 2006 2.7 1995 -1.4% 11
Slovakia Europe West & Central 24.7 2004 21.1 1995 1.8% 9
Slovenia Europe West & Central 50.0 2006 34.8 1995 3.3% 11
South Africa Africa Southern 4.3 2002 4.0 1995 1.2% 7
Spain Europe West & Central 9.8 2006 8.1 1995 1.8% 11
Swaziland Africa Southern 0.9 2000 1.0 1998 … …
Sweden Europe West & Central 16.8 2006 13.9 1995 1.8% 11
Switzerland Europe West & Central 10.6 2002 … … … …
Syrian Arab Republic Asia Near and Middle East 6.6 2000 7.4 1998 … …
Tajikistan Asia Central 4.8 2006 0.5 1995 23.7% 11
TFYR Macedonia Europe Southeast 29.5 2006 17.3 1995 5.0% 11
Thailand Asia East and South-East 5.7 2006 3.9 1998 4.8% 8
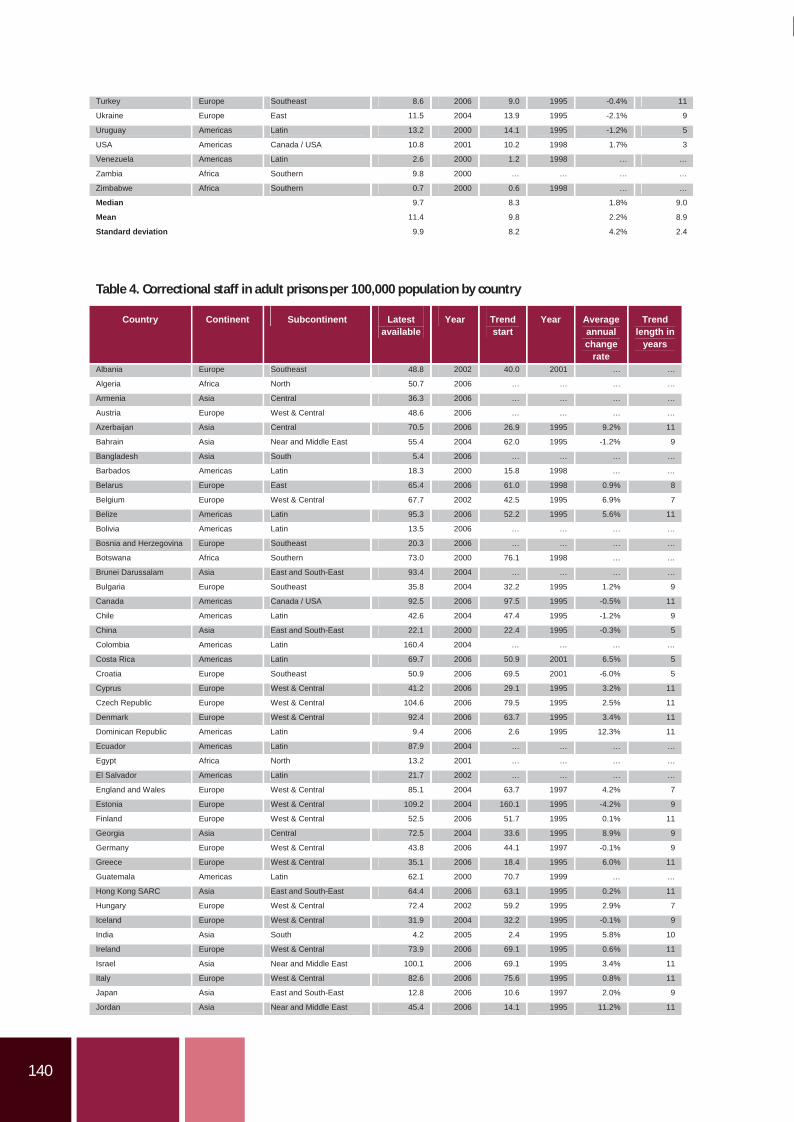
140
Turkey Europe Southeast 8.6 2006 9.0 1995 -0.4% 11
Ukraine Europe East 11.5 2004 13.9 1995 -2.1% 9
Uruguay Americas Latin 13.2 2000 14.1 1995 -1.2% 5
USA Americas Canada / USA 10.8 2001 10.2 1998 1.7% 3
Venezuela Americas Latin 2.6 2000 1.2 1998 … …
Zambia Africa Southern 9.8 2000 … … … …
Zimbabwe Africa Southern 0.7 2000 0.6 1998 … …
Median 9.7 8.3 1.8% 9.0
Mean 11.4 9.8 2.2% 8.9
Standard deviation 9.9 8.2 4.2% 2.4
Table 4. Correctional staff in adult prisons per 100,000 population by country
Country Continent Subcontinent Latestavailable
Year Trend start
Year Average annual change
rate
Trend length in
years
Albania Europe Southeast 48.8 2002 40.0 2001 … …
Algeria Africa North 50.7 2006 … … … …
Armenia Asia Central 36.3 2006 … … … …
Austria Europe West & Central 48.6 2006 … … … …
Azerbaijan Asia Central 70.5 2006 26.9 1995 9.2% 11
Bahrain Asia Near and Middle East 55.4 2004 62.0 1995 -1.2% 9
Bangladesh Asia South 5.4 2006 … … … …
Barbados Americas Latin 18.3 2000 15.8 1998 … …
Belarus Europe East 65.4 2006 61.0 1998 0.9% 8
Belgium Europe West & Central 67.7 2002 42.5 1995 6.9% 7
Belize Americas Latin 95.3 2006 52.2 1995 5.6% 11
Bolivia Americas Latin 13.5 2006 … … … …
Bosnia and Herzegovina Europe Southeast 20.3 2006 … … … …
Botswana Africa Southern 73.0 2000 76.1 1998 … …
Brunei Darussalam Asia East and South-East 93.4 2004 … … … …
Bulgaria Europe Southeast 35.8 2004 32.2 1995 1.2% 9
Canada Americas Canada / USA 92.5 2006 97.5 1995 -0.5% 11
Chile Americas Latin 42.6 2004 47.4 1995 -1.2% 9
China Asia East and South-East 22.1 2000 22.4 1995 -0.3% 5
Colombia Americas Latin 160.4 2004 … … … …
Costa Rica Americas Latin 69.7 2006 50.9 2001 6.5% 5
Croatia Europe Southeast 50.9 2006 69.5 2001 -6.0% 5
Cyprus Europe West & Central 41.2 2006 29.1 1995 3.2% 11
Czech Republic Europe West & Central 104.6 2006 79.5 1995 2.5% 11
Denmark Europe West & Central 92.4 2006 63.7 1995 3.4% 11
Dominican Republic Americas Latin 9.4 2006 2.6 1995 12.3% 11
Ecuador Americas Latin 87.9 2004 … … … …
Egypt Africa North 13.2 2001 … … … …
El Salvador Americas Latin 21.7 2002 … … … …
England and Wales Europe West & Central 85.1 2004 63.7 1997 4.2% 7
Estonia Europe West & Central 109.2 2004 160.1 1995 -4.2% 9
Finland Europe West & Central 52.5 2006 51.7 1995 0.1% 11
Georgia Asia Central 72.5 2004 33.6 1995 8.9% 9
Germany Europe West & Central 43.8 2006 44.1 1997 -0.1% 9
Greece Europe West & Central 35.1 2006 18.4 1995 6.0% 11
Guatemala Americas Latin 62.1 2000 70.7 1999 … …
Hong Kong SARC Asia East and South-East 64.4 2006 63.1 1995 0.2% 11
Hungary Europe West & Central 72.4 2002 59.2 1995 2.9% 7
Iceland Europe West & Central 31.9 2004 32.2 1995 -0.1% 9
India Asia South 4.2 2005 2.4 1995 5.8% 10
Ireland Europe West & Central 73.9 2006 69.1 1995 0.6% 11
Israel Asia Near and Middle East 100.1 2006 69.1 1995 3.4% 11
Italy Europe West & Central 82.6 2006 75.6 1995 0.8% 11
Japan Asia East and South-East 12.8 2006 10.6 1997 2.0% 9
Jordan Asia Near and Middle East 45.4 2006 14.1 1995 11.2% 11
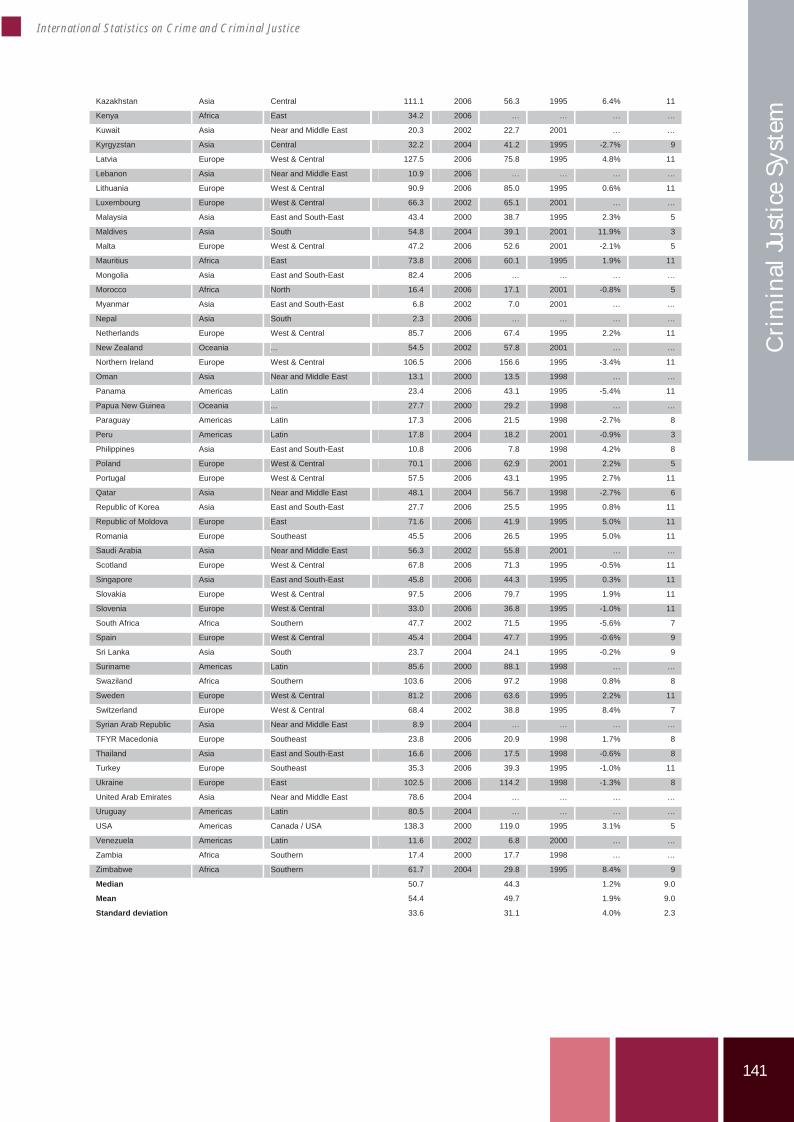
141
International Statistics on Crime and Criminal Justice
Cri
min
al Ju
stic
e Sy
stem
Kazakhstan Asia Central 111.1 2006 56.3 1995 6.4% 11
Kenya Africa East 34.2 2006 … … … …
Kuwait Asia Near and Middle East 20.3 2002 22.7 2001 … …
Kyrgyzstan Asia Central 32.2 2004 41.2 1995 -2.7% 9
Latvia Europe West & Central 127.5 2006 75.8 1995 4.8% 11
Lebanon Asia Near and Middle East 10.9 2006 … … … …
Lithuania Europe West & Central 90.9 2006 85.0 1995 0.6% 11
Luxembourg Europe West & Central 66.3 2002 65.1 2001 … …
Malaysia Asia East and South-East 43.4 2000 38.7 1995 2.3% 5
Maldives Asia South 54.8 2004 39.1 2001 11.9% 3
Malta Europe West & Central 47.2 2006 52.6 2001 -2.1% 5
Mauritius Africa East 73.8 2006 60.1 1995 1.9% 11
Mongolia Asia East and South-East 82.4 2006 … … … …
Morocco Africa North 16.4 2006 17.1 2001 -0.8% 5
Myanmar Asia East and South-East 6.8 2002 7.0 2001 … …
Nepal Asia South 2.3 2006 … … … …
Netherlands Europe West & Central 85.7 2006 67.4 1995 2.2% 11
New Zealand Oceania ... 54.5 2002 57.8 2001 … …
Northern Ireland Europe West & Central 106.5 2006 156.6 1995 -3.4% 11
Oman Asia Near and Middle East 13.1 2000 13.5 1998 … …
Panama Americas Latin 23.4 2006 43.1 1995 -5.4% 11
Papua New Guinea Oceania ... 27.7 2000 29.2 1998 … …
Paraguay Americas Latin 17.3 2006 21.5 1998 -2.7% 8
Peru Americas Latin 17.8 2004 18.2 2001 -0.9% 3
Philippines Asia East and South-East 10.8 2006 7.8 1998 4.2% 8
Poland Europe West & Central 70.1 2006 62.9 2001 2.2% 5
Portugal Europe West & Central 57.5 2006 43.1 1995 2.7% 11
Qatar Asia Near and Middle East 48.1 2004 56.7 1998 -2.7% 6
Republic of Korea Asia East and South-East 27.7 2006 25.5 1995 0.8% 11
Republic of Moldova Europe East 71.6 2006 41.9 1995 5.0% 11
Romania Europe Southeast 45.5 2006 26.5 1995 5.0% 11
Saudi Arabia Asia Near and Middle East 56.3 2002 55.8 2001 … …
Scotland Europe West & Central 67.8 2006 71.3 1995 -0.5% 11
Singapore Asia East and South-East 45.8 2006 44.3 1995 0.3% 11
Slovakia Europe West & Central 97.5 2006 79.7 1995 1.9% 11
Slovenia Europe West & Central 33.0 2006 36.8 1995 -1.0% 11
South Africa Africa Southern 47.7 2002 71.5 1995 -5.6% 7
Spain Europe West & Central 45.4 2004 47.7 1995 -0.6% 9
Sri Lanka Asia South 23.7 2004 24.1 1995 -0.2% 9
Suriname Americas Latin 85.6 2000 88.1 1998 … …
Swaziland Africa Southern 103.6 2006 97.2 1998 0.8% 8
Sweden Europe West & Central 81.2 2006 63.6 1995 2.2% 11
Switzerland Europe West & Central 68.4 2002 38.8 1995 8.4% 7
Syrian Arab Republic Asia Near and Middle East 8.9 2004 … … … …
TFYR Macedonia Europe Southeast 23.8 2006 20.9 1998 1.7% 8
Thailand Asia East and South-East 16.6 2006 17.5 1998 -0.6% 8
Turkey Europe Southeast 35.3 2006 39.3 1995 -1.0% 11
Ukraine Europe East 102.5 2006 114.2 1998 -1.3% 8
United Arab Emirates Asia Near and Middle East 78.6 2004 … … … …
Uruguay Americas Latin 80.5 2004 … … … …
USA Americas Canada / USA 138.3 2000 119.0 1995 3.1% 5
Venezuela Americas Latin 11.6 2002 6.8 2000 … …
Zambia Africa Southern 17.4 2000 17.7 1998 … …
Zimbabwe Africa Southern 61.7 2004 29.8 1995 8.4% 9
Median 50.7 44.3 1.2% 9.0
Mean 54.4 49.7 1.9% 9.0
Standard deviation 33.6 31.1 4.0% 2.3
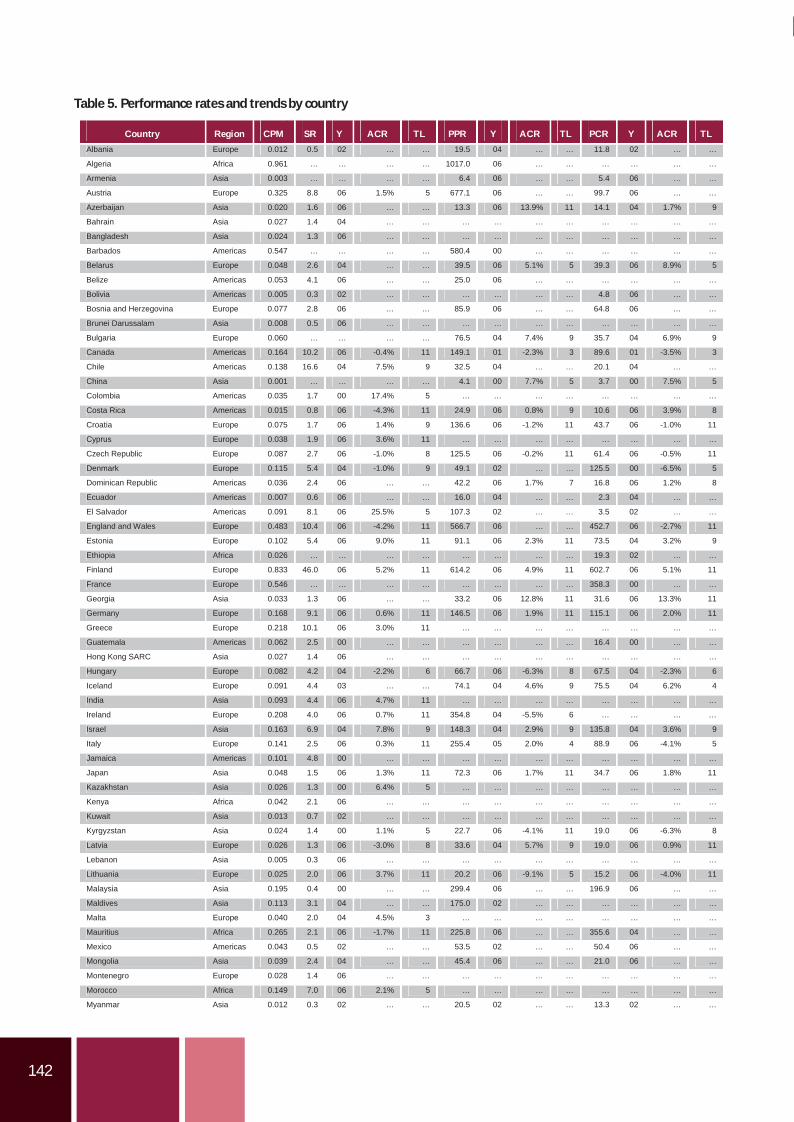
142
Table 5. Performance rates and trends by country
Country Region CPM SR Y ACR TL PPR Y ACR TL PCR Y ACR TL Albania Europe 0.012 0.5 02 … … 19.5 04 … … 11.8 02 … …
Algeria Africa 0.961 … … … … 1017.0 06 … … … … … …
Armenia Asia 0.003 … … … … 6.4 06 … … 5.4 06 … …
Austria Europe 0.325 8.8 06 1.5% 5 677.1 06 … … 99.7 06 … …
Azerbaijan Asia 0.020 1.6 06 … … 13.3 06 13.9% 11 14.1 04 1.7% 9
Bahrain Asia 0.027 1.4 04 … … … … … … … … … …
Bangladesh Asia 0.024 1.3 06 … … … … … … … … … …
Barbados Americas 0.547 … … … … 580.4 00 … … … … … …
Belarus Europe 0.048 2.6 04 … … 39.5 06 5.1% 5 39.3 06 8.9% 5
Belize Americas 0.053 4.1 06 … … 25.0 06 … … … … … …
Bolivia Americas 0.005 0.3 02 … … … … … … 4.8 06 … …
Bosnia and Herzegovina Europe 0.077 2.8 06 … … 85.9 06 … … 64.8 06 … …
Brunei Darussalam Asia 0.008 0.5 06 … … … … … … … … … …
Bulgaria Europe 0.060 … … … … 76.5 04 7.4% 9 35.7 04 6.9% 9
Canada Americas 0.164 10.2 06 -0.4% 11 149.1 01 -2.3% 3 89.6 01 -3.5% 3
Chile Americas 0.138 16.6 04 7.5% 9 32.5 04 … … 20.1 04 … …
China Asia 0.001 … … … … 4.1 00 7.7% 5 3.7 00 7.5% 5
Colombia Americas 0.035 1.7 00 17.4% 5 … … … … … … … …
Costa Rica Americas 0.015 0.8 06 -4.3% 11 24.9 06 0.8% 9 10.6 06 3.9% 8
Croatia Europe 0.075 1.7 06 1.4% 9 136.6 06 -1.2% 11 43.7 06 -1.0% 11
Cyprus Europe 0.038 1.9 06 3.6% 11 … … … … … … … …
Czech Republic Europe 0.087 2.7 06 -1.0% 8 125.5 06 -0.2% 11 61.4 06 -0.5% 11
Denmark Europe 0.115 5.4 04 -1.0% 9 49.1 02 … … 125.5 00 -6.5% 5
Dominican Republic Americas 0.036 2.4 06 … … 42.2 06 1.7% 7 16.8 06 1.2% 8
Ecuador Americas 0.007 0.6 06 … … 16.0 04 … … 2.3 04 … …
El Salvador Americas 0.091 8.1 06 25.5% 5 107.3 02 … … 3.5 02 … …
England and Wales Europe 0.483 10.4 06 -4.2% 11 566.7 06 … … 452.7 06 -2.7% 11
Estonia Europe 0.102 5.4 06 9.0% 11 91.1 06 2.3% 11 73.5 04 3.2% 9
Ethiopia Africa 0.026 … … … … … … … … 19.3 02 … …
Finland Europe 0.833 46.0 06 5.2% 11 614.2 06 4.9% 11 602.7 06 5.1% 11
France Europe 0.546 … … … … … … … … 358.3 00 … …
Georgia Asia 0.033 1.3 06 … … 33.2 06 12.8% 11 31.6 06 13.3% 11
Germany Europe 0.168 9.1 06 0.6% 11 146.5 06 1.9% 11 115.1 06 2.0% 11
Greece Europe 0.218 10.1 06 3.0% 11 … … … … … … … …
Guatemala Americas 0.062 2.5 00 … … … … … … 16.4 00 … …
Hong Kong SARC Asia 0.027 1.4 06 … … … … … … … … … …
Hungary Europe 0.082 4.2 04 -2.2% 6 66.7 06 -6.3% 8 67.5 04 -2.3% 6
Iceland Europe 0.091 4.4 03 … … 74.1 04 4.6% 9 75.5 04 6.2% 4
India Asia 0.093 4.4 06 4.7% 11 … … … … … … … …
Ireland Europe 0.208 4.0 06 0.7% 11 354.8 04 -5.5% 6 … … … …
Israel Asia 0.163 6.9 04 7.8% 9 148.3 04 2.9% 9 135.8 04 3.6% 9
Italy Europe 0.141 2.5 06 0.3% 11 255.4 05 2.0% 4 88.9 06 -4.1% 5
Jamaica Americas 0.101 4.8 00 … … … … … … … … … …
Japan Asia 0.048 1.5 06 1.3% 11 72.3 06 1.7% 11 34.7 06 1.8% 11
Kazakhstan Asia 0.026 1.3 00 6.4% 5 … … … … … … … …
Kenya Africa 0.042 2.1 06 … … … … … … … … … …
Kuwait Asia 0.013 0.7 02 … … … … … … … … … …
Kyrgyzstan Asia 0.024 1.4 00 1.1% 5 22.7 06 -4.1% 11 19.0 06 -6.3% 8
Latvia Europe 0.026 1.3 06 -3.0% 8 33.6 04 5.7% 9 19.0 06 0.9% 11
Lebanon Asia 0.005 0.3 06 … … … … … … … … … …
Lithuania Europe 0.025 2.0 06 3.7% 11 20.2 06 -9.1% 5 15.2 06 -4.0% 11
Malaysia Asia 0.195 0.4 00 … … 299.4 06 … … 196.9 06 … …
Maldives Asia 0.113 3.1 04 … … 175.0 02 … … … … … …
Malta Europe 0.040 2.0 04 4.5% 3 … … … … … … … …
Mauritius Africa 0.265 2.1 06 -1.7% 11 225.8 06 … … 355.6 04 … …
Mexico Americas 0.043 0.5 02 … … 53.5 02 … … 50.4 06 … …
Mongolia Asia 0.039 2.4 04 … … 45.4 06 … … 21.0 06 … …
Montenegro Europe 0.028 1.4 06 … … … … … … … … … …
Morocco Africa 0.149 7.0 06 2.1% 5 … … … … … … … …
Myanmar Asia 0.012 0.3 02 … … 20.5 02 … … 13.3 02 … …
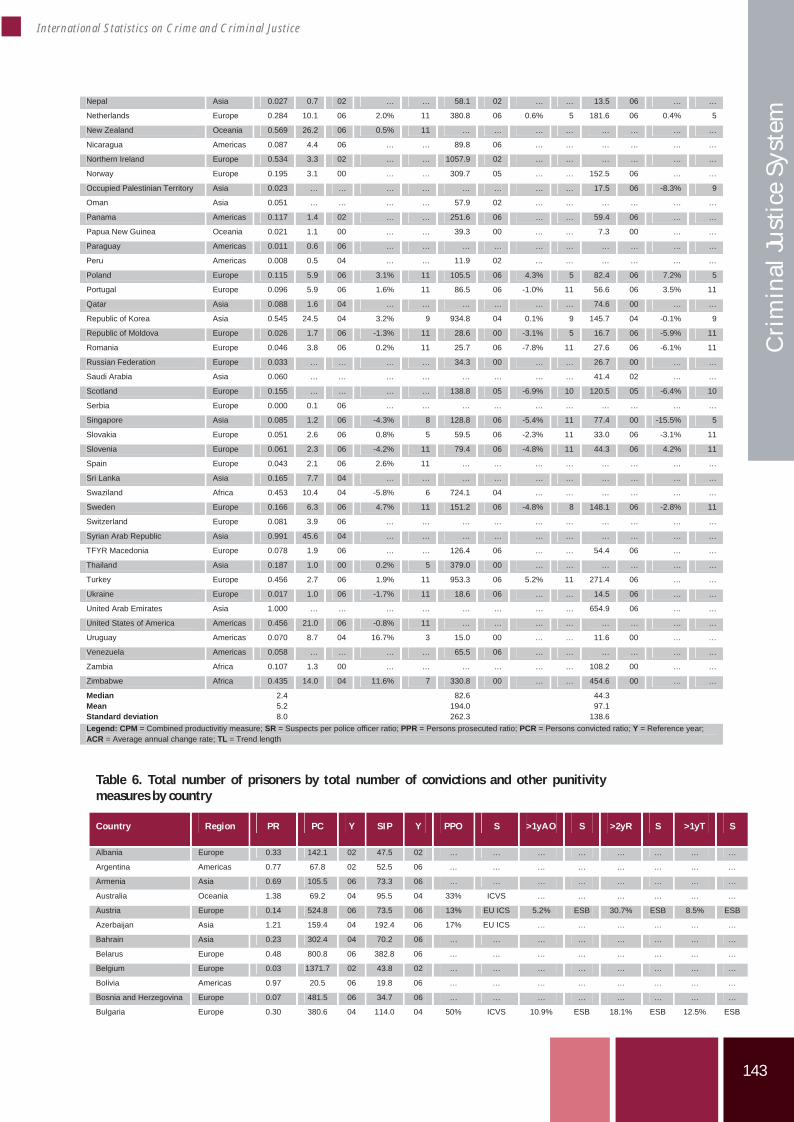
143
International Statistics on Crime and Criminal Justice
Cri
min
al Ju
stic
e Sy
stem
Nepal Asia 0.027 0.7 02 … … 58.1 02 … … 13.5 06 … …
Netherlands Europe 0.284 10.1 06 2.0% 11 380.8 06 0.6% 5 181.6 06 0.4% 5
New Zealand Oceania 0.569 26.2 06 0.5% 11 … … … … … … … …
Nicaragua Americas 0.087 4.4 06 … … 89.8 06 … … … … … …
Northern Ireland Europe 0.534 3.3 02 … … 1057.9 02 … … … … … …
Norway Europe 0.195 3.1 00 … … 309.7 05 … … 152.5 06 … …
Occupied Palestinian Territory Asia 0.023 … … … … … … … … 17.5 06 -8.3% 9
Oman Asia 0.051 … … … … 57.9 02 … … … … … …
Panama Americas 0.117 1.4 02 … … 251.6 06 … … 59.4 06 … …
Papua New Guinea Oceania 0.021 1.1 00 … … 39.3 00 … … 7.3 00 … …
Paraguay Americas 0.011 0.6 06 … … … … … … … … … …
Peru Americas 0.008 0.5 04 … … 11.9 02 … … … … … …
Poland Europe 0.115 5.9 06 3.1% 11 105.5 06 4.3% 5 82.4 06 7.2% 5
Portugal Europe 0.096 5.9 06 1.6% 11 86.5 06 -1.0% 11 56.6 06 3.5% 11
Qatar Asia 0.088 1.6 04 … … … … … … 74.6 00 … …
Republic of Korea Asia 0.545 24.5 04 3.2% 9 934.8 04 0.1% 9 145.7 04 -0.1% 9
Republic of Moldova Europe 0.026 1.7 06 -1.3% 11 28.6 00 -3.1% 5 16.7 06 -5.9% 11
Romania Europe 0.046 3.8 06 0.2% 11 25.7 06 -7.8% 11 27.6 06 -6.1% 11
Russian Federation Europe 0.033 … … … … 34.3 00 … … 26.7 00 … …
Saudi Arabia Asia 0.060 … … … … … … … … 41.4 02 … …
Scotland Europe 0.155 … … … … 138.8 05 -6.9% 10 120.5 05 -6.4% 10
Serbia Europe 0.000 0.1 06 … … … … … … … … … …
Singapore Asia 0.085 1.2 06 -4.3% 8 128.8 06 -5.4% 11 77.4 00 -15.5% 5
Slovakia Europe 0.051 2.6 06 0.8% 5 59.5 06 -2.3% 11 33.0 06 -3.1% 11
Slovenia Europe 0.061 2.3 06 -4.2% 11 79.4 06 -4.8% 11 44.3 06 4.2% 11
Spain Europe 0.043 2.1 06 2.6% 11 … … … … … … … …
Sri Lanka Asia 0.165 7.7 04 … … … … … … … … … …
Swaziland Africa 0.453 10.4 04 -5.8% 6 724.1 04 … … … … … …
Sweden Europe 0.166 6.3 06 4.7% 11 151.2 06 -4.8% 8 148.1 06 -2.8% 11
Switzerland Europe 0.081 3.9 06 … … … … … … … … … …
Syrian Arab Republic Asia 0.991 45.6 04 … … … … … … … … … …
TFYR Macedonia Europe 0.078 1.9 06 … … 126.4 06 … … 54.4 06 … …
Thailand Asia 0.187 1.0 00 0.2% 5 379.0 00 … … … … … …
Turkey Europe 0.456 2.7 06 1.9% 11 953.3 06 5.2% 11 271.4 06 … …
Ukraine Europe 0.017 1.0 06 -1.7% 11 18.6 06 … … 14.5 06 … …
United Arab Emirates Asia 1.000 … … … … … … … … 654.9 06 … …
United States of America Americas 0.456 21.0 06 -0.8% 11 … … … … … … … …
Uruguay Americas 0.070 8.7 04 16.7% 3 15.0 00 … … 11.6 00 … …
Venezuela Americas 0.058 … … … … 65.5 06 … … … … … …
Zambia Africa 0.107 1.3 00 … … … … … … 108.2 00 … …
Zimbabwe Africa 0.435 14.0 04 11.6% 7 330.8 00 … … 454.6 00 … …
MedianMean Standard deviation
2.45.28.0
82.6 194.0 262.3
44.3 97.1
138.6
Legend: CPM = Combined productivitiy measure; SR = Suspects per police officer ratio; PPR = Persons prosecuted ratio; PCR = Persons convicted ratio; Y = Reference year; ACR = Average annual change rate; TL = Trend length
Table 6. Total number of prisoners by total number of convictions and other punitivitymeasures by country
Country Region PR PC Y SIP Y PPO S >1yAO S >2yR S >1yT S
Albania Europe 0.33 142.1 02 47.5 02 … … … … … … … …
Argentina Americas 0.77 67.8 02 52.5 06 … … … … … … … …
Armenia Asia 0.69 105.5 06 73.3 06 … … … … … … … …
Australia Oceania 1.38 69.2 04 95.5 04 33% ICVS … … … … … …
Austria Europe 0.14 524.8 06 73.5 06 13% EU ICS 5.2% ESB 30.7% ESB 8.5% ESB
Azerbaijan Asia 1.21 159.4 04 192.4 06 17% EU ICS … … … … … …
Bahrain Asia 0.23 302.4 04 70.2 06 … … … … … … … …
Belarus Europe 0.48 800.8 06 382.8 06 … … … … … … … …
Belgium Europe 0.03 1371.7 02 43.8 02 … … … … … … … …
Bolivia Americas 0.97 20.5 06 19.8 06 … … … … … … … …
Bosnia and Herzegovina Europe 0.07 481.5 06 34.7 06 … … … … … … … …
Bulgaria Europe 0.30 380.6 04 114.0 04 50% ICVS 10.9% ESB 18.1% ESB 12.5% ESB
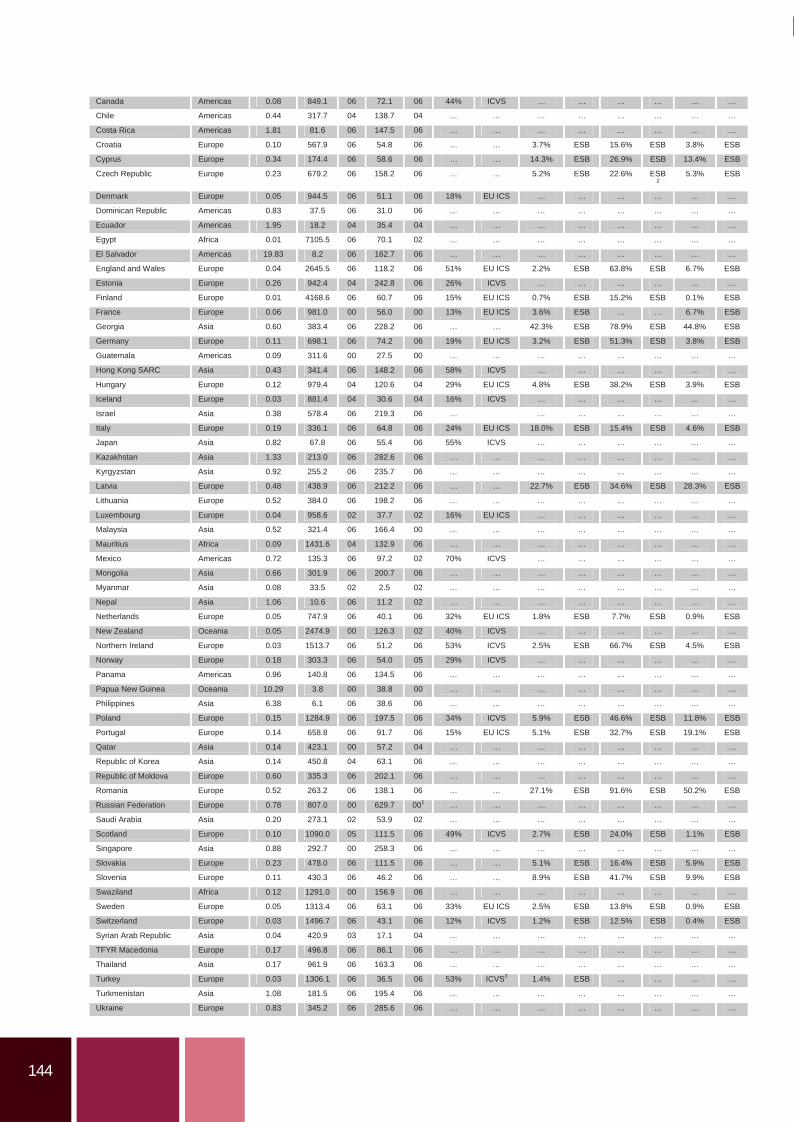
144
Canada Americas 0.08 849.1 06 72.1 06 44% ICVS … … … … … …
Chile Americas 0.44 317.7 04 138.7 04 … … … … … … … …
Costa Rica Americas 1.81 81.6 06 147.5 06 … … … … … … … …
Croatia Europe 0.10 567.9 06 54.8 06 … … 3.7% ESB 15.6% ESB 3.8% ESB
Cyprus Europe 0.34 174.4 06 58.6 06 … … 14.3% ESB 26.9% ESB 13.4% ESB
Czech Republic Europe 0.23 679.2 06 158.2 06 … … 5.2% ESB 22.6% ESB2
5.3% ESB
Denmark Europe 0.05 944.5 06 51.1 06 18% EU ICS … … … … … …
Dominican Republic Americas 0.83 37.5 06 31.0 06 … … … … … … … …
Ecuador Americas 1.95 18.2 04 35.4 04 … … … … … … … …
Egypt Africa 0.01 7105.5 06 70.1 02 … … … … … … … …
El Salvador Americas 19.83 8.2 06 162.7 06 … … … … … … … …
England and Wales Europe 0.04 2645.5 06 118.2 06 51% EU ICS 2.2% ESB 63.8% ESB 6.7% ESB
Estonia Europe 0.26 942.4 04 242.8 06 26% ICVS … … … … … …
Finland Europe 0.01 4168.6 06 60.7 06 15% EU ICS 0.7% ESB 15.2% ESB 0.1% ESB
France Europe 0.06 981.0 00 56.0 00 13% EU ICS 3.6% ESB … … 6.7% ESB
Georgia Asia 0.60 383.4 06 228.2 06 … … 42.3% ESB 78.9% ESB 44.8% ESB
Germany Europe 0.11 698.1 06 74.2 06 19% EU ICS 3.2% ESB 51.3% ESB 3.8% ESB
Guatemala Americas 0.09 311.6 00 27.5 00 … … … … … … … …
Hong Kong SARC Asia 0.43 341.4 06 148.2 06 58% ICVS … … … … … …
Hungary Europe 0.12 979.4 04 120.6 04 29% EU ICS 4.8% ESB 38.2% ESB 3.9% ESB
Iceland Europe 0.03 881.4 04 30.6 04 16% ICVS … … … … … …
Israel Asia 0.38 578.4 06 219.3 06 … … … … … … …
Italy Europe 0.19 336.1 06 64.8 06 24% EU ICS 18.0% ESB 15.4% ESB 4.6% ESB
Japan Asia 0.82 67.8 06 55.4 06 55% ICVS … … … … … …
Kazakhstan Asia 1.33 213.0 06 282.6 06 … … … … … … … …
Kyrgyzstan Asia 0.92 255.2 06 235.7 06 … … … … … … … …
Latvia Europe 0.48 438.9 06 212.2 06 … … 22.7% ESB 34.6% ESB 28.3% ESB
Lithuania Europe 0.52 384.0 06 198.2 06 … … … … … … … …
Luxembourg Europe 0.04 958.6 02 37.7 02 16% EU ICS … … … … … …
Malaysia Asia 0.52 321.4 06 166.4 00 … … … … … … … …
Mauritius Africa 0.09 1431.6 04 132.9 06 … … … … … … … …
Mexico Americas 0.72 135.3 06 97.2 02 70% ICVS … … … … … …
Mongolia Asia 0.66 301.9 06 200.7 06 … … … … … … … …
Myanmar Asia 0.08 33.5 02 2.5 02 … … … … … … … …
Nepal Asia 1.06 10.6 06 11.2 02 … … … … … … … …
Netherlands Europe 0.05 747.9 06 40.1 06 32% EU ICS 1.8% ESB 7.7% ESB 0.9% ESB
New Zealand Oceania 0.05 2474.9 00 126.3 02 40% ICVS … … … … … …
Northern Ireland Europe 0.03 1513.7 06 51.2 06 53% ICVS 2.5% ESB 66.7% ESB 4.5% ESB
Norway Europe 0.18 303.3 06 54.0 05 29% ICVS … … … … … …
Panama Americas 0.96 140.8 06 134.5 06 … … … … … … … …
Papua New Guinea Oceania 10.29 3.8 00 38.8 00 … … … … … … … …
Philippines Asia 6.38 6.1 06 38.6 06 … … … … … … … …
Poland Europe 0.15 1284.9 06 197.5 06 34% ICVS 5.9% ESB 46.6% ESB 11.8% ESB
Portugal Europe 0.14 658.8 06 91.7 06 15% EU ICS 5.1% ESB 32.7% ESB 19.1% ESB
Qatar Asia 0.14 423.1 00 57.2 04 … … … … … … … …
Republic of Korea Asia 0.14 450.8 04 63.1 06 … … … … … … … …
Republic of Moldova Europe 0.60 335.3 06 202.1 06 … … … … … … … …
Romania Europe 0.52 263.2 06 138.1 06 … … 27.1% ESB 91.6% ESB 50.2% ESB
Russian Federation Europe 0.78 807.0 00 629.7 001 … … … … … … … …
Saudi Arabia Asia 0.20 273.1 02 53.9 02 … … … … … … … …
Scotland Europe 0.10 1090.0 05 111.5 06 49% ICVS 2.7% ESB 24.0% ESB 1.1% ESB
Singapore Asia 0.88 292.7 00 258.3 06 … … … … … … … …
Slovakia Europe 0.23 478.0 06 111.5 06 … … 5.1% ESB 16.4% ESB 5.9% ESB
Slovenia Europe 0.11 430.3 06 46.2 06 … … 8.9% ESB 41.7% ESB 9.9% ESB
Swaziland Africa 0.12 1291.0 00 156.9 06 … … … … … … … …
Sweden Europe 0.05 1313.4 06 63.1 06 33% EU ICS 2.5% ESB 13.8% ESB 0.9% ESB
Switzerland Europe 0.03 1496.7 06 43.1 06 12% ICVS 1.2% ESB 12.5% ESB 0.4% ESB
Syrian Arab Republic Asia 0.04 420.9 03 17.1 04 … … … … … … … …
TFYR Macedonia Europe 0.17 496.8 06 86.1 06 … … … … … … … …
Thailand Asia 0.17 961.9 06 163.3 06 … … … … … … … …
Turkey Europe 0.03 1306.1 06 36.5 06 53% ICVS3 1.4% ESB … … … …
Turkmenistan Asia 1.08 181.5 06 195.4 06 … … … … … … … …
Ukraine Europe 0.83 345.2 06 285.6 06 … … … … … … … …
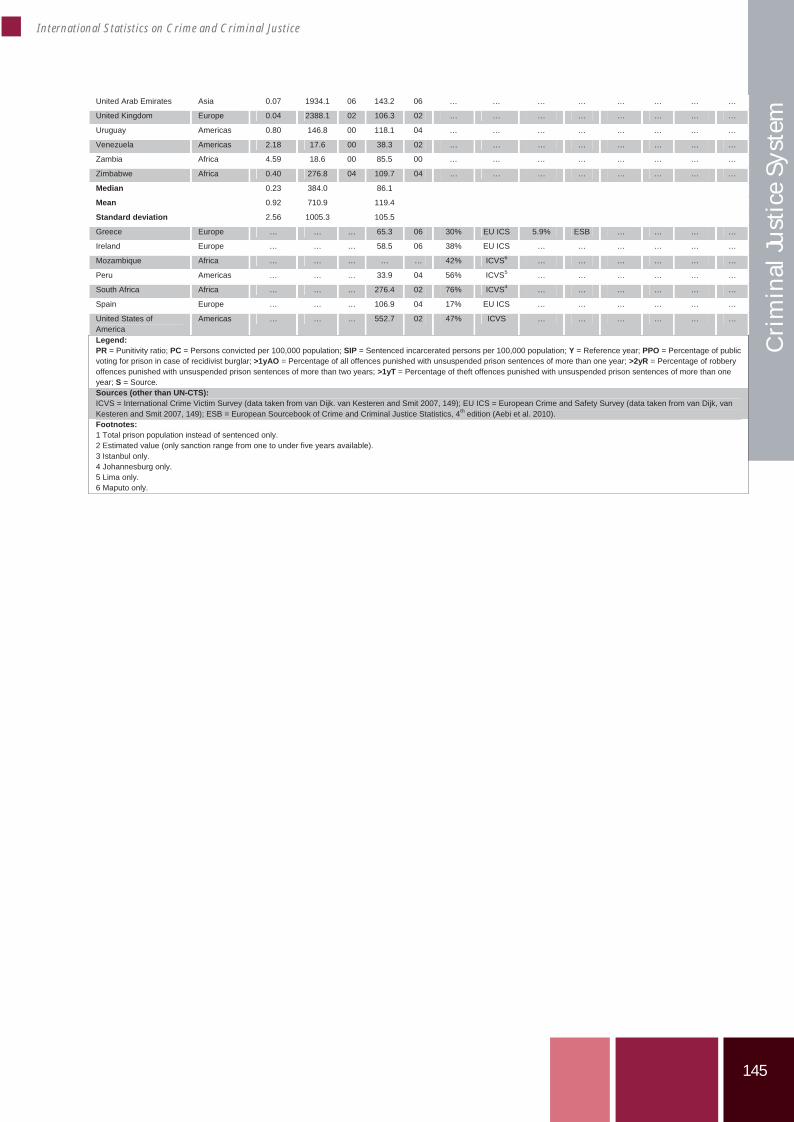
145
International Statistics on Crime and Criminal Justice
Cri
min
al Ju
stic
e Sy
stem
United Arab Emirates Asia 0.07 1934.1 06 143.2 06 … … … … … … … …
United Kingdom Europe 0.04 2388.1 02 106.3 02 … … … … … … … …
Uruguay Americas 0.80 146.8 00 118.1 04 … … … … … … … …
Venezuela Americas 2.18 17.6 00 38.3 02 … … … … … … … …
Zambia Africa 4.59 18.6 00 85.5 00 … … … … … … … …
Zimbabwe Africa 0.40 276.8 04 109.7 04 … … … … … … … …
Median 0.23 384.0 86.1
Mean 0.92 710.9 119.4
Standard deviation 2.56 1005.3 105.5
Greece Europe … … … 65.3 06 30% EU ICS 5.9% ESB … … … …
Ireland Europe … … … 58.5 06 38% EU ICS … … … … … …
Mozambique Africa … … … … … 42% ICVS6 … … … … … …
Peru Americas … … … 33.9 04 56% ICVS5 … … … … … …
South Africa Africa … … … 276.4 02 76% ICVS4 … … … … … …
Spain Europe … … … 106.9 04 17% EU ICS … … … … … …
United States of America
Americas … … … 552.7 02 47% ICVS … … … … … …
Legend: PR = Punitivity ratio; PC = Persons convicted per 100,000 population; SIP = Sentenced incarcerated persons per 100,000 population; Y = Reference year; PPO = Percentage of public voting for prison in case of recidivist burglar; >1yAO = Percentage of all offences punished with unsuspended prison sentences of more than one year; >2yR = Percentage of robbery offences punished with unsuspended prison sentences of more than two years; >1yT = Percentage of theft offences punished with unsuspended prison sentences of more than one year; S = Source.Sources (other than UN-CTS): ICVS = International Crime Victim Survey (data taken from van Dijk. van Kesteren and Smit 2007, 149); EU ICS = European Crime and Safety Survey (data taken from van Dijk, van Kesteren and Smit 2007, 149); ESB = European Sourcebook of Crime and Criminal Justice Statistics, 4th edition (Aebi et al. 2010). Footnotes: 1 Total prison population instead of sentenced only. 2 Estimated value (only sanction range from one to under five years available). 3 Istanbul only. 4 Johannesburg only. 5 Lima only. 6 Maputo only.
146
Annex B to chapter 6: Methodological notes
Data validation
UN CTS data were provided un validated by theUN. Therefore, for the purposes of this chapter, aquality check was carried out on the data. Alldata from countries with less than 100,000inhabitants were removed (with the exception ofthe results presented in Figure 1) because of theinstability of these data due to the small absolutenumbers.
Then, three types of checks were made, the firsttwo of these routinely for all variables used:Trend check, internal validity check, othersources check. The internal validity check wasalways carried out after the trend check andtherefore also after possible modifications due tothis first check. Other sources were only checkedfor suspicious values and only where such othersources were available.
Trend check was a check for consistency of datawithin responses provided all over the referenceperiod of this publication (6th to 10th UN CTS). Itwas mainly looked for significant “jumps” in thetime series between adjacent UN CTS waves.Where a gap in the time series existed since acountry did not respond to all waves, the trendcheck was still carried out. However, theacceptable thresholds for f luctuations wereadapted in such a case.
Internal validity check was a check for:
1.) Extreme, implausible outliers in theresponses from the different countries, i.e. valuestotally outside the acceptable and expectablevariation of a certain variable.
2.) Consistency of data within responsesprovided to different questions of the UN CTS.The following consistency checks were routinelymade for chapter 7:
a) Prosecution personnel per police personnel:This ratio was expected to be far smaller than 1.This rule was never violated.
b) Judges per police personnel: This ratio wasexpected to be far smaller than 1. This rule wasnever violated.
c) Juvenile prison staff by adult prison staff: Thisratio was expected to be smaller than 1. This rulewas never violated.
c) Persons prosecuted by persons suspected: Thisratio was expected to be smaller than 1. If this
rule was violated, data and trend for bothvariables were thoroughly checked. If the dataseemed trustworthy except for the violation ofthis rule, this was accepted if the ratio was notmuch bigger than 1, because this might beexplained by incomplete statistical recording atpolice level (e.g. restricted to certain offencetypes etc.) and other factors, such as time lagswithin the criminal justice process.
d) Persons brought before court by personssuspected: This ratio was expected to be smallerthan 1. Violations were handled as under 2.c).
e) Persons convicted by persons suspected: Thisratio was expected to be smaller than 1.Violations were handled as under 2.c).
f ) Persons convicted by persons prosecuted: Thisratio was expected to be smaller than 1.Violations were handled as under 2.c).
g) Persons convicted by persons brought beforecourt: This ratio was expected to be smaller than1. Violations were not accepted.
h) Pre trial detainees by total prison population:This ratio was expected to be smaller than 1.Violations were not accepted.
i) Sentenced prisoners by total prison population:This ratio was expected to be smaller than orequal to 1. Violations were not accepted.
j) Pre trial detainees plus sentenced prisoners bytotal prison population: This ratio was expectedto be equal to or moderately lower than 1.Violations were accepted in both directions, ifnot too extreme, for lower ratios already due tothe existence of other categories (“convictedawaiting sentence” and “other”) in the UN CTSdata, for higher ratios due to possibleoverlapping between both categories and / ordouble counts.
k) Adult prisoners by total prison population:This ratio was expected to be smaller than orequal to 1. Violations were not accepted inprinciple. However, in the case of very smalldifferences (excess of less than 10 %) these wereallowed if the data were plausible in all otherrespects, because the differences might be due todifferent sources or reference dates for thesedata.
147
International Statistics on Crime and Criminal Justice
Cri
min
al Ju
stic
e Sy
stem
l) Juvenile prisoners by total prison population:This ratio was expected to be far smaller than 1.This rule was never violated.
m) Adult prisoners plus juvenile prisoners by totalprison population: This ratio was expected to beequal to 1. Violations were sometimes accepted:Lower values are possible in general due to thefact that the breakdown by adults and juvenilesmight refer to sentenced prisoners only in somecountries. Higher values than 1 are moreproblematic and can only be explained bydifferences in statistical recording. These haveonly been accepted if the excess was lower than10 % and the data were plausible in all otherrespects.
When a suspected inconsistency was found, adecision had to be made as to how to deal with it.Basically there were three possibilities:
The suspected value was replaced by anothervalue for the same variable and the same year,but from another source.
The suspected value was replaced by anothervalue for the same variable from another year ifmore consistent figures could be found withinthe UN CTS data. This was only possible withinthe restrictions for the points in time asdescribed below.
The suspected value was removed withoutreplacement.
Apart from the process described, values for acertain country that were missing in a UN CTSsurvey wave were not added to the data from theother sources.
A complete listing of all inconsistencies foundand the actions taken can be found in Annex C.
Latest available year and start / end year for trend analysis
If available, the year 2006 from the 10th surveywas taken. Otherwise the latest available yearwas taken, provided this year was 2000 or later.Data from 1999 or earlier were not used for thisdata point.
In order to include as many countries as possiblein trend analysis, trends were computed usingonly two points in time (start and end). Theearliest starting date for trends was – differentfrom most other chapters in this book – not1996, but 1995, because resources variables wereonly covered for 1995 and 1997 in the 6th UNCTS. The years 1995 (preferred) to 2001 were
accepted as possible starting dates for trendanalysis, whereas the years 2006 (preferred) backto 2000 were accepted as possible end dates. Theend date for trend analysis is therefore alwaysidentical to the latest available year throughoutchapter 7. The starting and end year can also beseen directly in the table, allowing the reader tointerpret the results correctly. In trend tablesthere are always two values printed for eachcountry which had at least two values availablethat could be considered as starting date and enddate based on the rules above.
Average annual change rate
When presenting and comparing trends, thecomplication is that the period is not the samefor every country: e.g. for some countries the'start' year could be 1995 and the 'end' year 2006,for others this could be 2000 and 2004. Tocircumvent this, the mean annual change wascomputed with the following formula:
If x1 is the value at year t1 and x2 the value at yeart2 (with t2 > t1), the mean annual change is:
(x2 / x1)1/(t
2t1) 1
This mean annual change was computedbetween the 'start' and 'end' (for most countries1995 – 2006). But of course it would be useless tocalculate an average annual change rate with onlyone or two years in between these dates.Therefore, annual average change rates were onlycalculated if (end year start year >= 3).
148
Summary measures in figures and tables
When computing figures per regions and subregions the non weighted median was calculated.This means that the rates of large and smallcountries have equal weight when calculating themedian. The choice was made to facilitatecomparison of crime rates between countrieswithout taking into account the size of thecountry. The disadvantage of the method is thatone cannot exactly estimate the overall picture ofcriminal justice in different regions. Accurate andcomplete regional comparisons are, however,impossible because not all countries haveresponded to the UN CTS.
Calculation of medians was done partially on theregional and partially on the sub regional level,based on the available number of observations. Ingeneral, medians were not calculated for a subregion if there were only three or less reportingcountries there. There were some exceptions fromthis rule where this was necessary in order toseparately show the results for other sub regionswithin the same region with more than threereporting countries.
In order to document the restrictions for theinterpretation of medians, but still be able to
report as differentiated as possible, the total nvalues for each region / sub region were includedin the figure. Sometimes, medians were evencalculated for only two values, where considerednecessary (e.g. for Oceania not to lose itcompletely). In order to avoid misinterpretations,in these cases these two countries were explicitlylisted directly in the figure.
The lines “1st Quartile”, “Median” and “3rd
Quartile” in the other figures refer to the nonweighted Quartiles (1st, 2nd, 3rd) of the respectiveratio (e.g. in figure 6: suspects per police officer).
Most tables feature the following summarymeasures: median, mean, and standard deviation.As with the medians calculated for the figures byregions and sub regions, these measures arecalculated without weighting them bypopulation. Since these summary measures referto the total of responding countries, this decisionwas necessary in order to avoid themisinterpretation that the total medians, meansand standard deviations would represent “theworld” in total.
149
International Statistics on Crime and Criminal Justice
Cri
min
al Ju
stic
e Sy
stem
Annex C to chapter 6: Data modifications
The following modifications only refer to variablesthat were analyzed for chapter 7, not to othervariables, also not to those solely used for thepurposes of internal validity checks.
If a value is listed to have been deleted, it is explicitlynoted if it has been replaced by a value from anothersource or from the UN CTS, but from outside the
usual time range. However, it is not explicitly listed ifit has been replaced by a value from an adjacent UNCTS in accordance with the general selection rules asdescribed in Annex B. Such values have beenautomatically selected as replacement values if theywere within the general range for start or end (= i.e.:latest available) year of trend analysis.
Police personnel
Azerbaijan: Trend check failed for 8th UN-CTS (2001 / 2002); deleted. Belgium: Trend and other sources check failed for 6th UN-CTS (1995 – 1997); deleted; used ESB 2nd edition data for 1995 instead. Chile: Trend check failed for 6th UN-CTS (1995 – 1997); deleted; used 5th UN-CTS data for 1994 (instead of 1995). Costa Rica: Trend check failed; deleted 7th and 9th UN-CTS (1998 – 2000; 2005 / 2006). Maldives: Trend check failed; deleted 6th and 8th UN-CTS (1995 – 1997; 2001 / 2002). Mexico: Trend check failed for 9th UN-CTS (2003 / 2004); deleted. Spain: Trend and other sources check failed for 6th UN-CTS (1995 – 1997); deleted; used ESB 1st edition data for 1995 instead. Turkey: Corrected typo in 2006 data.
Total number of persons suspected / arrested / cautioned
Austria: Trend and other sources check failed for 8th UN-CTS (2001 / 2002); deleted; used ESB 3rd edition data for 2001 instead. England & Wales: Trend and other sources check failed for 6th UN-CTS (1995 – 1997); deleted; used ESB 2nd edition data for 1995 instead. Greece: Trend and other sources check failed; deleted 7th and 10th UN-CTS (1998 – 2000; 2005 / 2006); deleted; used ESB 4th edition data for 2006 instead. Latvia: Trend and other sources check failed; deleted 6th and 10th UN-CTS (1995 – 1997; 2005 / 2006); deleted; used ESB 4th edition data for 2005 / 2006 instead, but not ESB 2nd edition data for 1995 – 1997, because the latter values also failed trend check. Malaysia: Trend check failed; deleted 6th and 10th UN-CTS (1995 – 1997; 2005 / 2006). Morocco: Trend check failed for 7th UN-CTS (1998 – 2000); deleted. Nepal: Trend check failed for 10th UN-CTS (2005 / 2006); deleted. Occupied Palestine Territory: Trend check failed for 1995 value from 6th UN-CTS; deleted. Panama: Trend check failed; deleted 6th and 7th UN-CTS (1995 – 1997; 1998 – 2000). Paraguay: Trend check failed for 7th UN-CTS (1998 – 2000); deleted. Singapore: Trend check failed for 6th UN-CTS (1995 – 1997); deleted. Spain: Trend and other sources check failed for 6th UN-CTS (1995 – 1997); deleted; used ESB 2nd edition data for 1995 instead. Thailand: Trend check and internal validity check failed for 10th UN-CTS (2005 / 2006); deleted. Venezuela: Internal validity check failed for 7th UN-CTS (1998 – 2000); deleted.
Prosecution personnel
Argentina: According to 10th UN-CTS metadata, 2006 data only cover federal and Buenos Aires City personnel; excluded from comparison. Bahrain: Internal validity check failed for 6th UN-CTS; deleted. Chile: Trend check failed; deleted 7th and 8th UN-CTS (1998 – 2000; 2001 / 2002). El Salvador: Trend check failed for 7th UN-CTS (1998 – 2000); deleted. England & Wales: Trend check failed; deleted 7th and 8th UN-CTS (1998 – 2000; 2001 / 2002). Georgia: Trend check failed for 9th UN-CTS (2003 / 2004); deleted. Malta: Trend and internal validity check failed for 2002 value from 8th UN-CTS; deleted. Mexico: Trend and internal validity check failed for 1999 value from 7th UN-CTS; deleted. Pakistan: Internal validity check failed for 7th UN-CTS (1998 – 2000); deleted. Peru: Trend check failed for 6th UN-CTS (1995 – 1997); deleted. Sri Lanka: Internal validity check failed for 9th UN-CTS (2003 / 2004); deleted. Sweden: Trend and other sources check failed for 6th UN-CTS (1995 – 1997); deleted; used ESB 1st edition data for 1995 instead.
150
Total number of persons prosecuted
Chile: Trend check failed for 8th UN-CTS (2001 / 2002); deleted. Cyprus: Trend and internal validity check failed for all survey waves; all deleted. Ecuador: Trend and internal validity check failed for 10th UN-CTS (2005 / 2006). England & Wales: Trend check failed for 6th UN-CTS (1995 – 1997); deleted; internal validity check failed for 2001 value from 8th CTS. Guatemala: Internal validity check failed for 7th UN-CTS (1998 – 2000); deleted. Ireland: Trend check failed for 10th UN-CTS (2005 / 2006); deleted. Latvia: Trend check failed for 2006 value from 10th UN-CTS; deleted. Malta: Trend check failed for 9th UN-CTS (2003 / 2004); deleted. Nepal: Trend and internal validity check failed for 10th UN-CTS (2005 / 2006); deleted. Northern Ireland: Trend check failed for 6th UN-CTS (1995 – 1997); deleted. Republic of Moldova: Trend and internal validity check failed; deleted 8th and 9th UN-CTS values (2001 / 2002; 2003 / 2004). Swaziland: Trend and internal validity check failed for 10th UN-CTS (2005 / 2006); deleted. United Arab Emirates: Internal validity check failed for 10th UN-CTS (2005 / 2006); deleted. United States of America: Trend check failed for 10th UN-CTS (2005 / 2006); deleted. Venezuela: Trend and internal validity check failed for 8th UN-CTS (2001 / 2002); deleted. Zambia: Internal validity check failed for 7th UN-CTS (1998 - 2000); deleted.
Professional judges
Colombia: Trend check failed for 9th UN-CTS (2003 / 2004); deleted. Denmark: Trend check failed for 10th UN-CTS (2005 / 2006); deleted. England & Wales: Trend check failed for 6th UN-CTS (1995 – 1997); deleted. Germany: Trend and other sources check failed; deleted 9th and 10th UN-CTS (2003 / 2004; 2005 / 2006); used data taken from the Federal Statistical Office in Germany for 2006 instead. Maldives: Trend and internal validity check failed for all survey waves; all deleted. Northern Ireland: Trend check failed for 6th UN-CTS (1995 – 1997); deleted. Pakistan: Internal validity check failed for 7th UN-CTS (1998 – 2000); deleted. Slovakia: Trend check failed for 10th UN-CTS (2005 / 2006); deleted. United States of America: According to 10th UN-CTS metadata, 2005 / 2006 data only cover federal judges; excluded from comparison. Trend check also failed for 1997 value from 6th UN-CTS; deleted.
Total number of persons brought before the criminal courts
Afghanistan: Internal validity check failed for 8th UN-CTS (2001 / 2002); deleted. Australia: Trend and internal validity check failed for all survey waves; all deleted. Bahrain: Trend and internal validity check failed for all survey waves; all deleted. Bolivia: Trend and internal validity check failed for 10th UN-CTS (2005 / 2006); deleted. Colombia: Trend and internal validity check failed for all survey waves; all deleted. Costa Rica: Trend check failed for 6th UN-CTS (1995 – 1997); deleted. Cyprus: Trend and internal validity check failed for all survey waves; all deleted. Denmark: Trend check failed; deleted 6th to 9th UN-CTS (1995 – 1997; 1998 – 2000; 2001 / 2002; 2003 / 2004). El Salvador: Trend check failed for 6th UN-CTS (1995 – 1997); deleted. England & Wales: Trend check failed for 6th UN-CTS (1995 – 1997); deleted. Japan: Trend check failed; deleted 6th and 7th UN-CTS (1995 – 1997; 1998 – 2000). Luxembourg: Internal validity check failed for 8th UN-CTS (2001 / 2002); deleted. Malta: Trend and internal validity check failed for 9th UN-CTS (2003 / 2004); deleted. Mauritius: Trend and internal validity check failed for 10th UN-CTS (2005 / 2006); deleted. Myanmar: Internal validity check failed for 8th UN-CTS (2001 / 2002); deleted. Northern Ireland: Trend check failed for 6th UN-CTS (1995 – 1997); deleted. Occupied Palestine Territory: Internal validity check failed for 10th UN-CTS (2005 / 2006); deleted. Saudi Arabia: Internal validity check failed for 7th UN-CTS (1998 – 2000); deleted. Sweden: Internal validity check failed for all survey waves; all deleted. Turkey: Trend check failed for 8th UN-CTS (2001 / 2002); deleted. Turkmenistan: Internal validity check failed; deleted 9th and 10th UN-CTS (2003 / 2004; 2005 / 2006). United States of America: Trend and internal validity check failed for 10th UN-CTS (2005 / 2006); deleted. Venezuela: Internal validity check failed for 7th UN-CTS (1998 – 2000); deleted.
151
International Statistics on Crime and Criminal Justice
Cri
min
al Ju
stic
e Sy
stem
Total number of persons convicted
Chile: Trend and internal validity check failed; deleted 7th and 8th UN-CTS values (1998 – 2000; 2001 / 2002). Colombia: Trend and internal validity check failed for all survey waves; all deleted. Costa Rica: Trend check failed for 6th UN-CTS (1995 – 1997); deleted. Cyprus: Trend, internal validity and other sources check failed; deleted 7th to 10th; used ESB 4th edition data for 2006 instead. Denmark: Trend check failed for 8th UN-CTS (2001 / 2002); deleted. England & Wales: Trend and other sources check failed for 6th UN-CTS (1995 – 1997); deleted; used ESB 2nd edition data for 1995 / 1996 instead. Malta: Internal validity check failed for 9th UN-CTS (2003 / 2004). Mauritius: Trend and internal validity check failed for 10th UN-CTS (2005 / 2006); deleted. Northern Ireland: Trend and other sources check failed; deleted 6th to 8th UN-CTS (1995 – 1997; 1998 – 2000; 2001 / 2002); used ESB 2nd edition data for 1995 / 1996 and 4th edition for the missing 2006 instead. Sweden: Trend and other sources check failed; deleted 6th to 9th UN-CTS (1995 – 1997; 1998 – 2000; 2001 / 2002, 2003 / 2004); used ESB 2nd edition data for 1995 / 1996 instead. Turkey: Trend check failed for 2002 value from 8th UN-CTS; deleted.
Total staff in adult prisons
Colombia: Trend check failed; deleted 6th and 7th UN-CTS (1995 – 1997; 1998 – 2000). Ecuador: Trend check failed for 8th UN-CTS (2001 / 2002); deleted. El Salvador: Trend and internal validity check failed for 10th UN-CTS (2005 / 2006); deleted. Maldives: Trend and internal validity check failed for 7th UN-CTS (1998 – 2000); deleted. Mexico: Trend and internal validity check failed for all survey waves; all deleted. Ukraine: Trend and internal validity check failed for 6th UN-CTS (1995 – 1997); deleted.
Total staff in juvenile prisons
Czech Republic: Trend check failed; deleted 7th to 9th UN-CTS (1998 – 2000; 2001 / 2002; 2003 / 2004). Maldives: Trend and internal validity check failed for 7th UN-CTS (1998 – 2000); deleted. Mexico: Trend and internal validity check failed for all survey waves; all deleted. Phillipines: Trend and internal validity check failed for all survey waves; all deleted.
Total number of persons incarcerated
Argentina: Trend check failed for 6th UN-CTS (1995 – 1997); deleted. Azerbaijan: Trend check failed for 7th UN-CTS (1998 – 2000); deleted. Cyprus: Trend and other sources check failed; deleted 8th and 10th UN-CTS (2001 / 2002; 2005 / 2006); used ESB 4th edition data for 2006 instead. Jordan: Trend check failed for 6th UN-CTS (1995 – 1997); deleted. Maldives: Internal validity check failed for 7th UN-CTS (1998 – 2000); deleted. Mauritius: Trend check failed; deleted 6th and 9th UN-CTS (1995 – 1997; 2003 / 2004). Sri Lanka: Trend check failed for 6th UN-CTS (1995 – 1997); deleted. Swaziland: Trend check failed for 7th UN-CTS (1998 – 2000); deleted.
Number of sentenced persons incarcerated
Argentina: Trend check failed for 6th UN-CTS (1995 – 1997); deleted. Cyprus: Trend and other sources check failed; deleted 8th and 10th UN-CTS (2001 / 2002; 2005 / 2006); used ESB 4th edition data for 2006 for the variables “total number of prisoners: stock” and “of which in pre-trial detention: stock” to calculate a replacement value. Jordan: Trend check failed for 6th UN-CTS (1995 – 1997); deleted. Kazakhstan: Trend check failed; deleted 6th and 7th UN-CTS (1995 – 1997; 1998 – 2000). Kyrgyzstan: Trend check failed for 7th UN-CTS (1998 – 2000); deleted. Latvia: Trend check failed for 7th UN-CTS (1998 – 2000); deleted. Maldives: Trend and internal validity check failed for 7th UN-CTS (1998 – 2000); deleted. Mauritius: Trend check failed for 9th UN-CTS (2003 / 2004); deleted. Morocco: Trend check failed for 9th UN-CTS (2003 / 2004); deleted. Paraguay: Trend and internal validity check failed for 7th UN-CTS (1998 – 2000); deleted. Phillipines: Trend and internal validity check failed; deleted 7th and 8th UN-CTS values (1998 – 2000; 2001 / 2002). Swaziland: Trend check failed for 7th UN-CTS (1998 – 2000); deleted.

152
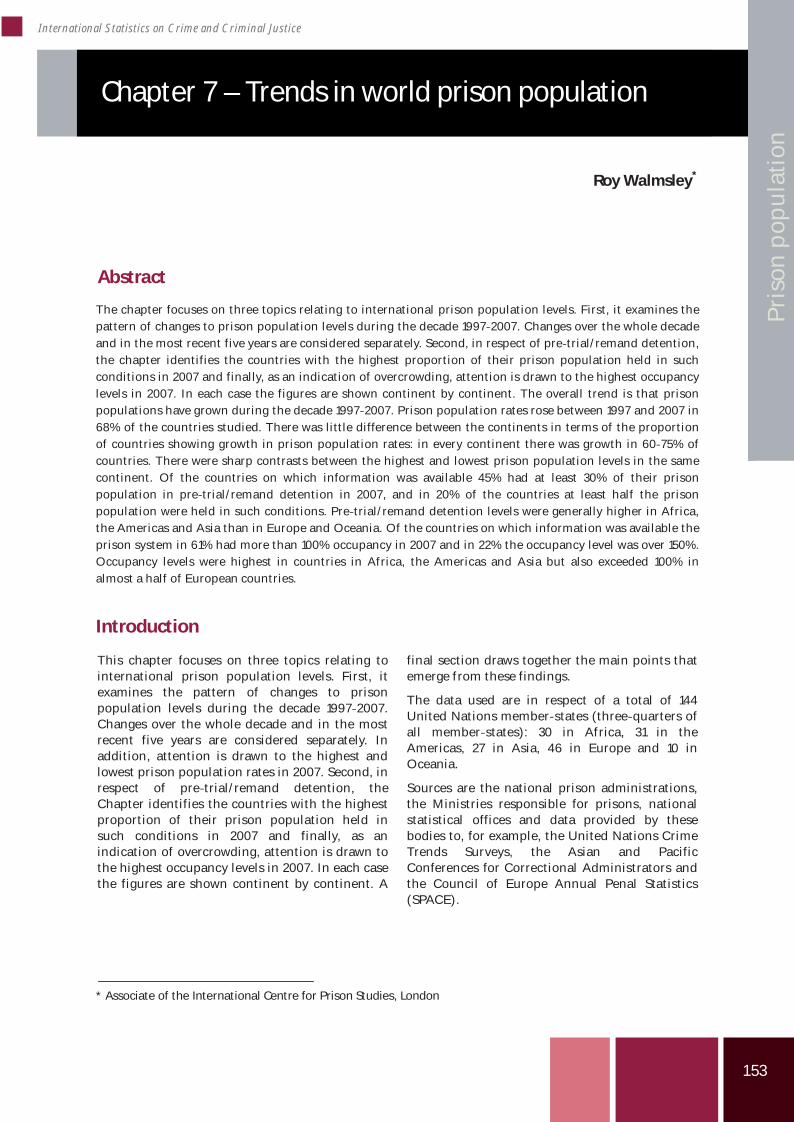
153
International Statistics on Crime and Criminal Justice
Pris
on p
opul
atio
n
Chapter 7 – Trends in world prison population
Roy Walmsley*
Abstract
The chapter focuses on three topics relating to international prison population levels. First, it examines thepattern of changes to prison population levels during the decade 1997 2007. Changes over the whole decadeand in the most recent five years are considered separately. Second, in respect of pre trial/remand detention,the chapter identifies the countries with the highest proportion of their prison population held in suchconditions in 2007 and finally, as an indication of overcrowding, attention is drawn to the highest occupancylevels in 2007. In each case the figures are shown continent by continent. The overall trend is that prisonpopulations have grown during the decade 1997 2007. Prison population rates rose between 1997 and 2007 in68% of the countries studied. There was little difference between the continents in terms of the proportionof countries showing growth in prison population rates: in every continent there was growth in 60 75% ofcountries. There were sharp contrasts between the highest and lowest prison population levels in the samecontinent. Of the countries on which information was available 45% had at least 30% of their prisonpopulation in pre trial/remand detention in 2007, and in 20% of the countries at least half the prisonpopulation were held in such conditions. Pre trial/remand detention levels were generally higher in Africa,the Americas and Asia than in Europe and Oceania. Of the countries on which information was available theprison system in 61% had more than 100% occupancy in 2007 and in 22% the occupancy level was over 150%.Occupancy levels were highest in countries in Africa, the Americas and Asia but also exceeded 100% inalmost a half of European countries.
Introduction
This chapter focuses on three topics relating tointernational prison population levels. First, itexamines the pattern of changes to prisonpopulation levels during the decade 1997 2007.Changes over the whole decade and in the mostrecent five years are considered separately. Inaddition, attention is drawn to the highest andlowest prison population rates in 2007. Second, inrespect of pre trial/remand detention, theChapter identifies the countries with the highestproportion of their prison population held insuch conditions in 2007 and finally, as anindication of overcrowding, attention is drawn tothe highest occupancy levels in 2007. In each casethe figures are shown continent by continent. A
final section draws together the main points thatemerge from these findings.
The data used are in respect of a total of 144United Nations member states (three quarters ofall member states): 30 in Africa, 31 in theAmericas, 27 in Asia, 46 in Europe and 10 inOceania.
Sources are the national prison administrations,the Ministries responsible for prisons, nationalstatistical offices and data provided by thesebodies to, for example, the United Nations CrimeTrends Surveys, the Asian and PacificConferences for Correctional Administrators andthe Council of Europe Annual Penal Statistics(SPACE).
* Associate of the International Centre for Prison Studies, London
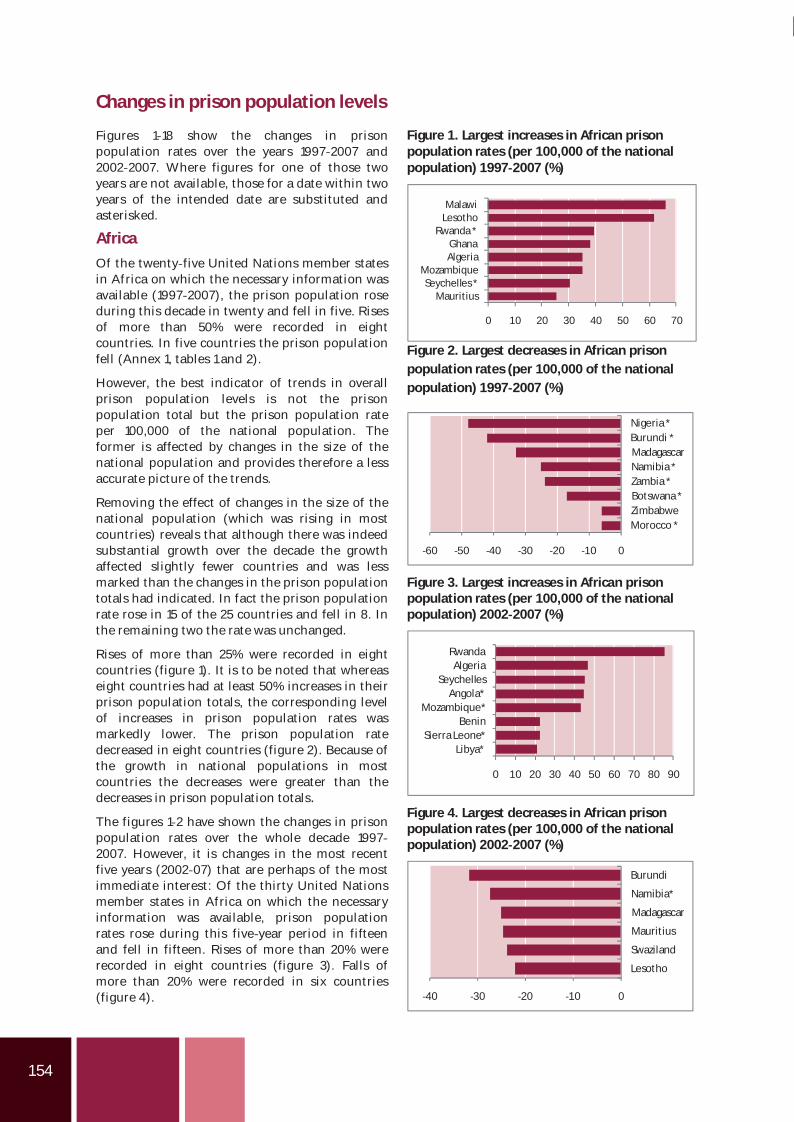
154
Changes in prison population levels
Figures 1 18 show the changes in prisonpopulation rates over the years 1997 2007 and2002 2007. Where figures for one of those twoyears are not available, those for a date within twoyears of the intended date are substituted andasterisked.
Africa
Of the twenty five United Nations member statesin Africa on which the necessary information wasavailable (1997 2007), the prison population roseduring this decade in twenty and fell in five. Risesof more than 50% were recorded in eightcountries. In five countries the prison populationfell (Annex 1, tables 1 and 2).
However, the best indicator of trends in overallprison population levels is not the prisonpopulation total but the prison population rateper 100,000 of the national population. Theformer is affected by changes in the size of thenational population and provides therefore a lessaccurate picture of the trends.
Removing the effect of changes in the size of thenational population (which was rising in mostcountries) reveals that although there was indeedsubstantial growth over the decade the growthaffected slightly fewer countries and was lessmarked than the changes in the prison populationtotals had indicated. In fact the prison populationrate rose in 15 of the 25 countries and fell in 8. Inthe remaining two the rate was unchanged.
Rises of more than 25% were recorded in eightcountries (figure 1). It is to be noted that whereaseight countries had at least 50% increases in theirprison population totals, the corresponding levelof increases in prison population rates wasmarkedly lower. The prison population ratedecreased in eight countries (figure 2). Because ofthe growth in national populations in mostcountries the decreases were greater than thedecreases in prison population totals. The figures 1 2 have shown the changes in prisonpopulation rates over the whole decade 19972007. However, it is changes in the most recentfive years (2002 07) that are perhaps of the mostimmediate interest: Of the thirty United Nationsmember states in Africa on which the necessaryinformation was available, prison populationrates rose during this five year period in fifteenand fell in fifteen. Rises of more than 20% wererecorded in eight countries (figure 3). Falls ofmore than 20% were recorded in six countries(figure 4).
Figure 1. Largest increases in African prisonpopulation rates (per 100,000 of the nationalpopulation) 1997 2007 (%)
0 10 20 30 40 50 60 70
MauritiusSeychelles *
MozambiqueAlgeriaGhana
Rwanda *LesothoMalawi
Figure 2. Largest decreases in African prisonpopulation rates (per 100,000 of the nationalpopulation) 1997 2007 (%)
60 50 40 30 20 10 0
Morocco *ZimbabweBotswana *Zambia *Namibia *MadagascarBurundi *Nigeria *
Figure 3. Largest increases in African prisonpopulation rates (per 100,000 of the nationalpopulation) 2002 2007 (%)
0 10 20 30 40 50 60 70 80 90
Libya*Sierra Leone*
BeninMozambique*
Angola*Seychelles
AlgeriaRwanda
Figure 4. Largest decreases in African prisonpopulation rates (per 100,000 of the nationalpopulation) 2002 2007 (%)
40 30 20 10 0
Lesotho
Swaziland
Mauritius
Madagascar
Namibia*
Burundi
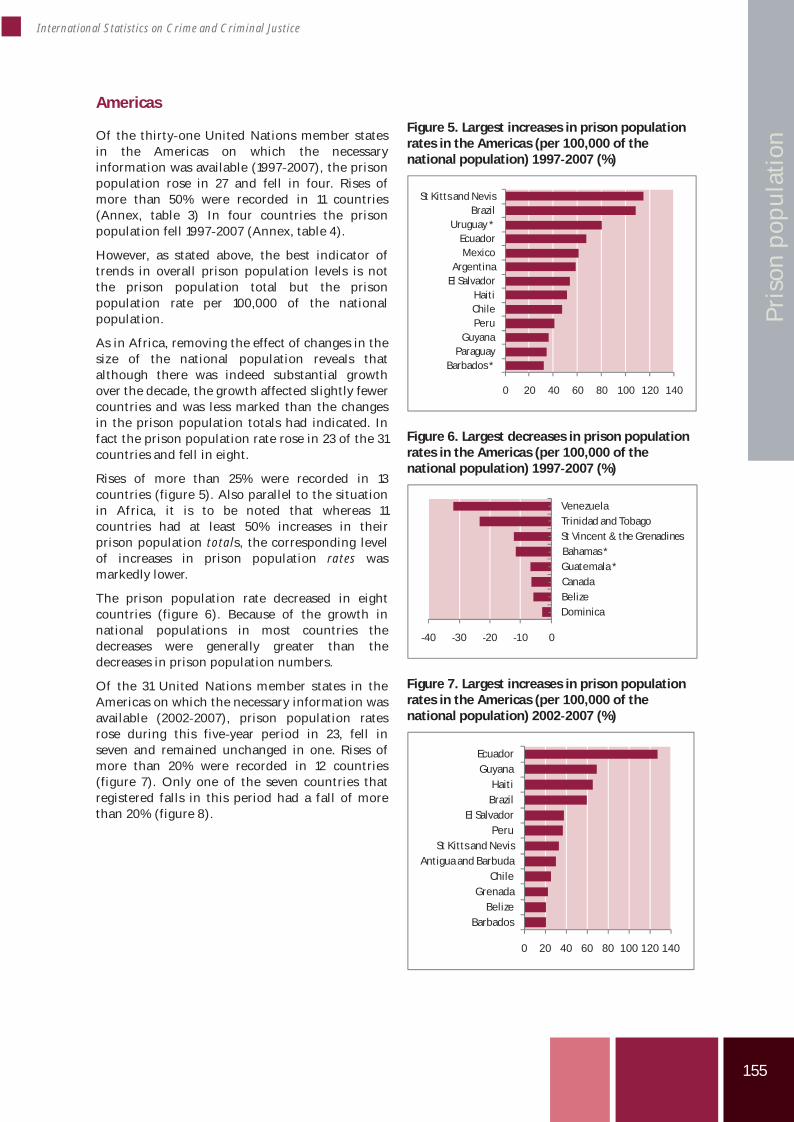
155
International Statistics on Crime and Criminal Justice
Pris
on p
opul
atio
n
Americas
Of the thirty one United Nations member statesin the Americas on which the necessaryinformation was available (1997 2007), the prisonpopulation rose in 27 and fell in four. Rises ofmore than 50% were recorded in 11 countries(Annex, table 3) In four countries the prisonpopulation fell 1997 2007 (Annex, table 4).
However, as stated above, the best indicator oftrends in overall prison population levels is notthe prison population total but the prisonpopulation rate per 100,000 of the nationalpopulation.
As in Africa, removing the effect of changes in thesize of the national population reveals thatalthough there was indeed substantial growthover the decade, the growth affected slightly fewercountries and was less marked than the changesin the prison population totals had indicated. Infact the prison population rate rose in 23 of the 31countries and fell in eight.
Rises of more than 25% were recorded in 13countries (figure 5). Also parallel to the situationin Africa, it is to be noted that whereas 11countries had at least 50% increases in theirprison population totals, the corresponding levelof increases in prison population rates wasmarkedly lower.
The prison population rate decreased in eightcountries (figure 6). Because of the growth innational populations in most countries thedecreases were generally greater than thedecreases in prison population numbers.
Of the 31 United Nations ember tates in theAmericas on which the necessary information wasavailable (2002 2007), prison population ratesrose during this five year period in 23, fell inseven and remained unchanged in one. Rises ofmore than 20% were recorded in 12 countries(figure 7). Only one of the seven countries thatregistered falls in this period had a fall of morethan 20% (figure 8).
Figure 5. Largest increases in prison populationrates in the Americas (per 100,000 of thenational population) 1997 2007 (%)
0 20 40 60 80 100 120 140
Barbados *Paraguay
GuyanaPeruChileHaiti
El SalvadorArgentina
MexicoEcuador
Uruguay *Brazil
St Kitts and Nevis
Figure 6. Largest decreases in prison populationrates in the Americas (per 100,000 of thenational population) 1997 2007 (%)
40 30 20 10 0
DominicaBelizeCanadaGuatemala *Bahamas *St Vincent & the GrenadinesTrinidad and TobagoVenezuela
Figure 7. Largest increases in prison populationrates in the Americas (per 100,000 of thenational population) 2002 2007 (%)
0 20 40 60 80 100 120 140
BarbadosBelize
GrenadaChile
Antigua and BarbudaSt Kitts and Nevis
PeruEl Salvador
BrazilHaiti
GuyanaEcuador
m s
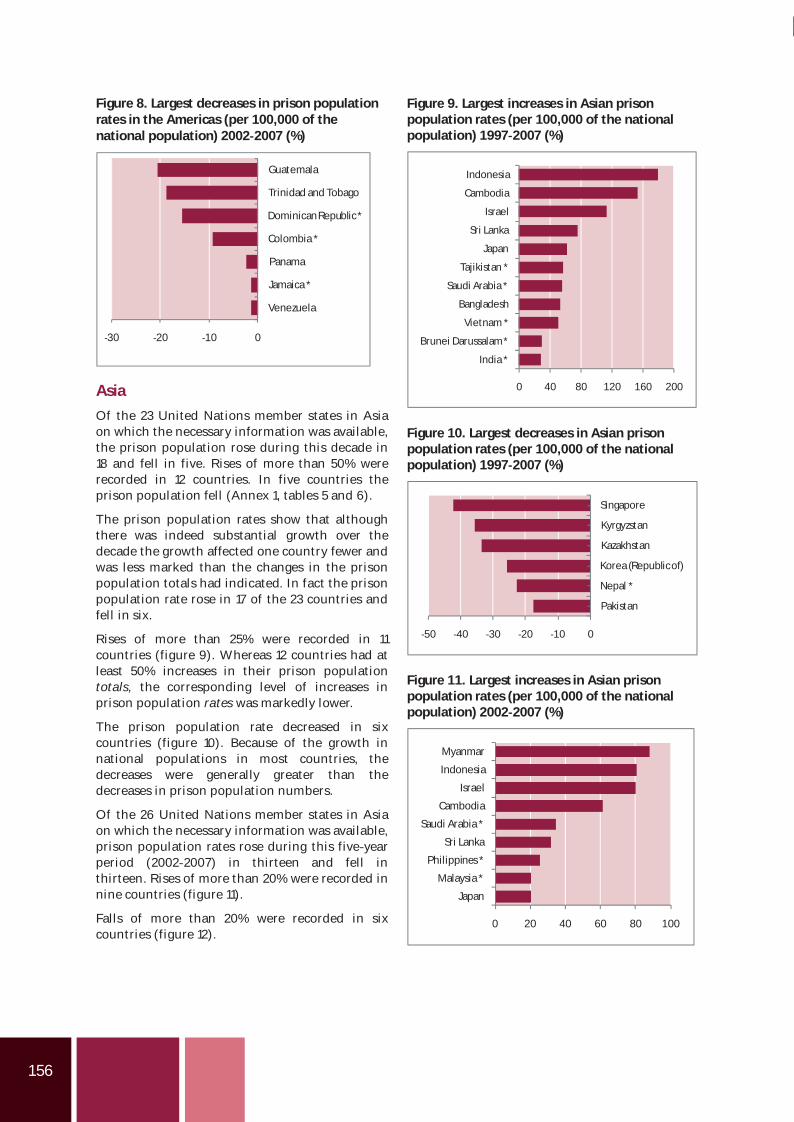
156
Figure 8. Largest decreases in prison populationrates in the Americas (per 100,000 of thenational population) 2002 2007 (%)
30 20 10 0
Venezuela
Jamaica *
Panama
Colombia *
DominicanRepublic*
Trinidad and Tobago
Guatemala
Asia
Of the 23 United Nations member states in Asiaon which the necessary information was available,the prison population rose during this decade in18 and fell in five. Rises of more than 50% wererecorded in 12 countries. In five countries theprison population fell (Annex 1, tables 5 and 6).
The prison population rates show that althoughthere was indeed substantial growth over thedecade the growth affected one country fewer andwas less marked than the changes in the prisonpopulation totals had indicated. In fact the prisonpopulation rate rose in 17 of the 23 countries andfell in six.
Rises of more than 25% were recorded in 11countries (figure 9). Whereas 12 countries had atleast 50% increases in their prison populationtotals, the corresponding level of increases inprison population rates was markedly lower.
The prison population rate decreased in sixcountries (figure 10). Because of the growth innational populations in most countries, thedecreases were generally greater than thedecreases in prison population numbers. Of the 26 United Nations member states in Asiaon which the necessary information was available,prison population rates rose during this five yearperiod (2002 2007) in thirteen and fell inthirteen. Rises of more than 20% were recorded innine countries (figure 11).
Falls of more than 20% were recorded in sixcountries (figure 12).
Figure 9. Largest increases in Asian prisonpopulation rates (per 100,000 of the nationalpopulation) 1997 2007 (%)
0 40 80 120 160 200
India *
Brunei Darussalam*
Vietnam *
Bangladesh
Saudi Arabia *
Tajikistan *
Japan
Sri Lanka
Israel
Cambodia
Indonesia
Figure 10. Largest decreases in Asian prisonpopulation rates (per 100,000 of the nationalpopulation) 1997 2007 (%)
50 40 30 20 10 0
Pakistan
Nepal *
Korea (Republicof)
Kazakhstan
Kyrgyzstan
Singapore
Figure 11. Largest increases in Asian prisonpopulation rates (per 100,000 of the nationalpopulation) 2002 2007 (%)
0 20 40 60 80 100
Japan
Malaysia *
Philippines *
Sri Lanka
Saudi Arabia *
Cambodia
Israel
Indonesia
Myanmar
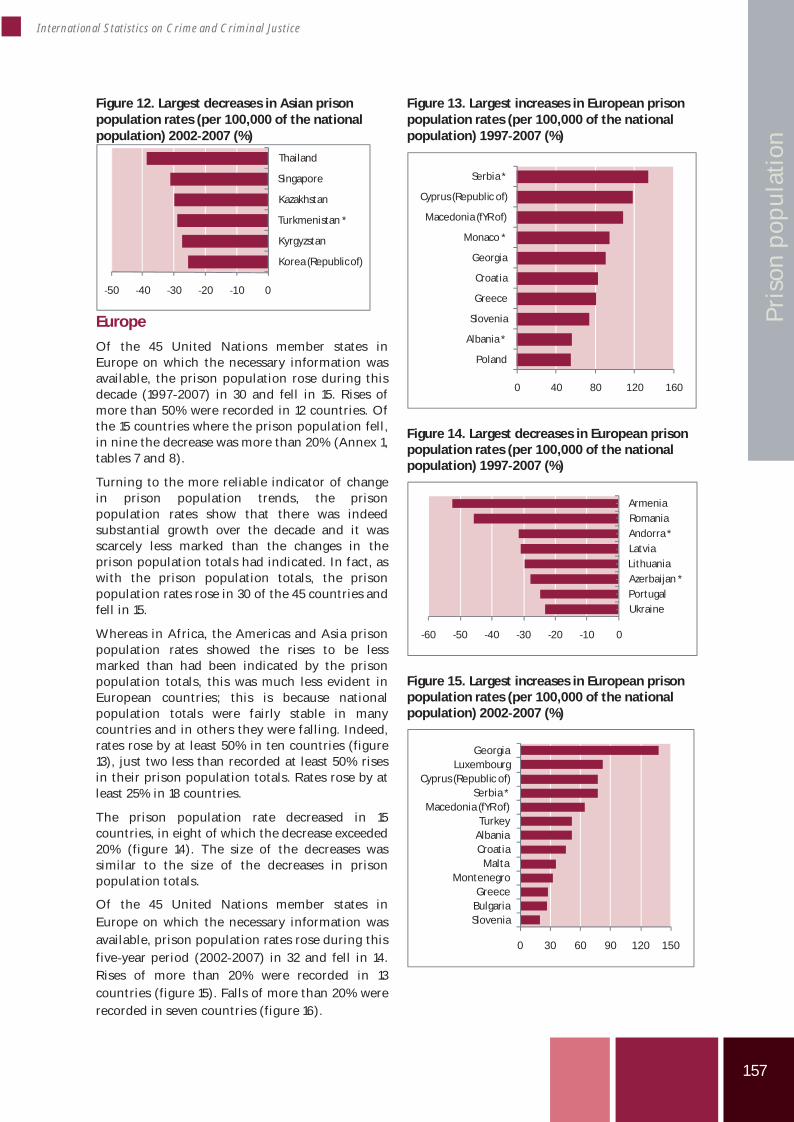
157
International Statistics on Crime and Criminal Justice
Pris
on p
opul
atio
n
Figure 12. Largest decreases in Asian prisonpopulation rates (per 100,000 of the nationalpopulation) 2002 2007 (%)
50 40 30 20 10 0
Korea (Republicof)
Kyrgyzstan
Turkmenistan *
Kazakhstan
Singapore
Thailand
Europe
Of the 45 United Nations member states inEurope on which the necessary information wasavailable, the prison population rose during thisdecade (1997 2007) in 30 and fell in 15. Rises ofmore than 50% were recorded in 12 countries. Ofthe 15 countries where the prison population fell,in nine the decrease was more than 20% (Annex 1,tables 7 and 8).
Turning to the more reliable indicator of changein prison population trends, the prisonpopulation rates show that there was indeedsubstantial growth over the decade and it wasscarcely less marked than the changes in theprison population totals had indicated. In fact, aswith the prison population totals, the prisonpopulation rates rose in 30 of the 45 countries andfell in 15.
Whereas in Africa, the Americas and Asia prisonpopulation rates showed the rises to be lessmarked than had been indicated by the prisonpopulation totals, this was much less evident inEuropean countries; this is because nationalpopulation totals were fairly stable in manycountries and in others they were falling. Indeed,rates rose by at least 50% in ten countries (figure13), just two less than recorded at least 50% risesin their prison population totals. Rates rose by atleast 25% in 18 countries.
The prison population rate decreased in 15countries, in eight of which the decrease exceeded20% (figure 14). The size of the decreases wassimilar to the size of the decreases in prisonpopulation totals.
Of the 45 United Nations member states inEurope on which the necessary information wasavailable, prison population rates rose during thisfive year period (2002 2007) in 32 and fell in 14.Rises of more than 20% were recorded in 13countries (figure 15). Falls of more than 20% wererecorded in seven countries (figure 16).
Figure 13. Largest increases in European prisonpopulation rates (per 100,000 of the nationalpopulation) 1997 2007 (%)
0 40 80 120 160
Poland
Albania *
Slovenia
Greece
Croatia
Georgia
Monaco *
Macedonia (fYR of)
Cyprus (Republic of)
Serbia *
Figure 14. Largest decreases in European prisonpopulation rates (per 100,000 of the nationalpopulation) 1997 2007 (%)
60 50 40 30 20 10 0
UkrainePortugalAzerbaijan *LithuaniaLatviaAndorra *RomaniaArmenia
Figure 15. Largest increases in European prisonpopulation rates (per 100,000 of the nationalpopulation) 2002 2007 (%)
0 30 60 90 120 150
SloveniaBulgariaGreece
MontenegroMalta
CroatiaAlbaniaTurkey
Macedonia (fYR of)Serbia *
Cyprus (Republic of)Luxembourg
Georgia
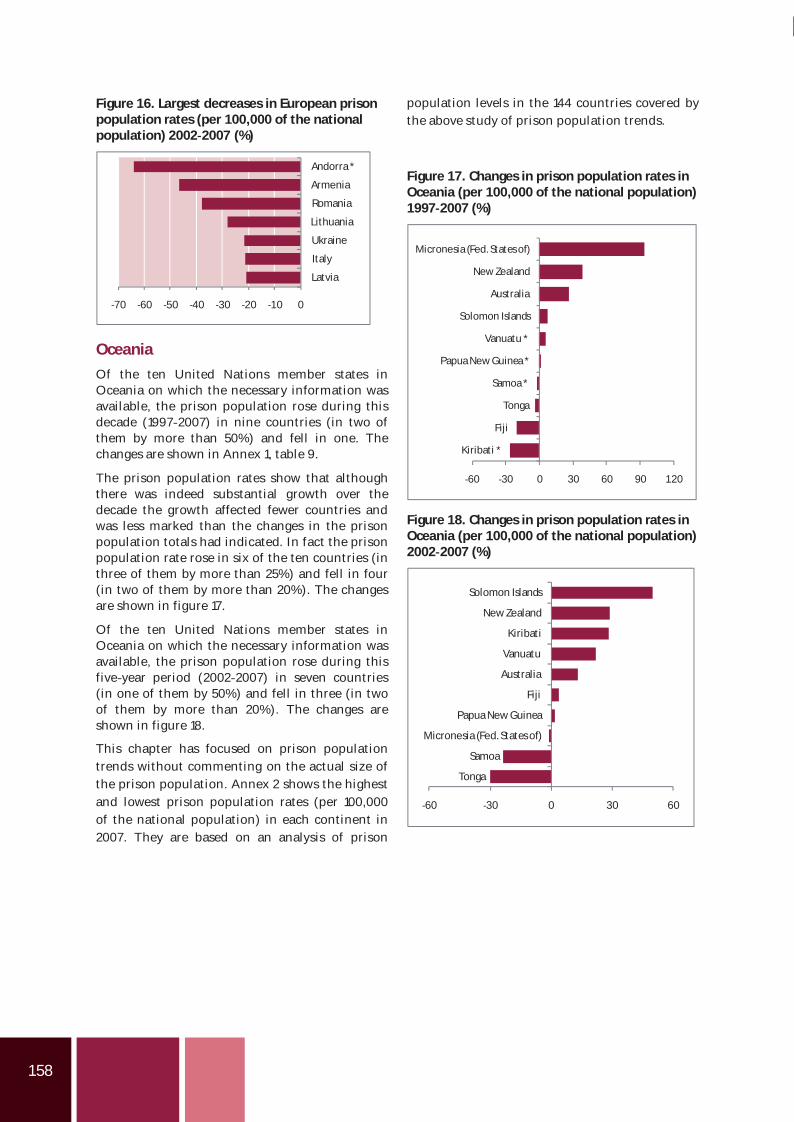
158
Figure 16. Largest decreases in European prisonpopulation rates (per 100,000 of the nationalpopulation) 2002 2007 (%)
70 60 50 40 30 20 10 0
Latvia
Italy
Ukraine
Lithuania
Romania
Armenia
Andorra *
Oceania
Of the ten United Nations member states inOceania on which the necessary information wasavailable, the prison population rose during thisdecade (1997 2007) in nine countries (in two ofthem by more than 50%) and fell in one. Thechanges are shown in Annex 1, table 9.
The prison population rates show that althoughthere was indeed substantial growth over thedecade the growth affected fewer countries andwas less marked than the changes in the prisonpopulation totals had indicated. In fact the prisonpopulation rate rose in six of the ten countries (inthree of them by more than 25%) and fell in four(in two of them by more than 20%). The changesare shown in figure 17.
Of the ten United Nations member states inOceania on which the necessary information wasavailable, the prison population rose during thisfive year period (2002 2007) in seven countries(in one of them by 50%) and fell in three (in twoof them by more than 20%). The changes areshown in figure 18.
This chapter has focused on prison populationtrends without commenting on the actual size ofthe prison population. Annex 2 shows the highestand lowest prison population rates (per 100,000of the national population) in each continent in2007. They are based on an analysis of prison
population levels in the 144 countries covered bythe above study of prison population trends.
Figure 17. Changes in prison population rates inOceania (per 100,000 of the national population)1997 2007 (%)
60 30 0 30 60 90 120
Kiribati *
Fiji
Tonga
Samoa *
Papua New Guinea *
Vanuatu *
Solomon Islands
Australia
New Zealand
Micronesia (Fed.States of)
Figure 18. Changes in prison population rates inOceania (per 100,000 of the national population)2002 2007 (%)
60 30 0 30 60
Tonga
Samoa
Micronesia (Fed.States of)
Papua New Guinea
Fiji
Australia
Vanuatu
Kiribati
New Zealand
Solomon Islands
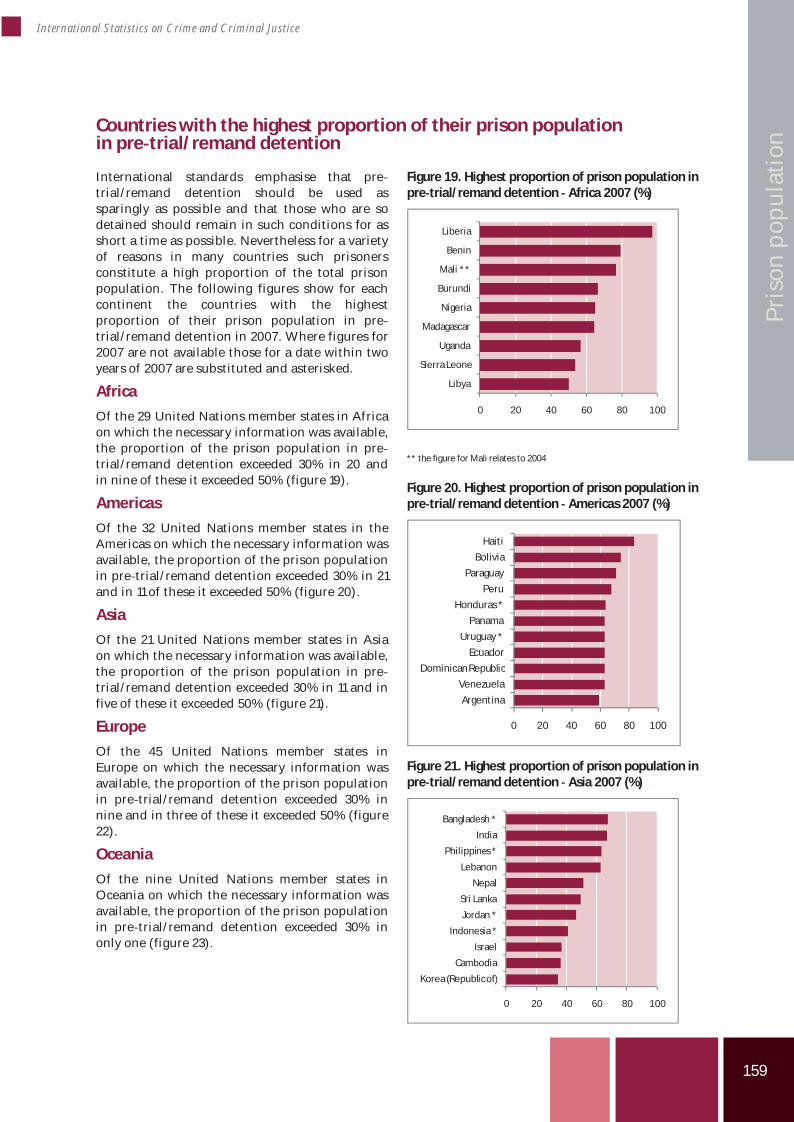
159
International Statistics on Crime and Criminal Justice
Pris
on p
opul
atio
n Countries with the highest proportion of their prison populationin pre trial/remand detention
International standards emphasise that pretrial/remand detention should be used assparingly as possible and that those who are sodetained should remain in such conditions for asshort a time as possible. Nevertheless for a varietyof reasons in many countries such prisonersconstitute a high proportion of the total prisonpopulation. The following figures show for eachcontinent the countries with the highestproportion of their prison population in pretrial/remand detention in 2007. Where figures for2007 are not available those for a date within twoyears of 2007 are substituted and asterisked.
Africa
Of the 29 United Nations member states in Africaon which the necessary information was available,the proportion of the prison population in pretrial/remand detention exceeded 30% in 20 andin nine of these it exceeded 50% (figure 19).
Americas
Of the 32 United Nations member states in theAmericas on which the necessary information wasavailable, the proportion of the prison populationin pre trial/remand detention exceeded 30% in 21and in 11 of these it exceeded 50% (figure 20).
Asia
Of the 21 United Nations member states in Asiaon which the necessary information was available,the proportion of the prison population in pretrial/remand detention exceeded 30% in 11 and infive of these it exceeded 50% (figure 21).
Europe
Of the 45 United Nations member states inEurope on which the necessary information wasavailable, the proportion of the prison populationin pre trial/remand detention exceeded 30% innine and in three of these it exceeded 50% (figure22).
Oceania
Of the nine United Nations member states inOceania on which the necessary information wasavailable, the proportion of the prison populationin pre trial/remand detention exceeded 30% inonly one (figure 23).
Figure 19. Highest proportion of prison population inpre trial/remand detention Africa 2007 (%)
0 20 40 60 80 100
Libya
Sierra Leone
Uganda
Madagascar
Nigeria
Burundi
Mali **
Benin
Liberia
** the figure for Mali relates to 2004
Figure 20. Highest proportion of prison population inpre trial/remand detention Americas 2007 (%)
0 20 40 60 80 100
Argentina
Venezuela
DominicanRepublic
Ecuador
Uruguay *
Panama
Honduras *
Peru
Paraguay
Bolivia
Haiti
Figure 21. Highest proportion of prison population inpre trial/remand detention Asia 2007 (%)
0 20 40 60 80 100
Korea (Republicof)
Cambodia
Israel
Indonesia *
Jordan *
Sri Lanka
Nepal
Lebanon
Philippines *
India
Bangladesh *
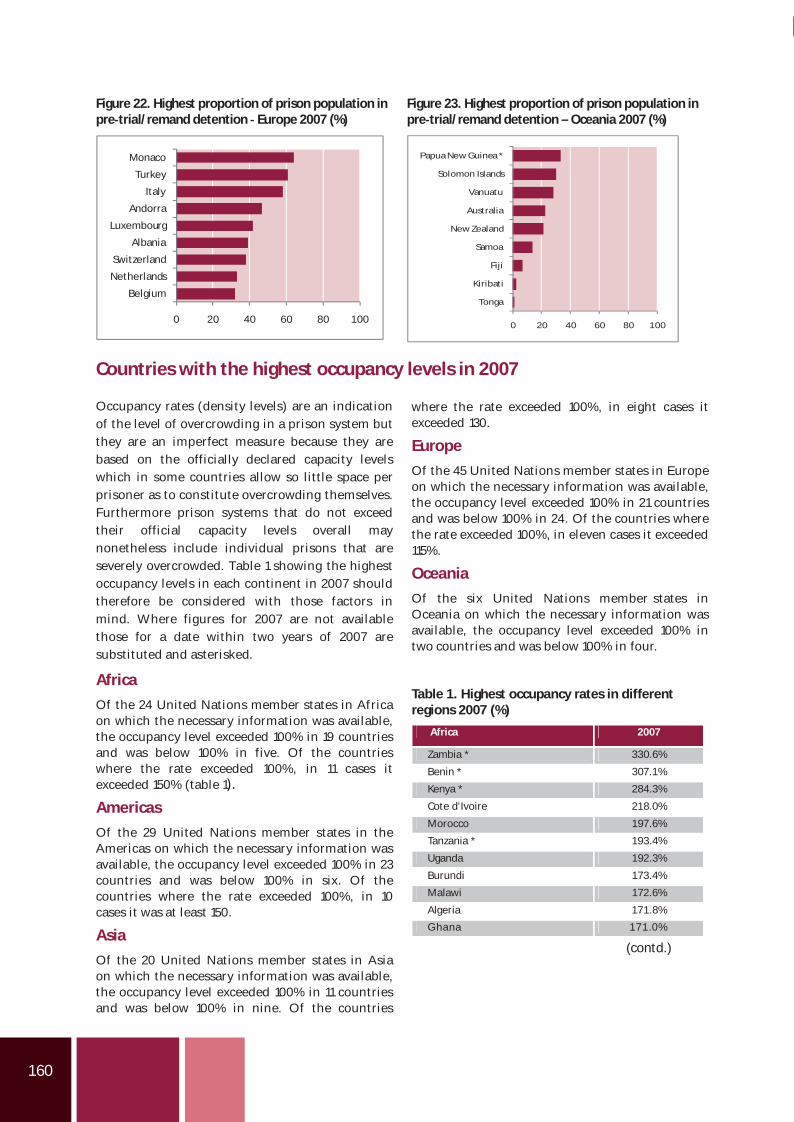
160
Figure 22. Highest proportion of prison population inpre trial/remand detention Europe 2007 (%)
0 20 40 60 80 100
Belgium
Netherlands
Switzerland
Albania
Luxembourg
Andorra
Italy
Turkey
Monaco
Figure 23. Highest proportion of prison population inpre trial/remand detention – Oceania 2007 (%)
0 20 40 60 80 100
Tonga
Kiribati
Fiji
Samoa
New Zealand
Australia
Vanuatu
Solomon Islands
Papua New Guinea *
Countries with the highest occupancy levels in 2007 Occupancy rates (density levels) are an indicationof the level of overcrowding in a prison system butthey are an imperfect measure because they arebased on the officially declared capacity levelswhich in some countries allow so little space perprisoner as to constitute overcrowding themselves.Furthermore prison systems that do not exceedtheir official capacity levels overall maynonetheless include individual prisons that areseverely overcrowded. Table 1 showing the highestoccupancy levels in each continent in 2007 shouldtherefore be considered with those factors inmind. Where figures for 2007 are not availablethose for a date within two years of 2007 aresubstituted and asterisked.
Africa
Of the 24 United Nations member states in Africaon which the necessary information was available,the occupancy level exceeded 100% in 19 countriesand was below 100% in five. Of the countrieswhere the rate exceeded 100%, in 11 cases itexceeded 150% (table 1). Americas
Of the 29 United Nations member states in theAmericas on which the necessary information wasavailable, the occupancy level exceeded 100% in 23countries and was below 100% in six. Of thecountries where the rate exceeded 100%, in 10cases it was at least 150.
Asia
Of the 20 United Nations member states in Asiaon which the necessary information was available,the occupancy level exceeded 100% in 11 countriesand was below 100% in nine. Of the countries
where the rate exceeded 100%, in eight cases itexceeded 130.
Europe
Of the 45 United Nations member states in Europeon which the necessary information was available,the occupancy level exceeded 100% in 21 countriesand was below 100% in 24. Of the countries wherethe rate exceeded 100%, in eleven cases it exceeded115%.
Oceania
Of the six United Nations member states inOceania on which the necessary information wasavailable, the occupancy level exceeded 100% intwo countries and was below 100% in four.
Table 1. Highest occupancy rates in differentregions 2007 (%)
Africa 2007
Zambia * 330.6%
Benin * 307.1%
Kenya * 284.3%
Cote d'Ivoire 218.0%
Morocco 197.6%
Tanzania * 193.4%
Uganda 192.3%
Burundi 173.4%
Malawi 172.6%
Algeria 171.8%
Ghana 171.0%
(contd.)
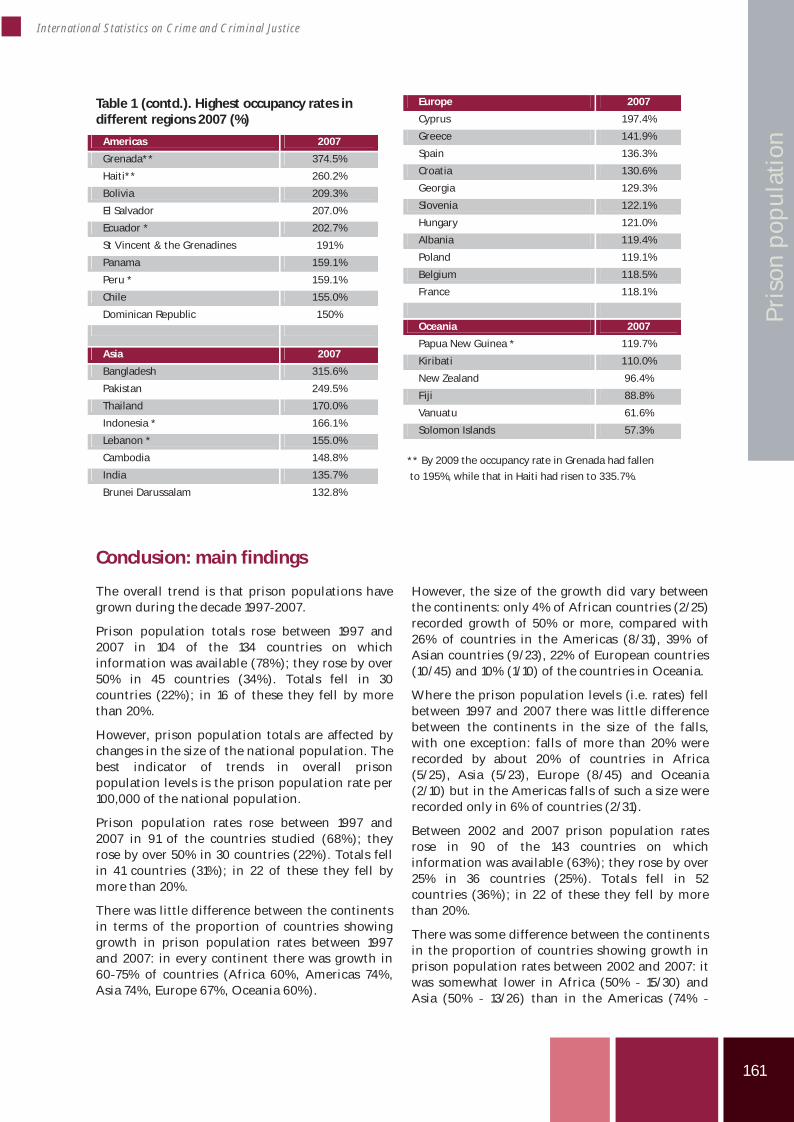
161
International Statistics on Crime and Criminal Justice
Pris
on p
opul
atio
n
Table 1 (contd.). Highest occupancy rates indifferent regions 2007 (%)
Americas 2007
Grenada** 374.5%
Haiti** 260.2%
Bolivia 209.3%
El Salvador 207.0%
Ecuador * 202.7%
St Vincent & the Grenadines 191%
Panama 159.1%
Peru * 159.1%
Chile 155.0%
Dominican Republic 150%
Asia 2007
Bangladesh 315.6%
Pakistan 249.5%
Thailand 170.0%
Indonesia * 166.1%
Lebanon * 155.0%
Cambodia 148.8%
India 135.7%
Brunei Darussalam 132.8%
Europe 2007
Cyprus 197.4%
Greece 141.9%
Spain 136.3%
Croatia 130.6%
Georgia 129.3%
Slovenia 122.1%
Hungary 121.0%
Albania 119.4%
Poland 119.1%
Belgium 118.5%
France 118.1%
Oceania 2007
Papua New Guinea * 119.7%
Kiribati 110.0%
New Zealand 96.4%
Fiji 88.8%
Vanuatu 61.6%
Solomon Islands 57.3%
** By 2009 the occupancy rate in Grenada had fallen
to 195%, while that in Haiti had risen to 335.7%.
Conclusion: main findings
The overall trend is that prison populations havegrown during the decade 1997 2007.
Prison population totals rose between 1997 and2007 in 104 of the 134 countries on whichinformation was available (78%); they rose by over50% in 45 countries (34%). Totals fell in 30countries (22%); in 16 of these they fell by morethan 20%.
However, prison population totals are affected bychanges in the size of the national population. Thebest indicator of trends in overall prisonpopulation levels is the prison population rate per100,000 of the national population.
Prison population rates rose between 1997 and2007 in 91 of the countries studied (68%); theyrose by over 50% in 30 countries (22%). Totals fellin 41 countries (31%); in 22 of these they fell bymore than 20%.
There was little difference between the continentsin terms of the proportion of countries showinggrowth in prison population rates between 1997and 2007: in every continent there was growth in60 75% of countries (Africa 60%, Americas 74%,Asia 74%, Europe 67%, Oceania 60%).
However, the size of the growth did vary betweenthe continents: only 4% of African countries (2/25)recorded growth of 50% or more, compared with26% of countries in the Americas (8/31), 39% ofAsian countries (9/23), 22% of European countries(10/45) and 10% (1/10) of the countries in Oceania.
Where the prison population levels (i.e. rates) fellbetween 1997 and 2007 there was little differencebetween the continents in the size of the falls,with one exception: falls of more than 20% wererecorded by about 20% of countries in Africa(5/25), Asia (5/23), Europe (8/45) and Oceania(2/10) but in the Americas falls of such a size wererecorded only in 6% of countries (2/31).
Between 2002 and 2007 prison population ratesrose in 90 of the 143 countries on whichinformation was available (63%); they rose by over25% in 36 countries (25%). Totals fell in 52countries (36%); in 22 of these they fell by morethan 20%.
There was some difference between the continentsin the proportion of countries showing growth inprison population rates between 2002 and 2007: itwas somewhat lower in Africa (50% 15/30) andAsia (50% 13/26) than in the Americas (74%
162
23/31), Europe and Oceania (both 70% 32/46 and7/10 respectively).
Similarly, there was some continental variation inthe size of growth between 2002 and 2007: growthof 25% or more was recorded in 15% of Europeancountries (7/46) and 17% of African countries(5/30) but in 27% of those in Asia (7/26), 29% ofthose in America (9/31) and 30% of those inOceania (3/10).
Where the prison population rates fell between2002 and 2007 there was little difference betweenthe continents in the size of the falls, again withthe exception of the Americas: falls of more than20% were recorded by 15 23% of countries inAfrica (6/30), Asia (6/26), Europe (7/46) andOceania (2/10) but in only 1 (3%) of the 31countries in the Americas on which suchinformation was available.
Comparison of the changes over the whole 10 yearperiod from 1997 with those in the five years from2002 shows that a smaller proportion of Africanand Asian countries showed growth between 2002and 2007 than showed growth over the wholedecade 1997 2007. No such change was apparent inthe figures for the other continents.
There were sharp contrasts between the highestand lowest prison population levels in the samecontinent:
In Africa the highest rates tend to be insouthern Africa, and the lowest rates inwestern Africa .In the Americas many of the highest rates arein the Caribbean while the lowest rates tend tobe in southern America.In Asia the highest rates tend to be in (formerSoviet) central Asia and the lowest rates insouth Asia.In Europe the highest rates are in the countriesof the former Soviet Union, while the lowestrates tend to be in the Nordic countries.In Oceania the highest rates are in NewZealand and Australia and the lowest rates inPacific island nations.
Pre trial/remand detention levels were high inmany countries. Of the 137 countries on whichinformation was available 62 (45%) had at least30% of their prison population in pre trial/remand
detention in 2007 and in 28 countries (20%) atleast half the prison population were held in suchconditions.
Pre trial/remand detention levels were generallyhigher in Africa, the Americas and Asia than inEurope and Oceania:
In Africa more than two thirds of countriesstudied had over 30% of their prisonpopulation in pre trial/remand detention andalmost a third had over 50% in such conditions.In the Americas almost two thirds of countriesstudied had over 30% of their prisonpopulation in pre trial/remand detention andmore than a third had over 50% in suchconditions.In Asia half the countries studied had over 30%of their prison population in pre trial/remanddetention and nearly a quarter had over 50% insuch conditions.By contrast, only one fifth of Europeancountries studied had over 30% of their prisonpopulation in pre trial/remand detention andonly three had over 50% in such conditions.Only one of the countries studied in Oceaniahad over 30% of the prison population in pretrial/remand detention.
Of the 124 countries on which information wasavailable the prison system in 76 (61%) had morethan 100% occupancy in 2007 and in 27 (22%) theoccupancy level was over 150%.
Occupancy levels were highest in countries inAfrica, the Americas and Asia but also exceeded100% in almost a half of European countries.
In 79% of African countries studied theoccupancy level exceeded 100% and in 46% itexceeded 150%.In 79% of countries studied in the Americas theoccupancy level exceeded 100% and in 34% itexceeded 150%.In 55% of Asian countries studied theoccupancy level exceeded 100% and in 25% itexceeded 150%.In 47% of European countries studied theoccupancy level exceeded 100% and in one ofthem it exceeded 150%.In 2 of 6 countries studied in Oceania (33%)the occupancy level exceeded 100% but it didnot exceed 120% in either of them.
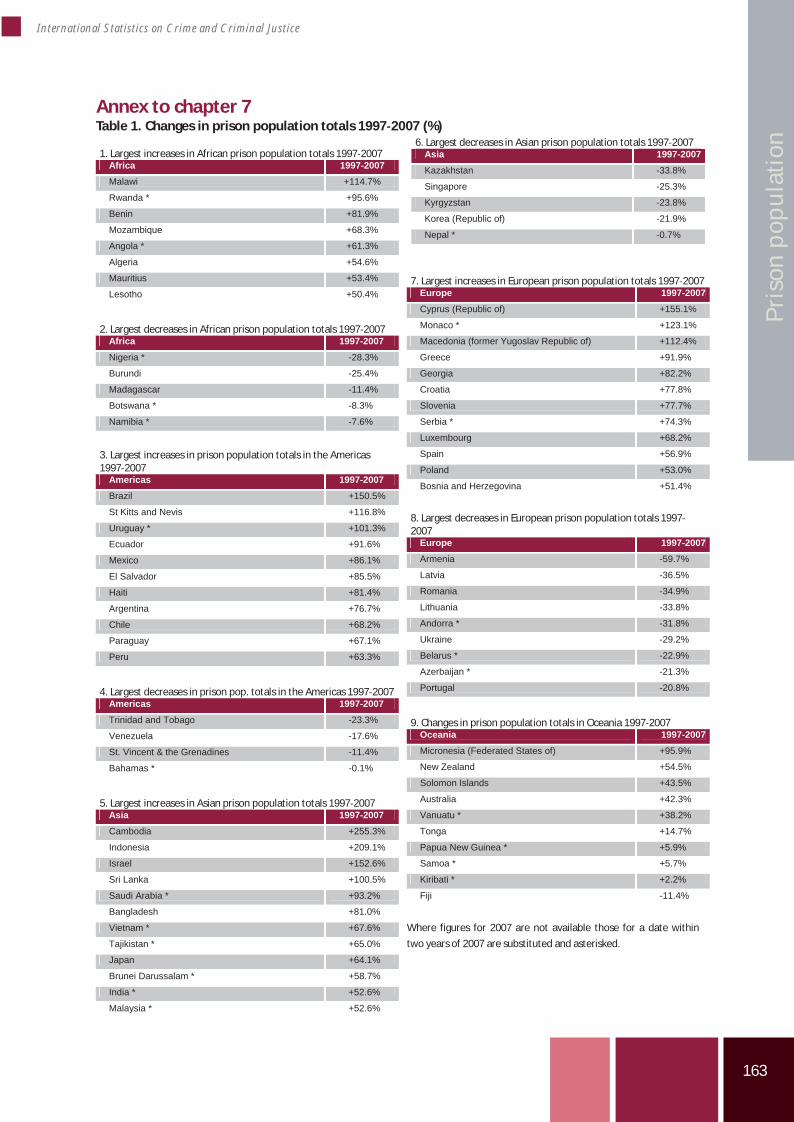
163
International Statistics on Crime and Criminal Justice
Pris
on p
opul
atio
n
Annex to chapter 7Table 1. Changes in prison population totals 1997 2007 (%)
1. Largest increases in African prison population totals 1997 2007Africa 1997-2007Malawi +114.7%
Rwanda * +95.6%
Benin +81.9%
Mozambique +68.3%
Angola * +61.3%
Algeria +54.6%
Mauritius +53.4%
Lesotho +50.4%
2. Largest decreases in African prison population totals 1997 2007Africa 1997-2007Nigeria * -28.3%
Burundi -25.4%
Madagascar -11.4%
Botswana * -8.3%
Namibia * -7.6%
3. Largest increases in prison population totals in the Americas1997 2007
Americas 1997-2007Brazil +150.5%
St Kitts and Nevis +116.8%
Uruguay * +101.3%
Ecuador +91.6%
Mexico +86.1%
El Salvador +85.5%
Haiti +81.4%
Argentina +76.7%
Chile +68.2%
Paraguay +67.1%
Peru +63.3%
4. Largest decreases in prison pop. totals in the Americas 1997 2007Americas 1997-2007Trinidad and Tobago -23.3%
Venezuela -17.6%
St. Vincent & the Grenadines -11.4%
Bahamas * -0.1%
5. Largest increases in Asian prison population totals 1997 2007Asia 1997-2007Cambodia +255.3%
Indonesia +209.1%
Israel +152.6%
Sri Lanka +100.5%
Saudi Arabia * +93.2%
Bangladesh +81.0%
Vietnam * +67.6%
Tajikistan * +65.0%
Japan +64.1%
Brunei Darussalam * +58.7%
India * +52.6%
Malaysia * +52.6%
6. Largest decreases in Asian prison population totals 1997 2007Asia 1997-2007Kazakhstan -33.8%
Singapore -25.3%
Kyrgyzstan -23.8%
Korea (Republic of) -21.9%
Nepal * -0.7%
7. Largest increases in European prison population totals 1997 2007Europe 1997-2007Cyprus (Republic of) +155.1%
Monaco * +123.1%
Macedonia (former Yugoslav Republic of) +112.4%
Greece +91.9%
Georgia +82.2%
Croatia +77.8%
Slovenia +77.7%
Serbia * +74.3%
Luxembourg +68.2%
Spain +56.9%
Poland +53.0%
Bosnia and Herzegovina +51.4%
8. Largest decreases in European prison population totals 19972007
Europe 1997-2007Armenia -59.7%
Latvia -36.5%
Romania -34.9%
Lithuania -33.8%
Andorra * -31.8%
Ukraine -29.2%
Belarus * -22.9%
Azerbaijan * -21.3%
Portugal -20.8%
9. Changes in prison population totals in Oceania 1997 2007Oceania 1997-2007Micronesia (Federated States of) +95.9%
New Zealand +54.5%
Solomon Islands +43.5%
Australia +42.3%
Vanuatu * +38.2%
Tonga +14.7%
Papua New Guinea * +5.9%
Samoa * +5.7%
Kiribati * +2.2%
Fiji -11.4%
Where figures for 2007 are not available those for a date within
two years of 2007 are substituted and asterisked.
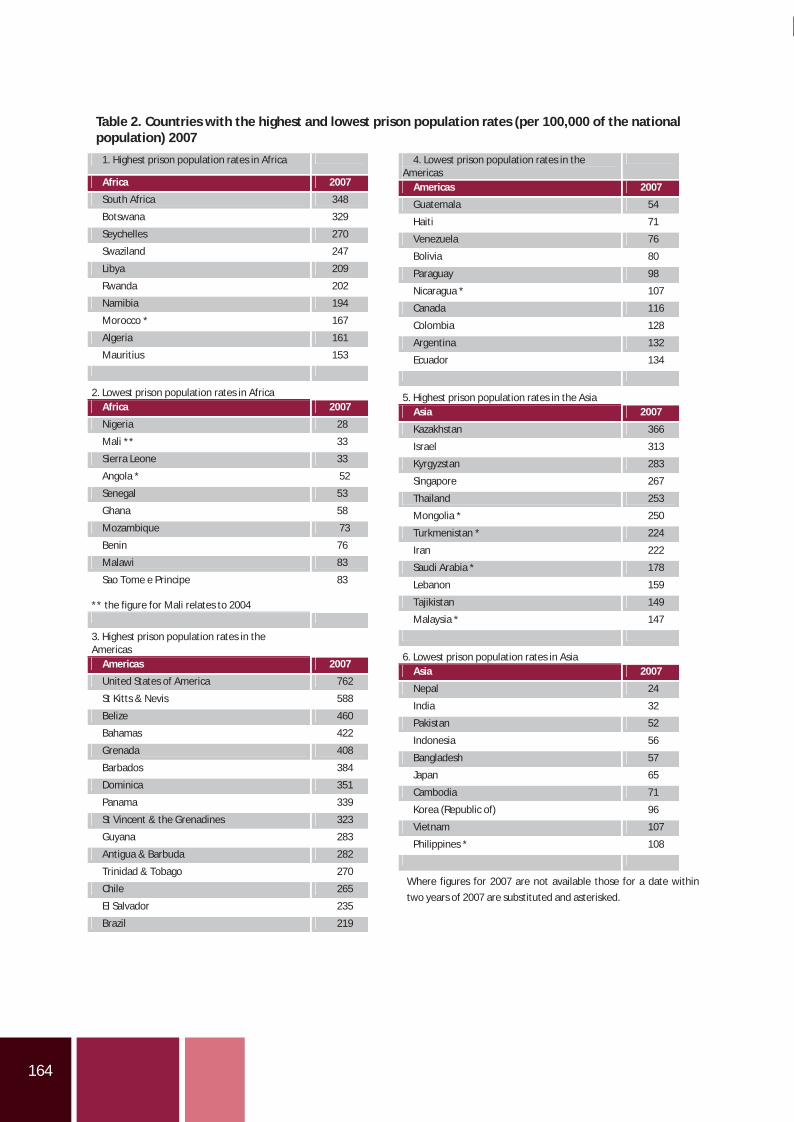
164
Table 2. Countries with the highest and lowest prison population rates (per 100,000 of the nationalpopulation) 2007
1. Highest prison population rates in Africa
frica 2007
South Africa 348
Botswana 329
Seychelles 270
Swaziland 247
Libya 209
Rwanda 202
Namibia 194
Morocco * 167
Algeria 161
Mauritius 153
2. Lowest prison population rates in AfricaAfrica 2007
Nigeria 28
Mali ** 33
Sierra Leone 33
Angola * 52
Senegal 53
Ghana 58
Mozambique 73
Benin 76
Malawi 83
Sao Tome e Principe 83
** the figure for Mali relates to 2004
3. Highest prison population rates in theAmericas
Americas 2007
United States of America 762
St Kitts & Nevis 588
Belize 460
Bahamas 422
Grenada 408
Barbados 384
Dominica 351
Panama 339
St Vincent & the Grenadines 323
Guyana 283
Antigua & Barbuda 282
Trinidad & Tobago 270
Chile 265
El Salvador 235
Brazil 219
4. Lowest prison population rates in theAmericas
Americas 2007
Guatemala 54
Haiti 71
Venezuela 76
Bolivia 80
Paraguay 98
Nicaragua * 107
Canada 116
Colombia 128
Argentina 132
Ecuador 134
5. Highest prison population rates in the AsiaAsia 2007
Kazakhstan 366
Israel 313
Kyrgyzstan 283
Singapore 267
Thailand 253
Mongolia * 250
Turkmenistan * 224
Iran 222
Saudi Arabia * 178
Lebanon 159
Tajikistan 149
Malaysia * 147
6. Lowest prison population rates in AsiaAsia 2007
Nepal 24
India 32
Pakistan 52
Indonesia 56
Bangladesh 57
Japan 65
Cambodia 71
Korea (Republic of) 96
Vietnam 107
Philippines * 108
Where figures for 2007 are not available those for a date within
two years of 2007 are substituted and asterisked.
A

165
International Statistics on Crime and Criminal Justice
Pris
on p
opul
atio
n
7. Highest prison population rates in the Europe
Europe 2007
Russian Federation 613
Belarus * 468
Georgia 417
Ukraine 323
Estonia 322
Latvia 287
Moldova 242
Lithuania 239
Poland 230
Azerbaijan * 229
Czech Republic 182
Luxembourg 155
8. Lowest prison population rates in EuropeEurope 2007
Andorra * 37
Iceland 37
Bosnia 62
Slovenia 66
Denmark 67
Finland 67
Norway 73
Sweden 74
Ireland 76
Monaco 76
Switzerland 76
Italy 77
9. Prison population rates in OceaniaOceania 2007
New Zealand 188
Australia 130
Fiji 112
Samoa 99
Micronesia 89
Kiribati 86
Tonga 74
Papua New Guinea 61
Vanuatu 56
Solomon Islands 42
Where figures for 2007 are not available thosefor a date within two years of 2007 aresubstituted and asterisked.

166
167
International Statistics on Crime and Criminal Justice
Cha
lleng
es
Chapter 8 – Crime and criminal justice statisticschallenges
Anna Alvazzi del Frate*
Abstract
An efficient system for the collection, analysis and dissemination of information on crime and criminaljustice is a prerequisite for effective crime prevention. Over the past few years much emphasis has beenplaced on issues of measurement of crime at the international level. Quantitative information on crime andcriminal justice remain scarce and mostly limited to the developed world. Furthermore, the availability ofinternationally comparable statistics is very limited. Different sources may provide slightly differentinformation, thus increasing the confusion of the users. There is still no unique reliable source ofinternational crime statistics which could guarantee simple use and comparability of data. This is a problemwhich may never find a solution because of the serious challenges of measuring hidden phenomena: what ismeasurable is only what comes to light.
Introduction
Administrative statistics on recorded crimes arethe most readily available type of data. Virtuallyall law enforcement systems keep records ofcrimes committed in their respectivejurisdictions. If these data are regularlypublished, they can also be used to monitortrends in the same jurisdiction over time.Nevertheless, there are well known challenges instraightforward comparisons of administrativedata in the field of criminal justice. Victimizationsurveys not only provide information thatsupplements and complements administrativestatistics, but may be easier to compare acrosscountries. This chapter will highlight the currentchallenges in the collection and analysis ofinternational statistics on crime and criminaljustice, with particular reference to the difficultiesfaced by developing countries in producingreliable statistics.
The difficulty or even impossibility to assess thecrime situation depends on the lack orinsufficiency of reliable relevant statistics. Thereare three prerequisites to the development of asolid system of crime and criminal justicestatistics:
a) The availability of specific data collectionmethods and instruments, adapted to the localcontext;
b) The availability of technical expertise and/orequipment to carry out data collection andanalysis; and
c) The commitment and motivation of relevantgovernment agencies to introduce a strategicapproach to the collection and analysis of crimeand criminal justice statistics.
Lack of resources may often be considered themain obstacle to the collection and analysis ofstatistics. However, experts often suggest thatlack of training, lack of commitment eitherfrom the government or heads of responsibleinstitutions, lack of proper legislation, fear ofmisuse of the data or insufficient informationon the good use that can be made of statisticsmay equally represent serious obstacles.Participants in a workshop on crime statistics inAddis Ababa in 2008 (UNODC UNECA 2008)indicated a number of issues they perceived aspriorities to be addressed in order to improvecrime and criminal justice statistics in theirrespective countries (figure 1).
*Research Officer, United Nations Office on Drugs and Crime (UNODC)
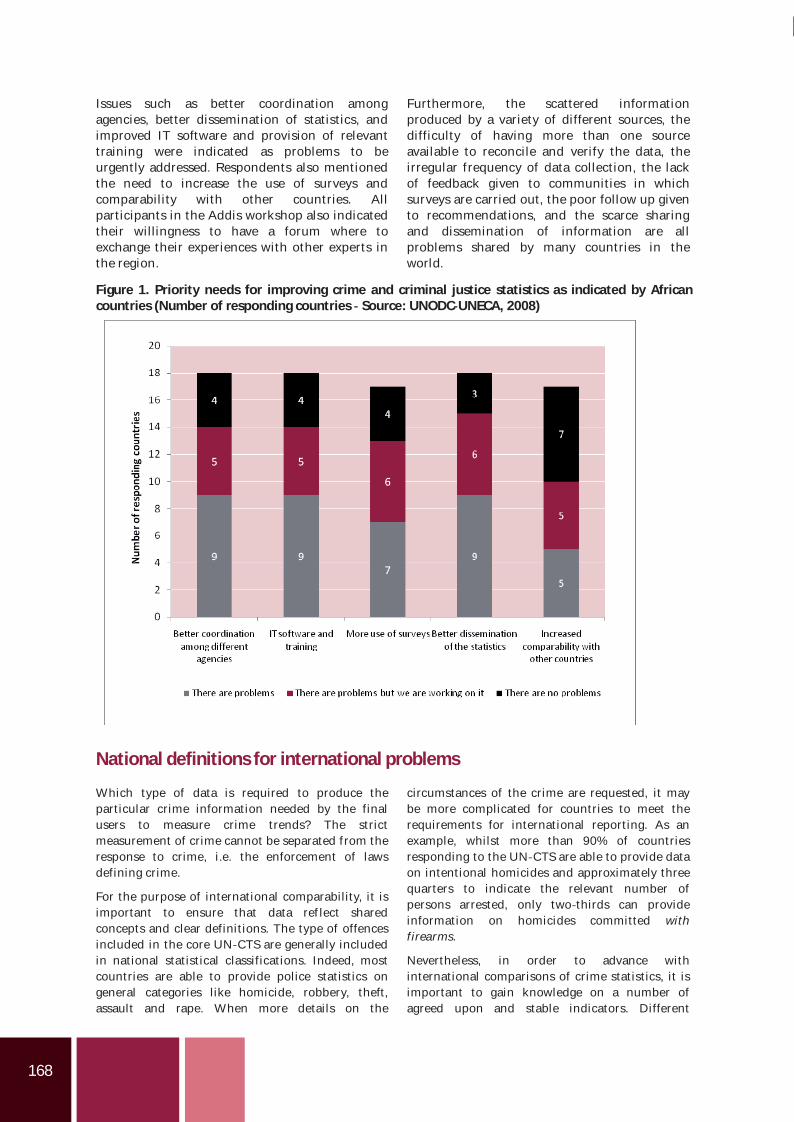
168
Issues such as better coordination amongagencies, better dissemination of statistics, andimproved IT software and provision of relevanttraining were indicated as problems to beurgently addressed. Respondents also mentionedthe need to increase the use of surveys andcomparability with other countries. Allparticipants in the Addis workshop also indicatedtheir willingness to have a forum where toexchange their experiences with other experts inthe region.
Furthermore, the scattered informationproduced by a variety of different sources, thedifficulty of having more than one sourceavailable to reconcile and verify the data, theirregular frequency of data collection, the lackof feedback given to communities in whichsurveys are carried out, the poor follow up givento recommendations, and the scarce sharingand dissemination of information are allproblems shared by many countries in theworld.
Figure 1. Priority needs for improving crime and criminal justice statistics as indicated by Africancountries (Number of responding countries Source: UNODC UNECA, 2008)
National definitions for international problems
Which type of data is required to produce theparticular crime information needed by the finalusers to measure crime trends? The strictmeasurement of crime cannot be separated from theresponse to crime, i.e. the enforcement of lawsdefining crime.
For the purpose of international comparability, it isimportant to ensure that data ref lect sharedconcepts and clear definitions. The type of offencesincluded in the core UN CTS are generally includedin national statistical classifications. Indeed, mostcountries are able to provide police statistics ongeneral categories like homicide, robbery, theft,assault and rape. When more details on the
circumstances of the crime are requested, it maybe more complicated for countries to meet therequirements for international reporting. As anexample, whilst more than 90% of countriesresponding to the UN CTS are able to provide dataon intentional homicides and approximately threequarters to indicate the relevant number ofpersons arrested, only two thirds can provideinformation on homicides committed withfirearms.
Nevertheless, in order to advance withinternational comparisons of crime statistics, it isimportant to gain knowledge on a number ofagreed upon and stable indicators. Different
169
International Statistics on Crime and Criminal Justice
Cha
lleng
es
countries may have different priorities, which mayresult in different ways to collect statistics.Countries may however need to compare data ontheir respective priority issues at the internationallevel.
Victimization surveys of general population andbusinesses, as well as self report surveys, are widelyaccepted as important tools to understand crimeproblems and trends. They also represent apromising area for the development ofinternationally comparable indicators. The UNODCUNECE Manual on Victimization Surveys hasrecently been finalized (UNODC UNECE 2010). TheManual was drafted by a Task Force composed ofexperts from seven countries and five internationalinstitutions. It covers a wide range of issues relatedto planning and implementing a victimizationsurvey. The Manual deals with ways to analyse,present and interpret data with a view tocommunicating key findings and results. It isaddressed in particular to countries that are in theprocess of developing victim survey programmes forthe first time and have limited experience in thisfield. It is expected that the Manual will assist in thecarrying out of victimization surveys, which may asa result provide important information on a widerange of issues that are best measured throughpopulation based survey.
The mix of administrative statistics and surveybased indicators is considered the best way to goabout assessing crime. The international community
may also establish priorities in the collection andanalysis of different crime and criminal justiceindicators. The identification of core indicators forselected crimes and components of the activity ofcriminal justice systems is also a priority forUNODC. Part of this work is being conducted incollaboration with international and regionalorganizations.
An interesting approach is the establishment ofsets of regional indicators. For example, a recentinitiative promoted by the Institute CISALVA,Universidad del Valle of Cali, Colombia, with thesupport of the Interamerican Development Bank,consists of the development of a system of regionalindicators to monitor urban safety and security inSouth American countries. The system ofindicators includes administrative and survey dataand represents an interesting sample of ‘core’indicators for the comparison across countries.Table 1 shows the proposed indicators andindicates which are included in the UN CTS.
An interesting aspect of the CISALVA project is thework done in identifying national sources in eachcountry for each indicator, which can be based onadministrative statistics produced by the criminaljustice system or the result of population basedsurveys. Since a number of these indicators areamong those included in the core UN CTS, theiruse at the regional level is likely to strengthen thecommitment and motivation of countries toprovide relevant statistics.
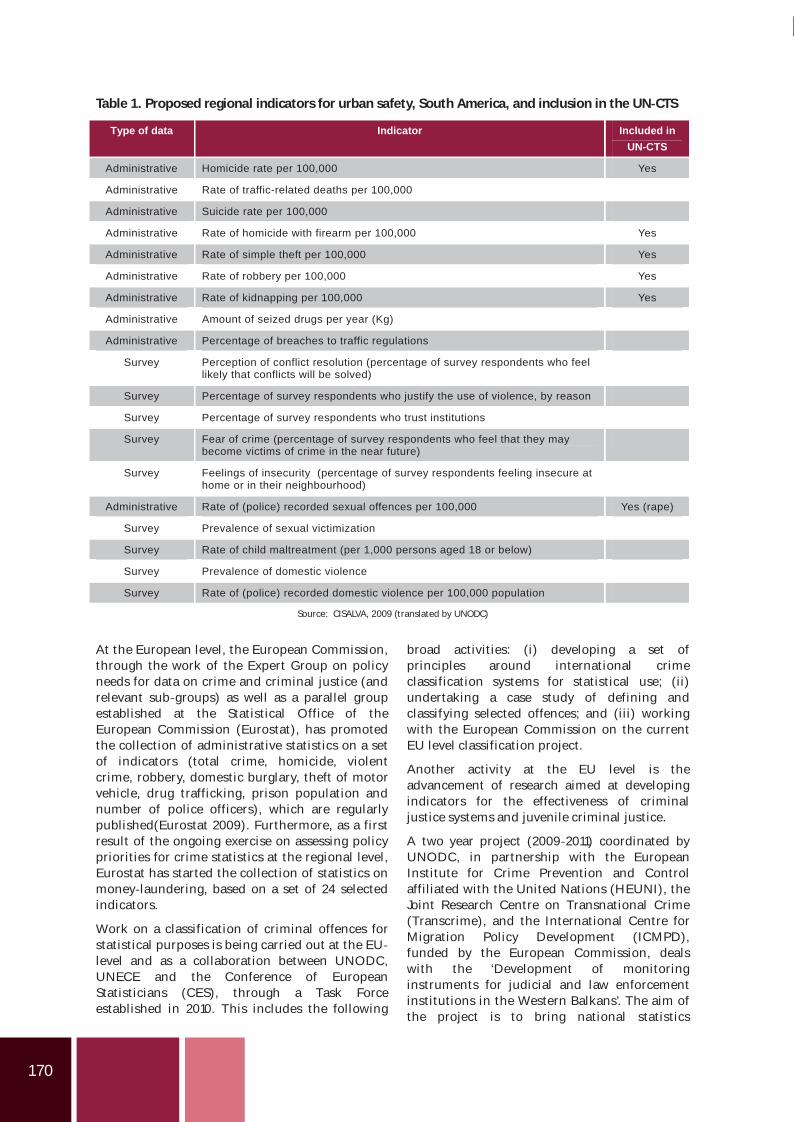
170
Table 1. Proposed regional indicators for urban safety, South America, and inclusion in the UN CTS
Type of data Indicator Included in UN-CTS
Administrative Homicide rate per 100,000 Yes
Administrative Rate of traffic-related deaths per 100,000
Administrative Suicide rate per 100,000
Administrative Rate of homicide with firearm per 100,000 Yes
Administrative Rate of simple theft per 100,000 Yes
Administrative Rate of robbery per 100,000 Yes
Administrative Rate of kidnapping per 100,000 Yes
Administrative Amount of seized drugs per year (Kg)
Administrative Percentage of breaches to traffic regulations
Survey Perception of conflict resolution (percentage of survey respondents who feel likely that conflicts will be solved)
Survey Percentage of survey respondents who justify the use of violence, by reason
Survey Percentage of survey respondents who trust institutions
Survey Fear of crime (percentage of survey respondents who feel that they may become victims of crime in the near future)
Survey Feelings of insecurity (percentage of survey respondents feeling insecure at home or in their neighbourhood)
Administrative Rate of (police) recorded sexual offences per 100,000 Yes (rape)
Survey Prevalence of sexual victimization
Survey Rate of child maltreatment (per 1,000 persons aged 18 or below)
Survey Prevalence of domestic violence
Survey Rate of (police) recorded domestic violence per 100,000 population
Source: CISALVA, 2009 (translated by UNODC)
At the European level, the European Commission,through the work of the Expert Group on policyneeds for data on crime and criminal justice (andrelevant sub groups) as well as a parallel groupestablished at the Statistical Office of theEuropean Commission (Eurostat), has promotedthe collection of administrative statistics on a setof indicators (total crime, homicide, violentcrime, robbery, domestic burglary, theft of motorvehicle, drug trafficking, prison population andnumber of police officers), which are regularlypublished(Eurostat 2009). Furthermore, as a firstresult of the ongoing exercise on assessing policypriorities for crime statistics at the regional level,Eurostat has started the collection of statistics onmoney laundering, based on a set of 24 selectedindicators.
Work on a classification of criminal offences forstatistical purposes is being carried out at the EUlevel and as a collaboration between UNODC,UNECE and the Conference of EuropeanStatisticians (CES), through a Task Forceestablished in 2010. This includes the following
broad activities: (i) developing a set ofprinciples around international crimeclassification systems for statistical use; (ii)undertaking a case study of defining andclassifying selected offences; and (iii) workingwith the European Commission on the currentEU level classification project.
Another activity at the EU level is theadvancement of research aimed at developingindicators for the effectiveness of criminaljustice systems and juvenile criminal justice.
A two year project (2009 2011) coordinated byUNODC, in partnership with the EuropeanInstitute for Crime Prevention and Controlaffiliated with the United Nations (HEUNI), theJoint Research Centre on Transnational Crime(Transcrime), and the International Centre forMigration Policy Development (ICMPD),funded by the European Commission, dealswith the ‘Development of monitoringinstruments for judicial and law enforcementinstitutions in the Western Balkans’. The aim ofthe project is to bring national statistics
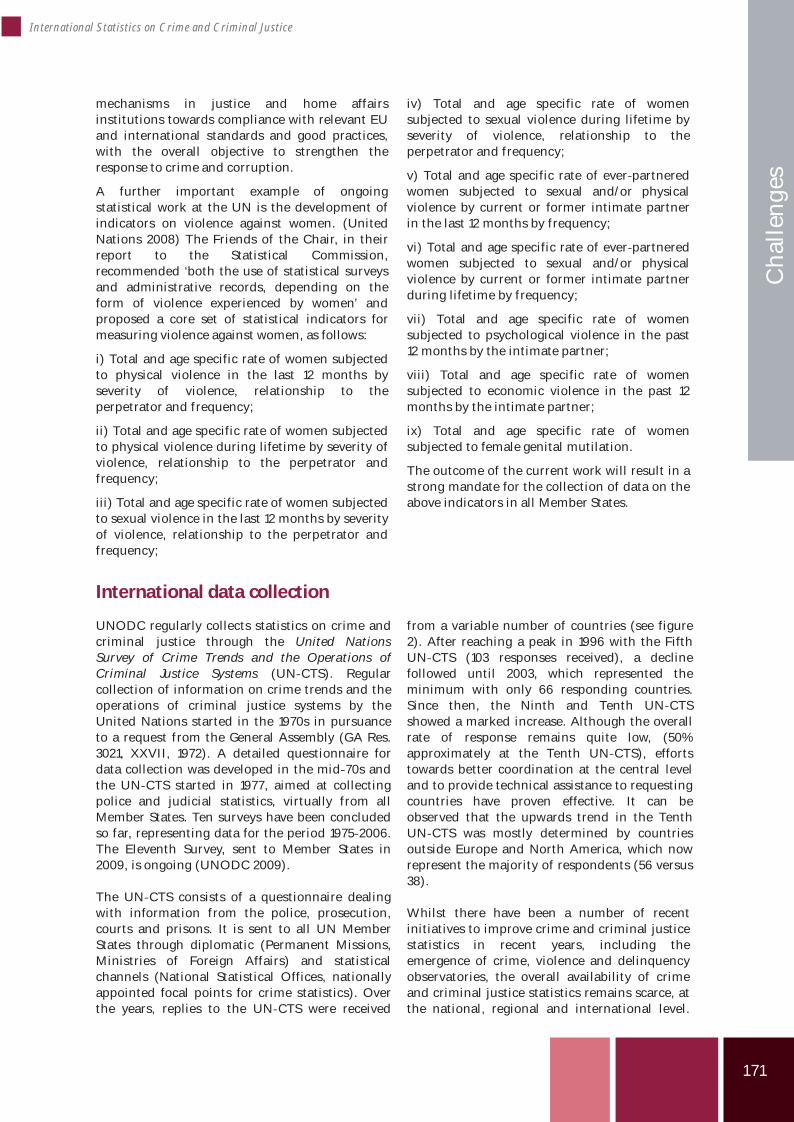
171
International Statistics on Crime and Criminal Justice
Cha
lleng
es
mechanisms in justice and home affairsinstitutions towards compliance with relevant EUand international standards and good practices,with the overall objective to strengthen theresponse to crime and corruption.
A further important example of ongoingstatistical work at the UN is the development ofindicators on violence against women. (UnitedNations 2008) The Friends of the Chair, in theirreport to the Statistical Commission,recommended ‘both the use of statistical surveysand administrative records, depending on theform of violence experienced by women’ andproposed a core set of statistical indicators formeasuring violence against women, as follows:
i) Total and age specific rate of women subjectedto physical violence in the last 12 months byseverity of violence, relationship to theperpetrator and frequency;
ii) Total and age specific rate of women subjectedto physical violence during lifetime by severity ofviolence, relationship to the perpetrator andfrequency;
iii) Total and age specific rate of women subjectedto sexual violence in the last 12 months by severityof violence, relationship to the perpetrator andfrequency;
iv) Total and age specific rate of womensubjected to sexual violence during lifetime byseverity of violence, relationship to theperpetrator and frequency;
v) Total and age specific rate of ever partneredwomen subjected to sexual and/or physicalviolence by current or former intimate partnerin the last 12 months by frequency;
vi) Total and age specific rate of ever partneredwomen subjected to sexual and/or physicalviolence by current or former intimate partnerduring lifetime by frequency;
vii) Total and age specific rate of womensubjected to psychological violence in the past12 months by the intimate partner;
viii) Total and age specific rate of womensubjected to economic violence in the past 12months by the intimate partner;
ix) Total and age specific rate of womensubjected to female genital mutilation.
The outcome of the current work will result in astrong mandate for the collection of data on theabove indicators in all Member States.
International data collection
UNODC regularly collects statistics on crime andcriminal justice through the United NationsSurvey of Crime Trends and the Operations ofCriminal Justice Systems (UN CTS). Regularcollection of information on crime trends and theoperations of criminal justice systems by theUnited Nations started in the 1970s in pursuanceto a request from the General Assembly (GA Res.3021, XXVII, 1972). A detailed questionnaire fordata collection was developed in the mid 70s andthe UN CTS started in 1977, aimed at collectingpolice and judicial statistics, virtually from allMember States. Ten surveys have been concludedso far, representing data for the period 1975 2006.The Eleventh Survey, sent to Member States in2009, is ongoing (UNODC 2009).
The UN CTS consists of a questionnaire dealingwith information from the police, prosecution,courts and prisons. It is sent to all UN MemberStates through diplomatic (Permanent Missions,Ministries of Foreign Affairs) and statisticalchannels (National Statistical Offices, nationallyappointed focal points for crime statistics). Overthe years, replies to the UN CTS were received
from a variable number of countries (see figure2). After reaching a peak in 1996 with the FifthUN CTS (103 responses received), a declinefollowed until 2003, which represented theminimum with only 66 responding countries.Since then, the Ninth and Tenth UN CTSshowed a marked increase. Although the overallrate of response remains quite low, (50%approximately at the Tenth UN CTS), effortstowards better coordination at the central leveland to provide technical assistance to requestingcountries have proven effective. It can beobserved that the upwards trend in the TenthUN CTS was mostly determined by countriesoutside Europe and North America, which nowrepresent the majority of respondents (56 versus38).
Whilst there have been a number of recentinitiatives to improve crime and criminal justicestatistics in recent years, including theemergence of crime, violence and delinquencyobservatories, the overall availability of crimeand criminal justice statistics remains scarce, atthe national, regional and international level.
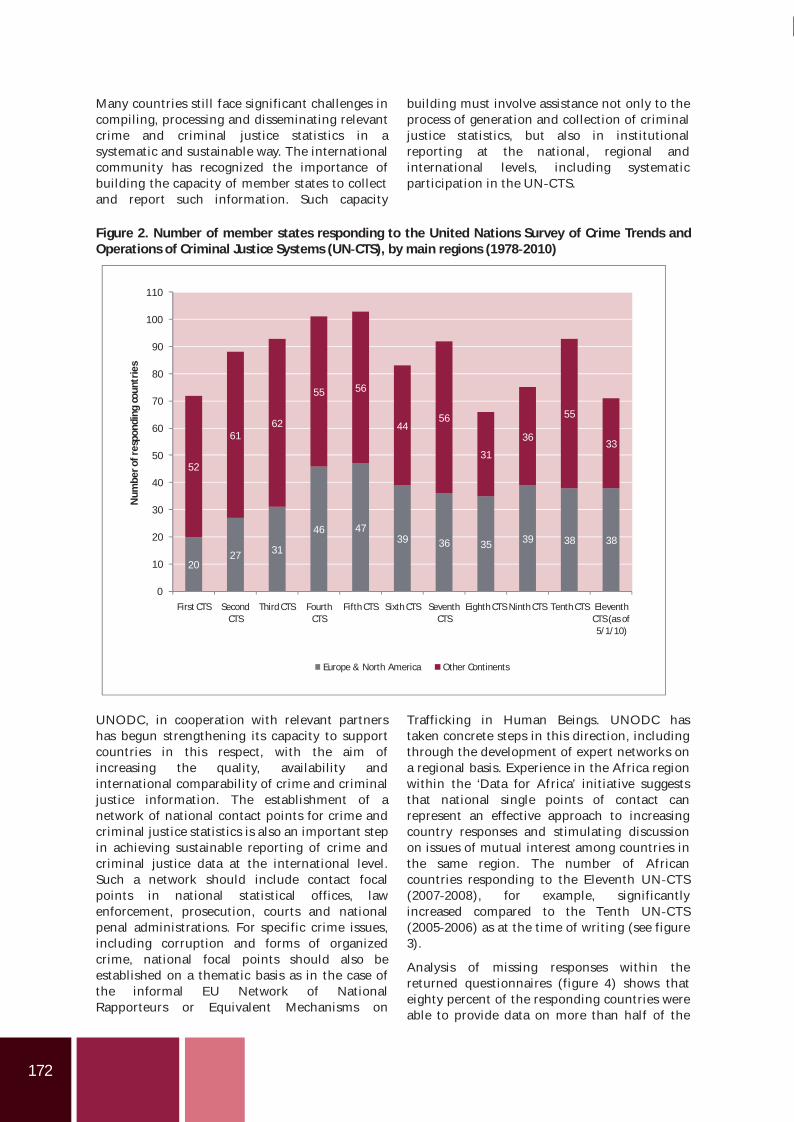
172
Many countries still face significant challenges incompiling, processing and disseminating relevantcrime and criminal justice statistics in asystematic and sustainable way. The internationalcommunity has recognized the importance ofbuilding the capacity of to collectand report such information. Such capacity
building must involve assistance not only to theprocess of generation and collection of criminaljustice statistics, but also in institutionalreporting at the national, regional andinternational levels, including systematicparticipation in the UN CTS.
Figure 2. Number of ember tates responding to the United Nations Survey of Crime Trends andOperations of Criminal Justice Systems (UN CTS), by main regions (1978 2010)
UNODC, in cooperation with relevant partnershas begun strengthening its capacity to supportcountries in this respect, with the aim ofincreasing the quality, availability andinternational comparability of crime and criminaljustice information. The establishment of anetwork of national contact points for crime andcriminal justice statistics is also an important stepin achieving sustainable reporting of crime andcriminal justice data at the international level.Such a network should include contact focalpoints in national statistical offices, lawenforcement, prosecution, courts and nationalpenal administrations. For specific crime issues,including corruption and forms of organizedcrime, national focal points should also beestablished on a thematic basis as in the case ofthe informal EU Network of NationalRapporteurs or Equivalent Mechanisms on
Trafficking in Human Beings. UNODC hastaken concrete steps in this direction, includingthrough the development of expert networks ona regional basis. Experience in the Africa regionwithin the ‘Data for Africa’ initiative suggeststhat national single points of contact canrepresent an effective approach to increasingcountry responses and stimulating discussionon issues of mutual interest among countries inthe same region. The number of Africancountries responding to the Eleventh UN CTS(2007 2008), for example, significantlyincreased compared to the Tenth UN CTS(2005 2006) as at the time of writing (see figure3).
Analysis of missing responses within thereturned questionnaires (figure 4) shows thateighty percent of the responding countries wereable to provide data on more than half of the
2027 31
46 4739 36 35 39 38 38
52
6162
55 56
4456
31
36
55
33
0
10
20
30
40
50
60
70
80
90
100
110
First CTS SecondCTS
Third CTS FourthCTS
Fifth CTS Sixth CTS SeventhCTS
Eighth CTS Ninth CTS Tenth CTS EleventhCTS (as of5/1/10)
Num
bero
fres
pond
ing
coun
trie
s
Europe & North America Other Continents
member states
m s
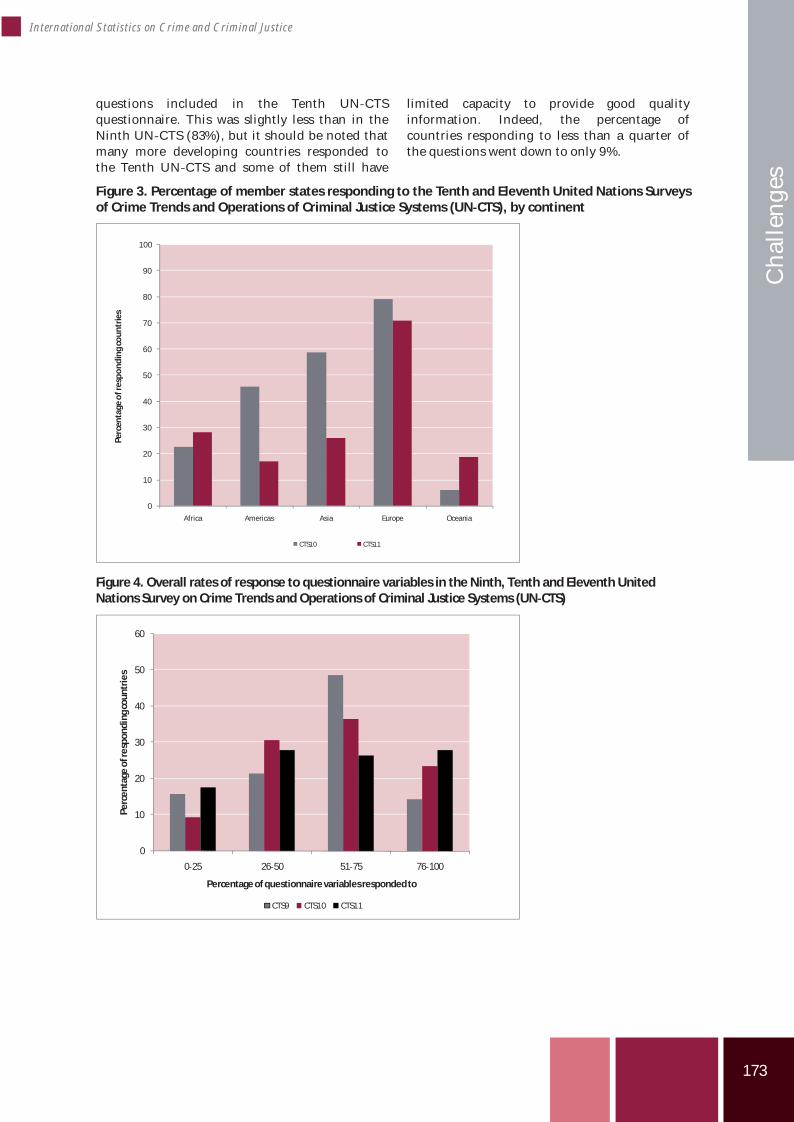
173
International Statistics on Crime and Criminal Justice
Cha
lleng
es
questions included in the Tenth UN CTSquestionnaire. This was slightly less than in theNinth UN CTS (83%), but it should be noted thatmany more developing countries responded tothe Tenth UN CTS and some of them still have
limited capacity to provide good qualityinformation. Indeed, the percentage ofcountries responding to less than a quarter ofthe questions went down to only 9%.
Figure 3. Percentage of ember tates responding to the Tenth and Eleventh United Nations Surveysof Crime Trends and Operations of Criminal Justice Systems (UN CTS), by continent
Figure 4. Overall rates of response to questionnaire variables in the Ninth, Tenth and Eleventh UnitedNations Survey on Crime Trends and Operations of Criminal Justice Systems (UN CTS)
0
10
20
30
40
50
60
0 25 26 50 51 75 76 100
Perc
enta
geof
resp
ondi
ngco
untr
ies
Percentage of questionnaire variables respondedto
CTS9 CTS10 CTS11
0
10
20
30
40
50
60
70
80
90
100
Africa Americas Asia Europe Oceania
Perc
enta
geo
fres
po
ndin
gco
untr
ies
CTS10 CTS11
m s
174
Figure 5. Percentage of numerical variables completed – Ninth, Tenth and Eleventh UnitedNations Survey on Crime Trends and Operations of Criminal Justice Systems (UN CTS)
When considering which parts of thequestionnaire were completed in the Tenth UNCTS, it should be noted that 21 countries did notreturn either the prosecution or the courtssection, 15 countries did not provide prisonstatistics and only 7 countries did not reportpolice data. When looking only at the filledquestionnaires, it can be observed that thepercentage of numerical items completed bycountries was quite high, with the majority ofcountries being able to respond to more than halfof the questions (figure 4).
It was mostly developing countries that wereunable to complete the questionnaire, thusindicating the need for further work to be doneto assist them in producing crime and criminaljustice statistics. Lack of information is not onlyan obstacle to the formulation of evidencebased policies and crime prevention strategies,but also represents a limit to the possibility toaccess international development aid.
Conclusion and way forward
UNODC will continue to work to improve theavailability and quality of crime and criminaljustice statistics at national and internationallevel. In particular, it will, subject to funding,continue to support countries in buildinginstitutional capacity to conduct victimizationsurveys with the guidance of relevant parts of theManual on Victimization Surveys. It will alsocontinue its ongoing work in the area ofcorruption surveys in countries that requestassistance in establishing baseline data andmonitoring trends regarding corruption relatedbehaviours.
Furthermore, work will continue towards a betterunderstanding of global and regional homicidepatterns through research on available homicidestatistics from multiple sources. Following thepublication of an international homicidestatistics dataset in December 2008 (UNODC
2008), UNODC published updated figures earlyin 2010, drawing on multiple sources for theyears 2003 2008 (UNODC 2010).
UNODC homicide statistics are intended torepresent a starting point for further researchand require development and updating as moretimely information becomes available.Nonetheless, within the framework of initiativessuch as the Geneva Declaration on ArmedViolence and Development, such data sourcesplay an important role in forming the basis ofindicators for measuring the nature and extentof non conflict related armed violence. Inresponse to the need for a greaterunderstanding of armed violence, UNODC hasalso carried out recent research on the structureand underlying causes of intentional homicidein selected regions, in addition tomethodological approaches to the measurement
0
10
20
30
40
50
60
70
80
Police Prosecution Courts Prisons
Prec
enta
geof
ques
tion
san
swer
ed
9th CTS 10th CTS 11th CTS

175
International Statistics on Crime and Criminal Justice
Cha
lleng
es
of criminal justice system performance in the caseof crimes involving armed violence.
As a follow up to the 2006 open ended expertgroup on ways and means to improve crime datacollection, research and analysis, UNODCorganized an expert group meeting on crimestatistics (Vienna, 28 30 January 2009). Followingthe subsequent ECOSOC Resolution 2009/25(entitled “Improving the collection, reporting andanalysis of data to enhance knowledge on trendsin specific areas of crime), UNODC established anopen ended intergovernmental expert workinggroup to prepare recommendations on theimprovement of tools for the collection ofrelevant crime data, in particular, the UN CTS. Atthe kind invitation of the Government ofArgentina, the first meeting of the open ended
intergovernmental expert working group washeld in Buenos Aires from 8 10 February 2010.
The meeting based its work on theconsiderations contained within Resolution2009/25, including the need to simplify andimprove the reporting system of the UN CTS inorder to encourage more Member States toreport, in a coordinated and integrated way, ontheir efforts, achievements and challenges inspecific areas of crime. The meeting resulted ina set of practical recommendations for theadvancement of work in the collection andanalysis of international crime and criminaljustice statistics. A key recommendation was torevise the UN CTS questionnaire in order toimprove the response rate, produce more timelydata and minimize the reporting burden andcomplexity for Member States.
References
CISALVA 2009, Indicadores estandarizados deconvivencia y seguridad ciudadana para la región’,Interamerican Development Bank. InformeEjecutivo Taller Regional de Estandarización deIndicadores de Convivencia y SeguridadCiudadana, Cali, Colombia.
Eurostat 2009. Statistics in Focus 36/2009, Crimeand Criminal Justice.
United Nations 2008. Statistical Commission,Friends of the Chair group for indicators onViolence against Women. Available at:http://unstats.un.org/unsd/demographic/meetings/vaw/
UNODC 2008. International homicide statisticsfor the year 2004. Available at:http://www.unodc.org/unodc/en/data andanalysis/ihs.html
UNODC 2009. United Nations Survey of CrimeTrends and Operations of Criminal JusticeSystems. Available at: http://www.unodc.org/
unodc/en/data and analysis/United NationsSurveys on Crime Trends and the Operationsof Criminal Justice Systems.html
UNODC 2010. Homicide statistics. Available at:http://www.unodc.org/unodc/en/data andanalysis/homicide.html
UNODC UNECA 2008. United Nations Office onDrugs and Crime and United Nations EconomicCommission for Africa, Workshop on CrimeStatistics, Addis Ababa, 9 12 December 2008.Documentation available at: http://www.unodc.org/unodc/en/data and analysis/Data for Africaworkshop.html
UNODC UNECE 2010. United Nations Office onDrugs and Crime and United Nations EconomicCommission for Europe, Manual onVictimization Surveys. Available at:http://www.unodc.org/documents/data andanalysis/Crime statistics/Manual_on_Victimization _surveys_2009_web.pdf

176
HE
UN
I
INTERNATIONAL STATISTICS on CRIME AND JUSTICE
The objec ve of this report is to show users of interna onal crime data what they could learn from these, and provide guidance as to restric ons, pi alls and strengths of the unique set of data that is now available thanks to the countries that have responded to the United Na ons Surveys of Crime Trends and Opera ons of Criminal Jus ce Systems. The present report, prepared in partnership of HEUNI and the UNODC, for the first me pulls together global responses of the surveys.
The report comprises eight chapters. They are designed to deal with all central issues addressed in the surveys. First, police-recorded crime is discussed, with separate chapters on homicides (Chapter 1), other police-recorded crimes (Chapter 2), and drug-related crime and drug trafficking (Chapter 3). Also, complex crimes are analysed, such as organised crime, and trafficking in human beings (Chapter 4). Such offences have played a marginal role in tradi onal crime sta s cs, and in order to improve the relevance of the data on such offences, new solu ons need to be developed. Chapter 5, shi ing to the next stage of the criminal jus ce system, presents data on responses of the criminal jus ce system, including an innova on where a ri on issues are being discussed. A parallel issue to responses of the criminal jus ce system are resources and performance. These are discussed in Chapter 6 where also a discussion on the puni vity of criminal jus ce systems is included. Next, a presenta on on prison popula ons of the world closes the analysis of criminal jus ce data. The last chapter finally discusses challenges with crime and criminal jus ce sta s cs, arguing for the importance of further improvements in the area.
ISBN 978-952-5333-78-7ISSN 1237-4741