Embed Size (px)
Citation preview
Proceedings of the
International Workshop
on New Technologies and
Cocoa Breeding
16th - 17th October 2000Kota Kinabalu, Sabah, Malaysia
Proceedings of the
International Workshop
on New Technologies and
Cocoa Breeding
16th - 17th October 2000

Kota Kinabalu, Sabah, Malaysia
Published by INGENIC, 2001
INGENIC is the International Group for Genetic Improvement of Cocoa. INGENIC wascreated in 1994 and operates as an independent group sponsored by differentinstitutions. It promotes the exchange of information and international collaboration ontopics related to cocoa genetics and improvement of cocoa planting materials.
The committee of INGENIC comprises:
Chairman Dr.Albertus B. EskesVice-Chairman Dr. Ming Tong Lee (replaced by Dr. Kelvin Lamin
in October 2000)Vice-Chairman D r . Y a wAdu-AmpomahVice-Chairman Dr. DarioAhnertSecretary/Treasurer Dr. Michelle J. EndEditor Mrs.Frances L. Bekele
Further information on INGENIC and copies of these Proceedings can be obtainedfrom:
The INGENIC SecretariatDr. Michelle J. Endc/o BCCCA37-41 Bedford RowLondonWC1R 4JHU.K.
Tel: +44 20 74049111Fax: +44 20 74049110E-mail: [email protected]
©INGENIC 2001ISBN 1 900527 02 2
ACKNOWLEDGEMENTS
The Workshop Organising Committee and INGENIC wish to thank all thoseorganisations who have given their valuable support to this Workshop. In particular, wewould like to express our gratitude to:
• ACRI (American Cocoa Research Institute) USA,BCCCA (Biscuit, Cake, Chocolate and Confectionery Alliance) UK, and theBundesverband der Deutschen Susswarenindustrie, Germany,
for their financial support.• MCB (Malaysian Cocoa Board), and• CPA (Cocoa Producers Alliance),
for support in the organisation of this Workshop.• CIRAD (Centre de Coopération Internationale en Recherches Agronomiques pour
le Développement) France,for support in typesetting and layout of these Proceedings.
• Cocoa Research (UK) Ltd. UK,for sponsoring the participation of Dr. Mike Wilkinson.
• CTA (Technical Centre for Agricultural and Rural Cooperation), the Netherlands,for sponsoring the participation of four researchers.
INGENIC wishes to thank furthermore the following organisations for their moregeneral support to INGENIC activities and to INGENIC committee members: ACRI,BCCCA, CIRAD, CPA, CRU (Cocoa Research Unit, Trinidad and Tobago), CRIG(Cocoa Research Institute of Ghana), LIFFE (London International Financial Futuresand Options Exchange), MCB, and the Universidade Estadual de Santa Cruz, Ilheus,Bahia, Brazil.
Workshop Organising Committees
Local CommitteeInternational Committee
Lee Ming Tong (Chairman)Albertus Eskes (Chairman)
Kelvin Lamin (Coordinator) LeeMing Tong (Vice-Chairman)Tan Chia Lock
Yaw Adu-Ampomah (Vice-Chairman)Ahmad Kamil Mohd
Dario Ahnert (Vice-Chairman)Jaaffar Azhar Mohammed
Dario Ahnert (Vice-Chairman)Lea Johnsiul
Frances Bekele (Editor)Rosnah Maamor

Elilia Tundim AbdullahSarinah Ambia

CONTENTS
Preface................................................................................................................ i
Welcoming Addresses ......................................................................................ii
Workshop Conclusions and Recommendations ........................................... 1
Introduction and Review PaperIntroductory Notes
Albertus Eskes.......................................................................................................... 8The Application and Constraints of New Technologies in Plant Breeding
M.J. Wilkinson ....................................................................................................... 12
Use of molecular markers for identification of cocoa genotypes
Use of Microsatellite Markers for Germplasm Identity Analysis in CocoaA.M. Risterucci, A.B. Eskes, D. Fargeasm, J.C. Motamayor and C. Lanaud ........... 25
The Detection of Mislabelled Trees in the International Cocoa Genebank, Trinidad(ICG,T) and Options for a Global Strategy for Identification of Accessions
O. Sounigo, Y. Christopher, F. Bekele, V. Mooleedhar and F. Hosein ................. 34A Report on BCCCA Cocoa Research Colloquium 1: ‘GermplasmCharacterisation Using Molecular Tools’
M. Gilmour ............................................................................................................ 41
Use of molecular markers for genetic diversity studies
Genetic Structure, Characterisation and Selection of Nacional Cocoa Comparedto Other Genetic Groups
D. Crouzillat, L. Bellanger, M. Rigoreau, P. Bucheli and V. Pétiard ...................... 48Evaluation and Use of the Genetic Diversity Present in the InternationalCocoa Genebank (ICG,T), in Trinidad
O. Sounigo, Y. Christopher, S. Ramdahin, R. Umaharan and A. Sankar ................. 67Diversity for Phenotypic Traits and Molecular Markers in CEPEC´s GermplasmCollection in Bahia, Brazil
J.L. Pires, J.M. Marita, U. Vanderlei L., M. Macoto Y., W.M. Aitken, G.P. Melo,W.R. Monteiro and D. Ahnert ................................................................................. 75
Implications of New Insight into the Genetic Structure of Theobroma cacao L.for Breeding Strategies
C. Lanaud, J.C. Motamayor and A.M. Risterucci.................................................... 93USDA DNA Fingerprinting Programme for Identification ofTheobroma cacao Accessions
J.A. Saunders, A.A. Hemeida and S. Mischke .........................................................112
Correlation of molecular markers with economically important traits
Use of QTL’s Detected for Resistance to Phytophthora in Theobroma Cacao L.C. Lanaud (abstract only).....................................................................................119
Use of QTLs for Witches’ Broom Resistance in Cocoa BreedingD. Ahnert .............................................................................................................120
QTL Studies Carried out for Agronomic, Technological and Quality Traitsof Cocoa in Ecuador
D. Crouzillat, M. Rigoreau, M. Cabigliera, M. Alvarez, P. Bucheliand V. Pétiard.....................................................................................................124
Analysis of QTL Studies Related to Yield and Vigour Traits Carriedout with Different Cocoa Genotypes
D. Clément, A.M Risterucci and C. Lanaud.........................................................132
Other topics
Resistance Gene Homologues: a Shortcut Strategy for Marker Assisted BreedingD.N. Kuhn, J.S. Brown, M. Heath and R.J. Schnell ................................................140
Proposal for a Gene Expression Micro-array ConsortiumM.J. Guiltinan .......................................................................................................145
Biotechnology Research by the Malaysian Cocoa BoardD. Furtek, R. Kasran, Tan Chia Lock, L. Johnsiul, Azhar Mohammed,V. Hartney, Meriam Mohd. Yusof, K. Lamin and Lee Ming Tong...........................149
Novel Technologies for Disease Indexing and Screening for CSSVD ResistanceS.T. Sackey ............................................................................................................156
Propagation methods
Recent Advances in the Tissue Culture of Cocoa from Somatic Embryosto Bentwood Gardens - A Short Review
M.J. Guiltinan and S. Maximova ...........................................................................164Avanzos en Propagación de Cacao Theobroma cacao por EmbriogénesisSomática en México (Advances in Cocoa Theobroma cacao Propagationby Somatic Embryogenesis in Mexico)
O. López-Baez, J. L. Moreno-Martinez and S. Pacheco-Rodas ..............................170Mass Multiplication on a Semi-industrial Scale of Cocoa Clones byRooted Cuttings in Brazil
J.B. Palacios and W.R. Monteiro...........................................................................185
Workshop Programme ..................................................................................192
List of Participants ........................................................................................194
16 – 17 October 2000, Kota Kinabalu, Sabah, Malaysia i
PREFACE
This is the third International Workshop to be organised by INGENIC, the InternationalGroup for the Genetic Improvement of Cocoa. It follows the International Workshop onCocoa Breeding Strategies (Kuala Lumpur, Malaysia 1994) and the InternationalWorkshop on the Contribution of Disease Resistance to Cocoa Variety Improvement(Salvador, Brazil 1996). These Workshops provide an important opportunity for cocoabreeders to exchange views amongst themselves and, particularly for the two mostrecent workshops, with experts from related fields. INGENIC decided to organise itsthird International Workshop on ‘New Technologies and Cocoa Breeding’ following arecommendation of the INGENIC General Meeting (Salvador, November 1996).INGENIC is most grateful to the Cocoa Producers’ Alliance and the Malaysian CocoaBoard for allowing this Workshop to be held on the occasion of the International CocoaResearch Conference October 2000, Kota Kinabalu, Sabah, Malaysia.
Progress in the development of new technologies in plant breeding has beentremendous during the last 15 years and practical applications are now emerging. Theexpectations of the new technologies are high, though it is understood that thesetechniques can only make a useful contribution if the traditional breeding base is strongenough to support their integration. It is often felt that there is still a large gap betweentraditional breeding and molecular biology. Certainly, an increased level of interactionbetween the ‘new’ and ‘traditional’ technologists is a first requirement for any use ofnew technologies for the benefit of the cocoa farmers and consumers. It is estimatedthat presently there are equal numbers of cocoa geneticists who are developing orusing new technologies and traditional plant breeders. The aim of the Workshop was tostimulate interaction between these researchers. INGENIC invited Dr. Mike Wilkinson,a molecular biologist/breeder with experience of many crops, including cocoa, to givean overview of the potential of new technologies in plant breeding. This presentationwas followed by five sessions covering the various techniques and applications tococoa genetics/breeding. Presentations in each session were followed by discussionand the last session was devoted to the formulation of the Workshop Conclusions andRecommendations. The sixty participants, from 16 countries, were encouraged toconsider the progress made to date with each of the new technologies, to identifyapplications for the information that has already been generated and to makerecommendations on new collaborative activities that could realise the full potential ofthese new technologies in cocoa breeding.
The editors were pleased to receive full papers of good quality soon after theWorkshop. The editing of these papers, including the feedback between the editorsand the authors, was necessarily more time-consuming. The editors are grateful toseveral authors who agreed to include more information in their written papers thanwas presented during the Workshop. This was especially so for the studies concerningthe genetic structure of cocoa populations, which now include often detailedinformation on genetic distances between accessions studied and on the level ofheterozygosity of these genotypes. Both types of information are of fundamentalimportance for the better usage of these genotypes in cocoa breeding.
INGENIC is engaged in organising its fourth Workshop, which is likely to be held tocoincide with the 14th International Cocoa Research Conference. The theme of theworkshop will be “Cocoa Breeding for Improved Production Systems”.
The editors of the Workshop ProceedingsJuly, 2001
Frances BekeleMichelle End
16 – 17 October 2000, Kota Kinabalu, Sabah, Malaysia ii
Albertus Eskes
WELCOMING ADDRESSES
Joao Louis PereiraChairman of the International Permanent Working Group for Cocoa Pests and Diseases(INCOPED)
The first meeting on cocoa pests and diseases was held in Accra, Ghana in November,1995. Gratefully, this was a result of the initiative and under the auspices of the CocoaResearch Institution of Ghana. At that Accra meeting, it was decided to reviveactivities in cocoa crop protection, through the formation of a group, needed to addressspecific problems. A consensus was reached and as an outcome, tentative terms ofreference were discussed.
Specialised meetings on cocoa pests and diseases have been held in years goneby, but these were normally conducted on a regional basis as African and LatinAmerican sub-groups. Therefore, the proposed group aimed to have a widerparticipation, examining research advances in common problems while also beingaware of, and prepared for, threats of new cocoa pest and diseases.
The then forthcoming 12th International Cocoa Research Conference in Salvador,Brazil in November, 1996, was considered to be a suitable venue to discuss, in somedetails, the aims and objectives of the Group, allowing for the presence of a betterrepresentation of cocoa producing countries and other interested parties. Therefore,on 23rd November, 1996, in Salvador, thirty-three participants representing fourteencountries, drew-up the Terms of Reference and elected office bearers. Subsequently,the Group took on the acronym of INCOPED and the Terms of Reference werepublished in the 1st Issue of the INCOPED NEWSLETTER in September, 1997.
In December 1997, Ivory Coast hosted the 2nd International Seminar on CocoaPests and Diseases at Yamoussoukro. This meeting was particularly well attended notonly by participants from cocoa producing countries but also by other researchersworldwide.
Considering that in most cocoa producing countries, the limiting factor in theeconomics of cocoa production is governed by the presence of serious pests anddiseases, I believe that INCOPED will continue to play an increasingly important role.At this moment, harmonising our present knowledge has been one of our moreimportant activities. This was done through seminars (with published Proceedings),newsletters, a web site and easier contact through our regional co-coordinators inAfrica, Americas, the Pacific Region and South-East Asia.
More needs to be done to keep our farmers in cocoa cultivation. However, toensure cocoa cultivation is economic, the existence of an unfair balance has to berecognised. This balance weighs heavily on the grower, due to a combination of highpressure from pests and diseases coupled with low cocoa prices. We accept thechallenge the former poses but seek awareness as to the importance of the latter.
On behalf of INCOPED, I express our sincere thanks to the Malaysian Organisers ofthe 13th ICRC and our Regional Co-ordinator for preparing the ground for this3rd Seminar.
Bertus EskesChairman of the International Group for Genetic Improvement of Cocoa (INGENIC)
Dear Mr. Hope Sona Ebai, Secretary General of the Cocoa Producers’ Alliance,dear Dr. Mohd Musa Md Jamil, Director General of the Malaysian Cocoa Board,dear Dr. Lee Ming Tong, Deputy Director General of the Malaysian Cocoa Board,dear Joao-Louis Pereira, Chairman of INCOPED,
16 – 17 October 2000, Kota Kinabalu, Sabah, Malaysia iii
dear Mr. Kelvin Lamin, Chairman of INGENIC National Organising Committee,dear Dr. Bong Chui Lian, Chairperson of INCOPED National OrganisingCommittee, anddear participants of the INCOPED Seminar and of the INGENIC Workshop.
It is a pleasure to welcome you here on behalf of the Local Organising Committee ofthe INGENIC workshop and on behalf of the INGENIC Board. It is a great pleasure forINGENIC that the organisation of the present Workshop could be done in closecollaboration with INCOPED. We are very pleased with the large number ofparticipants to both events, which shows the interest that these meetings havegenerated.
INGENIC was created at a meeting of cocoa geneticists during the 11th InternationalCocoa Research Conference of the Cocoa Producers’ Alliance in Yammoussukro, Côted’Ivoire, in 1993. The objective of INGENIC is to exchange information by publishing aNewsletter and by organising regular Workshops with specific themes. It also aims topromote further collaboration in the field of cocoa genetics.The first Workshop was held in 1994 in Kuala Lumpur, in conjunction with theMalaysian International Cocoa Conference. The theme was « Cocoa BreedingStrategies ». The second Workshop was held in 1996 in Salvador, Bahia, on theoccasion of the 12th International Cocoa Research Conference. The theme was thistime « Contribution of Disease Resistance to Cocoa Variety Improvement ». ThatWorkshop brought together cocoa geneticists as well as many pathologists. During the1996 General Assembly of INGENIC the theme for the next Workshop was chosen tobe « New Technologies and Cocoa Breeding », to be held in Malaysia. So that’s whywe are here now.
The choice of the themes of these Workshops shows that cocoa breeding needs tobe integrated with other disciplines for optimisation of results. For example, reliabledisease resistance evaluation methods and use of early screening tests are becomingmajor features of new cocoa breeding activities. In fact, these new methods allow, forthe first time, the development of pre-breeding programmes aimed at creation ofpopulations with increased disease resistance.
With regard to the theme of the present Workshop, there is no doubt about itsimportance. New technologies in plant breeding are undergoing dramaticdevelopment. On one side, these technologies help to provide new insight into thegenetic makeup of the cocoa species and inheritance of important traits, helping thecocoa breeder to decide on the choice of parents and selection methods to be used inbreeding. On the other side, these technologies have potential to increase selectionefficiency and to overcome production constraints that cannot be overcome byconventional methods. However, we should not forget that in the first placeconventional cocoa breeding has to be strongly supported in order to be able tointegrate these new technologies at all.
The objectives of the present Workshop are to analyse results, present data that canbe of direct use to the cocoa breeders, to discuss applications of these methods incocoa breeding, to analyse research gaps and discuss opportunities for collaborativeresearch proposals.
One aspect of the International Cocoa Research Conference that deserves specialattention is the session that took place about a « Global Cocoa Programme ».INGENIC wishes to be associated with this initiative as a force to identify researchgaps and to propose new collaborative activities in the area of cocoa genetics andvariety development. This theme will be discussed during the General Assembly thisevening.
INGENIC is grateful for the support that many institutions contribute to the generaloperation of INGENIC as well as specifically to this Workshop. The list of supportiveinstitutions, in alphabetical order, includes :• the American Cocoa Research Institute,• the Biscuit, Cake, Chocolate and Confectionery Alliance of the UK,
16 – 17 October 2000, Kota Kinabalu, Sabah, Malaysia iv
• the Centre for International Collaboration through Agronomic Research andDevelopment, in France,
• the Cocoa Producers’ Alliance,• Stiftung der Deutschen Kakao- und Schokoladenwirtschaft• the Cocoa Research Institute of Ghana,• Cocoa Research Limited in the UK,• the Cocoa Research Unit in Trinidad,• the London International Financial Futures and Options Exchange,• the Malaysian Cocoa Board,• Mars Incorporated, and• the Technical Centre for Agricultural and Rural Development of the EuropeanUnion, based in the Netherlands.
Special thanks go to the Cocoa Producers’ Alliance for allowing us to hold thismeeting in conjunction with the 13th International Cocoa Conference and for distributingthe announcement of the Workshop.
Special thanks go certainly to the Malaysian Cocoa Board for organising, for thesecond time, an INGENIC Workshop. From what we have experienced so far, thissupport would justify a proposal to be put forward at the General Assembly that allfuture INGENIC Workshops should be held in Malaysia! Thank you very much.
Hope Sona EbaiSecretary General of the Cocoa Producers’ Alliance (CPA)
Your Excellencies, Honourable Participants, Ladies and Gentlemen.It is indeed my pleasure, to address these few words of encouragement from
the Cocoa Producers’ Alliance on this occasion of the concurrent opening of the ThirdInternational Seminar of INCOPED and Third INGENIC Workshop.
Cocoa culture today is rapidly expanding owing to the continuous increase in theconsumption of this very nutritious product. But this delicious plant has quite a numberof enemies and diseases to be protected against. Moreover, its growth has to be tied,and respond to an ever-increasing demand.
In most of the Producer Countries, the presence of serious cocoa diseases andpests constitute a real handicap for production and the cocoa economy in general.Witches’ broom and moniliasis in Latin America, the various strains of Phytophthoraand mirids in Africa, the cocoa-pod borer in South-East Asia are some real menaces tococoa growing.
While combating the above problems, cocoa culture also faces a problem withits development within the context of increased land pressures. Higher productivitybrought about by the use of early and high-producing varieties is needed.
The themes you have chosen for your deliberations are in this regard,of greatpertinence. In effect, the INGENIC Workshop has set out as objective the analyses ofthe progress made in the domain of new technologies and their applicability towardsthe improvement of cocoa varieties. INCOPED, for its part, proposes to examineprogress made towards integrated pest management and cocoa diseases, biologicalcontrol and measures for quarantine in an attempt to manage these calamities in ourCocoa Producing Countries.
This is an attempt to describe the important role you play in the protection andpreservation of the cocoa tree in an environment more and more hostile.
Very high, thus, are our hopes placed on your two Groups for the role ofdistancing us from these calamities and increasing the interest of our farmers in cocoaculture.
On behalf of the Alliance, I would like to express my gratitude to the organisersof these meetings from which we expect quite a bit, and wish you great success in the
16 – 17 October 2000, Kota Kinabalu, Sabah, Malaysia v
deliberations of the 3rd INGENIC Workshop and the 3rd International Seminar ofINCOPED on pests and diseases of cocoa. I thank you for your kind attention.
Dr. Mohd Musa Md JamilDirector General of the Malaysian Cocoa Board (MCB)
Mr. Sona Ebai, Secretary General of the Cocoa Producers’ Alliance,Dr. Bertus Eskes, President of the International Group for Genetic Improvement ofCocoa (INGENIC),Dr. Louis Pereira, Chairman of the International Permanent Working Group for CocoaPest and Disease (INCOPED),all participants of the INGENIC workshop and INCOPED seminar,ladies and gentlemen.
Let me, first of all, express my thanks to Dr. Eskes and Dr. Pereira for giving usthe opportunity to organise this INGENIC workshop and this INCOPED seminar. I alsowish to welcome all of you to Kota Kinabalu and look forward to your activeparticipation in the workshop and seminar.
It is fortunate for cocoa that the crop protectionnists and breeders from all overthe world are able to meet and discuss research and current issues of their particulardisciplines. Certainly, the interaction of all the scientists and researchers in these twoevents will enhance current knowledge which will lead to the development of moreappropriate technologies for cocoa production.
However, in implementing projects, we must ensure that the immediateoutcome of the research will have a positive impact on our client: the cocoa farmers.Research findings should in one way or another be able to solve the current problemsof our cocoa farmers.
Highly basic, fundamental and biological research utilising the most up-to-datetechniques is good and fine. Sometimes this research is essential in understanding thereal problems, as it provides basic biological information. We, however, should notforget about research results that can give direct answers to the existing problems ofthe farmers. Perhaps, pathologists, entomologists and breeders should interact withagronomists and physiologists to resolve more pressing problems of the cocoafarmers, for example those related to low cocoa prices. Hence, we have to emphasisehigh productivity, efficient use of inputs and lowering the cost of production. In fact,pest and disease management and breeding should place emphasis on resolving theseproblems.
I feel it will be useful if various research disciplines go together to formulateresearch projects addressing farmers’ current problems. With low cocoa prices, notonly does damage and loss of yield through pest and disease have to be eliminated,but it also has to be done in the most economic way.
I remember during the early phase of cocoa development in Malaysia, thatplanning of cocoa research for production was relatively simple. We only needed todevelop good and high yielding planting materials, which were resistant to vascularstreak dieback. Coupled with good agronomic practices, we were able to increaseMalaysian cocoa hectarage and production substantially. Research in cocoafermentation also has improved Malaysian cocoa so as to achieve a wider acceptance.
Now, the problem is the unreasonably low cocoa price. Hence, we who are involvedin cocoa research should consider this in our research planning. Otherwise, our workwill be irrelevant to the farmers in the forefront of cocoa production systems.Finally, I wish all of you active and lively discussions in your workshop and seminar.Once again I thank Dr. Eskes and Dr. Pereira for allowing us to host these events.With their permission, I declare the INGENIC workshop and INCOPED seminar open.

16 – 17 October 2000, Kota Kinabalu, Sabah, Malaysia 1
WORKSHOP CONCLUSIONS AND RECOMMENDATIONS
Session 1. Introduction and Application of New Technologies in PlantBreeding
Introduction• Progress in breeding will be accelerated if breeders can integrate their activities with
those of scientists working in other disciplines. The purpose of this Workshop wasto bring together traditional breeders and experts in molecular biology to stimulatediscussions on the potential of new technologies in cocoa breeding.
• There is much to learn from research in other crops, where productivity has beendramatically increased, 50% by genetic improvement and 50% by agronomicmeasures. In view of the low overall increase in cocoa productivity, there is a lot tobe gained through genetic improvement.
• Efforts in traditional breeding need to be maintained and strengthened; if this doesnot happen there will be no good platform to benefit from the introduction of newtechnologies. Effective collaboration between traditional breeders andbiotechnologists is required to strengthen cocoa breeding as a whole.
Management of genetic diversity• Molecular markers can be effectively used to verify mislabelling (SSRs, CAPs,
SCARs), to evaluate genetic diversity and develop core collections (AFLPs, ISSRsand SSRs), and to search for candidate genes in germplasm collections (gene-specific PCR).
Marker assisted breeding• Selection efficiency can be improved through the use of DNA markers associated
with QTL or with candidate genes, particularly in introgressive breeding strategies.• Replicated progenies, made up of a large number of individuals and planted at
different sites, are required to take full advantage of QTL analysis. These shouldenable minor QTLs to be mapped and the stability across environments to beverified.
Genetic modification• Although no commercially grown cocoa has been genetically modified, there has
been a ten-fold increase in the acreage of other genetically modified crops over thelast three years. Although the public is gradually becoming more aware of GMtechnology and its benefits, it should be noted that in a significant proportion of thechocolate consuming world, current consumer preference is for non-GMO products.
• In other crops, genetic modification has sometimes been targeted at benefiting thefarmer, and in others, the consumer. Currently most applications relate to thecorrection of only those genetic weaknesses of the crop that are controlled by one ora few genes (e.g. susceptibility to pests, diseases or stress conditions).
• Traditional breeding will continue to be very important to create improvedpopulations and to handle traits determined by several genes.
• There is a trend towards the introduction of more than one gene into geneticallymodified varieties through the use of tissue specific and inducible promotersequences.
• An efficient genetic transformation system in cocoa is required for research andsignificant breeding perspectives in the long term future. However, it is essentialthat any such work is carried out in conjunction with appropriate studies of the
16 – 17 October 2000, Kota Kinabalu, Sabah, Malaysia 2
impact of the genetically modified organism on the environment and with dueconsideration to consumer opinion.
Synteny mapping and genome sequencing• The application of new technologies in cocoa breeding can benefit from the
advances made for other crops through synteny mapping; the use of anchoredpoints on the genome which can be used to relate cocoa genetic maps with themaps of other species.
• There is no urgent need for the comprehensive sequencing of the cocoa genome; itis probably better to use information from model crops (candidate gene strategy).
Collaboration between producing and consuming countries• It is essential to establish effective collaboration between scientists in producing
countries and non-producing countries.• There is a need to develop low-cost, low-tech methods to enable laboratories in
producing countries to carry out their part in collaborative studies and to enhancetheir capacity for innovative research.
Session 2. Identification and Characterisation of Cocoa Genotypes
Main results obtained to date• So far, various markers have been used: isozymes, RFLP, RAPD, AFLP, I-SSR
and SSR. Protocols for sample collection, shipment and analyses have beendeveloped.
• The use of microsatellites (SSR) is the way forward in the short term forfingerprinting, to provide anchor points for mapping populations and for studiesusing linkage disequilibrium to investigate origins of stocks and gene flow betweenpopulations. Researchers at CIRAD have made much progress in this area andhave already developed 69 microsatellite primers.
• The USDA is embarking on a large project to genetically characterise the cocoaaccessions held in the genebanks of the Americas using an automatedmicrosatellite analysis system, which has the capacity to analyse 1500samples/person/year.
• It is expected that 15 well chosen SSR will be sufficient for clone identification andcharacterisation purposes. However, a much larger number of well-identified SSRsare needed for mapping studies (see below).
Applications in cocoa breeding• Resolution of mislabelling is a major issue for efficient management and transfer of
germplasm, for reliable exchange of information on germplasm accessions, formulti-locational trials and, thus, for any collaborative efforts in cocoa germplasmconservation and utilisation.
• Progress made to date is still very limited in view of the importance of the problem.
Recommendations• A globally co-ordinated effort is required in the area of identification and
characterisation of cocoa genotypes in collections. This should include a ring-testto establish the compatibility of the automated system with gel-based systems forSSR analyses.
• Reliable comparison of results between laboratories and between differentvisualisation techniques will require the use of a common homozygous controlclone, e.g. Catongo.
16 – 17 October 2000, Kota Kinabalu, Sabah, Malaysia 3
• Additional experiments are needed to refine the techniques. These will include i)the adaptation of the various gel-based systems (including techniques which do notinvolve the use of radioactivity so that the research institutes holding the genebankscan carry out the analysis themselves), ii) determination of the power of resolutionof the technique (through sib-analyses) and iii) determination of the frequency ofmutations and null alleles.
• It will be essential to identify a “type” specimen for each clone which can be usedas a reference to compare all other accessions with the same name. The “type”tree must be selected by an expert, ideally from the original source genebank.Efforts should be made to ensure that it is safeguarded through carefuldocumentation, labelling and possibly cryopreservation.
• Four different options have been presented, with different roles for the collaborativeinstitutes, and advantages/disadvantages compared to a globally co-ordinatedeffort on cocoa germplasm identification and characterisation.
• If successful, this would allow the research institutes to carry out their own withinaccession testing using the same SSR primers and make comparisons with theinternational “type” fingerprint.
• Molecular marker information should be introduced in a standardised form intointernational databases.
• Strategies are needed for dealing with the off-types detected following molecularcharacterisation. Genebank managers will have the responsibility of discarding orassigning an appropriate new name to any genotypes which do not conform withthe “type” specimen. This information should be disseminated to the cocoacommunity through the INGENIC Newsletter, the International Cocoa GermplasmDatabase and other means.
Session 3. Genetic Diversity Analysis
Results obtained to date• Various molecular techniques and methods of data analyses have been of value in
assessing the genetic structure and diversity of cocoa populations. There may besome advantages in using a variety of markers since they may each reveal differentparts of the genome.
• Results obtained in different genetic diversity studies, involving in total more than1000 cocoa genotypes, were analysed during the workshop and the estimated levelof heterozygosity of more than 600 genotypes are presented in these proceedings.
• Studies carried out with RFLP, RAPD and microsatellites at CIRAD Montpellierhave shown that cocoa populations differ widely in their levels of diversity andheterozygosity. Upper Amazon Forasteros contain high levels of diversity andmedium levels of heterozygosity compared to Lower Amazon populations and towild French Guiana material, both of which exhibit low levels of diversity andheterozygosity. ‘Ancient’ Criollo types also form a very distinct, uniform andhomozygous group. These results would suggest that founder effects or refugeareas have played an important role in the evolution of T. cacao populations. Socalled Trinitario and ‘modern’ Criollo types appear to derive from hybridisationbetween ‘ancient’ Criollo and Lower Amazon Amelonado.
• RAPD analyses carried out in Trinidad suggest the existence of sub-groups withinthe Upper Amazon populations: (LCT-EEN + MO), (PA) and (IMC+NA+AMAZ).Scavina genotypes are very distinct. French Guiana materials show a very differentRAPD banding pattern compared to other Forastero types. RFLP analyses carriedout by Nestlé also identified genetic affinity among IMC and Pound clones (whichare NA and IMC types) and among PA types, and again showed the Scavinaclones (SCA 6 and SCA 12) to be very distinct.
16 – 17 October 2000, Kota Kinabalu, Sabah, Malaysia 4
• RFLP analyses carried out by Nestlé showed that the original Nacional variety israther homozygous and very distinct from Forastero and Trinitario types. Molecularanalyses appear to confirm that many of the cultivated Ecuador cocoa types derivefrom hybridisation between pure Nacional and introduced Trinitario types.
• RAPD analyses carried out on the CEPLAC collection in Bahia, Brazil have showncontinuous variation among the 270 genotypes analysed. A large degree ofvariation appears among the Upper Amazon types (mainly Pound collections) andamong accessions collected from the wild in Brazil. Lower Amazon Amelonadotypes (Comun variety) appear to be very closely related and at the extreme of thedistribution of Forastero types, nearer to Trinitario types. Scavina types form adistinct group at one extreme of the range of genetic diversity, genetically distant tothe Lower Amazon and Trinitario groups, and close to some of the accessions fromthe Ucayali river in Peru. Several unique RAPD bands were identified in theScavina clones, indicating their distinctiveness. Cultivated and wild genotypes fromEcuador tend to group together between Trinitario and Scavina types, respectively.As expected, clones of hybrid origin, such as CCN 51, tend to be located betweenthe putative parents on genetic diversity maps.
Applications in cocoa breeding• Information from molecular studies is very useful in managing diversity in
genebanks to establish base/core/working collections, ensuring that collectionscover the full range of diversity without overrepresentation of certain types andavoiding duplications. This is particularly important with regard to evaluation.Establishment of small representative core collections allows more extensive anduniform evaluation data sets to be assembled.
• Information on the genetic structure of cocoa populations, such as the level ofheterozygosity and genetic diversity, is directly useful in breeding. It can be usedto guide population enhancement or population breeding programmes, includingreciprocal recurrent selection based on recombinations between heterotic groups.
• The information generated can also be of value in attempts to maximise heterosis,and thus produce superior hybrids, since genetically distinct parental genotypescan be identified.
• Cocoa breeding programmes have started to integrate the new informationobtained from molecular marker studies to ensure that the diversity of thegermplasm is utilised effectively. However, much information is lacking, particularlyfor the material held in national genebanks.
Recommendations• Current findings, using isozymes, RAPD and microsatellite analyses, indicate that a
large part of the diversity of cocoa has not yet been exploited in breedingprogrammes. Collaboration in distributing this germplasm and evaluating itspotential through field trials is urgently required.
• Genetic diversity studies need to be continued to give more information on thegenetic diversity present in cocoa genebanks, with special emphasis placed on theidentification of ‘core’ collections.
• Continuous collaboration for further evaluation of the level of heterozygosity ofimportant breeding materials and of genetic distance between these clones isrequired.
• The information on the level of heterozygosity can be used immediately to createnew speculative crosses between genetically distinct and homozygous genotypes,which have not yet been used in cocoa breeding (such as crosses between FrenchGuiana, Amelonado, some Upper Amazon clones, Criollo and Nacional types).Such progenies can be expected to be uniform and exhibit good hybrid vigour (asobserved in ‘single crosses’ between improved pure lines in hybrid maize
16 – 17 October 2000, Kota Kinabalu, Sabah, Malaysia 5
selection). International collaboration is required to create and evaluate suchpromising ‘wide’ crosses.
• On the other hand, selection of new clones would be favoured in crosses betweenheterozygous and genetically distinct genotypes of high agronomic value,facilitating recombination of complementary traits.
Session 4. Correlation of Molecular Markers with Economically ImportantTraits
Results obtained to date• QTL for resistance to Phytophthora were identified in a collaborative project
(‘CAOBISCO project’). Co-localisations of QTL were observed for a number ofprogenies on chromosomes 1, 4 and 9 (coded according to the reference mapestablished at CIRAD).
• One strong QTL for resistance to Crinipellis has been identified in SCA 6.• QTL for agronomic traits such as yield, pod and bean characteristics were
identified mainly on chromosomes 1, 4 and 5 in a few different studies. For yield,some variation in QTL was observed over the years. One QTL on chromosome 4appeared to explain 43% of the phenotypic variation for pod size. A number of co-localisations were observed, mainly for related genotypes, but in some cases alsofor unrelated genotypes, of Trinitario or Upper Amazon origin. These resultssuggest a certain stability of QTL in cocoa.
• In one study, a major QTL for general agronomic value was found that explained27.1% of the total phenotypic variation and was co-localised with a QTL for earlyflowering and trunk diameter. Pleiotropic and epistatic effects were both detectedfor these traits.
Applications in cocoa breeding• The QTL studies have provided useful genetic information on the genetic basis of
several selection traits in cocoa. For example, the different QTL identified forPhytophthora resistance suggest that breeding approaches allowing foraccumulation of different resistance genes could be successful.
• It was generally recognised that the available information is generally not yetsufficient for the direct use of the QTL detected in cocoa breeding.
• After obtaining more robust and stable QTL, the markers associated with the QTLcan be used for Marker Assisted Selection (MAS). The technique can be used toaccelerate breeding progress, since those plants with QTL for one or moredesirable traits could be identified at the seedling stage. It is anticipated that theQTL/MAS systems developed could be transferable for use on similar progenies inother countries.
Recommendations• A common chromosome identification system for cocoa is essential and it was
agreed that the system developed by Lanaud and co-workers at CIRAD should beadopted internationally.
• The identification of QTL should be optimised for a limited number of selectiontraits. There is a need to choose strong QTL, such as those for significant levels ofresistance to several pathogens or strains of the same pathogen. Information frommarkers can be combined with phenotypic data to obtain a selection index.
• Clonally replicated progenies, containing a large number of individuals, will beneeded to take full advantage of the QTL analyses. Each progeny should consist ofat least 200 individual plants. It is very important to replicate these progenies in
16 – 17 October 2000, Kota Kinabalu, Sabah, Malaysia 6
different locations to map minor QTL and verify QTL stability across environments.This can only be achieved through international collaboration.
• Another approach to identify stable QTL is to use the possible linkagedisequilibrium that may persist in certain genetically related cocoa populations, suchas Trinitario or related Amazon populations (IMC, GU, etc.). Studies have beenrecently initiated for the Trinitario/Criollo group.
• Further development and transfer of simple marker technology to user countries isrequired before it can be integrated into cocoa breeding.
Session 5. Other Topics
Resistance gene homology and micro-array consortium• There are good indications that gene sequences detected in cocoa are similar to
known resistance genes in other plant species. Ten putative gene candidates havebeen identified that probably belong to three families of potential resistance (R) genes.The main objective is to screen germplasm for different resistance alleles.
• Microarrays are miniaturised systems which allow the simultaneous measurement ofthe comparative expression levels of thousands of genes in experimental and controlmaterial. This technique could be used to monitor gene expression profiles duringgrowth and development and in response to biotic and abiotic stresses. This canprovide leads to understanding basic molecular mechanisms, for example whichpathways are up regulated in response to a pathogen and which are turned off. It alsoprovides a means to rapidly identify candidate genes involved in a target process.
• Microarray systems for cocoa are being set up in several institutions and progresscould be accelerated if a cocoa gene expression microarray consortium can beestablished. A bioinformatics resource base is needed to link data obtained bydifferent research teams.
Applications in CSSV resistance studies and indexing• Molecular cloning methods have enabled the isolation of full-length infectious clones
of severe isolates of CSSV from Togo and Ghana. Mild isolates of the virus, whichhave potential use in cross-protection, have also been isolated. Infection of cocoabeans and young seedlings by particle bombardment and/or Agrobacterium-mediated infection is now possible. With these tools, specific virus inoculum can bequantified in challenging new cultivars in resistance breeding or cross-protectionprogrammes.
• New CSSV-specific primers have been designed for disease indexing bypolymerase chain reaction (PCR). Further development of this method is requiredso that it can form part of a quarantine procedure and thus help prevent the spreadof CSSV.
Session 6. Propagation Methods
Somatic embryogenesis (SE)• SE is a powerful tool for multiplication, germplasm conservation (cryopreservation),
germplasm exchange and genetic modification.• SE technology is not yet ready for commercial scale multiplication of improved
cocoa genotypes for farmers usage.• SE is expensive but can be used for fast multiplication of a limited number of
genotypes and the establishment of clonal gardens for further use with conventionalpropagation methods.
16 – 17 October 2000, Kota Kinabalu, Sabah, Malaysia 7
• SE protocols have been developed and the technology applied in at least ninelaboratories around the world. Floral parts are the explants of choice.
• The protocols are similar in the use of 2-4D and cytokinin but differ in the use ofbasal DKW, MS and Woody Plants Media. The majority of the laboratories areusing DKW.
• Close to 100 genotypes have been propagated by SE with high efficiency beingachieved for a number of genotypes. Conversion was achieved at 55-60%.
• Secondary embryogenesis is more efficient and produces unified embryos.• SE field tests and DNA tests to verify agronomic value and genetic uniformity are
required.• SE is a potential tool for cocoa germplasm exchange. However, it is not yet known
if SE propagated material is guaranteed virus-free (as is the case for zygoticembryos with CSSV). If so, SE could be of great help in speeding up the timeinvolved in transfer of germplasm.
Semi-industrial scale of production of rooted cuttings• The largest propagation centre ‘Biofabrica’ was established recently in Bahia, Brazil,
using traditional technology adapted from eucalyptus mass propagation systems.• Currently this centre is propagating 14 cocoa genotypes with resistance to Witches’
Broom disease. The rooting house and nurseries have the capacity for a dailyproduction of 50,000 rooted cuttings but at present a shortage of cuttings isrestricting the daily production to approximately 10,000 rooted cuttings.
16 – 17 October 2000, Kota Kinabalu, Sabah, Malaysia 8
Introductory Notes
Bertus Eskes
Cirad-Cp, TA 80/02, Avenue Agropolis, 34398 Montpellier Cedex 5, France
Scope
The objective of these introductory notes is to give a brief overview of the presentstatus of cocoa planting materials and breeding methods. This should help to set thecontext in which any new technologies would need to be applied and may thereforehelp in the process of formulating recommendations during this workshop. Theopinions expressed here are only meant to be a basis for further consideration; theyare the sole responsibility of the author of these notes and neither express the opinionof INGENIC as an association nor that of any sponsoring institution of INGENIC.
New technologies used in plant breeding are presently undergoing dramaticdevelopment. These technologies can provide new insight into the genetic structure ofgermplasm and inheritance of selection traits. Thus, they can offer the breederguidance when deciding on the choice of new parents to be used in breeding and ofselection methods. These technologies also have the potential to increase selectionefficiency, through marker-assisted selection, and to overcome, through genetictransformation, major production constraints such as losses due to pests and diseases,which are difficult to overcome by traditional methods.
Improvement of cocoa planting material involves several steps: germplasmmanagement, characterisation and evaluation, development of breeding tools (earlyscreening methods, biotechnologies), genetic studies, creation and selection of newvarieties (variety trials), and multiplication and distribution of new planting materials.The adoption of new technologies in cocoa breeding will depend not only on theefficiency of these methods (accuracy, costs) in relation to alternative methods, butalso on the feasibility of introducing these technologies into practical breedingprogrammes. There is no doubt that the first requirement for integration of any newtechnologies is the existence of strong traditional breeding programmes.
Cocoa planting material
The availability of good varieties is a basic feature of sustainable production of anycrop. However, it has been estimated that only about 30% of the total cultivated cocoaacreage is planted with selected varieties (Paulin and Eskes 1995). These varietiesconsist mostly of mixtures of bi-parental crosses (hybrids) between local andintroduced clones. Only a very small part is made up of selected clones. Theunselected cultivated cocoa varieties consist mostly of traditional populations(Trinitario, Amelonado, F3 Amazon) and of open-pollinated populations derived fromselected hybrid varieties. Farmers are increasingly using seeds taken from their ownpreferred trees. The latter process is expected to result in partial inbreeding of plantingmaterials, known to be related in cocoa to loss of vigour and yielding capacity(INGENIC 1995). This situation demonstrates the urgent need to develop and distributebetter varieties.
Diseases and pests continue to cause heavy crop losses in all producing regions,endangering the sustainability of cocoa growing. For example, black pod disease dueto Phytophthora megakarya causes losses of up to 70% in Central Africa and now
16 – 17 October 2000, Kota Kinabalu, Sabah, Malaysia 9
threatens Côte d’Ivoire, which provides 40% of the world’s production. The witches’broom disease has reduced cocoa production by 70% in the State of Bahia, Brazil.
Some high yielding clonal cocoa varieties with effective resistance to diseases havebeen selected during the last 25 years. Examples are the VSD resistant clonesselected in Asia (e.g. PBC 123 occupying 30% of the Malaysian cocoa belt) andwitches’ broom and black pod resistant clones in Trinidad (TSH clones). The latterclones are also being used to control the very serious witches’ broom outbreak inBahia, Brazil. These examples indicate the potential for genetic control of destructivecocoa diseases.
Trends in cocoa breeding
Trends identified in cocoa breeding methods (INGENIC 1995; INGENIC 1999) are:• Growing interest in clone selection as a method that can give quick genetic
progress (resistance, quality,..).• Initiation or reinforcement of recurrent selection programmes, aiming at continuous
genetic progress through adequate use of general and specific combining abilities.• Initiation or reinforcement of germplasm enhancement programmes, aiming at
accumulation of favourable alleles in breeding populations.• Increased international collaboration, not only for germplasm conservation and
distribution but also for germplasm evaluation and utilisation.Trends in the selection criteria applied in cocoa breeding are:
• More attention is being given to disease and pest resistance, especially in thosecases where suitable screening methods are available.
• In addition to breeding for yield, breeders are selecting for more efficient andsmaller trees that can be easily managed by the farmers.
• Quality is becoming a major selection criterion for niche markets. The recentevidence of the strong genetic component of flavour traits should make it possible toselect more efficiently for these traits.Recently, efficient, early and rapid screening tests for resistance to Phytophthora
pod rot have been developed, and these are now becoming widely applied in cocoagermplasm enhancement (Iwaro and Butler, in press) and in cocoa breeding (Eskes, inpress). However, methods for early screening for resistance to other importantpathogens (like Moniliasis, witches’ broom, and VSD) and to insects (mirids and cocoapod borer) must still be developed or improved.
The above trends indicate that cocoa breeding needs to be based on effectiveintegration of different disciplines using a teamwork approach. The role of newtechnologies in this complex of activities remains to be defined.
Conclusions from the first and second INGENIC Workshops
Before starting this Workshop, it may be useful to remind participants of theconclusions related to New Technologies formulated during the first two INGENICworkshops.
The 1994 Workshop on ‘Cocoa Breeding Strategies’ (INGENIC 1995) concludedthat new technologies:• are to be considered as ‘tools to complement conventional breeding’,• give ‘insight into the genetic structure of cocoa populations’,• are ‘powerful for characterisation and identification’,• ’should not detract from conventional breeding’, and• ‘should be applied to problems that are difficult to solve otherwise’.
16 – 17 October 2000, Kota Kinabalu, Sabah, Malaysia 10
The 1996 Workshop on the ‘Contribution of Disease Resistance to Cocoa VarietyImprovement’ (INGENIC 1999) concluded that:• ‘reliable methods are required for disease resistance measurements’,• ‘links of markers with black pod resistance have been established’,• ‘improved methods of vegetative propagation have a role to play in rapid
distribution of clones with resistance to destructive diseases’, and• ‘international collaboration is essential to facilitate accumulation of resistance
genes’
Cocoa breeders and biotechnologists
For the sake of comparison, cocoa geneticists have been classified into two categories:‘conventional breeders’ and ‘biotechnologists’. For several reasons, the number ofconventional cocoa breeders has been decreasing over the last ten years,, and thisappears to endanger the maintenance of strong breeding programmes. Conversely, thenumber of biotechnologists has been rapidly increasing. A rough estimate of thenumber of researchers in these two categories indicates that presently approximately21 active ‘conventional breeders’ and at least 17 ‘biotechnologists’ are effectivelyworking on cocoa.
The majority of the cocoa biotechnologists are working in laboratories in theAmericas and in Europe, suggesting the existence of at least a temporary geographicalgap between places of development and places of application of these newtechnologies. This leads to the question of how and when these technologies could betransferred to user sites.
Workshop Objectives
In preparing for this Workshop, INGENIC has identified the following objectives:• Analysis of general progress obtained and constraints identified in using new
technologies in plant breeding (lead speaker).• Analysis of progress obtained in the development of new technologies in cocoa.• Presentation of summarised results that are of direct use to the breeders.• Presentation and discussion of collaborative new activities.• Identification of research gaps.• Formulation of conclusions and recommendations.The presentations have been grouped into themes Sessions to facilitate discussions oncommon applications and/or techniques. It is fully appreciated that there will be someoverlap between the contents of the Sessions, but it is hoped that this will not adverselyaffect our discussions.
References
Eskes A. B. In press. Collaborative activities on cocoa germplasm utilization and conservation.In Proceedings of the 13th International Cocoa Research Conference, 8-14 October 2000,Kota Kinabalu, Malaysia.
INGENIC. 1995. Pages 195 in Proceedings of the International Workshop on Cocoa BreedingStrategies. October 1994, Kuala Lumpur, Malaysia. INGENIC, Reading, UK.
INGENIC. 1999. Pages 219 in Proceedings of the International Workshop on the Contribution ofDisease Resistance to Cocoa Variety Improvement. November 1996, Salvador, Bahia,Brazil. INGENIC, Reading, UK.

16 – 17 October 2000, Kota Kinabalu, Sabah, Malaysia 11
Iwaro A. D. and D. R. Butler. In press. Germplasm enhancement for resistance to black pod andwitches’ broom diseases. In Proceedings of the 13th International Cocoa ResearchConference, 8-14 October 2000, Kota Kinabalu, Malaysia.
Paulin D. and A. B. Eskes. 1995. Le cacaoyer: stratégies de sélection. Plantations RechercheDéveloppement 2: 5-18.
16 – 17 October 2000, Kota Kinabalu, Sabah, Malaysia 12
The Application and Constraints of New Technologies in PlantBreeding
Mike J. Wilkinson
Plant Science Laboratories, The University of Reading, Whiteknights, PO Box 221, ReadingRG6 6AS, United Kingdom
Abstract
The usefulness of a range of modern biotechnological and molecular tools is evaluated for thegenetic improvement and maintenance of cocoa breeding material. The process of selectionduring plant breeding inevitably leads to a narrowing of the genetic base of any crop. In turn,this can lead to an increased vulnerability of the crop to pests and disease attack. Cocoa iscurrently facing threat from several diseases, particularly from pathogenic fungi. In its currentform, cocoa is not amenable to widespread use of prophylactic chemicals for disease controland there is limited scope for control by changed agronomic practice. This leaves biologicalcontrol (which is in its infancy in cocoa) or more realistically in the short term, internal resistanceas the main means of protecting the crop in the field. The maintenance of active and fullycharacterised germplasm collections represents the starting point for introducing resistance andquality traits into cultivated material. Resources inevitably limit the size of these collections andso it is important that managers have a rational basis upon which to select which clones tomaintain and which to discard. The role and limitations of molecular biology in reaching thesedecisions are discussed. Effective use of germplasm collections also depends on clear andaccurate identification of material held, ready access of disease-free stocks and evaluation dataon the nature and extent of any resistance genes present. Problems of clone identification canbe addressed partly by careful management but ultimately rely on a system for identifyingmislabelled stocks. The relative merits of RAPDs, AFLP, ISSR, SSR and locus-specificpolymorphisms for addressing this problem are examined. Ultimately, the holding of stocks isonly of any practical value if the resistance genes or quality traits they contain can be identified,characterised and quickly transferred into breeding material. Here, QTL analysis,transcriptomics and marker assisted breeding each have potential for accelerating the processof gene transfer. Finally, the benefits, limitations and hazards of using genetic modification forcocoa improvement are examined.
Introduction
Over the past fifty years, new breeding technologies have resulted in hugeimprovements in the yield and productivity of temperate combinable crops such aswheat, potato and maize. For instance, cereal production has increased at a rate ofabout 60% per decade from 740 Mt in 1950 to about 1,900 Mt in 1995 and will have toincrease by another 690 Mt to meet projected demand in 2020 (Dyson 1996).Approximately half of the increase in productivity is generally attributed to geneticimprovement. The cultivation of cocoa has not seen this same improvement inagronomic performance, with an increase of around 25% over the last decade from2407 thousand tonnes in 1989 to 3003 thousand tonnes in 1999 (Anon. 1999 and2000), which has been mainly due to an increase in land area. Diseases remain amajor threat to the yield of cocoa. This paper examines the applications and constraintsof new technologies in modern plant breeding and evaluates their potential for thefuture of improvement of cocoa.
16 – 17 October 2000, Kota Kinabalu, Sabah, Malaysia 13
The role of molecular biology in cocoa breeding
The tools availableConventional plant breeding has enabled significant improvements in the agronomicperformance of most crops and will continue to play a central role in the futureimprovement of cocoa. However, the advent of new technologies greatly enhances theability of breeders to effect further improvements to crop quality, disease resistanceand yield. The use of molecular marker systems aids clone identification and paternityanalysis, the assessment of genetic affinity of clones and ultimately will allow gene-based evaluation of the agronomic value or physiology of clones. The emerging field oftranscriptomics (the study of global gene expression) seems set to speed theidentification of key genes in important pathways and will increase our understanding ofhow these genes interact. The possibility of subjecting the crop to Genetic Modificationmay open the way to effecting changes to particular processes and biochemicalpathways with greater precision. For a breeder, the starting point for all of this work liesin developing an understanding of the various molecular tools that are available andtheir limitations.
The type of marker system used and the purpose to which it is applied defines thevalue of molecular markers for breeding efforts. For global applications, however, it isimportant that the system used generates differences between closely relatedindividuals but also does so in a way that is easily reproduced and is amenable todatabase entry. There are many different marker systems currently available tobreeders and scientists. These methods can be broadly categorised into two mainclasses.• Multi-locus systems. These include Amplified Fragment Length Polymorphisms
(AFLP), Inter Simple Sequence Repeat (ISSR), Retrotransposon MicrosatelliteAmplified Polymorphisms (REMAP) and Randomly Amplified Polymorphic DNA(RAPD) analyses. Characteristically, this type of marker system produces largenumbers of bands from throughout the genome. In general, the markers tend toarise from non-coding DNA. The presence and absence of bands of the same sizeprovide the polymorphisms that are used as the basis of discrimination. In essence,this is analogous to the comparison of bar code patterns. Individual band differenceswithin the profiles can be converted into simpler locus-specific polymorphisms(single band differences) using Site-Specific Amplified Polymorphisms (SSAP).
• Multi-allelic systems. These systems include Simple Sequence Repeat PCR (SSR-PCR) and isozymes, using markers that arise from a single point in the genome.The polymorphism is given by differences in the size of the product amplified, i.e.bands in different positions on a gel.
Multi-locus markersRAPD analysis was the first multi-locus protocol based on Polymerase Chain Reaction(PCR) to be applied for the genetic characterisation of cocoa (Wilde et al. 1992). Thissystem has the innate advantage of being quick, technically simple and cheap toperform but has developed a reputation of questionable reproducibility betweenlaboratories (Gilmour 1994), in yielding only small numbers of variable markers and inbeing problematic to score for routine, high throughput applications. Problems with thereliability of RAPD analysis led to the development of more robust protocols. AFLPanalysis (Vos et al. 1995) is based on the PCR amplification of a subset of DNAfragments generated by two different restriction (i.e. cutting) enzymes. It is widelyregarded to be highly reproducible within a laboratory and usually generates around50-100 DNA fragments of detectable size per amplification reaction. The large numberof products produced necessitates the use of DNA sequencing-sized polyacrylamidegels and a suitable detection system (usually radiodetection or through the use of
16 – 17 October 2000, Kota Kinabalu, Sabah, Malaysia 14
fluorescently labelled nucleotides) or capillary sequencing equipment forelectrophoretic separation of the products. In consequence, initial infrastructural costscan be significant for non-specialist laboratories. Furthermore, complexity of theprofiles generated and the sensitivity of the technique to even minor changes in theelectrophoresis running conditions make data documentation and transferabilitybetween institutions an impracticable prospect. Inter Simple Sequence RepeatPolymerase Chain Reaction (ISSR-PCR) generates more simple band profiles(Charters et al. 1996a) that show some evidence of reproducibility betweenlaboratories (Charters et al. 1996b). Theoretically therefore, this technique could havepotential generic utility although the complexity of the band profiles would causesignificant data entry problems (particularly for minor, faint bands) and the protocolused would have to be standardised to a very high degree of accuracy.
More recently, further protocols have been developed that utilise the ubiquitouspresence of both retrotransposons and microsatellites (Simple Sequence Repeats) inhigher organisms. These techniques are REtrotransposon Microsatellite AmplifiedPolymorphism (REMAP) and Inter Retrotransposon Amplified Polymorphism (IRAP)and like AFLP, these techniques generate very large numbers of amplificationproducts. As yet, the reproducibility of these procedures is uncharacterised althoughthe readiness of retroelements to move in response to environmental stimuli may be acause for concern. The complexity of band profiles produced, like AFLP and ISSR, alsorenders data entry problematic.
Multi-allelic markersIsozymes were the first marker system based on multiple alleles generated at a singlesite in the genome. The low numbers of different isozymes available, the low numbersof polymorphisms typically generated by each isozyme, difficulty in handling largenumbers of samples and the possibility of sensitivity to environmental influencesseriously limit the value of isozymes as a universal reference marker system for cocoa.
Simple Sequence Repeats (SSRs), also known as microsatellites, consist of tandemarrays of short oligonucleotide sequences 2 to 6 bases in length. SSRs are extremelycommon throughout the eukaryotic genome (Tautz and Renz 1984) and are highlypolymorphic in length (Levinson and Gutman 1987). The variation in length is the mostwidely exploited means of using SSRs to reveal differences between individualgenotypes. It is now the method of choice for human genetics applications (e.g.Zoossmann-Diskin 2000; Service et al. 2001; Ota et al. 2001). SSR-PCR analysisinvolves the direct amplification of a specific SSR using two primers that specificallybind to regions flanking the target SSR. Differences between the lengths of theamplification products form the basis of the comparison. Thus, once appropriateprimers have been generated, SSR-PCR is quick, highly diagnostic and because theband profile is simple, is relatively easy to automate and generates information that istransferable between laboratories. Minor limitations lay in the presence of stutterbands, that can cause difficulty in the automated scoring of some loci, in therequirement for standardisation of labels and alleles for full transferability and, moreimportantly, that high resolution polyacrylamide gel electrophoresis (PAGE) or capillarysequencing equipment is used for band separation. The last point limits the applicationof the technique to moderately well established laboratories except for the scoring oflarge allelic differences. High mutation rates between the allelic states of SSRs couldalso be a cause for concern.
Targeted locus-specific systemsThus far, all markers have been initially generated from random sites within thegenome. This is even true for SSR-PCR, where the original isolation of the SSR isusually performed by screening a genomic library for clones that contain a large SSR.An attractive alternative to the random approach is the targeting of particular loci togenerate markers. Such loci could be targeted because they represent genes of
16 – 17 October 2000, Kota Kinabalu, Sabah, Malaysia 15
interest or may simply be a particularly useful band marker from a complex profile(such as an AFLP marker) that is linked to a desirable gene or QTL. Targeted locus-specific markers can be based on relatively large differences between individuals in theDNA sequence of the targeted fragment or can be based on Single NucleotidePolymorphisms (SNPs).
There are numerous approaches used for detecting such differences but those mostapplicable for modestly equipped laboratories exploit intron size variation, such asHeteroduplex analysis and Cleaved Amplified Polymorphic Sequence (CAPS). In allcases, the polymorphisms are simple to generate and score but require primers thatare specific to the targeted locus. These can be generated directly from previouslyknown sequence information or if necessary, a band from a complex multiple bandprofile, or cDNA clone, can be extracted from a gel, re-amplified by PCR, cloned and itsDNA sequence determined. From this information primers specific to the DNA in theband can be designed and used to produce individual copies of the band. Markersgenerated by this process are called Sequence Characterised Amplified Region(SCAR) markers and can be easily scored on agarose gels stained with ethidiumbromide.
Accumulation of such markers provides the almost limitless ability to distinguishbetween genotypes and yet also allows targeted focussing on genes of interest.
Applications of markers for cocoaMarkers that differentiate between individuals offer a wide range of uses for bothgermplasm curators and breeders. The value of molecular biology for cocoa genebankmanagers can be broadly broken down into three main applications: (1) cloneidentification and paternity analysis; (2) the assessment of genetic affinity and diversityof clones held, and (3) the evaluation of the agronomic value or physiology of clones.These applications are explored below.
The needs of germplasm managers
Clone identificationGenebank managers need techniques to allow them to distinguish between genotypesand identify mislabelled accessions. Genetic fingerprinting techniques are generallyvery useful in this process. However, there are some cocoa accessions, generallysiblings produced through self-pollination of a highly homozygous tree, which giveidentical, or almost identical, marker profiles. In such cases, it can be difficult toestablish whether two plants (cuttings or seedlings) should be considered to berepresentatives of the same genotype. In practical terms, it is probably advisable toadopt a pragmatic approach in which two plants are considered as effectivelybelonging to the same clone following the failure to detect variation after applying somearbitrary number of markers.
Practical constraints (limited resources, laboratory facilities and time or space)poses far greater demands on the technique if it is to have practical utility forgermplasm management purposes. Ideally, the protocol should possess the followingfeatures:• highly diagnostic,• cheap,• easy to perform,• demand low infrastructure costs,• easy to document into associated databases,• capable of diagnosis at different taxonomic ranks,• reproducible within and between laboratories,• amenable to automation,• adaptable for gel-free analysis, and
16 – 17 October 2000, Kota Kinabalu, Sabah, Malaysia 16
• provide some indication of phenotype.Of the techniques that are currently available, SSR-PCR probably represents the
system of choice, provided that effort is made to minimise linkage between the SSRloci used for identification purposes and to select SSRs with the highest allelic diversitywithin the species. SSR-PCR can differentiate between a maximum of around tenalleles per locus. Under optimal circumstances, the frequency of such alleles in apopulation should be evenly distributed so that about 10% of the population possesseach allele. This reduces the number of SSR primer pairs needed to distinguishbetween most genotypes and provides the highest power of diagnosis.
There are nevertheless some practical considerations that may ultimately restrict thevalue of SSR-PCR analysis for automated or local large-scale applications. Most SSRalleles differ in size by only 2 to 10 bases and so require high resolution PAGE forresolution. In most cases, therefore, specialist molecular laboratories are needed forfractionation and fragment detection. For this reason and logistical difficulties instandardising allele identities and label usage, large-scale genotype identificationprogrammes will probably rely on third party service arrangements rather than in-houseassessments.
In the future, therefore, it is probable that simple locus-specific systems will be usedsuch as CAPS, SCAR-based polymorphisms and Single Strand ConformationalPolymorphism (SSCP). Such systems will prove to be more useful to the germplasmmanagers in the long run. Of these, CAPS is the simplest and easiest to use. It isbased on the presence or absence of a restriction site at a site of sequencepolymorphism (e.g. a SNP) and is codominantly inherited (heterozygotes can bedistinguished). In this case, the presence or absence of the restriction site defines theallelic states, whereas in SCAR-based systems this is defined by the presence orabsence of an amplicon. The most efficient strategy to use such a two or three allelicsystem for the identification of genotypes is to select markers that progressivelysubdivide the total gene pool into groups of approximately equal size. Thus, for a twoallele system (SCAR), one marker has two possible groups (band present or absent).Two markers generate four groups (++, +-, -+, and --). It follows that for ten bands, 210
categories are created (=1024) and for 20 markers, 220 possible allele combinations areproduced (=1 048 576). Thus, even when only two allelic states are possible, 20 to 30bands should be sufficient for diagnostic purposes.
Genetic diversity analysisThere are two main applications for genetic diversity analysis in germplasmmanagement. Firstly, in establishing the composition of a core collection, a subset ofaccessions which will give a good representation of the genetic diversity present in thewhole collection. Secondly, genetic distance analysis of the entire collection, or a largeportion of it, can identify genetic groups that are under-represented. This type ofinformation can enable priorities to be established for subsequent germplasm collectingexpeditions.
A key factor determining the accuracy of genetic distance analysis is the avoidanceof bias in sampling strategy (if a subset is used). It is also important that the analysis isnot based on a small coverage of the genome, particularly if some of the loci used togenerate polymorphisms are tightly linked to genes under strong selection pressure.For this reason, multi-locus techniques such as AFLP and ISSR are probably of mostvalue. Of these, the latter is most suited for use in a modestly equipped laboratory.
Clone evaluationThe relationship between genotype and agronomic performance is still poorlycharacterised in most crops, including cocoa. Ultimately, however, germplasmmanagers and breeders will desire knowledge of the identity of genes that areimportant in controlling agronomically important traits and also of the allelic status ofthe plant material that is available for improvement programmes. In this way, the
16 – 17 October 2000, Kota Kinabalu, Sabah, Malaysia 17
breeders will possess some ability to predict the likely performance of the clone and itsoffspring in relation to the targeted trait. The selection of the most appropriate strategyfor identifying and characterising genes involved with the control of important traitsdepends on the number of genes involved and whether or not their identity is alreadyknown.
Where the gene has not been identified, the most commonly used strategy is to useallelic polymorphisms in a tightly linked marker. This has value for predicting theperformance of progeny from a characterised parent but is less useful across a widerange of germplasm. This is partly because frequent recombination over manygenerations breaks up any relationship between marker and gene alleles, but alsobecause alleles on the marker tend to evolve at different rates to alleles on the linkedtargeted gene. A more direct approach can be used in cases where the identity of thegene is known. Here, the breeder may either use a marker located within or very closeto the gene (within 1Kb). This overcomes any problems associated with recombinationbut not with differential rates of evolution. A second, more robust strategy is to developSNP-based markers that directly distinguish between alleles of the targeted gene.
The needs of breeders
Marker-assisted breedingMarker assisted selection has played a significant role in the genetic improvement ofcrops with well-characterised genomes but has yet to play a significant role in theimprovement of cocoa. There are essentially three states of knowledge that dictate theapproach used.
First and most simply, is the case where the identity and DNA sequence of the geneis known. In these instances, exploitation of the differences in DNA sequence betweenallelic forms of the gene can allow the development of molecular markers thatdistinguish between alleles. For breeding purposes, it is most desirable to usetechnically simple systems that are reliable and capable of high throughput. There areseveral possible candidate methodologies. These include variation in intron size(SCAR primers in flanking coding regions), CAPS analysis (restriction site on a SNPthat distinguishes between alleles), SCAR analysis (3' end of primer(s) sited on a SNPor insertion/deletion (indel)) and heteroduplex analysis (sequence polymorphismsbetween alleles giving rise to an extra, heteroduplex band).
A more common scenario is where the breeder knows that a trait is controlled by asingle gene but does not know the identity of the gene responsible. In these instances,one option open to the breeder is to identify markers that are linked to the gene anduse these to assist selection. This can be achieved relatively simply by ‘bulkedsegregant analysis’. A segregating mapping population is divided into two halves basedon phenotype. DNA is extracted from all individuals in a population. DNA from plantsrepresenting each phenotype are pooled together such that there are two pools (onefor each allelic state). These pooled DNA samples are then used as a template for amulti-locus marker system such as AFLP or ISSR. Markers that are tightly linked to thegene and polymorphic between the parents will generate bands that are present in onepool and yet absent in the other. These candidate markers are then tested on theoriginal segregating population and those closest to the gene can be used for marker-assisted selection. This approach, although reliable, can have limited generic valuesince the markers may not be polymorphic in progenies derived from other parents. Amore predictive approach is to use information on the behaviour of genes in a modelorganism as the basis for an informed guesswork approach to infer the possible identityof the gene. This is called the candidate gene approach. Primers specific to thecandidate gene are used to amplify all or part of the gene from the parents by PCR andsubjected to sequence analysis (to sequence differences between the parental forms ofthe gene). In turn, these are applied to the segregating population to test for co-
16 – 17 October 2000, Kota Kinabalu, Sabah, Malaysia 18
segregation with the variation observed in the phenotype. Transformation experimentscan be used to confirm the identity of the gene.
The final scenario is where there are several unknown genes controlling the trait ofinterest. Under these circumstances, Quantitative Trait Loci (QTLs) analysis can beapplied to mapped populations that segregate for the trait of interest. Associations aresought between the alleles of markers flanking a gene or gene cluster that is importantin controlling the trait. The validity of the strategy depends firstly on the population sizebeing sufficiently large to avoid recombination bias (typically populations of over 200plants are desirable). Secondly, the map needs to contain a large number of markersevenly distributed over the entire genome such that there are no regions with poorcoverage. Finally, it is important that the progeny segregates widely for the trait ofinterest.
There have been several studies that describe QTLs associated with traits ofinterest in Theobroma (Crouzillat et al. 1996, 2000a and 2000b), although the markersgenerated have yet to be applied as part of a breeding programme. The prospect ofprogressing from the identification of a QTL to the isolation of the gene(s) responsibleby map-based cloning is an attractive one but has been achieved so far just once intomato (Frary et al. 2000). In practical terms, such an approach is costly in time andresources, and requires very large populations to accumulate a suitable number ofrecombinant individuals (typically in excess of 1000). It is therefore unlikely to havepractical value for the routine isolation of agronomically important genes.
QTL analysis has far greater potential for the identification of markers for MarkerAssisted Breeding. This requires that the QTL identified is stable over years and sitesand that the markers used are closely linked to the QTL (generally less than 2cM).Ultimately, QTL analysis may equally have potential for the selection of two parentswith complementary genetic architectures. Again, cognisance should be taken of thestability of the complementary QTLs over sites and years. Perhaps one of the mostpowerful applications of QTL analysis, however, will be realised when it is combinedwith genomics information. For instance, the map position of a candidate gene overlaidonto a QTL analysis of an established mapping population could be used to testwhether the gene is responsible for any of the observed variation in a targeted trait.
In the immediate future, there is a clear need to improve the resolution and accuracyof QTL analysis in Theobroma. This requires the replication of large mapping progenies(more than 200 plants) across several geographically dispersed sites and the repetitionof phenotypic scoring over several years. For the medium term, Sequence TaggedSites (STS) anchor points need to be established to enable comparisons with maps ofmodel and intermediate species (synteny mapping). In the medium term, theexploitation of linkage disequilibrium (LD), to identify candidate genes, also haspotential utility. LD refers to correlations among neighbouring alleles, reflecting'haplotypes' descended from single, ancestral chromosomes. However, work on thehuman genome suggests that different regional groups may exhibit differing patterns ofLD associations. Reich et al. (2001) conducted a large-scale experiment using auniform protocol to examine 19 randomly selected regions in the human genome. LD ina United States population of north-European descent typically extended 60 kb fromcommon alleles, implying that LD mapping is likely to be practical in this population. Bycontrast, LD in a Nigerian population extended markedly less far. The result was usedto suggest that LD in northern Europeans is shaped by a marked demographic eventabout 27,000-53,000 years ago.
The future of Theobroma genomics and post-genomics
16 – 17 October 2000, Kota Kinabalu, Sabah, Malaysia 19
The growing volume of DNA sequence information relating to the genomes of modelspecies offers exciting opportunities for the rapid identification of some of the genesinvolved in key processes. The complete genome of one plant species (Arabidopsisthaliana) has now been sequenced and there are now many plant species for whichsequences of expressed genes (Expressed Sequence Tags, EST) are available. Thefunction of many of these genes is already known and the functions of many more willbe inferred over the coming years. There is a real opportunity to use important genesfrom the model species in order to find their equivalent versions in cocoa. This is amoderately challenging process but offers great long-term rewards to the breeder.There are several parts to the process of achieving this aim.
First, the DNA code for one gene can be very similar to that of another, relatedgene. It is consequently important when developing markers that are specific only tothe target gene that only the part of the code that is unique to it is used to produce themarker. Reaching this goal starts with the comparison of regions of the DNA sequenceof the target gene from several species with those of related genes. Gene-specificparts of the code are used to produce primers that bind only to these diagnostic partsof the gene code. The primers are then used to amplify the equivalent piece of DNAfrom cocoa. This can be achieved either directly using genomic DNA from cocoa byPCR or using messenger RNA (mRNA) by reverse transcriptase-PCR (Rt-PCR) . Full-length coding sequences of the cocoa version of the gene can then be generated by anumber of approaches (e.g. 5', 3' rapid amplification of cDNA ends (RACE)).Sequences of the candidate gene from the target species (Theobroma) can then becompared with that from the model organisms. Proof that a candidate is a homologueof one of known function in a model group should not be based entirely on sequencesimilarity but rests on supportive evidence such as complementation experiments andassociation/mapping studies. Thus, in order to fully exploit these resources it may benecessary to map the Theobroma genome to establish the extent of synteny (sharedgene order) between cocoa and the model crop species. This would require collectionsof around 200-plant progenies at replicated sites to be screened for anchor points tomap against the model species. Information generated from anchor points would allowcomparative maps to be established.
The choice of marker system for such anchor points and for future mapping andgenomics-based applications is open to some question. SSR-PCR is the methodgenerally favoured for the generation of anchor points for most groups within a genus.However, since DNA sequences from distantly related species are more disparate, thelikelihood that the PCR will fail increases when attempting to compare plants fromdifferent genera or families. For this reason, markers associated with the moreconserved (less variable) DNA sequences within genes probably offer betteropportunity for anchor points for maps that span large taxonomic distances.
As more information on candidate gene sequences and their functions becomesavailable, there is also scope to use such data for the development of markerscorresponding to the genes themselves rather than the current reliance on neutralmarkers from non-coding regions. The targeting of SNPs, indels or SSRs within genesfor the production of new markers has attractions far beyond testing the role ofcandidate genes. They have potential also for use as linked markers in their own right.
There are around 25000 genes in the best-characterised plant species, Arabidopsisthaliana (Kaul et al. 2000). In higher organisms, genes are distributed unevenly acrossthe genome so that groups of genes will frequently cluster together into the same, verysmall region of a chromosome. Most of the chromosome is almost invariably composedof DNA that does not code for any gene. By definition then, a marker from one genewithin such a cluster is likely to fall close to another within the same cluster. 'Neutralmarkers' from methods such as AFLP, ISSR or SSR-PCR may be positioned close toor distant from regions containing a gene or gene cluster. Thus, as markers for linkagemaps, markers taken directly from the genes themselves should perform no worse andprobably better than neutral markers.
16 – 17 October 2000, Kota Kinabalu, Sabah, Malaysia 20
There are advantages too in the nature of the markers generated directly from genesequences. Small changes in sequence between genotypes (e.g. SNPs) are mostusefully converted into CAPS markers or indels into SCAR markers. This type ofmarker produces data of a simple presence/absence type that is both easily scoredand amenable for entry into databases. It is conceivable that future research efforts forthe generation of markers may place increased emphasis on the generation of markersfrom within the genes themselves.
The production of gene code sequence data (either from EST or genomic sources)also allows the detailed study of how these genes are expressed and interact within thetrees themselves during key developmental stages or in response to infection. This iscalled transcriptomics. The effective use of transcriptomic approaches also allows forthe inference of gene function and the further characterisation of candidate genes. Inthe early stages, where sequence data is largely missing, Serial Analysis of GenomeExpression (SAGE) perhaps offers the most appropriate method of measuring genomeexpression as it does not depend on prior knowledge of gene code. Data generatedfrom this approach, however, can subsequently be applied for the isolation of full-lengthcode sequence of active genes. This can, in turn, be used to assemble a collection ofcocoa genes on micro-arrays. Micro-arrays offer the most effective method for studyingthe expression of these genes on a large scale. This will ultimately lead to a morecomprehensive identification of the gene cascades involved in key agronomicprocesses.
The role of genetic modification
Genetic Modification (GM) technology has considerable potential for the cocoa breederand geneticist in two ways:• as an experimental tool to confirm the function of candidate genes,• for the correction of inherent genetic flaws in the crop by the insertion of novel
transgene constructs.Despite the strength of public opinion against GM technology in some parts of the
world, the number of GM crop field trials continues to increase. The OECD databasealso shows a continual rise in the number of genes available. In 1999, the commercialcultivation of GM crops across the globe included over 20 Genetically Modified (GM)cultivars on about 40 Mha (http://nbiap.biochem.vt.edu; corrected on 22 June 2000).Collectively, these cultivars contain 31 transgenes and the trend is towards proliferationof GM crops and increasing the type and number of transgenes they contain. Forexample, the US National Biological Impacts Assessment database (James andKrattiger 1999) lists approved releases for the USA alone of some 60 GM crop speciescontaining about 300 transgenes. Advances in gene isolation technology, in the controlof transgene expression and the advent of “gene shuffling” technology will combine toincrease the number of crop-cultivar combinations still further.
The development of efficient transformation systems for cocoa (Perry et al. 2000)offers considerable potential benefits for the crop over the medium to long-term. GMtechnology could lead to a durable solution for many of the important pest and diseaseproblems faced by the crop since resistance to new pathogen strains could beincorporated into existing varieties, as and when required, perhaps more quickly usingGM than by using conventional techniques. Consumer resistance to the use of thetechnology is currently preventing emphasis being placed on research into thegeneration and commercial cultivation of GM cocoa lines. In the medium term, it maybe argued that gradual public acceptance of the technology in other crops throughrepeated exposure to GM material will allow its ultimate introduction and use in cocoa.
However, it would be very important that the appropriate risk assessmentstudies on GM cocoa had been conducted well in advance of the release of any GMcocoa varieties. The commercial release of any crop involves three stages. 1. Small-
16 – 17 October 2000, Kota Kinabalu, Sabah, Malaysia 21
scale field experiments. 2. Replicated field trials. 3. Registration or listing on a nationalor regional list of approved cultivars. Detailed evaluation of the environmental risksposed by the GM line is required at each stage of this process. This information iscomprised of two parts: a part that relates specifically to the transgene and another partthat relates more generically to the crop itself. In a global context, most regulatoryrestrictions address risks posed to human health (specific to the transgene) and thoseposed to the environment (determined by the transgene and the biology of the crop).For most crops, the greatest environmental risk is often seen as the possibility oftrangene movement into wild relatives, non-GM crops or possibly to other organisms byhorizontal gene transfer and of the effect of the GM crop on non-target species. Oftenoverlooked, however, are possible effects arising from changes to farm practice thatare evoked by the technology and the possibility that the crop itself may become aninvasive of natural or semi-natural habitats. I will briefly explore each of these inrelation to the possible commercial release of GM Theobroma cacao.
Gene flowThe wide range of transgenes available, coupled with historic records of hybridisationevents between crop and wild relatives (Ellstrand et al. 1999) makes some pollen-mediated transgene movement inevitable over the medium to long term. This is notnew and has occurred from non-GM cultivars (Scheffler and Dale 1994; Stace 1997;Ellstrand et al. 1999), although in a small number of cases, transgenes will enhancefitness of certain recipient wild relatives and could change their ecology. This may, inturn, affect the communities in which they live. The scale of such an environmentalconsequence is unlikely to be of great significance on a global scale for most crops,although over a limited range ecological consequences could be significant, dependingon the ecological importance of the recipient species.
Theobroma is endemic to South and Central Americas and so the risks of pollen-mediated gene flow from the crop to wild relatives is limited to this area. On the otherhand, the possibility of transgene movement to stands or plantations of non-GMTheobroma is not discounted by this argument. The ecological effects of suchmovement are unlikely to be of significance by such movement although there may beeconomic consequences should the recipient stand be organic or supplying seed for amarket requiring GM-free seed. This is particularly germane given that cocoa iscultivated for its seeds. The probability of horizontal gene movement to soil or water-borne micro-organisms is uncharacterised but likely to be negligible.
Changed farming practiceThe nature of the construct used and the crop into which it is placed are the chieffactors that determine this aspect of risk assessment. The introduction of herbicidetolerance into temperate annual crops, for instance, is likely to change the pattern andextent of herbicide application. For Theobroma, it is probable that transgenes thatenhance resistance to disease or insect attack will be the first to be introduced. It isdifficult to anticipate effects of such genes on the pattern and mode of cocoacultivation.
Direct and indirect effects on non-target speciesSecondary effects, including the impact of toxins on non-target organisms (pollinators,herbivores etc) or of their accumulation into higher trophic levels has recently attracteda great deal of interest and is currently the subject of significant amounts of researchactivity in other crops. Here too, data on the identity of those organisms most likely tobe affected by the use of selectively toxic GM lines (e.g. lines carrying the Bt gene) arelacking for cocoa.Conclusions
16 – 17 October 2000, Kota Kinabalu, Sabah, Malaysia 22
New technologies have the capacity to impact on the cocoa industry in many waysalthough the greatest benefits will probably accrue to curators of germplasm collectionsand breeders. Managers of germplasm or quarantine facilities face the perpetualproblem of mislabelling, erroneous documentation and transcription errors leading tothe misidentification of clones held. The problem is compounded by the fact thathomozygous, self-compatible trees generate near-identical offspring and colourmutants of pods or seeds are relatively common. In the immediate future, a service-based system of clone assignment or reassignment is to be introduced in which SSR-PCR will be used as the molecular tool for diagnosis. This will provide a snapshot thatwill enable many of the current errors to be corrected. However, it will not allowverification of all replicate clones in collections or the correction of on-going mistakesarising from the introduction of fresh material or errors during collection maintenance.This type of problem dictates the use of in-house facilities. Requirements forinfrastructure and detection systems appropriate for high-resolution electrophoresismake it difficult for SSR-PCR to be adopted routinely by local end-user. Furthermore,the need for standardisation of label usage, control sample and allele assignment,problems with distinguishing nulls from heterozygotes and data entry dictate that endusers possess moderately good facilities and molecular expertise on site. In the longerterm, therefore, there is a requirement for a simple, more robust system ofidentification. The most plausible system of those currently possible is one based onthe exploitation of SNPs or CAPS. This approach can be applied to simple agaroseelectrophoretic apparatus and generates unequivocal data sets that are amenable todatabase entry and completely transferable. The adoption of such a system in themedium term would provide the curator with the ability to routinely cull the collection ofmislabelled samples and in some cases, even to assign paternity to poorly documentedsamples.
All germplasm collections are dynamic entities, with new material constantly beingintroduced and clones lost through age or disease. Given that all facilities have finitesize and tend to operate at or near capacity, curators have the responsibility toprioritise the importance of clones within the collection. In this way, unimportant clonescan be discarded to make way for new, valuable material. In the absence ofcomprehensive evaluation data for incoming and existing material, this decision mustbe based on the relative similarity of clones to others held in a collection. It is moreimportant to retain clones that are genetically distinct than clones that bear a closesimilarity to others already held. The use of genetic distance analysis is the simplestapproach to allow this form of prioritisation. In the short-term, agarose-based ISSR-PCR or double-anchored ISSR-PCR (Charters 2001) probably represent the simplestand cheapest of the robust approaches for this to be achieved on site. AFLP (Flamentet al 2001) or ISSR using low temperature precast PAGE gels (Charters et al. 1996a)generate the most comprehensive datasets for analyses conducted in moderately wellequipped molecular facilities.
The ultimate goal of a curator is to provide comprehensive evaluation informationthat allows breeders to make effective use of material held. New technologies are stillsome way off making significant advances in this direction. Nevertheless, theidentification of candidate genes for certain traits by sequence searches or byfunctional transcriptomics (e.g. SAGE), coupled with allele screening and thedevelopment of CAPS systems to distinguish alleles of a desirable gene may allowprogress for some targeted traits in the medium term. The same approach, togetherwith QTL analysis may assist breeders to select parental material. Perhaps thegreatest value of QTL analysis in the short to medium term lies in the identification ofmarkers for marker assisted selection. In the longer term and as more key genes areidentified, a gradual movement will be possible towards the use of gene-specific, SNP-based markers. Transcriptomics, QTL analysis, shared ancestry analysis and alleleassociation studies will play an important role in identifying such genes.
16 – 17 October 2000, Kota Kinabalu, Sabah, Malaysia 23
The future of GM technology is perhaps the most difficult of all to predict as itsimplementation is dependant upon economic, social, environmental and politicalfactors. The potential benefits of the technology in terms of introducing generic ortargeted resistance to pests and disease are not in doubt, given the resourcesdeployed in other crops to develop appropriate transgene constructs. In the mediumterm, growth of GM cocoa would almost certainly require either significant movement inpublic opinion and/or a greater threat to continued supply such as a majorepidemiological outbreak of a significant disease or pest.
ReferencesAnonymous. 1999. ICCO Quarterly Bulletin of Cocoa Statistics, 25 (4). 1998/99.Anonymous. 2000. ICCO Quarterly Bulletin of Cocoa Statistics, 26 (4). 1999/00.Charters Y.M. 2001 Molecular tools for the management of Theobroma cacao germplasm.
Ph.D. thesis, University of Reading, United Kingdom.Charters Y.M., A. Robertson, M.J. Wilkinson, G. Ramsay. 1996a. PCR analysis of oilseed rape
(Brassica napus L. ssp. oleifera) using 5’-anchored simple sequence repeat (SSR) primers.Theor. and Appl. Genet. 92: 442-447.
Charters Y.M., A. Culham, M. End, P. Hadley, M.J. Wilkinson. 1996b. The potential of anchoredmicrosatellite analysis for cocoa germplasm characterization. Pages 301-304 in Proceedingsof the 12th International Cocoa Research Conference November 17-23, 1996, Salvador,Bahia, Brazil.
Crouzillat D., E. Lerceteau, V. Pétiard, J. Morera, H. Rodriguez, D. Walker, W. Phillips,C. Ronning, R. Schnell, J. Osei, P. Fritz. 1996. Theobroma cacao L: A genetic linkage mapand quantitative trait loci analysis. Theor. and Appl. Genet. 93: 205-214.
Crouzillat D, B. Menard, A. Mora, W. Phillips, V. Pétiard. 2000a. Quantitative trait analysis inTheobroma cacao using molecular markers - Yield QTL detection and stability over 15 years.Euphytica 114: 13-23.
Crouzillat D, W. Phillips, P.J. Fritz, V. Pétiard. 2000b. Quantitative trait loci analysis inTheobroma cacao using molecular markers. Inheritance of polygenic resistance toPhytophthora palmivora in two related cacao populations. Euphytica 114: 25-36.
Dyson T. 1996. Population and Food. Routledge, London, United Kingdom.Ellstrand N.C., H.C. Prentice, J.F. Hancock. 1999. Gene flow and introgression from
domesticated plants into their wild relatives. Ann. Rev. Ecol. System 30: 539-563.Flament M.H., I. Kébé, D. Clément, I. Pieretti, A.M. Risterucci, J.A.K. N'Goran, C. Cilas,
D. Despréaux, C. Lanaud 2001. Genetic mapping of resistance factors to Phytophthorapalmivora in cocoa. Genome 44: 79-85.
Frary A, T.C. Nesbitt, S. Grandillo, E. van der Knaap, B. Cong, J.P. Liu, J. Meller, R. Elber,K.B. Alpert, S.D. Tanksley. 2000. A quantitative trait locus key to the evolution of tomato fruitsize. Science 289: 85-88.
Gilmour M. 1995. The BCCCA ringtest on the RAPD analysis of cocoa. Pages 135-138 inProceedings of the International Workshop on Cocoa Breeding Strategies, Kuala Lumpur,Malaysia. October 19-20, 1994. INGENIC, United Kingdom.
James C. and A. Krattiger. 1999. The role of the private sector: i n Biotechnology fordeveloping-country Agriculture: Problems and Opportunities (Persley, G.J., ed.) - 2020Vision Focus 2, Brief 4 of 10. IFPRI, Washington.
Kaul S., H.L. Koo, J. Jenkins et al. . 2000. Analysis of the genome sequence of the floweringplant Arabidopsis thaliana. Nature 408: 796-815.
Lanaud C, O. Sounigo, Y.K. Amefia, D. Paulin, P. Lachenaud, D. Clément. 1987. New data onthe mechanisms of incompatibility in cocoa and its consequences on breeding. Café CacaoThé 31: 267-277.
Levinson G. and G.A. Gutman. 1987. High-frequencies of short frameshifts in poly-CA/TGtandem repeats borne by bacteriophage-m13 in Escherichia-coli k-12. Nucleic AcidsResearch 15: 5323-5338.
Ota M., Y. Katsuyama, A. Kimura, K. Tsuchiya, M. Kondo, T. Naruse, N. Mizuki, K. Itoh,T. Sasazuki, H. Inoko. 2001. A second susceptibility gene for developing rheumatoid
16 – 17 October 2000, Kota Kinabalu, Sabah, Malaysia 24
arthritis in the human MHC is localized within a 70-kb intervaltelomeric of the TNF genes inthe HLA class III region. Genomics 71: 263-270.
Perry M.D., J.B. Power, K.C. Lowe, M.R. Davey. 2000. Biolistic (R) transformation of cacao[Theobroma cacao (L.)]. Tropical Agriculture 77: 64-66.
Reich D.E., M. Cargill, S. Bolk, J. Ireland, P.C. Sabeti, D.J. Richter, T. Lavery, R. Kouyoumjian,S.F. Farhadian, R. Ward, E.S. Lander. 2001. Linkage disequilibrium in the human genome.Nature 411: 199-204.
Scheffler, J.A. and P.J. Dale. 1994. Opportunities for gene-transfer from transgenic oilseedrape (Brassica-napus) to related species. Transgenic Research 3: 263-278.
Service S.K., R.A. Ophoff, N.B. Freimer. 2001. The genome-wide distribution of backgroundlinkage disequilibrium in a population isolate. Human Molecular Genetics 10: 545-551.
Stace C.A. 1997. Page 1130 in New Flora of the British Isles. 2nd Ed. Cambridge University,U.K.
Tautz D. and Renz M. 1984 Simple sequences are ubiquitous repetitive components ofeukaryotic genomes. Nucleic Acid Research 12: 4127-5138.
Vos P., R. Hogers, M. Bleeker, M. Reijans, T. Lee van de, M. Hornes, A.. Frijters, J. Pot,J. Peleman, M. Kuiper, M. Zabeau. 1995. AFLP: a new technique for DNA fingerprinting.Nucleic Acids Research 23: 4407-4414.
Wilde J., R. Waugh and W. Powell. 1992. Genetic fingerprinting of Theobroma clones usingrandomly amplified polymorphic DNA markers. Theor. Appl. Genet. 83: 871-877.
Zoossmann-Diskin A. 2000. Are today's Jewish priests descended from the old ones? Homo51: 156-162.
16 – 17 October 2000, Kota Kinabalu, Sabah, Malaysia 25
Use of Microsatellite Markers for Germplasm Identity Analysisin Cocoa
Ange-Marie Risterucci, Bertus Eskes, Dominique Fargeas, Juan-Carlos Motamayorand Claire Lanaud
Cirad-Amis, TA 40/03, Avenue Agropolis, 34398 Montpellier Cedex 5, France
Abstract
Molecular genetic markers provide, among other applications, the opportunity to verify identity ingermplasm collections. DNA-based polymorphisms are a powerful tool in geneticcharacterisation. RFLP markers were the first to be used for plant genome studies, for mappingand for diversity analyses. However, RFLPs are labour intensive, time consuming, require alarge quantity of DNA and purification by ultra centrifugation. The PCR based techniques,including microsatellite analysis, require less DNA than RFLP markers and are thereforeconvenient for genetic analysis on young plants. An additional advantage of the use ofmicrosatellites is the codominant mode of inheritance, which in contrast to the dominant PCRmarkers based on arbitary primers, allows easy transfer of markers between genetic maps ofdifferent crosses. Compared to RFLPs, microsatellites detect more alleles and a higher level ofpolymorphism and are equally powerful tools for estimation of heterozygosity. Results obtainedon cocoa accessions included in the CFC/ICCO/IPGRI project on ‘Cocoa Germplasm Utilizationand Conservation, a Global Approach’ are presented here, including about 150 comparisons ofDNA samples from nine collections concerning 28 different accessions. It is concluded thatidentification problems occur frequently, on average in about 30% of the samples examined inour study. These identification problems occur both in comparisons between accessions fromdifferent collections and between trees within accessions from the same collection. Suchidentification problems constitute a serious problem for comparative analysis of clones obtainedfrom different sites or even from different trees within the same accession. Convenient locinumber for identification analyses using microsatellites, sample collection methodology as wellas conditions required for comparisons between different microsatellite analyses or betweenlaboratories are briefly discussed.
Introduction
An important consideration when conducting experiments in several different countriesis the need to ensure that the experimental material being used in all the sites iscorrectly identified. Mislabelled material can seriously compromise the interpretation ofthe data generated. The objective of this study was to verify the conformity of clonesused in the CFC/ICCO/IPGRI project on ‘Cocoa Germplasm Utilization andConservation: a Global approach’ (Eskes et al. 1998). Among other activities, thisproject supports the establishment of an International Clone Trial in ten cocoaproducing countries.
PCR-based techniques are widely used to detect polymorphism in plants.Microsatellite markers can detect a great number of alleles that enable discriminationbetween even closely related individuals. Microsatellite polymorphisms have beensuccessfully used for population and pedigree analyses (Plaschke et al. 1995, Provanet al. 1996, Senior et al.,1998), for genetic mapping (Ramsay et al. 2000, Temnykh etal. 2000) and genotype identification (Rongwen et al. 1995). They were found to bemore polymorphic than RFLP markers in rice (Wu and Tanksley 1993) or Arabidopsis(Bell and Ecker 1994). They also appeared to be a good tool for detection ofadulteration and mixing in seed samples or in food (Bligh 2000).
In our study, eight microsatellite markers were used to study the identity of 28‘International Clones’ used in the CFC/ICCO/IPGRI project that were multiplied in the
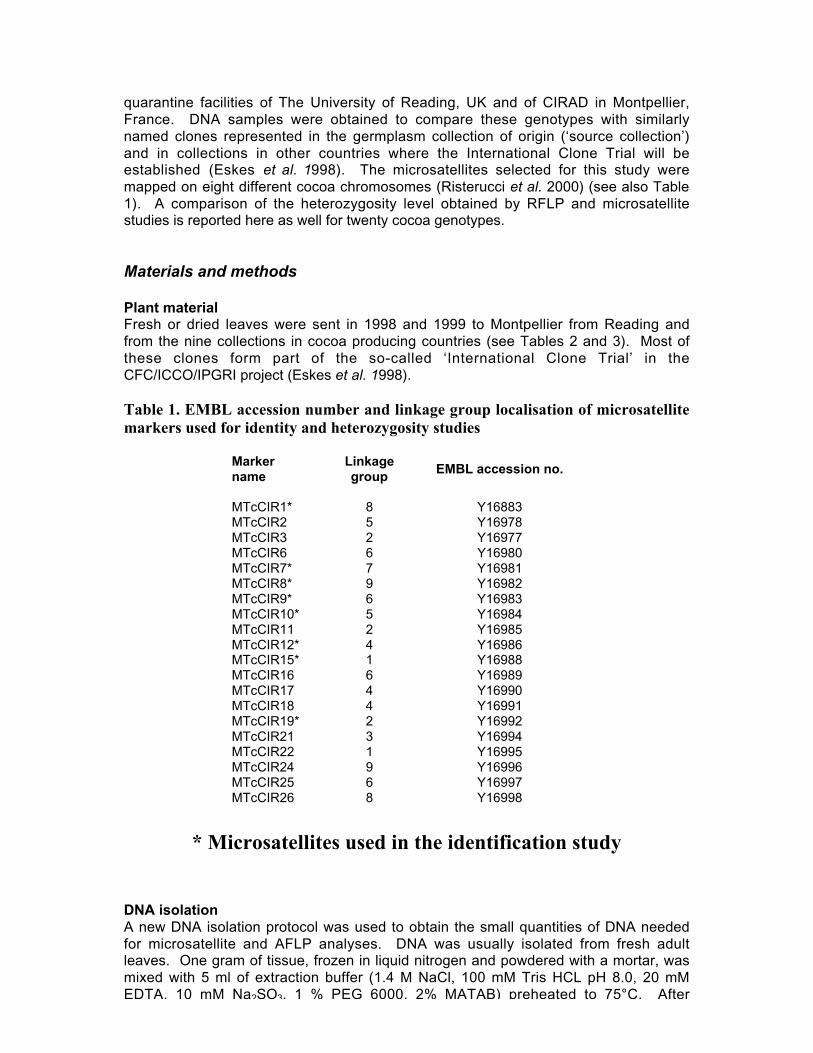
16 – 17 October 2000, Kota Kinabalu, Sabah, Malaysia 26
quarantine facilities of The University of Reading, UK and of CIRAD in Montpellier,France. DNA samples were obtained to compare these genotypes with similarlynamed clones represented in the germplasm collection of origin (‘source collection’)and in collections in other countries where the International Clone Trial will beestablished (Eskes et al. 1998). The microsatellites selected for this study weremapped on eight different cocoa chromosomes (Risterucci et al. 2000) (see also Table1). A comparison of the heterozygosity level obtained by RFLP and microsatellitestudies is reported here as well for twenty cocoa genotypes.
Materials and methods
Plant materialFresh or dried leaves were sent in 1998 and 1999 to Montpellier from Reading andfrom the nine collections in cocoa producing countries (see Tables 2 and 3). Most ofthese clones form part of the so-called ‘International Clone Trial’ in theCFC/ICCO/IPGRI project (Eskes et al. 1998).
Table 1. EMBL accession number and linkage group localisation of microsatellitemarkers used for identity and heterozygosity studies
Markername
Linkagegroup
EMBL accession no.
MTcCIR1* 8 Y16883MTcCIR2 5 Y16978MTcCIR3 2 Y16977MTcCIR6 6 Y16980MTcCIR7* 7 Y16981MTcCIR8* 9 Y16982MTcCIR9* 6 Y16983MTcCIR10* 5 Y16984MTcCIR11 2 Y16985MTcCIR12* 4 Y16986MTcCIR15* 1 Y16988MTcCIR16 6 Y16989MTcCIR17 4 Y16990MTcCIR18 4 Y16991MTcCIR19* 2 Y16992MTcCIR21 3 Y16994MTcCIR22 1 Y16995MTcCIR24 9 Y16996MTcCIR25 6 Y16997MTcCIR26 8 Y16998
* Microsatellites used in the identification study
DNA isolationA new DNA isolation protocol was used to obtain the small quantities of DNA neededfor microsatellite and AFLP analyses. DNA was usually isolated from fresh adultleaves. One gram of tissue, frozen in liquid nitrogen and powdered with a mortar, wasmixed with 5 ml of extraction buffer (1.4 M NaCl, 100 mM Tris HCL pH 8.0, 20 mMEDTA, 10 mM Na2SO3, 1 % PEG 6000, 2% MATAB) preheated to 75°C. Afterhomogenisation for 10 s with a vortex, the extract was incubated for 30 min at 75°C.
16 – 17 October 2000, Kota Kinabalu, Sabah, Malaysia 27
After cooling to 20°C, an equal volume of chloroform-isoamyl alcohol (24:1 v/v) wasadded, followed by emulsification. The tube was then centrifuged at 7000 g for 30 minand the supernatant was precipitated at –20°C overnight after addition of an equalvolume of isopropanol. The DNA was removed with a glass hook and re-suspended in1 ml of TE.
Microsatellite analysisA genomic library enriched in simple sequence repeats was constructed formicrosatellite analysis using a modified version of the protocol of Karagyozov et al.1993 (Lanaud et al. 1999). The primers were end labelled with γ-33P ATP, andamplification was performed in a MJ Research PTC 100 Thermal cycler on 20 µlreaction mixtures containing 10 ng of cocoa DNA, 0.2 mM dNTP mix, 2 mM MgCl2, 50mM KCl, 10 mM tris-HCl (pH 8.3), 0.2 µM primer (5’ end labelled with γ-33P ATP) and1 unit of Taq polymerase (Eurobio). The samples were denatured at 94°C for 4 minand subjected to 32 repeats of the following cycle: 94°C for 30 s, 46°C or 51°C for 1min and 72°C for 1 min. After adding 20 µl of loading buffer (98% formamide, 10 mMEDTA, bromophenol blue, xylene cyanol), the mixes were denatured at 92°C for 3 minand 3 µl of each sample were loaded onto 5% polyacrylamide gel with 7.5 M urea andelectrophoresed in 0.5% TBE buffer at 55 W for 1 h 40 min. The gel was dried for 30min at 80°C and exposed overnight to X-ray film (Fuji RX). EMBL accession numbersof the microsatellites used are listed in Table 1.
Results and discussion
Use of microsatellites for identity studiesIn the first round of analyses, in 1998/99, 75 DNA samples obtained from clones in ninecollections in cocoa producing countries were compared with the 28 samples from thereference clones, 13 from the Montpellier and 15 from the Reading greenhouses (Table2). The results showed differences in profile, for at least one of the eight microsatelliteloci, with regard to the reference clones for 19 out of the 75 comparisons (25%). For13 out of the 28 clones (46%) in at least one of the samples tested differences werefound with regard to the reference samples.
New analyses were performed in 1999/00 (Table 3) comparing 12 clones fromReading and 16 from Montpellier with samples received from seven countries. Theobjective was to confirm data obtained in the first year and also to carry out newcomparisons. Seventy-six DNA samples were compared to the 28 reference samples.This time, 27 samples (36%) showed differences in profile for one or more of eightmicrosatellite loci in relation to the reference clones. Twelve out of the 28 clones (43%)showed differences for at least one of the DNA samples compared.
For both years, it was observed that misidentifications could also be frequentlyfound amongst the trees within an accession. This was the case for eight out of the 23accessions (35%) for which more than one tree was tested from the same accession.
Comparisons of identity between years are limited to the samples of the referenceclones and of clones with similar profile. Samples that were different from thereference clones in the two years have not been compared together in one analysis toverify if the differences found could relate to the same genotype.
An interesting result concerns the widely distributed SCA 6 clone. The samplesanalysed from the nine collections indicate that the identity of this clone is wrong for allfour samples from Cameroon, for one of the two introductions in the collections inEcuador (‘Loma Long’) and for two trees out of four trees tested from the Trinidadcollection. Another intriguing result is that the sample from the reference clone can bedifferent fro m the sample received from the ‘source collection’, i.e. in the country oforigin of the clone (e.g. BE 10 and MAN 15-2 from Brazil).
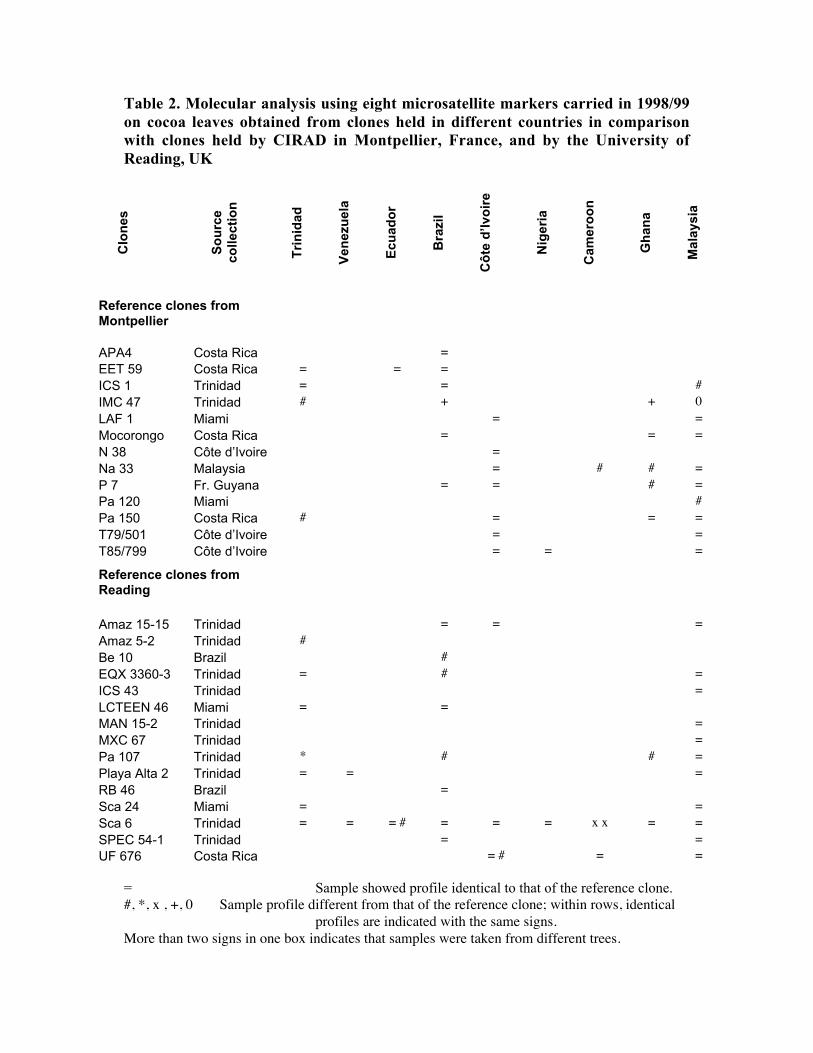
16 – 17 October 2000, Kota Kinabalu, Sabah, Malaysia 28
Table 2. Molecular analysis using eight microsatellite markers carried in 1998/99on cocoa leaves obtained from clones held in different countries in comparisonwith clones held by CIRAD in Montpellier, France, and by the University ofReading, UK
Clo
nes
So
urc
eco
llect
ion
Tri
nid
ad
Ven
ezu
ela
Ecu
ado
r
Bra
zil
Cô
te d
’Ivo
ire
Nig
eria
Cam
ero
on
Gh
ana
Mal
aysi
a
Reference clones fromMontpellier
APA4 Costa Rica =EET 59 Costa Rica = = =ICS 1 Trinidad = = #IMC 47 Trinidad # + + 0LAF 1 Miami = =Mocorongo Costa Rica = = =N 38 Côte d’Ivoire =Na 33 Malaysia = # # =P 7 Fr. Guyana = = # =Pa 120 Miami #Pa 150 Costa Rica # = = =T79/501 Côte d’Ivoire = =T85/799 Côte d’Ivoire = = =
Reference clones fromReading
Amaz 15-15 Trinidad = = =Amaz 5-2 Trinidad #Be 10 Brazil #EQX 3360-3 Trinidad = # =ICS 43 Trinidad =LCTEEN 46 Miami = =MAN 15-2 Trinidad =MXC 67 Trinidad =Pa 107 Trinidad * # # =Playa Alta 2 Trinidad = = =RB 46 Brazil =Sca 24 Miami = =Sca 6 Trinidad = = = # = = = x x = =SPEC 54-1 Trinidad = =UF 676 Costa Rica = # = =
= Sample showed profile identical to that of the reference clone.#, *, x , +, 0 Sample profile different from that of the reference clone; within rows, identical
profiles are indicated with the same signs.More than two signs in one box indicates that samples were taken from different trees.
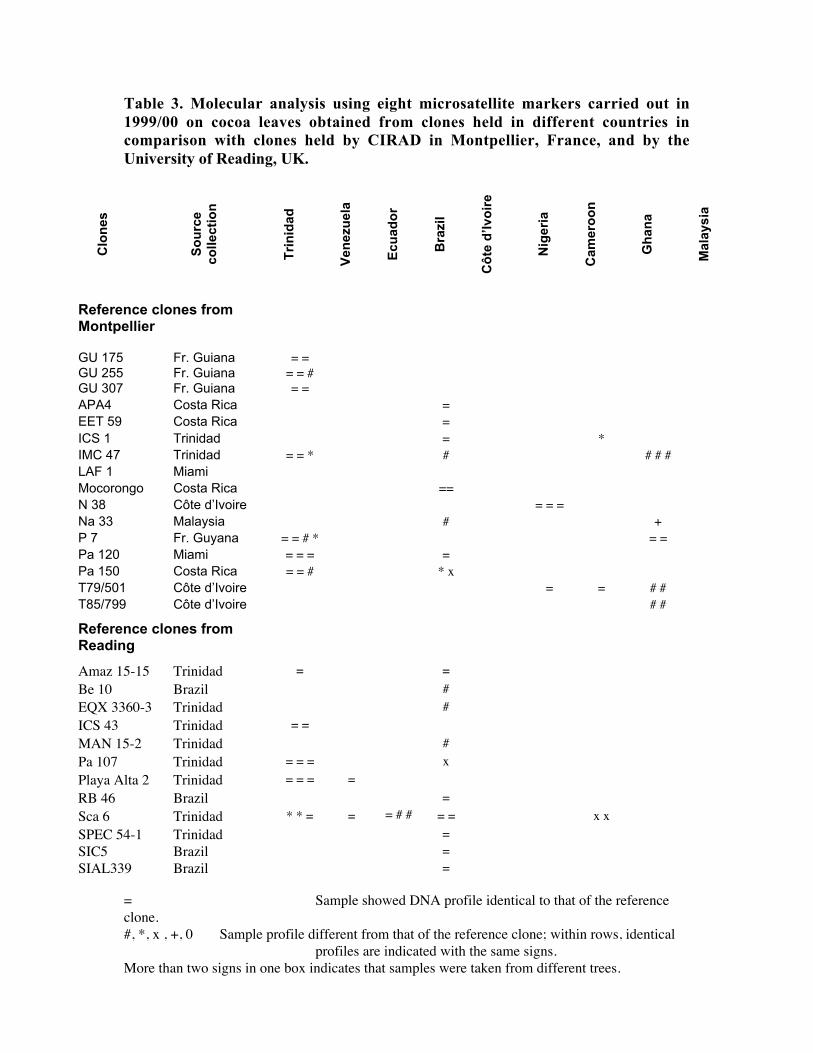
16 – 17 October 2000, Kota Kinabalu, Sabah, Malaysia 29
Table 3. Molecular analysis using eight microsatellite markers carried out in1999/00 on cocoa leaves obtained from clones held in different countries incomparison with clones held by CIRAD in Montpellier, France, and by theUniversity of Reading, UK.
Clo
nes
So
urc
eco
llect
ion
Tri
nid
ad
Ven
ezu
ela
Ecu
ado
r
Bra
zil
Cô
te d
’Ivo
ire
Nig
eria
Cam
ero
on
Gh
ana
Mal
aysi
a
Reference clones fromMontpellier
GU 175 Fr. Guiana = =GU 255 Fr. Guiana = = #GU 307 Fr. Guiana = =APA4 Costa Rica =EET 59 Costa Rica =ICS 1 Trinidad = *IMC 47 Trinidad = = * # # # #LAF 1 MiamiMocorongo Costa Rica ==N 38 Côte d’Ivoire = = =Na 33 Malaysia # +P 7 Fr. Guyana = = # * = =Pa 120 Miami = = = =Pa 150 Costa Rica = = # * xT79/501 Côte d’Ivoire = = # #T85/799 Côte d’Ivoire # #
Reference clones fromReading
Amaz 15-15 Trinidad = =Be 10 Brazil #EQX 3360-3 Trinidad #ICS 43 Trinidad = =MAN 15-2 Trinidad #Pa 107 Trinidad = = = xPlaya Alta 2 Trinidad = = = =RB 46 Brazil =Sca 6 Trinidad * * = = = # # = = x xSPEC 54-1 Trinidad =SIC5 Brazil =SIAL339 Brazil =
= Sample showed DNA profile identical to that of the referenceclone.#, *, x , +, 0 Sample profile different from that of the reference clone; within rows, identical
profiles are indicated with the same signs.More than two signs in one box indicates that samples were taken from different trees.
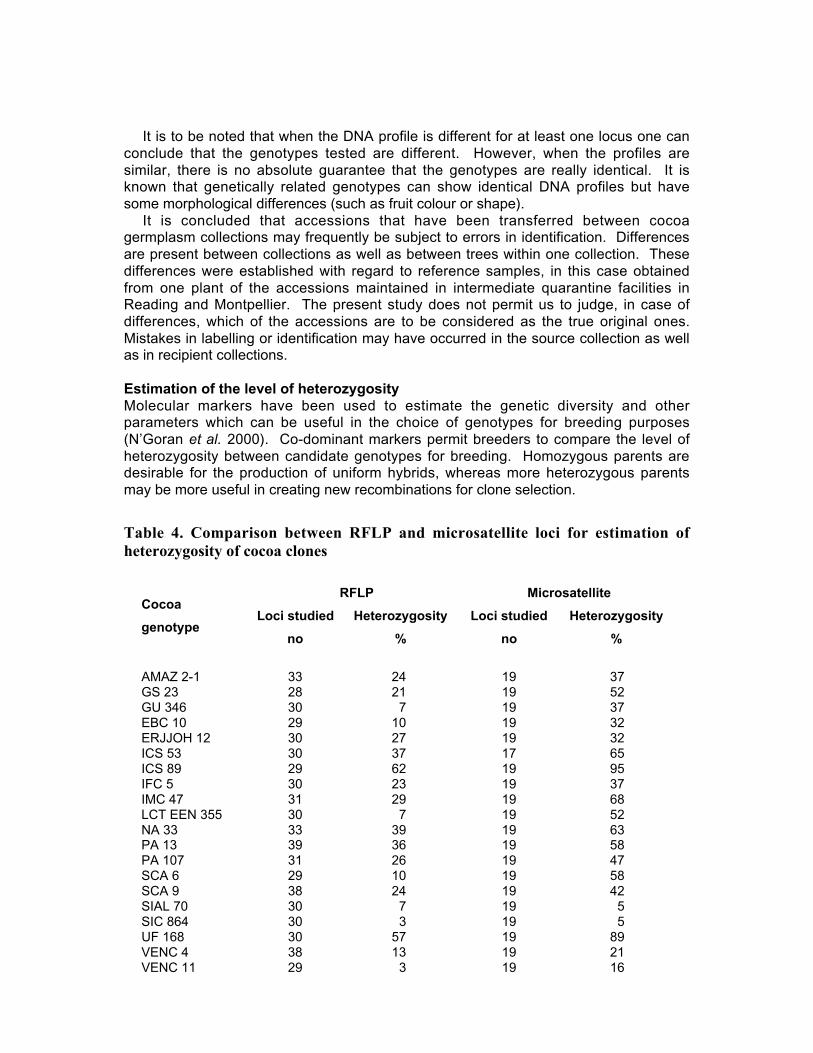
16 – 17 October 2000, Kota Kinabalu, Sabah, Malaysia 30
It is to be noted that when the DNA profile is different for at least one locus one canconclude that the genotypes tested are different. However, when the profiles aresimilar, there is no absolute guarantee that the genotypes are really identical. It isknown that genetically related genotypes can show identical DNA profiles but havesome morphological differences (such as fruit colour or shape).
It is concluded that accessions that have been transferred between cocoagermplasm collections may frequently be subject to errors in identification. Differencesare present between collections as well as between trees within one collection. Thesedifferences were established with regard to reference samples, in this case obtainedfrom one plant of the accessions maintained in intermediate quarantine facilities inReading and Montpellier. The present study does not permit us to judge, in case ofdifferences, which of the accessions are to be considered as the true original ones.Mistakes in labelling or identification may have occurred in the source collection as wellas in recipient collections.
Estimation of the level of heterozygosityMolecular markers have been used to estimate the genetic diversity and otherparameters which can be useful in the choice of genotypes for breeding purposes(N’Goran et al. 2000). Co-dominant markers permit breeders to compare the level ofheterozygosity between candidate genotypes for breeding. Homozygous parents aredesirable for the production of uniform hybrids, whereas more heterozygous parentsmay be more useful in creating new recombinations for clone selection.
Table 4. Comparison between RFLP and microsatellite loci for estimation ofheterozygosity of cocoa clones
RFLP MicrosatelliteCocoa
genotypeLoci studied
no
Heterozygosity
%
Loci studied
no
Heterozygosity
%
AMAZ 2-1 33 24 19 37GS 23 28 21 19 52GU 346 30 7 19 37EBC 10 29 10 19 32ERJJOH 12 30 27 19 32ICS 53 30 37 17 65ICS 89 29 62 19 95IFC 5 30 23 19 37IMC 47 31 29 19 68LCT EEN 355 30 7 19 52NA 33 33 39 19 63PA 13 39 36 19 58PA 107 31 26 19 47SCA 6 29 10 19 58SCA 9 38 24 19 42SIAL 70 30 7 19 5SIC 864 30 3 19 5UF 168 30 57 19 89VENC 4 38 13 19 21VENC 11 29 3 19 16
16 – 17 October 2000, Kota Kinabalu, Sabah, Malaysia 31
In our study, we compared RFLP and microsatellite markers to estimate the level ofheterozygosity of twenty cocoa clones (Table 4). For RFLPs, 29 to 33 loci were usedand for microsatellites 19 loci. For these clones, the average level of heterozygosityobtained was 22.9 % for RFLPs and 45.6 % for microsatellites. As expected, thehigher degree of allelic diversity and polymorphism of microsatellite loci compared togenomic or cDNA RFLPs shows that microsatellites may constitute a better tool forcomparisons of the degree of heterozygosity.
General discussion
Further development and use of microsatellite markersWith microsatellites, rapid screening of large numbers of plants may become feasible.Although their development is costly and time consuming, microsatellites are a goodchoice for many types of genome study, such as an internationally co-ordinated effortto genotype cocoa germplasm. Presently, 69 mapped microsatellites are available forcocoa. The production of more microsatellites with the French National SequencingCenter (CNS Evry) and subsequent screening of these microsatellites at CIRAD willcontinue.
Choice of microsatellite loci for identity controlThe choice of loci on different chromosomes appears to be an important criterion inobtaining good coverage of the genome. Other important criteria are the allelicfrequencies and the level of polymorphism that can be identified for each locus. Bychoosing the most suitable microsatellite loci in this way, 8 to 9 loci each with 6 to 10alleles would appear sufficient for an initial verification of identity; nevertheless the useof 15 loci would probably be necessary for safe identification of more closely relatedgenotypes.
In the future, to allow more widespread and easier use of microsatellites, markerswill be selected that can give results without the use of radioactivity, i.e. by usingagarose gel with BET staining or a small acrylamide gel with silver staining.
Number of allelesThe efficiency of genotype identification with different kinds of molecular markersdepends on the number of alleles that can be identified at a single locus. Comparisonsbetween RFLP and microsatellite markers on cocoa genotypes showed on average 2.4alleles per locus for RFLPs and 5.6 alleles per locus for microsatellites. Similar resultswere found in others species, 2.2 and 4.3 for soybean (Morgante et al. 1994), 2.6 and5.4 for barley (Russel et al. 1997), and 2.5 and 7.4 for rice (Olufowote et al. 1997),respectively.
Recommendations for leaf sample collection and shipmentOne leaf in good condition is a large enough sample for DNA extraction andmicrosatellite analysis. Fresh leaves conditioned in slightly humidified paper that weresent to the Montpellier laboratory for the identity studies gave good DNA extractionresults if the transit time did not exceed two weeks. If it is not possible to use freshleaves, air-dried leaves (not oven-dried leaves) or extracted DNA samples can be usedas good alternatives.
Codification method to permit comparison between different analyses andlaboratoriesIt is necessary for all laboratories to have a similar method for allelic codification ofmicrosatellite loci. The best method would seem to be to codify in relation to referencealleles of a homozygous clone, e.g. Catongo. DNA of such a clone should be made
16 – 17 October 2000, Kota Kinabalu, Sabah, Malaysia 32
available to all laboratories in order to allow for comparisons relative to the referenceallele.
Construction of a database for microsatellite alleles for cocoaA further requirement for more frequent comparative use of microsatellites in cocoagenome analyses is the construction of an international database for microsatellite loci,containing all information available and permitting easy comparisons with analysescarried out elsewhere.
Acknowledgements
The research on identity of cocoa clones presented here is partially supported by theCFC/ICCO/IPGRI Project. This project is developed under the aegis of the InternationalCocoa Organization and mainly funded by the Common Fund for Commodities. Thesupply of leaf samples for DNA extraction by the following institutions is acknowledged:CEPLAC in Brazil, CNRA in Côte d’Ivoire, CRIG in Ghana, CRIN in Nigeria, CRU inTrinidad, INIA in Venezuela, INIAP in Ecuador, IRAD in Cameroon, MCB in Malaysia andThe University of Reading in the UK.
References
Bell C.J. and J.H. Ecker. 1994. Assignment of 30 microsatellite loci to the linkage map ofArabidopsis. Genomics 19: 137-144.
Bligh H.F.J. 2000. Detection of adulteration of Basmati rice with non-premium long-grain rice.International Journal of Food Science and Technology 35: 257-265.
Eskes A.B., J.M.M. Engels. and R.A. Lass. 1998. The CFC/ICCO/IPGRI Project: a newinitiative on cocoa germplasm utilization and conservation. Plantations RechercheDéveloppement 5: 412-422.
Karagyozov L., I.D. Kalcheva and V.M. Chapman. 1993. Construction of random small-insertgenomic libraries highly enriched for simple sequence repeats. Nucleic Acids Research21: 3911-3912.
Lanaud C., A.M. Risterucci, I. Pieretti, M. Falque, A. Bouet and P.J.L. Lagoda. 1999. Isolationand characterization of microsatellites in Threobroma cacao L. Mol Ecol 8: 2141-2152.
Morgante M., A. Rafalski, P. Biddle, S. Tingey and A.M. Olivieri. 1994. Genetic mapping andvariability of seven soybean simple sequence repeat loci. Genome 37: 763-769.
N’Goran J.A.K., V. Laurent, A.M. Risterucci and C. Lanaud. 2000. The genetic structure ofcocoa populations (Theobroma cacao L.) revealed by RFLP analysis. Euphytica 115: 83-90.
Olufowote J.O., Y. Xu, X. Chen, W.D. Park, H.M. Beachell, R.H. Dilday, M. Goto andS.R. McCouch. 1997. Comparative evaluation of within-cultivar variation of rice (Oryzasativa L.) using microsatellite and RFLP markers. Genome 40: 370-378.
Plaschke J., M.W. Ganal and M.S. Röder. 1995. Detection of genetic diversity in closely relatedbread wheat using microsatellite markers. Theor. Appl. Genet. 91: 1001-1007.
Provan J., W. Powell and R. Waugh. 1996. Microsatellite analysis of relationships withincultivated potato ( Solanum tuberosum) . Theor. Appl. Genet. 92: 1078-1084.
Ramsay L., M. Macaulay, S. Degli Ivanissevich, K. MacLean, L. Cardle, J. Fuller, K.J. Edwards,S. Tuvesson, M. Morgante, A. Massari, E. Maestri, N. Marmiroli, T. Sjakste, M. Ganal, W.Powell and R. Waugh. 2000. A Simple Sequence Repeat-Based Linkage Map of Barley.Genetics 156: 1997-2005.
Risterucci A.M., L. Grivet, J.A.K. N’Goran, I. Pieretti, M.H. Flament and C. Lanaud. 2000. Ahigh-density linkage map of Theobroma cacao L. Theor. Appl. Genet. 101: 948-955.
Rongwen J., M.S. Akkaya, A.A.. Bhagwat, U. Lavi and P.B.Cregan. 1995. The use ofmicrosatellite DNA markers for soybean genotype identification. Theor. Appl. Genet. 90: 43-48.
Russell J.R., J.D. Fuller, M. Macaulay, B.G. Hatz, A. Jahoor, W. Powell and R. Waugh. 1997.Direct comparison of levels of genetic variation among barley accessions detected byRFLPs, AFLPs, SSRs and RAPDs. Theor. Appl. Genet. 95: 714-722.

16 – 17 October 2000, Kota Kinabalu, Sabah, Malaysia 33
Senior M.L., J.P. Murphy, M.M. Goodman and C.W. Stuber. 1998. Utility of SSRs fordetermining genetic similarities and relationships in maize using an agarose gel system.Crop Sci 38: 1088-1098.
Temnykh S., W.D. Park, N. Ayres, S. Cartinhour, N. Hauck, L. Lipovich, Y.G. Cho, T. Ishii andS.R. McCouch SR. 2000. Mapping and genome organization of microsatellite sequences inrice (Oryza sativa L.). Theor. Appl. Genet. 100: 697-712.
Wu K.S. and S.D. Tanksley. 1993. Abundance polymorphism and genetic mapping ofmicrosatellites in rice. Mol. Gen. Genet. 241: 225-235.
16 – 17 October 2000, Kota Kinabalu, Sabah, Malaysia 34
The Detection of Mislabelled Trees in the International CocoaGenebank, Trinidad ( ICG,T) and Options for a Global Strategyfor Identification of Accessions
Olivier Sounigo2, Yvette Christopher1, Frances Bekele1, Vishnarayan Mooleedhar1
and Felicia Hosein3
1 - Cocoa Research Unit, University of the West Indies, Saint-Augustine, Trinidad and Tobago2 - Cirad-Cp, TA 80/02, Avenue Agropolis, 34098 Montpellier Cedex 5, France, Attached to theCocoa Research Unit3 - Department of Plant Science, University of the West Indies, Saint-Augustine, Trinidad andTobago
Abstract
Mislabelling of trees is a common problem for the management of genebanks. A programmewas initiated in 1997 in order to evaluate its extent in the International Cocoa Genebank, inTrinidad (ICG,T), using the RAPD technique. The strategy used, the constraints and limitationsencountered, and the practical use of the data obtained are described in this presentation.Options for global approaches to identification of cocoa accessions are compared.
Introduction
Misidentification of trees is a common problem in genebanks, whether in cocoa(Figueira et al. 1998) or in other species. In order to evaluate the magnitude of thisproblem in our genebank, a project was initiated in 1997, using the RAPD technique.
Material and methods
Plant materialA total of 546 trees were tested from 132 different accessions (expected to be clones).The numbers of trees compared per accession are indicated in Table 1. The treeswere planted in:• the University Cocoa Research Station (UCRS = genebank, most recently planted,• at Marper farm (the oldest plantings of many clones), and• in the fields of the University campus in St. Augustine.The trees that were analysed were generally chosen in such a way that their podcharacteristics were in agreement with what is known about the accession or thepopulation it belongs to.
MethodsThe RAPD technique was used, using a protocol adopted at the Cocoa Research Unit(Christopher and Sounigo 1996), on DNA samples extracted according to Johnson etal. (1992). Fourteen primers were used, and 39 amplification products were selected,for their intensity and their reproducibility.
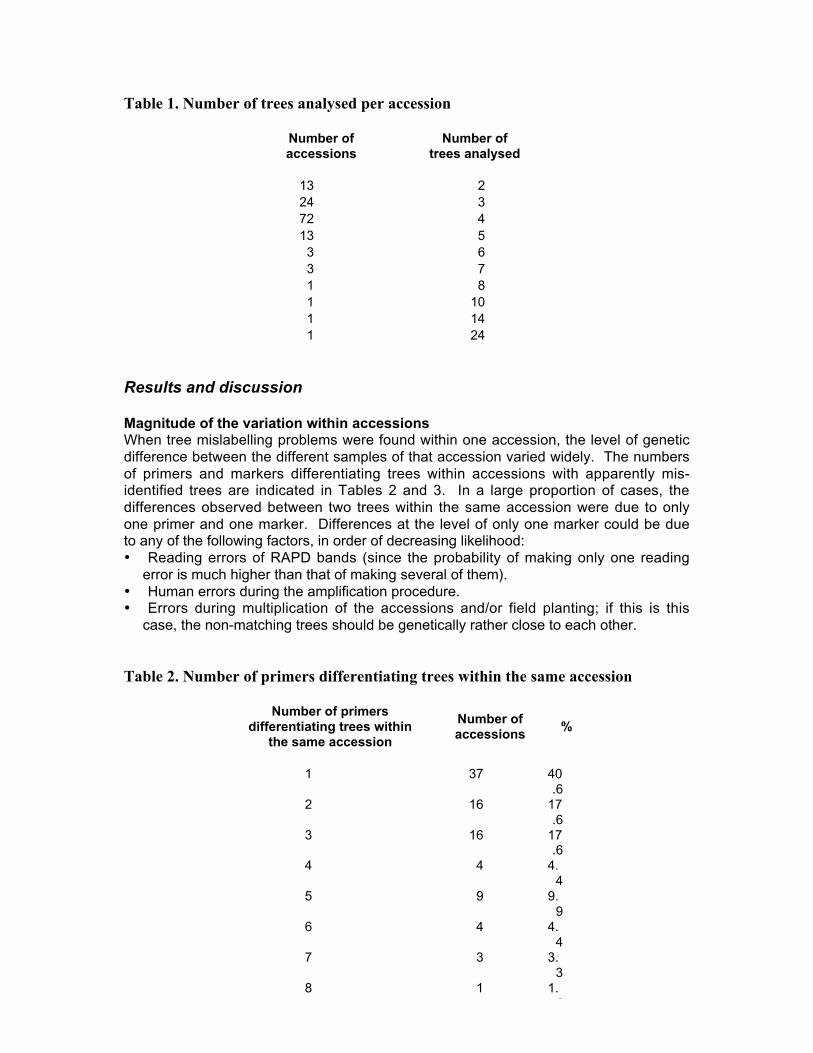
16 – 17 October 2000, Kota Kinabalu, Sabah, Malaysia 35
Table 1. Number of trees analysed per accession
Number ofaccessions
Number oftrees analysed
13 224 372 413 5
3 63 71 81 101 141 24
Results and discussion
Magnitude of the variation within accessionsWhen tree mislabelling problems were found within one accession, the level of geneticdifference between the different samples of that accession varied widely. The numbersof primers and markers differentiating trees within accessions with apparently mis-identified trees are indicated in Tables 2 and 3. In a large proportion of cases, thedifferences observed between two trees within the same accession were due to onlyone primer and one marker. Differences at the level of only one marker could be dueto any of the following factors, in order of decreasing likelihood:• Reading errors of RAPD bands (since the probability of making only one reading
error is much higher than that of making several of them).• Human errors during the amplification procedure.• Errors during multiplication of the accessions and/or field planting; if this is this
case, the non-matching trees should be genetically rather close to each other.
Table 2. Number of primers differentiating trees within the same accession
Number of primersdifferentiating trees within
the same accession
Number ofaccessions
%
1 37 40.6
2 16 17.6
3 16 17.6
4 4 4.4
5 9 9.9
6 4 4.4
7 3 3.3
8 1 1.1
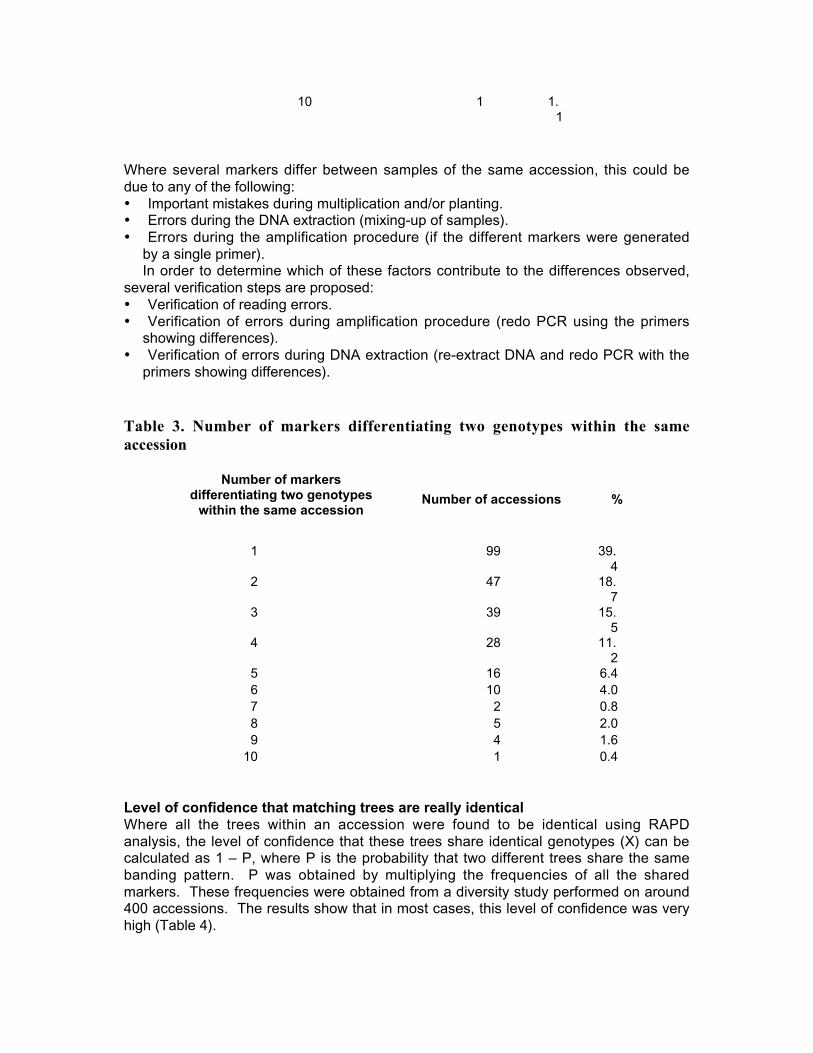
16 – 17 October 2000, Kota Kinabalu, Sabah, Malaysia 36
10 1 1.1
Where several markers differ between samples of the same accession, this could bedue to any of the following:• Important mistakes during multiplication and/or planting.• Errors during the DNA extraction (mixing-up of samples).• Errors during the amplification procedure (if the different markers were generated
by a single primer).In order to determine which of these factors contribute to the differences observed,
several verification steps are proposed:• Verification of reading errors.• Verification of errors during amplification procedure (redo PCR using the primers
showing differences).• Verification of errors during DNA extraction (re-extract DNA and redo PCR with the
primers showing differences).
Table 3. Number of markers differentiating two genotypes within the sameaccession
Number of markersdifferentiating two genotypes
within the same accessionNumber of accessions %
1 99 39.4
2 47 18.7
3 39 15.5
4 28 11.2
5 16 6.46 10 4.07 2 0.88 5 2.09 4 1.6
10 1 0.4
Level of confidence that matching trees are really identicalWhere all the trees within an accession were found to be identical using RAPDanalysis, the level of confidence that these trees share identical genotypes (X) can becalculated as 1 – P, where P is the probability that two different trees share the samebanding pattern. P was obtained by multiplying the frequencies of all the sharedmarkers. These frequencies were obtained from a diversity study performed on around400 accessions. The results show that in most cases, this level of confidence was veryhigh (Table 4).
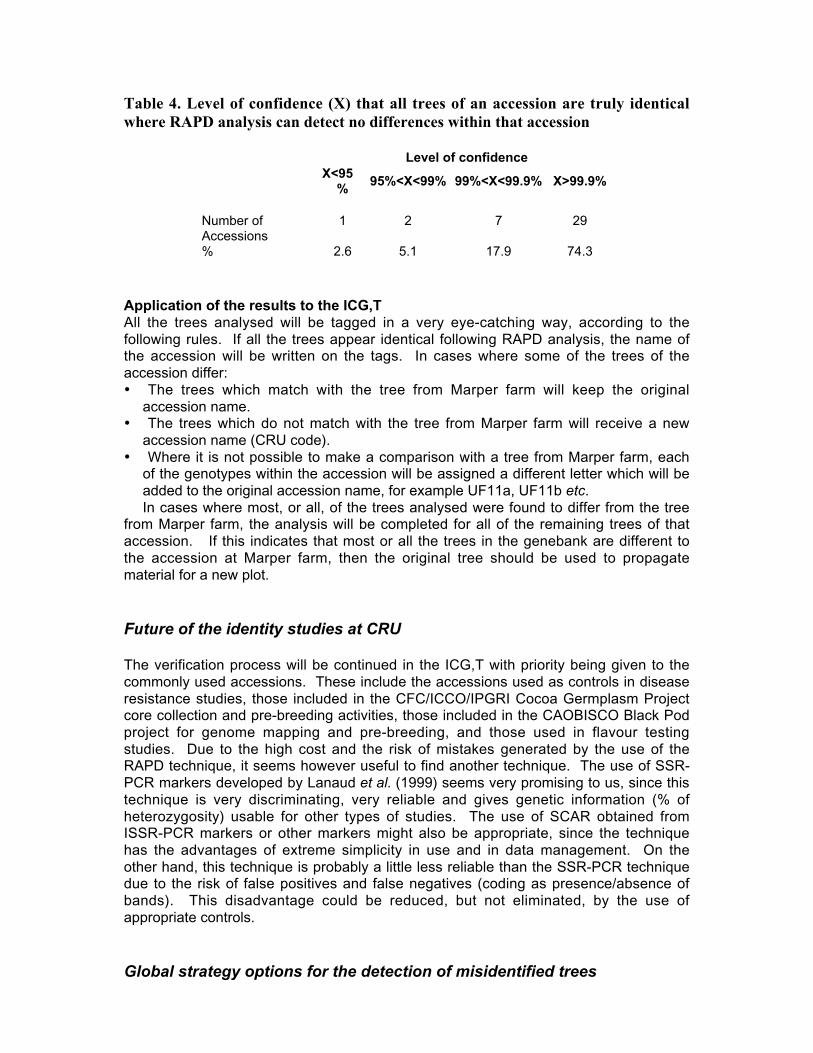
16 – 17 October 2000, Kota Kinabalu, Sabah, Malaysia 37
Table 4. Level of confidence (X) that all trees of an accession are truly identicalwhere RAPD analysis can detect no differences within that accession
Level of confidenceX<95
%95%<X<99% 99%<X<99.9% X>99.9%
Number ofAccessions
1 2 7 29
% 2.6 5.1 17.9 74.3
Application of the results to the ICG,TAll the trees analysed will be tagged in a very eye-catching way, according to thefollowing rules. If all the trees appear identical following RAPD analysis, the name ofthe accession will be written on the tags. In cases where some of the trees of theaccession differ:• The trees which match with the tree from Marper farm will keep the original
accession name.• The trees which do not match with the tree from Marper farm will receive a new
accession name (CRU code).• Where it is not possible to make a comparison with a tree from Marper farm, each
of the genotypes within the accession will be assigned a different letter which will beadded to the original accession name, for example UF11a, UF11b etc.In cases where most, or all, of the trees analysed were found to differ from the tree
from Marper farm, the analysis will be completed for all of the remaining trees of thataccession. If this indicates that most or all the trees in the genebank are different tothe accession at Marper farm, then the original tree should be used to propagatematerial for a new plot.
Future of the identity studies at CRU
The verification process will be continued in the ICG,T with priority being given to thecommonly used accessions. These include the accessions used as controls in diseaseresistance studies, those included in the CFC/ICCO/IPGRI Cocoa Germplasm Projectcore collection and pre-breeding activities, those included in the CAOBISCO Black Podproject for genome mapping and pre-breeding, and those used in flavour testingstudies. Due to the high cost and the risk of mistakes generated by the use of theRAPD technique, it seems however useful to find another technique. The use of SSR-PCR markers developed by Lanaud et al. (1999) seems very promising to us, since thistechnique is very discriminating, very reliable and gives genetic information (% ofheterozygosity) usable for other types of studies. The use of SCAR obtained fromISSR-PCR markers or other markers might also be appropriate, since the techniquehas the advantages of extreme simplicity in use and in data management. On theother hand, this technique is probably a little less reliable than the SSR-PCR techniquedue to the risk of false positives and false negatives (coding as presence/absence ofbands). This disadvantage could be reduced, but not eliminated, by the use ofappropriate controls.
Global strategy options for the detection of misidentified trees
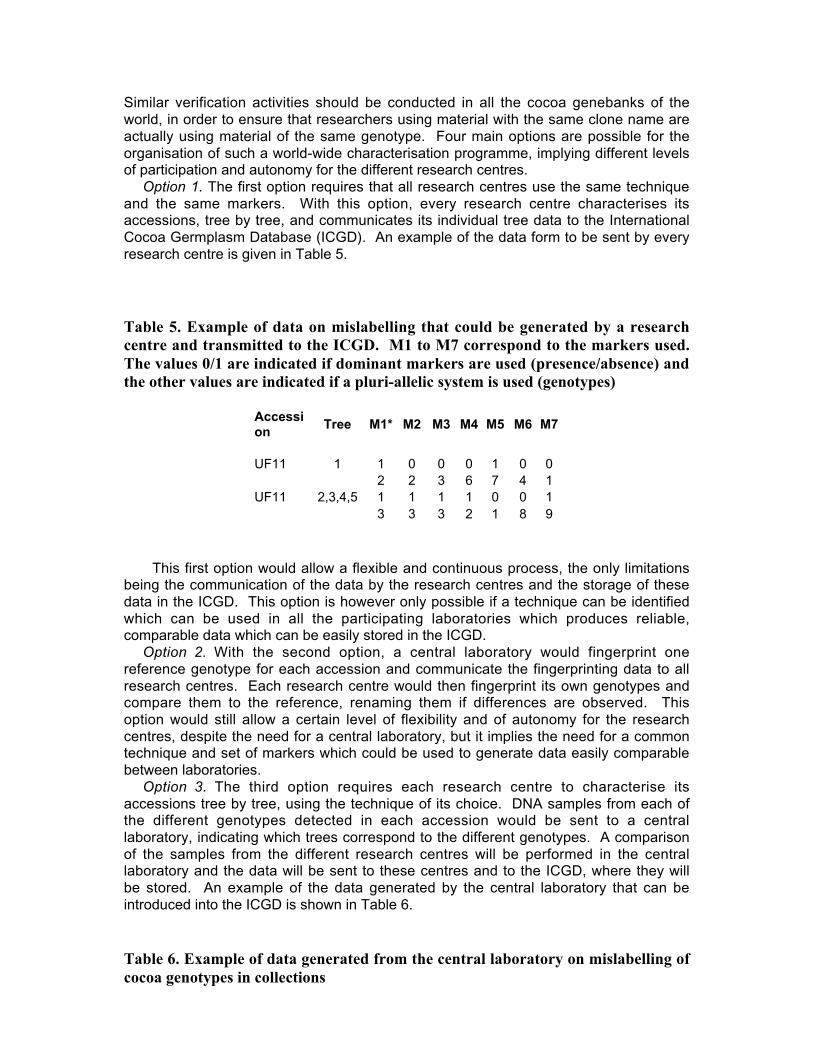
16 – 17 October 2000, Kota Kinabalu, Sabah, Malaysia 38
Similar verification activities should be conducted in all the cocoa genebanks of theworld, in order to ensure that researchers using material with the same clone name areactually using material of the same genotype. Four main options are possible for theorganisation of such a world-wide characterisation programme, implying different levelsof participation and autonomy for the different research centres.
Option 1. The first option requires that all research centres use the same techniqueand the same markers. With this option, every research centre characterises itsaccessions, tree by tree, and communicates its individual tree data to the InternationalCocoa Germplasm Database (ICGD). An example of the data form to be sent by everyresearch centre is given in Table 5.
Table 5. Example of data on mislabelling that could be generated by a researchcentre and transmitted to the ICGD. M1 to M7 correspond to the markers used.The values 0/1 are indicated if dominant markers are used (presence/absence) andthe other values are indicated if a pluri-allelic system is used (genotypes)
Accession
Tree M1* M2 M3 M4 M5 M6 M7
UF11 1 1 0 0 0 1 0 02 2 3 6 7 4 1
UF11 2,3,4,5 1 1 1 1 0 0 13 3 3 2 1 8 9
This first option would allow a flexible and continuous process, the only limitationsbeing the communication of the data by the research centres and the storage of thesedata in the ICGD. This option is however only possible if a technique can be identifiedwhich can be used in all the participating laboratories which produces reliable,comparable data which can be easily stored in the ICGD.
Option 2. With the second option, a central laboratory would fingerprint onereference genotype for each accession and communicate the fingerprinting data to allresearch centres. Each research centre would then fingerprint its own genotypes andcompare them to the reference, renaming them if differences are observed. Thisoption would still allow a certain level of flexibility and of autonomy for the researchcentres, despite the need for a central laboratory, but it implies the need for a commontechnique and set of markers which could be used to generate data easily comparablebetween laboratories.
Option 3. The third option requires each research centre to characterise itsaccessions tree by tree, using the technique of its choice. DNA samples from each ofthe different genotypes detected in each accession would be sent to a centrallaboratory, indicating which trees correspond to the different genotypes. A comparisonof the samples from the different research centres will be performed in the centrallaboratory and the data will be sent to these centres and to the ICGD, where they willbe stored. An example of the data generated by the central laboratory that can beintroduced into the ICGD is shown in Table 6.
Table 6. Example of data generated from the central laboratory on mislabelling ofcocoa genotypes in collections
Accession
Country Tree Genotype
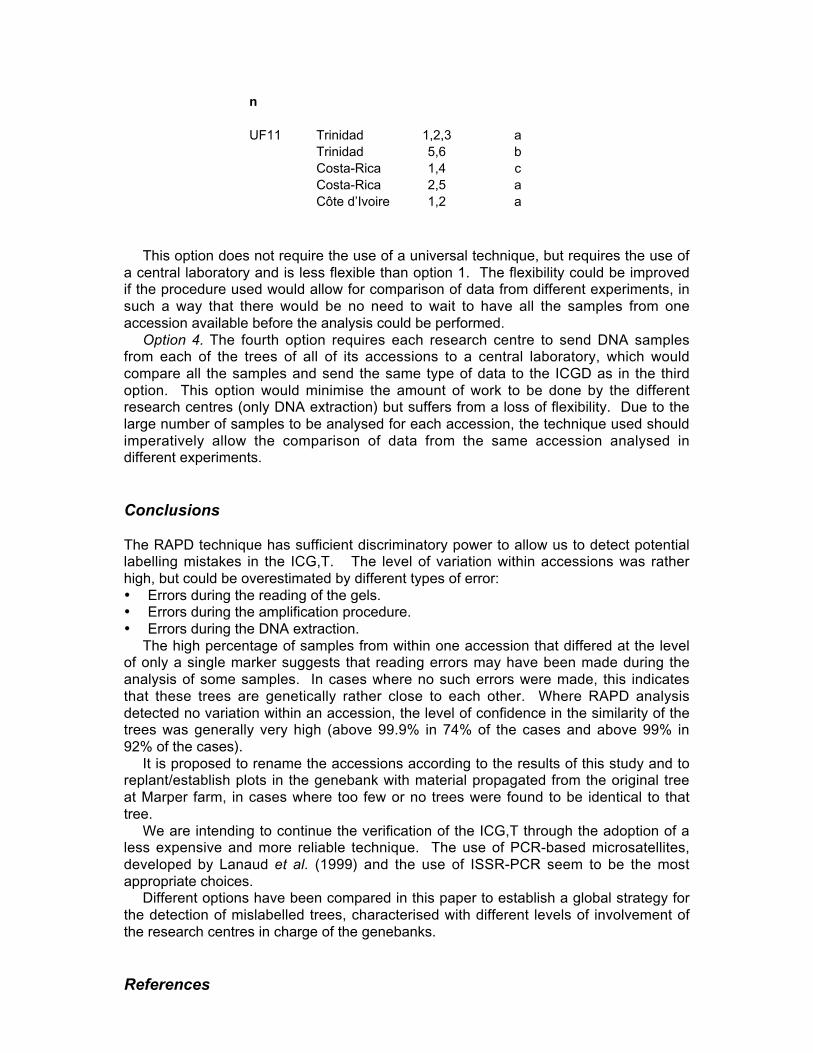
16 – 17 October 2000, Kota Kinabalu, Sabah, Malaysia 39
n
UF11 Trinidad 1,2,3 aTrinidad 5,6 bCosta-Rica 1,4 cCosta-Rica 2,5 aCôte d’Ivoire 1,2 a
This option does not require the use of a universal technique, but requires the use ofa central laboratory and is less flexible than option 1. The flexibility could be improvedif the procedure used would allow for comparison of data from different experiments, insuch a way that there would be no need to wait to have all the samples from oneaccession available before the analysis could be performed.
Option 4. The fourth option requires each research centre to send DNA samplesfrom each of the trees of all of its accessions to a central laboratory, which wouldcompare all the samples and send the same type of data to the ICGD as in the thirdoption. This option would minimise the amount of work to be done by the differentresearch centres (only DNA extraction) but suffers from a loss of flexibility. Due to thelarge number of samples to be analysed for each accession, the technique used shouldimperatively allow the comparison of data from the same accession analysed indifferent experiments.
Conclusions
The RAPD technique has sufficient discriminatory power to allow us to detect potentiallabelling mistakes in the ICG,T. The level of variation within accessions was ratherhigh, but could be overestimated by different types of error:• Errors during the reading of the gels.• Errors during the amplification procedure.• Errors during the DNA extraction.
The high percentage of samples from within one accession that differed at the levelof only a single marker suggests that reading errors may have been made during theanalysis of some samples. In cases where no such errors were made, this indicatesthat these trees are genetically rather close to each other. Where RAPD analysisdetected no variation within an accession, the level of confidence in the similarity of thetrees was generally very high (above 99.9% in 74% of the cases and above 99% in92% of the cases).
It is proposed to rename the accessions according to the results of this study and toreplant/establish plots in the genebank with material propagated from the original treeat Marper farm, in cases where too few or no trees were found to be identical to thattree.
We are intending to continue the verification of the ICG,T through the adoption of aless expensive and more reliable technique. The use of PCR-based microsatellites,developed by Lanaud et al. (1999) and the use of ISSR-PCR seem to be the mostappropriate choices.
Different options have been compared in this paper to establish a global strategy forthe detection of mislabelled trees, characterised with different levels of involvement ofthe research centres in charge of the genebanks.
References
16 – 17 October 2000, Kota Kinabalu, Sabah, Malaysia 40
Figueira A. 1998. Homonymous Genotypes and Misidentification in Germplasm Collections ofBrazil and Malaysia. INGENIC Newsletter 4: . 4-8.
Christopher Y. and O. Sounigo. 1996. The use of RAPD for characterization and geneticdiversity assessment of cacao. Pages 38-51 in Annual Report of the Cocoa Research Unitfor 1995, The Cocoa Research Unit, St. Augustine, Trinidad and Tobago.
Johnson E., J.R. Russel, F. Hosein, W. Powell and R. Waugh. 1992. A laboratory manual forRAPD analyses in cocoa. Internal Cocoa Research Unit Report (unpublished).
Lanaud C., A.M. Risterucci, I. Pieretti, M. Falque, A. Bouet and P.J.L. LAGODA. 1999. Isolationand characterization of microsatellites in Theobroma cacao L. Mol. Ecol. 12: 2141-2143.
16 – 17 October 2000, Kota Kinabalu, Sabah, Malaysia 41
A Report on BCCCA Cocoa Research Colloquium I:“Germplasm Characterisation Using Molecular Tools”
Martin Gilmour
Mars Confectionery, Dundee Road, Slough, SL1 4JX, United Kingdom
Abstract
The BCCCA have had a long commitment to the improvement of the cocoa crop and undertookto hold a meeting of scientists involved in molecular characterisation of cocoa germplasm. Theobjectives of this colloquium were for interested scientists to share results, co-ordinate projects,and work towards a vision of a world-wide cocoa enhanced breeding programme. Thecolloquium was held at CIRAD on the 21st September 2000 and was attended by approximately30 scientists. Presentations were made by BCCCA, CRU Trinidad, the University of Reading,USDA, CIRAD, and the ICGD, followed by open discussions on the future of germplasmcharacterisation using molecular tools. The colloquium participants agreed the following:• There is a vital need for a co-ordinated global cocoa germplasm characterisation
programme.• Recording and open circulation of the full range of results from such a programme should
follow the model of existing plant databases.• Type trees close to source will be identified and clearly labelled; the fate of off-types would
be determined by the primary collections.• Microsatellite analysis will be used in the programme; the technology is ready to use
immediately.• Additional experiments are however needed to refine the technique, to determine its limits,
and to determine the rate and presence of mutations.These conclusions will be described in more detail and how molecular characterisation fits
into a world-wide cocoa breeding programme enhanced by molecular tools will be discussed.
Introduction
The BCCCA Cocoa Research StrategyCurrently, small farmers grow most of the world’s cocoa and research is urgentlyneeded to help them produce good quality cocoa using sustainable growing systems.The UK cocoa and chocolate industry represented by the Biscuit, Cake, Chocolate andConfectionery Alliance (BCCCA) has a long tradition of support for cocoa research bothin the UK and in producing countries. To safeguard the future of the cocoa andchocolate industry, there is a need to ensure sustainable supplies of good qualitycocoa at prices which provide a worthwhile return to all those involved in the cocoachain, from grower through to chocolate manufacturer.
On a world-wide basis, the ultimate aim is to develop and make available cocoatrees suitable for each region, having the following characteristics: high yield, earlybearing, resistance/tolerance to major relevant pests and diseases, cocoas of goodquality and flavour, low maintenance and production costs, and environmentalsustainability. In addition, there is a need to develop the knowledge and expertise tocontrol pests and diseases that may arise in the future, in a way that fits with integratedcrop management principles.
Clearly, this task is beyond the resources, which the manufacturing industry is ableto make available, and additional support must be obtained. However, two strategiesare possible whereby manufacturers may be directly involved. Firstly, by providingassistance which will enable plant breeders in the producing countries to develop theimproved tree stocks, which are needed. Secondly, by sponsoring research into thecontrol of pests and diseases and farming production practices in the major producing
16 – 17 October 2000, Kota Kinabalu, Sabah, Malaysia 42
countries. Ideally, both of these objectives need to be achieved using no pesticides orby minimal usage in a system of Integrated Pest Management.
Collecting, conservation, characterisation, cataloguing and distributionThe single most important route for effecting improvements in the efficiency of cocoaproduction will be through plant breeding. Breeders need germplasm containingsufficient diversity to allow them to produce varieties with good economiccharacteristics, which will perform well under local environmental conditions and pestand disease pressures. Their progress will be accelerated if they have access toinformation on the characteristics of the material, are confident of its identity (perhapsthrough molecular characterisation), and if they can exchange material with othergenebanks via intermediate quarantine to minimise the risk of spreading pests anddiseases. Research needs are:• Collecting. Collecting of wild germplasm from the centre of origin/centre of diversity
to enlarge the genetic base of material available to plant breeders. Major collectinginitiatives should only be carried out, however, when material in a location is underthreat or is believed to be of vital importance or where an unusual specificopportunity arises for a co-operative programme with a local institution. Plannedcollecting can, however, be supplemented by opportunistic collecting fromelsewhere, including selected material from private and national collections, toensure that as wide a range of material as possible is freely available in internationalgenebanks. Collecting can be carried out in a more systematic way if the existinggermplasm in collections has been characterised, preferably at the molecular level.
• Conservation. This material must then be conserved in internationally recognisedfield genebanks or field collections (such as that at CRU Trinidad (InternationalCocoa Genebank, Trinidad) or at CATIE, Costa Rica. These may becomplementary to each other but should desirably have a high degree ofduplication. The need to exchange material with other collections is of greatimportance. In due time, other conservation methods, e.g. tissue culture or lowtemperature storage, may be possible and cost effective. The collections of cocoatrees in germplasm centres represent an important resource for the world cocoacommunity. These contain the outputs from collecting expeditions – both recent andthose undertaken many years ago - important local selections, core genotypes usedinternationally in cocoa breeding programmes, and in many cases, genotypes ofunknown origin. Molecular characterisation of cocoa germplasm will be a valuabletool to rationalise germplasm collections, i.e. make an inventory of maintainedgermplasm, identify off-types and duplications, and highlight gaps in the collections.
• Characterisation. The purpose of characterisation is to establish the provenance ofeach clone and its biological and commercial characteristics, using a variety ofproven techniques as available, e.g. morphological descriptors, isozyme analysisand RAPD markers (more recently microsatellite analysis). These need to befollowed by screening against as wide a range of pests and diseases as possible asand when the necessary techniques are available. The possibility in the future ofgenemapping - identification of characteristics linked to specific loci on the genome -leading to rapid and extensive screening for desirable characteristics will become ofincreasing importance. This technique is not yet at an advanced stage for cocoaand will still require a substantial research effort to make any meaningful advance.It is obvious that unequivocal characterisation of cocoa germplasm by molecularmethods is the best route to provide a base for future advanced genetic work oncocoa.
• Cataloguing. The data arising from characterisation needs to be assembled in acomputer database, readily usable in as wide a variety of locations as possible andproviding facilities for updating and the incorporation of new types of data as thesebecome available. The use of the internet needs to be considered, though hardcopies may still be needed for some key users.
16 – 17 October 2000, Kota Kinabalu, Sabah, Malaysia 43
• Distribution. Distribution of cocoa germplasm must be through internationallyrecognised intermediate quarantine to ensure that only healthy material is circulated.Under present procedures, cocoa seedlings need to be kept in intermediatequarantine for two years. Therefore new methods of quarantine, especially ofspeedy screening against a wide range of potentially harmful viruses, is urgentlyrequired to reduce the present quarantine time and costs. Inwards quarantine in theproducing country is sometimes also required. Successful micropropagationprocedures are needed to facilitate transfer of germplasm from quarantine.The incorporation of new genetic materials, fully characterised and catalogued, into
national breeding programmes is the ultimate and urgent objective of this work. Weare still using parental genotypes identified as potentially useful in early trialsconducted in Trinidad in the 1940's and 1950's. A broader range of useful parentsshould be urgently identified. The BCCCA believe it is essential for the manufacturingindustry to contribute to the general improvement of the cocoa crop by becominginvolved in the sponsorship of research and arranging for its results to becommunicated and applied in practice. Against a background of increased interest inthe molecular characterisation of cocoa germplasm, the developments in availabletechnology, and to build on our support for CRU, ICG,T, ICGD, and Reading UniversityIntermediate Quarantine, the BCCCA undertook to hold a research colloquium tostimulate greater co-operation between researchers and play a part in developing avision of a major cocoa enhanced breeding programme.
Colloquium programme and format
About 30 participants, mainly scientists from research institutions directly involved inthe subject, attended the colloquium. Speakers were:• Tony Lass, BCCCA, Cadbury International Limited• Martin Gilmour, BCCCA, Mars Confectionery• David Butler, CRU Trinidad• Olivier Sounigo, CIRAD, CRU Trinidad• Mike Wilkinson, The University of Reading• Jim Saunders, USDA• Ange-Marie Risterucci, CIRAD• Caroline Ford, The University of Reading
The chairman of the BCCCA Cocoa Research Committee introduced the topic ofmolecular characterisation using a real-life example of an area of confusion: several“versions” of SCA 6, which are phenotypically distinct from each other, appear to exist.The colloquium goals were described: an informal exchange of information, adescription of the potential methodologies, identification of the areas of compatibility, adraft plan agreed of a global characterisation programme, and a clear recognition of theneed for data capture and dissemination.
The role of molecular biology techniques in a world-wide cocoa enhanced breedingprogramme was described, and the point was made that this colloquium was onlyconsidering the topic of molecular characterisation (future meetings may focus on othermolecular biology tools and their use in cocoa improvement). Several more exampleswere presented of cases where there was a real need for unequivocal characterisationof cocoa germplasm. Real life examples were also described of attempts tocharacterise germplasm at CRU Trinidad, University of Reading, USDA Beltsville, andCIRAD Montpellier, using a variety of techniques. Finally in the presentation session,the extremely important issue of information management in cocoa characterisationwas discussed and suggestions were made as to how this could be incorporated intothe International Cocoa Germplasm Database (ICGD).
The remainder of the colloquium took the format of an open discussion facilitated byBCCCA in which the technology, gaps, agreed needs, and future steps were openly
16 – 17 October 2000, Kota Kinabalu, Sabah, Malaysia 44
discussed by all participants. At the end of the day, approximately 30 points had beencaptured and these were subsequently sent by email to participants for their approval.The following are the agreed points from the BCCCA Research Colloquium I, groupedinto themes:
Agreed outputs grouped under themes
(numbered as they came up during the colloquium)
General strategy• 1. The colloquium participants agreed that germplasm characterisation is vital, and
provides an essential platform for improved cocoa breeding.• 24. There was no time to plan a complete global cocoa characterisation programme
using molecular tools. It was agreed that this would be done at a later date and thatmost activity for the near future would concentrate on cocoa germplasm located inthe Americas - which conveniently includes the centres of diversity for cocoa.
Linking collections and quarantine facilities to germplasm characterisation• 6. Samples taken for fingerprinting should be taken from as close to original
"sources" as possible, e.g. Marper Farm in Trinidad in the case of the Poundcollections.
• 7. The principle of "type" specimens will be used in cocoa fingerprinting (as inherbarium collections). Maps and GPS co-ordinates will be used to locate thesetype trees unequivocally within collections. These type trees must be given verydistinct, obvious labels.
• 8. Individual sample trees must also be given durable labels. Cryopreservation willbe considered as an additional insurance to field collections for germplasmconservation. Field collections remain essential for phenotype studies andevaluation for traits of economic importance.
• 21. Curators were asked to tag each tree sampled for fingerprinting with apermanent stamped metal tag, tied on with galvanized wire.
• The issue of how to deal with off-types will be taken at the local level, withinformation on decisions being fed into the ICGD.
• 22. In the event of clear mislabelling, the issue of how to change the name wasdiscussed. Should this be in the ICGD, does a committee need to be convened todecide, should the institution name be used, should a new name be used after aparticular date, how should tissue-cultured plants be identified? are questions whichneed to be solved at a later date. The INGENIC newsletter was proposed as a wayto raise mislabelling issues.
• 23. It was agreed that a better view on the scale of mislabelling would be knownnext year, making it easier to answer the questions in point 22.
• 15. When characterised, curators of the primary genebanks will be asked toexchange the characterised germplasm.
• 16. The University of Reading Intermediate Quarantine Facility is currently the onlyquarantine station able to export cocoa germplasm to Africa (as stated by the Inter -African Phytosanitary Council). The Barbados facility is mainly for germplasmmovement into Trinidad, but material could go to other quarantine stations in thesame phytosanitary region. The USDA facility at the Sub-Tropical Research Station,Miami is undergoing renovation.
Recommendations on molecular tools for germplasm characterisation• 2. Microsatellites (SSRs) are the way ahead for immediate use in the molecular
characterisation of cocoa germplasm (in the past, characterisation methods haveincluded morphology, isozymes, RAPDs, RFLPs, and AFLPs.).
16 – 17 October 2000, Kota Kinabalu, Sabah, Malaysia 45
• 3. Fifteen SSRs are enough to use for fingerprinting cocoa. More SSRs may beneeded for genetic diversity studies.
• 4. We have enough SSRs that span the cocoa genome to now do effectivefingerprinting studies.
• 10. About 1500 samples per technician per year can be processed (leaves throughto DNA, fingerprinting analysis, and interpretation). More samples can beprocessed if the DNA is extracted locally.
• 13. The use of SSR primers allows for a variety of DNA separation and visualisationtechniques so the use of radioactivity is not necessary.
Additional experiments needed for a robust molecular approach to germplasmcharacterisation• 5. An approximate mutation rate of 300 per 10,000 plants could occur in cocoa
germplasm, giving rise to errors in fingerprinting. An extra set of 6 SSRs would beneeded to distinguish mislabelling from mutations.
• 14. We will assess the pooling of DNA samples for SSR analysis to see if this canbe used to increase the throughput of supposedly identical samples, e.g. the sets of16 trees at Trinidad. Olivier Sounigo (CIRAD and CRU) volunteered to test thepooling of SSR samples to see where pooling breaks down.
• 17. A ringtest was agreed between the major centres to test the inter-laboratorycompatibility of the 15 primer pairs to be used in fingerprinting. Ringtest participantsare: USDA–Miami, USDA–Beltsville, Penn State University, CIRAD, Nestle-Tours,University of Nottingham, CEPLAC and CRU-Trinidad. Claire Lanaud (CIRAD),Olivier Sounigo (CIRAD/CRU) and Jim Saunders (USDA) will decide on the choiceof the 15 primer pairs. David Butler (CRU) will decide on five genetically diverseclones to be fingerprinted and will collect the leaves from Marper Farm.
• 18. The ultimate test of a fingerprinting technique is if it can distinguish between fullsibs. If the technique can then assign a value e.g., 99%, 98%, 97% identical etc.,then this would be of real value. Ray Schnell (USDA Miami) volunteered to designand carry out an experiment to test this.
• 19. It was estimated that to assess the mutation rate in cocoa clones, about 200cloned trees from a single accession would have to be screened with 15 primers. Itwas suggested that the plant material being produced by Biofabrica in Bahia, Brazilwould be ideal to test this. Mike Wilkinson (University of Reading) and Uilson Lopes(CEPLAC) volunteered to design and carry out an experiment to test this.
Database management in germplasm characterisation• 11. Existing examples of plant germplasm databases will be assessed to see if they
could be used for cocoa, e.g. CIRAD model, maize d.base, Arabidopsis d.base.Estimated resource need for database handling is one full time postgraduate.
• 12. The cocoa database will try and store the fullest possible range of informationon cocoa. There will be free, open access to all parties, with all information in thepublic domain.
• 20. It was suggested that the next meeting of this group (perhaps during 2001)could discuss the interface between fingerprinting cocoa germplasm and phenotypicdata. Phenotypic data on cocoa genotypes is usually available locally, but in theabsence of a common set of agreed criteria, and data collected in different places,at different times, it was agreed to proceed with only collecting molecular data forthe near future.
Discussion and future prospects
General strategyGiven the level of interest shown in the colloquium it came as no surprise to find thatthe participants were in complete agreement that the overall objective of unequivocal
16 – 17 October 2000, Kota Kinabalu, Sabah, Malaysia 46
characterisation of cocoa germplasm was an essential and worthwhile goal. In thelonger term, there is a clear need for a global co-ordinated programme, but the USDAproject to characterise the cocoa germplasm in the Americas represents a very goodstart. A future output of this work could be the definition of a “virtual collection” ofcocoa germplasm, defined genetically, spanning the known genetic diversity of thespecies, but not necessarily geographically located at one site.
Linking collections and quarantine facilities to germplasm characterisationThe current collections of cocoa germplasm are clearly the first place to start on anyworld-wide cocoa characterisation programme. There was broad agreement that incharacterisation work, type specimens should be identified by people who have closeknowledge of the collections and specific varieties of cocoa. The simple but vitalaspect of tagging these type trees should be done in a robust, durable way. Thesubject of how to deal with off-types generated a lot of debate, but apart fromrecognising that this was a major issue, the colloquium did not attempt to propose asolution. It would perhaps be appropriate to place the responsibility for dealing with off-types with the individual curators of the collections. As the cocoa research communitymoves towards a world-wide cocoa molecular characterisation programme, there is anexpectation that primary genebanks will share results and germplasm. Although this ispotentially a politically sensitive issue, it needs to be stated that it remains theexpectation of the research community that there should be free exchange of resultsand germplasm between collections. This needs to be done in a way which takes intoaccount the potential spread of cocoa diseases, therefore it was noted in thecolloquium that The University of Reading Intermediate Quarantine facility is currentlythe only centre able to forward cocoa germplasm to all cocoa producing countries.
Recommendations on molecular tools for germplasm characterisationIt was not surprising given the high level of existing work in this field, that there was alot of debate on the techniques currently used in cocoa molecular characterisation. Itwas more surprising that some clear recommendations emerged as to the wayforward - the use of microsatellites, the number of microsatellites needed forfingerprinting (15), the estimated throughput, the preference to avoid radioactivity, etc.
Additional experiments needed for a robust molecular approach to germplasmcharacterisationA feature of the colloquium was the planning of future, usually collaborativeexperiments, which would take the research community closer to a global cocoacharacterisation programme. More experiments were planned to distinguish mutationsfrom off-types, to look at pooling samples for greater throughput (especially forcollections like that in Trinidad where multiple copies of single genotypes are kept), toset up an inter-laboratory ringtest, and to determine if fingerprinting could distinguishbetween sibs.
Database management in germplasm characterisationThe colloquium debate was mainly restricted to the above issues and practical aspectsof applying molecular biology techniques to cocoa germplasm characterisation. Itbecame clear during the meeting that this was only part of the bigger picture, and thatthe issue of how to record, integrate, and share the voluminous data likely to begenerated by molecular characterisation was a major unfilled gap in resources. Thiswas emphasised by the desire of the colloquium participants to have the largest rangeof data stored and made available to the research community. A fewrecommendations were made such as to use existing models of plant geneticdatabases, to try and link the data to the ICGD, and to start recording molecular dataleaving phenotypic data for the future. The colloquium concluded that the need for a
16 – 17 October 2000, Kota Kinabalu, Sabah, Malaysia 47
specialised bioinformatics person was clear, and the need for funding of such a personwas a priority.
Molecular characterisation as part of a world-wide cocoa enhanced breedingprogrammeThe BCCCA sees the molecular characterisation of cocoa germplasm as part of alarger programme to modernise the cocoa crop. Secure, diverse, characterisedcollections of cocoa germplasm form a platform for breeders, agronomists,pathologists, ecologists, physiologists, molecular biologists, and biotechnologists towork on known accessions of cocoa, safe in the knowledge that their results will beinternationally comparable. This work also underpins the setting up of mappingpopulations for the identification of QTLs, and the development of marker-assistedselection schemes. Gene discovery programmes using EST technology, or candidategene approaches also rely on the unequivocal identification of germplasm. Thesemodern molecular breeding techniques and molecular characterisation in combinationwith conventional breeding, will lead to the development of elite trees which can bepropagated by a variety of new tissue culture and horticultural methods. It is not anexaggeration to say that the outputs from this colloquium are at the heart of improvingthe cocoa crop for growers and consumers around the world. Therefore in conclusion,as well as the above outputs and action points, the unequivocal message from the firstBCCCA Research Colloquium is that molecular characterisation has a vital role to playin a world-wide cocoa breeding programme enhanced by molecular tools.
Acknowledgements
The BCCCA would like to thank the speakers, the participants, and our hosts CIRADfor making the first BCCCA research colloquium a success.
16 – 17 October 2000, Kota Kinabalu, Sabah, Malaysia 48
Genetic Structure, Characterisation and Selection of NacionalCocoa Compared to Other Genetic Groups
Dominique Crouzillat, Laurence Bellanger, Michel Rigoreau, Peter Bucheli andVincent Pétiard
Centre de Recherche Nestlé, 101, Avenue Gustave Eiffel, Notre-Dame D’Oé, B.P. 9716, 37097Tours Cedex 2, France
Abstract
Nacional cocoa from Ecuador is the source of the fine flavour cocoa called Arriba. The exactorigin of the Nacional type is not known, but it is generally considered as native to Ecuador.Recent studies using RFLP probes indicated that Nacional cocoa genotypes are geneticallydifferent from the Forastero, Criollo or Trinitario groups. Data are presented here, and brieflydiscussed, on the level of heterozygosity and genetic diversity of 416 genotypes characterised,including more than 100 Ecuadorian genotypes. The Ecuadorian types constituted twopopulations: one group having a low level of heterozygosity (average of 5%) and low geneticdiversity, representing part of the native Nacional group, and a second group with a higher levelof heterozygosity (average of 32%) that resulted from introgression with cocoa types fromVenezuela and Trinidad. Due to their higher productivity, hybrids now predominate overNacional types.Resistance to witches' broom disease, yield improvement and consistent Arribaflavour were defined as selection priorities in Ecuador. These criteria were studied through asub-sample of clones collected in various locations, representing the Ecuadorian geneticdiversity (EB clones). No immunity to witches' broom disease was detected but a relationshipbetween vigour and disease incidence was found suggesting that more brooms develop onmore vigorous trees. The sensory evaluation indicated that cocoa trees which give rise tobeans with significant Arriba flavour are not distributed according to their geographic origin ortheir genetic status. In fact, Arriba flavour has been found in both Nacional and hybrid types.The relative importance of the genetic and environmental factors on the Arriba flavour are yet tobe determined.
Introduction
The well-known Ecuadorian cocoas, derived from the Nacional variety, are consideredto be fine-flavoured. The production of this specific Arriba flavour not only depends ongenetic factors, but also on the post-harvest fermentation and the processing in thefactory.
In 1915, Ecuadorian cocoa production reached 50,000 tonnes when Ecuador wasthe second largest producer after Ghana. But the arrival of witches' broom disease inthe 1920s led to a strong decline in cocoa cultivation. From the beginning of the1930s, the quality of Ecuadorian cocoa has deteriorated due to the introduction ofTrinidad and Venezuelan clones collected for resistance to witches' broom disease. Anincreasing number of the trees planted today are hybrids from these clones (Lerceteauet al.1997). This was reflected in ICCO’s decision to consider Ecuador as a countrythat produced only 75% fine flavoured cocoa. Economically, this was a blow to theexporters as the premiums on cocoa prices decreased, and the industry is alsosuffering as good quality becomes harder to find.
In Ecuador, cocoa is primarily grown in the western coastal regions between sealevel and 400 m. There are three main zones: The northern zone includesEsmeraldas, Santo Domingo and Chone areas. The plantations mainly contain hybrids(Nacional x Trinitario). Yields are relatively low with a favourable climate for pathogendevelopment. The central area is in the Guayas river valley in Los Rios province. The
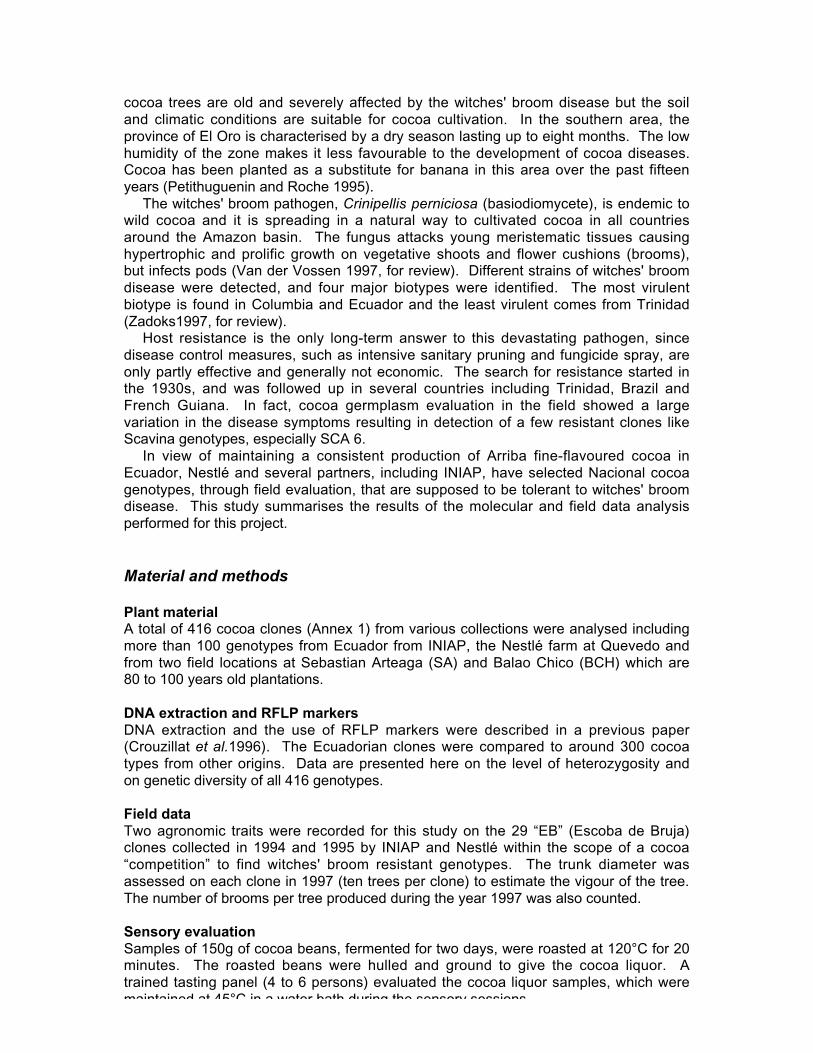
16 – 17 October 2000, Kota Kinabalu, Sabah, Malaysia 49
cocoa trees are old and severely affected by the witches' broom disease but the soiland climatic conditions are suitable for cocoa cultivation. In the southern area, theprovince of El Oro is characterised by a dry season lasting up to eight months. The lowhumidity of the zone makes it less favourable to the development of cocoa diseases.Cocoa has been planted as a substitute for banana in this area over the past fifteenyears (Petithuguenin and Roche 1995).
The witches' broom pathogen, Crinipellis perniciosa (basiodiomycete), is endemic towild cocoa and it is spreading in a natural way to cultivated cocoa in all countriesaround the Amazon basin. The fungus attacks young meristematic tissues causinghypertrophic and prolific growth on vegetative shoots and flower cushions (brooms),but infects pods (Van der Vossen 1997, for review). Different strains of witches' broomdisease were detected, and four major biotypes were identified. The most virulentbiotype is found in Columbia and Ecuador and the least virulent comes from Trinidad(Zadoks1997, for review).
Host resistance is the only long-term answer to this devastating pathogen, sincedisease control measures, such as intensive sanitary pruning and fungicide spray, areonly partly effective and generally not economic. The search for resistance started inthe 1930s, and was followed up in several countries including Trinidad, Brazil andFrench Guiana. In fact, cocoa germplasm evaluation in the field showed a largevariation in the disease symptoms resulting in detection of a few resistant clones likeScavina genotypes, especially SCA 6.
In view of maintaining a consistent production of Arriba fine-flavoured cocoa inEcuador, Nestlé and several partners, including INIAP, have selected Nacional cocoagenotypes, through field evaluation, that are supposed to be tolerant to witches' broomdisease. This study summarises the results of the molecular and field data analysisperformed for this project.
Material and methods
Plant materialA total of 416 cocoa clones (Annex 1) from various collections were analysed includingmore than 100 genotypes from Ecuador from INIAP, the Nestlé farm at Quevedo andfrom two field locations at Sebastian Arteaga (SA) and Balao Chico (BCH) which are80 to 100 years old plantations.
DNA extraction and RFLP markersDNA extraction and the use of RFLP markers were described in a previous paper(Crouzillat et al.1996). The Ecuadorian clones were compared to around 300 cocoatypes from other origins. Data are presented here on the level of heterozygosity andon genetic diversity of all 416 genotypes.
Field dataTwo agronomic traits were recorded for this study on the 29 “EB” (Escoba de Bruja)clones collected in 1994 and 1995 by INIAP and Nestlé within the scope of a cocoa“competition” to find witches' broom resistant genotypes. The trunk diameter wasassessed on each clone in 1997 (ten trees per clone) to estimate the vigour of the tree.The number of brooms per tree produced during the year 1997 was also counted.
Sensory evaluationSamples of 150g of cocoa beans, fermented for two days, were roasted at 120°C for 20minutes. The roasted beans were hulled and ground to give the cocoa liquor. Atrained tasting panel (4 to 6 persons) evaluated the cocoa liquor samples, which weremaintained at 45°C in a water bath during the sensory sessions.
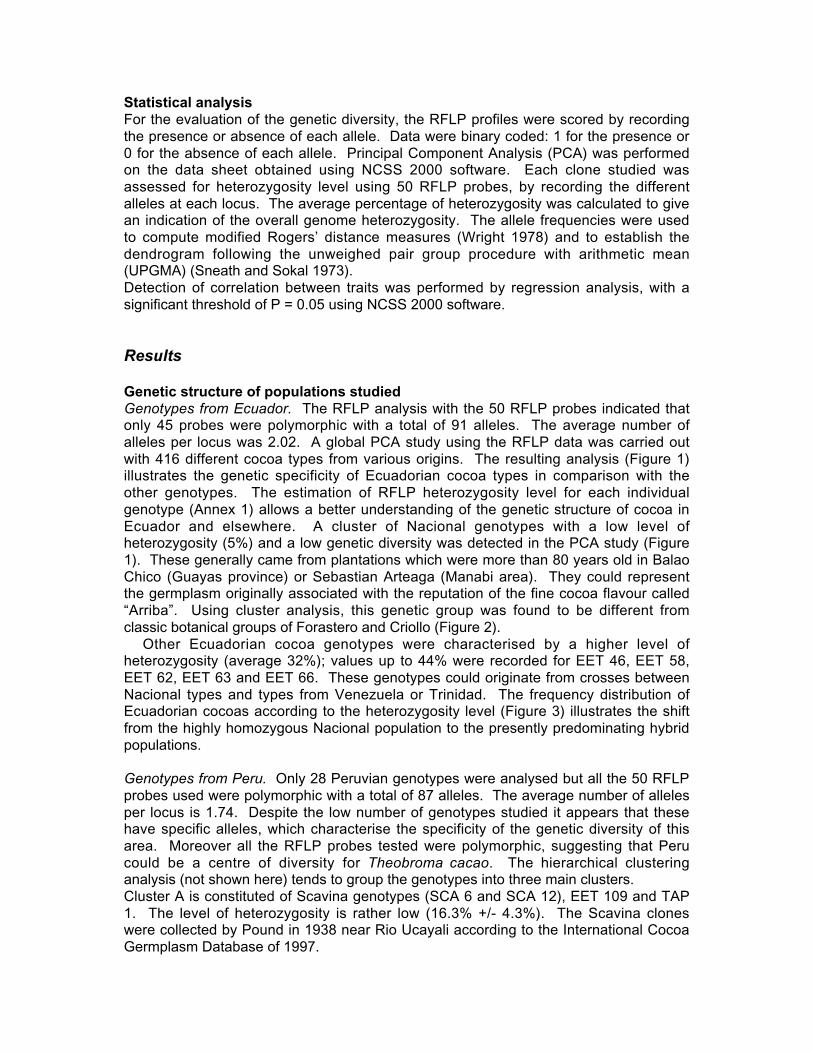
16 – 17 October 2000, Kota Kinabalu, Sabah, Malaysia 50
Statistical analysisFor the evaluation of the genetic diversity, the RFLP profiles were scored by recordingthe presence or absence of each allele. Data were binary coded: 1 for the presence or0 for the absence of each allele. Principal Component Analysis (PCA) was performedon the data sheet obtained using NCSS 2000 software. Each clone studied wasassessed for heterozygosity level using 50 RFLP probes, by recording the differentalleles at each locus. The average percentage of heterozygosity was calculated to givean indication of the overall genome heterozygosity. The allele frequencies were usedto compute modified Rogers’ distance measures (Wright 1978) and to establish thedendrogram following the unweighed pair group procedure with arithmetic mean(UPGMA) (Sneath and Sokal 1973).Detection of correlation between traits was performed by regression analysis, with asignificant threshold of P = 0.05 using NCSS 2000 software.
Results
Genetic structure of populations studiedGenotypes from Ecuador. The RFLP analysis with the 50 RFLP probes indicated thatonly 45 probes were polymorphic with a total of 91 alleles. The average number ofalleles per locus was 2.02. A global PCA study using the RFLP data was carried outwith 416 different cocoa types from various origins. The resulting analysis (Figure 1)illustrates the genetic specificity of Ecuadorian cocoa types in comparison with theother genotypes. The estimation of RFLP heterozygosity level for each individualgenotype (Annex 1) allows a better understanding of the genetic structure of cocoa inEcuador and elsewhere. A cluster of Nacional genotypes with a low level ofheterozygosity (5%) and a low genetic diversity was detected in the PCA study (Figure1). These generally came from plantations which were more than 80 years old in BalaoChico (Guayas province) or Sebastian Arteaga (Manabi area). They could representthe germplasm originally associated with the reputation of the fine cocoa flavour called“Arriba”. Using cluster analysis, this genetic group was found to be different fromclassic botanical groups of Forastero and Criollo (Figure 2).
Other Ecuadorian cocoa genotypes were characterised by a higher level ofheterozygosity (average 32%); values up to 44% were recorded for EET 46, EET 58,EET 62, EET 63 and EET 66. These genotypes could originate from crosses betweenNacional types and types from Venezuela or Trinidad. The frequency distribution ofEcuadorian cocoas according to the heterozygosity level (Figure 3) illustrates the shiftfrom the highly homozygous Nacional population to the presently predominating hybridpopulations.
Genotypes from Peru. Only 28 Peruvian genotypes were analysed but all the 50 RFLPprobes used were polymorphic with a total of 87 alleles. The average number of allelesper locus is 1.74. Despite the low number of genotypes studied it appears that thesehave specific alleles, which characterise the specificity of the genetic diversity of thisarea. Moreover all the RFLP probes tested were polymorphic, suggesting that Perucould be a centre of diversity for Theobroma cacao. The hierarchical clusteringanalysis (not shown here) tends to group the genotypes into three main clusters.Cluster A is constituted of Scavina genotypes (SCA 6 and SCA 12), EET 109 and TAP1. The level of heterozygosity is rather low (16.3% +/- 4.3%). The Scavina cloneswere collected by Pound in 1938 near Rio Ucayali according to the International CocoaGermplasm Database of 1997.
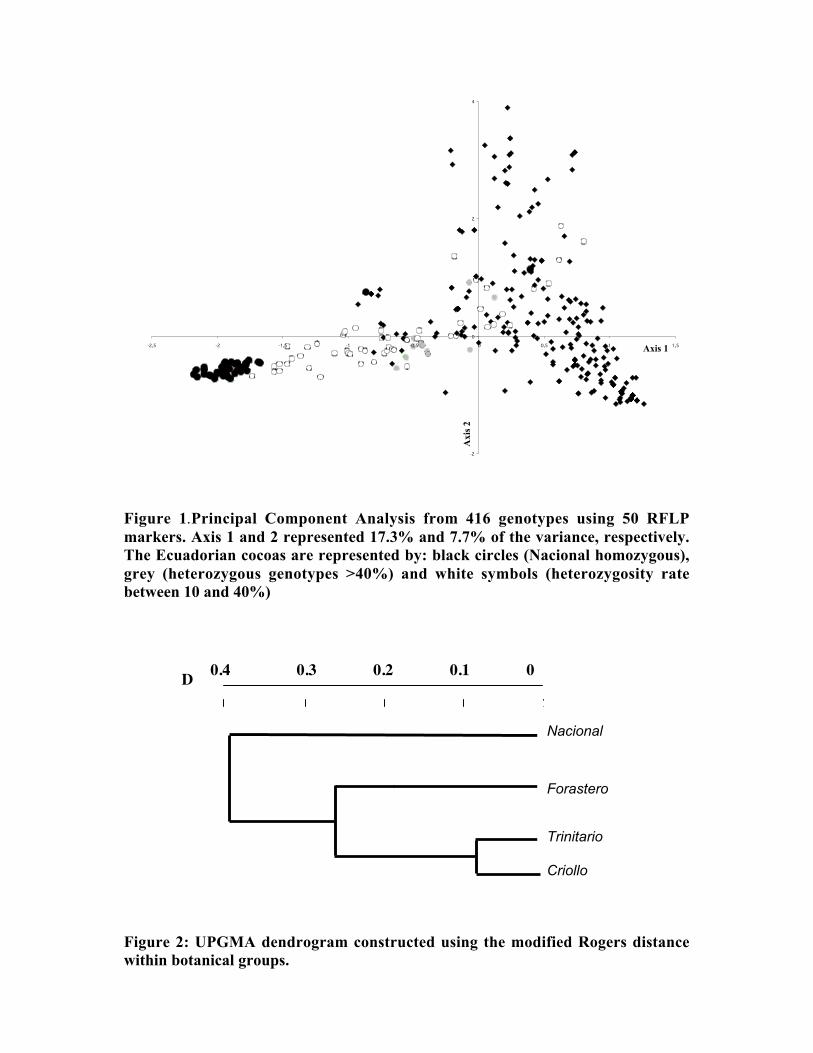
16 – 17 October 2000, Kota Kinabalu, Sabah, Malaysia 51
Figure 1.Principal Component Analysis from 416 genotypes using 50 RFLPmarkers. Axis 1 and 2 represented 17.3% and 7.7% of the variance, respectively.The Ecuadorian cocoas are represented by: black circles (Nacional homozygous),grey (heterozygous genotypes >40%) and white symbols (heterozygosity ratebetween 10 and 40%)
Figure 2: UPGMA dendrogram constructed using the modified Rogers distancewithin botanical groups.
-2
0
2
4
-2,5 -2 -1,5 -1 -0,5 0 0,5 1 1,5
Axi
s 2
Axis 1
9
Criollo
Nacional
Forastero
Trinitario
00.10.20.30.4D
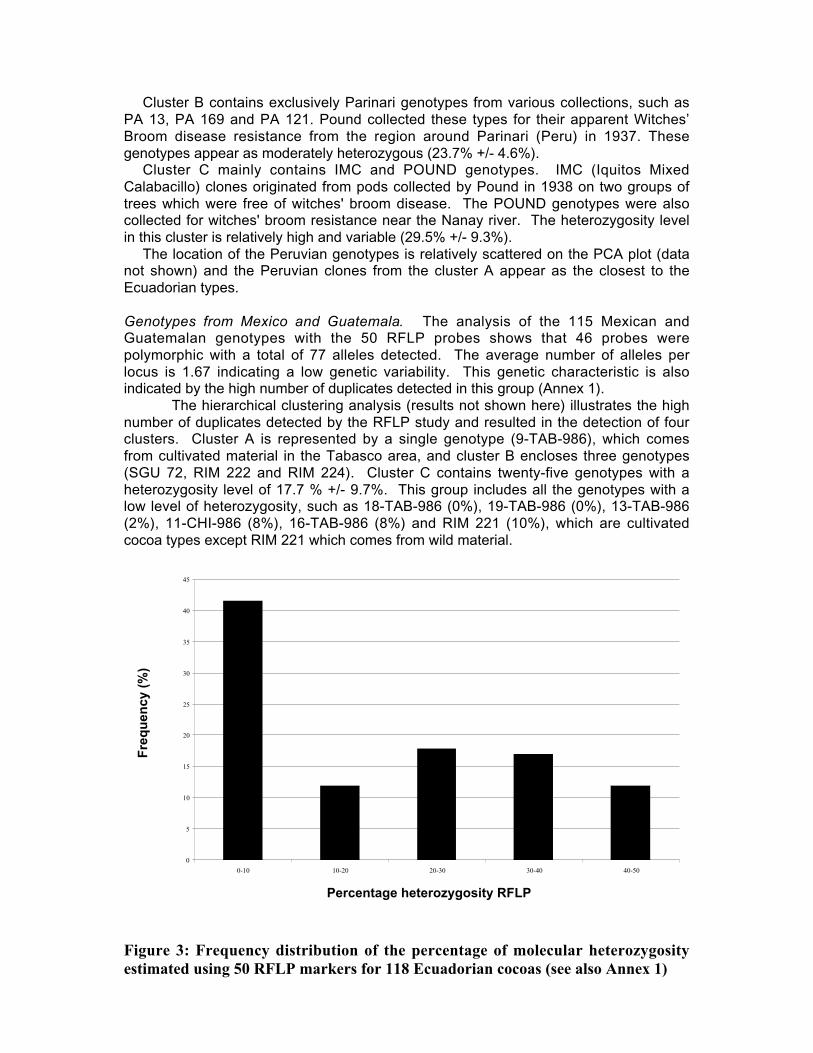
16 – 17 October 2000, Kota Kinabalu, Sabah, Malaysia 52
Cluster B contains exclusively Parinari genotypes from various collections, such asPA 13, PA 169 and PA 121. Pound collected these types for their apparent Witches’Broom disease resistance from the region around Parinari (Peru) in 1937. Thesegenotypes appear as moderately heterozygous (23.7% +/- 4.6%).
Cluster C mainly contains IMC and POUND genotypes. IMC (Iquitos MixedCalabacillo) clones originated from pods collected by Pound in 1938 on two groups oftrees which were free of witches' broom disease. The POUND genotypes were alsocollected for witches' broom resistance near the Nanay river. The heterozygosity levelin this cluster is relatively high and variable (29.5% +/- 9.3%).
The location of the Peruvian genotypes is relatively scattered on the PCA plot (datanot shown) and the Peruvian clones from the cluster A appear as the closest to theEcuadorian types.
Genotypes from Mexico and Guatemala. The analysis of the 115 Mexican andGuatemalan genotypes with the 50 RFLP probes shows that 46 probes werepolymorphic with a total of 77 alleles detected. The average number of alleles perlocus is 1.67 indicating a low genetic variability. This genetic characteristic is alsoindicated by the high number of duplicates detected in this group (Annex 1).
The hierarchical clustering analysis (results not shown here) illustrates the highnumber of duplicates detected by the RFLP study and resulted in the detection of fourclusters. Cluster A is represented by a single genotype (9-TAB-986), which comesfrom cultivated material in the Tabasco area, and cluster B encloses three genotypes(SGU 72, RIM 222 and RIM 224). Cluster C contains twenty-five genotypes with aheterozygosity level of 17.7 % +/- 9.7%. This group includes all the genotypes with alow level of heterozygosity, such as 18-TAB-986 (0%), 19-TAB-986 (0%), 13-TAB-986(2%), 11-CHI-986 (8%), 16-TAB-986 (8%) and RIM 221 (10%), which are cultivatedcocoa types except RIM 221 which comes from wild material.
Figure 3: Frequency distribution of the percentage of molecular heterozygosityestimated using 50 RFLP markers for 118 Ecuadorian cocoas (see also Annex 1)
0
5
10
15
20
25
30
35
40
45
0-10 10-20 20-30 30-40 40-50
Percentage heterozygosity RFLP
Fre
qu
ency
(%
)
16 – 17 October 2000, Kota Kinabalu, Sabah, Malaysia 53
Cluster D includes 86 genotypes with 51 duplicates showing a low genetic diversity.The average heterozygosity level in this cluster is 40.3% (+/-8.1%), reflecting the likelyhybrid status of these genotypes. Twelve out of the fifteen SGU types from Guatemalawere distributed in cluster D suggesting a close relationship between Mexican andGuatemalan genotypes.
Genotypes from Costa Rica. The RFLP analysis performed on the 73 Costa Ricangenotypes with the 50 RFLP probes shows that 44 probes were polymorphic with atotal of 85 alleles detected. The average number of alleles per locus is 1.93. Thehierarchical clustering analysis (not shown here) detected five clusters. Cluster A wascomposed of only two genotypes (CC 49 and CC 246). Twenty-four genotypes with anaverage heterozygosity level of 32.2% (+/- 8.5%) constitute cluster B. This groupincludes three UF genotypes (UF 676, UF 168 and UF 11) that cannot bedifferentiated. CC 225 is the only individual in cluster C; it is derived from the crossbetween Scavina 6 and ICS 1 from Trinidad. This genotype was obtained from theINIFAP collection and it is different from the genotype of the same name received fromthe CATIE collection, that belongs to group D. This result underlines the possibility ofthe mislabelling of this clone at INIFAP or at CATIE. Cluster D, with 17 genotypes, hasa heterozygosity level of 35.2% (+/- 5.4%), similar to cluster A. It includes a majority ofgenotypes originating from crosses between Costa Rican genotypes and introducedgenotypes, which would explain the high level of heterozygosity found.
Cluster E shows a lower heterozygosity level (23.8% +/- 11.3%) with individualvalues ranking from 0% (CC 33) to 50% (CC 264). This high variability in the levels ofheterozygosity suggests that this group is heterogeneous.
Agronomic and flavour studies on Ecuador cocoa typesArriba flavour evaluation. The first results of the sensory evaluation indicates that thecocoa trees with Arriba flavour (score ≥ 4) are neither distributed according to theirgeographic origin nor their genetic status. The Arriba clones were found from Manabi,El Oro, Los Rios and Guayas provinces independent of their heterozygosity level.These data suggest that Arriba flavour can be found either in “Nacional” or hybrid typesand that the Arriba flavour intensity is not related to the heterozygosity status of thegenotypes analysed. In the same way, none of the four provinces, where the cocoatrees came from, gave significant differences in Arriba flavour intensity.
Witches' broom resistance study. The significant coefficient of determination betweentrunk diameter and broom number (R_=0.53; p=0.000084) demonstrates a direct linkbetween the vigour of the genotype and the number of brooms produced (Table 1).The larger the trunk diameter, the higher the number of brooms. This physiologicalrelationship indicates that the disease impact appears to be more important onvigorous trees, such as hybrid forms than on homozygous trees from the pure Nacionalgroup.
A better estimate of the resistance to witches' broom disease in relation to treevigour could be given by the ratio of the number of brooms to the total number ofvegetative growing points of each genotype.
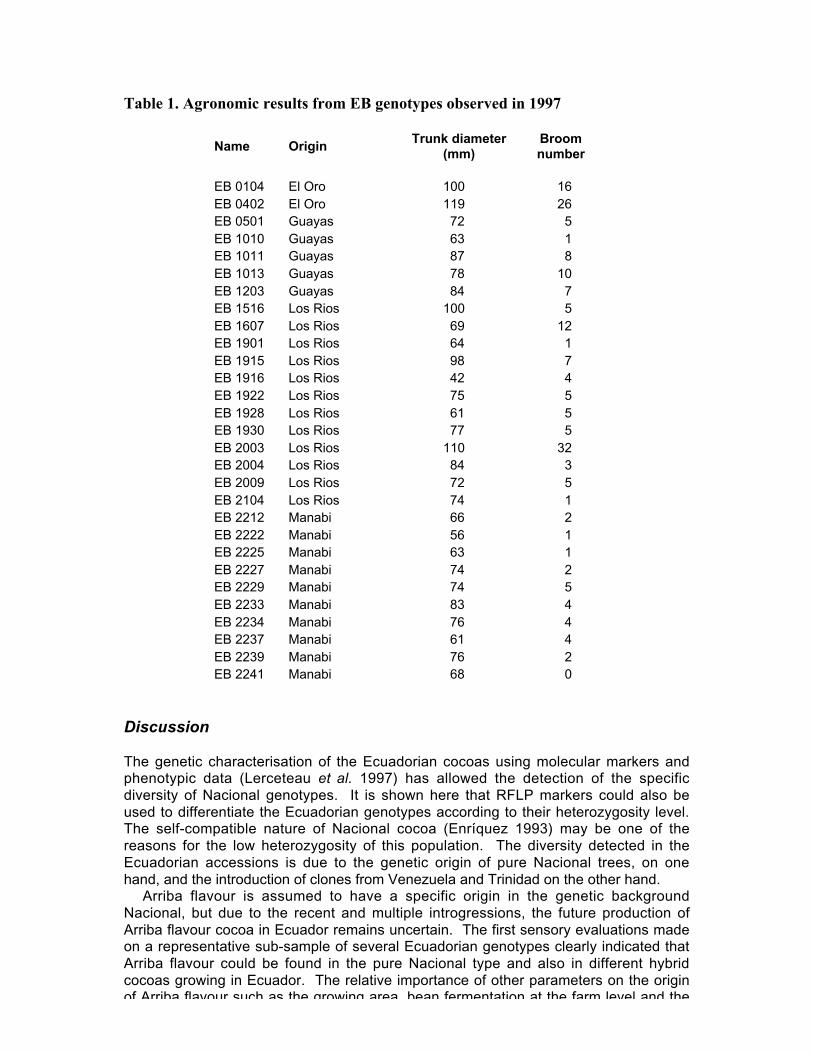
16 – 17 October 2000, Kota Kinabalu, Sabah, Malaysia 54
Table 1. Agronomic results from EB genotypes observed in 1997
Name OriginTrunk diameter
(mm)Broomnumber
EB 0104 El Oro 100 16EB 0402 El Oro 119 26EB 0501 Guayas 72 5EB 1010 Guayas 63 1EB 1011 Guayas 87 8EB 1013 Guayas 78 10EB 1203 Guayas 84 7EB 1516 Los Rios 100 5EB 1607 Los Rios 69 12EB 1901 Los Rios 64 1EB 1915 Los Rios 98 7EB 1916 Los Rios 42 4EB 1922 Los Rios 75 5EB 1928 Los Rios 61 5EB 1930 Los Rios 77 5EB 2003 Los Rios 110 32EB 2004 Los Rios 84 3EB 2009 Los Rios 72 5EB 2104 Los Rios 74 1EB 2212 Manabi 66 2EB 2222 Manabi 56 1EB 2225 Manabi 63 1EB 2227 Manabi 74 2EB 2229 Manabi 74 5EB 2233 Manabi 83 4EB 2234 Manabi 76 4EB 2237 Manabi 61 4EB 2239 Manabi 76 2EB 2241 Manabi 68 0
Discussion
The genetic characterisation of the Ecuadorian cocoas using molecular markers andphenotypic data (Lerceteau et al. 1997) has allowed the detection of the specificdiversity of Nacional genotypes. It is shown here that RFLP markers could also beused to differentiate the Ecuadorian genotypes according to their heterozygosity level.The self-compatible nature of Nacional cocoa (Enríquez 1993) may be one of thereasons for the low heterozygosity of this population. The diversity detected in theEcuadorian accessions is due to the genetic origin of pure Nacional trees, on onehand, and the introduction of clones from Venezuela and Trinidad on the other hand.
Arriba flavour is assumed to have a specific origin in the genetic backgroundNacional, but due to the recent and multiple introgressions, the future production ofArriba flavour cocoa in Ecuador remains uncertain. The first sensory evaluations madeon a representative sub-sample of several Ecuadorian genotypes clearly indicated thatArriba flavour could be found in the pure Nacional type and also in different hybridcocoas growing in Ecuador. The relative importance of other parameters on the originof Arriba flavour such as the growing area, bean fermentation at the farm level and theroasting in the factory remains unknown and has to be studied further.
16 – 17 October 2000, Kota Kinabalu, Sabah, Malaysia 55
Prospects for developing cocoa cultivars with an adequate level of resistance towitches' broom disease are underway in several countries (e.g. Brazil - Pires et al.1999 and Luz et al. 1999; Ecuador- Aragundi et al. 1987; United Kingdom – Wheeler1999; French Guiana - Lachenaud and Ducamp 1996). However, due to the lack of areproducible screening test, only field evaluations can be performed. In addition, fieldscreening showed a very large variation in disease symptoms (brooms per tree), withno genotypes exhibiting complete resistance to witches' broom infection and aresistance that is generally of a quantitative and incomplete nature. Only a fewgenotypes, such as SCA 6, gave limited evidence of resistance, but it seems that thisgenotype is inadequate under Ecuadorian conditions, certainly due to the strongaggressiveness of the pathogen strain. Other genotypes such as EET 233 have beenreported to have resistance in Ecuador (Aragundi et al. 1987).
Our results suggest that tree vigour could also be, at least partly, a component ofthe disease impact. For the time being, the multiplicity of the genetic, physiological andhost-pathogen interaction factors implicated in witches' broom disease suggest thatclonal selection is the best method to achieve short-term progress. However, theclones selected must be acceptable agronomically and quality-wise (possessing Arribaflavour).
References
Aragundi J., C. Suarez and G. Solozano. 1987. Evidence of resistance of cocoa clone EET 233to Moniliasis and witches' broom. Pages 479-483 in Proceedings of the 10th InternationalCocoa Research Conference, Santo Domingo, Dominican Republic, May 17-23, 1987:
Crouzillat D., E. Lerceteau, V. Pétiard, J. Morera, H. Rodriguez, D. Walker, W. Phillips, C.Ronning, R. Schnell, J. Osei and P. Fritz. 1996. Theobroma cacao L.: a genetic linkage mapand quantitative trait loci analysis. Theor Appl Genet 93: 205-214.
Enríquez G.A. 1993. Characteristics of cocoa “Nacional” of Ecuador. Pages 269-278 inProceedings of the International Workshop on Conservation, Characterisation and Utilisationof Cocoa Genetic Resources in the 21st century. Port of Spain, Trinidad. 13-17th
September. The Cocoa Research Unit, The University of the West Indies.Lachenaud P. and M. Ducamp. 1996. Characterisation and potential utilisation of wild cocoa
from French Guiana. INGENIC Newsletter 2: 8-9.Lerceteau E., J. Quiroz, J. Soria, S. Flipo, V. Pétiard and D. Crouzillat. 1997. Genetic
differentiation among Ecuadorian Theobroma cacao L. accessions using DNA andmorphological analyses. Euphytica 95: 77-87.
Luz E.D., S.D. Silva, P.S. Albuquerque, L.R. Pinto, K.P. Gramacho, U.V. Lopes, J.L. Pires,M.I. Brugnerotto and C.A. Paim. 1999. Evaluation of cocoa progenies in Bahia, Brazil forresistance to Crinipellis perniciosa. Pages 219-226 in Proceedings of the 12th InternationalCocoa Research Conference, Salvador-Bahia, Brazil.
Petithuguenin P. and G. Roche. 1995. Ecuador: the cocoa sector, results and prospects.Plantations Recherche, Développement 2: 22-26.
Pires J.L., W.R. Monteiro, E.D. Luz, S.D. Silva, L.R. Pinto, A. Figueira, K.P. Gramacho, U.V.Lopes, P.S. Albuquerque, M.M. Yamada, D.E. Ahnert and M.I. Brugnerotto. 1999. Cocoabreeding for witches' broom resistance at CEPEC, Bahia, Brazil. Pages 91-102 i nProceedings of the International Workshop on the Contribution of Disease Resistance toCocoa Variety Improvement. November 24-26, 1996, Salvador-Bahia, Brazil, INGENIC1999, United Kingdom.
Sneath P.H.A. and R.R. Sokal. 1973. Numerical taxonomy. Freeman, San Francisco, UnitedStates of America.
Van der Vossen, H. 1997. Strategies of variety improvement in cocoa with emphasis on durabledisease resistance. Pages 23-32 in Proceedings of the International Workshop on theContribution of Disease Resistance to Cocoa Variety Improvement. November 24-26, 1996,Salvador-Bahia, Brazil, INGENIC 1999, United Kingdom.
16 – 17 October 2000, Kota Kinabalu, Sabah, Malaysia 56
Wheeler B.E. 1999. Host-pathogen interactions in witches' broom disease of cocoa. Pages 83-90 in Proceedings of the International Workshop on the Contribution of Disease Resistanceto Cocoa Variety Improvement. November 24-26, 1996, Salvador-Bahia, Brazil, INGENIC1999, United Kingdom.
Wright S. 1978. Evolution and the genetics of populations, vol 4: variability within and amongnatural populations. University of Chicago Press, Chicago.
Zadoks J.C. 1997. Disease resistance testing in cocoa. Pages 17-22 in Proceedings of theInternational Workshop on the Contribution of Disease Resistance to Cocoa VarietyImprovement. November 24-26, 1996, Salvador-Bahia, Brazil, INGENIC 1999, UnitedKingdom.
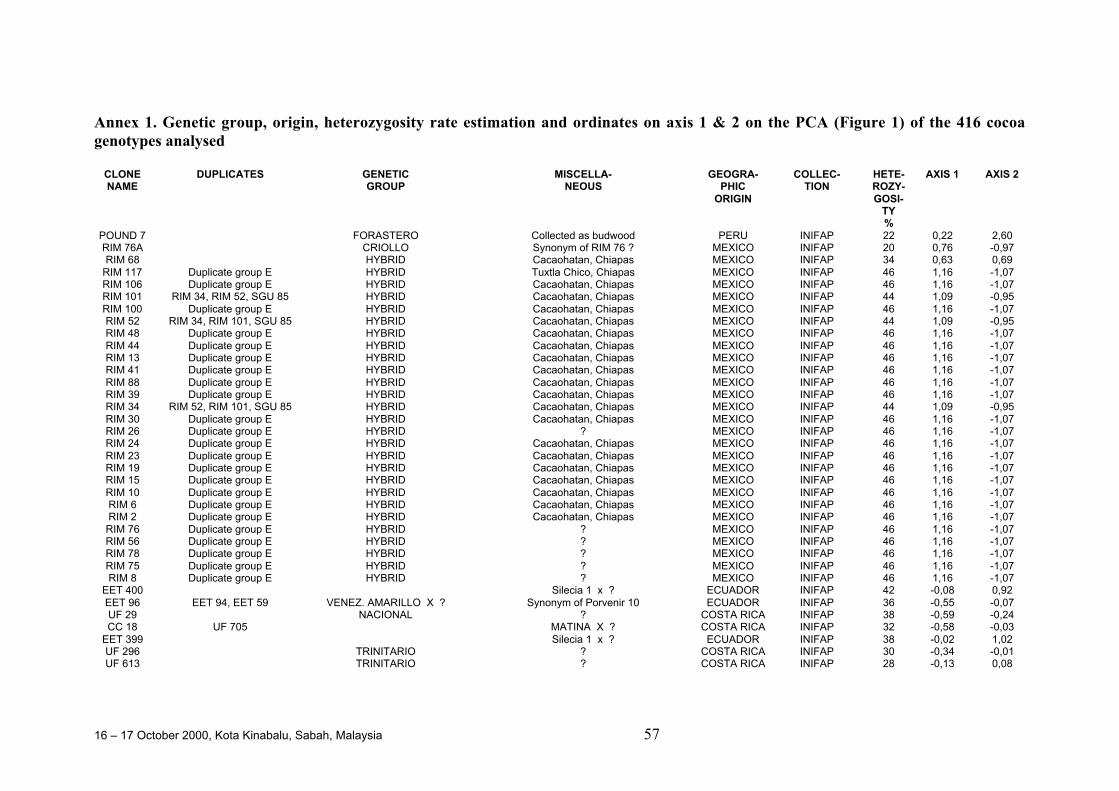
16 – 17 October 2000, Kota Kinabalu, Sabah, Malaysia 57
Annex 1. Genetic group, origin, heterozygosity rate estimation and ordinates on axis 1 & 2 on the PCA (Figure 1) of the 416 cocoagenotypes analysed
CLONENAME
DUPLICATES GENETICGROUP
MISCELLA-NEOUS
GEOGRA-PHIC
ORIGIN
COLLEC-TION
HETE-ROZY-GOSI-
TY%
AXIS 1 AXIS 2
POUND 7 FORASTERO Collected as budwood PERU INIFAP 22 0,22 2,60RIM 76A CRIOLLO Synonym of RIM 76 ? MEXICO INIFAP 20 0,76 -0,97RIM 68 HYBRID Cacaohatan, Chiapas MEXICO INIFAP 34 0,63 0,69
RIM 117 Duplicate group E HYBRID Tuxtla Chico, Chiapas MEXICO INIFAP 46 1,16 -1,07RIM 106 Duplicate group E HYBRID Cacaohatan, Chiapas MEXICO INIFAP 46 1,16 -1,07RIM 101 RIM 34, RIM 52, SGU 85 HYBRID Cacaohatan, Chiapas MEXICO INIFAP 44 1,09 -0,95RIM 100 Duplicate group E HYBRID Cacaohatan, Chiapas MEXICO INIFAP 46 1,16 -1,07RIM 52 RIM 34, RIM 101, SGU 85 HYBRID Cacaohatan, Chiapas MEXICO INIFAP 44 1,09 -0,95RIM 48 Duplicate group E HYBRID Cacaohatan, Chiapas MEXICO INIFAP 46 1,16 -1,07RIM 44 Duplicate group E HYBRID Cacaohatan, Chiapas MEXICO INIFAP 46 1,16 -1,07RIM 13 Duplicate group E HYBRID Cacaohatan, Chiapas MEXICO INIFAP 46 1,16 -1,07RIM 41 Duplicate group E HYBRID Cacaohatan, Chiapas MEXICO INIFAP 46 1,16 -1,07RIM 88 Duplicate group E HYBRID Cacaohatan, Chiapas MEXICO INIFAP 46 1,16 -1,07RIM 39 Duplicate group E HYBRID Cacaohatan, Chiapas MEXICO INIFAP 46 1,16 -1,07RIM 34 RIM 52, RIM 101, SGU 85 HYBRID Cacaohatan, Chiapas MEXICO INIFAP 44 1,09 -0,95RIM 30 Duplicate group E HYBRID Cacaohatan, Chiapas MEXICO INIFAP 46 1,16 -1,07RIM 26 Duplicate group E HYBRID ? MEXICO INIFAP 46 1,16 -1,07RIM 24 Duplicate group E HYBRID Cacaohatan, Chiapas MEXICO INIFAP 46 1,16 -1,07RIM 23 Duplicate group E HYBRID Cacaohatan, Chiapas MEXICO INIFAP 46 1,16 -1,07RIM 19 Duplicate group E HYBRID Cacaohatan, Chiapas MEXICO INIFAP 46 1,16 -1,07RIM 15 Duplicate group E HYBRID Cacaohatan, Chiapas MEXICO INIFAP 46 1,16 -1,07RIM 10 Duplicate group E HYBRID Cacaohatan, Chiapas MEXICO INIFAP 46 1,16 -1,07RIM 6 Duplicate group E HYBRID Cacaohatan, Chiapas MEXICO INIFAP 46 1,16 -1,07RIM 2 Duplicate group E HYBRID Cacaohatan, Chiapas MEXICO INIFAP 46 1,16 -1,07RIM 76 Duplicate group E HYBRID ? MEXICO INIFAP 46 1,16 -1,07RIM 56 Duplicate group E HYBRID ? MEXICO INIFAP 46 1,16 -1,07RIM 78 Duplicate group E HYBRID ? MEXICO INIFAP 46 1,16 -1,07RIM 75 Duplicate group E HYBRID ? MEXICO INIFAP 46 1,16 -1,07RIM 8 Duplicate group E HYBRID ? MEXICO INIFAP 46 1,16 -1,07
EET 400 Silecia 1 x ? ECUADOR INIFAP 42 -0,08 0,92EET 96 EET 94, EET 59 VENEZ. AMARILLO X ? Synonym of Porvenir 10 ECUADOR INIFAP 36 -0,55 -0,07UF 29 NACIONAL ? COSTA RICA INIFAP 38 -0,59 -0,24CC 18 UF 705 MATINA X ? COSTA RICA INIFAP 32 -0,58 -0,03
EET 399 Silecia 1 x ? ECUADOR INIFAP 38 -0,02 1,02UF 296 TRINITARIO ? COSTA RICA INIFAP 30 -0,34 -0,01UF 613 TRINITARIO ? COSTA RICA INIFAP 28 -0,13 0,08
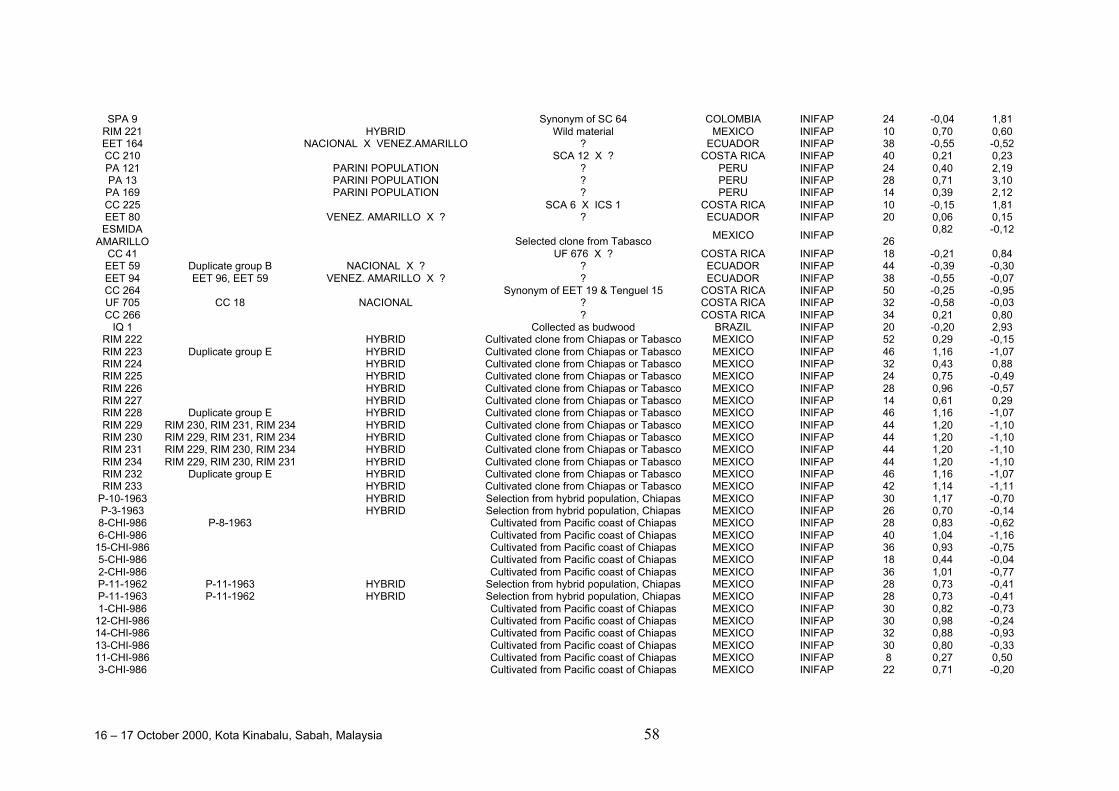
16 – 17 October 2000, Kota Kinabalu, Sabah, Malaysia 58
SPA 9 Synonym of SC 64 COLOMBIA INIFAP 24 -0,04 1,81RIM 221 HYBRID Wild material MEXICO INIFAP 10 0,70 0,60EET 164 NACIONAL X VENEZ.AMARILLO ? ECUADOR INIFAP 38 -0,55 -0,52CC 210 SCA 12 X ? COSTA RICA INIFAP 40 0,21 0,23PA 121 PARINI POPULATION ? PERU INIFAP 24 0,40 2,19PA 13 PARINI POPULATION ? PERU INIFAP 28 0,71 3,10PA 169 PARINI POPULATION ? PERU INIFAP 14 0,39 2,12CC 225 SCA 6 X ICS 1 COSTA RICA INIFAP 10 -0,15 1,81EET 80 VENEZ. AMARILLO X ? ? ECUADOR INIFAP 20 0,06 0,15ESMIDA
AMARILLO
Selected clone from TabascoMEXICO INIFAP
260,82 -0,12
CC 41 UF 676 X ? COSTA RICA INIFAP 18 -0,21 0,84EET 59 Duplicate group B NACIONAL X ? ? ECUADOR INIFAP 44 -0,39 -0,30EET 94 EET 96, EET 59 VENEZ. AMARILLO X ? ? ECUADOR INIFAP 38 -0,55 -0,07CC 264 Synonym of EET 19 & Tenguel 15 COSTA RICA INIFAP 50 -0,25 -0,95UF 705 CC 18 NACIONAL ? COSTA RICA INIFAP 32 -0,58 -0,03CC 266 ? COSTA RICA INIFAP 34 0,21 0,80
IQ 1 Collected as budwood BRAZIL INIFAP 20 -0,20 2,93RIM 222 HYBRID Cultivated clone from Chiapas or Tabasco MEXICO INIFAP 52 0,29 -0,15RIM 223 Duplicate group E HYBRID Cultivated clone from Chiapas or Tabasco MEXICO INIFAP 46 1,16 -1,07RIM 224 HYBRID Cultivated clone from Chiapas or Tabasco MEXICO INIFAP 32 0,43 0,88RIM 225 HYBRID Cultivated clone from Chiapas or Tabasco MEXICO INIFAP 24 0,75 -0,49RIM 226 HYBRID Cultivated clone from Chiapas or Tabasco MEXICO INIFAP 28 0,96 -0,57RIM 227 HYBRID Cultivated clone from Chiapas or Tabasco MEXICO INIFAP 14 0,61 0,29RIM 228 Duplicate group E HYBRID Cultivated clone from Chiapas or Tabasco MEXICO INIFAP 46 1,16 -1,07RIM 229 RIM 230, RIM 231, RIM 234 HYBRID Cultivated clone from Chiapas or Tabasco MEXICO INIFAP 44 1,20 -1,10RIM 230 RIM 229, RIM 231, RIM 234 HYBRID Cultivated clone from Chiapas or Tabasco MEXICO INIFAP 44 1,20 -1,10RIM 231 RIM 229, RIM 230, RIM 234 HYBRID Cultivated clone from Chiapas or Tabasco MEXICO INIFAP 44 1,20 -1,10RIM 234 RIM 229, RIM 230, RIM 231 HYBRID Cultivated clone from Chiapas or Tabasco MEXICO INIFAP 44 1,20 -1,10RIM 232 Duplicate group E HYBRID Cultivated clone from Chiapas or Tabasco MEXICO INIFAP 46 1,16 -1,07RIM 233 HYBRID Cultivated clone from Chiapas or Tabasco MEXICO INIFAP 42 1,14 -1,11
P-10-1963 HYBRID Selection from hybrid population, Chiapas MEXICO INIFAP 30 1,17 -0,70P-3-1963 HYBRID Selection from hybrid population, Chiapas MEXICO INIFAP 26 0,70 -0,148-CHI-986 P-8-1963 Cultivated from Pacific coast of Chiapas MEXICO INIFAP 28 0,83 -0,626-CHI-986 Cultivated from Pacific coast of Chiapas MEXICO INIFAP 40 1,04 -1,16
15-CHI-986 Cultivated from Pacific coast of Chiapas MEXICO INIFAP 36 0,93 -0,755-CHI-986 Cultivated from Pacific coast of Chiapas MEXICO INIFAP 18 0,44 -0,042-CHI-986 Cultivated from Pacific coast of Chiapas MEXICO INIFAP 36 1,01 -0,77P-11-1962 P-11-1963 HYBRID Selection from hybrid population, Chiapas MEXICO INIFAP 28 0,73 -0,41P-11-1963 P-11-1962 HYBRID Selection from hybrid population, Chiapas MEXICO INIFAP 28 0,73 -0,411-CHI-986 Cultivated from Pacific coast of Chiapas MEXICO INIFAP 30 0,82 -0,73
12-CHI-986 Cultivated from Pacific coast of Chiapas MEXICO INIFAP 30 0,98 -0,2414-CHI-986 Cultivated from Pacific coast of Chiapas MEXICO INIFAP 32 0,88 -0,9313-CHI-986 Cultivated from Pacific coast of Chiapas MEXICO INIFAP 30 0,80 -0,3311-CHI-986 Cultivated from Pacific coast of Chiapas MEXICO INIFAP 8 0,27 0,503-CHI-986 Cultivated from Pacific coast of Chiapas MEXICO INIFAP 22 0,71 -0,20
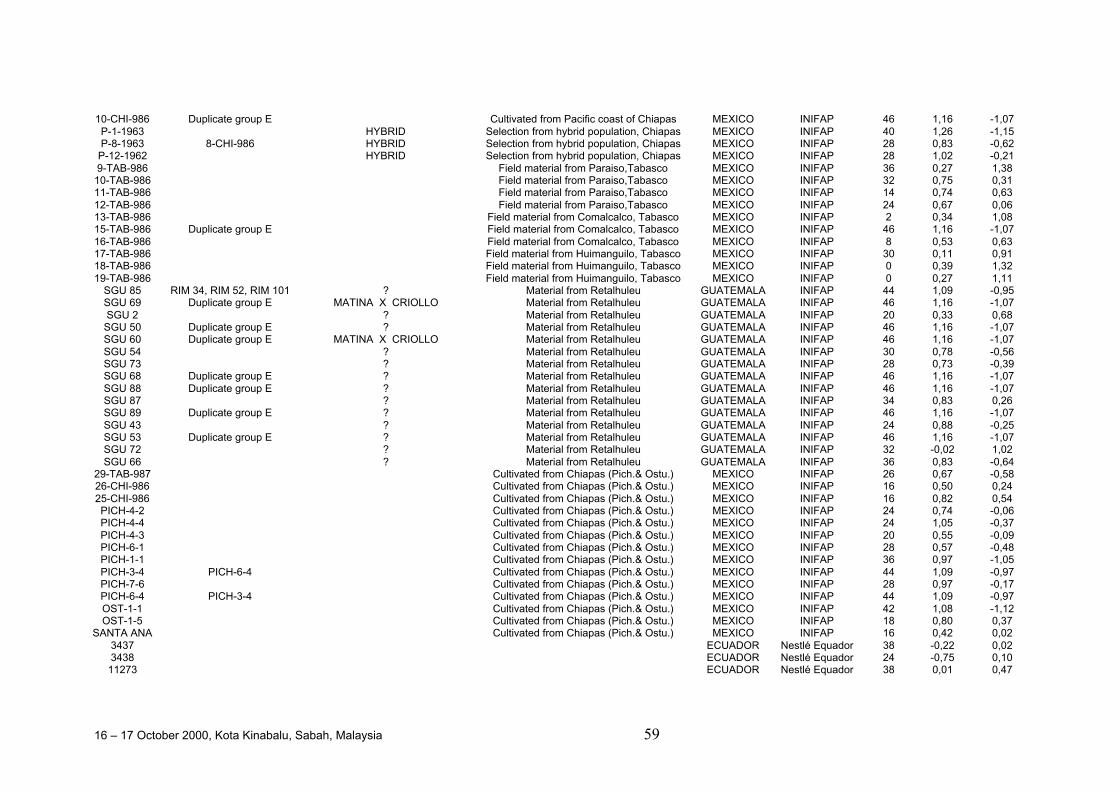
16 – 17 October 2000, Kota Kinabalu, Sabah, Malaysia 59
10-CHI-986 Duplicate group E Cultivated from Pacific coast of Chiapas MEXICO INIFAP 46 1,16 -1,07P-1-1963 HYBRID Selection from hybrid population, Chiapas MEXICO INIFAP 40 1,26 -1,15P-8-1963 8-CHI-986 HYBRID Selection from hybrid population, Chiapas MEXICO INIFAP 28 0,83 -0,62P-12-1962 HYBRID Selection from hybrid population, Chiapas MEXICO INIFAP 28 1,02 -0,219-TAB-986 Field material from Paraiso,Tabasco MEXICO INIFAP 36 0,27 1,3810-TAB-986 Field material from Paraiso,Tabasco MEXICO INIFAP 32 0,75 0,3111-TAB-986 Field material from Paraiso,Tabasco MEXICO INIFAP 14 0,74 0,6312-TAB-986 Field material from Paraiso,Tabasco MEXICO INIFAP 24 0,67 0,0613-TAB-986 Field material from Comalcalco, Tabasco MEXICO INIFAP 2 0,34 1,0815-TAB-986 Duplicate group E Field material from Comalcalco, Tabasco MEXICO INIFAP 46 1,16 -1,0716-TAB-986 Field material from Comalcalco, Tabasco MEXICO INIFAP 8 0,53 0,6317-TAB-986 Field material from Huimanguilo, Tabasco MEXICO INIFAP 30 0,11 0,9118-TAB-986 Field material from Huimanguilo, Tabasco MEXICO INIFAP 0 0,39 1,3219-TAB-986 Field material from Huimanguilo, Tabasco MEXICO INIFAP 0 0,27 1,11
SGU 85 RIM 34, RIM 52, RIM 101 ? Material from Retalhuleu GUATEMALA INIFAP 44 1,09 -0,95SGU 69 Duplicate group E MATINA X CRIOLLO Material from Retalhuleu GUATEMALA INIFAP 46 1,16 -1,07SGU 2 ? Material from Retalhuleu GUATEMALA INIFAP 20 0,33 0,68SGU 50 Duplicate group E ? Material from Retalhuleu GUATEMALA INIFAP 46 1,16 -1,07SGU 60 Duplicate group E MATINA X CRIOLLO Material from Retalhuleu GUATEMALA INIFAP 46 1,16 -1,07SGU 54 ? Material from Retalhuleu GUATEMALA INIFAP 30 0,78 -0,56SGU 73 ? Material from Retalhuleu GUATEMALA INIFAP 28 0,73 -0,39SGU 68 Duplicate group E ? Material from Retalhuleu GUATEMALA INIFAP 46 1,16 -1,07SGU 88 Duplicate group E ? Material from Retalhuleu GUATEMALA INIFAP 46 1,16 -1,07SGU 87 ? Material from Retalhuleu GUATEMALA INIFAP 34 0,83 0,26SGU 89 Duplicate group E ? Material from Retalhuleu GUATEMALA INIFAP 46 1,16 -1,07SGU 43 ? Material from Retalhuleu GUATEMALA INIFAP 24 0,88 -0,25SGU 53 Duplicate group E ? Material from Retalhuleu GUATEMALA INIFAP 46 1,16 -1,07SGU 72 ? Material from Retalhuleu GUATEMALA INIFAP 32 -0,02 1,02SGU 66 ? Material from Retalhuleu GUATEMALA INIFAP 36 0,83 -0,64
29-TAB-987 Cultivated from Chiapas (Pich.& Ostu.) MEXICO INIFAP 26 0,67 -0,5826-CHI-986 Cultivated from Chiapas (Pich.& Ostu.) MEXICO INIFAP 16 0,50 0,2425-CHI-986 Cultivated from Chiapas (Pich.& Ostu.) MEXICO INIFAP 16 0,82 0,54PICH-4-2 Cultivated from Chiapas (Pich.& Ostu.) MEXICO INIFAP 24 0,74 -0,06PICH-4-4 Cultivated from Chiapas (Pich.& Ostu.) MEXICO INIFAP 24 1,05 -0,37PICH-4-3 Cultivated from Chiapas (Pich.& Ostu.) MEXICO INIFAP 20 0,55 -0,09PICH-6-1 Cultivated from Chiapas (Pich.& Ostu.) MEXICO INIFAP 28 0,57 -0,48PICH-1-1 Cultivated from Chiapas (Pich.& Ostu.) MEXICO INIFAP 36 0,97 -1,05PICH-3-4 PICH-6-4 Cultivated from Chiapas (Pich.& Ostu.) MEXICO INIFAP 44 1,09 -0,97PICH-7-6 Cultivated from Chiapas (Pich.& Ostu.) MEXICO INIFAP 28 0,97 -0,17PICH-6-4 PICH-3-4 Cultivated from Chiapas (Pich.& Ostu.) MEXICO INIFAP 44 1,09 -0,97OST-1-1 Cultivated from Chiapas (Pich.& Ostu.) MEXICO INIFAP 42 1,08 -1,12OST-1-5 Cultivated from Chiapas (Pich.& Ostu.) MEXICO INIFAP 18 0,80 0,37
SANTA ANA Cultivated from Chiapas (Pich.& Ostu.) MEXICO INIFAP 16 0,42 0,023437 ECUADOR Nestlé Equador 38 -0,22 0,023438 ECUADOR Nestlé Equador 24 -0,75 0,1011273 ECUADOR Nestlé Equador 38 0,01 0,47
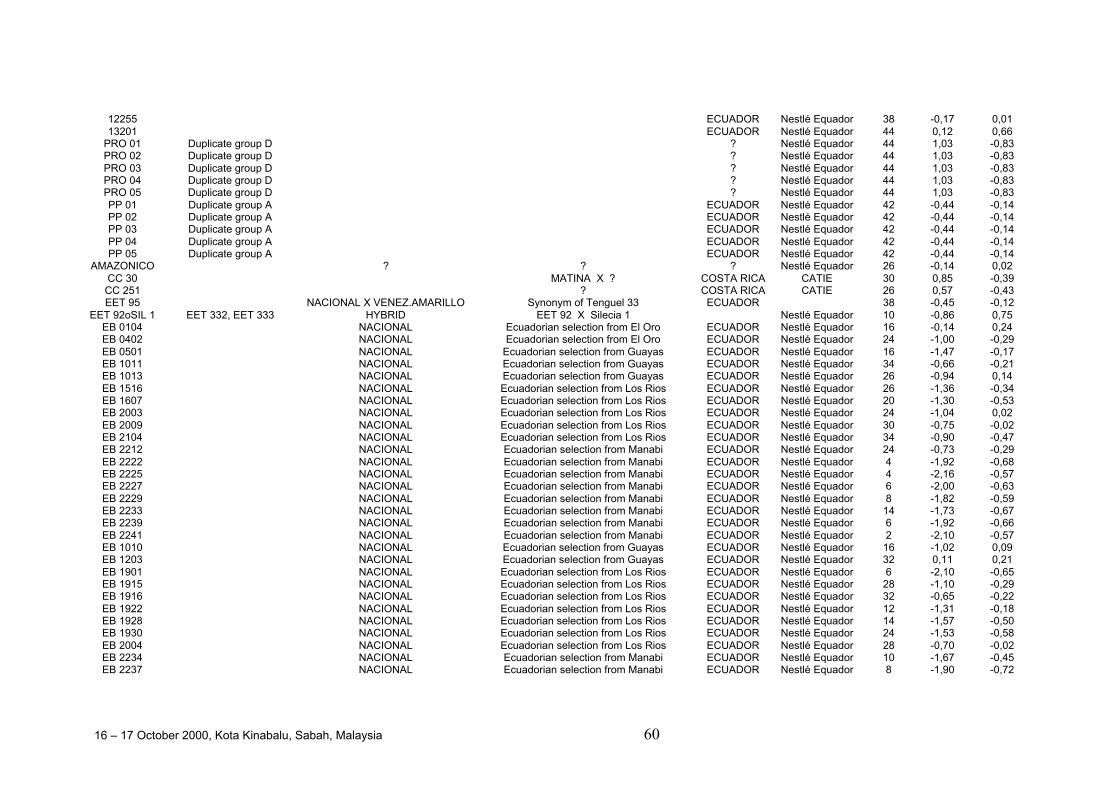
16 – 17 October 2000, Kota Kinabalu, Sabah, Malaysia 60
12255 ECUADOR Nestlé Equador 38 -0,17 0,0113201 ECUADOR Nestlé Equador 44 0,12 0,66
PRO 01 Duplicate group D ? Nestlé Equador 44 1,03 -0,83PRO 02 Duplicate group D ? Nestlé Equador 44 1,03 -0,83PRO 03 Duplicate group D ? Nestlé Equador 44 1,03 -0,83PRO 04 Duplicate group D ? Nestlé Equador 44 1,03 -0,83PRO 05 Duplicate group D ? Nestlé Equador 44 1,03 -0,83PP 01 Duplicate group A ECUADOR Nestlé Equador 42 -0,44 -0,14PP 02 Duplicate group A ECUADOR Nestlé Equador 42 -0,44 -0,14PP 03 Duplicate group A ECUADOR Nestlé Equador 42 -0,44 -0,14PP 04 Duplicate group A ECUADOR Nestlé Equador 42 -0,44 -0,14PP 05 Duplicate group A ECUADOR Nestlé Equador 42 -0,44 -0,14
AMAZONICO ? ? ? Nestlé Equador 26 -0,14 0,02CC 30 MATINA X ? COSTA RICA CATIE 30 0,85 -0,39CC 251 ? COSTA RICA CATIE 26 0,57 -0,43EET 95 NACIONAL X VENEZ.AMARILLO Synonym of Tenguel 33 ECUADOR 38 -0,45 -0,12
EET 92oSIL 1 EET 332, EET 333 HYBRID EET 92 X Silecia 1 Nestlé Equador 10 -0,86 0,75EB 0104 NACIONAL Ecuadorian selection from El Oro ECUADOR Nestlé Equador 16 -0,14 0,24EB 0402 NACIONAL Ecuadorian selection from El Oro ECUADOR Nestlé Equador 24 -1,00 -0,29EB 0501 NACIONAL Ecuadorian selection from Guayas ECUADOR Nestlé Equador 16 -1,47 -0,17EB 1011 NACIONAL Ecuadorian selection from Guayas ECUADOR Nestlé Equador 34 -0,66 -0,21EB 1013 NACIONAL Ecuadorian selection from Guayas ECUADOR Nestlé Equador 26 -0,94 0,14EB 1516 NACIONAL Ecuadorian selection from Los Rios ECUADOR Nestlé Equador 26 -1,36 -0,34EB 1607 NACIONAL Ecuadorian selection from Los Rios ECUADOR Nestlé Equador 20 -1,30 -0,53EB 2003 NACIONAL Ecuadorian selection from Los Rios ECUADOR Nestlé Equador 24 -1,04 0,02EB 2009 NACIONAL Ecuadorian selection from Los Rios ECUADOR Nestlé Equador 30 -0,75 -0,02EB 2104 NACIONAL Ecuadorian selection from Los Rios ECUADOR Nestlé Equador 34 -0,90 -0,47EB 2212 NACIONAL Ecuadorian selection from Manabi ECUADOR Nestlé Equador 24 -0,73 -0,29EB 2222 NACIONAL Ecuadorian selection from Manabi ECUADOR Nestlé Equador 4 -1,92 -0,68EB 2225 NACIONAL Ecuadorian selection from Manabi ECUADOR Nestlé Equador 4 -2,16 -0,57EB 2227 NACIONAL Ecuadorian selection from Manabi ECUADOR Nestlé Equador 6 -2,00 -0,63EB 2229 NACIONAL Ecuadorian selection from Manabi ECUADOR Nestlé Equador 8 -1,82 -0,59EB 2233 NACIONAL Ecuadorian selection from Manabi ECUADOR Nestlé Equador 14 -1,73 -0,67EB 2239 NACIONAL Ecuadorian selection from Manabi ECUADOR Nestlé Equador 6 -1,92 -0,66EB 2241 NACIONAL Ecuadorian selection from Manabi ECUADOR Nestlé Equador 2 -2,10 -0,57EB 1010 NACIONAL Ecuadorian selection from Guayas ECUADOR Nestlé Equador 16 -1,02 0,09EB 1203 NACIONAL Ecuadorian selection from Guayas ECUADOR Nestlé Equador 32 0,11 0,21EB 1901 NACIONAL Ecuadorian selection from Los Rios ECUADOR Nestlé Equador 6 -2,10 -0,65EB 1915 NACIONAL Ecuadorian selection from Los Rios ECUADOR Nestlé Equador 28 -1,10 -0,29EB 1916 NACIONAL Ecuadorian selection from Los Rios ECUADOR Nestlé Equador 32 -0,65 -0,22EB 1922 NACIONAL Ecuadorian selection from Los Rios ECUADOR Nestlé Equador 12 -1,31 -0,18EB 1928 NACIONAL Ecuadorian selection from Los Rios ECUADOR Nestlé Equador 14 -1,57 -0,50EB 1930 NACIONAL Ecuadorian selection from Los Rios ECUADOR Nestlé Equador 24 -1,53 -0,58EB 2004 NACIONAL Ecuadorian selection from Los Rios ECUADOR Nestlé Equador 28 -0,70 -0,02EB 2234 NACIONAL Ecuadorian selection from Manabi ECUADOR Nestlé Equador 10 -1,67 -0,45EB 2237 NACIONAL Ecuadorian selection from Manabi ECUADOR Nestlé Equador 8 -1,90 -0,72
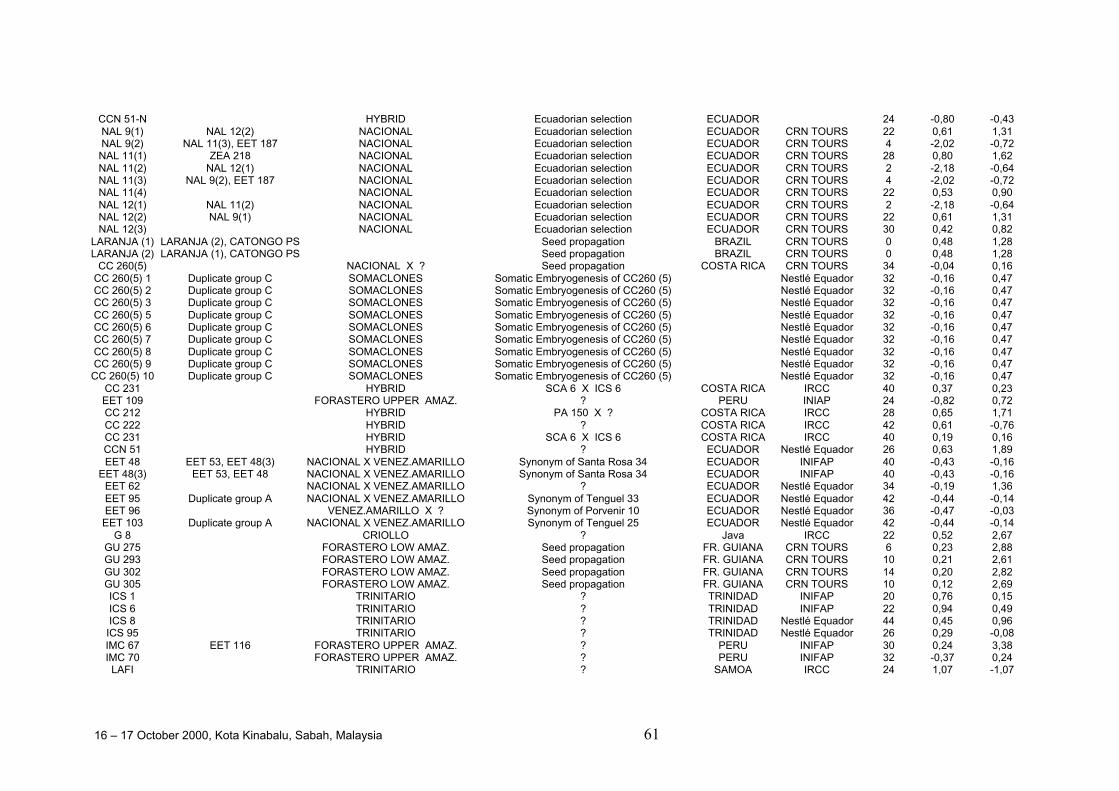
16 – 17 October 2000, Kota Kinabalu, Sabah, Malaysia 61
CCN 51-N HYBRID Ecuadorian selection ECUADOR 24 -0,80 -0,43NAL 9(1) NAL 12(2) NACIONAL Ecuadorian selection ECUADOR CRN TOURS 22 0,61 1,31NAL 9(2) NAL 11(3), EET 187 NACIONAL Ecuadorian selection ECUADOR CRN TOURS 4 -2,02 -0,72NAL 11(1) ZEA 218 NACIONAL Ecuadorian selection ECUADOR CRN TOURS 28 0,80 1,62NAL 11(2) NAL 12(1) NACIONAL Ecuadorian selection ECUADOR CRN TOURS 2 -2,18 -0,64NAL 11(3) NAL 9(2), EET 187 NACIONAL Ecuadorian selection ECUADOR CRN TOURS 4 -2,02 -0,72NAL 11(4) NACIONAL Ecuadorian selection ECUADOR CRN TOURS 22 0,53 0,90NAL 12(1) NAL 11(2) NACIONAL Ecuadorian selection ECUADOR CRN TOURS 2 -2,18 -0,64NAL 12(2) NAL 9(1) NACIONAL Ecuadorian selection ECUADOR CRN TOURS 22 0,61 1,31NAL 12(3) NACIONAL Ecuadorian selection ECUADOR CRN TOURS 30 0,42 0,82
LARANJA (1) LARANJA (2), CATONGO PS Seed propagation BRAZIL CRN TOURS 0 0,48 1,28LARANJA (2) LARANJA (1), CATONGO PS Seed propagation BRAZIL CRN TOURS 0 0,48 1,28
CC 260(5) NACIONAL X ? Seed propagation COSTA RICA CRN TOURS 34 -0,04 0,16CC 260(5) 1 Duplicate group C SOMACLONES Somatic Embryogenesis of CC260 (5) Nestlé Equador 32 -0,16 0,47CC 260(5) 2 Duplicate group C SOMACLONES Somatic Embryogenesis of CC260 (5) Nestlé Equador 32 -0,16 0,47CC 260(5) 3 Duplicate group C SOMACLONES Somatic Embryogenesis of CC260 (5) Nestlé Equador 32 -0,16 0,47CC 260(5) 5 Duplicate group C SOMACLONES Somatic Embryogenesis of CC260 (5) Nestlé Equador 32 -0,16 0,47CC 260(5) 6 Duplicate group C SOMACLONES Somatic Embryogenesis of CC260 (5) Nestlé Equador 32 -0,16 0,47CC 260(5) 7 Duplicate group C SOMACLONES Somatic Embryogenesis of CC260 (5) Nestlé Equador 32 -0,16 0,47CC 260(5) 8 Duplicate group C SOMACLONES Somatic Embryogenesis of CC260 (5) Nestlé Equador 32 -0,16 0,47CC 260(5) 9 Duplicate group C SOMACLONES Somatic Embryogenesis of CC260 (5) Nestlé Equador 32 -0,16 0,47CC 260(5) 10 Duplicate group C SOMACLONES Somatic Embryogenesis of CC260 (5) Nestlé Equador 32 -0,16 0,47
CC 231 HYBRID SCA 6 X ICS 6 COSTA RICA IRCC 40 0,37 0,23EET 109 FORASTERO UPPER AMAZ. ? PERU INIAP 24 -0,82 0,72CC 212 HYBRID PA 150 X ? COSTA RICA IRCC 28 0,65 1,71CC 222 HYBRID ? COSTA RICA IRCC 42 0,61 -0,76CC 231 HYBRID SCA 6 X ICS 6 COSTA RICA IRCC 40 0,19 0,16CCN 51 HYBRID ? ECUADOR Nestlé Equador 26 0,63 1,89EET 48 EET 53, EET 48(3) NACIONAL X VENEZ.AMARILLO Synonym of Santa Rosa 34 ECUADOR INIFAP 40 -0,43 -0,16
EET 48(3) EET 53, EET 48 NACIONAL X VENEZ.AMARILLO Synonym of Santa Rosa 34 ECUADOR INIFAP 40 -0,43 -0,16EET 62 NACIONAL X VENEZ.AMARILLO ? ECUADOR Nestlé Equador 34 -0,19 1,36EET 95 Duplicate group A NACIONAL X VENEZ.AMARILLO Synonym of Tenguel 33 ECUADOR Nestlé Equador 42 -0,44 -0,14EET 96 VENEZ.AMARILLO X ? Synonym of Porvenir 10 ECUADOR Nestlé Equador 36 -0,47 -0,03EET 103 Duplicate group A NACIONAL X VENEZ.AMARILLO Synonym of Tenguel 25 ECUADOR Nestlé Equador 42 -0,44 -0,14
G 8 CRIOLLO ? Java IRCC 22 0,52 2,67GU 275 FORASTERO LOW AMAZ. Seed propagation FR. GUIANA CRN TOURS 6 0,23 2,88GU 293 FORASTERO LOW AMAZ. Seed propagation FR. GUIANA CRN TOURS 10 0,21 2,61GU 302 FORASTERO LOW AMAZ. Seed propagation FR. GUIANA CRN TOURS 14 0,20 2,82GU 305 FORASTERO LOW AMAZ. Seed propagation FR. GUIANA CRN TOURS 10 0,12 2,69ICS 1 TRINITARIO ? TRINIDAD INIFAP 20 0,76 0,15ICS 6 TRINITARIO ? TRINIDAD INIFAP 22 0,94 0,49ICS 8 TRINITARIO ? TRINIDAD Nestlé Equador 44 0,45 0,96ICS 95 TRINITARIO ? TRINIDAD Nestlé Equador 26 0,29 -0,08IMC 67 EET 116 FORASTERO UPPER AMAZ. ? PERU INIFAP 30 0,24 3,38IMC 70 FORASTERO UPPER AMAZ. ? PERU INIFAP 32 -0,37 0,24LAFI TRINITARIO ? SAMOA IRCC 24 1,07 -1,07
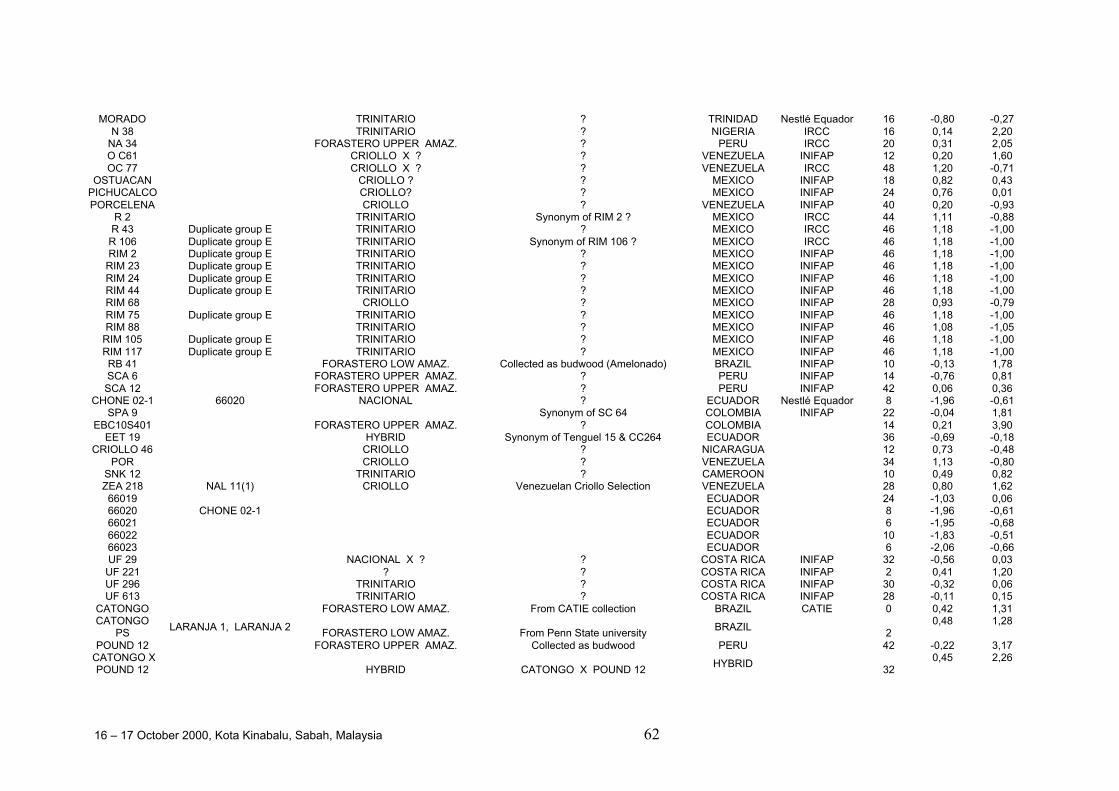
16 – 17 October 2000, Kota Kinabalu, Sabah, Malaysia 62
MORADO TRINITARIO ? TRINIDAD Nestlé Equador 16 -0,80 -0,27N 38 TRINITARIO ? NIGERIA IRCC 16 0,14 2,20
NA 34 FORASTERO UPPER AMAZ. ? PERU IRCC 20 0,31 2,05O C61 CRIOLLO X ? ? VENEZUELA INIFAP 12 0,20 1,60OC 77 CRIOLLO X ? ? VENEZUELA IRCC 48 1,20 -0,71
OSTUACAN CRIOLLO ? ? MEXICO INIFAP 18 0,82 0,43PICHUCALCO CRIOLLO? ? MEXICO INIFAP 24 0,76 0,01PORCELENA CRIOLLO ? VENEZUELA INIFAP 40 0,20 -0,93
R 2 TRINITARIO Synonym of RIM 2 ? MEXICO IRCC 44 1,11 -0,88R 43 Duplicate group E TRINITARIO ? MEXICO IRCC 46 1,18 -1,00R 106 Duplicate group E TRINITARIO Synonym of RIM 106 ? MEXICO IRCC 46 1,18 -1,00RIM 2 Duplicate group E TRINITARIO ? MEXICO INIFAP 46 1,18 -1,00RIM 23 Duplicate group E TRINITARIO ? MEXICO INIFAP 46 1,18 -1,00RIM 24 Duplicate group E TRINITARIO ? MEXICO INIFAP 46 1,18 -1,00RIM 44 Duplicate group E TRINITARIO ? MEXICO INIFAP 46 1,18 -1,00RIM 68 CRIOLLO ? MEXICO INIFAP 28 0,93 -0,79RIM 75 Duplicate group E TRINITARIO ? MEXICO INIFAP 46 1,18 -1,00RIM 88 TRINITARIO ? MEXICO INIFAP 46 1,08 -1,05
RIM 105 Duplicate group E TRINITARIO ? MEXICO INIFAP 46 1,18 -1,00RIM 117 Duplicate group E TRINITARIO ? MEXICO INIFAP 46 1,18 -1,00RB 41 FORASTERO LOW AMAZ. Collected as budwood (Amelonado) BRAZIL INIFAP 10 -0,13 1,78SCA 6 FORASTERO UPPER AMAZ. ? PERU INIFAP 14 -0,76 0,81SCA 12 FORASTERO UPPER AMAZ. ? PERU INIFAP 42 0,06 0,36
CHONE 02-1 66020 NACIONAL ? ECUADOR Nestlé Equador 8 -1,96 -0,61SPA 9 Synonym of SC 64 COLOMBIA INIFAP 22 -0,04 1,81
EBC10S401 FORASTERO UPPER AMAZ. ? COLOMBIA 14 0,21 3,90EET 19 HYBRID Synonym of Tenguel 15 & CC264 ECUADOR 36 -0,69 -0,18
CRIOLLO 46 CRIOLLO ? NICARAGUA 12 0,73 -0,48POR CRIOLLO ? VENEZUELA 34 1,13 -0,80
SNK 12 TRINITARIO ? CAMEROON 10 0,49 0,82ZEA 218 NAL 11(1) CRIOLLO Venezuelan Criollo Selection VENEZUELA 28 0,80 1,6266019 ECUADOR 24 -1,03 0,0666020 CHONE 02-1 ECUADOR 8 -1,96 -0,6166021 ECUADOR 6 -1,95 -0,6866022 ECUADOR 10 -1,83 -0,5166023 ECUADOR 6 -2,06 -0,66UF 29 NACIONAL X ? ? COSTA RICA INIFAP 32 -0,56 0,03UF 221 ? ? COSTA RICA INIFAP 2 0,41 1,20UF 296 TRINITARIO ? COSTA RICA INIFAP 30 -0,32 0,06UF 613 TRINITARIO ? COSTA RICA INIFAP 28 -0,11 0,15
CATONGO FORASTERO LOW AMAZ. From CATIE collection BRAZIL CATIE 0 0,42 1,31CATONGO
PSLARANJA 1, LARANJA 2
FORASTERO LOW AMAZ. From Penn State universityBRAZIL
20,48 1,28
POUND 12 FORASTERO UPPER AMAZ. Collected as budwood PERU 42 -0,22 3,17 CATONGO X
POUND 12
HYBRID CATONGO X POUND 12HYBRID
320,45 2,26
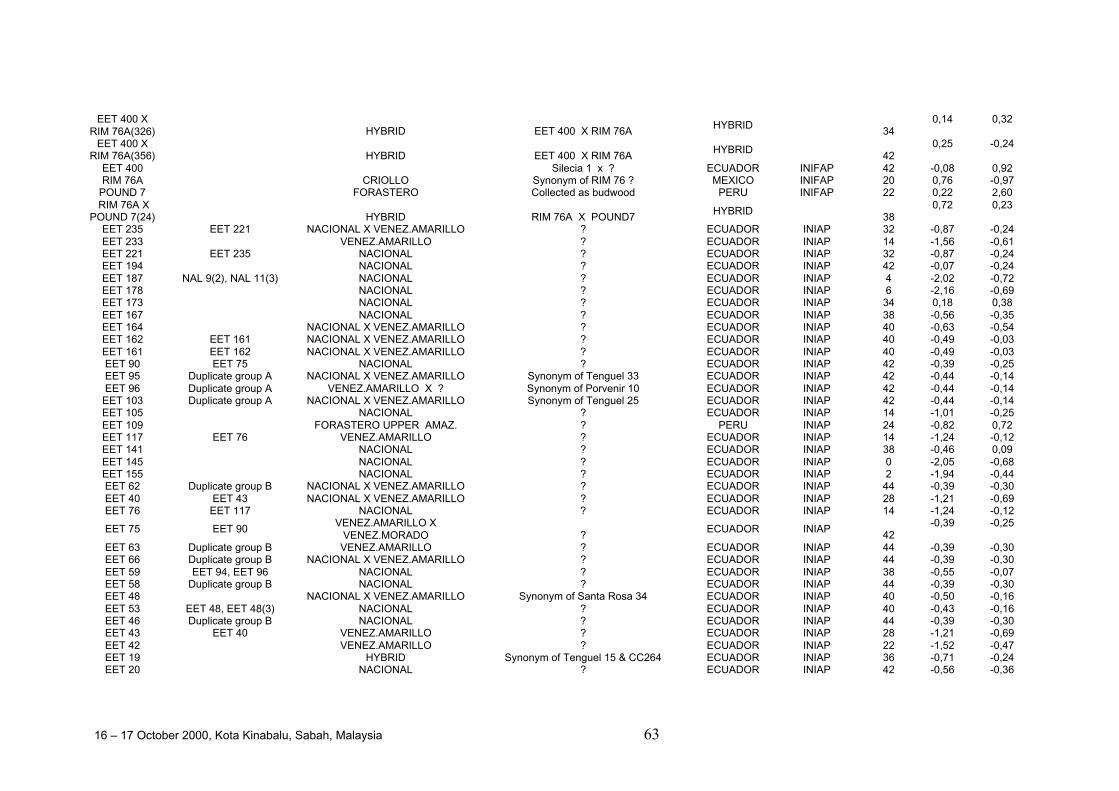
16 – 17 October 2000, Kota Kinabalu, Sabah, Malaysia 63
EET 400 XRIM 76A(326)
HYBRID EET 400 X RIM 76A
HYBRID 34
0,14 0,32
EET 400 XRIM 76A(356)
HYBRID EET 400 X RIM 76A
HYBRID 42
0,25 -0,24
EET 400 Silecia 1 x ? ECUADOR INIFAP 42 -0,08 0,92RIM 76A CRIOLLO Synonym of RIM 76 ? MEXICO INIFAP 20 0,76 -0,97
POUND 7 FORASTERO Collected as budwood PERU INIFAP 22 0,22 2,60 RIM 76A X
POUND 7(24)
HYBRID RIM 76A X POUND7HYBRID
380,72 0,23
EET 235 EET 221 NACIONAL X VENEZ.AMARILLO ? ECUADOR INIAP 32 -0,87 -0,24EET 233 VENEZ.AMARILLO ? ECUADOR INIAP 14 -1,56 -0,61EET 221 EET 235 NACIONAL ? ECUADOR INIAP 32 -0,87 -0,24EET 194 NACIONAL ? ECUADOR INIAP 42 -0,07 -0,24EET 187 NAL 9(2), NAL 11(3) NACIONAL ? ECUADOR INIAP 4 -2,02 -0,72EET 178 NACIONAL ? ECUADOR INIAP 6 -2,16 -0,69EET 173 NACIONAL ? ECUADOR INIAP 34 0,18 0,38EET 167 NACIONAL ? ECUADOR INIAP 38 -0,56 -0,35EET 164 NACIONAL X VENEZ.AMARILLO ? ECUADOR INIAP 40 -0,63 -0,54EET 162 EET 161 NACIONAL X VENEZ.AMARILLO ? ECUADOR INIAP 40 -0,49 -0,03EET 161 EET 162 NACIONAL X VENEZ.AMARILLO ? ECUADOR INIAP 40 -0,49 -0,03EET 90 EET 75 NACIONAL ? ECUADOR INIAP 42 -0,39 -0,25EET 95 Duplicate group A NACIONAL X VENEZ.AMARILLO Synonym of Tenguel 33 ECUADOR INIAP 42 -0,44 -0,14EET 96 Duplicate group A VENEZ.AMARILLO X ? Synonym of Porvenir 10 ECUADOR INIAP 42 -0,44 -0,14EET 103 Duplicate group A NACIONAL X VENEZ.AMARILLO Synonym of Tenguel 25 ECUADOR INIAP 42 -0,44 -0,14EET 105 NACIONAL ? ECUADOR INIAP 14 -1,01 -0,25EET 109 FORASTERO UPPER AMAZ. ? PERU INIAP 24 -0,82 0,72EET 117 EET 76 VENEZ.AMARILLO ? ECUADOR INIAP 14 -1,24 -0,12EET 141 NACIONAL ? ECUADOR INIAP 38 -0,46 0,09EET 145 NACIONAL ? ECUADOR INIAP 0 -2,05 -0,68EET 155 NACIONAL ? ECUADOR INIAP 2 -1,94 -0,44EET 62 Duplicate group B NACIONAL X VENEZ.AMARILLO ? ECUADOR INIAP 44 -0,39 -0,30EET 40 EET 43 NACIONAL X VENEZ.AMARILLO ? ECUADOR INIAP 28 -1,21 -0,69EET 76 EET 117 NACIONAL ? ECUADOR INIAP 14 -1,24 -0,12
EET 75 EET 90VENEZ.AMARILLO X
VENEZ.MORADO ?ECUADOR INIAP
42-0,39 -0,25
EET 63 Duplicate group B VENEZ.AMARILLO ? ECUADOR INIAP 44 -0,39 -0,30EET 66 Duplicate group B NACIONAL X VENEZ.AMARILLO ? ECUADOR INIAP 44 -0,39 -0,30EET 59 EET 94, EET 96 NACIONAL ? ECUADOR INIAP 38 -0,55 -0,07EET 58 Duplicate group B NACIONAL ? ECUADOR INIAP 44 -0,39 -0,30EET 48 NACIONAL X VENEZ.AMARILLO Synonym of Santa Rosa 34 ECUADOR INIAP 40 -0,50 -0,16EET 53 EET 48, EET 48(3) NACIONAL ? ECUADOR INIAP 40 -0,43 -0,16EET 46 Duplicate group B NACIONAL ? ECUADOR INIAP 44 -0,39 -0,30EET 43 EET 40 VENEZ.AMARILLO ? ECUADOR INIAP 28 -1,21 -0,69EET 42 VENEZ.AMARILLO ? ECUADOR INIAP 22 -1,52 -0,47EET 19 HYBRID Synonym of Tenguel 15 & CC264 ECUADOR INIAP 36 -0,71 -0,24EET 20 NACIONAL ? ECUADOR INIAP 42 -0,56 -0,36
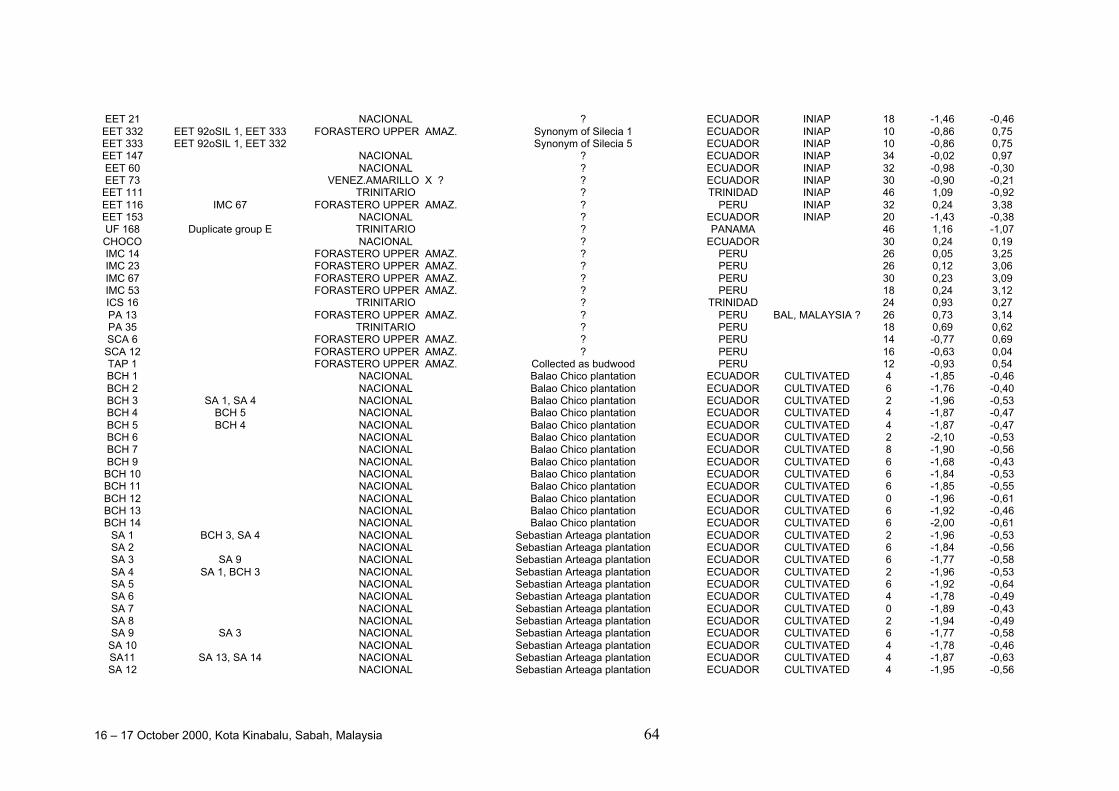
16 – 17 October 2000, Kota Kinabalu, Sabah, Malaysia 64
EET 21 NACIONAL ? ECUADOR INIAP 18 -1,46 -0,46EET 332 EET 92oSIL 1, EET 333 FORASTERO UPPER AMAZ. Synonym of Silecia 1 ECUADOR INIAP 10 -0,86 0,75EET 333 EET 92oSIL 1, EET 332 Synonym of Silecia 5 ECUADOR INIAP 10 -0,86 0,75EET 147 NACIONAL ? ECUADOR INIAP 34 -0,02 0,97EET 60 NACIONAL ? ECUADOR INIAP 32 -0,98 -0,30EET 73 VENEZ.AMARILLO X ? ? ECUADOR INIAP 30 -0,90 -0,21EET 111 TRINITARIO ? TRINIDAD INIAP 46 1,09 -0,92EET 116 IMC 67 FORASTERO UPPER AMAZ. ? PERU INIAP 32 0,24 3,38EET 153 NACIONAL ? ECUADOR INIAP 20 -1,43 -0,38UF 168 Duplicate group E TRINITARIO ? PANAMA 46 1,16 -1,07CHOCO NACIONAL ? ECUADOR 30 0,24 0,19IMC 14 FORASTERO UPPER AMAZ. ? PERU 26 0,05 3,25IMC 23 FORASTERO UPPER AMAZ. ? PERU 26 0,12 3,06IMC 67 FORASTERO UPPER AMAZ. ? PERU 30 0,23 3,09IMC 53 FORASTERO UPPER AMAZ. ? PERU 18 0,24 3,12ICS 16 TRINITARIO ? TRINIDAD 24 0,93 0,27PA 13 FORASTERO UPPER AMAZ. ? PERU BAL, MALAYSIA ? 26 0,73 3,14PA 35 TRINITARIO ? PERU 18 0,69 0,62SCA 6 FORASTERO UPPER AMAZ. ? PERU 14 -0,77 0,69SCA 12 FORASTERO UPPER AMAZ. ? PERU 16 -0,63 0,04TAP 1 FORASTERO UPPER AMAZ. Collected as budwood PERU 12 -0,93 0,54BCH 1 NACIONAL Balao Chico plantation ECUADOR CULTIVATED 4 -1,85 -0,46BCH 2 NACIONAL Balao Chico plantation ECUADOR CULTIVATED 6 -1,76 -0,40BCH 3 SA 1, SA 4 NACIONAL Balao Chico plantation ECUADOR CULTIVATED 2 -1,96 -0,53BCH 4 BCH 5 NACIONAL Balao Chico plantation ECUADOR CULTIVATED 4 -1,87 -0,47BCH 5 BCH 4 NACIONAL Balao Chico plantation ECUADOR CULTIVATED 4 -1,87 -0,47BCH 6 NACIONAL Balao Chico plantation ECUADOR CULTIVATED 2 -2,10 -0,53BCH 7 NACIONAL Balao Chico plantation ECUADOR CULTIVATED 8 -1,90 -0,56BCH 9 NACIONAL Balao Chico plantation ECUADOR CULTIVATED 6 -1,68 -0,43BCH 10 NACIONAL Balao Chico plantation ECUADOR CULTIVATED 6 -1,84 -0,53BCH 11 NACIONAL Balao Chico plantation ECUADOR CULTIVATED 6 -1,85 -0,55BCH 12 NACIONAL Balao Chico plantation ECUADOR CULTIVATED 0 -1,96 -0,61BCH 13 NACIONAL Balao Chico plantation ECUADOR CULTIVATED 6 -1,92 -0,46BCH 14 NACIONAL Balao Chico plantation ECUADOR CULTIVATED 6 -2,00 -0,61
SA 1 BCH 3, SA 4 NACIONAL Sebastian Arteaga plantation ECUADOR CULTIVATED 2 -1,96 -0,53SA 2 NACIONAL Sebastian Arteaga plantation ECUADOR CULTIVATED 6 -1,84 -0,56SA 3 SA 9 NACIONAL Sebastian Arteaga plantation ECUADOR CULTIVATED 6 -1,77 -0,58SA 4 SA 1, BCH 3 NACIONAL Sebastian Arteaga plantation ECUADOR CULTIVATED 2 -1,96 -0,53SA 5 NACIONAL Sebastian Arteaga plantation ECUADOR CULTIVATED 6 -1,92 -0,64SA 6 NACIONAL Sebastian Arteaga plantation ECUADOR CULTIVATED 4 -1,78 -0,49SA 7 NACIONAL Sebastian Arteaga plantation ECUADOR CULTIVATED 0 -1,89 -0,43SA 8 NACIONAL Sebastian Arteaga plantation ECUADOR CULTIVATED 2 -1,94 -0,49SA 9 SA 3 NACIONAL Sebastian Arteaga plantation ECUADOR CULTIVATED 6 -1,77 -0,58SA 10 NACIONAL Sebastian Arteaga plantation ECUADOR CULTIVATED 4 -1,78 -0,46SA11 SA 13, SA 14 NACIONAL Sebastian Arteaga plantation ECUADOR CULTIVATED 4 -1,87 -0,63SA 12 NACIONAL Sebastian Arteaga plantation ECUADOR CULTIVATED 4 -1,95 -0,56
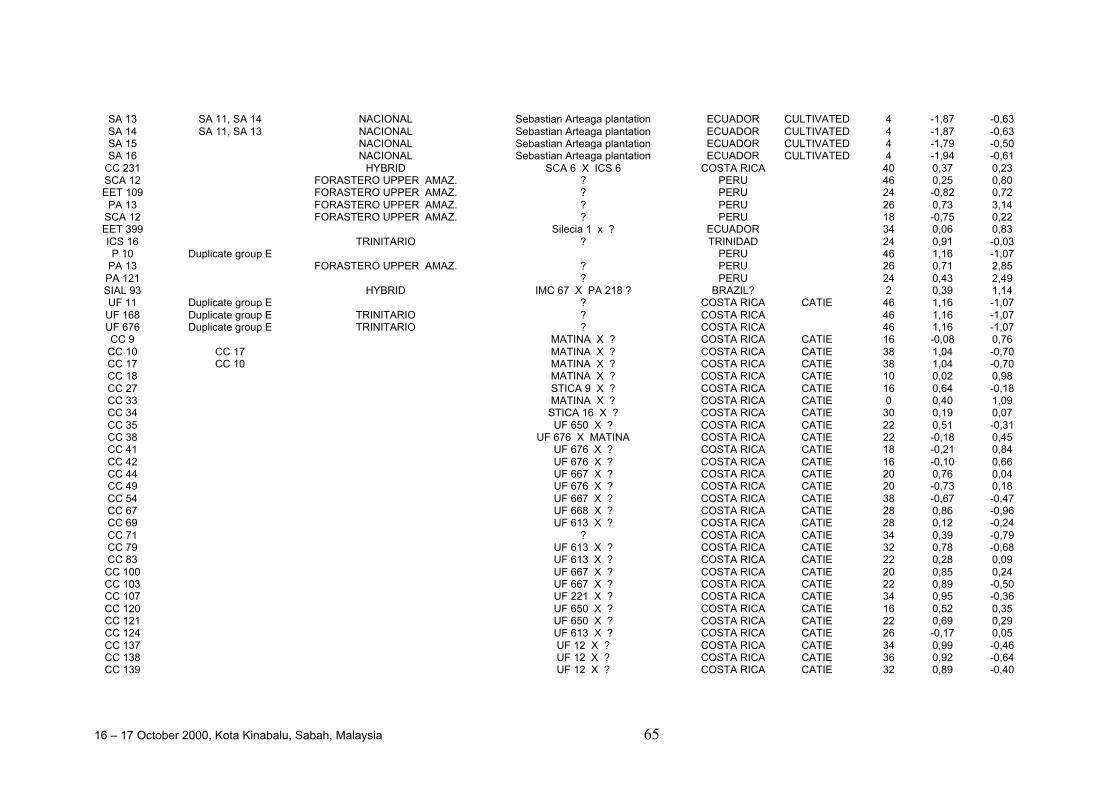
16 – 17 October 2000, Kota Kinabalu, Sabah, Malaysia 65
SA 13 SA 11, SA 14 NACIONAL Sebastian Arteaga plantation ECUADOR CULTIVATED 4 -1,87 -0,63SA 14 SA 11, SA 13 NACIONAL Sebastian Arteaga plantation ECUADOR CULTIVATED 4 -1,87 -0,63SA 15 NACIONAL Sebastian Arteaga plantation ECUADOR CULTIVATED 4 -1,79 -0,50SA 16 NACIONAL Sebastian Arteaga plantation ECUADOR CULTIVATED 4 -1,94 -0,61
CC 231 HYBRID SCA 6 X ICS 6 COSTA RICA 40 0,37 0,23SCA 12 FORASTERO UPPER AMAZ. ? PERU 46 0,25 0,80EET 109 FORASTERO UPPER AMAZ. ? PERU 24 -0,82 0,72
PA 13 FORASTERO UPPER AMAZ. ? PERU 26 0,73 3,14SCA 12 FORASTERO UPPER AMAZ. ? PERU 18 -0,75 0,22EET 399 Silecia 1 x ? ECUADOR 34 0,06 0,83ICS 16 TRINITARIO ? TRINIDAD 24 0,91 -0,03P 10 Duplicate group E PERU 46 1,16 -1,07
PA 13 FORASTERO UPPER AMAZ. ? PERU 26 0,71 2,85PA 121 ? PERU 24 0,43 2,49SIAL 93 HYBRID IMC 67 X PA 218 ? BRAZIL? 2 0,39 1,14UF 11 Duplicate group E ? COSTA RICA CATIE 46 1,16 -1,07UF 168 Duplicate group E TRINITARIO ? COSTA RICA 46 1,16 -1,07UF 676 Duplicate group E TRINITARIO ? COSTA RICA 46 1,16 -1,07CC 9 MATINA X ? COSTA RICA CATIE 16 -0,08 0,76CC 10 CC 17 MATINA X ? COSTA RICA CATIE 38 1,04 -0,70CC 17 CC 10 MATINA X ? COSTA RICA CATIE 38 1,04 -0,70CC 18 MATINA X ? COSTA RICA CATIE 10 0,02 0,98CC 27 STICA 9 X ? COSTA RICA CATIE 16 0,64 -0,18CC 33 MATINA X ? COSTA RICA CATIE 0 0,40 1,09CC 34 STICA 16 X ? COSTA RICA CATIE 30 0,19 0,07CC 35 UF 650 X ? COSTA RICA CATIE 22 0,51 -0,31CC 38 UF 676 X MATINA COSTA RICA CATIE 22 -0,18 0,45CC 41 UF 676 X ? COSTA RICA CATIE 18 -0,21 0,84CC 42 UF 676 X ? COSTA RICA CATIE 16 -0,10 0,66CC 44 UF 667 X ? COSTA RICA CATIE 20 0,76 0,04CC 49 UF 676 X ? COSTA RICA CATIE 20 -0,73 0,18CC 54 UF 667 X ? COSTA RICA CATIE 38 -0,67 -0,47CC 67 UF 668 X ? COSTA RICA CATIE 28 0,86 -0,96CC 69 UF 613 X ? COSTA RICA CATIE 28 0,12 -0,24CC 71 ? COSTA RICA CATIE 34 0,39 -0,79CC 79 UF 613 X ? COSTA RICA CATIE 32 0,78 -0,68CC 83 UF 613 X ? COSTA RICA CATIE 22 0,28 0,09CC 100 UF 667 X ? COSTA RICA CATIE 20 0,85 0,24CC 103 UF 667 X ? COSTA RICA CATIE 22 0,89 -0,50CC 107 UF 221 X ? COSTA RICA CATIE 34 0,95 -0,36CC 120 UF 650 X ? COSTA RICA CATIE 16 0,52 0,35CC 121 UF 650 X ? COSTA RICA CATIE 22 0,69 0,29CC 124 UF 613 X ? COSTA RICA CATIE 26 -0,17 0,05CC 137 UF 12 X ? COSTA RICA CATIE 34 0,99 -0,46CC 138 UF 12 X ? COSTA RICA CATIE 36 0,92 -0,64CC 139 UF 12 X ? COSTA RICA CATIE 32 0,89 -0,40
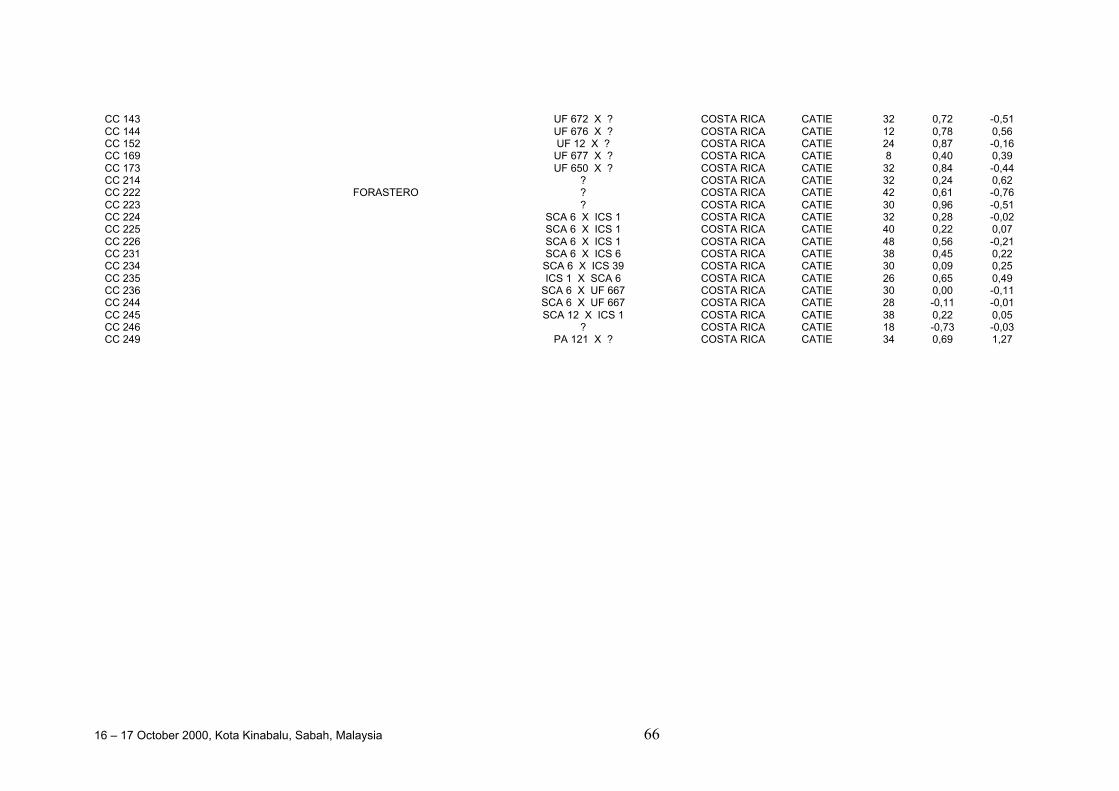
16 – 17 October 2000, Kota Kinabalu, Sabah, Malaysia 66
CC 143 UF 672 X ? COSTA RICA CATIE 32 0,72 -0,51CC 144 UF 676 X ? COSTA RICA CATIE 12 0,78 0,56CC 152 UF 12 X ? COSTA RICA CATIE 24 0,87 -0,16CC 169 UF 677 X ? COSTA RICA CATIE 8 0,40 0,39CC 173 UF 650 X ? COSTA RICA CATIE 32 0,84 -0,44CC 214 ? COSTA RICA CATIE 32 0,24 0,62CC 222 FORASTERO ? COSTA RICA CATIE 42 0,61 -0,76CC 223 ? COSTA RICA CATIE 30 0,96 -0,51CC 224 SCA 6 X ICS 1 COSTA RICA CATIE 32 0,28 -0,02CC 225 SCA 6 X ICS 1 COSTA RICA CATIE 40 0,22 0,07CC 226 SCA 6 X ICS 1 COSTA RICA CATIE 48 0,56 -0,21CC 231 SCA 6 X ICS 6 COSTA RICA CATIE 38 0,45 0,22CC 234 SCA 6 X ICS 39 COSTA RICA CATIE 30 0,09 0,25CC 235 ICS 1 X SCA 6 COSTA RICA CATIE 26 0,65 0,49CC 236 SCA 6 X UF 667 COSTA RICA CATIE 30 0,00 -0,11CC 244 SCA 6 X UF 667 COSTA RICA CATIE 28 -0,11 -0,01CC 245 SCA 12 X ICS 1 COSTA RICA CATIE 38 0,22 0,05CC 246 ? COSTA RICA CATIE 18 -0,73 -0,03CC 249 PA 121 X ? COSTA RICA CATIE 34 0,69 1,27
16 – 17 October 2000, Kota Kinabalu, Sabah, Malaysia 67
Evaluation and Use of the Genetic Diversity Present in theInternational Cocoa Genebank (ICG,T), in Trinidad
Olivier Sounigo2, Yvette Christopher1, Stacy Ramdahin1, Romina Umaharan1 andAntoinette Sankar1
1 - Cocoa Research Unit, University of the West Indies, St. Augustine, Trinidad and Tobago2 – Cirad-Cp, TA 80/02, Avenue Agropolis, 34098 Montpellier Cedex 5, France, Attached tothe Cocoa Research Unit
Abstract
Genetic diversity is currently assessed in the ICG,T using Isozyme Electrophoresis and RAPD.The information obtained from this assessment is used for establishing a "working collection"within ICG,T containing a reduced number of clones with large genetic diversity and interestingagronomic traits. Proposals are made to integrate the results of this assessment in to the cocoabreeding strategy.
Introduction
The Cocoa Research Unit (CRU) is in charge of the maintenance, description andevaluation of the 2,300 cocoa clones present in the International Cocoa Genebank(ICG,T) in Trinidad. Besides the morphological description of the clones, biochemical(Isozyme Electrophoresis) and molecular (RAPD) markers are currently used tocharacterise these clones and to assess the level of genetic diversity present in theICG,T.
Material and methods
Plant materialThe ICG,T is composed of :
• Upper Amazon populations from Peru, Ecuador and Colombia,
• Trinitario clones from the Caribbean (Trinidad, Grenada, Martinique, Guadeloupe,Dominican Republic), Central America (Costa Rica and Mexico) and from SouthAmerica (Venezuela and Colombia),
• Refractario clones from Ecuador,
• Lower Amazon Forastero from Brazil and Surinam,
• Native clones from French Guiana, and
• Some Criollo populations from Belize.
MethodsIsozyme Electrophoresis. Five systems are currently used, following the methodologyof Lanaud (1986): ACP, ADH, IDH, MDH and GPI.
RAPD. DNA is extracted according to the method proposed by Edwards et al. (1991),as modified by Johnson et al. (1992). Amplifications are carried out following themethod described by Christopher and Sounigo (1996). Thirteen operon primers areused to generate 30 polymorphic reproducible and scorable markers for these
16 – 17 October 2000, Kota Kinabalu, Sabah, Malaysia 68
analyses. The amplification products are run on a 1.6% agarose gel and visualisedunder ultra violet light after staining with ethidium bromide.Statistical analyses. The genetic diversity is measured using multivariate analyses.The level of genetic diversity within populations is measured by the Shannon index(Magurran 1988) when RAPD data are analysed. For isozyme data, the mean numberof polymorphic markers, the mean number of alleles per locus and levels of observedand expected heterozygosity are calculated. The genetic relationships betweenpopulations are visualised using cluster analyses performed on Rogers-Wrightdistances (Wright 1978) in the case of RAPD data, and on Nei distances (Nei 1972) inthe case of isozymes, calculated on pairs of populations.
The results and their use
Characterization using isozymesThe isozyme characterisation data for the clones are included in the InternationalCocoa Germplasm Database (ICGD) (Wadsworth et al. 1997). These can be used byall cocoa breeders for:
• Estimation of the level of heterozygosity present in the clone, even if this evaluationis not very precise (observed on only five isozyme loci). This type of information onthe parents of crosses is important for the prediction of the level of heterogeneity inthe progeny. This can indicate the possible future use of this progeny, as a variety(if the parents show a low level of heterozygosity) or as a reservoir for individual treeselection (if the parents are highly heterozygous).
• Verification of identity of the clones they have in common with ICG,T in order todetect mislabelling problems.
Level of genetic diversity within populationsThese data are currently used for the establishment of a "working collection" for theCFC/ICCO/IPGRI project on ‘Cocoa Germplasm Utilization and Conservation’ (Sounigoet al. 2000). A sub-sample of the most useful clones in the ICG,T is selected forinclusion in this "working collection". The “usefulness” is defined in terms of resistanceto diseases and favourable pod and bean characteristics. In order to maintain a highlevel of diversity in the working collection, an attempt was made to represent a largenumber of populations, the level of representation of each population depending on thelevel of genetic diversity it contains.
The levels of diversity observed in some of the populations using the RAPDtechnique are indicated in Table 1. The information about the genetic origin of theclones (number of mother trees) was obtained from the ICGD (Wadsworth e tal.1997).The levels of genetic diversity observed are not significantly correlated to thesample sizes of these populations indicating that the differences are not simply causedby bias arising from differences in sampling. The results show that the highest levels ofdiversity where found in populations that supposedly originate from the lowest numbersof mother trees (SCA, IMC and MO), which is rather surprising. This could beexplained in the case of MO by the hypothesis made by Bartley (1993) that genotypesfrom different geographic origins could have been named MO by mistake. Even theaccessions from the SPA population, supposedly originating from a single pod, presenta level of genetic diversity almost equal to the one shown by the NA population, whichis expected to originate from 14 mother trees. The populations from French Guianapresent a low level of genetic diversity, except ELP, which presents a fair level ofdiversity, equal to the one presented by the NA population.
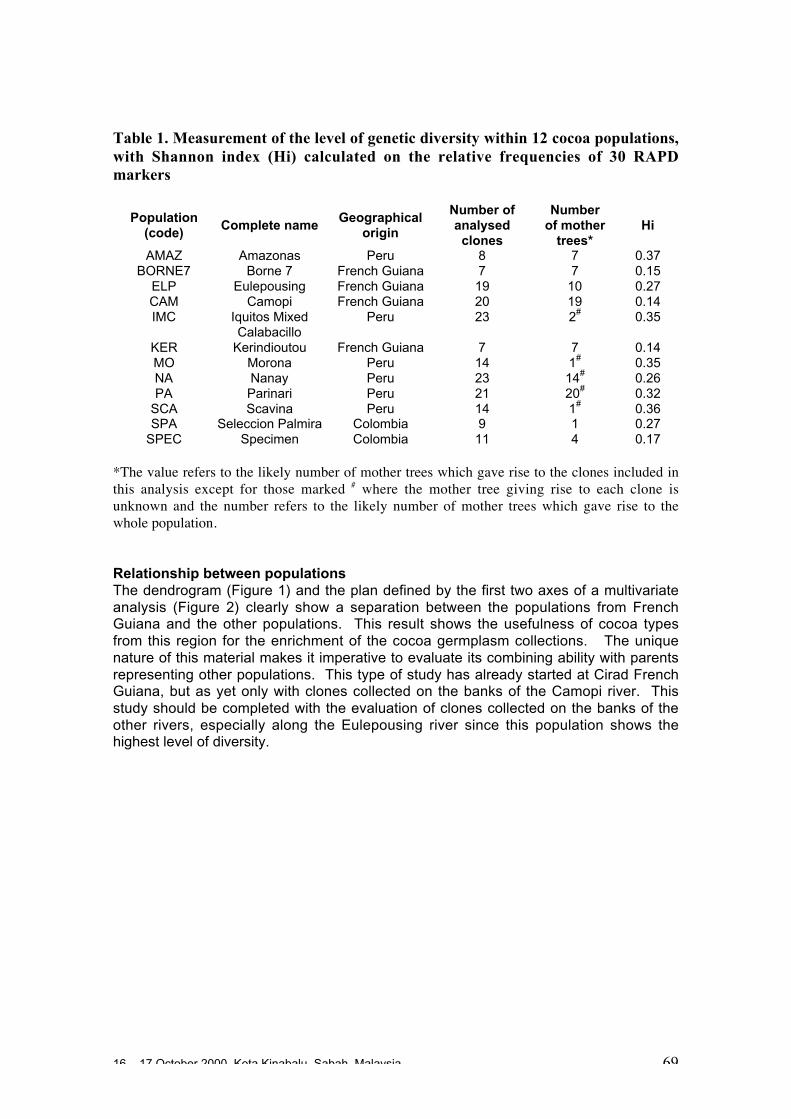
16 – 17 October 2000, Kota Kinabalu, Sabah, Malaysia 69
Table 1. Measurement of the level of genetic diversity within 12 cocoa populations,with Shannon index (Hi) calculated on the relative frequencies of 30 RAPDmarkers
Population(code)
Complete nameGeographical
origin
Number ofanalysed
clones
Numberof mother
trees*Hi
AMAZ Amazonas Peru 8 7 0.37BORNE7 Borne 7 French Guiana 7 7 0.15
ELP Eulepousing French Guiana 19 10 0.27CAM Camopi French Guiana 20 19 0.14IMC Iquitos Mixed
CalabacilloPeru 23 2# 0.35
KER Kerindioutou French Guiana 7 7 0.14MO Morona Peru 14 1# 0.35NA Nanay Peru 23 14# 0.26PA Parinari Peru 21 20# 0.32
SCA Scavina Peru 14 1# 0.36SPA Seleccion Palmira Colombia 9 1 0.27
SPEC Specimen Colombia 11 4 0.17
*The value refers to the likely number of mother trees which gave rise to the clones included inthis analysis except for those marked # where the mother tree giving rise to each clone isunknown and the number refers to the likely number of mother trees which gave rise to thewhole population.
Relationship between populationsThe dendrogram (Figure 1) and the plan defined by the first two axes of a multivariateanalysis (Figure 2) clearly show a separation between the populations from FrenchGuiana and the other populations. This result shows the usefulness of cocoa typesfrom this region for the enrichment of the cocoa germplasm collections. The uniquenature of this material makes it imperative to evaluate its combining ability with parentsrepresenting other populations. This type of study has already started at Cirad FrenchGuiana, but as yet only with clones collected on the banks of the Camopi river. Thisstudy should be completed with the evaluation of clones collected on the banks of theother rivers, especially along the Eulepousing river since this population shows thehighest level of diversity.
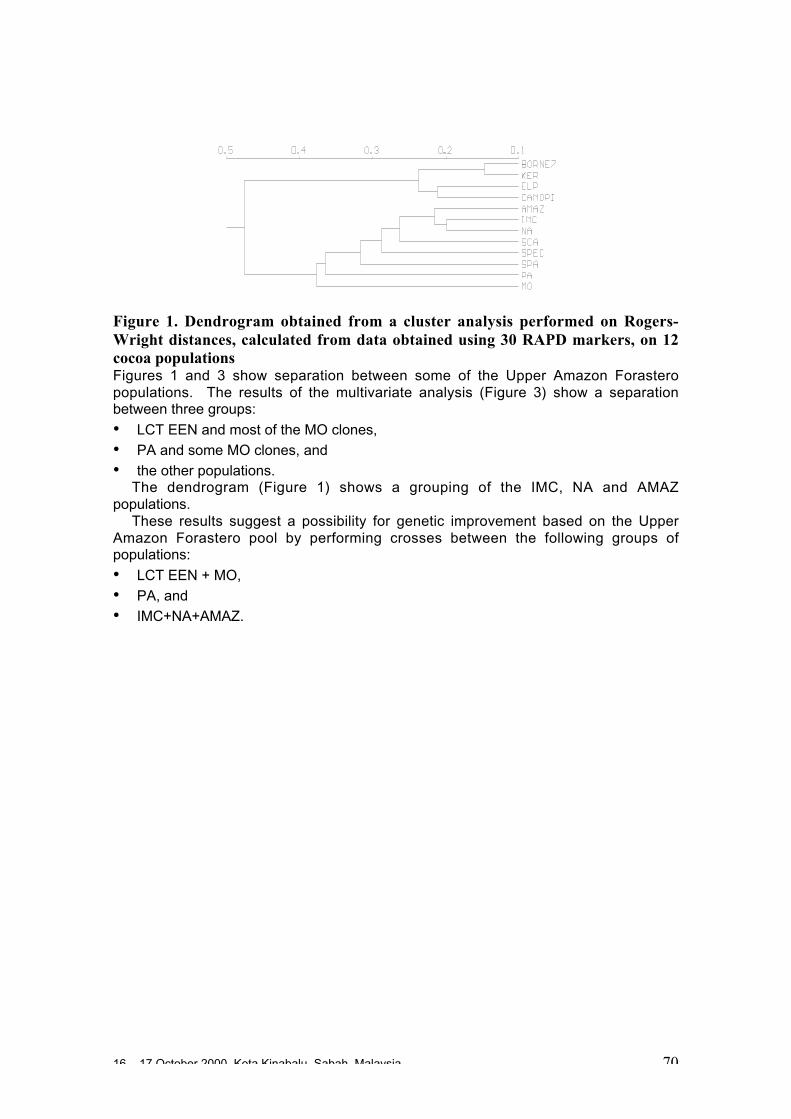
16 – 17 October 2000, Kota Kinabalu, Sabah, Malaysia 70
Figure 1. Dendrogram obtained from a cluster analysis performed on Rogers-Wright distances, calculated from data obtained using 30 RAPD markers, on 12cocoa populationsFigures 1 and 3 show separation between some of the Upper Amazon Forasteropopulations. The results of the multivariate analysis (Figure 3) show a separationbetween three groups:
• LCT EEN and most of the MO clones,
• PA and some MO clones, and
• the other populations.The dendrogram (Figure 1) shows a grouping of the IMC, NA and AMAZ
populations.These results suggest a possibility for genetic improvement based on the Upper
Amazon Forastero pool by performing crosses between the following groups ofpopulations:
• LCT EEN + MO,
• PA, and
• IMC+NA+AMAZ.
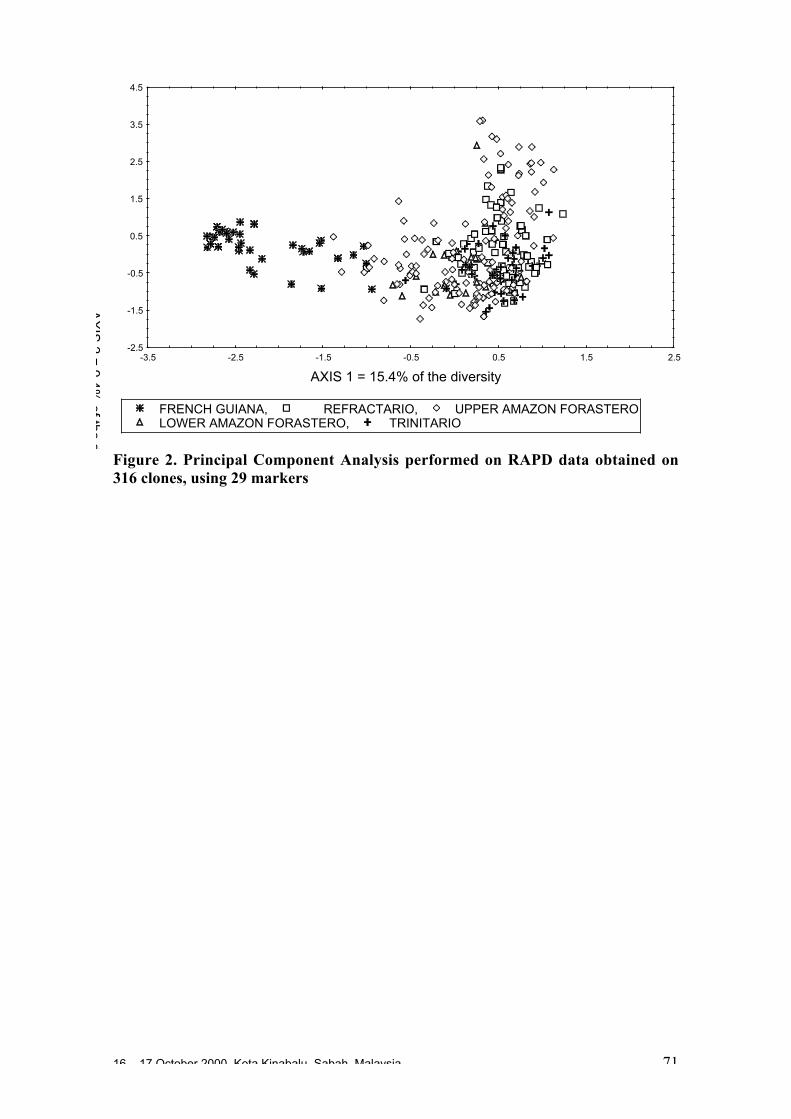
16 – 17 October 2000, Kota Kinabalu, Sabah, Malaysia 71
Figure 2. Principal Component Analysis performed on RAPD data obtained on316 clones, using 29 markers
AXIS 1 = 15.4% of the diversity
AX
IS 2 =
9.4% of the diversity
-2.5
-1.5
-0.5
0.5
1.5
2.5
3.5
4.5
-3.5 -2.5 -1.5 -0.5 0.5 1.5 2.5
FRENCH GUIANA, REFRACTARIO, UPPER AMAZON FORASTEROLOWER AMAZON FORASTERO, TRINITARIO
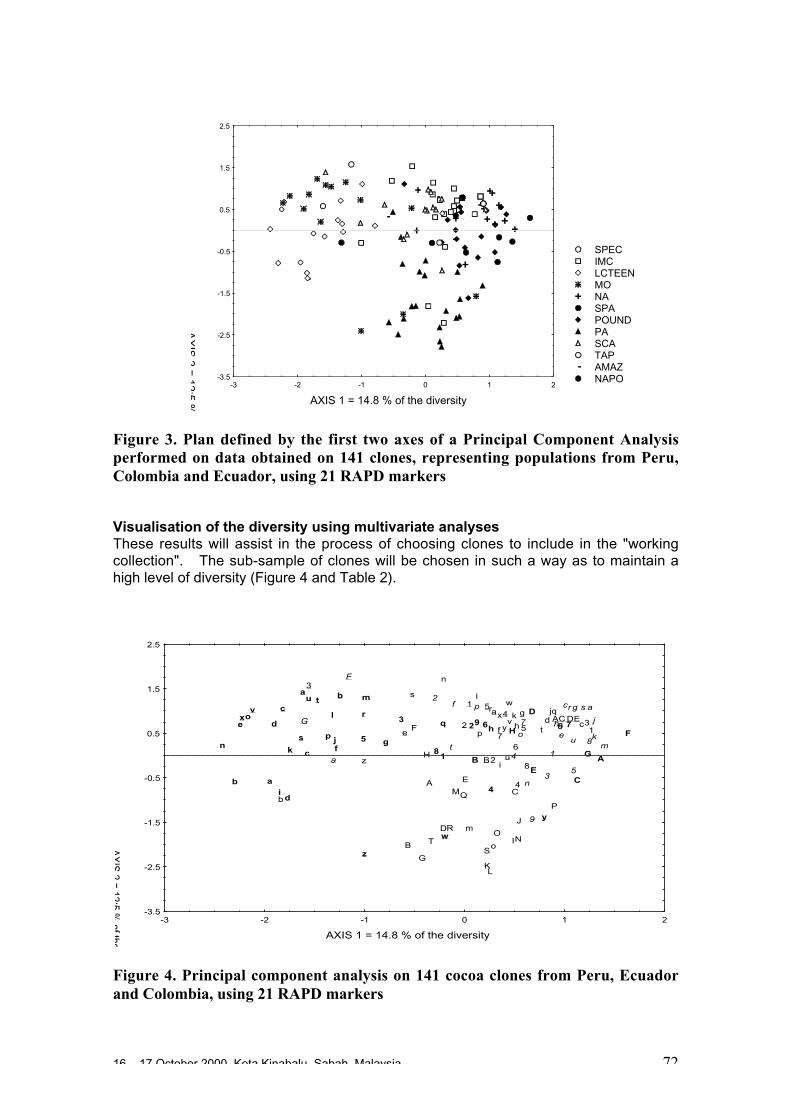
16 – 17 October 2000, Kota Kinabalu, Sabah, Malaysia 72
Figure 3. Plan defined by the first two axes of a Principal Component Analysisperformed on data obtained on 141 clones, representing populations from Peru,Colombia and Ecuador, using 21 RAPD markers
Visualisation of the diversity using multivariate analysesThese results will assist in the process of choosing clones to include in the "workingcollection". The sub-sample of clones will be chosen in such a way as to maintain ahigh level of diversity (Figure 4 and Table 2).
Figure 4. Principal component analysis on 141 cocoa clones from Peru, Ecuadorand Colombia, using 21 RAPD markers
AXIS 1 = 14.8 % of the diversity
AXIS 2 = 12:5 % of the diversity
a
b
cd
e
u
g
h
i
jk
l
m
n
o
p
q r
s
t fv
w
x
y
z
ab
c
d
e
fg
h
i
jk
l
m
n
o
p
qr
s
tu
v
w
x
y
z
a b
c
d
e
f g
h
j
k
ac s
tu
m
n
o
p r
a
1
2
3
4
5
67
8
9
1
2
3
4
5
6 7
8
9
A
B
C
D
E
F
G
H
I
J
KL
M
NO
PQ
R
ST
1
23
4
5
6 7
8
9
1
2
3
4 5
AB
C
D
E
F
G
H
A
B
C D E
F
G
-3.5
-2.5
-1.5
-0.5
0.5
1.5
2.5
-3 -2 -1 0 1 2
SPECIMCLCTEENMONASPAPOUNDPASCATAPAMAZNAPO
AXIS 1 = 14.8 % of the diversity
AX
IS 2 =
12:5 % of the diversity
-3.5
-2.5
-1.5
-0.5
0.5
1.5
2.5
-3 -2 -1 0 1 2
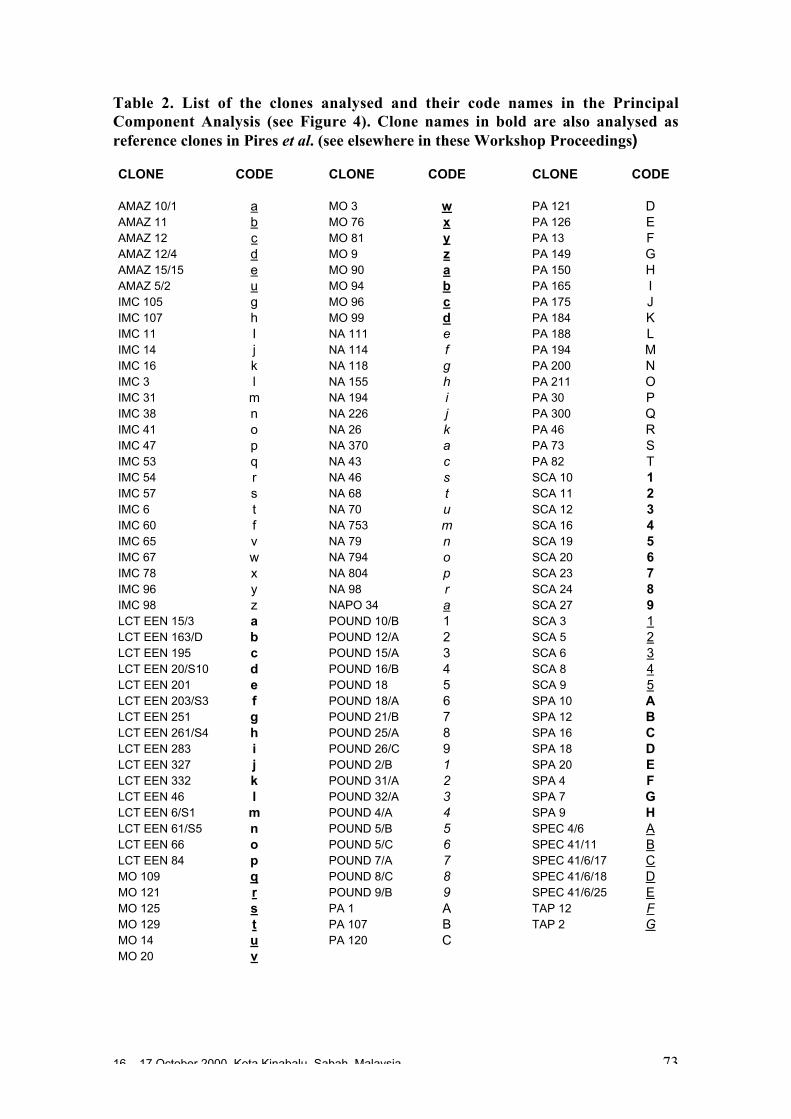
16 – 17 October 2000, Kota Kinabalu, Sabah, Malaysia 73
Table 2. List of the clones analysed and their code names in the PrincipalComponent Analysis (see Figure 4). Clone names in bold are also analysed asreference clones in Pires et al. (see elsewhere in these Workshop Proceedings)
CLONE CODE CLONE CODE CLONE CODE
AMAZ 10/1 a MO 3 w PA 121 DAMAZ 11 b MO 76 x PA 126 EAMAZ 12 c MO 81 y PA 13 FAMAZ 12/4 d MO 9 z PA 149 GAMAZ 15/15 e MO 90 a PA 150 HAMAZ 5/2 u MO 94 b PA 165 IIMC 105 g MO 96 c PA 175 JIMC 107 h MO 99 d PA 184 KIMC 11 I NA 111 e PA 188 LIMC 14 j NA 114 f PA 194 MIMC 16 k NA 118 g PA 200 NIMC 3 l NA 155 h PA 211 OIMC 31 m NA 194 i PA 30 PIMC 38 n NA 226 j PA 300 QIMC 41 o NA 26 k PA 46 RIMC 47 p NA 370 a PA 73 SIMC 53 q NA 43 c PA 82 TIMC 54 r NA 46 s SCA 10 1IMC 57 s NA 68 t SCA 11 2IMC 6 t NA 70 u SCA 12 3IMC 60 f NA 753 m SCA 16 4IMC 65 v NA 79 n SCA 19 5IMC 67 w NA 794 o SCA 20 6IMC 78 x NA 804 p SCA 23 7IMC 96 y NA 98 r SCA 24 8IMC 98 z NAPO 34 a SCA 27 9LCT EEN 15/3 a POUND 10/B 1 SCA 3 1LCT EEN 163/D b POUND 12/A 2 SCA 5 2LCT EEN 195 c POUND 15/A 3 SCA 6 3LCT EEN 20/S10 d POUND 16/B 4 SCA 8 4LCT EEN 201 e POUND 18 5 SCA 9 5LCT EEN 203/S3 f POUND 18/A 6 SPA 10 ALCT EEN 251 g POUND 21/B 7 SPA 12 BLCT EEN 261/S4 h POUND 25/A 8 SPA 16 CLCT EEN 283 i POUND 26/C 9 SPA 18 DLCT EEN 327 j POUND 2/B 1 SPA 20 ELCT EEN 332 k POUND 31/A 2 SPA 4 FLCT EEN 46 l POUND 32/A 3 SPA 7 GLCT EEN 6/S1 m POUND 4/A 4 SPA 9 HLCT EEN 61/S5 n POUND 5/B 5 SPEC 4/6 ALCT EEN 66 o POUND 5/C 6 SPEC 41/11 BLCT EEN 84 p POUND 7/A 7 SPEC 41/6/17 CMO 109 q POUND 8/C 8 SPEC 41/6/18 DMO 121 r POUND 9/B 9 SPEC 41/6/25 EMO 125 s PA 1 A TAP 12 FMO 129 t PA 107 B TAP 2 GMO 14 u PA 120 CMO 20 v
16 – 17 October 2000, Kota Kinabalu, Sabah, Malaysia 74
Conclusion
Isozyme and RAPD marker techniques currently provide us with useful information onthe genetic diversity existing in the ICG,T. However, these two types of markers sufferfrom some drawbacks:
• dominance of the RAPD markers, which prevents information from being obtainedon the level of heterozygosity of the clones, and
• low number of isozyme markers.The introduction of another technique, especially one using co-dominant markers,
would therefore be desirable. PCR-based SSR markers, developed for cocoa byLanaud et al. (1999) could be a technique of choice, once the necessary equipment forsequencing gels is available at CRU.
References
Bartley B.G.D. 1993. Notes on the meaning and origins of clone names. Personalcommunication to Michelle End, The University of Reading, UK.
Christopher Y., O. Sounigo. 1996. The use of RAPD for characterization and genetic diversityassessment of cacao. Pages 38-51 in Annual report of the Cocoa Research Unit for 1995.The Cocoa Research Unit, St. Augustine, Trinidad.
Edwards K., C. Johnstone and C. Thompson. 1991. A simple and rapid method for thepreparation of plant genomic DNA for PCR analysis. Nucl. Acid. Res., 19: 1349.
Johnson E., J.R. Russell, F. Hosein, W. Powell and P. Waugh. 1992. A laboratory manual forRAPD analyses in cocoa. In Internal report of the Cocoa Research Unit (unpublished).
Lanaud C. 1986. Utilisation des marqueurs enzymatiques pour l’étude génétique du cacaoyer:Theobroma cacao L. I. Contrôle génétique et “linkage” de neuf marqueurs enzymatiques.Café Cacao Thé 30: 259-270.
Lanaud C., A.M. Risterucci, I. Pieretti, M. Falque, A. Bouet and P.J.L. Lagoda. 1999. Isolationand characterization of microsatellites in Theobroma cacao L. Mol. Ecol. 12 (8): 2141.
Magurran A.E. 1988. Ecological diversity and its measurement. Croom Helm. London. 179 pp.Nei M. 1978. Genetic distance between populations. Amer. Naturalist. 106: 283-292.Sounigo O., V. Mooleedhar, D. Iwaro, F. Bekele, T.N. Sreenivasan, J.M. Thévenin, N. Khan and
D. Butler. 2000. Strategy to establish a CFC Project Collection. Pages 29-37 inProceedings of the CFC/ICCO/IPGRI Project Workshop. 1-6 February 1998. Montpellier.France. IPGRI,Rome, Italy.
Wadsworth R.M., C.S. Ford, M.J. End and P. Hadley (eds). 1997. International cocoagermplasm database. The London International Financial Futures and Options Exchange(LIFFE), London, UK.
Wright S. 1978. Evolution and the genetics of populations. vol 4. Variability within and amongnatural populations. University of Chicago Press,Chicago, U.S.A.
16 – 17 October 2000, Kota Kinabalu, Sabah, Malaysia 75
Diversity for Phenotypic Traits and Molecular Markers inCEPEC´s Germplasm Collection in Bahia, Brazil
José Luís Pires1, Jane M. Marita2, Uilson Vanderlei Lopes1, Milton Macoto Yamada1,W. Martin Aitken3, Gilson P. Melo1, Wilson Reis Monteiro1 and Dario Ahnert4
1 - Centro de Pesquisas do Cacau (SEGEN/CEPEC/CEPLAC), Ilhéus, BA, Brazil, 45.660-0002 - Dept of Forestry – University of Wisconsin, Madison, 537063 - Almirante Centro de Estudos do Cacau, Itajuípe, BA, Brazil, 45630-0004 - Universidade Estadual de Santa Cruz, Ilhéus, BA, Brazil, 45.660-000
Abstract
Phenotypic data analysis from CEPEC’s germplasm collection indicated a strong associationbetween individual bean weight and total bean weight per pod, between number of pods andtotal bean weight per tree and between witches’ broom resistance in cushion, canopy, pods andresistance to black pod. In a factor analysis, these constituted three factors which explain 80%of the total variation of 13 traits. The analysis of variance of the factorial scores (thereforerelative to the set of traits that each factor emphasises) and the cluster analysis based on theoriginal data indicated the existence of two main groups. The first group included domesticatedmaterials, Trinitarios, Criollos and Lower Amazon genotypes; genotypes in this group werecharacterised by a high yield and large pods and beans. The second group included wildAmazon genotypes, characterised by a high resistance to black pod and witches’ broomdisease and high fat content. Inter-mating individuals of these two groups, for the production ofsuperior varieties, is a logical option. On the other hand, the concentration of favourable allelesfor specific traits, including pyramiding of genes for durable resistance to witches’ broomdisease, requires simultaneous inter-crossing within groups. However, the groups mentionedare not totally distinct, as shown by RAPD analysis of 270 accessions of the CEPEC’sgermplasm collection (genetic distance between these genotypes and reference genotypes arepresented). Although there was a clear tendency for grouping of Lower Amazon accessions, ofTrinitario and Criollo accessions and of Upper Amazon accessions, these groups are not clearlyseparated on the MDS plot with overlaps occurring between groups. This shows clearly theneed for information from molecular markers for the formation of base populations orintercrossing groups. Another point that should be mentioned is the wide variation within UpperAmazon genotypes, particularly those from Peru, indicating that breeding programmes basedonly on genotypes of this group can successfully exploit the heterosis expected from crossinggenetically distant genotypes (materials from Brazil are also widely variable). Analysis of geneticdivergence, using RAPD markers also indicated the possibility that several different genes maycontribute to resistance to witches’ broom disease, since there were large distances betweengenotypes with low disease severity in the canopy and cushions (i.e. less than 20% of infectionin the germplasm collection. Molecular markers can also be important when phenotypicevaluations are not efficient in the identification of genotypes having resistance genes from bothparents. Therefore, studies of marker-gene association, for each source of resistance, areessential and this will build the basis for a marker assisted recurrent selection.
Introduction
Two strategies are traditionally used in cocoa breeding programmes:1. selection of clones and2. selection of hybrids (full-sib progeny between heterozygous parents, usually of
diverse type or origin).In both strategies, the breeding programmes have been limited to very few cycles of
selection, frequently a single one based on a very narrow genetic base. This appearsdue to the following reasons:
16 – 17 October 2000, Kota Kinabalu, Sabah, Malaysia 76
• Insufficient characterisation and evaluation of the germplasm available leading tothe choice of genotypes that are superior for easily observable traits.
• Long crop cycle (compounded by the absence of alternative practices like graftingon adult plants which could reduce the length of the crop cycle).
• The lack of efficient methods for early selection.
• The interruption of breeding programmes due to political and/or economic reasons.
• Relative success of the first crosses between genetically distant materials usuallyinvolving a wild genotype and a local selection.
• The heterozygosity of the plants in the hybrid progenies, making these plants lessuseful as parents for second cycle hybrids.The ‘first-cycle’ progenies were deployed as commercial hybrid varieties or used to
select new clones. However, emphasis on crosses between clones selected ingermplasm collections and continuously repeating the first cycle of selection, seems tohave reached an end. In the Ivory Coast, Malaysia and Brazil, recurrent selectionprogrammes have been proposed or initiated (Clément et al. 1993; Lockwood andPang 1993; Pires et al. 1999a). Now, such programmes can be conducted moresuccessfully through a better understanding of the distribution of economicallyimportant traits in the species, their interrelationships and, in particular, the availabilityand distribution of the genetic diversity present.
Material and methods
Traits consideredIn these analyses, data from approximately 560 clones of different origins from thegermplasm collection at the Cacao Research Center (CEPEC), Ilhéus, Bahia, wereused. The following traits were considered:• Fat content in the beans (Fat),• Frequency of pod loss caused by Phytophthora spp. (Phy),• Wet bean weight per plant (WBPL),• Dry bean weight per plant (DBPL),• Number of healthy pods per plant (PPL),• Total number of pods (healthy and diseased) per plant (TPPL),• Wet bean weight per pod (WBP),• Dry bean weight per pod (DBP),• Wet weight per bean (WB),• Dry weight per bean (DB),• Number of vegetative brooms (VB),• Number of cushion brooms (CB),• Frequency of pods with witches’ broom relative to the total number of pods (PB).
The variable Fat is an average of three samples obtained in one season; Phy is anaverage of five plants over a five year period; WBPL, PPL, and TPPL, are averages offive plants in three years; WB, DBP and WBP are averages of 15 samples in threeyears (of 40 beans each); DBPL is an average of five plants in three years, convertedfrom WBPL through the dry/wet ratio obtained from the samples, and VB, CB, PB theaverage of 10 plants in four years.
Besides the phenotypic variables, data from 32 RAPD primers (127 polymorphicbands) extracted from Marita (1998) and involving 254 clones were used in theanalyses. The 32 polymorphic primers, all from the Operon kit, were chosen based onresults from previous studies of diversity and linkage maps (Marita et al. 2000).
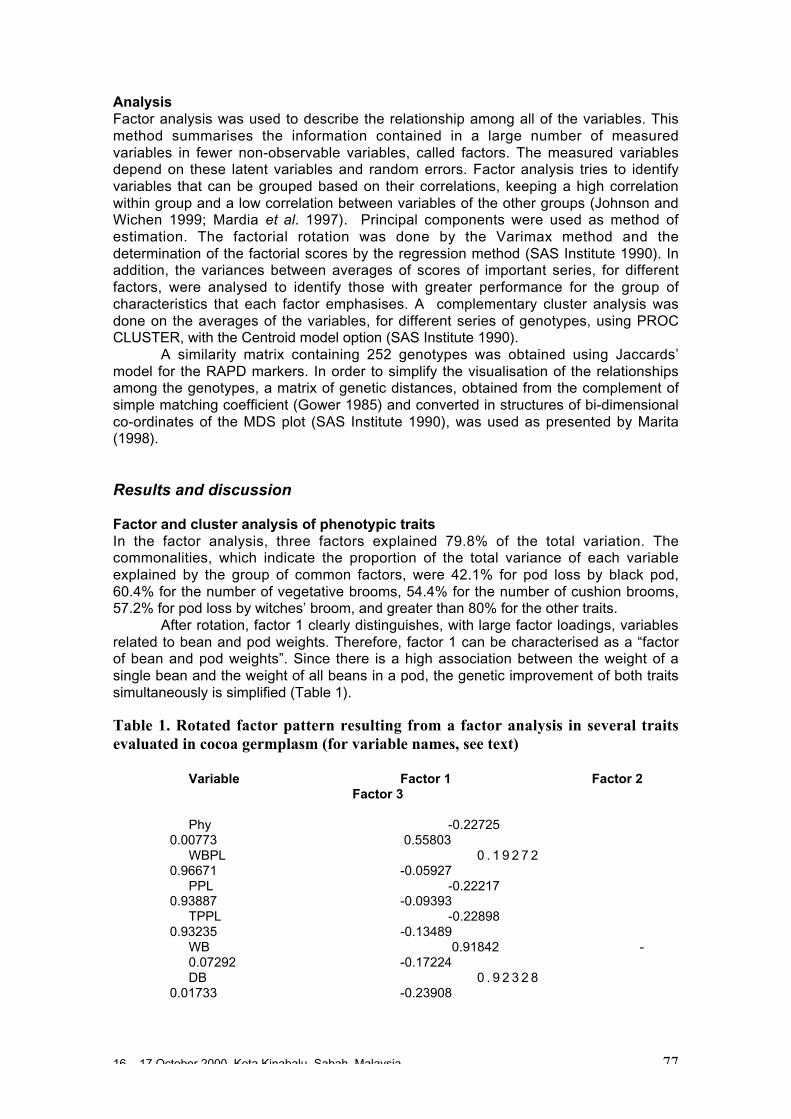
16 – 17 October 2000, Kota Kinabalu, Sabah, Malaysia 77
AnalysisFactor analysis was used to describe the relationship among all of the variables. Thismethod summarises the information contained in a large number of measuredvariables in fewer non-observable variables, called factors. The measured variablesdepend on these latent variables and random errors. Factor analysis tries to identifyvariables that can be grouped based on their correlations, keeping a high correlationwithin group and a low correlation between variables of the other groups (Johnson andWichen 1999; Mardia et al. 1997). Principal components were used as method ofestimation. The factorial rotation was done by the Varimax method and thedetermination of the factorial scores by the regression method (SAS Institute 1990). Inaddition, the variances between averages of scores of important series, for differentfactors, were analysed to identify those with greater performance for the group ofcharacteristics that each factor emphasises. A complementary cluster analysis wasdone on the averages of the variables, for different series of genotypes, using PROCCLUSTER, with the Centroid model option (SAS Institute 1990).
A similarity matrix containing 252 genotypes was obtained using Jaccards’model for the RAPD markers. In order to simplify the visualisation of the relationshipsamong the genotypes, a matrix of genetic distances, obtained from the complement ofsimple matching coefficient (Gower 1985) and converted in structures of bi-dimensionalco-ordinates of the MDS plot (SAS Institute 1990), was used as presented by Marita(1998).
Results and discussion
Factor and cluster analysis of phenotypic traitsIn the factor analysis, three factors explained 79.8% of the total variation. Thecommonalities, which indicate the proportion of the total variance of each variableexplained by the group of common factors, were 42.1% for pod loss by black pod,60.4% for the number of vegetative brooms, 54.4% for the number of cushion brooms,57.2% for pod loss by witches’ broom, and greater than 80% for the other traits.
After rotation, factor 1 clearly distinguishes, with large factor loadings, variablesrelated to bean and pod weights. Therefore, factor 1 can be characterised as a “factorof bean and pod weights”. Since there is a high association between the weight of asingle bean and the weight of all beans in a pod, the genetic improvement of both traitssimultaneously is simplified (Table 1).
Table 1. Rotated factor pattern resulting from a factor analysis in several traitsevaluated in cocoa germplasm (for variable names, see text)
Variable Factor 1 Factor 2Factor 3
Phy -0.227250.00773 0.55803
WBPL 0 . 1 9 2 7 20.96671 -0.05927
PPL -0.222170.93887 -0.09393
TPPL -0.228980.93235 -0.13489
WB 0.91842 -0.07292 -0.17224DB 0 . 9 2 3 2 8
0.01733 -0.23908
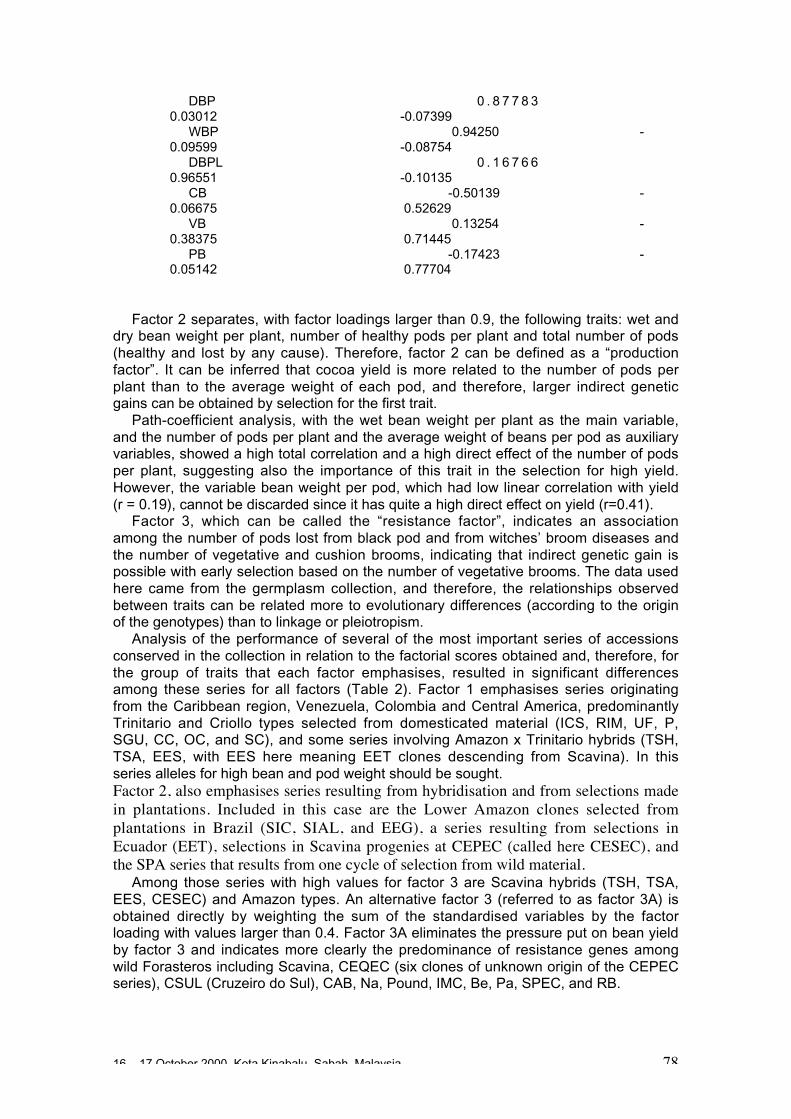
16 – 17 October 2000, Kota Kinabalu, Sabah, Malaysia 78
DBP 0 . 8 7 7 8 30.03012 -0.07399
WBP 0.94250 -0.09599 -0.08754
DBPL 0 . 1 6 7 6 60.96551 -0.10135
CB -0.50139 -0.06675 0.52629
VB 0.13254 -0.38375 0.71445
PB -0.17423 -0.05142 0.77704
Factor 2 separates, with factor loadings larger than 0.9, the following traits: wet anddry bean weight per plant, number of healthy pods per plant and total number of pods(healthy and lost by any cause). Therefore, factor 2 can be defined as a “productionfactor”. It can be inferred that cocoa yield is more related to the number of pods perplant than to the average weight of each pod, and therefore, larger indirect geneticgains can be obtained by selection for the first trait.
Path-coefficient analysis, with the wet bean weight per plant as the main variable,and the number of pods per plant and the average weight of beans per pod as auxiliaryvariables, showed a high total correlation and a high direct effect of the number of podsper plant, suggesting also the importance of this trait in the selection for high yield.However, the variable bean weight per pod, which had low linear correlation with yield(r = 0.19), cannot be discarded since it has quite a high direct effect on yield (r=0.41).
Factor 3, which can be called the “resistance factor”, indicates an associationamong the number of pods lost from black pod and from witches’ broom diseases andthe number of vegetative and cushion brooms, indicating that indirect genetic gain ispossible with early selection based on the number of vegetative brooms. The data usedhere came from the germplasm collection, and therefore, the relationships observedbetween traits can be related more to evolutionary differences (according to the originof the genotypes) than to linkage or pleiotropism.
Analysis of the performance of several of the most important series of accessionsconserved in the collection in relation to the factorial scores obtained and, therefore, forthe group of traits that each factor emphasises, resulted in significant differencesamong these series for all factors (Table 2). Factor 1 emphasises series originatingfrom the Caribbean region, Venezuela, Colombia and Central America, predominantlyTrinitario and Criollo types selected from domesticated material (ICS, RIM, UF, P,SGU, CC, OC, and SC), and some series involving Amazon x Trinitario hybrids (TSH,TSA, EES, with EES here meaning EET clones descending from Scavina). In thisseries alleles for high bean and pod weight should be sought.Factor 2, also emphasises series resulting from hybridisation and from selections madein plantations. Included in this case are the Lower Amazon clones selected fromplantations in Brazil (SIC, SIAL, and EEG), a series resulting from selections inEcuador (EET), selections in Scavina progenies at CEPEC (called here CESEC), andthe SPA series that results from one cycle of selection from wild material.
Among those series with high values for factor 3 are Scavina hybrids (TSH, TSA,EES, CESEC) and Amazon types. An alternative factor 3 (referred to as factor 3A) isobtained directly by weighting the sum of the standardised variables by the factorloading with values larger than 0.4. Factor 3A eliminates the pressure put on bean yieldby factor 3 and indicates more clearly the predominance of resistance genes amongwild Forasteros including Scavina, CEQEC (six clones of unknown origin of the CEPECseries), CSUL (Cruzeiro do Sul), CAB, Na, Pound, IMC, Be, Pa, SPEC, and RB.
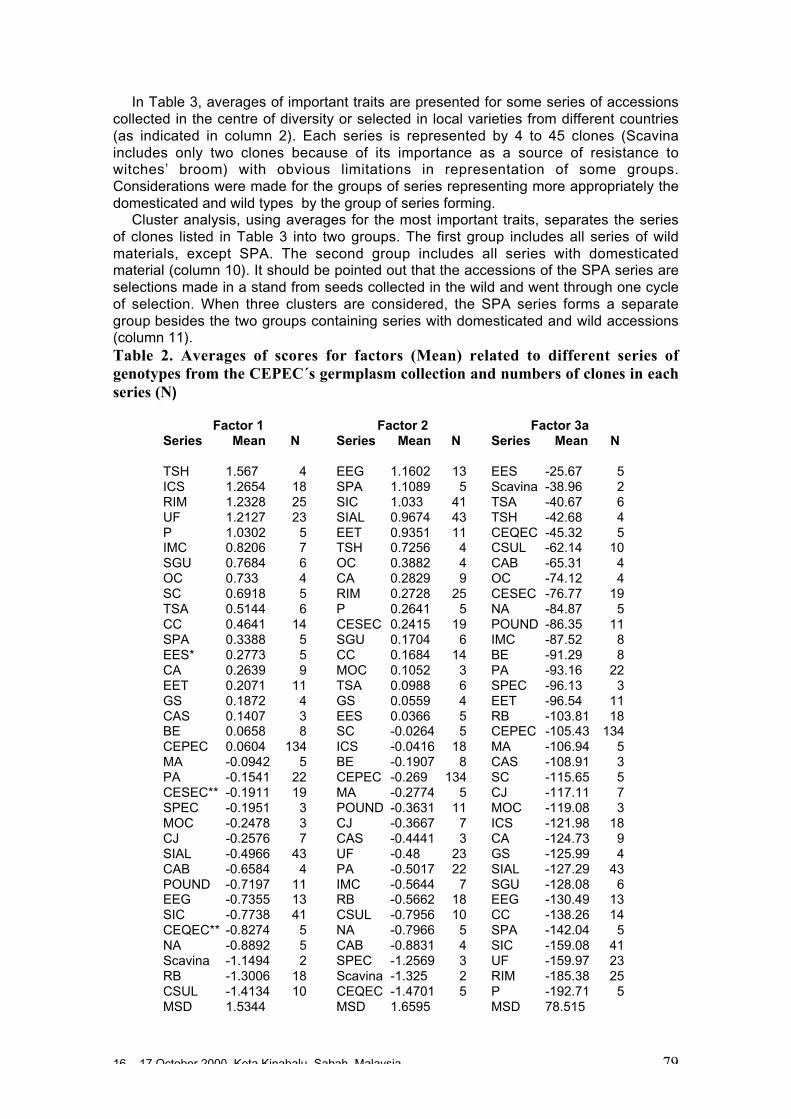
16 – 17 October 2000, Kota Kinabalu, Sabah, Malaysia 79
In Table 3, averages of important traits are presented for some series of accessionscollected in the centre of diversity or selected in local varieties from different countries(as indicated in column 2). Each series is represented by 4 to 45 clones (Scavinaincludes only two clones because of its importance as a source of resistance towitches’ broom) with obvious limitations in representation of some groups.Considerations were made for the groups of series representing more appropriately thedomesticated and wild types by the group of series forming.
Cluster analysis, using averages for the most important traits, separates the seriesof clones listed in Table 3 into two groups. The first group includes all series of wildmaterials, except SPA. The second group includes all series with domesticatedmaterial (column 10). It should be pointed out that the accessions of the SPA series areselections made in a stand from seeds collected in the wild and went through one cycleof selection. When three clusters are considered, the SPA series forms a separategroup besides the two groups containing series with domesticated and wild accessions(column 11).Table 2. Averages of scores for factors (Mean) related to different series ofgenotypes from the CEPEC´s germplasm collection and numbers of clones in eachseries (N)
Factor 1 Factor 2 Factor 3aSeries Mean N Series Mean N Series Mean N
TSH 1.567 4 EEG 1.1602 13 EES -25.67 5ICS 1.2654 18 SPA 1.1089 5 Scavina -38.96 2RIM 1.2328 25 SIC 1.033 41 TSA -40.67 6UF 1.2127 23 SIAL 0.9674 43 TSH -42.68 4P 1.0302 5 EET 0.9351 11 CEQEC -45.32 5IMC 0.8206 7 TSH 0.7256 4 CSUL -62.14 10SGU 0.7684 6 OC 0.3882 4 CAB -65.31 4OC 0.733 4 CA 0.2829 9 OC -74.12 4SC 0.6918 5 RIM 0.2728 25 CESEC -76.77 19TSA 0.5144 6 P 0.2641 5 NA -84.87 5CC 0.4641 14 CESEC 0.2415 19 POUND -86.35 11SPA 0.3388 5 SGU 0.1704 6 IMC -87.52 8EES* 0.2773 5 CC 0.1684 14 BE -91.29 8CA 0.2639 9 MOC 0.1052 3 PA -93.16 22EET 0.2071 11 TSA 0.0988 6 SPEC -96.13 3GS 0.1872 4 GS 0.0559 4 EET -96.54 11CAS 0.1407 3 EES 0.0366 5 RB -103.81 18BE 0.0658 8 SC -0.0264 5 CEPEC -105.43 134CEPEC 0.0604 134 ICS -0.0416 18 MA -106.94 5MA -0.0942 5 BE -0.1907 8 CAS -108.91 3PA -0.1541 22 CEPEC -0.269 134 SC -115.65 5CESEC** -0.1911 19 MA -0.2774 5 CJ -117.11 7SPEC -0.1951 3 POUND -0.3631 11 MOC -119.08 3MOC -0.2478 3 CJ -0.3667 7 ICS -121.98 18CJ -0.2576 7 CAS -0.4441 3 CA -124.73 9SIAL -0.4966 43 UF -0.48 23 GS -125.99 4CAB -0.6584 4 PA -0.5017 22 SIAL -127.29 43POUND -0.7197 11 IMC -0.5644 7 SGU -128.08 6EEG -0.7355 13 RB -0.5662 18 EEG -130.49 13SIC -0.7738 41 CSUL -0.7956 10 CC -138.26 14CEQEC** -0.8274 5 NA -0.7966 5 SPA -142.04 5NA -0.8892 5 CAB -0.8831 4 SIC -159.08 41Scavina -1.1494 2 SPEC -1.2569 3 UF -159.97 23RB -1.3006 18 Scavina -1.325 2 RIM -185.38 25CSUL -1.4134 10 CEQEC -1.4701 5 P -192.71 5MSD 1.5344 MSD 1.6595 MSD 78.515
16 – 17 October 2000, Kota Kinabalu, Sabah, Malaysia 80
MSD is the minimum significant difference, with α = 0.1.* EES are EET clones descending from Scavina.** CESEC and CEQEC are, respectively, selections in Scavina progenies at CEPEC and clonesof unknown origin of the CEPEC series.
When four clusters are considered, series from wild material with more resistance towitches’ broom are distinguished (Scavina, CEQEC, Cruzeiro Sul) (column 12) andwhen five groups are considered, series with selections from Ecuador and Bahia(Brazil) are separated from series selected in those countries further North (column13).
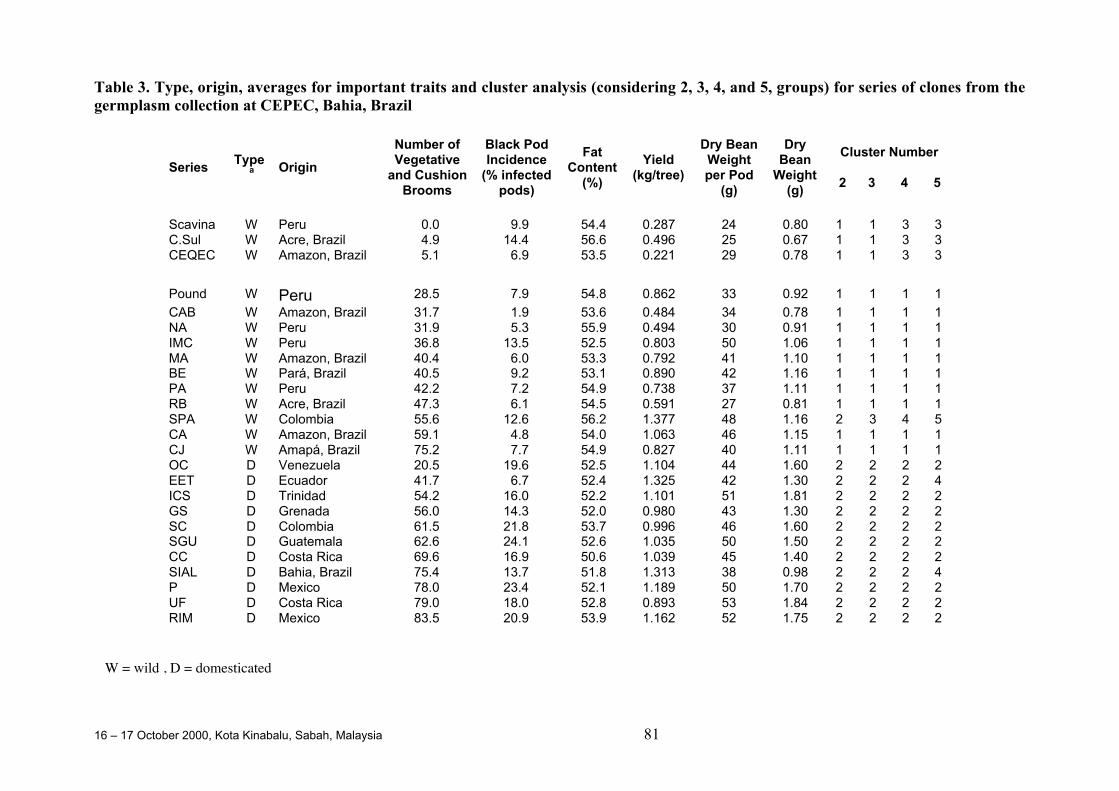
16 – 17 October 2000, Kota Kinabalu, Sabah, Malaysia 81
Table 3. Type, origin, averages for important traits and cluster analysis (considering 2, 3, 4, and 5, groups) for series of clones from thegermplasm collection at CEPEC, Bahia, Brazil
SeriesType
a Origin
Number ofVegetative
and CushionBrooms
Black PodIncidence
(% infectedpods)
FatContent
(%)
Yield(kg/tree)
Dry BeanWeightper Pod
(g)
DryBean
Weight(g)
Cluster Number
2 3 4 5
Scavina W Peru 0.0 9.9 54.4 0.287 24 0.80 1 1 3 3C.Sul W Acre, Brazil 4.9 14.4 56.6 0.496 25 0.67 1 1 3 3CEQEC W Amazon, Brazil 5.1 6.9 53.5 0.221 29 0.78 1 1 3 3
Pound W Peru 28.5 7.9 54.8 0.862 33 0.92 1 1 1 1
CAB W Amazon, Brazil 31.7 1.9 53.6 0.484 34 0.78 1 1 1 1NA W Peru 31.9 5.3 55.9 0.494 30 0.91 1 1 1 1IMC W Peru 36.8 13.5 52.5 0.803 50 1.06 1 1 1 1MA W Amazon, Brazil 40.4 6.0 53.3 0.792 41 1.10 1 1 1 1BE W Pará, Brazil 40.5 9.2 53.1 0.890 42 1.16 1 1 1 1PA W Peru 42.2 7.2 54.9 0.738 37 1.11 1 1 1 1RB W Acre, Brazil 47.3 6.1 54.5 0.591 27 0.81 1 1 1 1SPA W Colombia 55.6 12.6 56.2 1.377 48 1.16 2 3 4 5CA W Amazon, Brazil 59.1 4.8 54.0 1.063 46 1.15 1 1 1 1CJ W Amapá, Brazil 75.2 7.7 54.9 0.827 40 1.11 1 1 1 1OC D Venezuela 20.5 19.6 52.5 1.104 44 1.60 2 2 2 2EET D Ecuador 41.7 6.7 52.4 1.325 42 1.30 2 2 2 4ICS D Trinidad 54.2 16.0 52.2 1.101 51 1.81 2 2 2 2GS D Grenada 56.0 14.3 52.0 0.980 43 1.30 2 2 2 2SC D Colombia 61.5 21.8 53.7 0.996 46 1.60 2 2 2 2SGU D Guatemala 62.6 24.1 52.6 1.035 50 1.50 2 2 2 2CC D Costa Rica 69.6 16.9 50.6 1.039 45 1.40 2 2 2 2SIAL D Bahia, Brazil 75.4 13.7 51.8 1.313 38 0.98 2 2 2 4P D Mexico 78.0 23.4 52.1 1.189 50 1.70 2 2 2 2UF D Costa Rica 79.0 18.0 52.8 0.893 53 1.84 2 2 2 2RIM D Mexico 83.5 20.9 53.9 1.162 52 1.75 2 2 2 2
W = wild , D = domesticated
16 – 17 October 2000, Kota Kinabalu, Sabah, Malaysia 82
Among the 13 series with lower witches’ broom infection averages, only two are ofthe domesticated type. Apparently, genotypes more exposed to the disease are lessaffected than those that evolved in the absence of the disease. One could argue thatduring germplasm collection expeditions, preference was given to resistant plants.However, the efficiency of this selection is not high because of the relative lowinoculum pressure in the wild. Similarly, for black pod disease among the 12 series withsmaller frequency of pod losses, only one series includes domesticated material. Itshould be pointed out that black pod is not a disease specific to the genus Theobroma,and it is not a problem in wild populations. It is expected that the selection pressurewas larger in domesticated populations. A possible explanation for such results wouldbe the evolution and adaptation of the pathogen to these varieties. The high uniformityin these varieties and the loss of resistance alleles by genetic drift could be alternativeexplanations for the high infection averages. With respect to uniformity, it can bereported that the series RIM (domesticated) with 19 clones and RB (wild) with 17clones had pod losses between 10.3 and 35.7% and between 2.3 and 10.4%,respectively. Therefore, the reason for the low infection is not the high variability in theseries RB. Practically all RBs had losses smaller than the RIMs suggesting theoccurrence of resistance genes in the wild but not in the domesticated material.
The ten highest values for fat content were observed in wild materials and, in thiscase, there was no direct selection in any of the groups (domesticated vs wild). Apossible reason for this result is the negative correlation between this trait and yield(Pires et al. 1998), such that the selection of high yielding materials could havereduced the fat content.
As expected, the domesticated materials showed the larger means for single beanweight, bean weight per pod, and yield. In short, there are two distinct groups. Onegroup involves domesticated materials (Trinitario, Criollo or Lower Amazon clones) withhigh production and large bean and pod sizes. Another group involves wild Amazonmaterial with high resistance and high fat content. Therefore, hybridisation betweenthese groups is the obvious option for the development of superior cocoa varieties.Furthermore, resistance can be combined with good pod characteristics in onegeneration, exploiting heterosis for yield (e.g., crossing Scavina 6 with ICS 1).However, the progeny of genetically very distinct parents will be highly heterozygous,making the selection of new parents for the next cycles of recurrent selection moredifficult (if the interest is in hybrid varieties propagated by seeds). Crosses do notalways result in gains for important traits (e.g. resistance in the Scavina 6 x ICS 1progeny is not higher than in Scavina 6 and the bean weight is not as high as in ICS1).For the Brazilian programme, it is critical to accumulate genes for resistance to witches’broom in order to get durable resistance; therefore, it is necessary, also, to makecrosses within groups.
Genetic diversity revealed by molecular markersThe analysis of the diversity in the CEPEC collection, based on 133 polymorphic RAPDmarkers for 270 accessions of the germplasm collection, is shown in Figure 1(extracted from Marita 1998; see also Figure 1 in Marita et al. 2000, in which allgenotypes are represented). A similarity matrix is presented between 252 genotypesand 25 ‘reference’ clones well distributed and also present in other genetic diversitystudies (see other papers presented at this Workshop).
An important point is that the geographic groups are not completely distinct, asshown in Figure 1. Although there is a clear tendency for grouping of the LowerAmazon types at the base of the MDS plot, Trinitarios and Criollos to the right, UpperAmazon types to the left and at the base, and hybrids according to their ascendance,there is overlap between groups. Therefore, if molecular marker information is ignored,making crosses between an Upper Amazon with a Lower Amazon, or between twoUpper Amazons, could in fact include genotypes that are either genetically very distant
16 – 17 October 2000, Kota Kinabalu, Sabah, Malaysia 83
or very close. The result would not be definitive. This clearly illustrates the importanceof applying molecular markers to create base populations or inter-crossing groups.
In previous studies, the genetic groups were defined with less overlap between thegroups, but these studies involved smaller sample sizes and included fewer genotypesfrom the Brazilian Amazon (N´Goran et al. 1994; Figueira et al. 1994; Laurent et al.1994). Brazilian materials are very diverse, even if the CEPEC series that involvemainly hybrids are excluded (Figure 1). Genotypes from Ecuador are also diverse, inpart because they include hybrids (throughout the top centre of the MDS plot) andsome Amazon genotypes (on the left side). However, derivatives from the Nacionalvariety from Ecuador are close to each other on the top right. Another very diversegroup is that from Peru (middle-left side from the top to the base).
The large spread of the Upper Amazons indicates that breeding programmes basedpurely on materials from that region can exploit the possibility of heterosis and thevariability within this group. Scavina 6 and 12 (the two genotypes from Peru positionedon the top left of Figure 1) are very distinct genetically from nearly all other genotypes.This may be one of the reasons why Scavinas are good parental types, as is the casein crosses with some Trinitarios (ICSs) or Lower Amazons (e.g., SICs and SIALs).Crosses between local materials from Bahia (SIC, SIAL, EEG) with Trinitarios, not sogenetically distant, also give rise to good performance. However, in this case thegenotypes involved are good clones, and here it is possible that the additive effects aremore important than in the case of Scavina. Finally, the position of genotypes from theNacional variety from Ecuador (top right in Figure 1) indicates the possibility ofexploiting heterosis in crosses involving these and Upper or Lower Amazon genotypes.
Use of genetic diversity in breeding for resistance to witches’ broomAn important point that shows up from this study of genetic diversity is the possibility ofaccumulation of genes for resistance to witches’ broom (previous studies suggest thedisease is not controlled by a few genes, see Pires et al. 1999). This is illustrated in thesimilarity matrix among 252 genotypes (Annex 2) and in Tables 4 and 5. There, someaccessions (bold lettering in the Annex 1) among the 55 that exhibited an infection levelless than 20% of the overall average of the collection are presented (600 accessionswere evaluated from 1995 to 1999 with 178 included in the diversity study). Alsopresented are five clones (Amazon 15, CAB 148, CAB 157, MO 20, and U 32) involvedin the marker studies and among the 18 clones selected for witches´ broom resistancefrom the 127 new plant introductions in the germplasm collection. These clones wereselected as described above, but involved only three evaluations.
Among the clones selected with a less than 20% infection level, 43 have been citedas not related to Scavina and several of them are genetically very distinct (Table 4;note that not all clones were included in the marker analyses). While more uniformseries showed averages of similarities larger than 65% (SIC and SIAL with 78%, GUwith 84% and ICS with 67%), very low values were observed between Scavina 6 andother genotypes selected as resistant including Upper Amazon genotypes: Cruzeiro doSul (C.Sul), Pound, Ucayali (U), Amazon, Nanay (NA), Morona (MO), and MOQ).Scavina 6 progeny derived from crosses with very distinct genotypes also show arelatively low level of similarity with Scavina 6 (genotypes TSA, TSH, IAC, EET). Theseare identified by the typical distribution of the hybrids (see Figure 1 in Marita et al.2000).
Molecular data reveal 10 bands unique to Scavina 6 (present only in 8 to 15% out ofthe 292 genotypes analysed). Table 4 lists the proportion of these 10 unique bandspresent in other clones selected for resistance to witches’ broom. Considering theproportion of unique bands from Scavina and the similarity information for allgenotypes, different groupings can be observed. The first group includes hybridgenotypes (TSA, TSH, EET, IAC) with low similarity to Scavina and located in aposition in the MDS plot intermediate to their respective genetic lineage (Marita et al.2000).
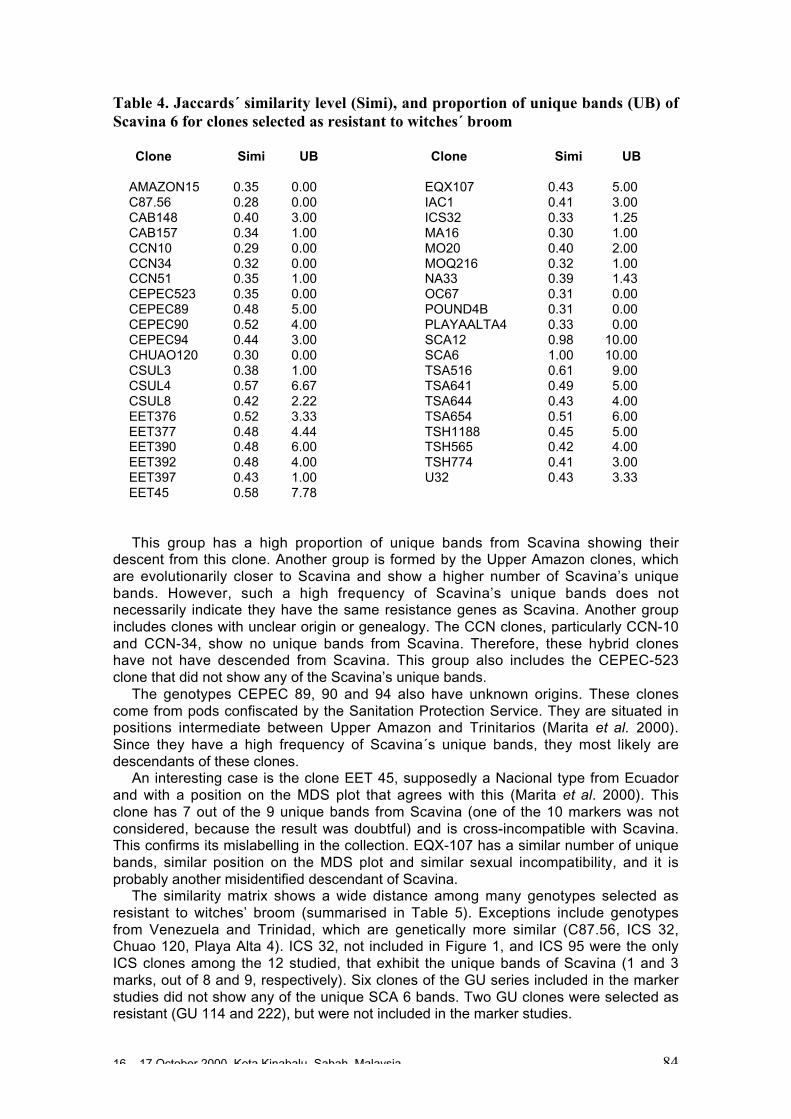
16 – 17 October 2000, Kota Kinabalu, Sabah, Malaysia 84
Table 4. Jaccards´ similarity level (Simi), and proportion of unique bands (UB) ofScavina 6 for clones selected as resistant to witches´ broom
Clone Simi UB Clone Simi UB
AMAZON15 0.35 0.00 EQX107 0.43 5.00C87.56 0.28 0.00 IAC1 0.41 3.00CAB148 0.40 3.00 ICS32 0.33 1.25CAB157 0.34 1.00 MA16 0.30 1.00CCN10 0.29 0.00 MO20 0.40 2.00CCN34 0.32 0.00 MOQ216 0.32 1.00CCN51 0.35 1.00 NA33 0.39 1.43CEPEC523 0.35 0.00 OC67 0.31 0.00CEPEC89 0.48 5.00 POUND4B 0.31 0.00CEPEC90 0.52 4.00 PLAYAALTA4 0.33 0.00CEPEC94 0.44 3.00 SCA12 0.98 10.00CHUAO120 0.30 0.00 SCA6 1.00 10.00CSUL3 0.38 1.00 TSA516 0.61 9.00CSUL4 0.57 6.67 TSA641 0.49 5.00CSUL8 0.42 2.22 TSA644 0.43 4.00EET376 0.52 3.33 TSA654 0.51 6.00EET377 0.48 4.44 TSH1188 0.45 5.00EET390 0.48 6.00 TSH565 0.42 4.00EET392 0.48 4.00 TSH774 0.41 3.00EET397 0.43 1.00 U32 0.43 3.33EET45 0.58 7.78
This group has a high proportion of unique bands from Scavina showing theirdescent from this clone. Another group is formed by the Upper Amazon clones, whichare evolutionarily closer to Scavina and show a higher number of Scavina’s uniquebands. However, such a high frequency of Scavina’s unique bands does notnecessarily indicate they have the same resistance genes as Scavina. Another groupincludes clones with unclear origin or genealogy. The CCN clones, particularly CCN-10and CCN-34, show no unique bands from Scavina. Therefore, these hybrid cloneshave not have descended from Scavina. This group also includes the CEPEC-523clone that did not show any of the Scavina’s unique bands.
The genotypes CEPEC 89, 90 and 94 also have unknown origins. These clonescome from pods confiscated by the Sanitation Protection Service. They are situated inpositions intermediate between Upper Amazon and Trinitarios (Marita et al. 2000).Since they have a high frequency of Scavina´s unique bands, they most likely aredescendants of these clones.
An interesting case is the clone EET 45, supposedly a Nacional type from Ecuadorand with a position on the MDS plot that agrees with this (Marita et al. 2000). Thisclone has 7 out of the 9 unique bands from Scavina (one of the 10 markers was notconsidered, because the result was doubtful) and is cross-incompatible with Scavina.This confirms its mislabelling in the collection. EQX-107 has a similar number of uniquebands, similar position on the MDS plot and similar sexual incompatibility, and it isprobably another misidentified descendant of Scavina.
The similarity matrix shows a wide distance among many genotypes selected asresistant to witches’ broom (summarised in Table 5). Exceptions include genotypesfrom Venezuela and Trinidad, which are genetically more similar (C87.56, ICS 32,Chuao 120, Playa Alta 4). ICS 32, not included in Figure 1, and ICS 95 were the onlyICS clones among the 12 studied, that exhibit the unique bands of Scavina (1 and 3marks, out of 8 and 9, respectively). Six clones of the GU series included in the markerstudies did not show any of the unique SCA 6 bands. Two GU clones were selected asresistant (GU 114 and 222), but were not included in the marker studies.
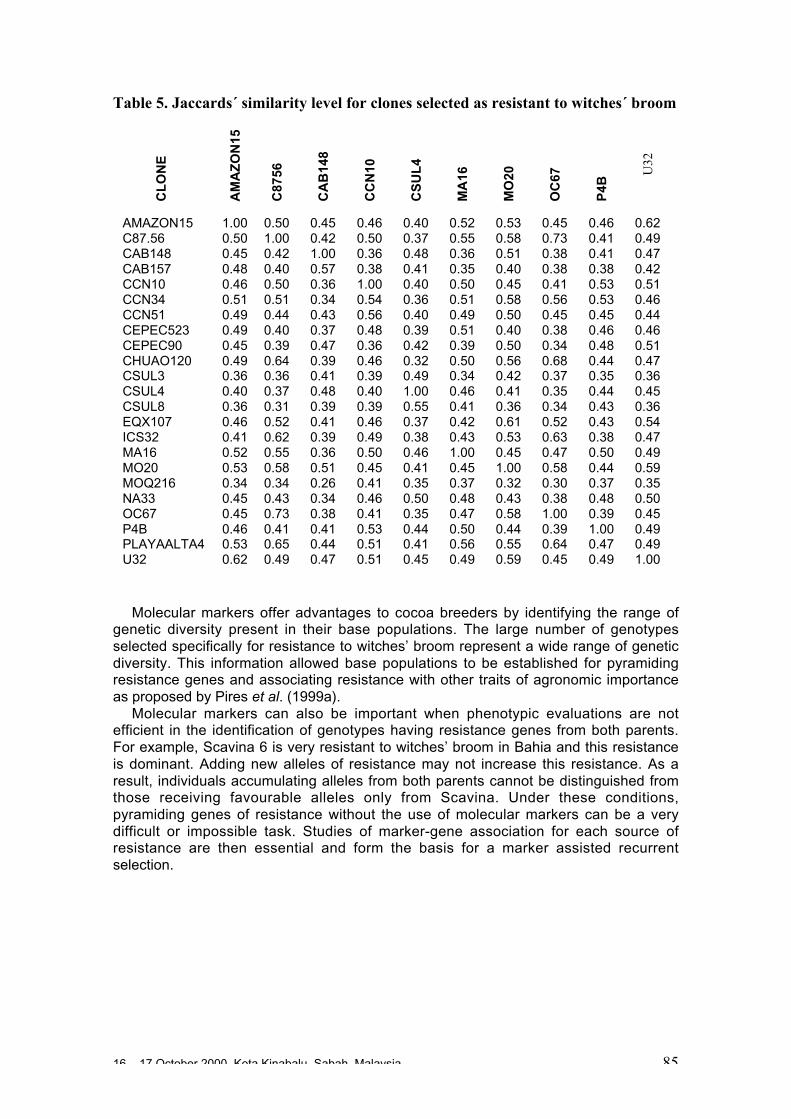
16 – 17 October 2000, Kota Kinabalu, Sabah, Malaysia 85
Table 5. Jaccards´ similarity level for clones selected as resistant to witches´ broom
CL
ON
E
AM
AZ
ON
15
C87
56
CA
B14
8
CC
N10
CS
UL
4
MA
16
MO
20
OC
67
P4B
U32
AMAZON15 1.00 0.50 0.45 0.46 0.40 0.52 0.53 0.45 0.46 0.62C87.56 0.50 1.00 0.42 0.50 0.37 0.55 0.58 0.73 0.41 0.49CAB148 0.45 0.42 1.00 0.36 0.48 0.36 0.51 0.38 0.41 0.47CAB157 0.48 0.40 0.57 0.38 0.41 0.35 0.40 0.38 0.38 0.42CCN10 0.46 0.50 0.36 1.00 0.40 0.50 0.45 0.41 0.53 0.51CCN34 0.51 0.51 0.34 0.54 0.36 0.51 0.58 0.56 0.53 0.46CCN51 0.49 0.44 0.43 0.56 0.40 0.49 0.50 0.45 0.45 0.44CEPEC523 0.49 0.40 0.37 0.48 0.39 0.51 0.40 0.38 0.46 0.46CEPEC90 0.45 0.39 0.47 0.36 0.42 0.39 0.50 0.34 0.48 0.51CHUAO120 0.49 0.64 0.39 0.46 0.32 0.50 0.56 0.68 0.44 0.47CSUL3 0.36 0.36 0.41 0.39 0.49 0.34 0.42 0.37 0.35 0.36CSUL4 0.40 0.37 0.48 0.40 1.00 0.46 0.41 0.35 0.44 0.45CSUL8 0.36 0.31 0.39 0.39 0.55 0.41 0.36 0.34 0.43 0.36EQX107 0.46 0.52 0.41 0.46 0.37 0.42 0.61 0.52 0.43 0.54ICS32 0.41 0.62 0.39 0.49 0.38 0.43 0.53 0.63 0.38 0.47MA16 0.52 0.55 0.36 0.50 0.46 1.00 0.45 0.47 0.50 0.49MO20 0.53 0.58 0.51 0.45 0.41 0.45 1.00 0.58 0.44 0.59MOQ216 0.34 0.34 0.26 0.41 0.35 0.37 0.32 0.30 0.37 0.35NA33 0.45 0.43 0.34 0.46 0.50 0.48 0.43 0.38 0.48 0.50OC67 0.45 0.73 0.38 0.41 0.35 0.47 0.58 1.00 0.39 0.45P4B 0.46 0.41 0.41 0.53 0.44 0.50 0.44 0.39 1.00 0.49PLAYAALTA4 0.53 0.65 0.44 0.51 0.41 0.56 0.55 0.64 0.47 0.49U32 0.62 0.49 0.47 0.51 0.45 0.49 0.59 0.45 0.49 1.00
Molecular markers offer advantages to cocoa breeders by identifying the range ofgenetic diversity present in their base populations. The large number of genotypesselected specifically for resistance to witches’ broom represent a wide range of geneticdiversity. This information allowed base populations to be established for pyramidingresistance genes and associating resistance with other traits of agronomic importanceas proposed by Pires et al. (1999a).
Molecular markers can also be important when phenotypic evaluations are notefficient in the identification of genotypes having resistance genes from both parents.For example, Scavina 6 is very resistant to witches’ broom in Bahia and this resistanceis dominant. Adding new alleles of resistance may not increase this resistance. As aresult, individuals accumulating alleles from both parents cannot be distinguished fromthose receiving favourable alleles only from Scavina. Under these conditions,pyramiding genes of resistance without the use of molecular markers can be a verydifficult or impossible task. Studies of marker-gene association for each source ofresistance are then essential and form the basis for a marker assisted recurrentselection.
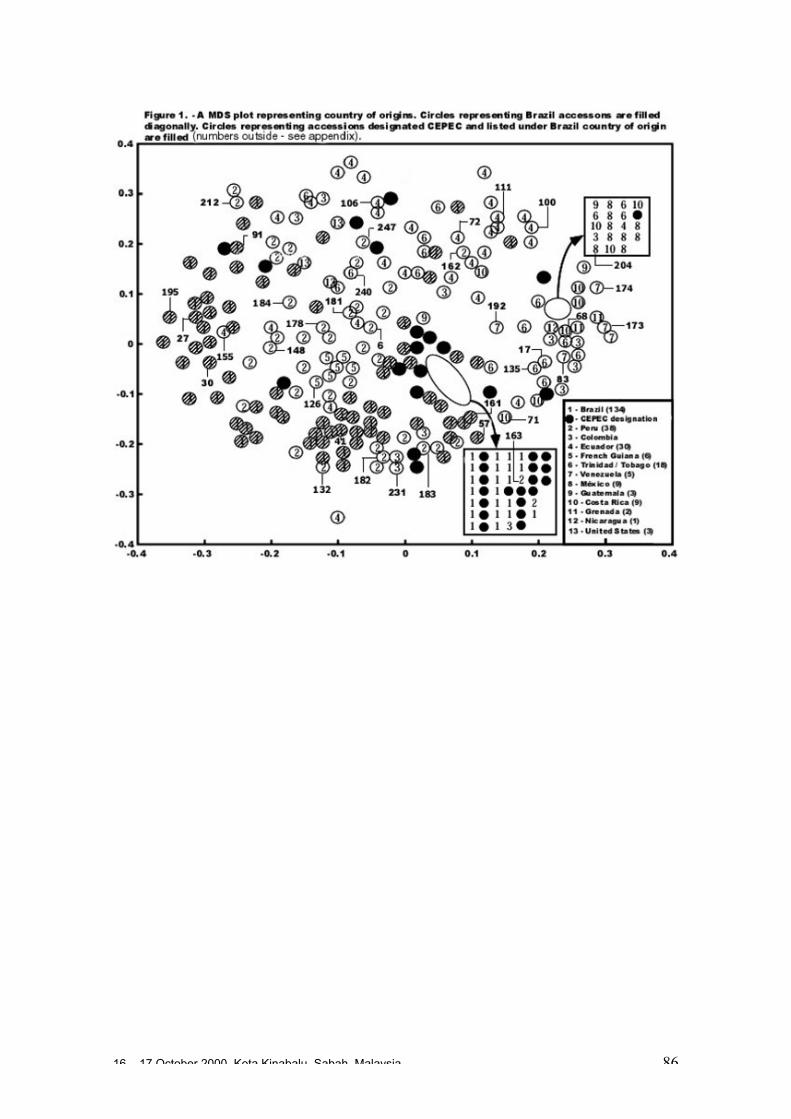
16 – 17 October 2000, Kota Kinabalu, Sabah, Malaysia 86
16 – 17 October 2000, Kota Kinabalu, Sabah, Malaysia 87
References
Clément D., A.B. Eskes, O. Sounigo and J.A.K. N’Goran. 1993. Amélioration génétique ducacaoyer en Côte d'Ivoire: présentation d'un nouveau schéma de sélection. Pages 451-456in Proceedings of the 11th International Cocoa Research Conference,1993, Yamoussoukro,Côte d’Ivoire. Cocoa Producers’ Alliance, London, U.K.
Figueira A., J. Janick, M. Levy and P. Goldsborough. 1994. Re-examining the classification ofTheobroma cacao L. using molecular markers. J. Amer. Soc. Hort. Sci. 119: 1073-1082.
Gower J. C. 1985. Measures of similarity, dissimilarity, and distance. Pages 297-405 inEncyclopaedia of statistical sciences 5 (Kots, S. and Johnson N.L., eds). Wiley, New York,U.S.A.
Laurent V., A.M. Risterucci and C. Lanaud. 1994. Genetic diversity in cocoa revealed by cDNAprobes. Theor. Appl. Genet. 88: 193-198.
Lockwood G. and J.T.Y. Pang. 1993. Additive inheritance of yield in cocoa. Pages 415-423 inProceedings of the 11th International Cocoa Research Conference, 1993, Cocoa Producers’Alliance, London, U.K.
Johnson R. A. and D.W. Wichern. 1999. Applied Multivariate Statistical Analysis. Prentice Hall,New Jersey, U.S.A. 816pp.
Mardia K. V., J.T. Kent and J.M. Bibby. 1997. Multivariate Analysis. Academic Press Inc., SanDiego, U.S.A. 518pp.
Marita J.M. 1998. Characterization of Theoboma cacao using RAPD-marker based estimates ofgenetic distance and recommendations for a core collection to maximise genetic diversity.MSc. Thesis. University of Wisconsin, USA.
Marita J. M., J. Nienhuis, J.L. Pires, and W.M. Aitken. 2000. Characterization of geneticdiversity in Theobroma cacao in relation to witches' broom disease. Crop Science. In press.
N’Goran J. A. K., V. Laurent, A.M. Risterucci and C. Lanaud. 1994. Comparative geneticdiversity studies of Theobroma cacao L. using RFLP and RAPD markers. Heredity 73: 589-597.
Pires J.L., W.R. Monteiro, L.R.M. Pinto and E.D.M.N. Luz. 1999. Resistance to witches' broom-Evaluation of genotypes from different origins. Pages 389-397 in Proceedings of the 12thInternational Cocoa Research Conference, Salvador, Brazil, 1996. Cocoa Producer'sAlliance, London, U.K.
Pires J. L., W.R. Monteiro, L.R.M. Pinto, M.M. Yamada and D. Anhert. 1999a. A proposal forcocoa breeding. Pages 287-292 in Proceedings of the 12th International Cocoa ResearchConference, Salvador, Brazil, 1996. Cocoa Producer's Alliance, London, U.K.
SAS Institute. 1990. SAS/STAT User’s Guide. Version 6. Fourth edition. SAS Institute Inc.,North Carolina, U.S.A.
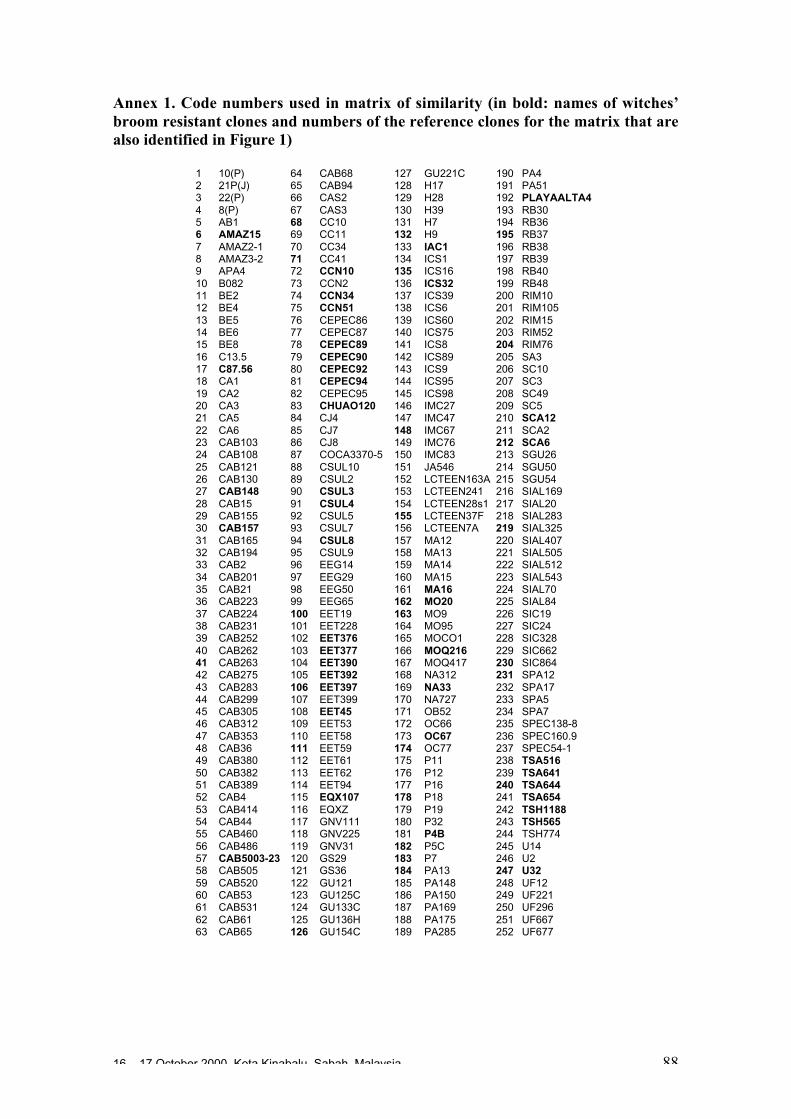
16 – 17 October 2000, Kota Kinabalu, Sabah, Malaysia 88
Annex 1. Code numbers used in matrix of similarity (in bold: names of witches’broom resistant clones and numbers of the reference clones for the matrix that arealso identified in Figure 1)
1 10(P) 64 CAB68 127 GU221C 190 PA42 21P(J) 65 CAB94 128 H17 191 PA513 22(P) 66 CAS2 129 H28 192 PLAYAALTA44 8(P) 67 CAS3 130 H39 193 RB305 AB1 68 CC10 131 H7 194 RB366 AMAZ15 69 CC11 132 H9 195 RB377 AMAZ2-1 70 CC34 133 IAC1 196 RB388 AMAZ3-2 71 CC41 134 ICS1 197 RB399 APA4 72 CCN10 135 ICS16 198 RB4010 B082 73 CCN2 136 ICS32 199 RB4811 BE2 74 CCN34 137 ICS39 200 RIM1012 BE4 75 CCN51 138 ICS6 201 RIM10513 BE5 76 CEPEC86 139 ICS60 202 RIM1514 BE6 77 CEPEC87 140 ICS75 203 RIM5215 BE8 78 CEPEC89 141 ICS8 204 RIM7616 C13.5 79 CEPEC90 142 ICS89 205 SA317 C87.56 80 CEPEC92 143 ICS9 206 SC1018 CA1 81 CEPEC94 144 ICS95 207 SC319 CA2 82 CEPEC95 145 ICS98 208 SC4920 CA3 83 CHUAO120 146 IMC27 209 SC521 CA5 84 CJ4 147 IMC47 210 SCA1222 CA6 85 CJ7 148 IMC67 211 SCA223 CAB103 86 CJ8 149 IMC76 212 SCA624 CAB108 87 COCA3370-5 150 IMC83 213 SGU2625 CAB121 88 CSUL10 151 JA546 214 SGU5026 CAB130 89 CSUL2 152 LCTEEN163A 215 SGU5427 CAB148 90 CSUL3 153 LCTEEN241 216 SIAL16928 CAB15 91 CSUL4 154 LCTEEN28s1 217 SIAL2029 CAB155 92 CSUL5 155 LCTEEN37F 218 SIAL28330 CAB157 93 CSUL7 156 LCTEEN7A 219 SIAL32531 CAB165 94 CSUL8 157 MA12 220 SIAL40732 CAB194 95 CSUL9 158 MA13 221 SIAL50533 CAB2 96 EEG14 159 MA14 222 SIAL51234 CAB201 97 EEG29 160 MA15 223 SIAL54335 CAB21 98 EEG50 161 MA16 224 SIAL7036 CAB223 99 EEG65 162 MO20 225 SIAL8437 CAB224 100 EET19 163 MO9 226 SIC1938 CAB231 101 EET228 164 MO95 227 SIC2439 CAB252 102 EET376 165 MOCO1 228 SIC32840 CAB262 103 EET377 166 MOQ216 229 SIC66241 CAB263 104 EET390 167 MOQ417 230 SIC86442 CAB275 105 EET392 168 NA312 231 SPA1243 CAB283 106 EET397 169 NA33 232 SPA1744 CAB299 107 EET399 170 NA727 233 SPA545 CAB305 108 EET45 171 OB52 234 SPA746 CAB312 109 EET53 172 OC66 235 SPEC138-847 CAB353 110 EET58 173 OC67 236 SPEC160.948 CAB36 111 EET59 174 OC77 237 SPEC54-149 CAB380 112 EET61 175 P11 238 TSA51650 CAB382 113 EET62 176 P12 239 TSA64151 CAB389 114 EET94 177 P16 240 TSA64452 CAB4 115 EQX107 178 P18 241 TSA65453 CAB414 116 EQXZ 179 P19 242 TSH118854 CAB44 117 GNV111 180 P32 243 TSH56555 CAB460 118 GNV225 181 P4B 244 TSH77456 CAB486 119 GNV31 182 P5C 245 U1457 CAB5003-23 120 GS29 183 P7 246 U258 CAB505 121 GS36 184 PA13 247 U3259 CAB520 122 GU121 185 PA148 248 UF1260 CAB53 123 GU125C 186 PA150 249 UF22161 CAB531 124 GU133C 187 PA169 250 UF29662 CAB61 125 GU136H 188 PA175 251 UF66763 CAB65 126 GU154C 189 PA285 252 UF677
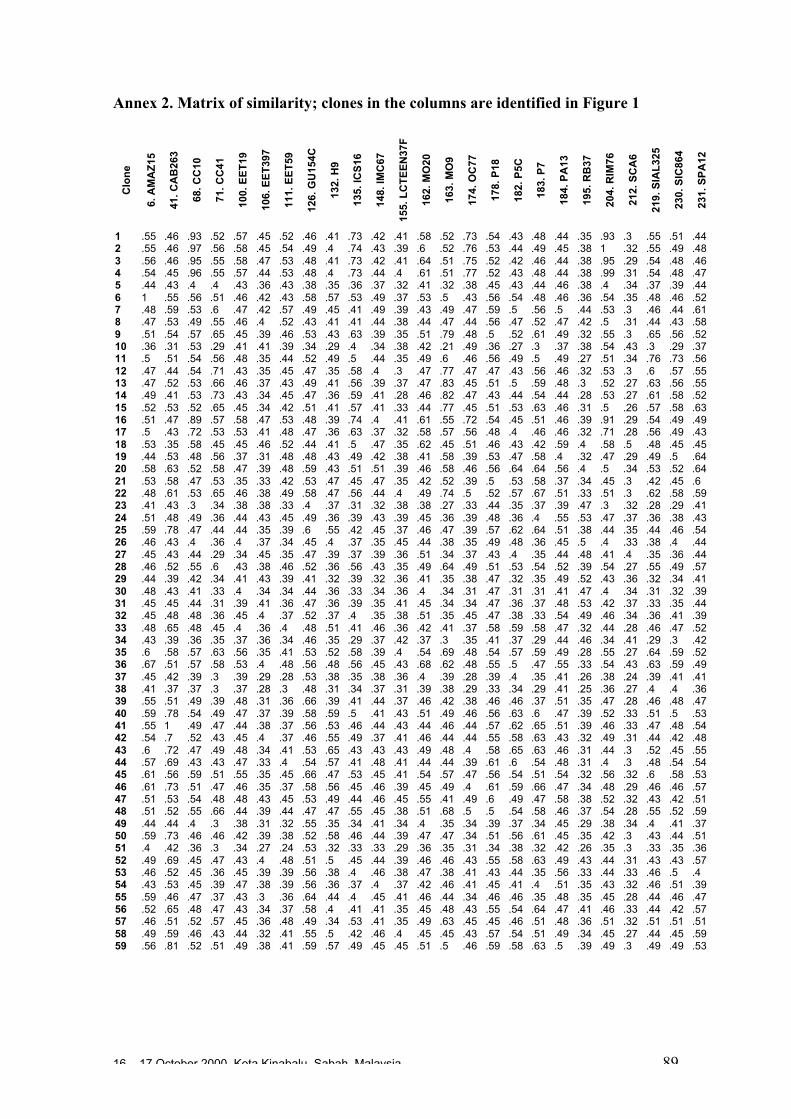
16 – 17 October 2000, Kota Kinabalu, Sabah, Malaysia 89
Annex 2. Matrix of similarity; clones in the columns are identified in Figure 1C
lon
e
6. A
MA
Z15
41. C
AB
263
68. C
C10
71. C
C41
100.
EE
T19
106.
EE
T39
7
111.
EE
T59
126.
GU
154C
132.
H9
135.
ICS
16
148.
IMC
67
155.
LC
TE
EN
37F
162.
MO
20
163.
MO
9
174.
OC
77
178.
P18
182.
P5C
183.
P7
184.
PA
13
195.
RB
37
204.
RIM
76
212.
SC
A6
219.
SIA
L32
5
230.
SIC
864
231.
SP
A12
1 .55 .46 .93 .52 .57 .45 .52 .46 .41 .73 .42 .41 .58 .52 .73 .54 .43 .48 .44 .35 .93 .3 .55 .51 .442 .55 .46 .97 .56 .58 .45 .54 .49 .4 .74 .43 .39 .6 .52 .76 .53 .44 .49 .45 .38 1 .32 .55 .49 .483 .56 .46 .95 .55 .58 .47 .53 .48 .41 .73 .42 .41 .64 .51 .75 .52 .42 .46 .44 .38 .95 .29 .54 .48 .464 .54 .45 .96 .55 .57 .44 .53 .48 .4 .73 .44 .4 .61 .51 .77 .52 .43 .48 .44 .38 .99 .31 .54 .48 .475 .44 .43 .4 .4 .43 .36 .43 .38 .35 .36 .37 .32 .41 .32 .38 .45 .43 .44 .46 .38 .4 .34 .37 .39 .446 1 .55 .56 .51 .46 .42 .43 .58 .57 .53 .49 .37 .53 .5 .43 .56 .54 .48 .46 .36 .54 .35 .48 .46 .527 .48 .59 .53 .6 .47 .42 .57 .49 .45 .41 .49 .39 .43 .49 .47 .59 .5 .56 .5 .44 .53 .3 .46 .44 .618 .47 .53 .49 .55 .46 .4 .52 .43 .41 .41 .44 .38 .44 .47 .44 .56 .47 .52 .47 .42 .5 .31 .44 .43 .589 .51 .54 .57 .65 .45 .39 .46 .53 .43 .63 .39 .35 .51 .79 .48 .5 .52 .61 .49 .32 .55 .3 .65 .56 .5210 .36 .31 .53 .29 .41 .41 .39 .34 .29 .4 .34 .38 .42 .21 .49 .36 .27 .3 .37 .38 .54 .43 .3 .29 .3711 .5 .51 .54 .56 .48 .35 .44 .52 .49 .5 .44 .35 .49 .6 .46 .56 .49 .5 .49 .27 .51 .34 .76 .73 .5612 .47 .44 .54 .71 .43 .35 .45 .47 .35 .58 .4 .3 .47 .77 .47 .47 .43 .56 .46 .32 .53 .3 .6 .57 .5513 .47 .52 .53 .66 .46 .37 .43 .49 .41 .56 .39 .37 .47 .83 .45 .51 .5 .59 .48 .3 .52 .27 .63 .56 .5514 .49 .41 .53 .73 .43 .34 .45 .47 .36 .59 .41 .28 .46 .82 .47 .43 .44 .54 .44 .28 .53 .27 .61 .58 .5215 .52 .53 .52 .65 .45 .34 .42 .51 .41 .57 .41 .33 .44 .77 .45 .51 .53 .63 .46 .31 .5 .26 .57 .58 .6316 .51 .47 .89 .57 .58 .47 .53 .48 .39 .74 .4 .41 .61 .55 .72 .54 .45 .51 .46 .39 .91 .29 .54 .49 .4917 .5 .43 .72 .53 .53 .41 .48 .47 .36 .63 .37 .32 .58 .57 .56 .48 .4 .46 .46 .32 .71 .28 .56 .49 .4318 .53 .35 .58 .45 .45 .46 .52 .44 .41 .5 .47 .35 .62 .45 .51 .46 .43 .42 .59 .4 .58 .5 .48 .45 .4519 .44 .53 .48 .56 .37 .31 .48 .48 .43 .49 .42 .38 .41 .58 .39 .53 .47 .58 .4 .32 .47 .29 .49 .5 .6420 .58 .63 .52 .58 .47 .39 .48 .59 .43 .51 .51 .39 .46 .58 .46 .56 .64 .64 .56 .4 .5 .34 .53 .52 .6421 .53 .58 .47 .53 .35 .33 .42 .53 .47 .45 .47 .35 .42 .52 .39 .5 .53 .58 .37 .34 .45 .3 .42 .45 .622 .48 .61 .53 .65 .46 .38 .49 .58 .47 .56 .44 .4 .49 .74 .5 .52 .57 .67 .51 .33 .51 .3 .62 .58 .5923 .41 .43 .3 .34 .38 .38 .33 .4 .37 .31 .32 .38 .38 .27 .33 .44 .35 .37 .39 .47 .3 .32 .28 .29 .4124 .51 .48 .49 .36 .44 .43 .45 .49 .36 .39 .43 .39 .45 .36 .39 .48 .36 .4 .55 .53 .47 .37 .36 .38 .4325 .59 .78 .47 .44 .44 .35 .39 .6 .55 .42 .45 .37 .46 .47 .39 .57 .62 .64 .51 .38 .44 .35 .44 .46 .5426 .46 .43 .4 .36 .4 .37 .34 .45 .4 .37 .35 .45 .44 .38 .35 .49 .48 .36 .45 .5 .4 .33 .38 .4 .4427 .45 .43 .44 .29 .34 .45 .35 .47 .39 .37 .39 .36 .51 .34 .37 .43 .4 .35 .44 .48 .41 .4 .35 .36 .4428 .46 .52 .55 .6 .43 .38 .46 .52 .36 .56 .43 .35 .49 .64 .49 .51 .53 .54 .52 .39 .54 .27 .55 .49 .5729 .44 .39 .42 .34 .41 .43 .39 .41 .32 .39 .32 .36 .41 .35 .38 .47 .32 .35 .49 .52 .43 .36 .32 .34 .4130 .48 .43 .41 .33 .4 .34 .34 .44 .36 .33 .34 .36 .4 .34 .31 .47 .31 .31 .41 .47 .4 .34 .31 .32 .3931 .45 .45 .44 .31 .39 .41 .36 .47 .36 .39 .35 .41 .45 .34 .34 .47 .36 .37 .48 .53 .42 .37 .33 .35 .4432 .45 .48 .48 .36 .45 .4 .37 .52 .37 .4 .35 .38 .51 .35 .45 .47 .38 .33 .54 .49 .46 .34 .36 .41 .3933 .48 .65 .48 .45 .4 .36 .4 .48 .51 .41 .46 .36 .42 .41 .37 .58 .59 .58 .47 .32 .44 .28 .46 .47 .5234 .43 .39 .36 .35 .37 .36 .34 .46 .35 .29 .37 .42 .37 .3 .35 .41 .37 .29 .44 .46 .34 .41 .29 .3 .4235 .6 .58 .57 .63 .56 .35 .41 .53 .52 .58 .39 .4 .54 .69 .48 .54 .57 .59 .49 .28 .55 .27 .64 .59 .5236 .67 .51 .57 .58 .53 .4 .48 .56 .48 .56 .45 .43 .68 .62 .48 .55 .5 .47 .55 .33 .54 .43 .63 .59 .4937 .45 .42 .39 .3 .39 .29 .28 .53 .38 .35 .38 .36 .4 .39 .28 .39 .4 .35 .41 .26 .38 .24 .39 .41 .4138 .41 .37 .37 .3 .37 .28 .3 .48 .31 .34 .37 .31 .39 .38 .29 .33 .34 .29 .41 .25 .36 .27 .4 .4 .3639 .55 .51 .49 .39 .48 .31 .36 .66 .39 .41 .44 .37 .46 .42 .38 .46 .46 .37 .51 .35 .47 .28 .46 .48 .4740 .59 .78 .54 .49 .47 .37 .39 .58 .59 .5 .41 .43 .51 .49 .46 .56 .63 .6 .47 .39 .52 .33 .51 .5 .5341 .55 1 .49 .47 .44 .38 .37 .56 .53 .46 .44 .43 .44 .46 .44 .57 .62 .65 .51 .39 .46 .33 .47 .48 .5442 .54 .7 .52 .43 .45 .4 .37 .46 .55 .49 .37 .41 .46 .44 .44 .55 .58 .63 .43 .32 .49 .31 .44 .42 .4843 .6 .72 .47 .49 .48 .34 .41 .53 .65 .43 .43 .43 .49 .48 .4 .58 .65 .63 .46 .31 .44 .3 .52 .45 .5544 .57 .69 .43 .43 .47 .33 .4 .54 .57 .41 .48 .41 .44 .44 .39 .61 .6 .54 .48 .31 .4 .3 .48 .54 .5445 .61 .56 .59 .51 .55 .35 .45 .66 .47 .53 .45 .41 .54 .57 .47 .56 .54 .51 .54 .32 .56 .32 .6 .58 .5346 .61 .73 .51 .47 .46 .35 .37 .58 .56 .45 .46 .39 .45 .49 .4 .61 .59 .66 .47 .34 .48 .29 .46 .46 .5747 .51 .53 .54 .48 .48 .43 .45 .53 .49 .44 .46 .45 .55 .41 .49 .6 .49 .47 .58 .38 .52 .32 .43 .42 .5148 .51 .52 .55 .66 .44 .39 .44 .47 .47 .55 .45 .38 .51 .68 .5 .5 .54 .58 .46 .37 .54 .28 .55 .52 .5949 .44 .44 .4 .3 .38 .31 .32 .55 .35 .34 .41 .34 .4 .35 .34 .39 .37 .34 .45 .29 .38 .34 .4 .41 .3750 .59 .73 .46 .46 .42 .39 .38 .52 .58 .46 .44 .39 .47 .47 .34 .51 .56 .61 .45 .35 .42 .3 .43 .44 .5151 .4 .42 .36 .3 .34 .27 .24 .53 .32 .33 .33 .29 .36 .35 .31 .34 .38 .32 .42 .26 .35 .3 .33 .35 .3652 .49 .69 .45 .47 .43 .4 .48 .51 .5 .45 .44 .39 .46 .46 .43 .55 .58 .63 .49 .43 .44 .31 .43 .43 .5753 .46 .52 .45 .36 .45 .39 .39 .56 .38 .4 .46 .38 .47 .38 .41 .43 .44 .35 .56 .33 .44 .33 .46 .5 .454 .43 .53 .45 .39 .47 .38 .39 .56 .36 .37 .4 .37 .42 .46 .41 .45 .41 .4 .51 .35 .43 .32 .46 .51 .3955 .59 .46 .47 .37 .43 .3 .36 .64 .44 .4 .45 .41 .46 .44 .34 .46 .46 .35 .48 .35 .45 .28 .44 .46 .4756 .52 .65 .48 .47 .43 .34 .37 .58 .4 .41 .41 .35 .45 .48 .43 .55 .54 .64 .47 .41 .46 .33 .44 .42 .5757 .46 .51 .52 .57 .45 .36 .48 .49 .34 .53 .41 .35 .49 .63 .45 .45 .46 .51 .48 .36 .51 .32 .51 .51 .5158 .49 .59 .46 .43 .44 .32 .41 .55 .5 .42 .46 .4 .45 .45 .43 .57 .54 .51 .49 .34 .45 .27 .44 .45 .5959 .56 .81 .52 .51 .49 .38 .41 .59 .57 .49 .45 .45 .51 .5 .46 .59 .58 .63 .5 .39 .49 .3 .49 .49 .53
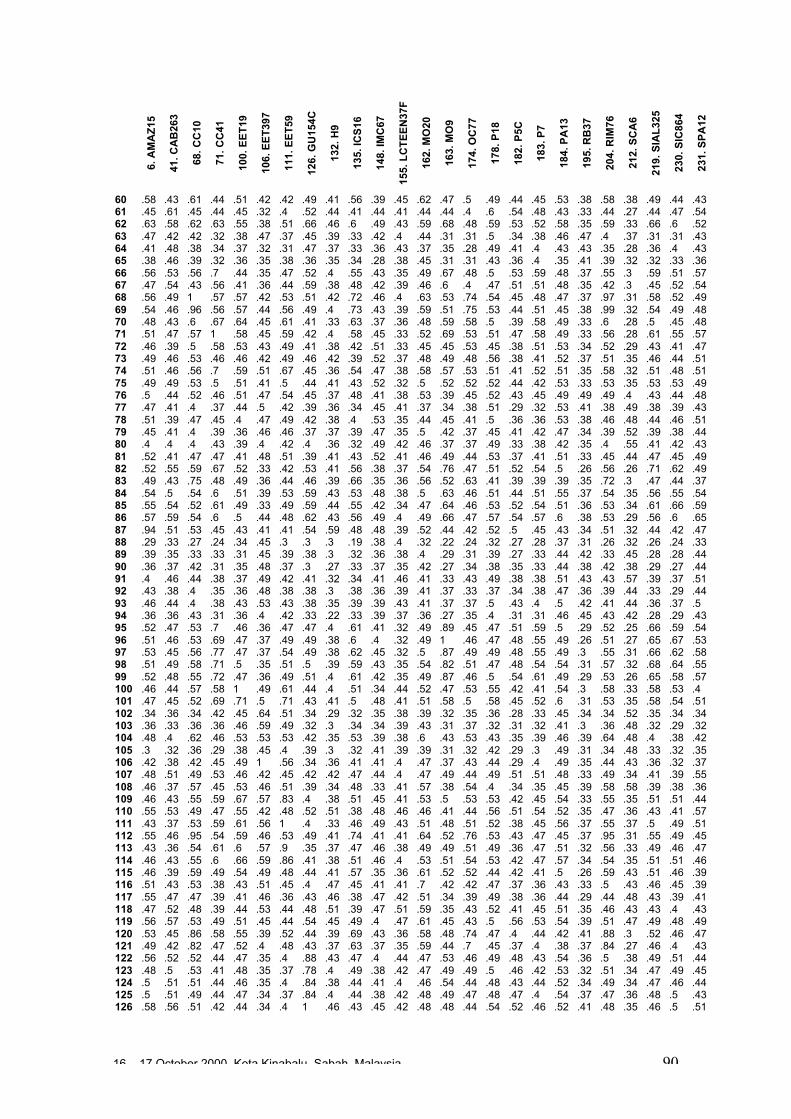
16 – 17 October 2000, Kota Kinabalu, Sabah, Malaysia 90
6. A
MA
Z15
41. C
AB
263
68. C
C10
71. C
C41
100.
EE
T19
106.
EE
T39
7
111.
EE
T59
126.
GU
154C
132.
H9
135.
ICS
16
148.
IMC
67
155.
LC
TE
EN
37F
162.
MO
20
163.
MO
9
174.
OC
77
178.
P18
182.
P5C
183.
P7
184.
PA
13
195.
RB
37
204.
RIM
76
212.
SC
A6
219.
SIA
L32
5
230.
SIC
864
231.
SP
A12
60 .58 .43 .61 .44 .51 .42 .42 .49 .41 .56 .39 .45 .62 .47 .5 .49 .44 .45 .53 .38 .58 .38 .49 .44 .4361 .45 .61 .45 .44 .45 .32 .4 .52 .44 .41 .44 .41 .44 .44 .4 .6 .54 .48 .43 .33 .44 .27 .44 .47 .5462 .63 .58 .62 .63 .55 .38 .51 .66 .46 .6 .49 .43 .59 .68 .48 .59 .53 .52 .58 .35 .59 .33 .66 .6 .5263 .47 .42 .42 .32 .38 .47 .37 .45 .39 .33 .42 .4 .44 .31 .31 .5 .34 .38 .46 .47 .4 .37 .31 .31 .4364 .41 .48 .38 .34 .37 .32 .31 .47 .37 .33 .36 .43 .37 .35 .28 .49 .41 .4 .43 .43 .35 .28 .36 .4 .4365 .38 .46 .39 .32 .36 .35 .38 .36 .35 .34 .28 .38 .45 .31 .31 .43 .36 .4 .35 .41 .39 .32 .32 .33 .3666 .56 .53 .56 .7 .44 .35 .47 .52 .4 .55 .43 .35 .49 .67 .48 .5 .53 .59 .48 .37 .55 .3 .59 .51 .5767 .47 .54 .43 .56 .41 .36 .44 .59 .38 .48 .42 .39 .46 .6 .4 .47 .51 .51 .48 .35 .42 .3 .45 .52 .5468 .56 .49 1 .57 .57 .42 .53 .51 .42 .72 .46 .4 .63 .53 .74 .54 .45 .48 .47 .37 .97 .31 .58 .52 .4969 .54 .46 .96 .56 .57 .44 .56 .49 .4 .73 .43 .39 .59 .51 .75 .53 .44 .51 .45 .38 .99 .32 .54 .49 .4870 .48 .43 .6 .67 .64 .45 .61 .41 .33 .63 .37 .36 .48 .59 .58 .5 .39 .58 .49 .33 .6 .28 .5 .45 .4871 .51 .47 .57 1 .58 .45 .59 .42 .4 .58 .45 .33 .52 .69 .53 .51 .47 .58 .49 .33 .56 .28 .61 .55 .5772 .46 .39 .5 .58 .53 .43 .49 .41 .38 .42 .51 .33 .45 .45 .53 .45 .38 .51 .53 .34 .52 .29 .43 .41 .4773 .49 .46 .53 .46 .46 .42 .49 .46 .42 .39 .52 .37 .48 .49 .48 .56 .38 .41 .52 .37 .51 .35 .46 .44 .5174 .51 .46 .56 .7 .59 .51 .67 .45 .36 .54 .47 .38 .58 .57 .53 .51 .41 .52 .51 .35 .58 .32 .51 .48 .5175 .49 .49 .53 .5 .51 .41 .5 .44 .41 .43 .52 .32 .5 .52 .52 .52 .44 .42 .53 .33 .53 .35 .53 .53 .4976 .5 .44 .52 .46 .51 .47 .54 .45 .37 .48 .41 .38 .53 .39 .45 .52 .43 .45 .49 .49 .49 .4 .43 .44 .4877 .47 .41 .4 .37 .44 .5 .42 .39 .36 .34 .45 .41 .37 .34 .38 .51 .29 .32 .53 .41 .38 .49 .38 .39 .4378 .51 .39 .47 .45 .4 .47 .49 .42 .38 .4 .53 .35 .44 .45 .41 .5 .36 .36 .53 .38 .46 .48 .44 .46 .5179 .45 .41 .4 .39 .36 .46 .46 .37 .37 .39 .47 .35 .5 .42 .37 .45 .41 .42 .47 .34 .39 .52 .39 .38 .4480 .4 .4 .4 .43 .39 .4 .42 .4 .36 .32 .49 .42 .46 .37 .37 .49 .33 .38 .42 .35 .4 .55 .41 .42 .4381 .52 .41 .47 .47 .41 .48 .51 .39 .41 .43 .52 .41 .46 .49 .44 .53 .37 .41 .51 .33 .45 .44 .47 .45 .4982 .52 .55 .59 .67 .52 .33 .42 .53 .41 .56 .38 .37 .54 .76 .47 .51 .52 .54 .5 .26 .56 .26 .71 .62 .4983 .49 .43 .75 .48 .49 .36 .44 .46 .39 .66 .35 .36 .56 .52 .63 .41 .39 .39 .39 .35 .72 .3 .47 .44 .3784 .54 .5 .54 .6 .51 .39 .53 .59 .43 .53 .48 .38 .5 .63 .46 .51 .44 .51 .55 .37 .54 .35 .56 .55 .5485 .55 .54 .52 .61 .49 .33 .49 .59 .44 .55 .42 .34 .47 .64 .46 .53 .52 .54 .51 .36 .53 .34 .61 .66 .5986 .57 .59 .54 .6 .5 .44 .48 .62 .43 .56 .49 .4 .49 .66 .47 .57 .54 .57 .6 .38 .53 .29 .56 .6 .6587 .94 .51 .53 .45 .43 .41 .41 .54 .59 .48 .48 .39 .52 .44 .42 .52 .5 .45 .43 .34 .51 .32 .44 .42 .4788 .29 .33 .27 .24 .34 .45 .3 .3 .3 .19 .38 .4 .32 .22 .24 .32 .27 .28 .37 .31 .26 .32 .26 .24 .3389 .39 .35 .33 .33 .31 .45 .39 .38 .3 .32 .36 .38 .4 .29 .31 .39 .27 .33 .44 .42 .33 .45 .28 .28 .4490 .36 .37 .42 .31 .35 .48 .37 .3 .27 .33 .37 .35 .42 .27 .34 .38 .35 .33 .44 .38 .42 .38 .29 .27 .4491 .4 .46 .44 .38 .37 .49 .42 .41 .32 .34 .41 .46 .41 .33 .43 .49 .38 .38 .51 .43 .43 .57 .39 .37 .5192 .43 .38 .4 .35 .36 .48 .38 .38 .3 .38 .36 .39 .41 .37 .33 .37 .34 .38 .47 .36 .39 .44 .33 .29 .4493 .46 .44 .4 .38 .43 .53 .43 .38 .35 .39 .39 .43 .41 .37 .37 .5 .43 .4 .5 .42 .41 .44 .36 .37 .594 .36 .36 .43 .31 .36 .4 .42 .33 .22 .33 .39 .37 .36 .27 .35 .4 .31 .31 .46 .45 .43 .42 .28 .29 .4395 .52 .47 .53 .7 .46 .36 .47 .47 .4 .61 .41 .32 .49 .89 .45 .47 .51 .59 .5 .29 .52 .25 .66 .59 .5496 .51 .46 .53 .69 .47 .37 .49 .49 .38 .6 .4 .32 .49 1 .46 .47 .48 .55 .49 .26 .51 .27 .65 .67 .5397 .53 .45 .56 .77 .47 .37 .54 .49 .38 .62 .45 .32 .5 .87 .49 .49 .48 .55 .49 .3 .55 .31 .66 .62 .5898 .51 .49 .58 .71 .5 .35 .51 .5 .39 .59 .43 .35 .54 .82 .51 .47 .48 .54 .54 .31 .57 .32 .68 .64 .5599 .52 .48 .55 .72 .47 .36 .49 .51 .4 .61 .42 .35 .49 .87 .46 .5 .54 .61 .49 .29 .53 .26 .65 .58 .57100 .46 .44 .57 .58 1 .49 .61 .44 .4 .51 .34 .44 .52 .47 .53 .55 .42 .41 .54 .3 .58 .33 .58 .53 .4101 .47 .45 .52 .69 .71 .5 .71 .43 .41 .5 .48 .41 .51 .58 .5 .58 .45 .52 .6 .31 .53 .35 .58 .54 .51102 .34 .36 .34 .42 .45 .64 .51 .34 .29 .32 .35 .38 .39 .32 .35 .36 .28 .33 .45 .34 .34 .52 .35 .34 .34103 .36 .33 .36 .36 .46 .59 .49 .32 .3 .34 .34 .39 .43 .31 .37 .32 .31 .32 .41 .3 .36 .48 .32 .29 .32104 .48 .4 .62 .46 .53 .53 .53 .42 .35 .53 .39 .38 .6 .43 .53 .43 .35 .39 .46 .39 .64 .48 .4 .38 .42105 .3 .32 .36 .29 .38 .45 .4 .39 .3 .32 .41 .39 .39 .31 .32 .42 .29 .3 .49 .31 .34 .48 .33 .32 .35106 .42 .38 .42 .45 .49 1 .56 .34 .36 .41 .41 .4 .47 .37 .43 .44 .29 .4 .49 .35 .44 .43 .36 .32 .37107 .48 .51 .49 .53 .46 .42 .45 .42 .42 .47 .44 .4 .47 .49 .44 .49 .51 .51 .48 .33 .49 .34 .41 .39 .55108 .46 .37 .57 .45 .53 .46 .51 .39 .34 .48 .33 .41 .57 .38 .54 .4 .34 .35 .45 .39 .58 .58 .39 .38 .36109 .46 .43 .55 .59 .67 .57 .83 .4 .38 .51 .45 .41 .53 .5 .53 .53 .42 .45 .54 .33 .55 .35 .51 .51 .44110 .55 .53 .49 .47 .55 .42 .48 .52 .51 .38 .48 .46 .46 .41 .44 .56 .51 .54 .52 .35 .47 .36 .43 .41 .57111 .43 .37 .53 .59 .61 .56 1 .4 .33 .46 .49 .43 .51 .48 .51 .52 .38 .45 .56 .37 .55 .37 .5 .49 .51112 .55 .46 .95 .54 .59 .46 .53 .49 .41 .74 .41 .41 .64 .52 .76 .53 .43 .47 .45 .37 .95 .31 .55 .49 .45113 .43 .36 .54 .61 .6 .57 .9 .35 .37 .47 .46 .38 .49 .49 .51 .49 .36 .47 .51 .32 .56 .33 .49 .46 .47114 .46 .43 .55 .6 .66 .59 .86 .41 .38 .51 .46 .4 .53 .51 .54 .53 .42 .47 .57 .34 .54 .35 .51 .51 .46115 .46 .39 .59 .49 .54 .49 .48 .44 .41 .57 .35 .36 .61 .52 .52 .44 .42 .41 .5 .26 .59 .43 .51 .46 .39116 .51 .43 .53 .38 .43 .51 .45 .4 .47 .45 .41 .41 .7 .42 .42 .47 .37 .36 .43 .33 .5 .43 .46 .45 .39117 .55 .47 .47 .39 .41 .46 .36 .43 .46 .38 .47 .42 .51 .34 .39 .49 .38 .36 .44 .29 .44 .48 .43 .39 .41118 .47 .52 .48 .39 .44 .53 .44 .48 .51 .39 .47 .51 .59 .35 .43 .52 .41 .45 .51 .35 .46 .43 .43 .4 .43119 .56 .57 .53 .49 .51 .45 .44 .54 .45 .49 .4 .47 .61 .45 .43 .5 .56 .53 .54 .39 .51 .47 .49 .48 .49120 .53 .45 .86 .58 .55 .39 .52 .44 .39 .69 .43 .36 .58 .48 .74 .47 .4 .44 .42 .41 .88 .3 .52 .46 .47121 .49 .42 .82 .47 .52 .4 .48 .43 .37 .63 .37 .35 .59 .44 .7 .45 .37 .4 .38 .37 .84 .27 .46 .4 .43122 .56 .52 .52 .44 .47 .35 .4 .88 .43 .47 .4 .44 .47 .53 .46 .49 .48 .43 .54 .36 .5 .38 .49 .51 .44123 .48 .5 .53 .41 .48 .35 .37 .78 .4 .49 .38 .42 .47 .49 .49 .5 .46 .42 .53 .32 .51 .34 .47 .49 .45124 .5 .51 .51 .44 .46 .35 .4 .84 .38 .44 .41 .4 .46 .54 .44 .48 .43 .44 .52 .34 .49 .34 .47 .46 .44125 .5 .51 .49 .44 .47 .34 .37 .84 .4 .44 .38 .42 .48 .49 .47 .48 .47 .4 .54 .37 .47 .36 .48 .5 .43126 .58 .56 .51 .42 .44 .34 .4 1 .46 .43 .45 .42 .48 .48 .44 .54 .52 .46 .52 .41 .48 .35 .46 .5 .51
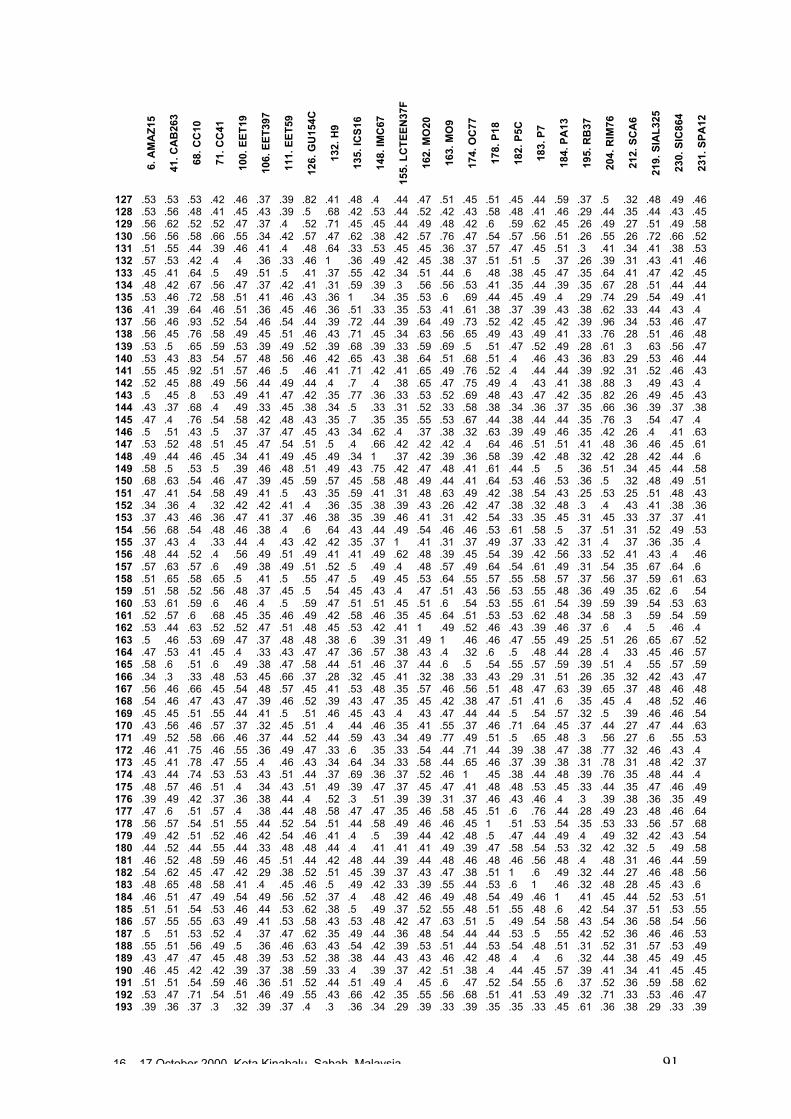
16 – 17 October 2000, Kota Kinabalu, Sabah, Malaysia 91
6. A
MA
Z15
41. C
AB
263
68. C
C10
71. C
C41
100.
EE
T19
106.
EE
T39
7
111.
EE
T59
126.
GU
154C
132.
H9
135.
ICS
16
148.
IMC
67
155.
LC
TE
EN
37F
162.
MO
20
163.
MO
9
174.
OC
77
178.
P18
182.
P5C
183.
P7
184.
PA
13
195.
RB
37
204.
RIM
76
212.
SC
A6
219.
SIA
L32
5
230.
SIC
864
231.
SP
A12
127 .53 .53 .53 .42 .46 .37 .39 .82 .41 .48 .4 .44 .47 .51 .45 .51 .45 .44 .59 .37 .5 .32 .48 .49 .46128 .53 .56 .48 .41 .45 .43 .39 .5 .68 .42 .53 .44 .52 .42 .43 .58 .48 .41 .46 .29 .44 .35 .44 .43 .45129 .56 .62 .52 .52 .47 .37 .4 .52 .71 .45 .45 .44 .49 .48 .42 .6 .59 .62 .45 .26 .49 .27 .51 .49 .58130 .56 .56 .58 .66 .55 .34 .42 .57 .47 .62 .38 .42 .57 .76 .47 .54 .57 .56 .51 .26 .55 .26 .72 .66 .52131 .51 .55 .44 .39 .46 .41 .4 .48 .64 .33 .53 .45 .45 .36 .37 .57 .47 .45 .51 .3 .41 .34 .41 .38 .53132 .57 .53 .42 .4 .4 .36 .33 .46 1 .36 .49 .42 .45 .38 .37 .51 .51 .5 .37 .26 .39 .31 .43 .41 .46133 .45 .41 .64 .5 .49 .51 .5 .41 .37 .55 .42 .34 .51 .44 .6 .48 .38 .45 .47 .35 .64 .41 .47 .42 .45134 .48 .42 .67 .56 .47 .37 .42 .41 .31 .59 .39 .3 .56 .56 .53 .41 .35 .44 .39 .35 .67 .28 .51 .44 .44135 .53 .46 .72 .58 .51 .41 .46 .43 .36 1 .34 .35 .53 .6 .69 .44 .45 .49 .4 .29 .74 .29 .54 .49 .41136 .41 .39 .64 .46 .51 .36 .45 .46 .36 .51 .33 .35 .53 .41 .61 .38 .37 .39 .43 .38 .62 .33 .44 .43 .4137 .56 .46 .93 .52 .54 .46 .54 .44 .39 .72 .44 .39 .64 .49 .73 .52 .42 .45 .42 .39 .96 .34 .53 .46 .47138 .56 .45 .76 .58 .49 .45 .51 .46 .43 .71 .45 .34 .63 .56 .65 .49 .43 .49 .41 .33 .76 .28 .51 .46 .48139 .53 .5 .65 .59 .53 .39 .49 .52 .39 .68 .39 .33 .59 .69 .5 .51 .47 .52 .49 .28 .61 .3 .63 .56 .47140 .53 .43 .83 .54 .57 .48 .56 .46 .42 .65 .43 .38 .64 .51 .68 .51 .4 .46 .43 .36 .83 .29 .53 .46 .44141 .55 .45 .92 .51 .57 .46 .5 .46 .41 .71 .42 .41 .65 .49 .76 .52 .4 .44 .44 .39 .92 .31 .52 .46 .43142 .52 .45 .88 .49 .56 .44 .49 .44 .4 .7 .4 .38 .65 .47 .75 .49 .4 .43 .41 .38 .88 .3 .49 .43 .4143 .5 .45 .8 .53 .49 .41 .47 .42 .35 .77 .36 .33 .53 .52 .69 .48 .43 .47 .42 .35 .82 .26 .49 .45 .43144 .43 .37 .68 .4 .49 .33 .45 .38 .34 .5 .33 .31 .52 .33 .58 .38 .34 .36 .37 .35 .66 .36 .39 .37 .38145 .47 .4 .76 .54 .58 .42 .48 .43 .35 .7 .35 .35 .55 .53 .67 .44 .38 .44 .44 .35 .76 .3 .54 .47 .4146 .5 .51 .43 .5 .37 .37 .47 .45 .43 .34 .62 .4 .37 .38 .32 .63 .39 .49 .46 .35 .42 .26 .4 .41 .63147 .53 .52 .48 .51 .45 .47 .54 .51 .5 .4 .66 .42 .42 .42 .4 .64 .46 .51 .51 .41 .48 .36 .46 .45 .61148 .49 .44 .46 .45 .34 .41 .49 .45 .49 .34 1 .37 .42 .39 .36 .58 .39 .42 .48 .32 .42 .28 .42 .44 .6149 .58 .5 .53 .5 .39 .46 .48 .51 .49 .43 .75 .42 .47 .48 .41 .61 .44 .5 .5 .36 .51 .34 .45 .44 .58150 .68 .63 .54 .46 .47 .39 .45 .59 .57 .45 .58 .48 .49 .44 .41 .64 .53 .46 .53 .36 .5 .32 .48 .49 .51151 .47 .41 .54 .58 .49 .41 .5 .43 .35 .59 .41 .31 .48 .63 .49 .42 .38 .54 .43 .25 .53 .25 .51 .48 .43152 .34 .36 .4 .32 .42 .42 .41 .4 .36 .35 .38 .39 .43 .26 .42 .47 .38 .32 .48 .3 .4 .43 .41 .38 .36153 .37 .43 .46 .36 .47 .41 .37 .46 .38 .35 .39 .46 .41 .31 .42 .54 .33 .35 .45 .31 .45 .33 .37 .37 .41154 .56 .68 .54 .48 .46 .38 .4 .6 .64 .43 .44 .49 .54 .46 .46 .53 .61 .58 .5 .37 .51 .31 .52 .49 .53155 .37 .43 .4 .33 .44 .4 .43 .42 .42 .35 .37 1 .41 .31 .37 .49 .37 .33 .42 .31 .4 .37 .36 .35 .4156 .48 .44 .52 .4 .56 .49 .51 .49 .41 .41 .49 .62 .48 .39 .45 .54 .39 .42 .56 .33 .52 .41 .43 .4 .46157 .57 .63 .57 .6 .49 .38 .49 .51 .52 .5 .49 .4 .48 .57 .49 .64 .54 .61 .49 .31 .54 .35 .67 .64 .6158 .51 .65 .58 .65 .5 .41 .5 .55 .47 .5 .49 .45 .53 .64 .55 .57 .55 .58 .57 .37 .56 .37 .59 .61 .63159 .51 .58 .52 .56 .48 .37 .45 .5 .54 .45 .43 .4 .47 .51 .43 .56 .53 .55 .48 .36 .49 .35 .62 .6 .54160 .53 .61 .59 .6 .46 .4 .5 .59 .47 .51 .51 .45 .51 .6 .54 .53 .55 .61 .54 .39 .59 .39 .54 .53 .63161 .52 .57 .6 .68 .45 .35 .46 .49 .42 .58 .46 .35 .45 .64 .51 .53 .53 .62 .48 .34 .58 .3 .59 .54 .59162 .53 .44 .63 .52 .52 .47 .51 .48 .45 .53 .42 .41 1 .49 .52 .46 .43 .39 .46 .37 .6 .4 .5 .46 .4163 .5 .46 .53 .69 .47 .37 .48 .48 .38 .6 .39 .31 .49 1 .46 .46 .47 .55 .49 .25 .51 .26 .65 .67 .52164 .47 .53 .41 .45 .4 .33 .43 .47 .47 .36 .57 .38 .43 .4 .32 .6 .5 .48 .44 .28 .4 .33 .45 .46 .57165 .58 .6 .51 .6 .49 .38 .47 .58 .44 .51 .46 .37 .44 .6 .5 .54 .55 .57 .59 .39 .51 .4 .55 .57 .59166 .34 .3 .33 .48 .53 .45 .66 .37 .28 .32 .45 .41 .32 .38 .33 .43 .29 .31 .51 .26 .35 .32 .42 .43 .47167 .56 .46 .66 .45 .54 .48 .57 .45 .41 .53 .48 .35 .57 .46 .56 .51 .48 .47 .63 .39 .65 .37 .48 .46 .48168 .54 .46 .47 .43 .47 .39 .46 .52 .39 .43 .47 .35 .45 .42 .38 .47 .51 .41 .6 .35 .45 .4 .48 .52 .46169 .45 .45 .51 .55 .44 .41 .5 .51 .46 .45 .43 .4 .43 .47 .44 .44 .5 .54 .57 .32 .5 .39 .46 .46 .54170 .43 .56 .46 .57 .37 .32 .45 .51 .4 .44 .46 .35 .41 .55 .37 .46 .71 .64 .45 .37 .44 .27 .47 .44 .63171 .49 .52 .58 .66 .46 .37 .44 .52 .44 .59 .43 .34 .49 .77 .49 .51 .5 .65 .48 .3 .56 .27 .6 .55 .53172 .46 .41 .75 .46 .55 .36 .49 .47 .33 .6 .35 .33 .54 .44 .71 .44 .39 .38 .47 .38 .77 .32 .46 .43 .4173 .45 .41 .78 .47 .55 .4 .46 .43 .34 .64 .34 .33 .58 .44 .65 .46 .37 .39 .38 .31 .78 .31 .48 .42 .37174 .43 .44 .74 .53 .53 .43 .51 .44 .37 .69 .36 .37 .52 .46 1 .45 .38 .44 .48 .39 .76 .35 .48 .44 .4175 .48 .57 .46 .51 .4 .34 .43 .51 .49 .39 .47 .37 .45 .47 .41 .48 .48 .53 .45 .33 .44 .35 .47 .46 .49176 .39 .49 .42 .37 .36 .38 .44 .4 .52 .3 .51 .39 .39 .31 .37 .46 .43 .46 .4 .3 .39 .38 .36 .35 .49177 .47 .6 .51 .57 .4 .38 .44 .48 .58 .47 .47 .35 .46 .58 .45 .51 .6 .76 .44 .28 .49 .23 .48 .46 .64178 .56 .57 .54 .51 .55 .44 .52 .54 .51 .44 .58 .49 .46 .46 .45 1 .51 .53 .54 .35 .53 .33 .56 .57 .68179 .49 .42 .51 .52 .46 .42 .54 .46 .41 .4 .5 .39 .44 .42 .48 .5 .47 .44 .49 .4 .49 .32 .42 .43 .54180 .44 .52 .44 .55 .44 .33 .48 .48 .44 .4 .41 .41 .41 .49 .39 .47 .58 .54 .53 .32 .42 .32 .5 .49 .58181 .46 .52 .48 .59 .46 .45 .51 .44 .42 .48 .44 .39 .44 .48 .46 .48 .46 .56 .48 .4 .48 .31 .46 .44 .59182 .54 .62 .45 .47 .42 .29 .38 .52 .51 .45 .39 .37 .43 .47 .38 .51 1 .6 .49 .32 .44 .27 .46 .48 .56183 .48 .65 .48 .58 .41 .4 .45 .46 .5 .49 .42 .33 .39 .55 .44 .53 .6 1 .46 .32 .48 .28 .45 .43 .6184 .46 .51 .47 .49 .54 .49 .56 .52 .37 .4 .48 .42 .46 .49 .48 .54 .49 .46 1 .41 .45 .44 .52 .53 .51185 .51 .51 .54 .53 .46 .44 .53 .62 .38 .5 .49 .37 .52 .55 .48 .51 .55 .48 .6 .42 .54 .37 .51 .53 .55186 .57 .55 .55 .63 .49 .41 .53 .58 .43 .53 .48 .42 .47 .63 .51 .5 .49 .54 .58 .43 .54 .36 .58 .54 .56187 .5 .51 .53 .52 .4 .37 .47 .62 .35 .49 .44 .36 .48 .54 .44 .44 .53 .5 .55 .42 .52 .36 .46 .46 .53188 .55 .51 .56 .49 .5 .36 .46 .63 .43 .54 .42 .39 .53 .51 .44 .53 .54 .48 .51 .31 .52 .31 .57 .53 .49189 .43 .47 .47 .45 .48 .39 .53 .52 .38 .38 .44 .43 .43 .46 .42 .48 .4 .4 .6 .32 .44 .38 .45 .49 .45190 .46 .45 .42 .42 .39 .37 .38 .59 .33 .4 .39 .37 .42 .51 .38 .4 .44 .45 .57 .39 .41 .34 .41 .45 .45191 .51 .51 .54 .59 .46 .36 .51 .52 .44 .51 .49 .4 .45 .6 .47 .52 .54 .55 .6 .37 .52 .36 .59 .58 .62192 .53 .47 .71 .54 .51 .46 .49 .55 .43 .66 .42 .35 .55 .56 .68 .51 .41 .53 .49 .32 .71 .33 .53 .46 .47193 .39 .36 .37 .3 .32 .39 .37 .4 .3 .36 .34 .29 .39 .33 .39 .35 .35 .33 .45 .61 .36 .38 .29 .33 .39
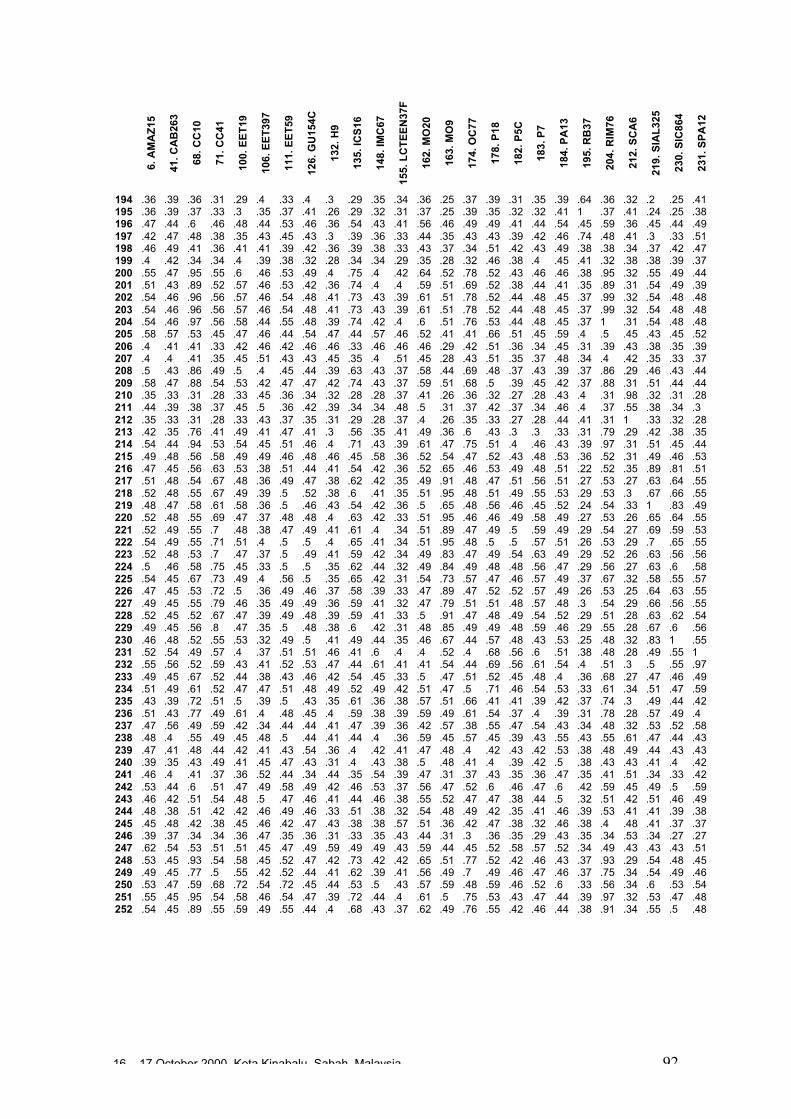
16 – 17 October 2000, Kota Kinabalu, Sabah, Malaysia 92
6. A
MA
Z15
41. C
AB
263
68. C
C10
71. C
C41
100.
EE
T19
106.
EE
T39
7
111.
EE
T59
126.
GU
154C
132.
H9
135.
ICS
16
148.
IMC
67
155.
LC
TE
EN
37F
162.
MO
20
163.
MO
9
174.
OC
77
178.
P18
182.
P5C
183.
P7
184.
PA
13
195.
RB
37
204.
RIM
76
212.
SC
A6
219.
SIA
L32
5
230.
SIC
864
231.
SP
A12
194 .36 .39 .36 .31 .29 .4 .33 .4 .3 .29 .35 .34 .36 .25 .37 .39 .31 .35 .39 .64 .36 .32 .2 .25 .41195 .36 .39 .37 .33 .3 .35 .37 .41 .26 .29 .32 .31 .37 .25 .39 .35 .32 .32 .41 1 .37 .41 .24 .25 .38196 .47 .44 .6 .46 .48 .44 .53 .46 .36 .54 .43 .41 .56 .46 .49 .49 .41 .44 .54 .45 .59 .36 .45 .44 .49197 .42 .47 .48 .38 .35 .43 .45 .43 .3 .39 .36 .33 .44 .35 .43 .43 .39 .42 .46 .74 .48 .41 .3 .33 .51198 .46 .49 .41 .36 .41 .41 .39 .42 .36 .39 .38 .33 .43 .37 .34 .51 .42 .43 .49 .38 .38 .34 .37 .42 .47199 .4 .42 .34 .34 .4 .39 .38 .32 .28 .34 .34 .29 .35 .28 .32 .46 .38 .4 .45 .41 .32 .38 .38 .39 .37200 .55 .47 .95 .55 .6 .46 .53 .49 .4 .75 .4 .42 .64 .52 .78 .52 .43 .46 .46 .38 .95 .32 .55 .49 .44201 .51 .43 .89 .52 .57 .46 .53 .42 .36 .74 .4 .4 .59 .51 .69 .52 .38 .44 .41 .35 .89 .31 .54 .49 .39202 .54 .46 .96 .56 .57 .46 .54 .48 .41 .73 .43 .39 .61 .51 .78 .52 .44 .48 .45 .37 .99 .32 .54 .48 .48203 .54 .46 .96 .56 .57 .46 .54 .48 .41 .73 .43 .39 .61 .51 .78 .52 .44 .48 .45 .37 .99 .32 .54 .48 .48204 .54 .46 .97 .56 .58 .44 .55 .48 .39 .74 .42 .4 .6 .51 .76 .53 .44 .48 .45 .37 1 .31 .54 .48 .48205 .58 .57 .53 .45 .47 .46 .44 .54 .47 .44 .57 .46 .52 .41 .41 .66 .51 .45 .59 .4 .5 .45 .43 .45 .52206 .4 .41 .41 .33 .42 .46 .42 .46 .46 .33 .46 .46 .46 .29 .42 .51 .36 .34 .45 .31 .39 .43 .38 .35 .39207 .4 .4 .41 .35 .45 .51 .43 .43 .45 .35 .4 .51 .45 .28 .43 .51 .35 .37 .48 .34 .4 .42 .35 .33 .37208 .5 .43 .86 .49 .5 .4 .45 .44 .39 .63 .43 .37 .58 .44 .69 .48 .37 .43 .39 .37 .86 .29 .46 .43 .44209 .58 .47 .88 .54 .53 .42 .47 .47 .42 .74 .43 .37 .59 .51 .68 .5 .39 .45 .42 .37 .88 .31 .51 .44 .44210 .35 .33 .31 .28 .33 .45 .36 .34 .32 .28 .28 .37 .41 .26 .36 .32 .27 .28 .43 .4 .31 .98 .32 .31 .28211 .44 .39 .38 .37 .45 .5 .36 .42 .39 .34 .34 .48 .5 .31 .37 .42 .37 .34 .46 .4 .37 .55 .38 .34 .3212 .35 .33 .31 .28 .33 .43 .37 .35 .31 .29 .28 .37 .4 .26 .35 .33 .27 .28 .44 .41 .31 1 .33 .32 .28213 .42 .35 .76 .41 .49 .41 .47 .41 .3 .56 .35 .41 .49 .36 .6 .43 .3 .3 .33 .31 .79 .29 .42 .38 .35214 .54 .44 .94 .53 .54 .45 .51 .46 .4 .71 .43 .39 .61 .47 .75 .51 .4 .46 .43 .39 .97 .31 .51 .45 .44215 .49 .48 .56 .58 .49 .49 .46 .48 .46 .45 .58 .36 .52 .54 .47 .52 .43 .48 .53 .36 .52 .31 .49 .46 .53216 .47 .45 .56 .63 .53 .38 .51 .44 .41 .54 .42 .36 .52 .65 .46 .53 .49 .48 .51 .22 .52 .35 .89 .81 .51217 .51 .48 .54 .67 .48 .36 .49 .47 .38 .62 .42 .35 .49 .91 .48 .47 .51 .56 .51 .27 .53 .27 .63 .64 .55218 .52 .48 .55 .67 .49 .39 .5 .52 .38 .6 .41 .35 .51 .95 .48 .51 .49 .55 .53 .29 .53 .3 .67 .66 .55219 .48 .47 .58 .61 .58 .36 .5 .46 .43 .54 .42 .36 .5 .65 .48 .56 .46 .45 .52 .24 .54 .33 1 .83 .49220 .52 .48 .55 .69 .47 .37 .48 .48 .4 .63 .42 .33 .51 .95 .46 .46 .49 .58 .49 .27 .53 .26 .65 .64 .55221 .52 .49 .55 .7 .48 .38 .47 .49 .41 .61 .4 .34 .51 .89 .47 .49 .5 .59 .49 .29 .54 .27 .69 .59 .53222 .54 .49 .55 .71 .51 .4 .5 .5 .4 .65 .41 .34 .51 .95 .48 .5 .5 .57 .51 .26 .53 .29 .7 .65 .55223 .52 .48 .53 .7 .47 .37 .5 .49 .41 .59 .42 .34 .49 .83 .47 .49 .54 .63 .49 .29 .52 .26 .63 .56 .56224 .5 .46 .58 .75 .45 .33 .5 .5 .35 .62 .44 .32 .49 .84 .49 .48 .48 .56 .47 .29 .56 .27 .63 .6 .58225 .54 .45 .67 .73 .49 .4 .56 .5 .35 .65 .42 .31 .54 .73 .57 .47 .46 .57 .49 .37 .67 .32 .58 .55 .57226 .47 .45 .53 .72 .5 .36 .49 .46 .37 .58 .39 .33 .47 .89 .47 .52 .52 .57 .49 .26 .53 .25 .64 .63 .55227 .49 .45 .55 .79 .46 .35 .49 .49 .36 .59 .41 .32 .47 .79 .51 .51 .48 .57 .48 .3 .54 .29 .66 .56 .55228 .52 .45 .52 .67 .47 .39 .49 .48 .39 .59 .41 .33 .5 .91 .47 .48 .49 .54 .52 .29 .51 .28 .63 .62 .54229 .49 .45 .56 .8 .47 .35 .5 .48 .38 .6 .42 .31 .48 .85 .49 .49 .48 .59 .46 .29 .55 .28 .67 .6 .56230 .46 .48 .52 .55 .53 .32 .49 .5 .41 .49 .44 .35 .46 .67 .44 .57 .48 .43 .53 .25 .48 .32 .83 1 .55231 .52 .54 .49 .57 .4 .37 .51 .51 .46 .41 .6 .4 .4 .52 .4 .68 .56 .6 .51 .38 .48 .28 .49 .55 1232 .55 .56 .52 .59 .43 .41 .52 .53 .47 .44 .61 .41 .41 .54 .44 .69 .56 .61 .54 .4 .51 .3 .5 .55 .97233 .49 .45 .67 .52 .44 .38 .43 .46 .42 .54 .45 .33 .5 .47 .51 .52 .45 .48 .4 .36 .68 .27 .47 .46 .49234 .51 .49 .61 .52 .47 .47 .51 .48 .49 .52 .49 .42 .51 .47 .5 .71 .46 .54 .53 .33 .61 .34 .51 .47 .59235 .43 .39 .72 .51 .5 .39 .5 .43 .35 .61 .36 .38 .57 .51 .66 .41 .41 .39 .42 .37 .74 .3 .49 .44 .42236 .51 .43 .77 .49 .61 .4 .48 .45 .4 .59 .38 .39 .59 .49 .61 .54 .37 .4 .39 .31 .78 .28 .57 .49 .4237 .47 .56 .49 .59 .42 .34 .44 .44 .41 .47 .39 .36 .42 .57 .38 .55 .47 .54 .43 .34 .48 .32 .53 .52 .58238 .48 .4 .55 .49 .45 .48 .5 .44 .41 .44 .4 .36 .59 .45 .57 .45 .39 .43 .55 .43 .55 .61 .47 .44 .43239 .47 .41 .48 .44 .42 .41 .43 .54 .36 .4 .42 .41 .47 .48 .4 .42 .43 .42 .53 .38 .48 .49 .44 .43 .43240 .39 .35 .43 .49 .41 .45 .47 .43 .31 .4 .43 .38 .5 .48 .41 .4 .39 .42 .5 .38 .43 .43 .41 .4 .42241 .46 .4 .41 .37 .36 .52 .44 .34 .44 .35 .54 .39 .47 .31 .37 .43 .35 .36 .47 .35 .41 .51 .34 .33 .42242 .53 .44 .6 .51 .47 .49 .58 .49 .42 .46 .53 .37 .56 .47 .52 .6 .46 .47 .6 .42 .59 .45 .49 .5 .59243 .46 .42 .51 .54 .48 .5 .47 .46 .41 .44 .46 .38 .55 .52 .47 .47 .38 .44 .5 .32 .51 .42 .51 .46 .49244 .48 .38 .51 .42 .42 .46 .49 .46 .33 .51 .38 .32 .54 .48 .49 .42 .35 .41 .46 .39 .53 .41 .41 .39 .38245 .45 .48 .42 .38 .45 .46 .42 .47 .43 .38 .38 .57 .51 .36 .42 .47 .38 .32 .46 .38 .4 .48 .41 .37 .37246 .39 .37 .34 .34 .36 .47 .35 .36 .31 .33 .35 .43 .44 .31 .3 .36 .35 .29 .43 .35 .34 .53 .34 .27 .27247 .62 .54 .53 .51 .51 .45 .47 .49 .59 .49 .49 .43 .59 .44 .45 .52 .58 .57 .52 .34 .49 .43 .43 .43 .51248 .53 .45 .93 .54 .58 .45 .52 .47 .42 .73 .42 .42 .65 .51 .77 .52 .42 .46 .43 .37 .93 .29 .54 .48 .45249 .49 .45 .77 .5 .55 .42 .52 .44 .41 .62 .39 .41 .56 .49 .7 .49 .46 .47 .46 .37 .75 .34 .54 .49 .46250 .53 .47 .59 .68 .72 .54 .72 .45 .44 .53 .5 .43 .57 .59 .48 .59 .46 .52 .6 .33 .56 .34 .6 .53 .54251 .55 .45 .95 .54 .58 .46 .54 .47 .39 .72 .44 .4 .61 .5 .75 .53 .43 .47 .44 .39 .97 .32 .53 .47 .48252 .54 .45 .89 .55 .59 .49 .55 .44 .4 .68 .43 .37 .62 .49 .76 .55 .42 .46 .44 .38 .91 .34 .55 .5 .48
16 – 17 October 2000, Kota Kinabalu, Sabah, Malaysia 93
Implications of New Insight into the Genetic Structure ofTheobroma cacao L. for Breeding Strategies
Claire Lanaud, Juan-Carlos Motamayor and Ange-Marie Risterucci
Cirad-Amis, TA 40/03, Avenue Agropolis, 34398 Montpellier Cedex 5, France
Abstract
The genetic diversity of cocoa has been studied using morphological, enzymatic and moleculardescriptors. It has often proved difficult to obtain a clear classification due to factors includingthe significant genetic mixing that has occurred over the past three centuries, bias in thesamples analysed (e.g. the limited number of Forastero samples collected in Peru for Witches’broom resistance), the uncertain origin of some accessions (e.g. some early studies were basedon material believed to be Criollo, but which was in fact of hybrid origin), different populationshave been used in different studies. Breeding has been hampered by a lack of knowledge ofthe genetic diversity and level of heterozygosity of the accessions.
The main results of the diversity studies are:• In Forastero populations there is significant diversity between and within populations, with
continuous variation between them. The greatest diversity was observed amongEcuadorian LCTEEN populations, and the least among a few populations such as PeruvianNA or GU from French Guiana. However, the Ecuadorian populations studied by Allenwere collected from a larger number of trees and from a wider area than those collected byPound, and very few Colombian and Brazilian samples were used in these studies.
• Almost completely homozygous “ancestral” Criollo and Nacional genotypes that wereprobably at the origin of “modern” Criollo and Nacional varieties were identified. ModernCriollo and Nacional varieties are hybrid types resulting from introgression of a few LowerAmazon Forastero genotypes into ancestral Criollo, and of Trinitario into ancestral Nacionalvarieties, respectively.
• The specificity of some populations or varieties has been recognised, for example wildFrench Guiana, ancient Criollo and Nacional varieties. The founder effect or refuge areasmay be responsible for the differences between these populations.
• The narrow genetic base of cocoa genotypes used in breeding programs is well known.• The level of heterozygosity of several hundreds of clones has recently been established
(data presented here) and this new information may be very useful to breeders.Many breeding programmes have only used a limited number of Upper Amazon Forastero
types collected by Pound. Genotypes from other populations have been used very little or notat all (e.g. wild French Guiana, LCT EEN, Colombian EBC types, etc). It would be particularlyinteresting to set up prospective trials of crosses between genotypes from these differentpopulations. This would exploit the diversity of natural T. cacao populations that have notpreviously been used and may result in new heterotic combinations. Secondly, the geneticdiversity studies have given useful information for population breeding approaches, such asreciprocal recurrent selection. Thirdly, the narrow genetic basis used in many cocoa breedingprogrammes to date is favourable for the exploitation of the expected linkage disequilibria withinsuch populations. QTL mapping is generally done on a few specific progenies, and the resultsonly relate to the clones involved. It is possible to enlarge such studies to analyse the degree towhich genetic linkage between markers and traits of interest has been maintained during theevolution and domestication processes in genetic groups such as IMC, SCA and MO, Forastero,Criollo, Trinitario or Nacional.
Introduction
A few reminders on the history of cocoa Cocoa was domesticated thousands of years ago by the Mayas and Aztecs (Paradis1979). Even before the Spanish conquest, cocoa travelled along the trade routes used
16 – 17 October 2000, Kota Kinabalu, Sabah, Malaysia 94
by the Mayas, Aztecs, and also the Pipil-Nicaraos (Young 1994; Coe and Coe 1996).Criollo types then spread to Central America, and to a large number of Caribbeanislands, including Trinidad in 1525 and thereafter to Jamaica. Cocoa introductions intoVenezuela from Central America, particularly Costa Rica, were made by the Spanish(Pittier 1933), but it is also possible that cocoa may have been grown before theSpanish Conquest in the south-west of the country (Pittier 1933; Bergman 1969). TheFrench planted cocoa in Martinique and Haiti, and the Portuguese planted it in Belemand Bahia around 1750, using Lower Amazon (Forastero) populations.
Hybridisations between Criollo and Forastero types in the 18th Century resulted inTrinitario types. It is not well known how this hybrid group initially formed. According toPound (1945), the two populations could have met and hybridised on the islands of theOrinoco delta, including Trinidad and the Orinoco valley. This could have involved thecultivated Criollo population from Venezuela and the Amelonado type Forastero fromGuyana, and was probably linked to exchanges between Venezuela and Trinidad.Cheesman (1944) reported that, in 1727, the “Blast”, perhaps a cyclone or anepidemic, destroyed the Criollo plantations in Trinidad. Plantations were reconstitutedusing seeds from the Orinoco valley, in Eastern Venezuela (Ciudad Bolivar).According to Cheesman, there is still some doubt as to the nature of theseintroductions, which may have been either Amelonado type Forastero, or alreadyhybrid Trinitario forms. Other varieties, such as those grown on the Venezuelan coast,may also have been introduced (Bartley, pers. comm.). Hybrids were produced byopen pollination, and their superiority in agronomic terms and better resistance todiseases and pests favoured their use in Trinidad as a replacement for Criollo types.Trinitario material was distributed from Trinidad 70 years later, particularly intoVenezuela.
According to Bartley (pers. comm.), the formation of hybrid populations following theintroduction of Forastero types into original Criollo plantations may correspond to fourmain waves of introductions, possibly involving different genotypes. In addition to theintroductions described above between Trinidad and Venezuela, there may also havebeen introductions of Ecuadorian cocoa into Mexico, introductions of varieties grown atthe mouth of the Amazon into Central America, and of Amazon varieties intoColombian Criollo plantations in the 19th Century.
Selections were made in Trinidad among the Trinitario population and largenumbers of clones (ICS, for Imperial College Selection) were distributed world-wide.The current plantations in Central America and Venezuela, which are veryheterogeneous, often comprise a population of hybrids of varying degrees ofintrogression between Forastero and Criollo. The terms Criollo and Forastero originallycame from Venezuela, where a distinction was made between traditionally grown localvarieties (Criollo) and foreign trees (Forastero) introduced later from Trinidad, whichwere also known as Trinitario referring to the country from which they were introduced.
The Ecuadorian Nacional cocoa became an important variety in the second half ofthe 19th Century following the increase in cocoa consumption. According to Pound(1945), the “Nacional” type is probably indigenous to Eastern Ecuador. He refers tothe existence of groups of very old wild cocoa trees resembling the Nacional type,known as "amacigales", in primary forest areas cleared for new crops. Nacional cocoadiffered from the wild cocoa trees found in the Amazon Valley. Some Nacional traitshave more resemblance to Criollo than Forastero types, but Nacional also hascharacteristics that distinguish it from both groups. One such characteristic is thatNacional cocoa has the specific ‘Arriba’ flavour (Enríquez 1993). Venezuelan cocoatypes were introduced into Ecuador around 1890, via a few pods from Trinidad, wherethey had been introduced previously (Pound 1945). This material was particularlyvigorous and precocious, even on poor soils, and most planters took seedlings fromthese trees to add to their original Nacional plantings. As a result, there was significantgenetic mixing between the different origins, and pure types gradually disappeared(Soria 1970 a and b).
16 – 17 October 2000, Kota Kinabalu, Sabah, Malaysia 95
Cocoa was introduced into Africa more recently. It was first brought by Spanish orPortuguese seafarers, to São Tomé in 1822 and Fernando Po in 1855 (Burle 1952).Swiss missionaries then made other introductions, from Suriname, and the first cocoaseeds were sown on the African mainland in 1857. The first material planted in WestAfrica, particularly Ghana, was Lower Amazon (Amelonado) type but this was followedby introductions of hybrid Trinitario and Criollo types from 1920 (Toxopeus 1972) whichformed hybrids with original Amelonado type. However, each introduction comprisedonly a very limited number of genotypes, and the genetic basis of the cocoapopulations initially grown in West Africa was very narrow. Moreover, the origin of thematerial is unclear.
Cocoa was introduced in the 16th century into Asia and the Pacific (Wood 1991;Young 1994). In 1560, Venezuelan Criollo trees were introduced into Celebes by theDutch, who later also introduced this type into Java. In addition, the Spanishintroduced Criollo types from Mexico into the Philippines in 1614. In 1798, cocoa wastaken by the British to Madras, India from the island of Amboina, and it was introducedinto Ceylon (now Sri Lanka) from Trinidad at about the same time. From Ceylon,cocoa was subsequently transferred to Singapore and Fiji (1880), Samoa (1883),Queensland (1886), and Bombay and Zanzibar (1887). Cocoa was also grown inMalaysia as early as in 1778 and in Hawai by 1831.
Classification of cocoaThe species Theobroma cacao (2n = 2x = 20) comprises a large number of highlymorphologically variable populations, which can all be crossed with each other.Populations may be mostly autogamous or allogamous, depending on their geneticorigin. A system of gametophytic-sporophytic self-incompatibility studied by severalauthors (Knight and Rogers 1955; Bouharmont 1960; Cope 1962; Glendinning 1962)increases the allogamy of certain populations.
Morris (1882) was the first botanist to propose classification of cocoa populationsinto two groups: Criollo and Forastero. His classification was taken up by Pittier(1933), who designated each group as a different species: T. leiocarpum for Forasteroand T. cacao for Criollo. However, all cocoa populations are inter-fertile, which in factjustifies the designation of a single species covering all wild and cultivated cocoapopulations. Cuatrecasas (1964) proposed two sub-species: T. cacao subsp. cacao forCriollo and T. cacao subsp. sphaerocarpum for Forastero. A third group, Trinitario,contains hybrids between these two sub-species. This overall classification into twomorpho-geographic groups, Criollo and Forastero, has been and is still in widespreaduse.
Classification of cocoa is difficult as it is affected by the history of cocoadomestication and by the substantial genetic mixing that has occurred, mainly over thelast three centuries. The classifications proposed for the species T. cacao havetherefore never been fully satisfactory. For example, according to some authors(Cheesman 1944; Soria 1970a and b) Nacional is an Upper Amazon Forastero, whilefor Enríquez (1993), some of its technological characteristics make it resemble a Criollotype.
Numerous hypotheses have also been put forward about the origin of the Criollogroup (Cheesman 1944; Mora Urpi 1958; Cuatrecasas 1964; Purseglove 1968,Whitkus et al. 1998). The most widely held are those of Cheesman and Cuatrecasas.Based on Vavilov’s principle, Cheesman (1944) considered the Upper Amazon as thecentre of origin of Criollo and Forastero, given that it is in this region that the greatestmorphological diversity is observed. Cheesman suggested that the spread of Criollothroughout Central America began from a small population in the upper reaches of theAmazon, which may have crossed the Andes with the help of man, and then formeddifferentiated populations as it spread. Cuatrecasas (1964), on the other hand,suggested that the species was indigenous from the Amazon region to Mexico.
16 – 17 October 2000, Kota Kinabalu, Sabah, Malaysia 96
Cuatrecasas backed up his hypotheses with observations of supposedly wild cocoatrees in the Lacandona forest near Chiapas, Mexico (Cuatrecasas 1964).
Study of the genetic structure of T. cacao
Many authors have participated in genetic diversity studies of T. cacao withmorphological, enzymatic or molecular markers (for a recent review see Lanaud et al.1999b). We report here some of the main results that have a direct bearing on cocoagenetic improvement. We firstly report on the level of heterozygosity as observed withisozymes, RFLP and microsatellite markers in the CIRAD laboratory at Montpellier.
Degree of heterozygosity of cocoa accessionsThe data reported in Annex 1 are derived from the following sources: isozymes studiescarried out by Lanaud (1987), RFLP studies carried out by Laurent et al. (1994) and byRisterucci, Motamayor, Raboin and Lanaud (unpublished data), and microsatellitestudies carried out by Motamayor (also unpublished data).
The hybrid forms between Criollo and Forastero are called ‘Trinitario” in Annex 1even if they correspond to “modern Criollo” varieties that correspond in fact to ancientCriollo more or less introgressed by Forastero genes as demonstrated by Motamayoret al. (2000a and b).
The results show that most of Trinitario clones (e.g. UF, ICS, UIT) are veryheterozygous, which is in agreement with their hybrid origin. Some other populationsdisplayed a higher degree of homozygosity, for instance wild Forastero from FrenchGuiana (GU), Amelonado and Catongo Forastero (C361) varieties and certain Criolloclones (LAN, COL, Guasare, POR, PSL), corresponding to ancient cultivars. CertainUpper Amazon Forastero types also appeared to have a relatively high degree ofhomozygosity, for instance the EBC clones collected in Colombia, certain EcuadorianLCTEEN clones and SCA 6.
These results are very valuable to cocoa breeders since they can be used todetermine the clones most likely to create uniform hybrid progenies or to determinehomozygous genotypes belonging to different genetic groups which could be crossedto exploit possible hybrid vigour.
The origin and diversity of Nacional, Criollo and Trinitario varietiesCriollo and Trinitario varieties. The origin and diversity of Criollo and Trinitario havebeen studied by Motamayor et al. (2000a and b). For this study, plant material wascollected from the oldest plantings in Venezuela, irrespective of agronomic criteria, andin the Lacandona Forest, Mexico, near Maya archaeological sites where there are sub-spontaneous cocoa trees that probably descend from the cocoa trees grown by theMayas. Samples were also taken in Yucatan. These representatives of pure Criollovarieties grown in the past have different pod shapes: oval with smooth surface, likethose of Porcelana, or elongated with a very rough surface, like those of Pentagona.The analysis of this material was supplemented with that of so-called ‘current’ Criolloand Trinitario varieties obtained from representative collections in Venezuela, Mexicoand Costa Rica.
The analyses revealed a very small proportion of polymorphic loci among theindividuals of ancient Criollo varieties. Moreover, within the group, hardly anymolecular differences were observed, despite the highly contrasting morphotypescollected from Mexico to Venezuela, such as the Venezuelan Porcelana, Pentagonaand Guasare, and the Criollo from the Lacandona Forest in Mexico.
The Criollo clones taken from collections generally appeared to be much moreheterozygous. These clones had been originally selected not only for bean qualitycharacters but also for agronomic characteristics (vigour, production or diseaseresistance). A Factorial Correspondence Analysis showed that the diversity of current
16 – 17 October 2000, Kota Kinabalu, Sabah, Malaysia 97
Criollo overlapped with that of the Trinitario clones studied. The more vigorous Criollotypes may therefore correspond to ancestral Criollo forms into which Forastero geneshave been introgressed to varying degrees.
Furthermore, the origin of the Forastero parents at the origin of modern Criollo andTrinitario was analysed. Around 90% of modern Criollo and Trinitario types apparentlyresult from hybridisation and subsequent introgression between two genetically uniformtypes: homozygous Lower Amazon Forastero on one side and homozygous ancientCriollo on the other side. This is why in most cases only the same two alleles arefound on each locus in the modern Criollo/Trinitario hybrid groups. Genotypesbelonging to these groups would therefore represent different levels of recombinationsof the Criollo and Lower Amazon Forastero parental genomes.
Ecuadorian Nacional. Lerceteau et al. (1997) used RFLP markers to study theEcuadorian Nacional types which are grown today. A highly homozygous Nacionaltype was identified in old plantings in south-eastern and north-eastern Ecuador. Thesetrees probably represent the homozygous ancestor at the origin of all the current hybridvarieties, (also called ‘Nacional’ types in collections), that result from Trinitariointrogressions into this ancestral type with its extremely limited genetic base.
The diversity of Forastero populations. The Forastero group comprises a large numberof wild populations and cultivated varieties originating from South America, which arefound from Ecuador to the Guyanas. It includes vigorous trees and numerous sourcesof disease resistance. Significant genetic variability has been identified among thesepopulations (e.g. Pound 1938 and 1945; Allen and Lass 1983). Certain Upper Amazonpopulations or geographic groups, such as LCTEEN and IMC, seem to be the mostvariable (Sounigo et al. 1996, see also this Proceedings), and there is continuousvariation between them. Substantial within-population diversity has also been detectedinside these populations, particularly those from Ecuador. Russel et al. (1993) showedthat within-population diversity was greater than between population diversity for threePeruvian and Ecuadorian populations (IMC, PA, LCTEEN). Using enzymatic markers,the GU types from French Guiana, on the other hand, do not seem to vary much andhave a relatively high level of homozygosity (Lanaud 1987) although significantmorphological diversity has been observed in terms of pod shape (Lachenaud andSallée 1993).
However, it is difficult to compare the degree of diversity among these differentpopulations. In effect, not all the populations were sampled or represented in the sameway. The surveys made by Allen in Ecuador were not based on any strict criteria andcovered a very large area in which material was taken from a large number of trees.Pound’s Peruvian clone samples, on the contrary, were taken for a precise purpose:witches’ broom resistance. The material, which was taken from a limited number oftrees is, therefore, not necessarily representative of the genetic diversity found in sucharea. Likewise, there was little material from clones from Colombia or from theBrazilian middle or upper Amazon in the material collected by Pound. Despite theseoften very biased samples, the genetic diversity (morphological, agronomical and bymarkers) observed was consistently substantial and greater than that found among thepopulations sampled in French Guiana or along the Orinoco in Venezuela.
The specificity of certain populations. Several populations or varieties seem to beclearly differentiated from the other morphogeographic groups identified for thespecies:• French Guianan Forastero (GU clones) differ clearly from other Forastero
populations for several molecular markers while their chloroplastic DNA is similar tothat of most Forasteros. However, their rDNA is also original compared to that ofall the other cocoa populations, with three types of unit per genome, and two units(9 and 12) that are not found in other populations (Laurent et al., 1993b). This
16 – 17 October 2000, Kota Kinabalu, Sabah, Malaysia 98
originality was also found in RAPD studies by Sounigo et al. (1996) and byLerceteau et al. (1997). In RFLP studies, they seemed to be more closely relatedto certain Upper Amazon Forastero than to Lower Amazon cultivated forms.However, the RAPD study made by N'Goran et al. (1994), which revealed differentRAPD bands to those found by Lerceteau et al. (1997), showed Guianan cocoatrees to be better related similar to certain trees found in Brazil.
• The distinctiveness of the clones of the Ecuadorian pure Nacional varieties inrelation to the other populations of the species was observed by Lerceteau et al.(1997), who thus also demonstrated their dissimilarity to Criollo.
• Several analyses have also shown the Criollos to form a distinct group (Laurent etal. 1993a, 1993b and 1994 ), particularly those corresponding to the populationscultivated in the past (Motamayor et al. 2000a). Analyses of genome size, usingflow cytometry, have also shown that the Criollo genome size is smaller than that ofForastero (Lanaud et al., unpublished data). Despite this marked difference, thegenetic difference between Criollo with regard to certain Colombian and Ecuadorianaccessions are as large as the latter accessions in relation to other Forasteropopulations (e.g. French Guianan or Peruvian populations), which would be inagreement with a South American origin of ancient Criollo (Motamayor et al.2000a).
The narrow genetic base of the cocoa trees currently grown and used in improvementprogrammes. Genetic marker studies have shown the extremely narrow genetic basisof the Criollo, Trinitario, Nacional and Amelonado varieties, which account for almost allthe traditional cocoa trees grown world-wide. From 1950 onwards, the Upper AmazonForastero types collected by Pound started to be incorporated into cocoa improvementprogrammes. However, only a small part of the genetic diversity of the Poundcollections has so far been used. In effect, it was somewhat by accident that some ofthem were distributed to a large number of producing countries (Lockwood and End1993). Pods from nine of these clones, produced by Posnette in 1944 in an experimenton incompatibility designed for students, were sent to Ghana. The progenies werethen spread throughout West Africa and later to Malaysia. Genetic improvementprogrammes have largely been, and continue to be, based on this Upper AmazonForastero material. The material was generally hybridised with local Amelonado orTrinitario material, and later inter-Amazon crosses were also made. It is concludedtherefore that only a small share of the genetic diversity of the species has beenexploited, in terms of both traditional varieties and breeding programmes.
Consequences for cocoa genetic improvement
The first conclusion for cocoa breeding is that there is a large scope to increase thegenetic bases for cocoa breeding. Certain Forastero types, such as GU clones,Ecuadorian LCTEEN clones and Colombian EBC clones have not yet been used forbreeding purposes. Moreover, these genetic diversity analyses have alsodemonstrated the significant diversity of certain Upper Amazon populations, despite thefact that some samples were small or collected with precise criteria, such as thesurveys made by Pound. This means that surveys of wild material should be continuedin certain Upper Amazon regions such as Peru or Colombia, where there is substantialdiversity that has not yet been sampled to any real extent.
Modern Criollo/Trinitario type varieties apparently result primarily fromhybridization between two or three homozygous genotypes, and likewise, Nacionalvarieties apparently derive from a very small number of genotypes. This situationopens up a wide range of possibilities for improving these varieties, which produce anaromatic cocoa highly sought after for fine chocolate production. They could beimproved for certain traits (like yielding capacity and precocity) by using existing or new
16 – 17 October 2000, Kota Kinabalu, Sabah, Malaysia 99
hybrid combinations, with other genetic groups, selecting for favourable recombinants(e.g. combining good quality with good yield and disease resistance).
The possibilities for exploiting new types of hybrids are not limited to theimprovement of Criollo or Nacional varieties, but are open to all cocoa breedingpopulations including hybrids between different Forastero populations. The hybridvigour observed so far in many breeding programmes between Upper AmazonForastero from Peru and Lower Amazon Forastero or Criollo could also exist, or beeven more important, in many other hybrid combinations which have not yet beentested.
The new insights into the genetic structure of cocoa also have significantconsequences for the choice and management of populations used in reciprocalrecurrent selection strategies. In effect, sufficient genetic variability has to bemaintained in the genetically different base populations to enable continuous geneticprogress.
The narrow genetic base of the cocoa trees currently grown or being used forbreeding purposes also favours exploitation of linkage disequilibria that may have beenmaintained between molecular markers and interesting traits during the genomeevolution process. This phenomenon could enable greater use of the data acquired onthe genome. For instance, in the case of the current Trinitario/Criollo, which have avery small number of parental genotypes, there have been very few generations ofrecombinations (probably six or seven at the most) between the first hybrids andcurrent varieties. The close genetic linkages detected in some Trinitario clonesbetween certain markers and genes of interest (Lanaud et al. 1999a; Lanaud et al.2000; Clément et al. 2000; Paulin et al. 2000) may have been maintained for most ofthis population. If this is the case, this will allow greater screening possibilities andexploitation of the Criollo/Trinitario group using the markers close to those genes.
As explained above, this situation could be similar for the “new” Nacional varieties,i.e. the “pure” Nacional varieties which have received genes from certain Trinitariotypes. The small number of generations of recombinations has probably resulted in themaintenance of most of the close genetic linkages between markers and traits ofinterest, and should again enable screening of the varieties using those markers.
However, optimum use of the genetic resources of the species means clearlycharacterising all available accessions for morphological, agronomic, molecular,technological and sensorial traits. This comprehensive evaluation is highly complexbut could be carried out firstly on a limited sample, as representative as possible of thediversity of the species using all available information (geographic, molecular and alsomorphological data).
One promising way for the future, with respect to a complete evaluation of cocoagenetic resources in terms of traits of interest, involves identification of the genesinvolved in the expression of those characters. This approach could be based ongenome mapping, positional cloning and searching for candidate genes and would beassociated with the use of high scale genome analyses. It would then be both easyand quick to look at the allele variations of the target gene within the species, identifyoriginal types and monitor the introgression of the character during breeding operationsusing a marker associated to the gene. This approach would thus facilitate the trueexploitation of genetic diversity.
References
Allen J.B. and R.A. Lass. 1983. London Cocoa Trade Amazon Project. Final Report. Phase 1.Cocoa Growers’ Bulletin volume 34.
Bergmann J.F. 1969. The distribution of cacao cultivation in pre-Columbian America. Annals ofthe Association of American Geographers 59: 85-96.
16 – 17 October 2000, Kota Kinabalu, Sabah, Malaysia 100
Bouharmont J. 1960. Recherches cytologiques sur la fructification et l’incompatibilité chezTheobroma cacao L. Publ. de l’Inéarc, Série Scientifique 89: 117 pp.
Burle L. 1952. La production du cacao en Afrique Occidentale Française. Centre deRecherches agronomiques de Bingerville. Bulletin 5: 3-21.
Cheesman E.E. 1944. Notes on the nomenclature, classification and possible relationships ofcocoa population. Tropical Agriculture 21: 144-159.
Clément D., A.M. Risterucci, L. Grivet, J.C. Motamayor, J.A.K. N'Goran and C. Lanaud. 2000.Cartographie génétique de caractères liés au rendement, à la vigueur, à la résistance àP. palmivora et aux fèves, chez Theobroma cacao L.. In 13ème Conférence Internationalesur la Recherche Cacaoyère, Kota Kinabalu, Malaisie, 9 au 14 October 2000. In press.
Coe S.D. and M.D. Coe. 1996. The true history of chocolate. Thames and Hudson Ltd,London, United Kingdom.
Cope F.W. 1962. The mechanism of pollen incompatibility in Theobroma cacao. Heredity 17:157 pp.
Cuatrecasas J. 1964. Cacao and its allies: a taxonomic revision of the genus Theobroma.Contributions from the United States Herbarium 35: 379-614.
Enríquez G.A. 1993. Characteristics of cacao “Nacional” of Ecuador. Pages 269-278 inProceedings of the International Workshop on Conservation, Characterization and Utilisationof Cocoa Genetic Resources in the 21st Century. Port-of-Spain, Trinidad. 13-17thSeptember. The Cocoa Research Unit, The University of the West Indies.
Glendinning D.R. 1962. Natural pollination of cocoa. Nature 193, no. 4822: 1305.Knight R. and H.H. Rogers. 1955. Incompatibility in Theobroma cacao. Heredity 9: 69-77.Lachenaud P. and S. Sallée. 1993. Les cacaoyers spontanés de Guyane. Localisation,
écologie et morphologie. Café, Cacao, Thé, XXXVII, n° 2: 101-114.Lanaud C. 1987. Nouvelles données sur la biologie du cacaoyer (Theobroma cacao L.):
diversité des populations, systèmes d’incompatibilité, haploïdes spontanés. Leursconséquences pour l’amélioration génétique de cette espèce. Doctorat d’état, Paris XI.
Lanaud C., I. Kébé, A.M. Risterucci, D. Clément, J.A.K. N'Goran, L. Grivet, M. Tahi, C. Cilas,I. Pieretti, A.B. Eskes and D. Despréaux. 1999a. Mapping quantitative trait loci (QTL) forresistance to Phytophthora palmivora in T. cacao L. Pages 99-105 in Proceedings of the12th International Cocoa Research Conference, November 17-23, 1996, Salvador, Bahia,Brazil.
Lanaud C., J.C. Motamayor and O. Sounigo. 1999b. Le cacaoyer. Pages 141-173 in Diversitégénétique des plantes tropicales cultivées. (Hamon, P., Seguin, M., Perrier, X., Glaszmann,J.C., eds). Collection repères/CIRAD, Montpellier, France.
Lanaud C., M.H. Flament, S. Nyassé, A.M. Risterucci, D. Fargeas, I. Kébé, O. Sounigo,L. Motilal, J.M. Thévenin, D. Paulin, M. Ducamp, D. Clément, J.A.K. N'Goran and C. Cilas.2000. Bilan de l'étude des bases génétiques de la résistance du cacaoyer au Phytophthoraà l'aide de marqueurs moléculaires. In 13ème Conférence Internationale sur la RechercheCacaoyère, Kota Kinabalu, Malaisie, 9-20 Octobre 2000. In press.
Laurent V., A.M. Risterucci and C. Lanaud. 1993a. Chloroplast and mitochondrial DNA diversityin Theobroma cacao. Theor. Appl. Genet. 87: 81-88.
Laurent V., A.M. Risterucci and C. Lanaud. 1993b. Variability for nuclear ribosomal geneswithin Theobroma cacao L. Heredity 71: 96-103.
Laurent V., A.M. Risterucci and C. Lanaud. 1994. Genetic diversity in cocoa revealed by cDNAprobes. Theor. Appl. Genet. 88: 193-198.
Lerceteau E., T. Robert, V. Pétiard and D. Crouzillat. 1997. Evaluation of the extent of geneticvariability among Theobroma cacao L. accessions using RAPD and RFLP markers. Theor.Appl. Genet. 95: 10-19.
Lockwood G. and M. End. 1993. History, technique and future needs for cacao collection.Pages 1-14 in Proceedings of the Workshop on the Conservation, Characterization andUtilization of Cocoa Genetic Resources in the 21st Century, 13-17 September, 1992, Port-of-Spain, Trinidad. The Cocoa Research Unit, Port-of- Spain, Trinidad.
Mora Urpi J. 1958. Notas sobre el posible origen y la variabilidad del cacao cultivado enAmérica Tropical. Turrialba 8: 34-43.
Morris D. 1882. Cocoa: how to grow and how to cure it. Jamaica pp 1-45.Motamayor J.C., A.M. Risterucci, A.P. Lopez and C. Lanaud. 2000a. Domestication du
cacaoyer. I. Preuve d'une origine sud américaine des cacaoyers cultivés par les Mayas. In13ème Conférence Internationale sur la Recherche Cacaoyère. Kota Kinabalu, Malaisie, 9-20Octobre 2000. In press.
16 – 17 October 2000, Kota Kinabalu, Sabah, Malaysia 101
Motamayor J.C., A.M. Risterucci, C. Lanaud. 2000b. Domestication du cacaoyer. II.Germplasm à l'origine des cacaoyers Criollo/Trinitario cultivés avant 1950. In 13ème
Conférence Internationale sur la Recherche Cacaoyère. Kota Kinabalu, Malaisie, 9-20Octobre 2000. In press.
N’Goran J.A.K., V. Laurent, A.M. Risterucci and C. Lanaud. 1994. Comparative geneticdiversity of Theobroma cacao L. using RFLP and RAPD markers. Heredity 73: 589-597.
Paradis L. 1979. Le cacao précolombien: Monnais d’échange et breuvage des dieux. Journ.d’Agric. Trad. et de Bota. Appl. XXVI: 3-4.
Paulin D. and A.B. Eskes. 1995. Le cacaoyer: stratégies de sélection. Plantations RechercheDéveloppement 2: 5-18.
Paulin D., A.M. Risterucci, M. Ducamp, J.A.K. N'goran and C. Lanaud. 2000. Identification deQTL pour la résistance du cacaoyer à la pourriture brune des cabosses (Phytophthorapalmivora). In 13ème Conférence Internationale sur la Recherche Cacaoyère, Kota Kinabalu,Malaisie, 9 au 14 Octobre 2000. In press.
Pittier H. 1933. Degeneration of cacao through natural hybridization. Journal of Heredity 36:385-390.
Pound F.J. 1938. Cacao and witchbroom disease (Marasmius perniciosus) of South America.Archives of Cocoa Research 1: 20-72.
Pound F.J. 1945. A note on the cocoa population of South America. Pages 131-133 in Reportof the Cocoa Conference held at Grosvenor House, London.
Purseglove J.W. 1968. Theobroma cacao L.. Pages 571-599 in Tropical crops. Dicotyledons 2.(Purseglove, J. W. (ed)). John Wiley and Sons Inc, London, United Kingdom.
Russel J.R., F. Hosein, R. Waugh and W. Powell. 1993. Genetic differentiation of cocoa(Theobroma cacao L.) populations revealed by RAPD analysis. Molecular Ecology 2: 89-97.
Soria J. 1970a. Principal varieties of cocoa cultivated in Tropical America. Cocoa Growers’Bulletin 19: 12-21.
Soria J. 1970b. The present status and perspectives for cocoa cultivars in Latin America.Proceedings of the Trop. Reg. Amer. Soc. For Hort. Sci. Vol. 14. Miami, Florida.
Sounigo O., Y. Christopher and R. Umaharan. 1997. Genetic diversity assessment ofTheobroma cacao L. using isoenzymee and RAPD analyses. Pages 35-51 in Annual Reportfor the Cocoa Research Unit for 1996, CRU, Port of Spain, Trinidad and Tobago.
Toxopeus H. 1972. Cocoa breeding: a consequence of mating system, heterosis andpopulation structure. Pages 3-12 in Proceedings of the Conference on Cocoa and Coconutsin Malaysia – Incorporated Society of Planters, Kuala Lumpur, Malaysia.
Whitkus R., M. de la Cruz and L. Mota-Bravo. 1998. Genetic diversity and relationships ofcocoa (Theobroma cacao L.) in southern Mexico. Theor. Appl. Genet. 96: 621-627.
Wood G.A.R. 1991. A history of early cocoa introductions. Cocoa Growers' Bulletin 44: 7-12.Young A.M. 1994. The chocolate tree: a natural history of cacao. Smithsonian Institution Press,
Washington, United States, 200 pp
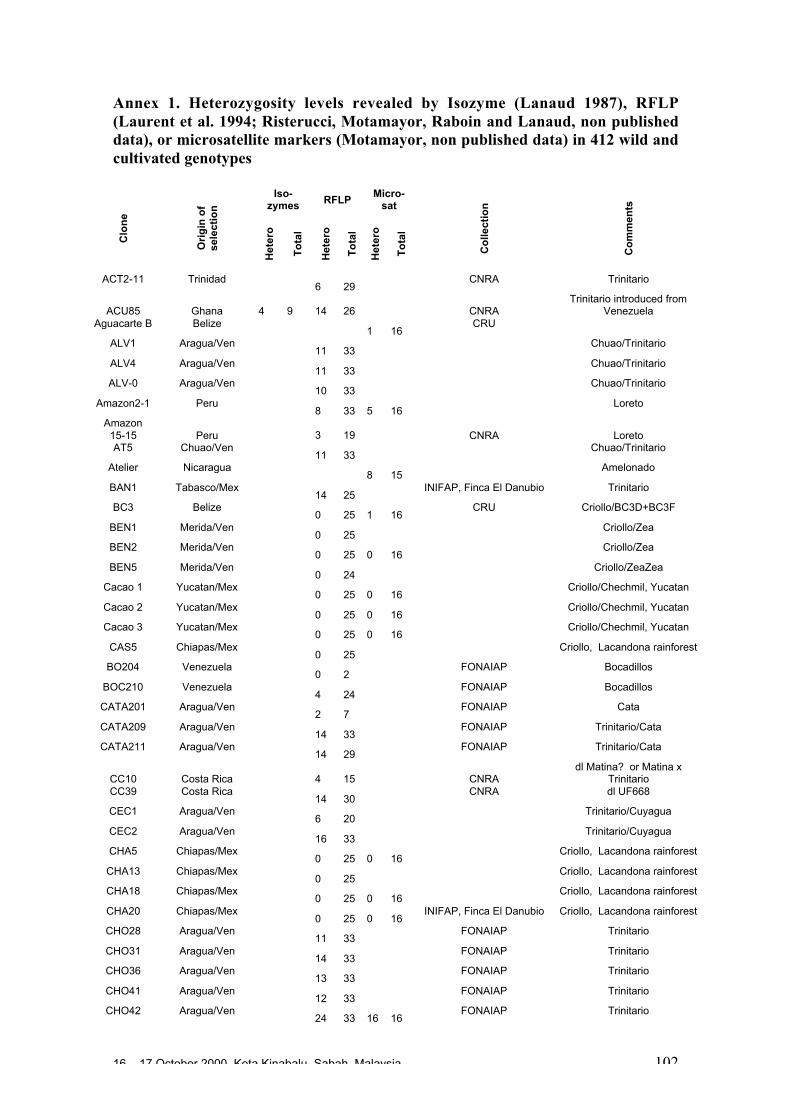
16 – 17 October 2000, Kota Kinabalu, Sabah, Malaysia 102
Annex 1. Heterozygosity levels revealed by Isozyme (Lanaud 1987), RFLP(Laurent et al. 1994; Risterucci, Motamayor, Raboin and Lanaud, non publisheddata), or microsatellite markers (Motamayor, non published data) in 412 wild andcultivated genotypes
Iso-zymes RFLP
Micro-sat
Clo
ne
Ori
gin
of
sele
ctio
n
Het
ero
To
tal
Het
ero
To
tal
Het
ero
To
tal
Co
llect
ion
Co
mm
ents
ACT2-11 Trinidad6 29
CNRA Trinitario
ACU85 Ghana 4 9 14 26 CNRATrinitario introduced from
VenezuelaAguacarte B Belize
1 16CRU
ALV1 Aragua/Ven11 33
Chuao/Trinitario
ALV4 Aragua/Ven11 33
Chuao/Trinitario
ALV-0 Aragua/Ven10 33
Chuao/Trinitario
Amazon2-1 Peru8 33 5 16
Loreto
Amazon15-15 Peru 3 19 CNRA LoretoAT5 Chuao/Ven
11 33Chuao/Trinitario
Atelier Nicaragua8 15
Amelonado
BAN1 Tabasco/Mex14 25
INIFAP, Finca El Danubio Trinitario
BC3 Belize0 25 1 16
CRU Criollo/BC3D+BC3F
BEN1 Merida/Ven0 25
Criollo/Zea
BEN2 Merida/Ven0 25 0 16
Criollo/Zea
BEN5 Merida/Ven0 24
Criollo/ZeaZea
Cacao 1 Yucatan/Mex0 25 0 16
Criollo/Chechmil, Yucatan
Cacao 2 Yucatan/Mex0 25 0 16
Criollo/Chechmil, Yucatan
Cacao 3 Yucatan/Mex0 25 0 16
Criollo/Chechmil, Yucatan
CAS5 Chiapas/Mex0 25
Criollo, Lacandona rainforest
BO204 Venezuela0 2
FONAIAP Bocadillos
BOC210 Venezuela4 24
FONAIAP Bocadillos
CATA201 Aragua/Ven2 7
FONAIAP Cata
CATA209 Aragua/Ven14 33
FONAIAP Trinitario/Cata
CATA211 Aragua/Ven14 29
FONAIAP Trinitario/Cata
CC10 Costa Rica 4 15 CNRAdl Matina? or Matina x
TrinitarioCC39 Costa Rica
14 30CNRA dl UF668
CEC1 Aragua/Ven6 20
Trinitario/Cuyagua
CEC2 Aragua/Ven16 33
Trinitario/Cuyagua
CHA5 Chiapas/Mex0 25 0 16
Criollo, Lacandona rainforest
CHA13 Chiapas/Mex0 25
Criollo, Lacandona rainforest
CHA18 Chiapas/Mex0 25 0 16
Criollo, Lacandona rainforest
CHA20 Chiapas/Mex0 25 0 16
INIFAP, Finca El Danubio Criollo, Lacandona rainforest
CHO28 Aragua/Ven11 33
FONAIAP Trinitario
CHO31 Aragua/Ven14 33
FONAIAP Trinitario
CHO36 Aragua/Ven13 33
FONAIAP Trinitario
CHO41 Aragua/Ven12 33
FONAIAP Trinitario
CHO42 Aragua/Ven24 33 16 16
FONAIAP Trinitario
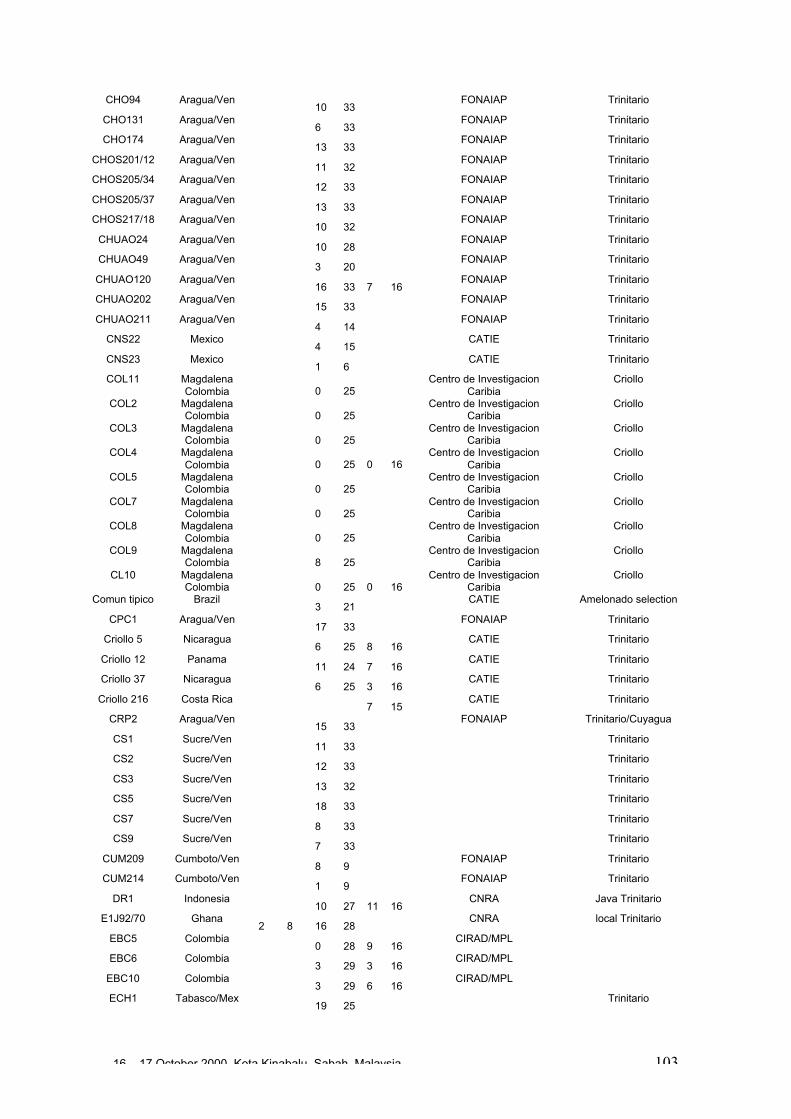
16 – 17 October 2000, Kota Kinabalu, Sabah, Malaysia 103
CHO94 Aragua/Ven10 33
FONAIAP Trinitario
CHO131 Aragua/Ven6 33
FONAIAP Trinitario
CHO174 Aragua/Ven13 33
FONAIAP Trinitario
CHOS201/12 Aragua/Ven11 32
FONAIAP Trinitario
CHOS205/34 Aragua/Ven12 33
FONAIAP Trinitario
CHOS205/37 Aragua/Ven13 33
FONAIAP Trinitario
CHOS217/18 Aragua/Ven10 32
FONAIAP Trinitario
CHUAO24 Aragua/Ven10 28
FONAIAP Trinitario
CHUAO49 Aragua/Ven3 20
FONAIAP Trinitario
CHUAO120 Aragua/Ven16 33 7 16
FONAIAP Trinitario
CHUAO202 Aragua/Ven15 33
FONAIAP Trinitario
CHUAO211 Aragua/Ven4 14
FONAIAP Trinitario
CNS22 Mexico4 15
CATIE Trinitario
CNS23 Mexico1 6
CATIE Trinitario
COL11 MagdalenaColombia 0 25
Centro de InvestigacionCaribia
Criollo
COL2 MagdalenaColombia 0 25
Centro de InvestigacionCaribia
Criollo
COL3 MagdalenaColombia 0 25
Centro de InvestigacionCaribia
Criollo
COL4 MagdalenaColombia 0 25 0 16
Centro de InvestigacionCaribia
Criollo
COL5 MagdalenaColombia 0 25
Centro de InvestigacionCaribia
Criollo
COL7 MagdalenaColombia 0 25
Centro de InvestigacionCaribia
Criollo
COL8 MagdalenaColombia 0 25
Centro de InvestigacionCaribia
Criollo
COL9 MagdalenaColombia 8 25
Centro de InvestigacionCaribia
Criollo
CL10 MagdalenaColombia 0 25 0 16
Centro de InvestigacionCaribia
Criollo
Comun tipico Brazil3 21
CATIE Amelonado selection
CPC1 Aragua/Ven17 33
FONAIAP Trinitario
Criollo 5 Nicaragua6 25 8 16
CATIE Trinitario
Criollo 12 Panama11 24 7 16
CATIE Trinitario
Criollo 37 Nicaragua6 25 3 16
CATIE Trinitario
Criollo 216 Costa Rica7 15
CATIE Trinitario
CRP2 Aragua/Ven15 33
FONAIAP Trinitario/Cuyagua
CS1 Sucre/Ven11 33
Trinitario
CS2 Sucre/Ven12 33
Trinitario
CS3 Sucre/Ven13 32
Trinitario
CS5 Sucre/Ven18 33
Trinitario
CS7 Sucre/Ven8 33
Trinitario
CS9 Sucre/Ven7 33
Trinitario
CUM209 Cumboto/Ven8 9
FONAIAP Trinitario
CUM214 Cumboto/Ven1 9
FONAIAP Trinitario
DR1 Indonesia10 27 11 16
CNRA Java Trinitario
E1J92/70 Ghana2 8 16 28
CNRA local Trinitario
EBC5 Colombia0 28 9 16
CIRAD/MPL
EBC6 Colombia3 29 3 16
CIRAD/MPL
EBC10 Colombia3 29 6 16
CIRAD/MPL
ECH1 Tabasco/Mex19 25
Trinitario
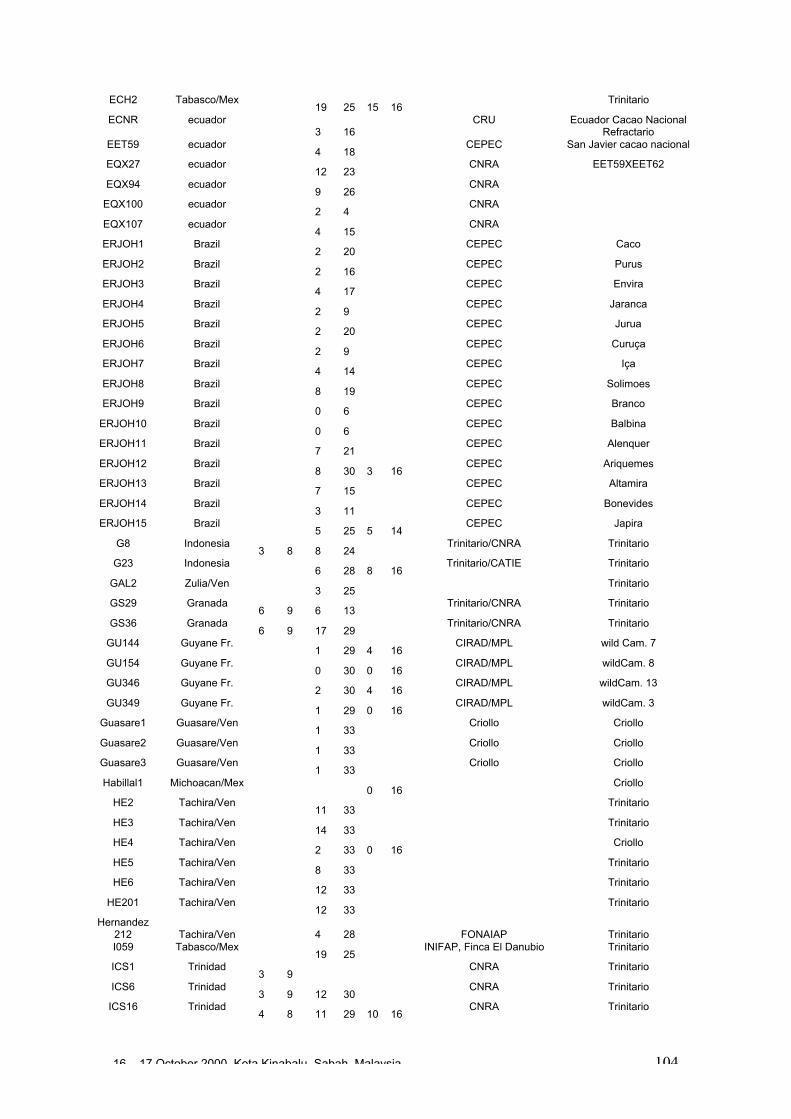
16 – 17 October 2000, Kota Kinabalu, Sabah, Malaysia 104
ECH2 Tabasco/Mex19 25 15 16
Trinitario
ECNR ecuador3 16
CRU Ecuador Cacao NacionalRefractario
EET59 ecuador4 18
CEPEC San Javier cacao nacional
EQX27 ecuador12 23
CNRA EET59XEET62
EQX94 ecuador9 26
CNRA
EQX100 ecuador2 4
CNRA
EQX107 ecuador4 15
CNRA
ERJOH1 Brazil2 20
CEPEC Caco
ERJOH2 Brazil2 16
CEPEC Purus
ERJOH3 Brazil4 17
CEPEC Envira
ERJOH4 Brazil2 9
CEPEC Jaranca
ERJOH5 Brazil2 20
CEPEC Jurua
ERJOH6 Brazil2 9
CEPEC Curuça
ERJOH7 Brazil4 14
CEPEC Iça
ERJOH8 Brazil8 19
CEPEC Solimoes
ERJOH9 Brazil0 6
CEPEC Branco
ERJOH10 Brazil0 6
CEPEC Balbina
ERJOH11 Brazil7 21
CEPEC Alenquer
ERJOH12 Brazil8 30 3 16
CEPEC Ariquemes
ERJOH13 Brazil7 15
CEPEC Altamira
ERJOH14 Brazil3 11
CEPEC Bonevides
ERJOH15 Brazil5 25 5 14
CEPEC Japira
G8 Indonesia3 8 8 24
Trinitario/CNRA Trinitario
G23 Indonesia6 28 8 16
Trinitario/CATIE Trinitario
GAL2 Zulia/Ven3 25
Trinitario
GS29 Granada6 9 6 13
Trinitario/CNRA Trinitario
GS36 Granada6 9 17 29
Trinitario/CNRA Trinitario
GU144 Guyane Fr.1 29 4 16
CIRAD/MPL wild Cam. 7
GU154 Guyane Fr.0 30 0 16
CIRAD/MPL wildCam. 8
GU346 Guyane Fr.2 30 4 16
CIRAD/MPL wildCam. 13
GU349 Guyane Fr.1 29 0 16
CIRAD/MPL wildCam. 3
Guasare1 Guasare/Ven1 33
Criollo Criollo
Guasare2 Guasare/Ven1 33
Criollo Criollo
Guasare3 Guasare/Ven1 33
Criollo Criollo
Habillal1 Michoacan/Mex0 16
Criollo
HE2 Tachira/Ven11 33
Trinitario
HE3 Tachira/Ven14 33
Trinitario
HE4 Tachira/Ven2 33 0 16
Criollo
HE5 Tachira/Ven8 33
Trinitario
HE6 Tachira/Ven12 33
Trinitario
HE201 Tachira/Ven12 33
Trinitario
Hernandez212 Tachira/Ven 4 28 FONAIAP TrinitarioI059 Tabasco/Mex
19 25INIFAP, Finca El Danubio Trinitario
ICS1 Trinidad3 9
CNRA Trinitario
ICS6 Trinidad3 9 12 30
CNRA Trinitario
ICS16 Trinidad4 8 11 29 10 16
CNRA Trinitario
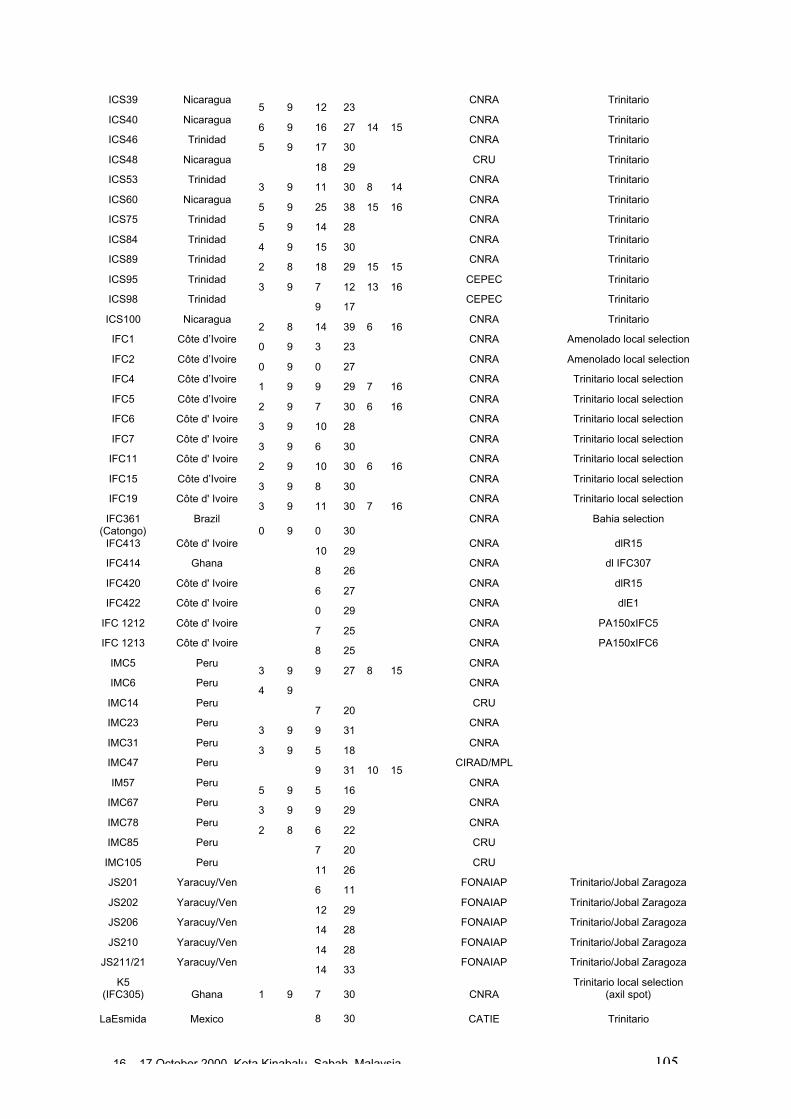
16 – 17 October 2000, Kota Kinabalu, Sabah, Malaysia 105
ICS39 Nicaragua5 9 12 23
CNRA Trinitario
ICS40 Nicaragua6 9 16 27 14 15
CNRA Trinitario
ICS46 Trinidad5 9 17 30
CNRA Trinitario
ICS48 Nicaragua18 29
CRU Trinitario
ICS53 Trinidad3 9 11 30 8 14
CNRA Trinitario
ICS60 Nicaragua5 9 25 38 15 16
CNRA Trinitario
ICS75 Trinidad5 9 14 28
CNRA Trinitario
ICS84 Trinidad4 9 15 30
CNRA Trinitario
ICS89 Trinidad2 8 18 29 15 15
CNRA Trinitario
ICS95 Trinidad3 9 7 12 13 16
CEPEC Trinitario
ICS98 Trinidad9 17
CEPEC Trinitario
ICS100 Nicaragua2 8 14 39 6 16
CNRA Trinitario
IFC1 Côte d’Ivoire0 9 3 23
CNRA Amenolado local selection
IFC2 Côte d’Ivoire0 9 0 27
CNRA Amenolado local selection
IFC4 Côte d’Ivoire1 9 9 29 7 16
CNRA Trinitario local selection
IFC5 Côte d’Ivoire2 9 7 30 6 16
CNRA Trinitario local selection
IFC6 Côte d' Ivoire3 9 10 28
CNRA Trinitario local selection
IFC7 Côte d' Ivoire3 9 6 30
CNRA Trinitario local selection
IFC11 Côte d' Ivoire2 9 10 30 6 16
CNRA Trinitario local selection
IFC15 Côte d’Ivoire3 9 8 30
CNRA Trinitario local selection
IFC19 Côte d' Ivoire3 9 11 30 7 16
CNRA Trinitario local selection
IFC361(Catongo)
Brazil0 9 0 30
CNRA Bahia selection
IFC413 Côte d' Ivoire10 29
CNRA dlR15
IFC414 Ghana8 26
CNRA dl IFC307
IFC420 Côte d' Ivoire6 27
CNRA dlR15
IFC422 Côte d' Ivoire0 29
CNRA dlE1
IFC 1212 Côte d' Ivoire7 25
CNRA PA150xIFC5
IFC 1213 Côte d' Ivoire8 25
CNRA PA150xIFC6
IMC5 Peru3 9 9 27 8 15
CNRA
IMC6 Peru4 9
CNRA
IMC14 Peru7 20
CRU
IMC23 Peru3 9 9 31
CNRA
IMC31 Peru3 9 5 18
CNRA
IMC47 Peru9 31 10 15
CIRAD/MPL
IM57 Peru5 9 5 16
CNRA
IMC67 Peru3 9 9 29
CNRA
IMC78 Peru2 8 6 22
CNRA
IMC85 Peru7 20
CRU
IMC105 Peru11 26
CRU
JS201 Yaracuy/Ven6 11
FONAIAP Trinitario/Jobal Zaragoza
JS202 Yaracuy/Ven12 29
FONAIAP Trinitario/Jobal Zaragoza
JS206 Yaracuy/Ven14 28
FONAIAP Trinitario/Jobal Zaragoza
JS210 Yaracuy/Ven14 28
FONAIAP Trinitario/Jobal Zaragoza
JS211/21 Yaracuy/Ven14 33
FONAIAP Trinitario/Jobal Zaragoza
K5(IFC305) Ghana 1 9 7 30 CNRA
Trinitario local selection(axil spot)
LaEsmida Mexico 8 30 CATIE Trinitario
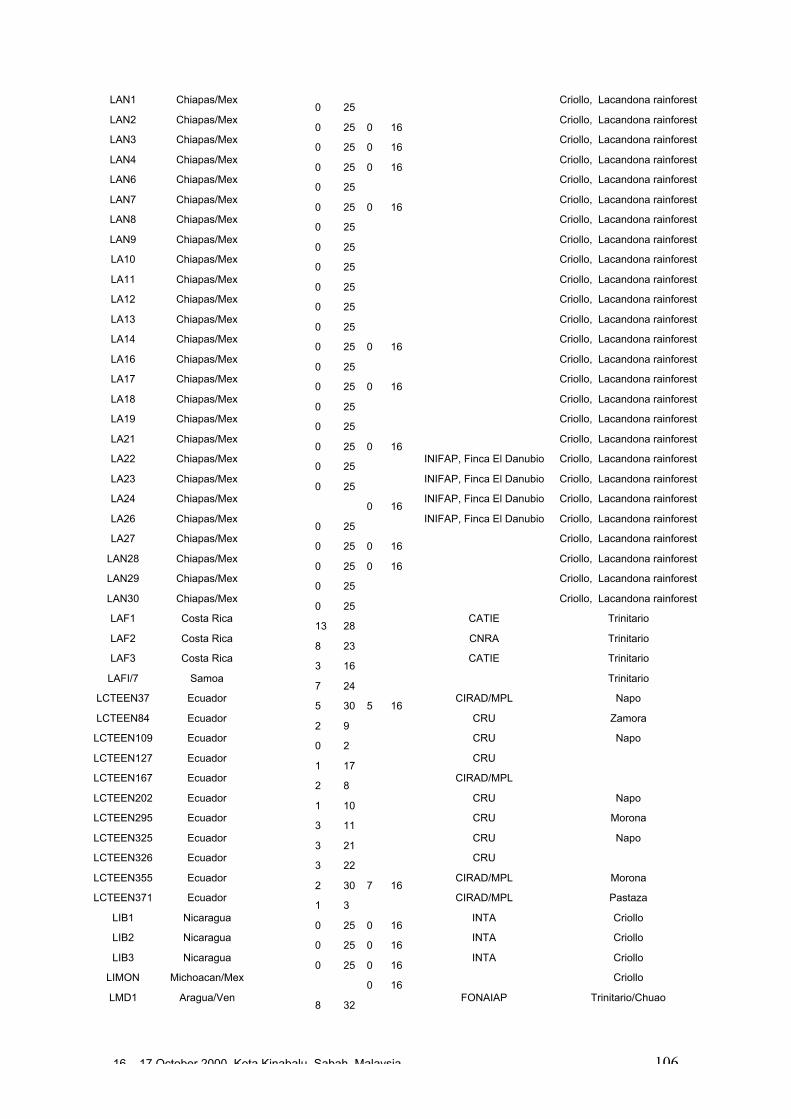
16 – 17 October 2000, Kota Kinabalu, Sabah, Malaysia 106
LAN1 Chiapas/Mex0 25
Criollo, Lacandona rainforest
LAN2 Chiapas/Mex0 25 0 16
Criollo, Lacandona rainforest
LAN3 Chiapas/Mex0 25 0 16
Criollo, Lacandona rainforest
LAN4 Chiapas/Mex0 25 0 16
Criollo, Lacandona rainforest
LAN6 Chiapas/Mex0 25
Criollo, Lacandona rainforest
LAN7 Chiapas/Mex0 25 0 16
Criollo, Lacandona rainforest
LAN8 Chiapas/Mex0 25
Criollo, Lacandona rainforest
LAN9 Chiapas/Mex0 25
Criollo, Lacandona rainforest
LA10 Chiapas/Mex0 25
Criollo, Lacandona rainforest
LA11 Chiapas/Mex0 25
Criollo, Lacandona rainforest
LA12 Chiapas/Mex0 25
Criollo, Lacandona rainforest
LA13 Chiapas/Mex0 25
Criollo, Lacandona rainforest
LA14 Chiapas/Mex0 25 0 16
Criollo, Lacandona rainforest
LA16 Chiapas/Mex0 25
Criollo, Lacandona rainforest
LA17 Chiapas/Mex0 25 0 16
Criollo, Lacandona rainforest
LA18 Chiapas/Mex0 25
Criollo, Lacandona rainforest
LA19 Chiapas/Mex0 25
Criollo, Lacandona rainforest
LA21 Chiapas/Mex0 25 0 16
Criollo, Lacandona rainforest
LA22 Chiapas/Mex0 25
INIFAP, Finca El Danubio Criollo, Lacandona rainforest
LA23 Chiapas/Mex0 25
INIFAP, Finca El Danubio Criollo, Lacandona rainforest
LA24 Chiapas/Mex0 16
INIFAP, Finca El Danubio Criollo, Lacandona rainforest
LA26 Chiapas/Mex0 25
INIFAP, Finca El Danubio Criollo, Lacandona rainforest
LA27 Chiapas/Mex0 25 0 16
Criollo, Lacandona rainforest
LAN28 Chiapas/Mex0 25 0 16
Criollo, Lacandona rainforest
LAN29 Chiapas/Mex0 25
Criollo, Lacandona rainforest
LAN30 Chiapas/Mex0 25
Criollo, Lacandona rainforest
LAF1 Costa Rica13 28
CATIE Trinitario
LAF2 Costa Rica8 23
CNRA Trinitario
LAF3 Costa Rica3 16
CATIE Trinitario
LAFI/7 Samoa7 24
Trinitario
LCTEEN37 Ecuador5 30 5 16
CIRAD/MPL Napo
LCTEEN84 Ecuador2 9
CRU Zamora
LCTEEN109 Ecuador0 2
CRU Napo
LCTEEN127 Ecuador1 17
CRU
LCTEEN167 Ecuador2 8
CIRAD/MPL
LCTEEN202 Ecuador1 10
CRU Napo
LCTEEN295 Ecuador3 11
CRU Morona
LCTEEN325 Ecuador3 21
CRU Napo
LCTEEN326 Ecuador3 22
CRU
LCTEEN355 Ecuador2 30 7 16
CIRAD/MPL Morona
LCTEEN371 Ecuador1 3
CIRAD/MPL Pastaza
LIB1 Nicaragua0 25 0 16
INTA Criollo
LIB2 Nicaragua0 25 0 16
INTA Criollo
LIB3 Nicaragua0 25 0 16
INTA Criollo
LIMON Michoacan/Mex0 16
Criollo
LMD1 Aragua/Ven8 32
FONAIAP Trinitario/Chuao
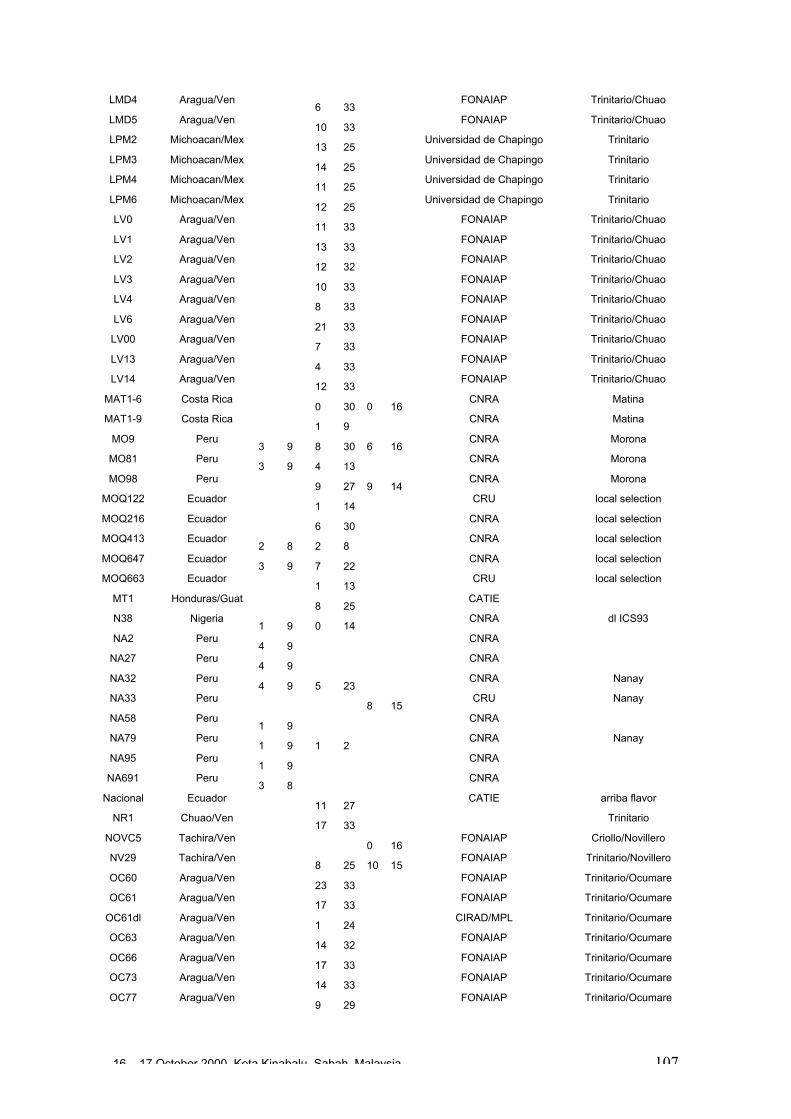
16 – 17 October 2000, Kota Kinabalu, Sabah, Malaysia 107
LMD4 Aragua/Ven6 33
FONAIAP Trinitario/Chuao
LMD5 Aragua/Ven10 33
FONAIAP Trinitario/Chuao
LPM2 Michoacan/Mex13 25
Universidad de Chapingo Trinitario
LPM3 Michoacan/Mex14 25
Universidad de Chapingo Trinitario
LPM4 Michoacan/Mex11 25
Universidad de Chapingo Trinitario
LPM6 Michoacan/Mex12 25
Universidad de Chapingo Trinitario
LV0 Aragua/Ven11 33
FONAIAP Trinitario/Chuao
LV1 Aragua/Ven13 33
FONAIAP Trinitario/Chuao
LV2 Aragua/Ven12 32
FONAIAP Trinitario/Chuao
LV3 Aragua/Ven10 33
FONAIAP Trinitario/Chuao
LV4 Aragua/Ven8 33
FONAIAP Trinitario/Chuao
LV6 Aragua/Ven21 33
FONAIAP Trinitario/Chuao
LV00 Aragua/Ven7 33
FONAIAP Trinitario/Chuao
LV13 Aragua/Ven4 33
FONAIAP Trinitario/Chuao
LV14 Aragua/Ven12 33
FONAIAP Trinitario/Chuao
MAT1-6 Costa Rica0 30 0 16
CNRA Matina
MAT1-9 Costa Rica1 9
CNRA Matina
MO9 Peru3 9 8 30 6 16
CNRA Morona
MO81 Peru3 9 4 13
CNRA Morona
MO98 Peru9 27 9 14
CNRA Morona
MOQ122 Ecuador1 14
CRU local selection
MOQ216 Ecuador6 30
CNRA local selection
MOQ413 Ecuador2 8 2 8
CNRA local selection
MOQ647 Ecuador3 9 7 22
CNRA local selection
MOQ663 Ecuador1 13
CRU local selection
MT1 Honduras/Guat8 25
CATIE
N38 Nigeria1 9 0 14
CNRA dl ICS93
NA2 Peru4 9
CNRA
NA27 Peru4 9
CNRA
NA32 Peru4 9 5 23
CNRA Nanay
NA33 Peru8 15
CRU Nanay
NA58 Peru1 9
CNRA
NA79 Peru1 9 1 2
CNRA Nanay
NA95 Peru1 9
CNRA
NA691 Peru3 8
CNRA
Nacional Ecuador11 27
CATIE arriba flavor
NR1 Chuao/Ven17 33
Trinitario
NOVC5 Tachira/Ven0 16
FONAIAP Criollo/Novillero
NV29 Tachira/Ven8 25 10 15
FONAIAP Trinitario/Novillero
OC60 Aragua/Ven23 33
FONAIAP Trinitario/Ocumare
OC61 Aragua/Ven17 33
FONAIAP Trinitario/Ocumare
OC61dl Aragua/Ven1 24
CIRAD/MPL Trinitario/Ocumare
OC63 Aragua/Ven14 32
FONAIAP Trinitario/Ocumare
OC66 Aragua/Ven17 33
FONAIAP Trinitario/Ocumare
OC73 Aragua/Ven14 33
FONAIAP Trinitario/Ocumare
OC77 Aragua/Ven9 29
FONAIAP Trinitario/Ocumare
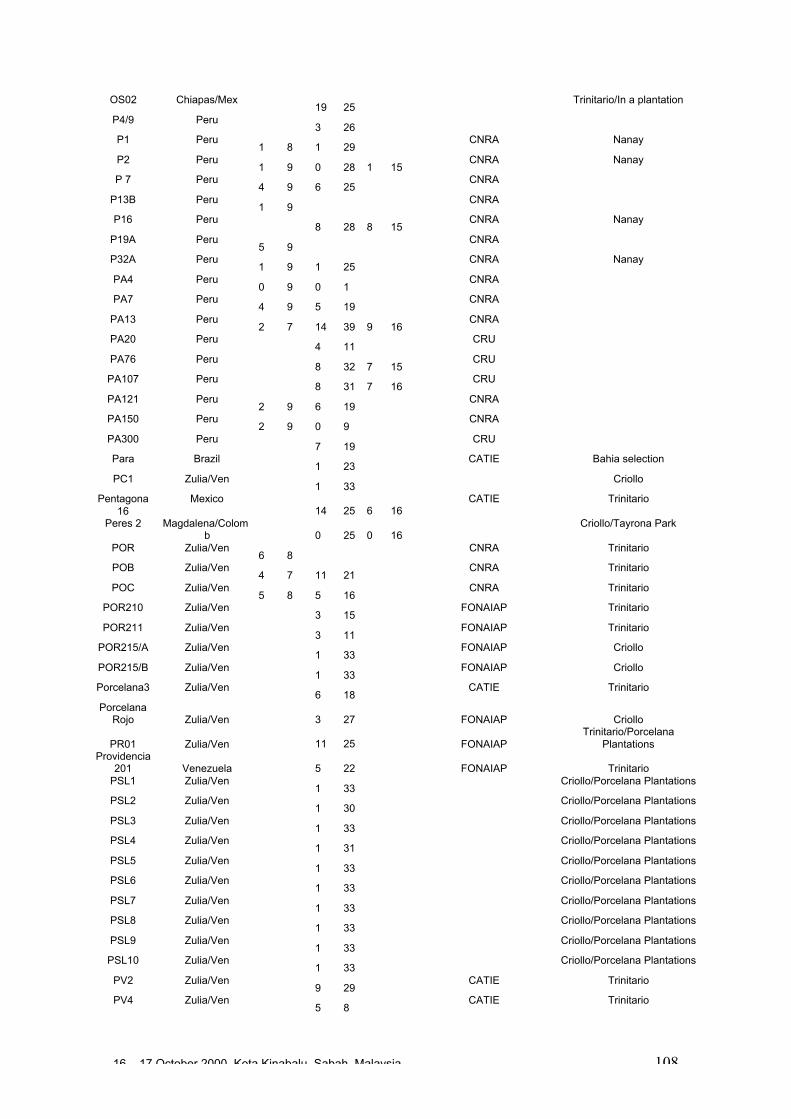
16 – 17 October 2000, Kota Kinabalu, Sabah, Malaysia 108
OS02 Chiapas/Mex19 25
Trinitario/In a plantation
P4/9 Peru3 26
P1 Peru1 8 1 29
CNRA Nanay
P2 Peru1 9 0 28 1 15
CNRA Nanay
P 7 Peru4 9 6 25
CNRA
P13B Peru1 9
CNRA
P16 Peru8 28 8 15
CNRA Nanay
P19A Peru5 9
CNRA
P32A Peru1 9 1 25
CNRA Nanay
PA4 Peru0 9 0 1
CNRA
PA7 Peru4 9 5 19
CNRA
PA13 Peru2 7 14 39 9 16
CNRA
PA20 Peru4 11
CRU
PA76 Peru8 32 7 15
CRU
PA107 Peru8 31 7 16
CRU
PA121 Peru2 9 6 19
CNRA
PA150 Peru2 9 0 9
CNRA
PA300 Peru7 19
CRU
Para Brazil1 23
CATIE Bahia selection
PC1 Zulia/Ven1 33
Criollo
Pentagona16
Mexico14 25 6 16
CATIE Trinitario
Peres 2 Magdalena/Colomb 0 25 0 16
Criollo/Tayrona Park
POR Zulia/Ven6 8
CNRA Trinitario
POB Zulia/Ven4 7 11 21
CNRA Trinitario
POC Zulia/Ven5 8 5 16
CNRA Trinitario
POR210 Zulia/Ven3 15
FONAIAP Trinitario
POR211 Zulia/Ven3 11
FONAIAP Trinitario
POR215/A Zulia/Ven1 33
FONAIAP Criollo
POR215/B Zulia/Ven1 33
FONAIAP Criollo
Porcelana3 Zulia/Ven6 18
CATIE Trinitario
PorcelanaRojo Zulia/Ven 3 27 FONAIAP Criollo
PR01 Zulia/Ven 11 25 FONAIAPTrinitario/Porcelana
PlantationsProvidencia
201 Venezuela 5 22 FONAIAP TrinitarioPSL1 Zulia/Ven
1 33Criollo/Porcelana Plantations
PSL2 Zulia/Ven1 30
Criollo/Porcelana Plantations
PSL3 Zulia/Ven1 33
Criollo/Porcelana Plantations
PSL4 Zulia/Ven1 31
Criollo/Porcelana Plantations
PSL5 Zulia/Ven1 33
Criollo/Porcelana Plantations
PSL6 Zulia/Ven1 33
Criollo/Porcelana Plantations
PSL7 Zulia/Ven1 33
Criollo/Porcelana Plantations
PSL8 Zulia/Ven1 33
Criollo/Porcelana Plantations
PSL9 Zulia/Ven1 33
Criollo/Porcelana Plantations
PSL10 Zulia/Ven1 33
Criollo/Porcelana Plantations
PV2 Zulia/Ven9 29
CATIE Trinitario
PV4 Zulia/Ven5 8
CATIE Trinitario
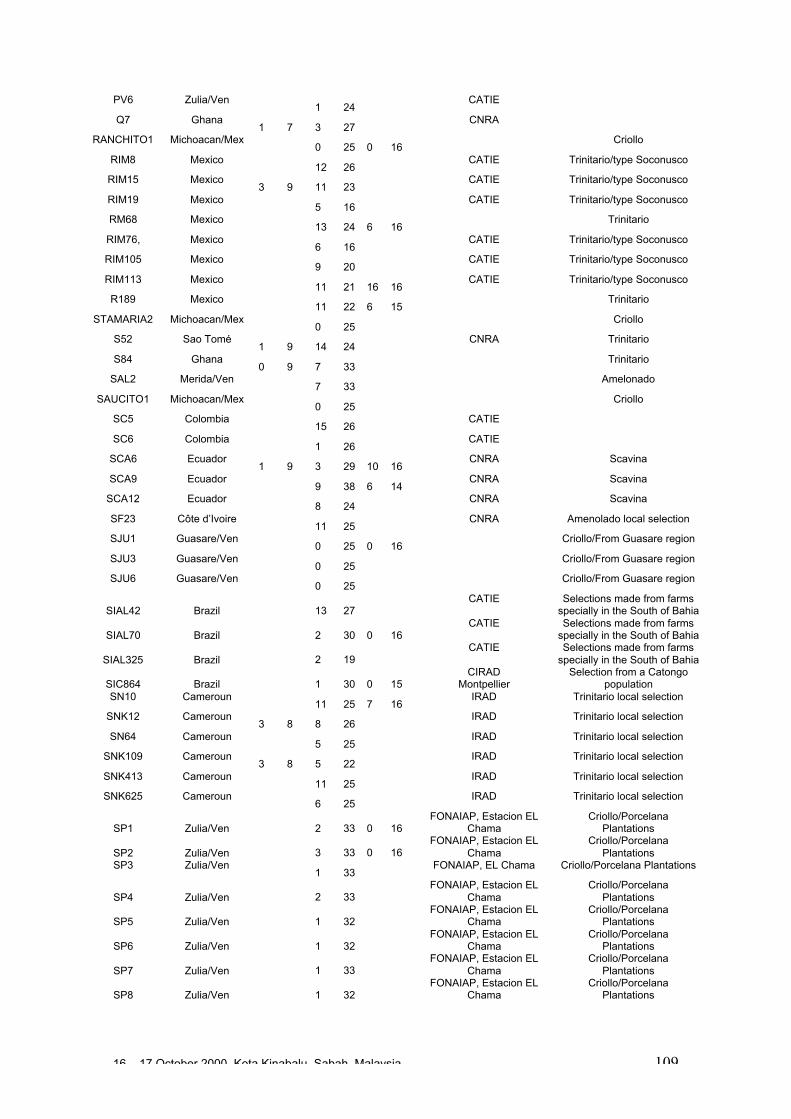
16 – 17 October 2000, Kota Kinabalu, Sabah, Malaysia 109
PV6 Zulia/Ven1 24
CATIE
Q7 Ghana1 7 3 27
CNRA
RANCHITO1 Michoacan/Mex0 25 0 16
Criollo
RIM8 Mexico12 26
CATIE Trinitario/type Soconusco
RIM15 Mexico3 9 11 23
CATIE Trinitario/type Soconusco
RIM19 Mexico5 16
CATIE Trinitario/type Soconusco
RM68 Mexico13 24 6 16
Trinitario
RIM76, Mexico6 16
CATIE Trinitario/type Soconusco
RIM105 Mexico9 20
CATIE Trinitario/type Soconusco
RIM113 Mexico11 21 16 16
CATIE Trinitario/type Soconusco
R189 Mexico11 22 6 15
Trinitario
STAMARIA2 Michoacan/Mex0 25
Criollo
S52 Sao Tomé1 9 14 24
CNRA Trinitario
S84 Ghana0 9 7 33
Trinitario
SAL2 Merida/Ven7 33
Amelonado
SAUCITO1 Michoacan/Mex0 25
Criollo
SC5 Colombia15 26
CATIE
SC6 Colombia1 26
CATIE
SCA6 Ecuador1 9 3 29 10 16
CNRA Scavina
SCA9 Ecuador9 38 6 14
CNRA Scavina
SCA12 Ecuador8 24
CNRA Scavina
SF23 Côte d’Ivoire11 25
CNRA Amenolado local selection
SJU1 Guasare/Ven0 25 0 16
Criollo/From Guasare region
SJU3 Guasare/Ven0 25
Criollo/From Guasare region
SJU6 Guasare/Ven0 25
Criollo/From Guasare region
SIAL42 Brazil 13 27CATIE Selections made from farms
specially in the South of Bahia
SIAL70 Brazil 2 30 0 16CATIE Selections made from farms
specially in the South of Bahia
SIAL325 Brazil 2 19CATIE Selections made from farms
specially in the South of Bahia
SIC864 Brazil 1 30 0 15CIRAD
MontpellierSelection from a Catongo
populationSN10 Cameroun
11 25 7 16IRAD Trinitario local selection
SNK12 Cameroun3 8 8 26
IRAD Trinitario local selection
SN64 Cameroun5 25
IRAD Trinitario local selection
SNK109 Cameroun3 8 5 22
IRAD Trinitario local selection
SNK413 Cameroun11 25
IRAD Trinitario local selection
SNK625 Cameroun6 25
IRAD Trinitario local selection
SP1 Zulia/Ven 2 33 0 16FONAIAP, Estacion EL
ChamaCriollo/Porcelana
Plantations
SP2 Zulia/Ven 3 33 0 16FONAIAP, Estacion EL
ChamaCriollo/Porcelana
PlantationsSP3 Zulia/Ven
1 33FONAIAP, EL Chama Criollo/Porcelana Plantations
SP4 Zulia/Ven 2 33FONAIAP, Estacion EL
ChamaCriollo/Porcelana
Plantations
SP5 Zulia/Ven 1 32FONAIAP, Estacion EL
ChamaCriollo/Porcelana
Plantations
SP6 Zulia/Ven 1 32FONAIAP, Estacion EL
ChamaCriollo/Porcelana
Plantations
SP7 Zulia/Ven 1 33FONAIAP, Estacion EL
ChamaCriollo/Porcelana
Plantations
SP8 Zulia/Ven 1 32FONAIAP, Estacion EL
ChamaCriollo/Porcelana
Plantations
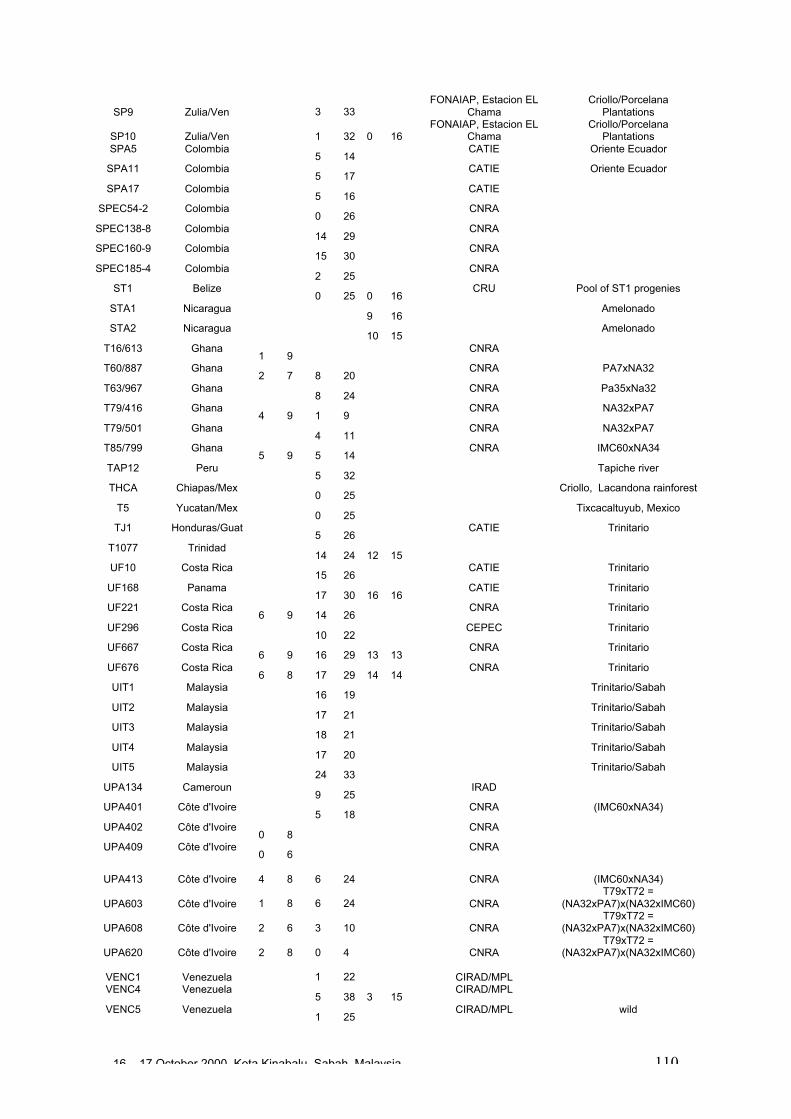
16 – 17 October 2000, Kota Kinabalu, Sabah, Malaysia 110
SP9 Zulia/Ven 3 33FONAIAP, Estacion EL
ChamaCriollo/Porcelana
Plantations
SP10 Zulia/Ven 1 32 0 16FONAIAP, Estacion EL
ChamaCriollo/Porcelana
PlantationsSPA5 Colombia
5 14CATIE Oriente Ecuador
SPA11 Colombia5 17
CATIE Oriente Ecuador
SPA17 Colombia5 16
CATIE
SPEC54-2 Colombia0 26
CNRA
SPEC138-8 Colombia14 29
CNRA
SPEC160-9 Colombia15 30
CNRA
SPEC185-4 Colombia2 25
CNRA
ST1 Belize0 25 0 16
CRU Pool of ST1 progenies
STA1 Nicaragua9 16
Amelonado
STA2 Nicaragua10 15
Amelonado
T16/613 Ghana1 9
CNRA
T60/887 Ghana2 7 8 20
CNRA PA7xNA32
T63/967 Ghana8 24
CNRA Pa35xNa32
T79/416 Ghana4 9 1 9
CNRA NA32xPA7
T79/501 Ghana4 11
CNRA NA32xPA7
T85/799 Ghana5 9 5 14
CNRA IMC60xNA34
TAP12 Peru5 32
Tapiche river
THCA Chiapas/Mex0 25
Criollo, Lacandona rainforest
T5 Yucatan/Mex0 25
Tixcacaltuyub, Mexico
TJ1 Honduras/Guat5 26
CATIE Trinitario
T1077 Trinidad14 24 12 15
UF10 Costa Rica15 26
CATIE Trinitario
UF168 Panama17 30 16 16
CATIE Trinitario
UF221 Costa Rica6 9 14 26
CNRA Trinitario
UF296 Costa Rica10 22
CEPEC Trinitario
UF667 Costa Rica6 9 16 29 13 13
CNRA Trinitario
UF676 Costa Rica6 8 17 29 14 14
CNRA Trinitario
UIT1 Malaysia16 19
Trinitario/Sabah
UIT2 Malaysia17 21
Trinitario/Sabah
UIT3 Malaysia18 21
Trinitario/Sabah
UIT4 Malaysia17 20
Trinitario/Sabah
UIT5 Malaysia24 33
Trinitario/Sabah
UPA134 Cameroun9 25
IRAD
UPA401 Côte d'Ivoire5 18
CNRA (IMC60xNA34)
UPA402 Côte d'Ivoire0 8
CNRA
UPA409 Côte d'Ivoire0 6
CNRA
UPA413 Côte d'Ivoire 4 8 6 24 CNRA (IMC60xNA34)
UPA603 Côte d'Ivoire 1 8 6 24 CNRAT79xT72 =
(NA32xPA7)x(NA32xIMC60)
UPA608 Côte d'Ivoire 2 6 3 10 CNRAT79xT72 =
(NA32xPA7)x(NA32xIMC60)
UPA620 Côte d'Ivoire 2 8 0 4 CNRAT79xT72 =
(NA32xPA7)x(NA32xIMC60)
VENC1 Venezuela 1 22 CIRAD/MPLVENC4 Venezuela
5 38 3 15CIRAD/MPL
VENC5 Venezuela1 25
CIRAD/MPL wild
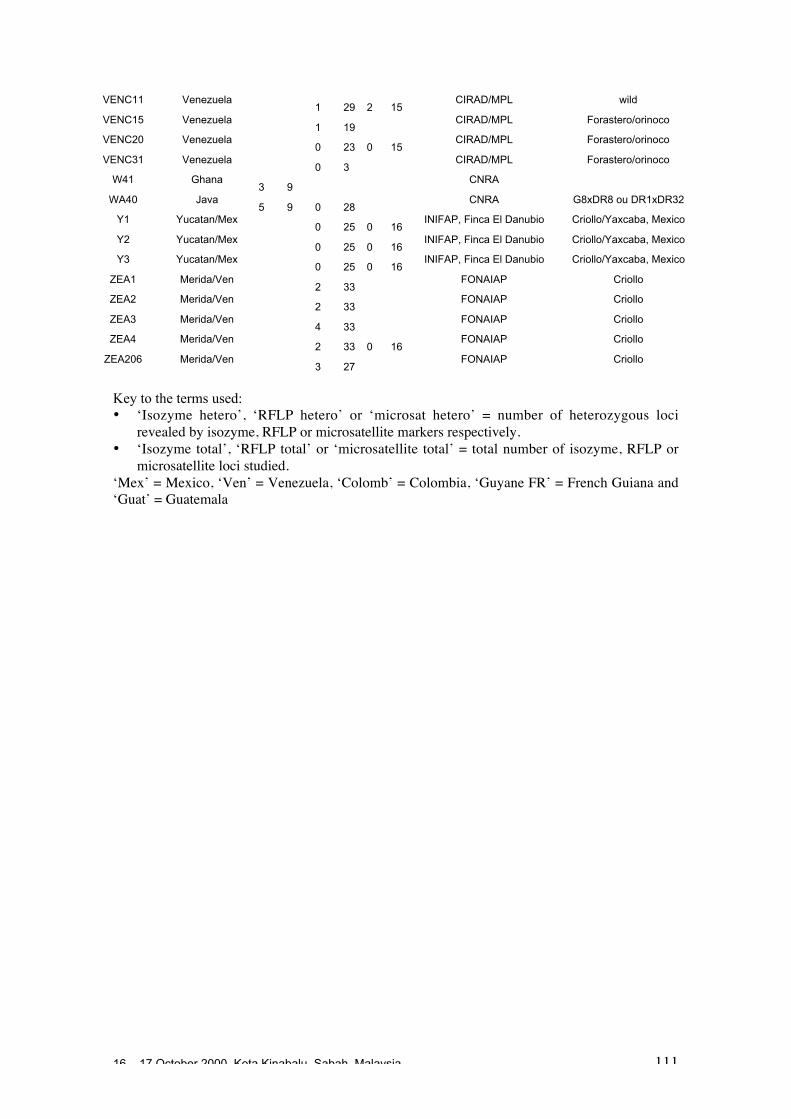
16 – 17 October 2000, Kota Kinabalu, Sabah, Malaysia 111
VENC11 Venezuela1 29 2 15
CIRAD/MPL wild
VENC15 Venezuela1 19
CIRAD/MPL Forastero/orinoco
VENC20 Venezuela0 23 0 15
CIRAD/MPL Forastero/orinoco
VENC31 Venezuela0 3
CIRAD/MPL Forastero/orinoco
W41 Ghana3 9
CNRA
WA40 Java5 9 0 28
CNRA G8xDR8 ou DR1xDR32
Y1 Yucatan/Mex0 25 0 16
INIFAP, Finca El Danubio Criollo/Yaxcaba, Mexico
Y2 Yucatan/Mex0 25 0 16
INIFAP, Finca El Danubio Criollo/Yaxcaba, Mexico
Y3 Yucatan/Mex0 25 0 16
INIFAP, Finca El Danubio Criollo/Yaxcaba, Mexico
ZEA1 Merida/Ven2 33
FONAIAP Criollo
ZEA2 Merida/Ven2 33
FONAIAP Criollo
ZEA3 Merida/Ven4 33
FONAIAP Criollo
ZEA4 Merida/Ven2 33 0 16
FONAIAP Criollo
ZEA206 Merida/Ven3 27
FONAIAP Criollo
Key to the terms used:• ‘Isozyme hetero’, ‘RFLP hetero’ or ‘microsat hetero’ = number of heterozygous loci
revealed by isozyme, RFLP or microsatellite markers respectively.• ‘Isozyme total’, ‘RFLP total’ or ‘microsatellite total’ = total number of isozyme, RFLP or
microsatellite loci studied.‘Mex’ = Mexico, ‘Ven’ = Venezuela, ‘Colomb’ = Colombia, ‘Guyane FR’ = French Guiana and‘Guat’ = Guatemala
16 – 17 October 2000, Kota Kinabalu, Sabah, Malaysia 112
USDA DNA Fingerprinting Programme for Identification ofTheobroma Cacao Accessions
James A. Saunders1, Alaa A. Hemeida2 and Sue Mischke1
1 - USDA, Agricultural Research Service, Bldg. 50, Rm. 100, Beltsville, MD 20705, USA2 - Genetic Engineering & Biotechnology Research Institute (GEBRI), Sadat City, MinufiyaUniversity, Egypt
Abstract
Living germplasm collections of Theobroma cacao genotypes are maintained in severalinternational collections scattered throughout Central and South America as well as in selectedCaribbean Islands such as Puerto Rico and Trinidad and Tobago. These living germplasmcollections predate the current curators and the scope of the genetic diversity within thesecollections has never been determined in detail. Preliminary molecular studies on a largeinternational collection in Trinidad and Tobago indicate that as much as 20-30% of the collectionmay be mislabelled or labelled with different names. The United States Department ofAgriculture has begun a programme to identify and describe the genetic diversity of thesecollections using state-of-the-art molecular fingerprinting techniques. Two separate molecularanalysis techniques, Amplified Fragment Length Polymorphism (AFLP) DNA analyses andSimple Sequence Repeats (SSR or microsatellite) DNA analysis were performed on populationsof trees in T. cacao germplasm collections to evaluate the utility of these procedures for DNAfingerprinting of this tree crop. DNA fragments were selectively amplified, labelled withfluorescent dyes and separated by capillary electrophoresis using two different models of DNAanalysers (an ABI/Perkin Elmer 310 single capillary injector and a Beckman CEQ 2000 eightchannel capillary DNA analyser). Using either procedure, electropherogrammes of DNAfragment patterns were reproducible and consistent within a common genotype, whiledifferentiating separate genotypes. Similarity dendrograms were based on the combined clusteranalysis of AFLP primer sets of polymorphic peaks or from SSR primers selectively amplifiedwith PCR technology. Based on this study, 15 primers for SSR markers have been selected asan international standard technique for T. cacao molecular characterisation. Molecularfingerprinting defines individual accessions, identifies duplications of genotypes withingermplasm collections, corrects mislabelling of accessions and establishes genetic similarity ofbreeding lines for potential crosses. This will help also to select for germplasm stocks to beused in breeding Theobroma cacao cultivars with improved tolerance/resistance to diseases.
Introduction
In the last 15 years, the rapid spread of three major fungal diseases affectingTheobroma cacao, together with unstable prices for cocoa beans, has reducedproduction of the commodity in Central and South America and nearby CaribbeanIslands by more than 75% of former values. The three most important diseases thatthreaten cocoa production in the Americas are Witches’ Broom disease caused byCrinipellis perniciosa, Frosty Pod Rot caused by Moniliophthora roreri and Black PodRot caused by several species of Phytophthora. The development of geneticallyresistant T. cacao is one technique that is being employed to help combat this problem.However, the germplasm collections available as genetic resources are comprised ofcocoa accessions which have never been fully characterised, and the informationabout the genetic diversity within each collection is lacking. Furthermore, it seemslikely that many identical accessions in the collections have been given different namesdue to the dates and conditions of collection. In a preliminary study in Trinidad andTobago, using RAPD molecular markers, it was estimated that up to 20% of the plots
16 – 17 October 2000, Kota Kinabalu, Sabah, Malaysia 113
could contain misidentified material due to errors during germplasm transfer or long-term maintenance (Christopher et al. 1999).To assist in the development of genetically resistant cultivars to these diseases inTheobroma cacao, the United States Department of Agriculture (USDA) has begun amulti-faceted genomics programme focused on T. cacao. The programme iscomprised of integrated efforts at three USDA locations that include:The molecular characterisation and DNA fingerprinting of all major cocoa germplasmcollections within the Americas willing to participate in international exchange ofgermplasm. The USDA International Cocoa DNA Fingerprinting Center is equippedwith state-of-the-art multi-channel capillary electrophoretic DNA fragment analysersand is located at the Beltsville Agricultural Research Center, Beltsville, MD, USA.Initiation of quarantine facilities and an International USDA Cocoa Core Germplasmcollection to aid in the exchange of disease-free cocoa germplasm. The cocoaquarantine centre is located at the Subtropical Horticultural Research Station, Miami,Florida, and the USDA Cocoa Core Germplasm collection is located at the TropicalAgricultural Research Station in Mayaguez, Puerto Rico. A small scale breedingprogramme will also be conducted at the USDA facilities in Puerto Rico.An in-depth molecular mapping and gene discovery programme in cocoa aimed atidentifying genes of resistance to major cocoa diseases. This effort will be centered atthe Subtropical Horticultural Research Station in Miami, Florida with close collaborationand support from the cocoa programme at the Beltsville Agricultural Research Centerin Beltsville, MD.This report will focus on the establishment of the International Cocoa MolecularIdentification Centre in Beltsville, and the activities of this programme on thecharacterisation of T. cacao germplasm collections by DNA fingerprinting procedures.
Material and methods
DNA isolationDNA isolations were performed on 100 mg samples of frozen leaf tissue from T. cacaoaccessions collected from either the USDA Tropical Agricultural Research Station inMayaguez, Puerto Rico or the CEPLAC Research Institute, Itabuna, Bahia, Brazil.Tissue disruption was accomplished with one 40-second shaking regime on a Bio101FastPrep (Carlsbad, CA) rapid oscillating shaker fitted with 2 ml tubes containinggarnet and a single 550 mg ceramic bead. For lack of a better name this“shaker/basher” produces a fine homogenate of leaf material by the abrasive actions ofthe garnet and ceramic bead striking against the leaf material while the assembly isbeing rapidly shaken in the presence of extraction buffer. This procedure has thedistinct advantage over grinding with a mortar and pestle in that 12 samples can beprocessed simultaneously with no possibility of cross contamination of leaf materialsince the samples are completely contained within labelled, disposable tubes. PurifiedDNA samples were isolated from this material using a modified Dneasy Plant Mini DNAisolation kit by Qiagen (Hilden, Germany). Double stranded DNA was quantified by thePicoGreen fluorescence technique (Molecular Probes, Inc., Eugene, OR) using aFluoroskan Ascent (Labsystems, Helsinki, Finland) microplate reader equipped with485/538 excitation/emission filter settings.
AFLP DNA analysisTechniques for the AFLP analysis of T. cacao were adapted and modified from thosepublished previously (Lin et al. 1996; Saunders et al. 2000, in press). Themodifications consisted of the use of fluorescent dyes linked to primers in place of 32P,and the use of capillary electrophoresis for DNA size fragment separation. Twodifferent capillary electrophoresis systems were used to evaluate the DNA fragmentanalysis. These systems consist of either an ABI Prism Perkin Elmer 310 single-
16 – 17 October 2000, Kota Kinabalu, Sabah, Malaysia 114
channel capillary Genetic Analyser (PE Applied Biosystems, Foster City, CA) used forAFLP DNA analysis or a Beckman CEQ2000 eight-channel capillary DNA AnalysisSystem (Beckman Coulter, Fullerton, CA) used for SSR DNA analysis.
For the ABI PE 310 capillary DNA fragment analyser, 5.5_l containing 50-200 ng ofgenomic DNA from each sample was digested overnight at room temperature andligated to adaptor pairs of known sequence following manufacturer’s instructions fromthe AFLP Plant Mapping Kit (PE Applied Biosystems, Foster City, CA). The ligationpairs and digestive enzymes were contained within an additional 5.5µ l of reagentmixture of 1 unit/µl EcoRI and 1 unit/µl of MseI restriction enzymes, 50 mM Tris-HCl pH7.5, 10 mM MgCl2, 10 mM dithiothreitol, 1 mM ATP, 25 µg/ml BSA, 60 Units of T4 DNAligase (New England Biolabs, Beverly, MA), 1 µl of each EcoRI and MseI adaptor pairs(AFLP Plant Mapping Kit, PE Applied Biosystems, Foster City, CA), 0.05 M NaCl and0.6 µl sterile distilled water. After the restriction-ligation of the DNA, the samples werediluted 18-fold with 15 mM tris-HCL pH 8.0 containing 0.1 mM EDTA. PCR pre-selective amplification was performed on the samples with a GeneAmp 9700 PCRsystem (PE Applied Biosystems, Foster City, CA), in a 20 µl reaction containing 4 µl ofthe restriction/ligated DNA and 16 µl of a mixture containing 1 µ l of EcoRI and MseIAFLP preselective primers (PE Applied Biosystems) and 15 µl of AFLP core mix (PEApplied Biosystems). The PCR amplification protocol consisted of 72ºC for 3 minutesfollowed by 20 cycles of the following profile: 94ºC for 20s, 56ºC for 30s and 72ºC for 2min with a final 60ºC hold for 30 min. The amplified product was diluted 20-fold using15 mM tris-HCl buffer pH 8.0 containing 0.1 mM EDTA.
For selective amplification of restriction fragments, seven sets of AFLP selectiveEcoRI and MseI primer pairs (PE Biosystems) were used. The reaction mixture foreach selective amplification contained 15 µl AFLP core mix, 1 µl of AFLP EcoRI dye-labelled primer with three additional user selected nucleotides and 1 µl AFLP MseIunlabelled primer with three additional user-selected nucleotides. The PCR profile forthe selected amplification consisted of an initial warm-up at 94ºC for two minutes thenone cycle of 94ºC for 20s, 66ºC for 30s and 72ºC for 2 min, followed by ten subsequentcycles each with 1ºC lowering of the annealing temperature and finally 25 cycles of94ºC for 20s, 56ºC for 30s and 72ºC for 2 min with a final hold of 60ºC for 30 min.Following PCR amplification, 1 µl of reaction products, 24 µl of deionised formamide,and 0.5 µl Genescan-400 size standard were mixed, heated at 95ºC for 5 min, andstored at 4ºC. DNA fragment sizes between 50 and 400 bp were separated anddetermined on an ABI Perkin Elmer 310 single-channel capillary genetic analyser.
SSR DNA analysisPrimer sequences for SSR analysis were described by Lanaud et al.(1999). For PCRamplification of the SSR primers in Theobroma cacao genomic DNA, five primer setswere synthesised at Research Genetics, Inc. (Huntsville, Alabama). The 5’forwardprimers end-labelled with WellRed TM fluorescent dyes were supplied and usedaccording to manufacturer’s instructions (Beckman Coulter Inc., Fullerton, CA, USA).The reaction mixtures contained 3 µl genomic DNA (≈100 ng), 1 µl of both forward andreverse primers (final concentration of 0.5 µl , and 15 µ l of PCR Super Mix (LifeTechnologies Inc., Gaithersburg, MD). The PCR reaction was performed in a GeneAmp 9700 PCR system with the temperature profile of 94ºC for 4 min followed by 40cycles of following profile: 94ºC for 30s, 46ºC or 51ºC for 1min and 72ºC for 2 min witha final 60ºC hold for 30 min. The individual samples were run on a Beckman CEQ2000eight channel capillary DNA Analysis system to determine the size of the amplifiedDNA fragments from each accession of Theobroma cacao. The capillary injectionconsisted of a 30 second electrophoresis at 2.0 kV from a 40 µ l mixture of 0.5 µ lCEQ2000 DNA size standard-400 (Beckman Coulter P/N 608098), 0.5 µl of PCRamplification mixture and 39 µl sample loading solution containing deionised formamide(SLS Beckman Coulter P/N 608083). The CEQ 2000 Frag-3 profile was used for the
16 – 17 October 2000, Kota Kinabalu, Sabah, Malaysia 115
running conditions that were: capillary temperature 50ºC, denaturation temperature90ºC for 120s, and separation voltage 6.0 kV for a run time of 35min. Data analysiswas performed using the CEQ 2000 Fragment Analysis software according tomanufacturer’s recommendations (Beckman Coulter Inc., Fullerton, CA, USA).
Results and discussion
Selection of DNA fingerprinting techniquesMultiple techniques are available for the molecular characterisation of plant germplasmcollections with refinements, updates and modifications of these procedures beingintroduced at an astounding pace. Several researchers have evaluated the use ofRandom Amplified Polymorphic DNA (RAPD) and Restriction Fragment LengthPolymorphism (RFLP) DNA analyses for diversity studies on T. cacao with mixedresults (e.g. Wilde et al. 1992; Gilmour 1994; Laurent et al. 1994; N’Goran et al. 1994and D. Butler Cocoa Research Unit, Trinidad And Tobago, personal communication).Although both of these molecular analysis techniques produce molecular markers,neither is suitable for the high throughput analysis necessary for the molecularcharacterisation of the estimated 8,000 – 10,000 T. cacao accessions held in presentcollections within the Americas. In addition, there are questions of consistency andrepeatability under the conditions necessary for large-scale projects using RAPD. Toaddress some of these issues, we evaluated two of the more recent DNA analyticalprocedures, Amplified Fragment Length Polymorphism’s (AFLP) and Simple SequenceRepeats (SSR also termed microsatellite analysis) for their utility as DNA fingerprintingprocedures for T. cacao germplasm collections. Since the size of the population whichis being evaluated was also a factor in the utility of the molecular procedure that isused, we looked at two different T. cacao populations, a small sample of 14 T. cacaoaccessions from Brazil and a larger population of approximately 125 T. cacaoaccessions collected from Central and South America. These samples were subjectedto DNA analysis using both AFLP and SSR protocols to evaluate the utility of thetechniques.
AFLP DNA analysisThe use of AFLP DNA analysis on T. cacao involves five basic steps for molecularanalysis. First the genomic DNA is isolated from the plant leaf and thoroughlyfragmented using the frequent cutting restriction enzymes EcoRI and MseI. Theserestriction enzymes completely digest the genomic DNA into fragments ofapproximately 50 – 1000 bp during a complete overnight digestion. The fragmentedDNA is then ligated with a small segment of known DNA and selected fragments of theDNA are copied by PCR amplification. In the third step of the process, furtherspecificity is achieved by a second, selective amplification in which the PCR primersare modified to amplify only a fraction of the genome. In the fourth step of the process,these fragments must be separated to produce the actual fingerprint upon whichsubsequent analysis is accomplished. At present, either electrophoresis on slab gelsor capillary systems are used for the separation of the DNA fragments. The final stepin the AFLP process is the scoring and data analysis of the DNA fragments. Thescoring of the DNA fragments is linked to the separation system and involves the needto visualise the DNA fragments by staining, fluorescent dyes, or with radioactiveisotope markers. Each of these DNA visualisation procedures brings its own set ofcriteria for accurate scoring and analysis of the data that is unique to that DNA marker.
One of the main advantages of the AFLP DNA analysis technique is that it is notnecessary for the researcher to have previous knowledge about the genome beingtested in order to achieve results capable of differentiating between genotypes. Havingsaid that, however, all AFLP primers do not produce equally valuable information aboutthe nature of the DNA being tested. Many AFLP primers work better in some plants
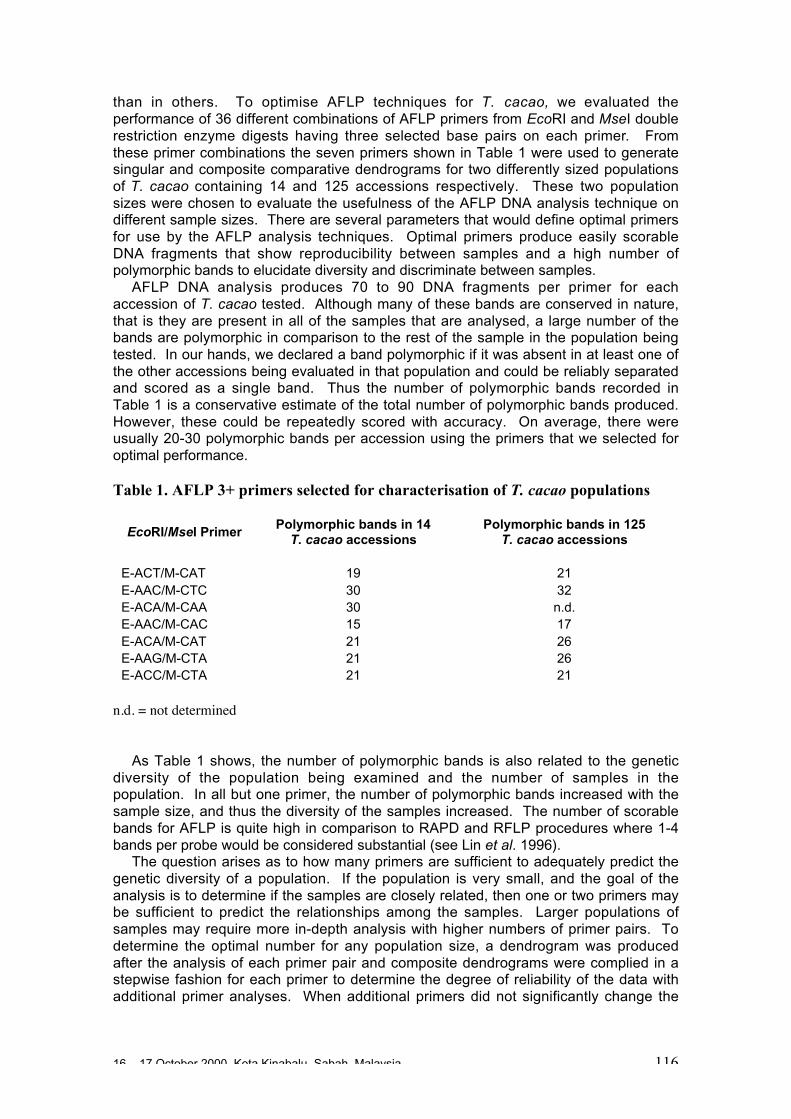
16 – 17 October 2000, Kota Kinabalu, Sabah, Malaysia 116
than in others. To optimise AFLP techniques for T. cacao, we evaluated theperformance of 36 different combinations of AFLP primers from EcoRI and MseI doublerestriction enzyme digests having three selected base pairs on each primer. Fromthese primer combinations the seven primers shown in Table 1 were used to generatesingular and composite comparative dendrograms for two differently sized populationsof T. cacao containing 14 and 125 accessions respectively. These two populationsizes were chosen to evaluate the usefulness of the AFLP DNA analysis technique ondifferent sample sizes. There are several parameters that would define optimal primersfor use by the AFLP analysis techniques. Optimal primers produce easily scorableDNA fragments that show reproducibility between samples and a high number ofpolymorphic bands to elucidate diversity and discriminate between samples.
AFLP DNA analysis produces 70 to 90 DNA fragments per primer for eachaccession of T. cacao tested. Although many of these bands are conserved in nature,that is they are present in all of the samples that are analysed, a large number of thebands are polymorphic in comparison to the rest of the sample in the population beingtested. In our hands, we declared a band polymorphic if it was absent in at least one ofthe other accessions being evaluated in that population and could be reliably separatedand scored as a single band. Thus the number of polymorphic bands recorded inTable 1 is a conservative estimate of the total number of polymorphic bands produced.However, these could be repeatedly scored with accuracy. On average, there wereusually 20-30 polymorphic bands per accession using the primers that we selected foroptimal performance.
Table 1. AFLP 3+ primers selected for characterisation of T. cacao populations
EcoRI/MseI PrimerPolymorphic bands in 14
T. cacao accessionsPolymorphic bands in 125
T. cacao accessions
E-ACT/M-CAT 19 21E-AAC/M-CTC 30 32E-ACA/M-CAA 30 n.d.E-AAC/M-CAC 15 17E-ACA/M-CAT 21 26E-AAG/M-CTA 21 26E-ACC/M-CTA 21 21
n.d. = not determined
As Table 1 shows, the number of polymorphic bands is also related to the geneticdiversity of the population being examined and the number of samples in thepopulation. In all but one primer, the number of polymorphic bands increased with thesample size, and thus the diversity of the samples increased. The number of scorablebands for AFLP is quite high in comparison to RAPD and RFLP procedures where 1-4bands per probe would be considered substantial (see Lin et al. 1996).
The question arises as to how many primers are sufficient to adequately predict thegenetic diversity of a population. If the population is very small, and the goal of theanalysis is to determine if the samples are closely related, then one or two primers maybe sufficient to predict the relationships among the samples. Larger populations ofsamples may require more in-depth analysis with higher numbers of primer pairs. Todetermine the optimal number for any population size, a dendrogram was producedafter the analysis of each primer pair and composite dendrograms were complied in astepwise fashion for each primer to determine the degree of reliability of the data withadditional primer analyses. When additional primers did not significantly change the
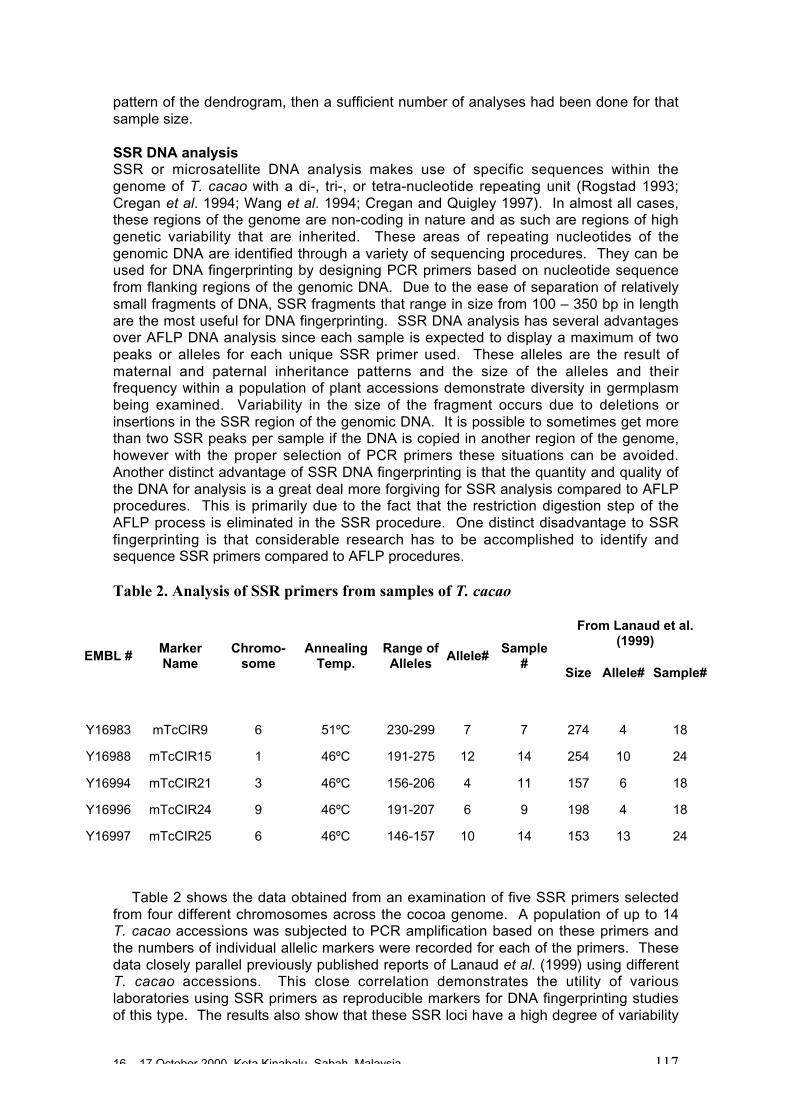
16 – 17 October 2000, Kota Kinabalu, Sabah, Malaysia 117
pattern of the dendrogram, then a sufficient number of analyses had been done for thatsample size.
SSR DNA analysisSSR or microsatellite DNA analysis makes use of specific sequences within thegenome of T. cacao with a di-, tri-, or tetra-nucleotide repeating unit (Rogstad 1993;Cregan et al. 1994; Wang et al. 1994; Cregan and Quigley 1997). In almost all cases,these regions of the genome are non-coding in nature and as such are regions of highgenetic variability that are inherited. These areas of repeating nucleotides of thegenomic DNA are identified through a variety of sequencing procedures. They can beused for DNA fingerprinting by designing PCR primers based on nucleotide sequencefrom flanking regions of the genomic DNA. Due to the ease of separation of relativelysmall fragments of DNA, SSR fragments that range in size from 100 – 350 bp in lengthare the most useful for DNA fingerprinting. SSR DNA analysis has several advantagesover AFLP DNA analysis since each sample is expected to display a maximum of twopeaks or alleles for each unique SSR primer used. These alleles are the result ofmaternal and paternal inheritance patterns and the size of the alleles and theirfrequency within a population of plant accessions demonstrate diversity in germplasmbeing examined. Variability in the size of the fragment occurs due to deletions orinsertions in the SSR region of the genomic DNA. It is possible to sometimes get morethan two SSR peaks per sample if the DNA is copied in another region of the genome,however with the proper selection of PCR primers these situations can be avoided.Another distinct advantage of SSR DNA fingerprinting is that the quantity and quality ofthe DNA for analysis is a great deal more forgiving for SSR analysis compared to AFLPprocedures. This is primarily due to the fact that the restriction digestion step of theAFLP process is eliminated in the SSR procedure. One distinct disadvantage to SSRfingerprinting is that considerable research has to be accomplished to identify andsequence SSR primers compared to AFLP procedures.
Table 2. Analysis of SSR primers from samples of T. cacao
From Lanaud et al.(1999)
EMBL #MarkerName
Chromo-some
AnnealingTemp.
Range ofAlleles
Allele#Sample
#Size Allele# Sample#
Y16983 mTcCIR9 6 51ºC 230-299 7 7 274 4 18
Y16988 mTcCIR15 1 46ºC 191-275 12 14 254 10 24
Y16994 mTcCIR21 3 46ºC 156-206 4 11 157 6 18
Y16996 mTcCIR24 9 46ºC 191-207 6 9 198 4 18
Y16997 mTcCIR25 6 46ºC 146-157 10 14 153 13 24
Table 2 shows the data obtained from an examination of five SSR primers selectedfrom four different chromosomes across the cocoa genome. A population of up to 14T. cacao accessions was subjected to PCR amplification based on these primers andthe numbers of individual allelic markers were recorded for each of the primers. Thesedata closely parallel previously published reports of Lanaud et al. (1999) using differentT. cacao accessions. This close correlation demonstrates the utility of variouslaboratories using SSR primers as reproducible markers for DNA fingerprinting studiesof this type. The results also show that these SSR loci have a high degree of variability
16 – 17 October 2000, Kota Kinabalu, Sabah, Malaysia 118
associated with this population of plant samples, allowing for assignment of a uniquemolecular description of each of the samples with three to four SSR primers.
Conclusions
We have examined two different molecular analytical systems, namely AFLP and SSRDNA analysis, for their utility as a procedure for the molecular characterisation ofinternational germplasm collections of T. cacao. Both techniques are useful and canbe used to clearly define the genetic identity and diversity of these valuable resources.Due to the ease of data analysis, reproducibility, and simplicity of the proceduraloperations, the use of SSR DNA analysis has been recommended as an internationalstandard for T. cacao. Further, 15 specific SSR primers will be selected as theinternational standard primers for SSR analysis of T. cacao so that internationalagreement of nomenclature can be applied uniformly throughout the global cocoacommunity.
References
Christopher Y., V. Mooleedhar, F. Bekele and F. Hosein. 1999. Verification of accessions in theICG,T using botanical descriptors and RAPD analysis. Pages 15-18 in Annual Report of theCocoa Research Unit for 1998. Cocoa Research Unit, The University of the West Indies, St.Augustine, Trinidad and Tobago.
Cregan P.B., M.S. Akkaya, A.A. Bhagwat, U. Lavi and J. Rongwen. 1994. Lengthpolymorphisms of simple sequence repeat (SSR) DNA as molecular markers in plants.Pages 47-56 in Plant Genome Analysis (Gresshoff, P.M., ed). CRC Press, Boca Raton,Florida.
Cregan P.B and C.V. Quigley. 1997. Simple sequence repeat DNA marker analysis. Pages173-185 in DNA Markers: Protocols, Applications and Overviews. (Caetano-Anolles, G. andGresshoff, P.M., eds). John Wiley & Sons, New York.
Gilmour M. 1994. The BCCCA ringtest on the RAPD analysis of cocoa. Pages 135-138 inProceedings of the International Workshop on Cocoa Breeding Strategies, Kuala Lumpur,Malaysia.
Lanaud C., A.M. Risterucci, I. Pieretti, M. Falque, A. Bouet and P.J.L. Lagoda. 1999. Isolationand characterization of microsatellites in Theobroma cacao L. Molecular Ecology 8: 2141-2143.
Laurent V., A.M. Risterucci and C. Lanaud. 1994. Genetic diversity in cocoa revealed by c-DNAprobes. Theor. Appl. Genet. 88: 193-198.
Lin J.J., J. Kuo, J. Ma, J.A. Saunders, H.S. Beard, M. H. MacDonald, W. Kenworthy, G.N. Udeand B.F. Matthews. 1996. Identification of molecular markers in soybean comparing RFLP,RAPD and AFLP DNA mapping techniques. Plant Molecular Biology Reporter 14: 156-169.
N’Goran J.A.K., V. Laurent, A.M. Risterucci and C. Lanaud. 1994. Comparative geneticdiversity studies of Theobroma cacao L. using RFLP and RAPD markers. Heredity 73: 589-597.
Risterucci A.M., L. Grivet, J.A.K. N’Goran, I. Pieretti, M.H. Flament and C. Lanaud. 2000. Ahigh density linkage map of Theobroma cacao L. Theor. and Appl. Genet. In press.
Rogstad S.H. 1993. Surveying plant genomes for variable number of tandem repeat loci.Methods in Enzymology 224: 278-294.
Saunders J.A., M.J. Pedroni, L. Penrose and T. Fist. 2000. AFLP DNA analysis of opiumPoppy. Crop Science. In press.
Wang Z., J.L. Weber, G. Zhong and S.D. Tanksley.1994. Survey of plant short tandem DNArepeats. Theor. and Appl. Genet. 88: 1-6.
Wilde J.R., R. Waugh and W. Powell. 1992. Genetic fingerprinting of Theobroma clones usingrandomly amplified polymorphic DNA markers. Theor. and Appl. Genet. 83: 871-877.
16 – 17 October 2000, Kota Kinabalu, Sabah, Malaysia 119
Use of QTL Detected for Resistance to Phytophthora inTheobroma Cacao L.
Claire Lanaud
Cirad-Amis, TA 40/03, Avenue Agropolis, 34398 Montpellier Cedex 5, France
Abstract*
In the framework of a CAOBISCO sponsored project the genetic bases of resistance to severalspecies of Phytophthora have been studied. Different significant QTL identified make it possibleto accumulate various genes to improve varietal resistance. Markers closely linked to QTLcould allow to control at early stages the presence of resistance alleles in progenies. Severalapplications or strategies using QTL analyses could be considered to improve the resistancelevel.• Creation of genotypes homozygous for resistance alleles. The most resistant clones, asSCA6 and SNK413, could have the resistance genes in a homozygous condition. Theidentification of a QTL means a heterozygous condition of the resistance gene identified in theparent studied. By selfing the genotypes and using Marker Assisted Selection (MAS) it ispossible to produce and screen selfed progenies for plants that are homozygous for theresistance alleles. These clones will have a higher resistance level and a better combiningability to produce resistant hybrids.• Accumulation of various resistance genes and other genes of interest. Various resistancegenes could be accumulated using MAS by crossing clones for which different QTL ofresistance have been identified. It is also possible to use MAS to break linkage betweenfavourable and unfavourable alleles located in the same chromosome region.• Early selection for resistance and other traits. Increased selection efficiency in pre-breeding, at the nursery stage, would be possible by applying MAS on a limited number ofresistance QTL (the stronger QTL, QTL for resistance to several Phytophthora species…) andto have available more plants to apply selection for other traits of interest in the field.• Combined use of marker information and phenotypic selection to constitute a selectionindex. Information on a larger number of QTL could be combined with phenotypic selectionrelated to resistance traits (e.g. intrinsic resistance revealed by leaf tests) or other traits ofinterest to constitute a selection index.• Application of MAS at other sites than those where QTL have been identified. It is possibleto accumulate QTL identified at different sites for resistance to diseases not present in thecountry (examples: screening in Montpellier for resistance to P. palmivora, P. megakarya,P. capsici or possible selection of field resistance to P. megakarya on the basis of QTL identifiedin Cameroon).
The first results obtained in the CAOBISCO project allow to put in place several experimentsto test different MAS strategies (selfing clones to fix resistance genes in homozygous condition,accumulating various resistance genes). However the identification of QTL in important otherresistant clones has to be continued to identify all major sources of resistance to Phytophthorain cocoa.
* This is the summary of the paper presented by Claire Lanaud at the INGENICWorkshop. For the full paper of Claire Lanaud et al. on QTL detection for resistance toPhytophthora, please consult the Proceedings of the 13th International Cocoa ResearchConference.
16 – 17 October 2000, Kota Kinabalu, Sabah, Malaysia 120
Use of QTLs for Witches’ Broom Resistance in Cocoa Breeding
Dário Ahnert
Universidade Estadual de Santa Cruz, Pro-Reitorio de Pesquisa e Pos-Graduaçao, Km 16,Rodovia Ilheus-Itabuna, CEP 45650-000, Bahia, Brazil
Abstract
Witches' broom disease, caused by Crinipellis perniciosa, is the most devastating cocoa pest inthe American continent. The fungus attacks meristematic tissues such as young pods, flowercushions, vegetative shoots, and leaves causing reduced production and damage to the plant.Herein we report the results of a QTL study for resistance to witches’ broom and show howthese findings can help to accelerate breeding for resistance. For the study, we used 82 F2
plants derived from the cross ICS 1 (susceptible parent) and SCA 6 (resistant parent), evaluatedfor witches’ broom resistance over two years at the CEPEC/CEPLAC research centre inItabuna, Bahia, and 193 DNA markers (124 RAPD and 69 AFLP). Interval and compositeinterval mapping models identified one major genomic region (covering 27cM) associated withwitches’ broom resistance on the SCA 6 linkage group. These results are in accordance with thepattern of segregation observed in the field for SCA 6 progenies and may be used in a marker-assisted selection process for gene pyramidisation.
Introduction
Witches’ broom disease, caused by the fungus Crinipellis perniciosa, is one of the mostdevastating cocoa pests in the American continent threatening the cocoa industry inalmost all producing countries in that region. The fungus attacks meristematic tissuessuch as young pods, flower cushions, vegetative shoots, and leaves causing reducedproduction and damage to the plant. The disease is responsible for 18% of the globalcocoa losses (Van der Vossen 1999) and can reduce yield by more than 50% at thefarm level. Disease control is based on the removal of infected tissues from the trees,application of copper fungicides to protect the young pods and use of resistantgenotypes. Genetic resistance, the most efficient method of C. perniciosa control, hasbeen used since the first outbreak of the fungus in Ecuador in 1918 (Stell 1934).According to this author, the Ecuadorian farmers established new plantations with theresistant genotypes called ‘refractarios’. However this has not solved the problem inEcuador, possibly due to the fact that farmers have used seeds derived from out-crossed ‘refractarios’ and these, according to the literature, are heterozygousgenotypes.
The Scavina (SCA) selections are the most important sources of resistance, andhave been widely used in the Brazilian cocoa breeding programme (Ahnert and Pires2000). Other sources of resistance are available (Pires et al. 1999; Reyes 1999;Fonseca et al. 1999), and these are also being incorporated into the breedingprogramme. Resistance to C. perniciosa has a polygenic inheritance but in the case ofSCA 6 it has been suggested that only a few genes may be responsible for diseasecontrol (Bartley 1977; Pires et al. 1999).
To study the inheritance of SCA 6 resistance for C. perniciosa, we used an F2
population of 82 plants, derived through self-pollination of the clone TSH 516. Thisclone is a selection derived from the cross SCA 6 X ICS 1. The F2 plants were grown atthe CEPEC/CEPLAC research centre in Itabuna, Bahia, and were six years old whenfield evaluation was initiated. Evaluation was carried out over two years, 1988 and1999, by removing vegetative brooms four times per year and counting them. Each F2
plant, the parental clones SCA 6 and ICS 1, and the F1 clone TSH 516 were evaluated.
16 – 17 October 2000, Kota Kinabalu, Sabah, Malaysia 121
For these latter three clones, ten plants of each were evaluated in the germplasmcollection. DNA was extracted from each F2 plant, from the F1 plant and from theparents. The following molecular markers were collected: Randomly AmplifiedPolymorphic DNA (RAPD) and Amplified Fragment Length Polymorphism (AFLP). Agenetic linkage map was constructed using the software MAPMAKER 3.0 and QTLswere mapped using the software QTL Cartographer.
CEPLAC/CEPEC, Universidade Federal de Viçosa (UFV/BIOAGRO), UniversidadeEstadual de Santa Cruz (UESC) and Universidade Estadual Norte Fluminense (UENF)carried out the QTL mapping study. The data were used for a Master’s degree thesisby T.V. Queiroz at UFV/BIOAGRO, Viçosa, Brazil. Herein, we will discuss the use ofSCA 6 QTLs for resistance breeding. The complete manuscript showing the QTLmapping is under preparation.
Results and discussion
Phenotypic data and QTL mappingMost of the F2 plants showed the same level of field resistance as SCA 6, withapproximately one vegetative broom/plant/removal. A few plants had more than tenbrooms/plant/removal, and thus they resembled the susceptible genotype ICS1, whichhad more than 50 brooms/plant/removal. These findings suggest a trend towards asegregation rate of 3:1, expected for a single dominant gene. They are in accordancewith earlier findings that a single dominant allele controls SCA 6 resistance (Bartley1977).
A total of 193 DNA markers (124 RAPD and 69 AFLP) were mapped along 25linkage groups covering 1,713cM. One major QTL was mapped on linkage group 11,linked to a SCA 6 marker, and explained approximately 36% of the phenotypic variationfor resistance (Queiroz et al. 2000). A more detailed study of this region using a largernumber of F2 plants, candidate resistance genes as markers, and cloning andsequencing may help to reveal further details of the genetics behind SCA 6 resistance.This major SCA 6 QTL, with a dominant pattern of inheritance, can be used for rapidgenetic gain in a breeding programme. Due to this feature and the good generalcombining ability of SCA 6, this clone is already widely used in the Brazilian breedingpopulations in Bahia and in the Amazon region.
Use of SCA 6 genes for resistance breedingWhen SCA 6 and SCA 12 progenies were first tested for resistance to C. perniciosa inTrinidad and Ecuador, SCA’s resistance was not considered to be durable (Bartley1977). According to this author, initially the progenies had low levels of infection but asthe experiment progressed, infection increased. Similar results were observed for theSCA progenies in hybrid trials in the Amazon (State of Rondônia). We believe that oneof the major reasons for this is the increase in inoculum pressure in the field resultingfrom infections on susceptible plants from other crosses in the experiment and in theneighbourhood. It seems that as the level of inoculum gets higher, infection levelsincrease as well. Another reason may be the evolution of races of the fungus that canovercome the SCA resistance genes.
Among and within SCA progenies, some plants are usually more resistant thanothers, indicating that more than one gene is involved in resistance. For example, theclone TSH 1188 is one of the most witches’ broom resistant clones in Bahia. It mayhave the SCA QTL plus some minor genes from ICS 1 and IMC 67 that increaseresistance.
Studies of witches’ broom resistance in Brazil were initiated in the 1960’s whenCEPLAC started field trials in the Amazon to evaluate crosses between clones (F1
hybrids). Soon it became evident that the different hybrid combinations reacteddifferently to the attack of the fungus. It was observed that progenies derived from
16 – 17 October 2000, Kota Kinabalu, Sabah, Malaysia 122
SCA 6 and SCA 12, PA 150, IMC 67, Cruzeiro do Sul and RB suffered less pod lossand infection than all the other hybrids (Ahnert et al. 1991). Based on this information,we decided to eliminate all highly susceptible clones from the Amazon cocoa breedingprogramme, leaving only the more resistant clones for hybrid seed production. So, thecultivars released to farmers from the 1990’s onwards in that region have been amixture of medium to highly witches’ broom resistant hybrids. This degree of geneticcontrol, associated with phytosanitary removal of brooms in the dry season, has helpedto ensure relatively low yield losses caused by witches’ broom in the Amazon.
C. perniciosa reached the cocoa plantations in Bahia in 1989. This provided the firstopportunity for a very good field evaluation for witches’ broom resistance since therewere many germplasm and hybrid trials at CEPEC that were uniformly established inthe field with plants being at least eight years old. Initially, with a low to medium level ofinoculum pressure, genotypes with different patterns of resistance could be identified(Pires et al. 1999).
According to Van der Vossen (1999), a cultivar is considered to have durableresistance when it is grown for a long time in an environment considered favourable tothe disease and the resistance remains effective. Having this concept in mind, 15selected resistant clones (mostly SCA 6 derived ones) have been released recently byCEPLAC to growers in Bahia. Local farmers have often selected other resistant plantsin their own farms (many apparently also derived from SCA clones), and are currentlyusing these as well as the 15 officially recommended clones to renew their plantations.
Marker assisted breedingThe identification of the major QTL of SCA 6 for resistance and the knowledge thatother genes for resistance contribute to increased resistance, opens the possibility ofgene pyramidisation via Marker Assisted Selection (MAS). Since the SCA 6 major QTLhas such a large effect, the presence of any other resistance genes in the same plantcan easily be masked in the phenotypic evaluation. However, if markers can bedeveloped which are closely linked to these other genes, MAS can be used to detectthose plants which possess these other resistance genes in addition to the SCA 6 QTL.If suitable markers can be developed, MAS can be carried out at the seedling stage,thus accelerating the breeding process. Seedlings derived from double, triple or higherlevel crosses from different sources of resistance could be screened for the presenceof markers linked to QTL and grafted onto old rootstocks for phenotypic selection.Grafting onto rootstocks would accelerate evaluation and, hence the breeding cycle.MAS would eliminate the need for phenotypic screening in the greenhouse andfacilitate gene pyramidisation.
Even though resistance provided by this major SCA 6 QTL may have lost some ofits efficiency in Ecuador and Rondônia (Brazil), it is still very effective in Trinidad and inBahia. In combination with other genes, it could provide durable resistance to localstrains of C. perniciosa.
Acknowledgements
The financial support received for this work from BNB, BIOAGRO, CNPq, CAPES,CEPLAC/CEPEC and UESC is gratefully acknowledged.
References
Ahnert D. and J.L. Pires. 2000. Use of the available genetic variability of cocoa in Brazil . Pages104-113 in Proceedings of Technical Meeting: State of the Knowledge on Mass Productionof Genetically Improved Propagules of Cocoa. Ilhéus, Bahia, Brazil, October, 1998.
16 – 17 October 2000, Kota Kinabalu, Sabah, Malaysia 123
Ahnert D., P.F.R. Machado, B.G.D. Bartley, R.G. Kobayashi and F.C.O. Silva. 1991.Desenvolvimento e avaliação de cacaueiros híbridos para a Amazônia. In Informe Tecnico,Belém, PA, Brasil, CEPLAC/CORAM, 1989-90.
Bartley B.G.D. 1977. The status of genetic resistance in cocoa to Crinipellis perniciosa (Stahel)Singer. Pages 57-69 in Proceedings of The International Cocoa Research Conference,Caracas, Venezuela. Cocoa Producers Alliance, Lagos, Nigeria.
Fonseca S.E.A., E.F. Neto, P.S.B. Albuquerque and C.M.V.C. Almeida. 1999. A contribuiçãodas pesquisas na Amazônia brasileira para resistencia às doenças. Pages 103–105 inProceedings of the International Workshop on the Contribution of Disease Resistance toCocoa Variety Improvement. November, 1996, Salvador, Bahia, Brazil. INGENIC, Reading,U.K.
Pires J.L., W.R. Monteiro, E.D.M.N. Luz, S.D.V.M. Silva, L.R.M. Pinto, A. Figueira, K.P.Gramacho, U.V. Lopes, P.S.B. Albuquerque, M.M. Yamada, D. Ahnert and M.I.B.Brugnerotto. 1999. Cocoa breeding for witches’ broom resistance at CEPEC, Bahia, Brazil.Pages 91–101 in Proceedings of the International Workshop on the Contribution of DiseaseResistance to Cocoa Variety Improvement. November 1996, Salvador, Bahia, Brazil.INGENIC, Reading, UK.
Queiroz V.T., C.T. Guimarães, D. Ahnert, J.W.S. Mota, M.G. Pereira, R.F. Daher, V.R.M.Miranda, E.G. Barros and M.A. Moreira. 2000. Mapping of major QTLs associated withwitches broom resistance in cocoa. Page 227 in Genetics and Molecular Biology, Volume 23No. 3, Supplement. Program and Abstracts - 46th Congresso Nacional de Genética. Aguasde Lindóia, São Paulo, Brazil.
Reyes L.C. de. 1999. Reacciones de cultivares de cacao a los principales patogenos presentesen Venezuela. Pages 75-81 in Proceedings of the International Workshop on theContribution of Disease Resistance to Cocoa Variety Improvement. November, 1996,Salvador, Bahia, Brazil. INGENIC, Reading, UK.
Stell F. 1934. Report on his visit to Equador to study witches’ broom disease (Marasmiousperniciosa ) of cocoa: Trinidad and Tobago. Council paper No. 137. Government Printery,Port-of-Spain, Trinidad.
Van der Vossen H.A.M. 1999. Strategies of variety improvement in cocoa with emphasis ondurable resistance. Pages 26-31 in Proceedings of the International Workshop on theContribution of Disease Resistance to Cocoa Variety Improvement. November, 1996,Salvador, Bahia, Brazil. INGENIC, Reading, UK.
16 – 17 October 2000, Kota Kinabalu, Sabah, Malaysia 124
QTL Studies Carried out for Agronomic, Technological andQuality Traits of Cocoa in Ecuador
Dominique Crouzillat, Michel Rigoreau, Morgan Cabigliera, Milton Alvarez*, PeterBucheli and Vincent Pétiard
Centre de Recherche Nestlé, 101, Avenue Gustave Eiffel, Notre-Dame D’Oé, B.P. 9716, 37097Tours Cedex 2, France* Nestlé Agronomia, Via Interoceanica, Castilla postal 17-11- 6053, Quito-Cumbaya, Ecuador
Abstract
An F2 population, obtained by selfing an Ecuadorian hybrid cocoa genotype with Arriba flavour,was the basis for a genetic study on agronomic, technological and qualitative traits. Geneticanalyses using RFLP and microsatellite markers indicated that this Ecuadorian hybrid cocoawas the result of a cross between a highly homozygous Nacional genotype and an unknowngenotype that probably came from Venezuela. A genetic map was obtained from 171 trees ofthe F2 segregating population with 113 loci including RFLP and microsatellite markers andcovering 815 cM. The average distance between two adjacent loci is about 8.4 cM. A majorQTL for general agronomic value was found that explained 27.1% of the total phenotypicvariation and was co-localised with a QTL for early flowering and trunk diameter. Pleiotropicand epistatic effects were both detected for these traits. QTL for technological traits such as theweight of 100 cocoa beans were found on the genetic map at different locations to the QTL foragronomic traits suggesting that these traits could be selected independently. The majority ofthe QTL for agronomic and technological traits are favoured by the alleles coming from theVenezuelan parent. Sensory evaluation was initiated on the segregating progeny in order toevaluate the range of variation and the main components of Arriba flavour.
Introduction
In order to select for Arriba flavour it is important to accumulate knowledge on thegenetic components involved in agronomic, technological and sensory characteristics.Even if the technological and sensory traits are the most important from themanufacturer’s point of view, agronomic traits must be taken into account for theselection of elite Arriba clones.
Field and sensory data on one hand and molecular analyses (Lerceteau et al. 1997)on the other hand indicated that the Nacional cocoa types are at the origin of the Arribaflavour. However, their resistance to disease and yield performance are unsatisfactory.Consequently, breeders have introduced accessions from Venezuela and Trinidad tocreate hybrids with the Nacional type in order to increase productivity. Today thesehybrids are predominant in Ecuador but the qualitative aspect of the Arriba flavour hasnot been taken into consideration in such selection programmes.
Recent developments in bean sample fermentation on a small scale coupled tosensory analysis have supported the observation that flavour potential is a heritablefunction of the genotype (Lockwood and Eskes 1995). So far, commercial fine flavourcocoas have only been found in Nacional, true Criollos and in some Trinitariogenotypes that are often poor yielding and susceptible to diseases. The inheritance offlavour was investigated by Clapperton et al. (1994) who found flavour components tobe significantly heritable indicating that sensory traits can be manipulated in aconventional breeding programme.
The main objectives of this study are to estimate the genetic influence on Arribaflavour in conjunction with agronomic traits in a supposed hybrid (Nacional xVenezolano). QTL analysis could be used to assess the number of genes involved in
16 – 17 October 2000, Kota Kinabalu, Sabah, Malaysia 125
flavour determination and allow better management of the development of further eliteArriba clones.
Material and methods
Segregating populationAn individual cocoa tree, which was identified as a cross between Nacional andVenezolano Amarillo parents, was selected for its high Arriba flavour score and highheterozygosity level. This cocoa tree was selfed and an F2 progeny was obtainedconsisting of 171 individuals planted in 1995 at Nestlé, Quevedo (Ecuador).
Quantitative traits analysedThree characteristics were selected to estimate the agronomic value of the segregatingprogeny:• Trunk diameter was recorded from 1996 to 1999 and is considered a yield
predictor.• Number of days before flowering; this is important to estimate the precocity of
production for the future elite Arriba clones.The general agronomic value, scored on a scale from 1 (bad) to 10 (excellent) for
each segregating tree. This trait shows significant correlation with the two otheragronomic traits previously studied. In addition, the number of beans per 100 gramswas studied in 1997, 1999 and 2000. Sensory analysis has been initiated on sub-samples of the segregating progeny in order to estimate the range of variation forArriba flavour.
Molecular markers, genetic mapping and QTL detectionA total of 113 loci (78 RFLP markers and 35 microsatellites) were used. The RFLPprobes named gTcCIR or cTcCIR and the microsatellites mTcCIR were kindly providedby CIRAD (France). The cocoa genetic map consisting of 113 loci was constructedusing the software package MAPMAKER 2.0 (Lander et al. 1987). QTL mapping wascarried out using the approach of ANOVA with the software QGENE 2.24 (Nelson1997). A p <0.01 value was used as the threshold for the QTL detection. The methodof interval mapping (Lander and Botsein 1989) with MAPMAKER/QTL software wasalso used with a LOD score of 2. The code number of each linkage group was givenas described by Lanaud et al. (1995).
Results
Genetic map and Nacional allele identificationThe genetic map obtained from the F2 population type comprised 113 loci covering 815cM on ten linkage groups (Figure 1). The average distance between two adjacentmarkers is 8.4 cM. This marker density is sufficient for the QTL study.
Skewed segregation was detected for seven loci (6.2%), five being significant at athreshold of p = 0.05 and two at p = 0.01. They are located on linkage groups 1, 2, 3, 6and 7, five of them are situated in the distal part of the linkage group (Figure 1).Generally at these seven loci the Venezolano Amarillo allele predominates.
Due to the genetic status of the parental F1 clone (Nacional X Venezolano Amarillo)and due to the genetic specificity of Nacional clones (Crouzillat et al. 2000), it waspossible to assess Nacional alleles on 50 of the 113 loci mapped. For all these locicovering the ten linkage groups, the Nacional alleles were always in the same couplingphase suggesting that the Nacional parent was highly homozygous. This allelicidentification allowed the determination of the genetic effect for each QTL analysed.
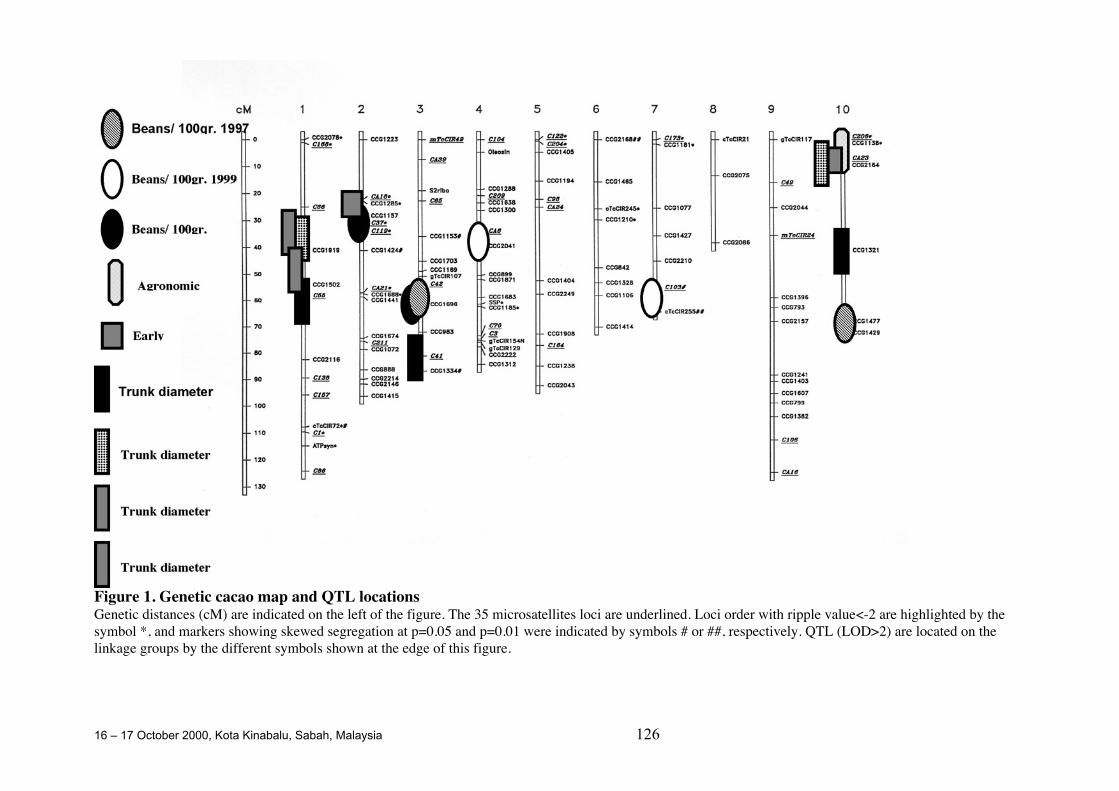
16 – 17 October 2000, Kota Kinabalu, Sabah, Malaysia 126
Figure 1. Genetic cacao map and QTL locationsGenetic distances (cM) are indicated on the left of the figure. The 35 microsatellites loci are underlined. Loci order with ripple value<-2 are highlighted by thesymbol *, and markers showing skewed segregation at p=0.05 and p=0.01 were indicated by symbols # or ##, respectively. QTL (LOD>2) are located on thelinkage groups by the different symbols shown at the edge of this figure.
16 – 17 October 2000, Kota Kinabalu, Sabah, Malaysia 127
QTL studyThe objective of the QTL analysis was to study the agronomic and technological traitsof interest. Analysis of trunk diameter, assessed annually between 1996 and 1999,allowed the detection of three QTL for 1996, two for 1997 and one QTL for 1998 and1999 (Table 1). The QTL located on chromosome 1 was found for all four years andthe other three QTL detected on linkage groups 3 and 10 only once. The two QTLdetected on chromosome 10 in 1996 and 1997 are not considered as the samebecause their map locations and their genetic effects are different. The QTL detectedon the linkage group 3 in 1996 appeared to be related to the Nacional allele whichappears to be favourable for this trait (Table 1). These results indicate that only theQTL on chromosome 1 detected in each of the four years studied has a significant anddurable effect on trunk diameter. Two QTL for early flowering were detected on linkagegroups 2 and 10 and each explained 6.6 and 6%, respectively, of the phenotypicvariance.
One major QTL was found for general agronomic value on linkage group 10,explaining 27.1% of the phenotypic variance. In this case, the favourable allele comesfrom the Venezolano parent. This QTL appears to be the major component of theagronomic value for this cross. It is significantly correlated with early flowering (r =0.28, p<0.01) and trunk diameter assessed in 1997 (r = 0.64) explaining theoverlapping of these three QTL on chromosome 10.
One technological trait, the number of beans per 100 g, was analysed in 1997, 1999and 2000. Two QTL for this trait were detected each year. These QTL were atdifferent map locations, except for a shared QTL detected on chromosome 3 for 1997and 2000 as shown in Table 2. These five different QTL do not overlap with otheragronomic QTL and the Venezolano alleles were generally found to be favourable forthis trait.
Pleiotropic and epistatic effectsThe map location coincidence of QTL for early flowering, trunk diameter in 1997 andgeneral agronomic value on chromosome 10 could be considered as pleiotropy sincethe Venezolano allele is found to be favourable for the three traits and because thesame genetic effect (dominance) was detected (Table 1).
An epistatic effect was found for the QTL detected on chromosome 10 for generalagronomic value. The ANOVA study indicated that the region near the locus CCG1328 on chromosome 6 (Figure 1) has a highly significant (p=0.000005) impact on theQTL detected on chromosome 10. The favourable alleles are coming from theVenezolano parent for these two loci (Table 3), indicating the influence of the geneticbackground on QTL expression.
Discussion
Field performance, including disease resistance and yield, is the major trait of interestto cocoa farmers and breeders. As 90% of the world’s cocoa is produced bysmallholders and trade is by country of origin and bean weight, most individual growershave, however, only a limited opportunity to add value through quality.
Cocoa trees are faced with a wide spectrum of climatic conditions during theirlifetime. Modifications in QTL expression over diverse environments have beenreported in crop plants (Paterson et al. 1991; Hayes et al. 1993). More recently QTLanalyses were performed on fruit trees (Asins et al. 1994) and on forest trees such aspoplar (Bradshaw and Stettler 1995), pine (Plomion et al. 1996) and Eucalyptus(Verhaegen et al. 1997) indicating an influence of environmental effects on the stabilityof QTL expression. In our study, according to the year analysed, several different QTLwere found for trunk diameter and average bean weight. These data suggest apossible influence of environment on QTL expression. Nevertheless, a cocoa yield
16 – 17 October 2000, Kota Kinabalu, Sabah, Malaysia 128
study over 15 years (Crouzillat et al. 2000) permitted the identification of some majorQTL, consistently detected over the years, that could be useful in a breedingprogramme. With regard to the present data, the QTL detected on chromosome 10 forgeneral agronomic performance appears to be a major component of this trait.
The average bean weight is considered to be partly under the influence of theenvironment (Toxopeus and Wessel 1970). Diallel crosses in Costa Rica (Engels1985) and factorial mating designs (Tan 1990; Lockwood and Pang 1995) havedemonstrated high broad sense heritability of bean weight and a large additivecomponent of the genotypic variance. The data obtained on this trait in our studydemonstrated that only one common QTL was found for two of the three years studied.Consequently, further confirmation of these QTL is required before possible use inselection.
In parallel to these agronomic and technological analyses, the sensory evaluation ofthis segregating population has started. A detailed protocol has been described frombean harvest to liquor tasting using single tree sampling (Bucheli et al. 2000). The firstsensory data obtained indicate that a range of variability for Arriba flavour exists.Further quantitative studies are necessary to estimate the role of environmental factors,the fermentation process and sensory evaluation on the determination of Arriba flavour.
References
Asins M.J., P. Mestre, J.E. Garcia, F. Dicenta and E.A. Carbonell. 1994. Genotype xenvironment interaction in QTL analysis of an inter-varietal almond cross by means ofgenetic markers. Theoret. Appl. Genet. 89: 358-364.
Bradshaw H.D. and R.F. Stettler. 1995. Molecular genetics of growth and development inPopulus. IV. Mapping QTLs with large effects on growth, form and phenology traits in aforest tree. Genetics 139: 963-973.
Bucheli P., M. Rigoreau, L. Bellanger, M. Alvarez, J. Sanchez, L. Cirou, V. Pétiard andD. Crouzillat. 2000. In press. Strategy for assessing cocoa flavour of a large number ofsamples for selection and breeding. In Proceedings of the 13th International CocoaResearch Conference, Kota Kinabalu, Malaysia, October 9-14, 2000.
Clapperton J., S.T.K. Yow, D.H.K. Lim and G. Lockwood. 1994. Genetic variation in cocoaflavour. Pages 749-758 in Proceedings of the 11th International Cocoa ResearchConference, Yamoussoukro, Côte d’Ivoire, July 18-24, 1993.
Crouzillat D., B. Ménard B., A. Mora, W. Phillips and V. Pétiard. 2000. Quantitative trait analysisin Theobroma cacao using molecular markers. Yield QTL detection and stability over 15years. Euphytica 114: 13-23.
Crouzillat D., L. Bellanger, M. Rigoreau, P. Bucheli and V. Pétiard. 2000. In press. Geneticstructure, characterization and selection of Nacional cacao. In Proceedings of the INGENICWorkshop, Kota Kinabalu, Malaysia, October 16-17, 2000.
Engels J.M.M. 1985. A systematic description of cacao clones. V. Quantitative genetic aspectsof several fruit characteristics. Café Cacao Thé 29: 3-10.
Hayes P.M., B.H. Liu, S.J. Knapp, F. Chen, B. Jones, T. Blake, J. Franckowiak, D. Rasmusson,M. Sorrels, S.E. Ullrich, D. Wesenberg and A. Kleinhofs. 1993. Quantitative trait locuseffects and environmental interaction in a sample of North American barley germplasm.Theoret. Appl. Genet. 87: 392-401.
Lanaud C., A.M. Risterucci, J. N’Goran, D. Clément, M. Flament, V. Laurent and M. Falque.1995. A genetic linkage map of Theobroma cacao L. Theoret. Appl. Genet. 91: 987-993.
Lander E., P. Green, J. Abrahamson, A. Barlow, M. Daly, S. Lincoln and L. Newburg. 1987.MAPMAKER: an interactive computer package for constructing primary genetic linkagemaps of experimental and natural populations. Genomics 1: 174-181.
Lander E. and D. Botstein. 1989. Mapping Mendelian factors underlying quantitative traits usingRFLP linkage maps. Genetics 121: 185-199.
Lerceteau E., J. Quiroz, J. Soria, S. Flipo, V. Pétiard and D. Crouzillat. 1997. Geneticdifferentiation among Ecuadorian Theobroma cacao L. accessions using DNA andmorphological analyses. Euphytica 95: 77-87.
16 – 17 October 2000, Kota Kinabalu, Sabah, Malaysia 129
Lockwood G. and J. T.Y. Pang. 1995. Cocoa breeding at BAL plantation. Genetic analysis andits implications for breeding strategy. Pages 66-80 in Proceedings of the InternationalWorkshop on Cocoa Breeding Strategies, Kuala Lumpur, October 18-19, 1994. INGENIC,United Kingdom.
Lockwood G. and A.B. Eskes. 1995. Relationship between cocoa variety and quality. Pages159-167 in Cocoa meetings. The various aspects of quality. Montpellier, France, June 30,1995. CIRAD, France.
Nelson J. C. 1997. QGENE: software for marker-based genomic analysis and breeding.Molecular Breeding 3: 239-245.
Paterson A.H., S. Damon, J.D. Hewitt, D. Zamir, H.D. Rabinowitch, S.E. Lincoln, E.S. Lander.and S.D. Tanksley. 1991. Mendelian factors underlying quantitative traits in tomato:comparison across species, generations and environments. Genetics 127: 181-197.
Plomion C., C-E.Durel and D. O’Malley. 1996. Genetic dissection of height in maritime pineseedlings raised under accelerated growth condition. Theoret. Appl. Genet. 93: 849-858.
Tan G.Y. 1990. Combining ability analysis of yield and its components in cacao. Journal of theAmerican Society of Horticultural Science 115: 509-512.
Toxopeus H. and M. Wessel. 1970. Studies on pod and bean values of Theobroma cacao L. inNigeria. 1. Environmental effects on West African Amelonado with particular attention toannual rainfall distribution. Netherlands Journal of Agricultural Science 18: 132-139.
Verhaegen D., C. Plomion, J.M. Gion, M. Poitel, P. Costa and A. Kremer. 1997. Quantitativetrait dissection analysis in Eucalyptus using RAPD markers: 1. Detection of QTL ininterspecific hybrid progeny, stability of QTL expression across different ages. Theoret.Appl. Genet. 95: 597-608.
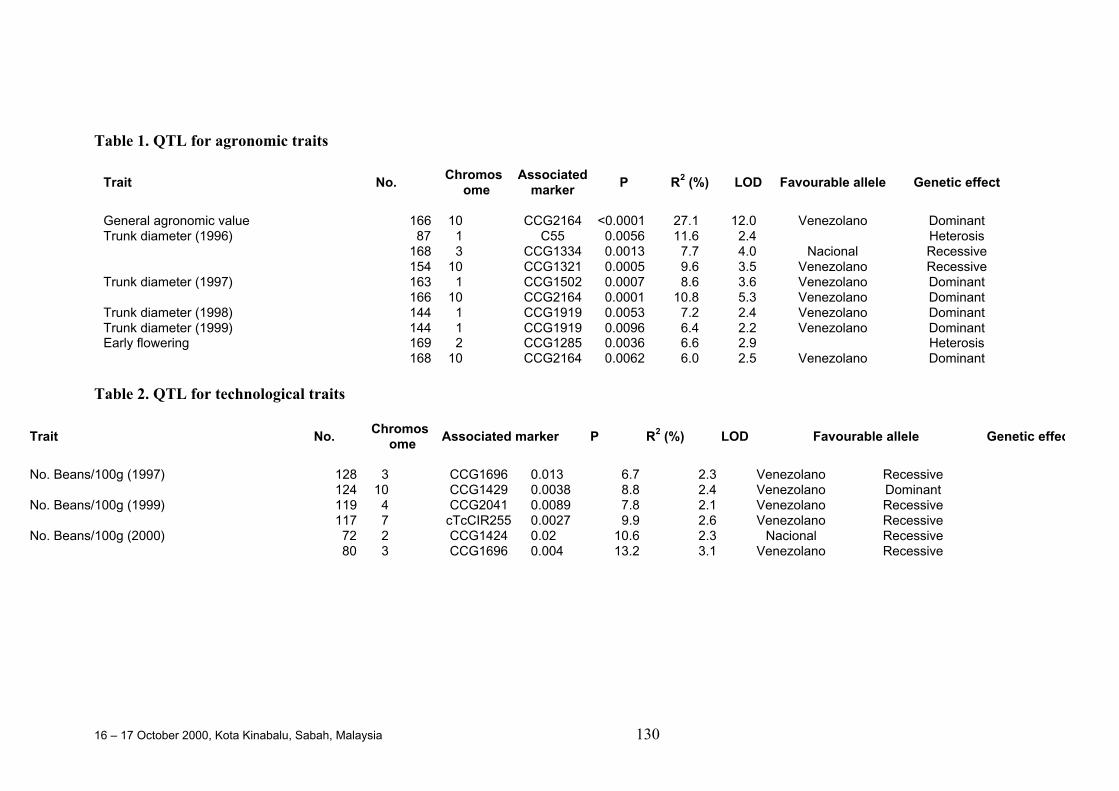
16 – 17 October 2000, Kota Kinabalu, Sabah, Malaysia 130
Table 1. QTL for agronomic traits
Trait No.Chromos
omeAssociated
markerP R2 (%) LOD Favourable allele Genetic effect
General agronomic value 166 10 CCG2164 <0.0001 27.1 12.0 Venezolano DominantTrunk diameter (1996) 87 1 C55 0.0056 11.6 2.4 Heterosis
168 3 CCG1334 0.0013 7.7 4.0 Nacional Recessive154 10 CCG1321 0.0005 9.6 3.5 Venezolano Recessive
Trunk diameter (1997) 163 1 CCG1502 0.0007 8.6 3.6 Venezolano Dominant166 10 CCG2164 0.0001 10.8 5.3 Venezolano Dominant
Trunk diameter (1998) 144 1 CCG1919 0.0053 7.2 2.4 Venezolano DominantTrunk diameter (1999) 144 1 CCG1919 0.0096 6.4 2.2 Venezolano DominantEarly flowering 169 2 CCG1285 0.0036 6.6 2.9 Heterosis
168 10 CCG2164 0.0062 6.0 2.5 Venezolano Dominant
Table 2. QTL for technological traits
Trait No.Chromos
omeAssociated marker P R2 (%) LOD Favourable allele Genetic effect
128 3 CCG1696 0.013 6.7 2.3 Venezolano RecessiveNo. Beans/100g (1997)124 10 CCG1429 0.0038 8.8 2.4 Venezolano Dominant119 4 CCG2041 0.0089 7.8 2.1 Venezolano Recessive117 7 cTcCIR255 0.0027 9.9 2.6 Venezolano Recessive72 2 CCG1424 0.02 10.6 2.3 Nacional Recessive
No. Beans/100g (1999)
No. Beans/100g (2000)80 3 CCG1696 0.004 13.2 3.1 Venezolano Recessive
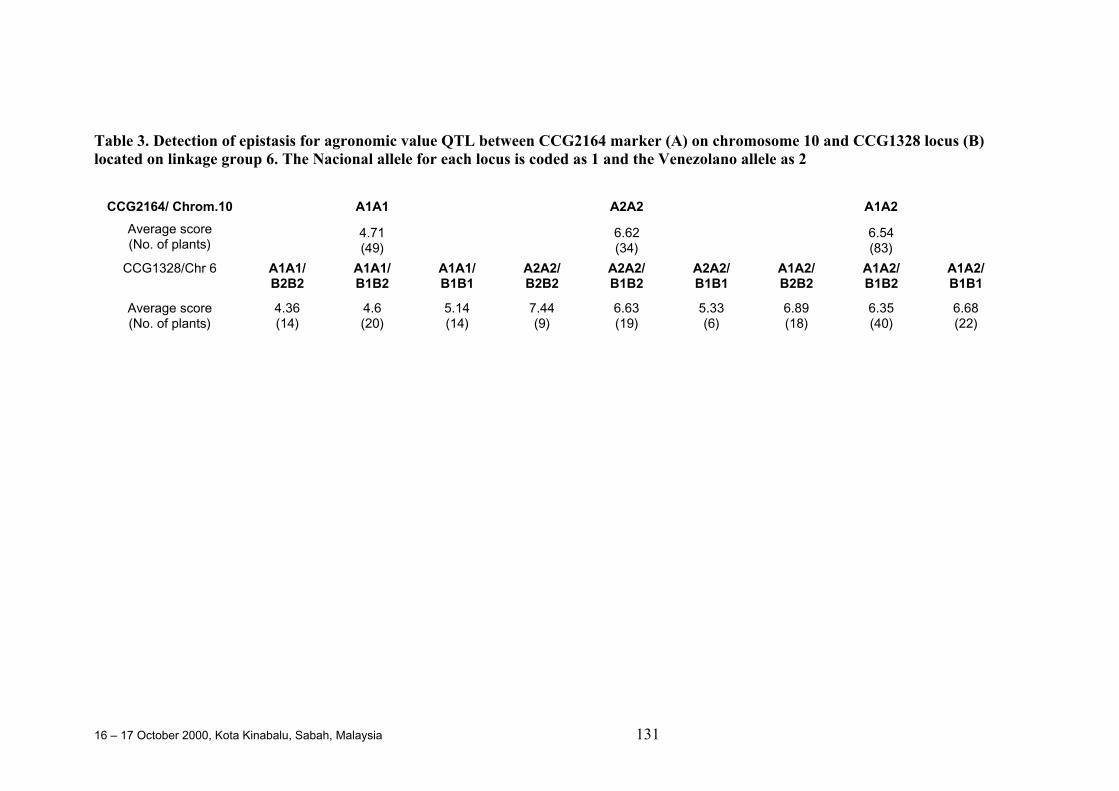
16 – 17 October 2000, Kota Kinabalu, Sabah, Malaysia 131
Table 3. Detection of epistasis for agronomic value QTL between CCG2164 marker (A) on chromosome 10 and CCG1328 locus (B)located on linkage group 6. The Nacional allele for each locus is coded as 1 and the Venezolano allele as 2
CCG2164/ Chrom.10 A1A1 A2A2 A1A2
Average score(No. of plants)
4.71(49)
6.62(34)
6.54(83)
CCG1328/Chr 6 A1A1/B2B2
A1A1/B1B2
A1A1/B1B1
A2A2/B2B2
A2A2/B1B2
A2A2/B1B1
A1A2/B2B2
A1A2/B1B2
A1A2/B1B1
Average score(No. of plants)
4.36(14)
4.6(20)
5.14(14)
7.44(9)
6.63(19)
5.33(6)
6.89(18)
6.35(40)
6.68(22)
16 – 17 October 2000, Kota Kinabalu, Sabah, Malaysia 132
Analysis of QTL Studies Related to Yield and Vigour TraitsCarried out With Different Cocoa Genotypes
Didier Clément1, Ange-Marie Risterucci2 and Claire Lanaud2
1 - Cirad-Cp, TA 80/02, Avenue Agropolis, 34398 Montpellier Cedex 5, France2 - Cirad-Amis, TA 40/03, Avenue Agropolis, 34398 Montpellier Cedex 5, France
Abstract
Theobroma cacao is mainly cultivated by small growers, especially in the main production areain West Africa. The sustainability of cocoa cultivation will be improved if farmers have access tonew planting material with improved agronomic traits such as yield, vigour, pest, and diseaseresistance. Progress in breeding programmes to accumulate favourable alleles for these traitscan be accelerated using molecular marker techniques which allow more direct access to thegenome. The technology has developed rapidly and over the last ten years studies have beencarried out to map QTLs for agronomic traits in several plant species. In cocoa, a number ofprogenies have been mapped and several QTL related to resistance to Phytophthora spp. andto yield components have been detected. The comparison of the different linkage maps ofcocoa is possible through specific markers (RFLP and microsatellites) mapped on to areference map containing 473 markers. The purpose of this paper is to analyse available resultson the detection of QTL for yield and vigour traits and the co-location of the QTL identified indifferent parental genotypes. Methodological approaches to the detection of QTL are alsopresented. Perspectives for further research on mapping of yield and vigour traits and thepossible use of molecular markers in the selection for these traits in cocoa are discussed.
Introduction
Most cocoa is produced by small holders who cultivate the trees in addition to foodcrops for family consumption. The income they gain from cocoa is often saved tosupport them in later life. Africa supplies nearly 70% of the world’s production of cocoawith Côte d'Ivoire as the principal producer. Improved planting material, better adaptedto the local environment, and disease conditions, can be produced through breedingprogrammes designed to accumulate favourable alleles for the main agronomic traits.In cocoa, the selection cycle normally requires 6 to 8 years of observations. Thereforethe development of effective early screening methods to accelerate progress is of greatinterest. Cocoa breeders are also investigating the use of successive cycles ofselection, for example a recurrent selection program has been initiated in Côte d'Ivoireto improve lower Amazon Forastero and upper Amazon Forastero populations bysuccessive cycles of selection inside each population (Clément et al. 1994; Eskes et al.1995).
Recent progress in molecular marker technology now allows more direct access tothe genotype and the use of molecular markers in the genetic mapping of the mainagronomic traits has been considerably developed in recent years. A new field ofresearch in cocoa breeding has opened. The first cocoa linkage map was presented byLanaud et al. (1995) from a progeny resulting from the Côte d'Ivoire cocoa breedingprogramme and a high density linkage map was established recently by Risterucci etal. (2000). Genetic mapping of agronomic traits (disease resistance and yieldcomponents) was carried out with this reference progeny by Lanaud et al. (1999) andwith other progenies by Flament et al. (2000), by Crouzillat et al. (1996, 2000) and byClément et al. (2000).
In the present paper we report the main results of studies to detect QTL related toyield components, to attack by black pod disease and to vigour traits. Furthermore,
16 – 17 October 2000, Kota Kinabalu, Sabah, Malaysia 133
comparisons with results from other studies are made and perspectives for the use ofmolecular markers in cocoa selection programmes discussed.
Material and methods
Plant materialThe progenies used for the QTL studies compared in this paper and the references ofthe publications related to these studies are presented in Table 1. Pound 12, IMC 78,T 60/887, and UPA 402 are Upper Amazon Forastero genotypes. Pound 12 andIMC 78 are genotypes collected by Pound (1938, 1943), UPA 402 is a result of sib-crossing between two genotypes of the T 87 progeny (NA 34 x IMC 60), and T 60/887is a progeny of PA 7 x NA 32. UF 676, DR 1, and S 52 are Trinitario clones. IFC 1 andIFC 5 are Lower Amazon Forastero selections from Côte d’Ivoire; IFC 5 has probablyreceived some introgression of genes from African Trinitario. Catongo is a highlyhomozygous Lower Amazon Forastero selected in the Bahia State in Brazil. Thenumber of trees observed in each progeny varied between 55 and 181.
Table 1. Cocoa progenies used in QTL studies for agronomic traits
Progenies CountriesNumber of
treesReferences
UPA402 x UF676 Côte d'Ivoire 181 Lanaud et al. (1995)Risterucci et al. (2000)
Catongo x Pound12 Costa Rica 55 Crouzillat et al. (1999)T60/887 x (IFC5 IFC1) Côte d'Ivoire 112 Flament et al. (2000)DR1 x Catongo Côte d'Ivoire 107 Clément et al. (2000)S52 x Catongo Côte d'Ivoire 101 Clément et al. (2000)IMC78 x Catongo Côte d'Ivoire 128 Clément et al. (2000)
Quantitative traitsYield and vigour data were obtained over several years during the juvenile productionphase (first seven years of production), during the mature phase or during both phases(Table 2). The following traits were analysed in the different studies:Yield (mean wet bean weight per tree);The average weight of one pod or the pod index (these two traits are similar);Vigour observed on all adult trees (trunk diameter-TD-, trunk circumference-TC-, orcanopy width-CW). Early vigour was measured only for the DR 1, S 52, and IMC 78progenies two years after the planting (stem diameter-SD).
Mapping analysis and QTL detectionA total of 473 markers were used for the genetic mapping of UPA 402 x UF 676,currently the most saturated map of the cocoa genome. RFLP probes andmicrosatellites were used as co-dominant markers and AFLP and RAPD as dominantmarkers. Genetic maps built from progenies with heterozygous parents (double pseudotest cross) such as UPA 402 x UF 676, were made generally using Joinmap version1.4 (Stam 1993). A genetic map of Catongo x Pound 12 (Crouzillat et al. 1996) wasestablished with MAPMAKER (Lander et al. 1987). For all these maps, the Kosambimapping function was used.
RFLP and microsatellite markers allowed linkage groups to be identified withindividual chromosomes in UPA 402 x UF 676 (Lanaud et al. 1995). However thegenetic map of Catongo x Pound 12, established by Crouzillat et al. (1996), uses adifferent chromosome numbering system to that established by Lanaud et al. (1995).Exchanges of RFLP and microsatellite markers has allowed the correspondence
16 – 17 October 2000, Kota Kinabalu, Sabah, Malaysia 134
between the two chromosome numbering systems to be established and thiscorrespondence is shown in Table 3. In this present study, the UPA 402 x UF 676 mapwas used as consensus map for locating the QTL identified in the different parentalgenotypes.
Table 2. Yield and vigour traits observed in the different studies
Juvenile phase Mature phase
Yield UPA402 x UF676 4 years -Pound12 7 years 8 yearsT60/887 2 yearsDR1 - 9 yearsS52 - 9 yearsIMC78 - 9 years
Vigour UPA402 x UF676 - TCPound12 - TC and CWT60/887 - TC and CWDR1 SD TC and CWS52 SD TC and CWIMC78 SD
SD: stem diameterTC: trunk circumferenceCW: canopy width
QTL mapping was carried out using the Simple Interval Mapping (SIM) techniqueproposed by Lander and Botstein (1989). Composite Interval Mapping (CIM),developed by Zeng (1994), was applied only for QTL identified in the DR 1, S 52, andIMC 78 parents (Clément et al. 2000). A LOD threshold value of 2 was generallyapplied to declare that a specific QTL was significant. In the study of Clément et al.(2000) the LOD threshold values were fixed by the Churchill and Doerge method(1994).
Table 3. Correspondences between UPA402 x UF676 and Catongo x Pound12maps
UPA402 x UF676 (1) Catongo x P12 (2)
Chromosome 1 Chromosome 3Chromosome 2 Chromosome 4Chromosome 3 Chromosome 6Chromosome 4 Chromosome 5Chromosome 5 Chromosome 9Chromosome 6 Chromosome 7Chromosome 7 Chromosome 1Chromosome 8 Chromosome 8Chromosome 9 Chromosome 2Chromosome 10 Chromosome 10
(1) Lanaud et al. 1995(2) Crouzillat et al. 1996
Comparison of results
16 – 17 October 2000, Kota Kinabalu, Sabah, Malaysia 135
Phenotypic correlationA strong significant correlation between yield and vigour for adult trees was found inthe different studies (Table 4). This is to be expected since competition will have had itseffect by the time the trees reach this adult stage. Except for the S 52 x Catongoprogeny, the correlation between yield and vigour at a young age was not significant. Ingeneral, early vigour is more significantly correlated with the first years of productionthan with production in later years (Eskes et al. 1995).
Table 4. Phenotypic correlation between yield and vigour traits
VigourParents Stem diameter Trunk circumference Canopy width
DR1 NS 0.71*** 0.47**S52 0.38** 0.79** 0.42**IMC78 NS 0.66** 0.48**Pound12
Yie
ld
(no data) 0.56*** (no data)
Pearson coefficient correlation: significant at p<0.01 ** and p<0.001***
Genetic mapsFor crosses with Catongo (highly homozygous), the markers reflect only theheterozygosity of the parents: Pound 12, DR 1, S 52, and IMC 78. This is also broadlythe case with T 60/887, IFC 1, and IFC 5 which are all fairly homozygous. For theUPA 402 x UF 676 map, the marker segregation mainly reflects the high level ofheterozygosity of UF 676. The characteristics of each of the maps are shown inTable 5.
Table 5. Genetic maps characteristics
Number ofmarkers
LG Map length in cMAverage distance
between 2 markers
UPA402 x UF676 473 10 887 1.9Pound12 158 10 772 4.8T60/887 184 11 793 4.3DR1 192 9 653 3.4S52 138 11 589 4.8IMC78 x 223 10 721 3.2
QTL detectionSIM and CIM analyses were carried out for QTL detection with DR 1, S 52, and IMC 78(Clément et al. 2000). In the other studies, QTL analyses were carried out using SIMonly. The comparison of results obtained using SIM and CIM showed differences inpower (LOD score of the peak) and efficiency (estimation of the R_). In some cases thepercentage of the phenotypic variation explained by the QTL (R_ values) estimated inCIM analyses were higher than those obtained using SIM, but lower in others (Clémentet al. 2000).
QTL related to yield, average weight of one pod and vigour traitsThe most significant QTL for yield, average weight of one pod and vigour traits weremainly detected on chromosomes 1, 4, and 5 in the different heterozygous parents.
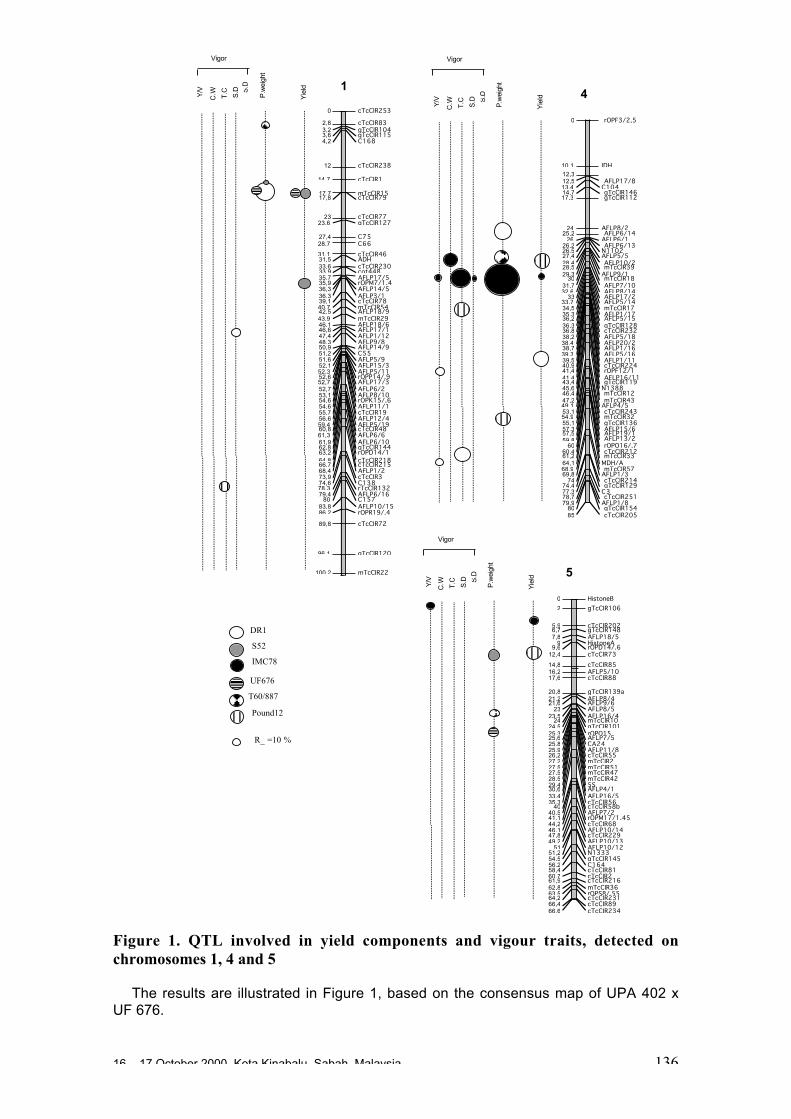
16 – 17 October 2000, Kota Kinabalu, Sabah, Malaysia 136
Figure 1. QTL involved in yield components and vigour traits, detected onchromosomes 1, 4 and 5
The results are illustrated in Figure 1, based on the consensus map of UPA 402 xUF 676.
cTcCIR253
cTcCIR83gTcCIR104gTcCIR115
cTcCIR238
mTcCIR15cTcCIR79
cTcCIR77gTcCIR127
cTcCIR46
AFLP17/5rOPM7/1.4AFLP14/5
cTcCIR78mTcCIR54AFLP18/9mTcCIR29AFLP18/6AFLP17/1AFLP1/12
AFLP14/9
AFLP15/3AFLP5/11rOPP14/.9AFLP17/3
AFLP8/10rOPK15/,6AFLP11/1cTcCIR19AFLP12/4AFLP5/19cTcCIR48
AFLP6/10gTcCIR144rOPD14/1cTcCIR218cTcCIR215
rTcCIR132AFLP6/16
AFLP10/15rOPR19/.4
cTcCIR72
gTcCIR120
1
0
2,83,23,64,2 C168
12
14,7 cTcCIR1
17,717,8
2323,6
27,4 C7528,7 C6631,131,5 ADH33,633,9 cot44835,735,936,336,3 AFLP3/139,140,742,543,946,146,647,448,3 AFLP9/850,951,2 C5551,6 AFLP5/952,152,352,652,752,7 AFLP6/253,154,654,655,756,659,460,861,3 AFLP6/661,962,863,264,866,768,4 AFLP1/273,9 cTcCIR374,6 C13878,379,4
80 C15783,886,2
89,8
96,1
100,2 mTcCIR22
cTcCIR230
S.D
T.C
C.W
S.D
Y/V
Yie
ld
P.w
eigh
t
Vigor
rOPF3/2,5
gTcCIR146gTcCIR112
gTcCIR128cTcCIR232
cTcCIR224
AFLP16/11gTcCIR119
cTcCIR243
gTcCIR136
rOPO16/.7cTcCIR212
cTcCIR214gTcCIR129
cTcCIR251
gTcCIR154cTcCIR205
AFLP17/8
AFLP6/14
AFLP6/13
AFLP10/2mTcCIR39
mTcCIR18AFLP7/10AFLP8/14AFLP17/2AFLP5/14mTcCIR17AFLP1/17AFLP5/15
AFLP5/18AFLP20/2AFLP1/16AFLP5/16AFLP1/11rOPF12/1
mTcCIR12mTcCIR43
mTcCIR32
AFLP15/6AFLP19/1AFLP13/2
mTcCIR33
mTcCIR57
0
10,1
12,312,513,414,717,3
2425,2
2626,226,527,428,428,529,3
3031,732,6
3333,734,535,336,236,336,838,238,438,739,339,540,941,441,443,445,646,447,249,153,154,955,157,357,559,8
6060,461,264,168,969,8
7474,477,378,779,9
8085
4
IDH
C104
AFLP8/2
AFLP6/1
N1102AFLP5/5
AFLP9/1
N1388
AFLP4/5
MDH/A
AFLP1/3
C3
AFLP1/8
S.D
T.C
C.W
S.D
Y/V
Vigor
Yie
ld
P.w
eigh
t
gTcCIR106
cTcCIR202gTcCIR148
rOPD14/.6
gTcCIR139a
gTcCIR101
cTcCIR58b
rOPM17/1.45
AFLP10/14cTcCIR229AFLP10/13AFLP10/12
gTcCIR145
cTcCIR216
rOPS8/.55cTcCIR231
0
2
5,96,77,8
99,6
12,4
14,816,217,6
20,821,221,6
2323,5
2424,525,325,625,825,926,227,227,527,528,529,430,633,435,3
4040,541,144,246,147,849,2
5151,254,556,258,460,761,962,863,564,266,466,6
5
HistoneB
AFLP18/5HistoneA
cTcCIR73cTcCIR85AFLP5/10cTcCIR88
AFLP8/4AFLP9/6AFLP8/5AFLP16/4mTcCIR10
rOPO15AFLP7/5CA24AFLP11/8cTcCIR55mTcCIR2mTcCIR51mTcCIR47mTcCIR425SAFLP4/1AFLP16/5cTcCIR56AFLP7/2
cTcCIR68
N1333
C164cTcCIR81cTcCIR2
mTcCIR36
cTcCIR89cTcCIR234
S.D
T.C
C.W
S.D
Y/V
VigorY
ield
P.w
eigh
t
T60/887
R_ =10 %
DR1
S52
IMC78
UF676
Pound12
16 – 17 October 2000, Kota Kinabalu, Sabah, Malaysia 137
QTL related to yield were detected in the same region of chromosome 1 (aroundmTcCIR15) for two Trinitario genotypes (UF 676 and S 52). QTL related to yield for twoUpper Amazon Forastero genotypes (POUND 12 and IMC 78) were also identified inthe same regions, but of chromosomes 4 and 5.
QTL related to the average weight of one pod have been identified in the sameregion as QTL for yield (Figure 1). In the case of chromosome 4, QTL related to theaverage weight of one pod were detected in the same region for T 60/887 and IMC 78.A QTL was detected close to this region in DR 1. The QTL located in IMC 78 explained43.5% of the phenotypic variation; it might therefore involve a major gene (Clément etal. 2000).
On chromosome 4; several QTL for yield components and vigour traits weredetected in the same region (Figure 1)
Discussion
MethodsGenetic mapping of yield, its components and other agronomic traits must be carriedout using data gathered from field trials over several years. Most of the progeniesanalysed were planted in existing hybrid variety trials. This implies that, in most cases,the statistical analysis has been carried out using data from less than 100 trees. It isconsidered now that QTL analyses require observations on progenies with at least 200individuals.
QTL studies based on the analysis of several progenies sharing common parentalgenotypes require fewer individuals for each progeny. This method is interestingbecause it allows the stability of the QTL in different genetic backgrounds to beestimated. Simulation studies on poplar showed that better results could be expectedusing progenies with common parents (e.g. factorial mating designs) than usingunrelated progenies (Muranty et al. 1996).
Different chromosome numbering systems are currently being used in the twogenetic maps of cocoa. It is suggested that the numbering system established for theUPA 402 x UF 676 progeny should be universally adopted (Risterucci et al. 2000).
Microsatellite markers reveal a higher level of polymorphism than RFLP markers(Risterucci et al. 2000; Clément et al. 2000). They also require less DNA and some ofthe analyses can be automated. The microsatellite technology appears to be currentlythe most appropriate method for genetic mapping and QTL analyses in cocoa. Indeed,microsatellite markers allow easy identification of the linkage groups and comparison ofmaps from different progenies. They have also been used in genetic diversity studiesand to confirm the identity of clones and seedling progeny. Moreover, microsatellitemarker technology will be easily transferable to laboratories in tropical countries (sincethe technique does not involve the use of radioactivity) and applied to Marked AssistedSelection (MAS).
The Simple Interval Mapping (SIM) technique proposed by Lander and Botstein(1989) has been the detection method generally used for the detection of QTL incocoa. However, the Composite Interval Mapping (CIM) approach increases detectionpower and improves the estimation of the phenotypic variation explained by the QTL.With CIM analyses, 5 to 10 markers, given by the forward, and backward regression(co-factors added to the model), are generally used. This method is being increasinglyapplied in QTL mapping analyses.
QTL identifiedGenetic diversity studies on the Trinitario group have shown that this group resultedfrom hybridisation between almost homozygous Criollo and Forastero individuals(Motamayor et al. 2000). In this situation, we can suppose that a linkage disequilibriumbetween molecular markers and agronomic traits may have been maintained. Indeed,
16 – 17 October 2000, Kota Kinabalu, Sabah, Malaysia 138
common QTLs related to yield components have been found in different Trinitarioclones (DR 1, S 52, and UF 676). This could mean that there is a good chance that theQTL identified in one Trinitario type will also apply to other Trinitario genotypes.
For the Pound 12 and IMC 78 progenies, yield was observed over several years inCosta Rica and Côte d’Ivoire, respectively. The co-localised QTL for yield of these twoForasteros were the ones which were also the most stable in time. This co-location ofQTLs between IMC 78 and POUND 12 could possibly also be due to the similargenetic origin of these genotypes. Indeed, according to Pound (1943), the genotypescollected on the Nanay river (as POUND 12) grew not far from the area where the IMC(Iquitos Mixed Calabacillo) trees were collected. Recent diversity studies on UpperAmazon Forastero genotypes showed that the genetic distance between Nanay (NA)and IMC clones was relatively low (Sounigo et al. 2000). Therefore, a genetic linkagedisequilibrium may have been maintained between markers and genes involved in yieldcomponents between IMC and NA genotypes.
The QTL for the average pod weight with the IMC 78 parent was detected onchromosome 4 and explained 43.5% of the phenotypic variation. Close to it, a QTLrelated to the same trait was identified in DR 1 (R_=22). Studies on the genetic controlof fruit traits (weight and size) have been carried out on other species such as tomato(Grandillo et al. 1999; Ku et al. 1999). An example is given by Ku et al. (1999) on thegenetic control of fruit length and the constriction at the stem end of the fruit. We cansuggest a similar situation concerning genes involved in the genetic control of pod form(weight, shape) in cocoa especially for the QTL located in the common region ofchromosome 4 of these two types. Research to establish a candidate gene for thisyield component could be envisaged.
Perspectives
Molecular markers have opened a new era of more efficient selection for quantitativetraits. In this study, QTLs involved in important traits for breeding were identified. Theco-localisation of some of them in progenies from parents belonging to the either thesame or different genetic groups confirms the stability of some of the QTL identified.This is a favourable situation to consider marker assisted selection (MAS).
MAS allows breeders to follow two main approaches. The first approach consists ofmonitoring the accumulation of favourable genes in one genotype in back-crossprogenies (Marked Assisted Back-Cross). The second allows for better assessment ofthe genotypic value of individuals from the marker genotype, allowing for MarkerAssisted Recurrent Selection (MARS). This second approach seems more appropriatefor the use of molecular markers in cocoa breeding programmes. Various applicationsof MARS were recently developed by Gallais et al. (2000).
The advantage of selection based only on markers is that the selection cycle can beconsiderably shortened. In order to use all sources of genetic variability from markedand unmarked QTLs it seems, however, better to use Marker Assisted Selection,combining molecular score and phenotypic value in an index, such as that defined byLande and Thompson (1990).
References
Clément D., A.B. Eskes, O. Sounigo and J.A.K. N'Goran. 1994. Amélioration génétique ducacaoyer en Côte d'Ivoire. Présentation d'un nouveau schéma de sélection. Pages 451-455in Proceedings of the11th International Cocoa Research Conference, July 18-24, 1993,Yamoussoukro, Ivory Coast. Cocoa Producer's Alliance, Lagos, Nigeria.
Clément D., A.M. Risterucci, L. Grivet, J-C. Motamayor, J.A.K. N'Goran and C. Lanaud. 2000.Cartographie génétique de caractères liés au rendement, à la vigueur, à la résistance à
16 – 17 October 2000, Kota Kinabalu, Sabah, Malaysia 139
P. palmivora et aux fèves, chez Theobroma cacao. In press in Proceedings of the 13th
International Cocoa Research Conference, October 9-14, Kota Kinabalu, Malaysia.Churchill G.A. and R.W. Doerge. 1994. Empirical threshold values for Quantitative Trait
Mapping. Genetics 8: 963-971.Crouzillat D., E. Lerceteau, V. Pétiard, J. Morena, H. Rodriguez, D. Walker, W. Phillips,
C. Ronning, R. Schnell, J. Osei and P. Fritz. 1996. Theobroma cacao L.: a genetic linkagemap and quantitative trait loci analysis. Theor. Appl. Genet. 93: 205-214.
Crouzillat D., B. Ménard, A. Mora, W. Phillips and V. Pétiard. 2000. Quantitative trait analysis inTheobroma cacao L. using molecular markers. Euphytica 114: 13-23.
Eskes A.B., D. Paulin, D. Clément, J.A.K. N'Goran, O. Sounigo, P. Lachenaud, C. Cilas,D. Berry and A. Yagmpam. 1995. Méthodes de sélection et connaissances acquises engénétique par les programmes d'amélioration du cacaoyer en Côte d'Ivoire et au Cameroun.Pages 41-56 in Proceedings of the International workshop on Cocoa Breeding Strategies.October 18-19, 1994, Kuala Lumpur, Malaysia. INGENIC, United Kingdom.
Flament M.H., I. Kébé, D. Clément, I. Pierretti, A.M. Risterucci, J.A.K. N'Goran, C. Cilas,D. Despréaux and C. Lanaud. 2000. Genetic mapping of resistance factors to Phytophthorapalmivora in cocoa. Génome. In press.
Gallais A., A. Charcosset, I. Goldringer, F. Hospital and L. Moreau. 2000. Progress andprospects for marker-assisted selection. Quantitative Genetics and Breeding Methods. InProceedings of the XIth Meeting of the Section Biometrics in Plant Breeding, August 30-September 01 2000, Paris, France. In press
Grandillo S., H.M. Ku and S.D. Tanksley. 1999. Identifying the loci responsible for naturalvariation in fruit size and shape in tomato. Theor. Appl. Genet. 99: 978-987.
Ku H-M., S. Doganlar, K.Y. Chen and S.D. Tanksley.1999. The genetic basis of pear-shapedtomato fruit. Theor. Appl. Genet. 9: 844-850.
Lanaud C., A.M. Risterucci, J.A.K. N'Goran, D. Clément, M. Flament, V. Laurent and M. Falque.1995. A genetic linkage map of Theobroma cacao L. Theor. Appl. Genet. 91: 987-993.
Lanaud C., I. Kébé I, A.M. Risterucci, D. Clément, J.A.K. N'Goran, L. Grivet, M. Tahi, C. Cilas,I. Pieretti, A.B. Eskes and D. Despréaux. 1999. Mapping quantitative trait loci (QTL) forresistance to Phytophthora palmivora in T. cacao L. Pages 99-105 in Proceedings of the 12th
International Cocoa Research Conference, November 17-23, 1996, Salvador, Bahia, BrazilLande R. and R. Thompson. 1990. Efficiency of marker-assisted selection in the improvement of
quantitative traits. Genetics 124: 743-756.Lander E., P. Green, J. Abrahamson, A. Barlow, M. Daly, S. Lincoln and L. Newburg. 1987.
Mapmaker: an interactive computer package for constructing primary genetic linkage mapsof experimental and natural populations. Genomics 1: 174-181.
Lander E.S. and D. Botstein. 1989. Mapping mendelian factors underlying quantitative traitsusing RFLP linkage maps. Genetics 121: 185-199.
Motamayor J.C., A.M. Risterucci and C. Lanaud. 2000. Cacao domestication II: progenitorgermplasm of most cultivated cacao until 1950. In press in Proceedings of the 13th
International Cocoa Research Conference, October 9-14, Kota Kinabalu, Malaysia.Muranty H. 1996. Power of tests for quantitative trait loci detection using full-sib families in
different schemes. Heredity, 76: 156-165.Pound F.J. 1943. Cocoa and witches' broom disease: report on a recent visit to the Amazon
territory of Peru. The archives of cocoa research, volume 1, (Toxopeus, H., ed), ACRI-IOCC,London, United Kingdom.
Risterucci A.M., L. Grivet, J.A.K. N'Goran, I. Pieretti, M-H. Flament and C. Lanaud. 2000. Ahigh-density linkage map of Theobroma cacao L. Theor. Appl. Genet. 101: 948-955.
Sounigo O., Y. Christopher, S. Ramdahin, R. Umaharan and A. Sankar. 2000. Evaluation anduse of the genetic diversity present in the International Cocoa Genebank, Trinidad (ICG T).In Proceedings of the 3rd INGENIC International Workshop on the New Technologies andCocoa Breeding, October 16-17, Kota Kinabalu, Sabah, Malaysia. In press.
Stam P. 1993. Construction of integrated genetic linkage maps by means by a new computerpackage: JoinMap. The Plant Journal 3: 739-744.
Zeng Z.B. 1994. Precision mapping of quantitative trait loci. Genetics 136: 1457-1468.
16 – 17 October 2000, Kota Kinabalu, Sabah, Malaysia 140
Resistance Gene Homologues: a Shortcut Strategy for MarkerAssisted Breeding
David N. Kuhn, J. Steve Brown, Marta Heath and Raymond J. Schnell
USDA-ARS SHRS, Miami, FL, USA
Abstract
Theobroma cacao is an economically important tropical tree crop whose seeds are used toproduce cocoa and chocolate. Many commercial cultivars are susceptible to major diseases andpests. Thus, the potential for crop loss due to disease or even pandemic is a real concern tococoa producers. This situation is currently exemplified by the drastic reduction in cocoaproduction in Brazil due to infection with Witches’ Broom Disease (Crinipellis perniciosa).Breeding of tree crops for disease resistance requires large populations segregating for thedesired character and an effective means of assaying disease resistance. If trees cannot beassayed until they produce pods, this could delay assay for up to five years. Thus, molecularmarkers are sought that could speed the selection and propagation of disease resistantcultivars. A normal molecular genetic approach to this problem would be to screen hundreds ofgenetic markers (RFLP, SSR, allozymes, AFLP) for segregation with the desired phenotype. Weare proposing a shortcut to this approach by looking for resistance gene homologues (RGHs).
RGHs have been identified for many plant species by using degenerate PCR primersdesigned to a highly conserved region of the nucleotide binding site of plant resistance genes(Shen et al. 1988; Aarts et al. 1988). The RGHs map to the same location as known resistancegenes in Arabidopsis and lettuce. Thus, RGHs may make better molecular markers for diseaseresistance in cocoa because resistance genes are often physically clustered in plants. Byidentifying putative members of the clusters, we may be able to rapidly identify useful geneticmarkers which will show a stronger linkage to the disease resistance phenotype.
Introduction
Cocoa is an important agronomic crop but, because it is a tree crop, it has a number ofproblems with regard to improvement through traditional breeding methods;• Trees raised from seed may not produce fruit until they are three to five years old.• Many cultivars are self-incompatible, which makes it difficult to produce F2
populations.• Large areas are needed to plant thousands of trees.• Because of the length of time and large areas needed for such breeding
experiments, maintenance of families can be affected by political and programmaticchanges.
• Even the hybrid cocoa grown today has been reproduced in seed gardens and itspedigree and genotype may be uncertain or unknown.
• An obstacle to disease resistance breeding is the inability to study different races ofthe pathogens in commercial production areas due to limitations on movement ofthe pathogens into these areas.
• Many of the existing F1 families have been produced to study segregation ofagronomic characters, rather than disease resistance.
• Finally, disease resistance in T. cacao may be multigenic, making discovery ofindividual genes responsible for resistance unlikely.
Marker assisted breeding is meant to overcome some of these concerns bydeveloping molecular markers associated with the desired phenotype, in this case,disease resistance. These markers can be used to preselect material for assay ofdisease resistance or for breeding before the phenotype is expressed. For example, byidentifying a molecular marker associated with pod rot, one could identify material for
16 – 17 October 2000, Kota Kinabalu, Sabah, Malaysia 141
breeding without having to wait until it had actually produced pods for assay of diseaseresistance. Such measures should speed up selection of agronomically useful clonesfor assay or propagation.
A number of disease resistance genes have been isolated from plants by traditionalgenetic means. Sequencing of these genes revealed that most of the products ofresistance genes are involved in pathogen recognition and signal transduction.Comparison of resistance gene sequences from a number of plant sources hasidentified a few highly conserved sequence motifs, such as the nucleotide binding site(NBS) usually toward the 5’ end of the gene and a leucine rich repeat (LRR) toward the3’ end of the gene. In addition, mapping experiments in Arabidopsis and lettuce haveshown that resistance genes are clustered physically on the chromosomes, apparentlywithout regard to the type of pathogen. Thus, a gene for resistance to nematodes couldbe adjacent to a gene for resistance to rust. Finally, by analysing EST libraries ofArabidopsis for the presence of sequences similar to the known NBS motif, it has beenestimated that 1% of all Arabidopsis genes (approximately 200 of 21 000) are diseaseresistance genes.
Based on these facts, it seems possible to identify portions of resistance genehomologues using primers to the conserved NBS site in T. cacao. If these RGHs arepolymorphic, they should allow mapping of resistance gene clusters in T. cacao. Evenif the RGHs are not the actual genes for resistance to a particular disease, they may beclosely linked due to resistance gene clustering. Identification of RGHs associated witha specific disease resistance will depend on the availability of large enough familiessegregating for disease resistance.
Materials and methods
Degenerate primers were designed from highly conserved regions in the nucleotidebinding site (NBS) domain from known plant disease resistance genes by Shen et al.(1998) and Aarts et al. (1998). Aarts et al. (1998) designed RG1(GGIATGGGIGGIGTIGGIAARACNACN) (GMGGVGKTT) and RG2(ICCIAGIACYTTIARIGCIARIGGIARWCC) (GLPLALKVLG). Shen et al. (1998)designed PLOOPGA (GAATTCGGNGTNGGNAAAGACAAC) (EFGVGKTT) andGLPL6 (GTCGACAANGCCAANGGCAATCC) (GLPLALS). The primer sets weresimilar as can be seen by the amino acid translations but differed in their degeneracy.RG1 was 1024 fold degenerate and RG2 was 8192 fold degenerate, assuming two folddegeneracy for each I. PLOOPGA was 64 fold degenerate and GLPL6 was 16 folddegenerate. We used both sets of primers to amplify genomic DNA from sevendifferent cultivars: SCA6, EET400, P12, GS46, Amelonado, 106Rand IMC67xSCA12, aclonal selection from a hybrid family. Amplicons from all amplification reactions weremixed and cloned into the pCR-4Topo plasmid (Invitrogen). Plasmid DNA was isolatedfrom each of the 650 colonies and, initially, 40 candidates were sequenced.
Results and discussion
Nucleotide sequences were compared against the non-redundant GenBank databasesusing BLAST (Altschul et al 1997) at the NIH-NCBI website (www.ncbi.nlm.nih.gov). Ofthe first 40 sequences, 18 had a 350 bp insert that was identical to chloroplast DNA. All650 colonies were grown on LB agar in a matrix and screened by colony hybridisationwith the chloroplast sequence as a probe. Colonies hybridising to the probe were notfurther analysed. The 350 remaining colonies were amplified individually using the M13forward and reverse primers and categorised by size by agarose gel electrophoresis.
Shen et al. (1998) and Aarts et al. (1998) had observed that inserts of approximately530 nucleotides in length that contained a continuous open reading frame which
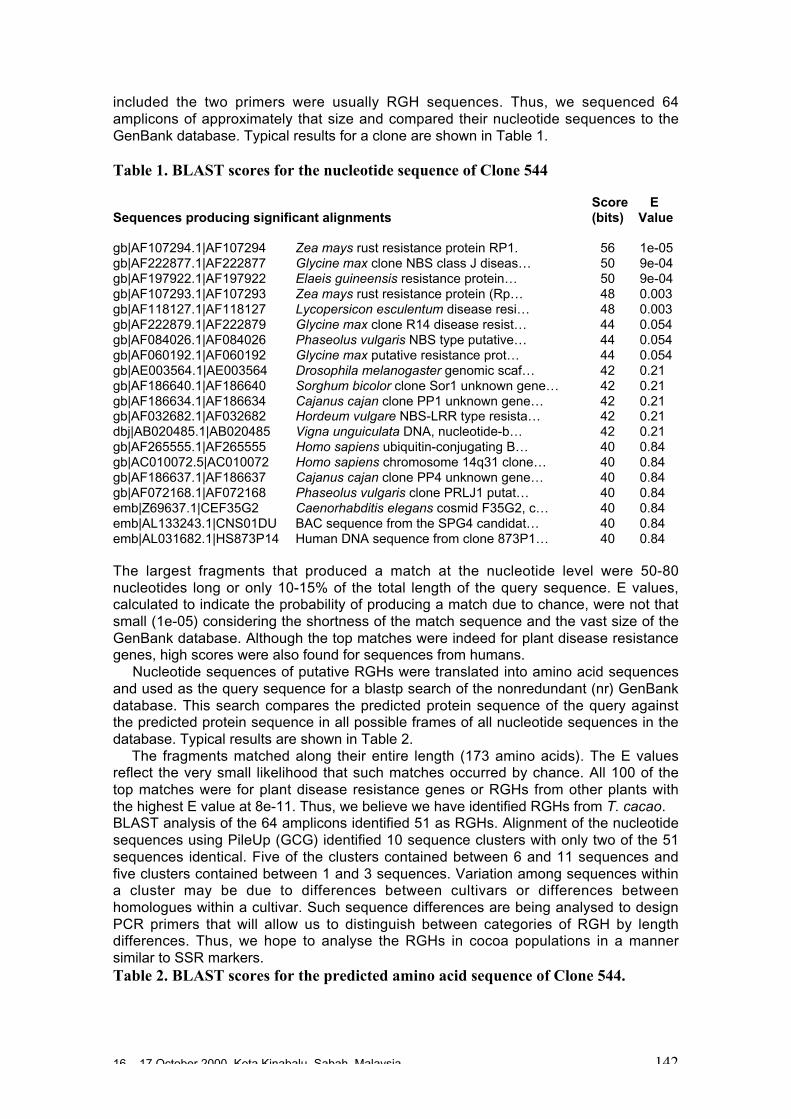
16 – 17 October 2000, Kota Kinabalu, Sabah, Malaysia 142
included the two primers were usually RGH sequences. Thus, we sequenced 64amplicons of approximately that size and compared their nucleotide sequences to theGenBank database. Typical results for a clone are shown in Table 1.
Table 1. BLAST scores for the nucleotide sequence of Clone 544
Score ESequences producing significant alignments (bits) Value
gb|AF107294.1|AF107294 Zea mays rust resistance protein RP1. 56 1e-05gb|AF222877.1|AF222877 Glycine max clone NBS class J diseas… 50 9e-04gb|AF197922.1|AF197922 Elaeis guineensis resistance protein… 50 9e-04gb|AF107293.1|AF107293 Zea mays rust resistance protein (Rp… 48 0.003gb|AF118127.1|AF118127 Lycopersicon esculentum disease resi… 48 0.003gb|AF222879.1|AF222879 Glycine max clone R14 disease resist… 44 0.054gb|AF084026.1|AF084026 Phaseolus vulgaris NBS type putative… 44 0.054gb|AF060192.1|AF060192 Glycine max putative resistance prot… 44 0.054gb|AE003564.1|AE003564 Drosophila melanogaster genomic scaf… 42 0.21gb|AF186640.1|AF186640 Sorghum bicolor clone Sor1 unknown gene… 42 0.21gb|AF186634.1|AF186634 Cajanus cajan clone PP1 unknown gene… 42 0.21gb|AF032682.1|AF032682 Hordeum vulgare NBS-LRR type resista… 42 0.21dbj|AB020485.1|AB020485 Vigna unguiculata DNA, nucleotide-b… 42 0.21gb|AF265555.1|AF265555 Homo sapiens ubiquitin-conjugating B… 40 0.84gb|AC010072.5|AC010072 Homo sapiens chromosome 14q31 clone… 40 0.84gb|AF186637.1|AF186637 Cajanus cajan clone PP4 unknown gene… 40 0.84gb|AF072168.1|AF072168 Phaseolus vulgaris clone PRLJ1 putat… 40 0.84emb|Z69637.1|CEF35G2 Caenorhabditis elegans cosmid F35G2, c… 40 0.84emb|AL133243.1|CNS01DU BAC sequence from the SPG4 candidat… 40 0.84emb|AL031682.1|HS873P14 Human DNA sequence from clone 873P1… 40 0.84
The largest fragments that produced a match at the nucleotide level were 50-80nucleotides long or only 10-15% of the total length of the query sequence. E values,calculated to indicate the probability of producing a match due to chance, were not thatsmall (1e-05) considering the shortness of the match sequence and the vast size of theGenBank database. Although the top matches were indeed for plant disease resistancegenes, high scores were also found for sequences from humans.
Nucleotide sequences of putative RGHs were translated into amino acid sequencesand used as the query sequence for a blastp search of the nonredundant (nr) GenBankdatabase. This search compares the predicted protein sequence of the query againstthe predicted protein sequence in all possible frames of all nucleotide sequences in thedatabase. Typical results are shown in Table 2.
The fragments matched along their entire length (173 amino acids). The E valuesreflect the very small likelihood that such matches occurred by chance. All 100 of thetop matches were for plant disease resistance genes or RGHs from other plants withthe highest E value at 8e-11. Thus, we believe we have identified RGHs from T. cacao.BLAST analysis of the 64 amplicons identified 51 as RGHs. Alignment of the nucleotidesequences using PileUp (GCG) identified 10 sequence clusters with only two of the 51sequences identical. Five of the clusters contained between 6 and 11 sequences andfive clusters contained between 1 and 3 sequences. Variation among sequences withina cluster may be due to differences between cultivars or differences betweenhomologues within a cultivar. Such sequence differences are being analysed to designPCR primers that will allow us to distinguish between categories of RGH by lengthdifferences. Thus, we hope to analyse the RGHs in cocoa populations in a mannersimilar to SSR markers.Table 2. BLAST scores for the predicted amino acid sequence of Clone 544.
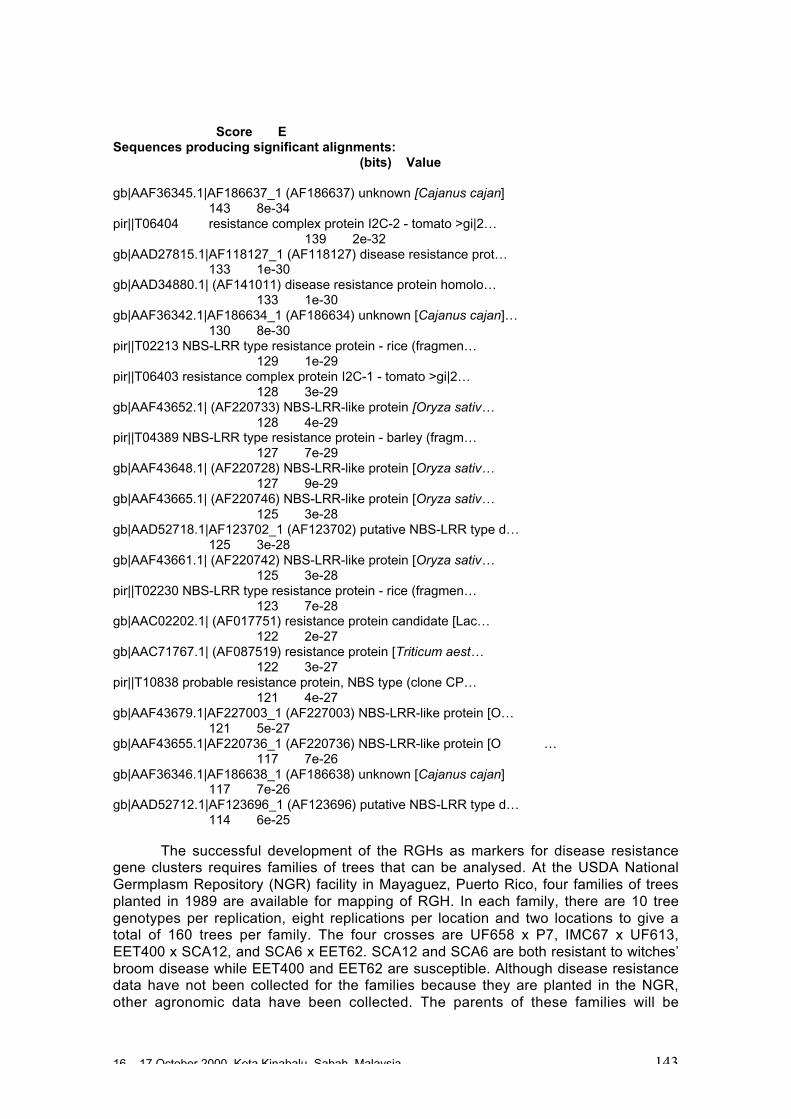
16 – 17 October 2000, Kota Kinabalu, Sabah, Malaysia 143
Score ESequences producing significant alignments:
(bits) Value
gb|AAF36345.1|AF186637_1 (AF186637) unknown [Cajanus cajan]143 8e-34
pir||T06404 resistance complex protein I2C-2 - tomato >gi|2…139 2e-32
gb|AAD27815.1|AF118127_1 (AF118127) disease resistance prot…133 1e-30
gb|AAD34880.1| (AF141011) disease resistance protein homolo…133 1e-30
gb|AAF36342.1|AF186634_1 (AF186634) unknown [Cajanus cajan]…130 8e-30
pir||T02213 NBS-LRR type resistance protein - rice (fragmen…129 1e-29
pir||T06403 resistance complex protein I2C-1 - tomato >gi|2…128 3e-29
gb|AAF43652.1| (AF220733) NBS-LRR-like protein [Oryza sativ…128 4e-29
pir||T04389 NBS-LRR type resistance protein - barley (fragm…127 7e-29
gb|AAF43648.1| (AF220728) NBS-LRR-like protein [Oryza sativ…127 9e-29
gb|AAF43665.1| (AF220746) NBS-LRR-like protein [Oryza sativ…125 3e-28
gb|AAD52718.1|AF123702_1 (AF123702) putative NBS-LRR type d…125 3e-28
gb|AAF43661.1| (AF220742) NBS-LRR-like protein [Oryza sativ…125 3e-28
pir||T02230 NBS-LRR type resistance protein - rice (fragmen…123 7e-28
gb|AAC02202.1| (AF017751) resistance protein candidate [Lac…122 2e-27
gb|AAC71767.1| (AF087519) resistance protein [Triticum aest…122 3e-27
pir||T10838 probable resistance protein, NBS type (clone CP…121 4e-27
gb|AAF43679.1|AF227003_1 (AF227003) NBS-LRR-like protein [O…121 5e-27
gb|AAF43655.1|AF220736_1 (AF220736) NBS-LRR-like protein [O …117 7e-26
gb|AAF36346.1|AF186638_1 (AF186638) unknown [Cajanus cajan]117 7e-26
gb|AAD52712.1|AF123696_1 (AF123696) putative NBS-LRR type d…114 6e-25
The successful development of the RGHs as markers for disease resistancegene clusters requires families of trees that can be analysed. At the USDA NationalGermplasm Repository (NGR) facility in Mayaguez, Puerto Rico, four families of treesplanted in 1989 are available for mapping of RGH. In each family, there are 10 treegenotypes per replication, eight replications per location and two locations to give atotal of 160 trees per family. The four crosses are UF658 x P7, IMC67 x UF613,EET400 x SCA12, and SCA6 x EET62. SCA12 and SCA6 are both resistant to witches’broom disease while EET400 and EET62 are susceptible. Although disease resistancedata have not been collected for the families because they are planted in the NGR,other agronomic data have been collected. The parents of these families will be
16 – 17 October 2000, Kota Kinabalu, Sabah, Malaysia 144
analysed for presence of specific RGH categories and inheritance of RGH genes willbe mapped to linkage groups by analysis of co-segregation of SSR markers.
References
Aarts M. G. M., B.T.L. Hekkert, E.B. Holub, J.L. Beynon, W.J. Stiekema and A. Pereira. 1998.Identification of R-Gene Homologous DNA Fragments Genetically Linked to DiseaseResistance Loci in Arabidopsis thaliana. Molecular Plant-Microbe Interactions 11: 251-258.
Altschul S. F., T. L. Madden, A. A. Schäffer, J. Zhang, Z. Zhang, W. Miller and D.J. Lipman.1997. Gapped BLAST and PSI-BLAST: a new generation of protein database searchprograms. Nucleic Acids Research, 25: 3389-3402.
Shen K. A., B.C. Meyers, M.N. Islam-Faridi, D.B. Chin, D.M. Stelly and R.W. Michelmore. 1998.Resistance Gene Candidates identified by PCR with Degenerate Oligonucleotide PrimersMap to clusters of resistance genes in lettuce. Molecular Plant-Microbe Interactions 11: 815-823.
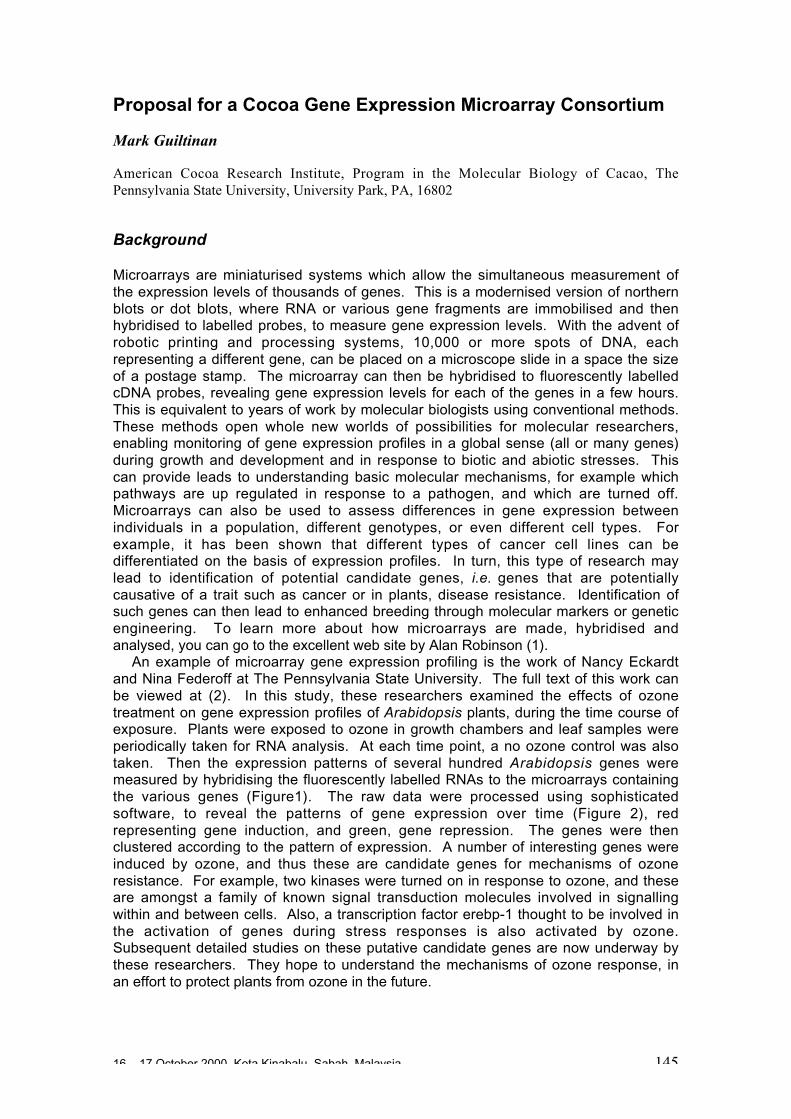
16 – 17 October 2000, Kota Kinabalu, Sabah, Malaysia 145
Proposal for a Cocoa Gene Expression Microarray Consortium
Mark Guiltinan
American Cocoa Research Institute, Program in the Molecular Biology of Cacao, ThePennsylvania State University, University Park, PA, 16802
Background
Microarrays are miniaturised systems which allow the simultaneous measurement ofthe expression levels of thousands of genes. This is a modernised version of northernblots or dot blots, where RNA or various gene fragments are immobilised and thenhybridised to labelled probes, to measure gene expression levels. With the advent ofrobotic printing and processing systems, 10,000 or more spots of DNA, eachrepresenting a different gene, can be placed on a microscope slide in a space the sizeof a postage stamp. The microarray can then be hybridised to fluorescently labelledcDNA probes, revealing gene expression levels for each of the genes in a few hours.This is equivalent to years of work by molecular biologists using conventional methods.These methods open whole new worlds of possibilities for molecular researchers,enabling monitoring of gene expression profiles in a global sense (all or many genes)during growth and development and in response to biotic and abiotic stresses. Thiscan provide leads to understanding basic molecular mechanisms, for example whichpathways are up regulated in response to a pathogen, and which are turned off.Microarrays can also be used to assess differences in gene expression betweenindividuals in a population, different genotypes, or even different cell types. Forexample, it has been shown that different types of cancer cell lines can bedifferentiated on the basis of expression profiles. In turn, this type of research maylead to identification of potential candidate genes, i.e. genes that are potentiallycausative of a trait such as cancer or in plants, disease resistance. Identification ofsuch genes can then lead to enhanced breeding through molecular markers or geneticengineering. To learn more about how microarrays are made, hybridised andanalysed, you can go to the excellent web site by Alan Robinson (1).
An example of microarray gene expression profiling is the work of Nancy Eckardtand Nina Federoff at The Pennsylvania State University. The full text of this work canbe viewed at (2). In this study, these researchers examined the effects of ozonetreatment on gene expression profiles of Arabidopsis plants, during the time course ofexposure. Plants were exposed to ozone in growth chambers and leaf samples wereperiodically taken for RNA analysis. At each time point, a no ozone control was alsotaken. Then the expression patterns of several hundred Arabidopsis genes weremeasured by hybridising the fluorescently labelled RNAs to the microarrays containingthe various genes (Figure1). The raw data were processed using sophisticatedsoftware, to reveal the patterns of gene expression over time (Figure 2), redrepresenting gene induction, and green, gene repression. The genes were thenclustered according to the pattern of expression. A number of interesting genes wereinduced by ozone, and thus these are candidate genes for mechanisms of ozoneresistance. For example, two kinases were turned on in response to ozone, and theseare amongst a family of known signal transduction molecules involved in signallingwithin and between cells. Also, a transcription factor erebp-1 thought to be involved inthe activation of genes during stress responses is also activated by ozone.Subsequent detailed studies on these putative candidate genes are now underway bythese researchers. They hope to understand the mechanisms of ozone response, inan effort to protect plants from ozone in the future.
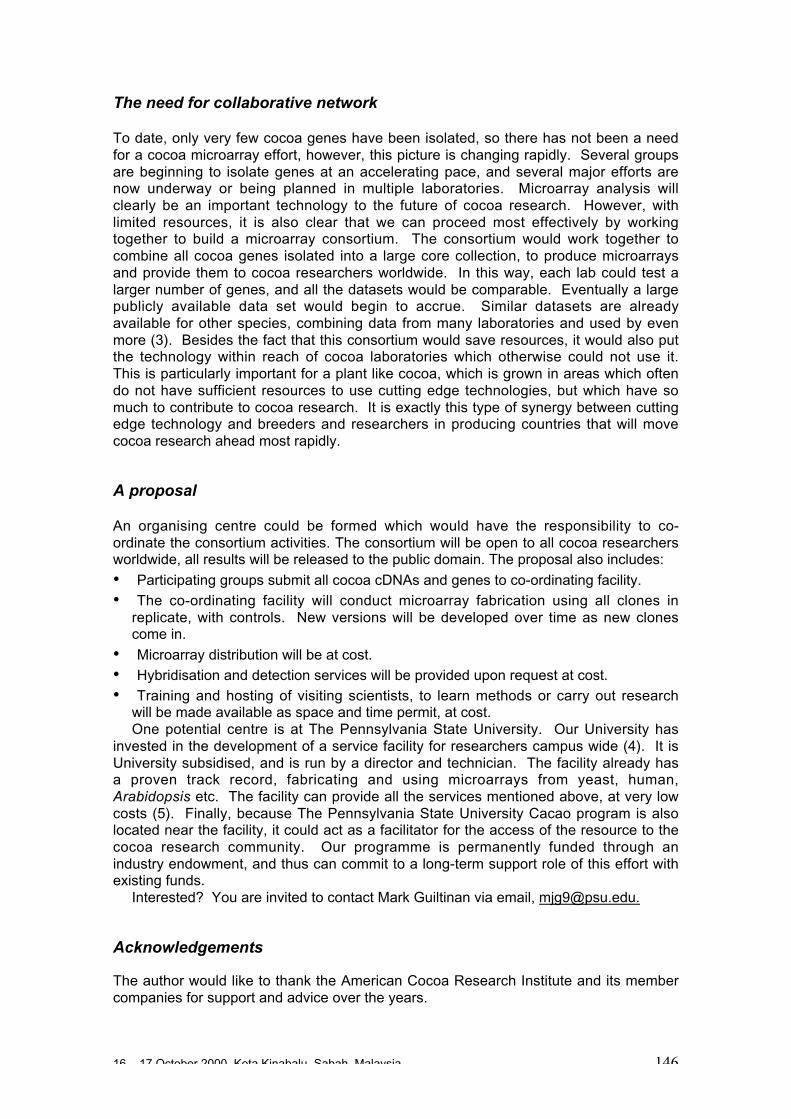
16 – 17 October 2000, Kota Kinabalu, Sabah, Malaysia 146
The need for collaborative network
To date, only very few cocoa genes have been isolated, so there has not been a needfor a cocoa microarray effort, however, this picture is changing rapidly. Several groupsare beginning to isolate genes at an accelerating pace, and several major efforts arenow underway or being planned in multiple laboratories. Microarray analysis willclearly be an important technology to the future of cocoa research. However, withlimited resources, it is also clear that we can proceed most effectively by workingtogether to build a microarray consortium. The consortium would work together tocombine all cocoa genes isolated into a large core collection, to produce microarraysand provide them to cocoa researchers worldwide. In this way, each lab could test alarger number of genes, and all the datasets would be comparable. Eventually a largepublicly available data set would begin to accrue. Similar datasets are alreadyavailable for other species, combining data from many laboratories and used by evenmore (3). Besides the fact that this consortium would save resources, it would also putthe technology within reach of cocoa laboratories which otherwise could not use it.This is particularly important for a plant like cocoa, which is grown in areas which oftendo not have sufficient resources to use cutting edge technologies, but which have somuch to contribute to cocoa research. It is exactly this type of synergy between cuttingedge technology and breeders and researchers in producing countries that will movecocoa research ahead most rapidly.
A proposal
An organising centre could be formed which would have the responsibility to co-ordinate the consortium activities. The consortium will be open to all cocoa researchersworldwide, all results will be released to the public domain. The proposal also includes:
• Participating groups submit all cocoa cDNAs and genes to co-ordinating facility.
• The co-ordinating facility will conduct microarray fabrication using all clones inreplicate, with controls. New versions will be developed over time as new clonescome in.
• Microarray distribution will be at cost.
• Hybridisation and detection services will be provided upon request at cost.
• Training and hosting of visiting scientists, to learn methods or carry out researchwill be made available as space and time permit, at cost.One potential centre is at The Pennsylvania State University. Our University has
invested in the development of a service facility for researchers campus wide (4). It isUniversity subsidised, and is run by a director and technician. The facility already hasa proven track record, fabricating and using microarrays from yeast, human,Arabidopsis etc. The facility can provide all the services mentioned above, at very lowcosts (5). Finally, because The Pennsylvania State University Cacao program is alsolocated near the facility, it could act as a facilitator for the access of the resource to thecocoa research community. Our programme is permanently funded through anindustry endowment, and thus can commit to a long-term support role of this effort withexisting funds.
Interested? You are invited to contact Mark Guiltinan via email, [email protected].
Acknowledgements
The author would like to thank the American Cocoa Research Institute and its membercompanies for support and advice over the years.
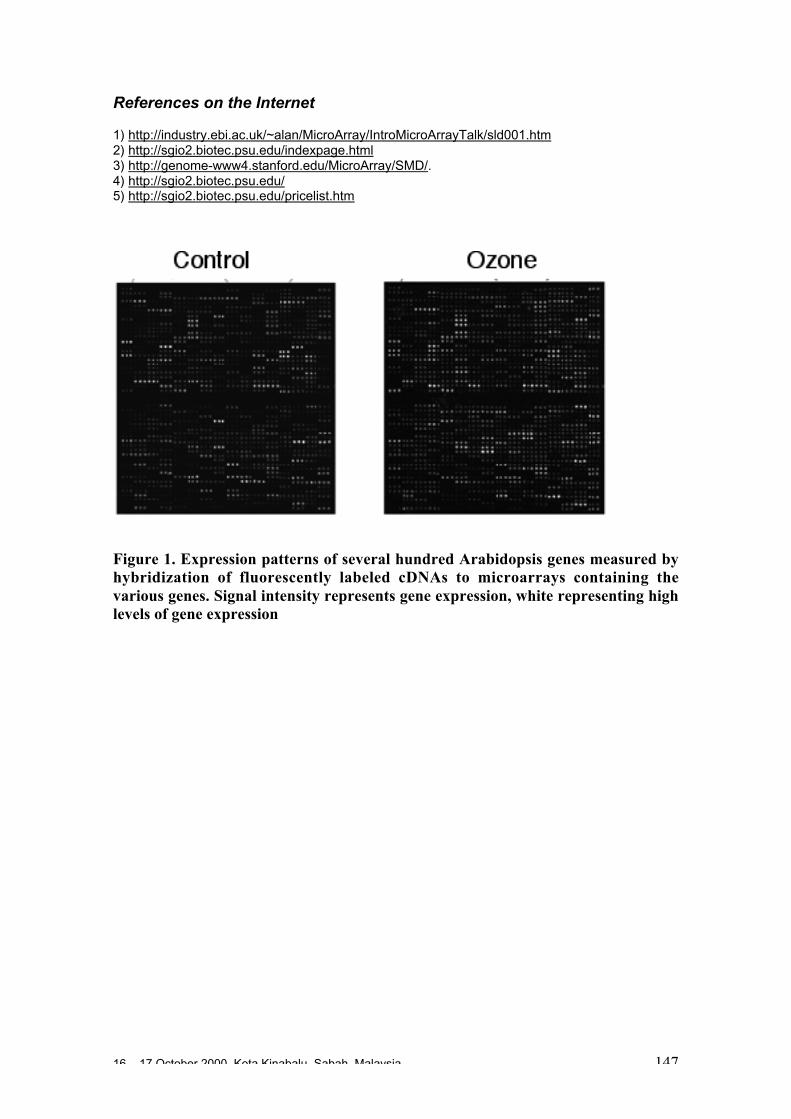
16 – 17 October 2000, Kota Kinabalu, Sabah, Malaysia 147
References on the Internet
1) http://industry.ebi.ac.uk/~alan/MicroArray/IntroMicroArrayTalk/sld001.htm2) http://sgio2.biotec.psu.edu/indexpage.html3) http://genome-www4.stanford.edu/MicroArray/SMD/.4) http://sgio2.biotec.psu.edu/5) http://sgio2.biotec.psu.edu/pricelist.htm
Figure 1. Expression patterns of several hundred Arabidopsis genes measured byhybridization of fluorescently labeled cDNAs to microarrays containing thevarious genes. Signal intensity represents gene expression, white representing highlevels of gene expression
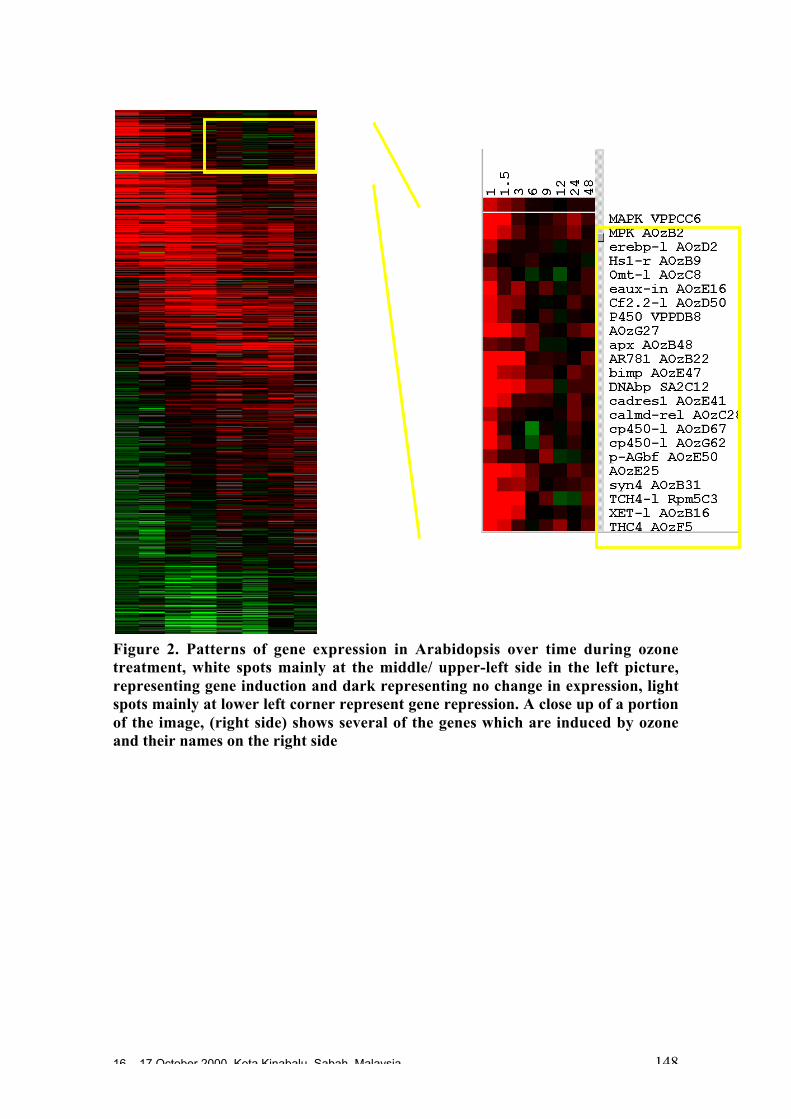
16 – 17 October 2000, Kota Kinabalu, Sabah, Malaysia 148
Figure 2. Patterns of gene expression in Arabidopsis over time during ozonetreatment, white spots mainly at the middle/ upper-left side in the left picture,representing gene induction and dark representing no change in expression, lightspots mainly at lower left corner represent gene repression. A close up of a portionof the image, (right side) shows several of the genes which are induced by ozoneand their names on the right side
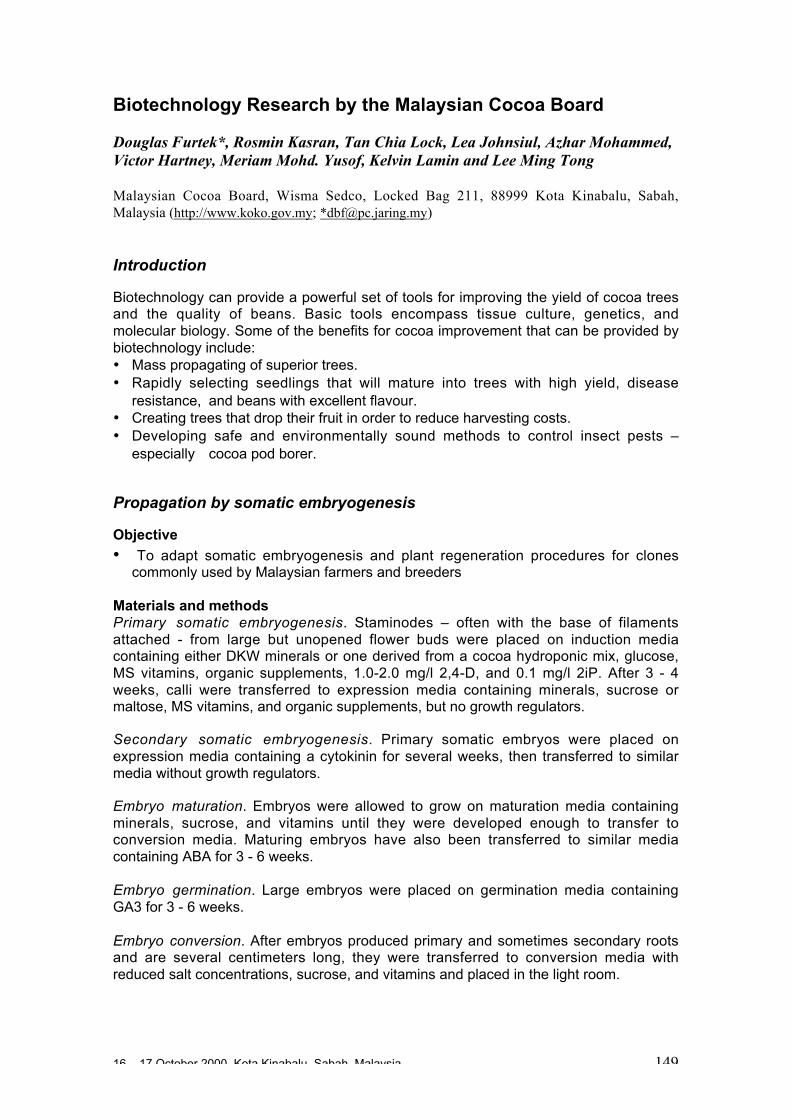
16 – 17 October 2000, Kota Kinabalu, Sabah, Malaysia 149
Biotechnology Research by the Malaysian Cocoa Board
Douglas Furtek*, Rosmin Kasran, Tan Chia Lock, Lea Johnsiul, Azhar Mohammed,Victor Hartney, Meriam Mohd. Yusof, Kelvin Lamin and Lee Ming Tong
Malaysian Cocoa Board, Wisma Sedco, Locked Bag 211, 88999 Kota Kinabalu, Sabah,Malaysia (http://www.koko.gov.my; *[email protected])
Introduction
Biotechnology can provide a powerful set of tools for improving the yield of cocoa treesand the quality of beans. Basic tools encompass tissue culture, genetics, andmolecular biology. Some of the benefits for cocoa improvement that can be provided bybiotechnology include:• Mass propagating of superior trees.• Rapidly selecting seedlings that will mature into trees with high yield, disease
resistance, and beans with excellent flavour.• Creating trees that drop their fruit in order to reduce harvesting costs.• Developing safe and environmentally sound methods to control insect pests –
especially cocoa pod borer.
Propagation by somatic embryogenesis
Objective
• To adapt somatic embryogenesis and plant regeneration procedures for clonescommonly used by Malaysian farmers and breeders
Materials and methodsPrimary somatic embryogenesis. Staminodes – often with the base of filamentsattached - from large but unopened flower buds were placed on induction mediacontaining either DKW minerals or one derived from a cocoa hydroponic mix, glucose,MS vitamins, organic supplements, 1.0-2.0 mg/l 2,4-D, and 0.1 mg/l 2iP. After 3 - 4weeks, calli were transferred to expression media containing minerals, sucrose ormaltose, MS vitamins, and organic supplements, but no growth regulators.
Secondary somatic embryogenesis. Primary somatic embryos were placed onexpression media containing a cytokinin for several weeks, then transferred to similarmedia without growth regulators.
Embryo maturation. Embryos were allowed to grow on maturation media containingminerals, sucrose, and vitamins until they were developed enough to transfer toconversion media. Maturing embryos have also been transferred to similar mediacontaining ABA for 3 - 6 weeks.
Embryo germination. Large embryos were placed on germination media containingGA3 for 3 - 6 weeks.
Embryo conversion. After embryos produced primary and sometimes secondary rootsand are several centimeters long, they were transferred to conversion media withreduced salt concentrations, sucrose, and vitamins and placed in the light room.
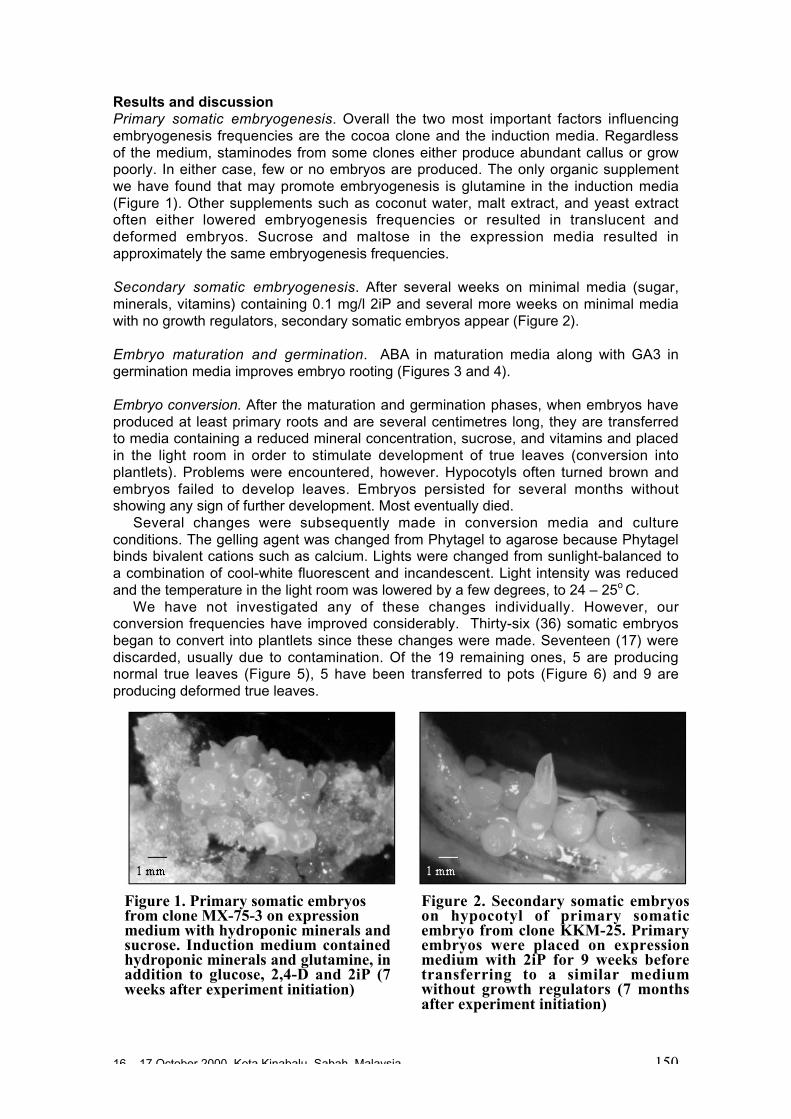
16 – 17 October 2000, Kota Kinabalu, Sabah, Malaysia 150
Results and discussionPrimary somatic embryogenesis. Overall the two most important factors influencingembryogenesis frequencies are the cocoa clone and the induction media. Regardlessof the medium, staminodes from some clones either produce abundant callus or growpoorly. In either case, few or no embryos are produced. The only organic supplementwe have found that may promote embryogenesis is glutamine in the induction media(Figure 1). Other supplements such as coconut water, malt extract, and yeast extractoften either lowered embryogenesis frequencies or resulted in translucent anddeformed embryos. Sucrose and maltose in the expression media resulted inapproximately the same embryogenesis frequencies.
Secondary somatic embryogenesis. After several weeks on minimal media (sugar,minerals, vitamins) containing 0.1 mg/l 2iP and several more weeks on minimal mediawith no growth regulators, secondary somatic embryos appear (Figure 2).
Embryo maturation and germination. ABA in maturation media along with GA3 ingermination media improves embryo rooting (Figures 3 and 4).
Embryo conversion. After the maturation and germination phases, when embryos haveproduced at least primary roots and are several centimetres long, they are transferredto media containing a reduced mineral concentration, sucrose, and vitamins and placedin the light room in order to stimulate development of true leaves (conversion intoplantlets). Problems were encountered, however. Hypocotyls often turned brown andembryos failed to develop leaves. Embryos persisted for several months withoutshowing any sign of further development. Most eventually died.
Several changes were subsequently made in conversion media and cultureconditions. The gelling agent was changed from Phytagel to agarose because Phytagelbinds bivalent cations such as calcium. Lights were changed from sunlight-balanced toa combination of cool-white fluorescent and incandescent. Light intensity was reducedand the temperature in the light room was lowered by a few degrees, to 24 – 25o C.
We have not investigated any of these changes individually. However, ourconversion frequencies have improved considerably. Thirty-six (36) somatic embryosbegan to convert into plantlets since these changes were made. Seventeen (17) werediscarded, usually due to contamination. Of the 19 remaining ones, 5 are producingnormal true leaves (Figure 5), 5 have been transferred to pots (Figure 6) and 9 areproducing deformed true leaves.
Figure 1. Primary somatic embryosfrom clone MX-75-3 on expressionmedium with hydroponic minerals andsucrose. Induction medium containedhydroponic minerals and glutamine, inaddition to glucose, 2,4-D and 2iP (7weeks after experiment initiation)
Figure 2. Secondary somatic embryoson hypocotyl of primary somaticembryo from clone KKM-25. Primaryembryos were placed on expressionmedium with 2iP for 9 weeks beforetransferring to a similar mediumwithout growth regulators (7 monthsafter experiment initiation)
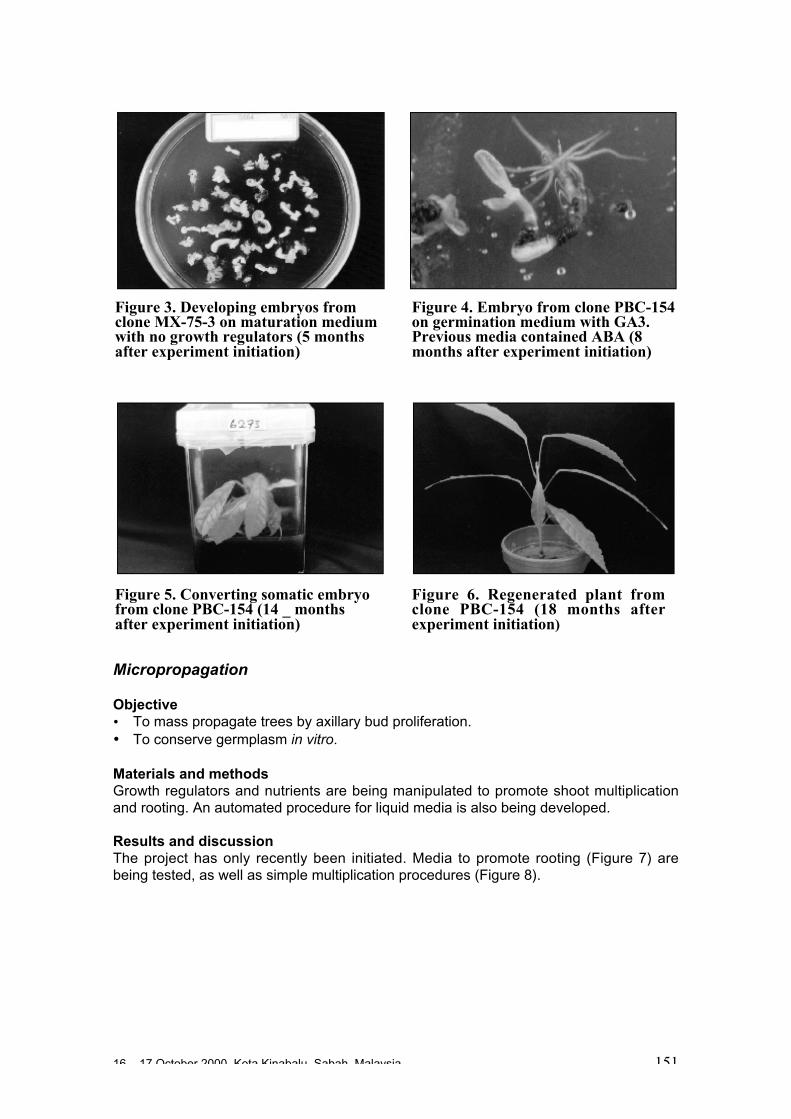
16 – 17 October 2000, Kota Kinabalu, Sabah, Malaysia 151
Micropropagation
Objective• To mass propagate trees by axillary bud proliferation.• To conserve germplasm in vitro.
Materials and methodsGrowth regulators and nutrients are being manipulated to promote shoot multiplicationand rooting. An automated procedure for liquid media is also being developed.
Results and discussionThe project has only recently been initiated. Media to promote rooting (Figure 7) arebeing tested, as well as simple multiplication procedures (Figure 8).
Figure 3. Developing embryos fromclone MX-75-3 on maturation mediumwith no growth regulators (5 monthsafter experiment initiation)
Figure 4. Embryo from clone PBC-154on germination medium with GA3.Previous media contained ABA (8months after experiment initiation)
Figure 5. Converting somatic embryofrom clone PBC-154 (14 _ monthsafter experiment initiation)
Figure 6. Regenerated plant fromclone PBC-154 (18 months afterexperiment initiation)
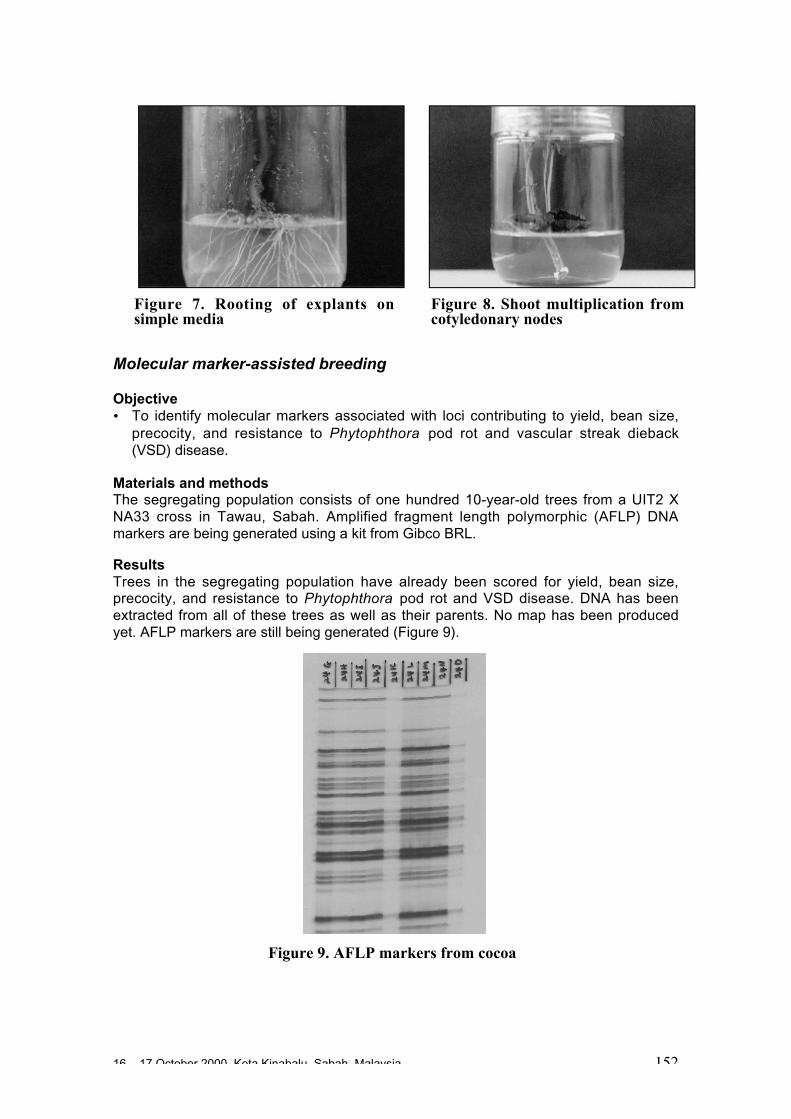
16 – 17 October 2000, Kota Kinabalu, Sabah, Malaysia 152
Molecular marker-assisted breeding
Objective• To identify molecular markers associated with loci contributing to yield, bean size,
precocity, and resistance to Phytophthora pod rot and vascular streak dieback(VSD) disease.
Materials and methodsThe segregating population consists of one hundred 10-year-old trees from a UIT2 XNA33 cross in Tawau, Sabah. Amplified fragment length polymorphic (AFLP) DNAmarkers are being generated using a kit from Gibco BRL.
ResultsTrees in the segregating population have already been scored for yield, bean size,precocity, and resistance to Phytophthora pod rot and VSD disease. DNA has beenextracted from all of these trees as well as their parents. No map has been producedyet. AFLP markers are still being generated (Figure 9).
Figure 9. AFLP markers from cocoa
Figure 7. Rooting of explants onsimple media
Figure 8. Shoot multiplication fromcotyledonary nodes
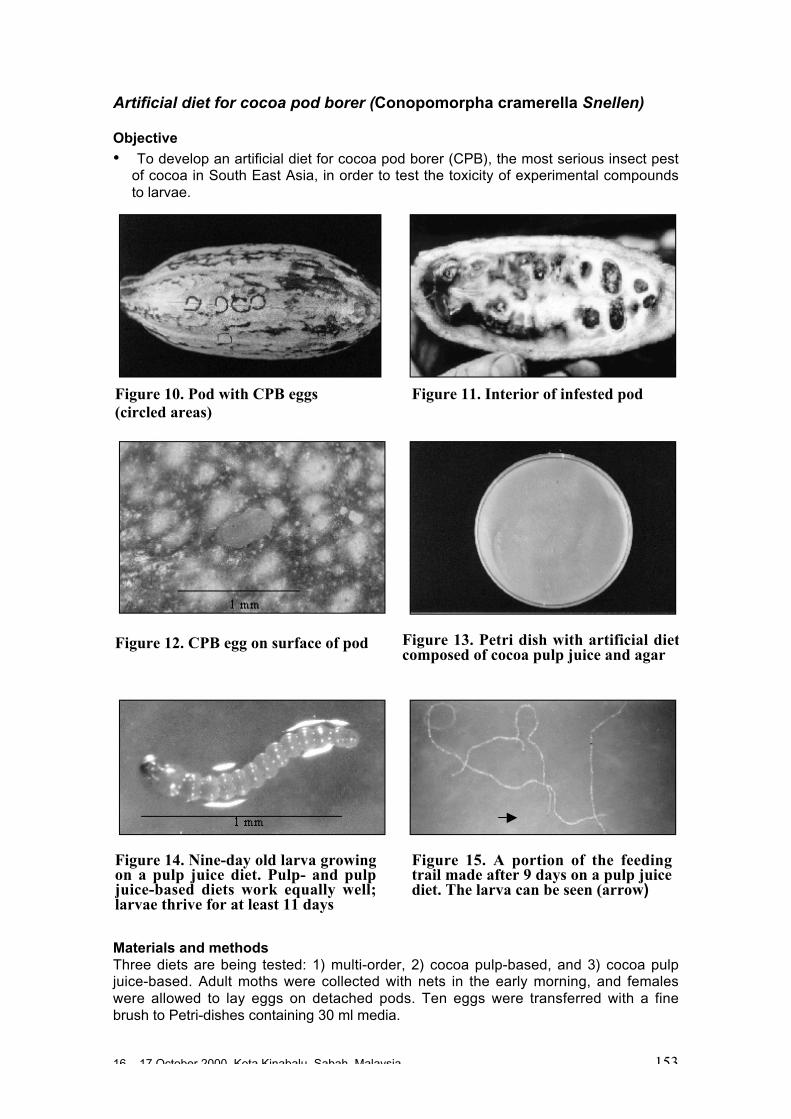
16 – 17 October 2000, Kota Kinabalu, Sabah, Malaysia 153
Artificial diet for cocoa pod borer (Conopomorpha cramerella Snellen)
Objective
• To develop an artificial diet for cocoa pod borer (CPB), the most serious insect pestof cocoa in South East Asia, in order to test the toxicity of experimental compoundsto larvae.
Materials and methodsThree diets are being tested: 1) multi-order, 2) cocoa pulp-based, and 3) cocoa pulpjuice-based. Adult moths were collected with nets in the early morning, and femaleswere allowed to lay eggs on detached pods. Ten eggs were transferred with a finebrush to Petri-dishes containing 30 ml media.
Figure 10. Pod with CPB eggs(circled areas)
Figure 11. Interior of infested pod
Figure 12. CPB egg on surface of pod Figure 13. Petri dish with artificial dietcomposed of cocoa pulp juice and agar
Figure 14. Nine-day old larva growingon a pulp juice diet. Pulp- and pulpjuice-based diets work equally well;larvae thrive for at least 11 days
Figure 15. A portion of the feedingtrail made after 9 days on a pulp juicediet. The larva can be seen (arrow)
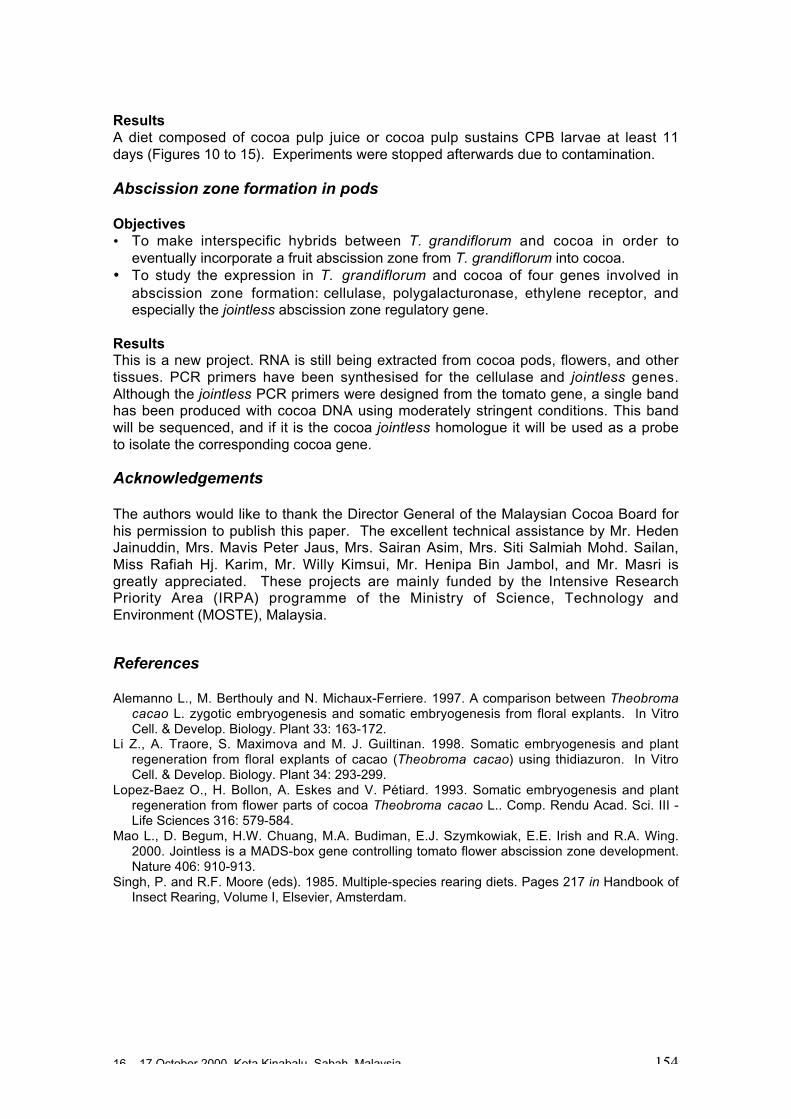
16 – 17 October 2000, Kota Kinabalu, Sabah, Malaysia 154
ResultsA diet composed of cocoa pulp juice or cocoa pulp sustains CPB larvae at least 11days (Figures 10 to 15). Experiments were stopped afterwards due to contamination.
Abscission zone formation in pods
Objectives• To make interspecific hybrids between T. grandiflorum and cocoa in order to
eventually incorporate a fruit abscission zone from T. grandiflorum into cocoa.• To study the expression in T. grandiflorum and cocoa of four genes involved in
abscission zone formation: cellulase, polygalacturonase, ethylene receptor, andespecially the jointless abscission zone regulatory gene.
ResultsThis is a new project. RNA is still being extracted from cocoa pods, flowers, and othertissues. PCR primers have been synthesised for the cellulase and jointless genes.Although the jointless PCR primers were designed from the tomato gene, a single bandhas been produced with cocoa DNA using moderately stringent conditions. This bandwill be sequenced, and if it is the cocoa jointless homologue it will be used as a probeto isolate the corresponding cocoa gene.
Acknowledgements
The authors would like to thank the Director General of the Malaysian Cocoa Board forhis permission to publish this paper. The excellent technical assistance by Mr. HedenJainuddin, Mrs. Mavis Peter Jaus, Mrs. Sairan Asim, Mrs. Siti Salmiah Mohd. Sailan,Miss Rafiah Hj. Karim, Mr. Willy Kimsui, Mr. Henipa Bin Jambol, and Mr. Masri isgreatly appreciated. These projects are mainly funded by the Intensive ResearchPriority Area (IRPA) programme of the Ministry of Science, Technology andEnvironment (MOSTE), Malaysia.
References
Alemanno L., M. Berthouly and N. Michaux-Ferriere. 1997. A comparison between Theobromacacao L. zygotic embryogenesis and somatic embryogenesis from floral explants. In VitroCell. & Develop. Biology. Plant 33: 163-172.
Li Z., A. Traore, S. Maximova and M. J. Guiltinan. 1998. Somatic embryogenesis and plantregeneration from floral explants of cacao (Theobroma cacao) using thidiazuron. In VitroCell. & Develop. Biology. Plant 34: 293-299.
Lopez-Baez O., H. Bollon, A. Eskes and V. Pétiard. 1993. Somatic embryogenesis and plantregeneration from flower parts of cocoa Theobroma cacao L.. Comp. Rendu Acad. Sci. III -Life Sciences 316: 579-584.
Mao L., D. Begum, H.W. Chuang, M.A. Budiman, E.J. Szymkowiak, E.E. Irish and R.A. Wing.2000. Jointless is a MADS-box gene controlling tomato flower abscission zone development.Nature 406: 910-913.
Singh, P. and R.F. Moore (eds). 1985. Multiple-species rearing diets. Pages 217 in Handbook ofInsect Rearing, Volume I, Elsevier, Amsterdam.
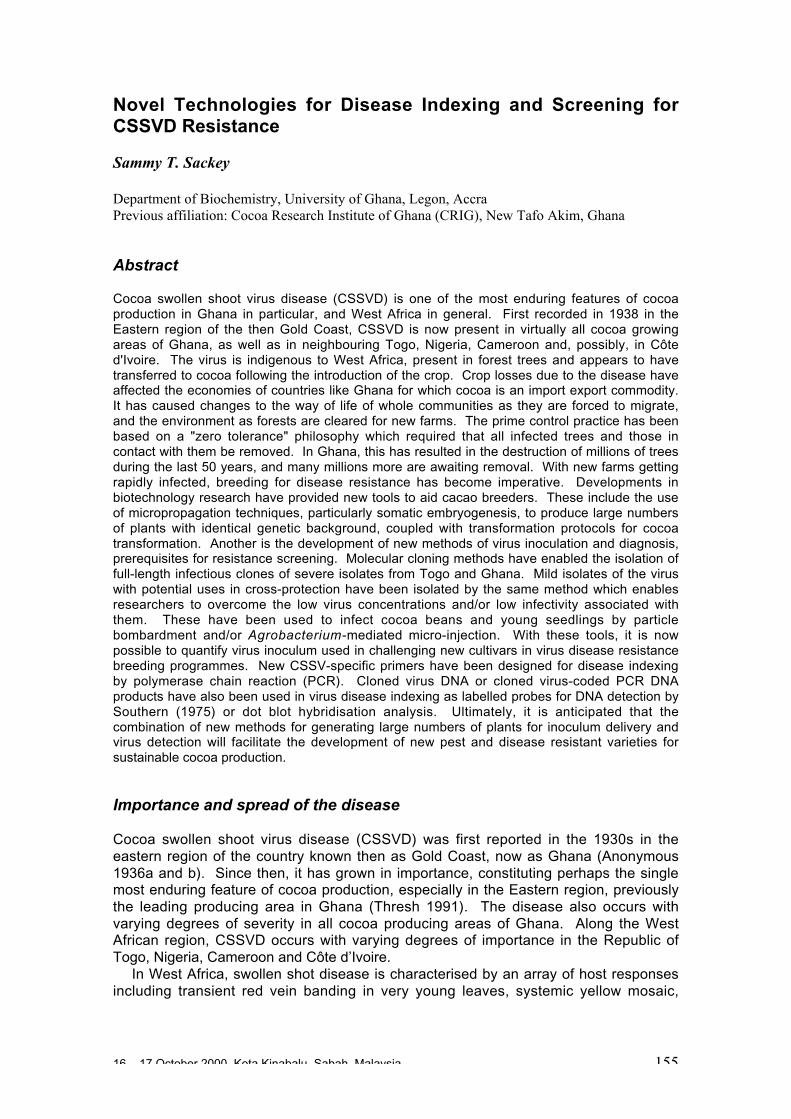
16 – 17 October 2000, Kota Kinabalu, Sabah, Malaysia 155
Novel Technologies for Disease Indexing and Screening forCSSVD Resistance
Sammy T. Sackey
Department of Biochemistry, University of Ghana, Legon, AccraPrevious affiliation: Cocoa Research Institute of Ghana (CRIG), New Tafo Akim, Ghana
Abstract
Cocoa swollen shoot virus disease (CSSVD) is one of the most enduring features of cocoaproduction in Ghana in particular, and West Africa in general. First recorded in 1938 in theEastern region of the then Gold Coast, CSSVD is now present in virtually all cocoa growingareas of Ghana, as well as in neighbouring Togo, Nigeria, Cameroon and, possibly, in Côted'Ivoire. The virus is indigenous to West Africa, present in forest trees and appears to havetransferred to cocoa following the introduction of the crop. Crop losses due to the disease haveaffected the economies of countries like Ghana for which cocoa is an import export commodity.It has caused changes to the way of life of whole communities as they are forced to migrate,and the environment as forests are cleared for new farms. The prime control practice has beenbased on a "zero tolerance" philosophy which required that all infected trees and those incontact with them be removed. In Ghana, this has resulted in the destruction of millions of treesduring the last 50 years, and many millions more are awaiting removal. With new farms gettingrapidly infected, breeding for disease resistance has become imperative. Developments inbiotechnology research have provided new tools to aid cacao breeders. These include the useof micropropagation techniques, particularly somatic embryogenesis, to produce large numbersof plants with identical genetic background, coupled with transformation protocols for cocoatransformation. Another is the development of new methods of virus inoculation and diagnosis,prerequisites for resistance screening. Molecular cloning methods have enabled the isolation offull-length infectious clones of severe isolates from Togo and Ghana. Mild isolates of the viruswith potential uses in cross-protection have been isolated by the same method which enablesresearchers to overcome the low virus concentrations and/or low infectivity associated withthem. These have been used to infect cocoa beans and young seedlings by particlebombardment and/or Agrobacterium-mediated micro-injection. With these tools, it is nowpossible to quantify virus inoculum used in challenging new cultivars in virus disease resistancebreeding programmes. New CSSV-specific primers have been designed for disease indexingby polymerase chain reaction (PCR). Cloned virus DNA or cloned virus-coded PCR DNAproducts have also been used in virus disease indexing as labelled probes for DNA detection bySouthern (1975) or dot blot hybridisation analysis. Ultimately, it is anticipated that thecombination of new methods for generating large numbers of plants for inoculum delivery andvirus detection will facilitate the development of new pest and disease resistant varieties forsustainable cocoa production.
Importance and spread of the disease
Cocoa swollen shoot virus disease (CSSVD) was first reported in the 1930s in theeastern region of the country known then as Gold Coast, now as Ghana (Anonymous1936a and b). Since then, it has grown in importance, constituting perhaps the singlemost enduring feature of cocoa production, especially in the Eastern region, previouslythe leading producing area in Ghana (Thresh 1991). The disease also occurs withvarying degrees of severity in all cocoa producing areas of Ghana. Along the WestAfrican region, CSSVD occurs with varying degrees of importance in the Republic ofTogo, Nigeria, Cameroon and Côte d’Ivoire.
In West Africa, swollen shot disease is characterised by an array of host responsesincluding transient red vein banding in very young leaves, systemic yellow mosaic,
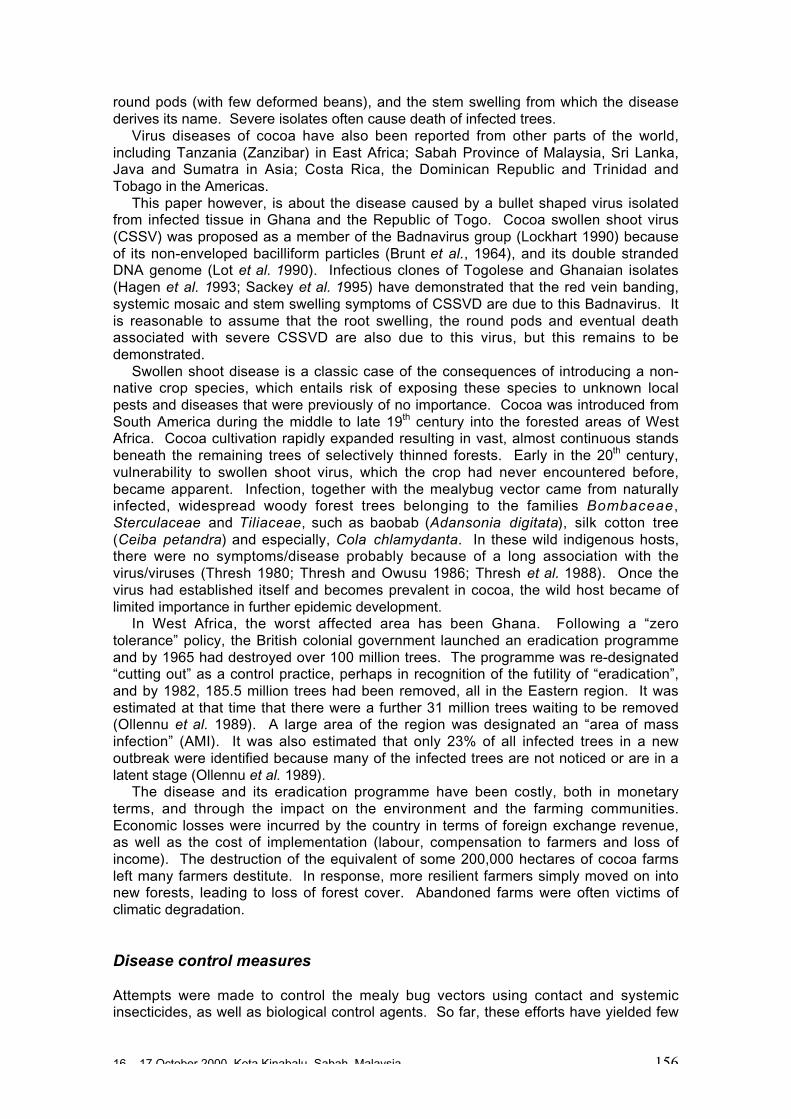
16 – 17 October 2000, Kota Kinabalu, Sabah, Malaysia 156
round pods (with few deformed beans), and the stem swelling from which the diseasederives its name. Severe isolates often cause death of infected trees.
Virus diseases of cocoa have also been reported from other parts of the world,including Tanzania (Zanzibar) in East Africa; Sabah Province of Malaysia, Sri Lanka,Java and Sumatra in Asia; Costa Rica, the Dominican Republic and Trinidad andTobago in the Americas.
This paper however, is about the disease caused by a bullet shaped virus isolatedfrom infected tissue in Ghana and the Republic of Togo. Cocoa swollen shoot virus(CSSV) was proposed as a member of the Badnavirus group (Lockhart 1990) becauseof its non-enveloped bacilliform particles (Brunt et al., 1964), and its double strandedDNA genome (Lot et al. 1990). Infectious clones of Togolese and Ghanaian isolates(Hagen et al. 1993; Sackey et al. 1995) have demonstrated that the red vein banding,systemic mosaic and stem swelling symptoms of CSSVD are due to this Badnavirus. Itis reasonable to assume that the root swelling, the round pods and eventual deathassociated with severe CSSVD are also due to this virus, but this remains to bedemonstrated.
Swollen shoot disease is a classic case of the consequences of introducing a non-native crop species, which entails risk of exposing these species to unknown localpests and diseases that were previously of no importance. Cocoa was introduced fromSouth America during the middle to late 19th century into the forested areas of WestAfrica. Cocoa cultivation rapidly expanded resulting in vast, almost continuous standsbeneath the remaining trees of selectively thinned forests. Early in the 20th century,vulnerability to swollen shoot virus, which the crop had never encountered before,became apparent. Infection, together with the mealybug vector came from naturallyinfected, widespread woody forest trees belonging to the families Bombaceae,Sterculaceae and Tiliaceae, such as baobab (Adansonia digitata), silk cotton tree(Ceiba petandra) and especially, Cola chlamydanta. In these wild indigenous hosts,there were no symptoms/disease probably because of a long association with thevirus/viruses (Thresh 1980; Thresh and Owusu 1986; Thresh et al. 1988). Once thevirus had established itself and becomes prevalent in cocoa, the wild host became oflimited importance in further epidemic development.
In West Africa, the worst affected area has been Ghana. Following a “zerotolerance” policy, the British colonial government launched an eradication programmeand by 1965 had destroyed over 100 million trees. The programme was re-designated“cutting out” as a control practice, perhaps in recognition of the futility of “eradication”,and by 1982, 185.5 million trees had been removed, all in the Eastern region. It wasestimated at that time that there were a further 31 million trees waiting to be removed(Ollennu et al. 1989). A large area of the region was designated an “area of massinfection” (AMI). It was also estimated that only 23% of all infected trees in a newoutbreak were identified because many of the infected trees are not noticed or are in alatent stage (Ollennu et al. 1989).
The disease and its eradication programme have been costly, both in monetaryterms, and through the impact on the environment and the farming communities.Economic losses were incurred by the country in terms of foreign exchange revenue,as well as the cost of implementation (labour, compensation to farmers and loss ofincome). The destruction of the equivalent of some 200,000 hectares of cocoa farmsleft many farmers destitute. In response, more resilient farmers simply moved on intonew forests, leading to loss of forest cover. Abandoned farms were often victims ofclimatic degradation.
Disease control measures
Attempts were made to control the mealy bug vectors using contact and systemicinsecticides, as well as biological control agents. So far, these efforts have yielded few
16 – 17 October 2000, Kota Kinabalu, Sabah, Malaysia 157
returns perhaps because of the paucity of basic information on these insects. It isknown that as many as 16 species of mealybugs are involved in the transmission ofCSSV, and thus biological control, for example, would require detailed studies on each.These studies are ongoing.
The World Bank in conjunction with the Government of Ghana launched two CocoaRehabilitation Projects in which cutting out was combined with block plantings usingnew cocoa introductions from the CRIG breeding programmes. The results of theseinitiatives have been presented elsewhere, but generally are dependent on co-operation of farmers, availability of improved (disease resistant/tolerant) plantingmaterial, and financial resources to implement the programmes.
The most persistent effort has, however, been the resistance breeding programmesin different producing countries, particularly, Ghana and Togo. Since CSSV is notpresent in the centre of origin of the species, there is unlikely to be any specific CSSVresistance to be exploited in the wild germplasm. This means that breeding forresistance, at best, is an attempt to bring together the properties inherent in differentcocoa genotypes that might create a barrier between the vector and host, or inhibit theinfection process of the virus. These are often physiological characteristics of theclone, including such properties as plant tissue or sap palatability to the vector, andpresence of components associated with host response (phytoalexins) to invasion byforeign substances. The main elements of the breeding programmes are therefore:
• Screening new cultivars for the relative impact of swollen shoot virus.• Crossing cultivars by hand pollination.• Screening progenies for relative impact of virus.• Combining better performing, “resistant/tolerant” parents.
In practice, breeding requires an efficient method of inoculum delivery and methodsof disease indexing. Its success is dependent on access to a wide variety of clones forscreening. There are questions for which breeders need answers. For example, howdo you know that if new promising genotypes are being introduced, that they are reallydifferent and that a significant reduction in virus impact can be obtained at farmer’slevel? Could newly introduced accessions harbour some unknown pathogen thatwould be released into your environment? How do you challenge the new clones withthe pathogen/pest of interest, and evaluate their impact in a systemic manner?
Fortunately, there are many new technologies, which can be applied to assistbreeders to answer these and many other questions. These include technologies fordisease indexing, and virus inoculum delivery in resistance screening for breeders.
Disease indexing
The role of the intermediary quarantine facilities is to reduce the risk of transferringpests and diseases as germplasm is exchanged between breeding programmes. ForCSSV, there have been several methods of disease indexing which still haverelevance. They include:• grafting,• serological methods such as ELISA) and ISEM (Adomako et al. 1983; Sagemann et
al. 1983 and 1985; Hughes and Ollennu 1993); and, more recently,• DNA hybridisation,• polymerase chain reaction (PCR), and• immuno capture polymerase chain reaction (ICPCR) (Sackey et al. 1990 and 1998;
Hoffmann et al. 1997).Increasingly, time is of essence and it is important to have definitive evidence of the
disease status of plant tissue. Enzyme linked immunosorbent assay and relatedserological techniques have been used, with monoclonal and polyclonal antiseradeveloped in collaborative research between the Cocoa Research Institute of Ghanaand the Institute for Biochemistry and Plant Virology in Brauschweig, Germany.
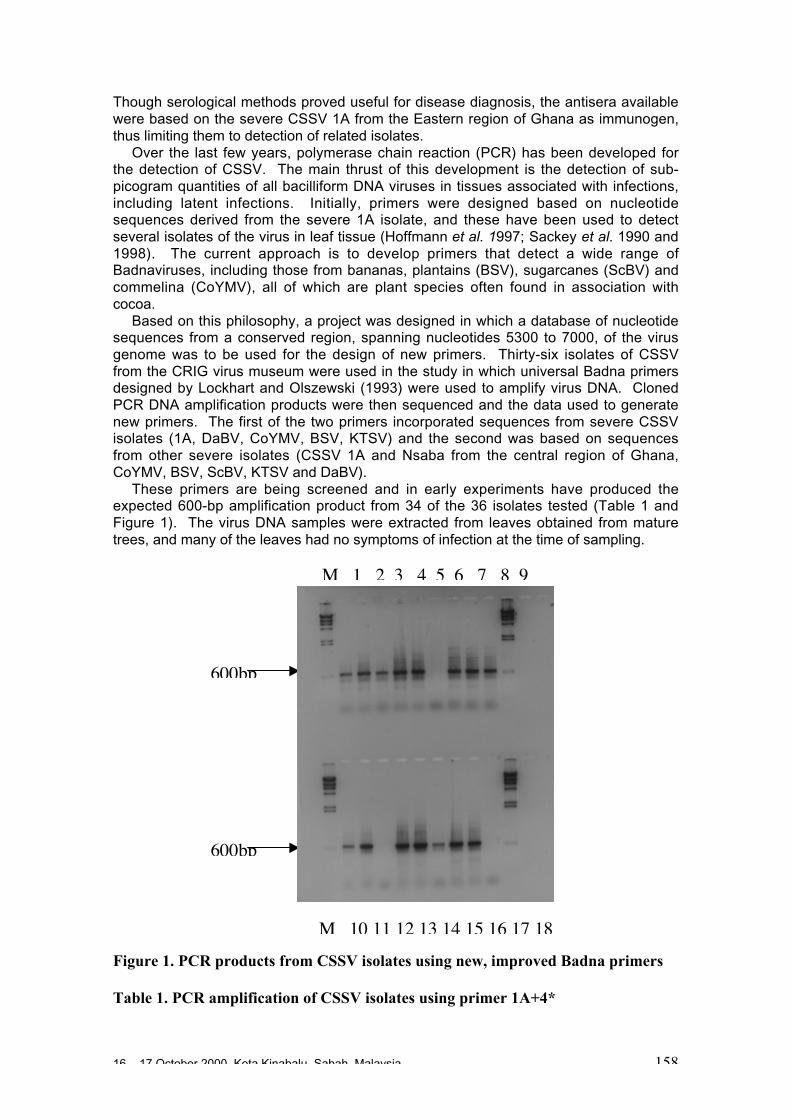
16 – 17 October 2000, Kota Kinabalu, Sabah, Malaysia 158
Though serological methods proved useful for disease diagnosis, the antisera availablewere based on the severe CSSV 1A from the Eastern region of Ghana as immunogen,thus limiting them to detection of related isolates.
Over the last few years, polymerase chain reaction (PCR) has been developed forthe detection of CSSV. The main thrust of this development is the detection of sub-picogram quantities of all bacilliform DNA viruses in tissues associated with infections,including latent infections. Initially, primers were designed based on nucleotidesequences derived from the severe 1A isolate, and these have been used to detectseveral isolates of the virus in leaf tissue (Hoffmann et al. 1997; Sackey et al. 1990 and1998). The current approach is to develop primers that detect a wide range ofBadnaviruses, including those from bananas, plantains (BSV), sugarcanes (ScBV) andcommelina (CoYMV), all of which are plant species often found in association withcocoa.
Based on this philosophy, a project was designed in which a database of nucleotidesequences from a conserved region, spanning nucleotides 5300 to 7000, of the virusgenome was to be used for the design of new primers. Thirty-six isolates of CSSVfrom the CRIG virus museum were used in the study in which universal Badna primersdesigned by Lockhart and Olszewski (1993) were used to amplify virus DNA. ClonedPCR DNA amplification products were then sequenced and the data used to generatenew primers. The first of the two primers incorporated sequences from severe CSSVisolates (1A, DaBV, CoYMV, BSV, KTSV) and the second was based on sequencesfrom other severe isolates (CSSV 1A and Nsaba from the central region of Ghana,CoYMV, BSV, ScBV, KTSV and DaBV).
These primers are being screened and in early experiments have produced theexpected 600-bp amplification product from 34 of the 36 isolates tested (Table 1 andFigure 1). The virus DNA samples were extracted from leaves obtained from maturetrees, and many of the leaves had no symptoms of infection at the time of sampling.
Figure 1. PCR products from CSSV isolates using new, improved Badna primers
Table 1. PCR amplification of CSSV isolates using primer 1A+4*
M 1 2 3 4 5 6 7 8 9M
M 10 11 12 13 14 15 16 17 18M
600bp
600bp
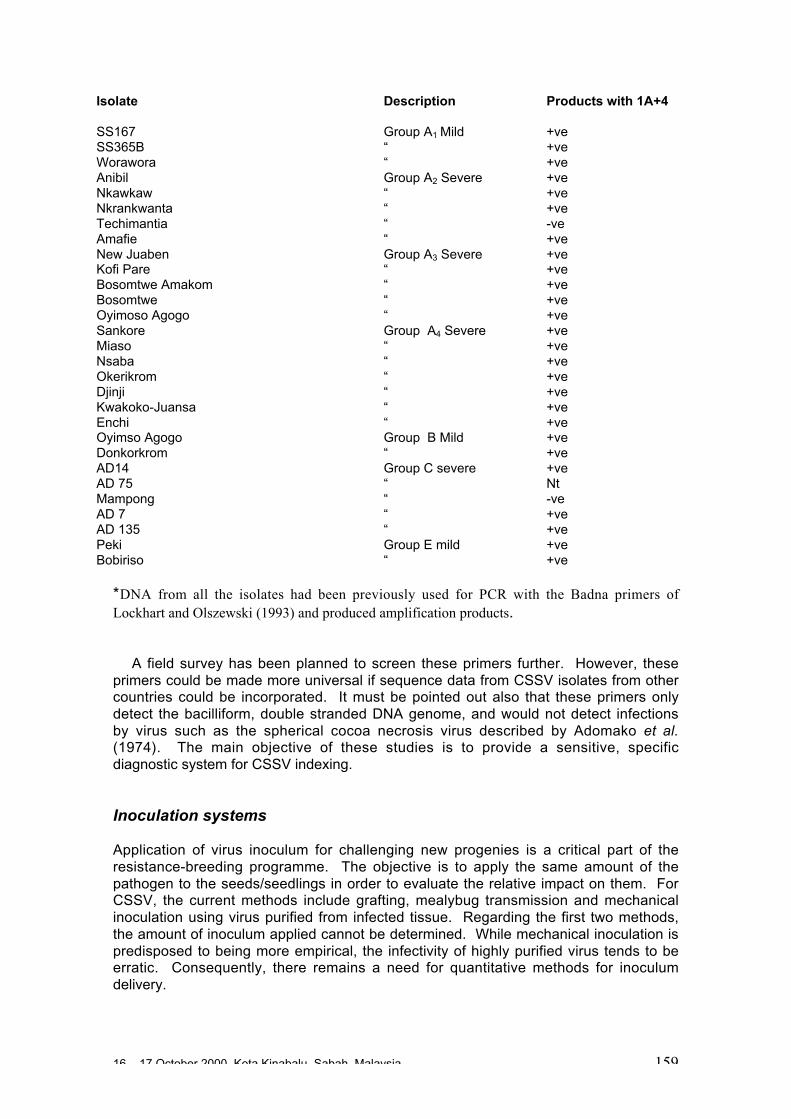
16 – 17 October 2000, Kota Kinabalu, Sabah, Malaysia 159
Isolate Description Products with 1A+4
SS167 Group A1 Mild +veSS365B “ +veWorawora “ +veAnibil Group A2 Severe +veNkawkaw “ +veNkrankwanta “ +veTechimantia “ -veAmafie “ +veNew Juaben Group A3 Severe +veKofi Pare “ +veBosomtwe Amakom “ +veBosomtwe “ +veOyimoso Agogo “ +veSankore Group A4 Severe +veMiaso “ +veNsaba “ +veOkerikrom “ +veDjinji “ +veKwakoko-Juansa “ +veEnchi “ +veOyimso Agogo Group B Mild +veDonkorkrom “ +veAD14 Group C severe +veAD 75 “ NtMampong “ -veAD 7 “ +veAD 135 “ +vePeki Group E mild +veBobiriso “ +ve
*DNA from all the isolates had been previously used for PCR with the Badna primers ofLockhart and Olszewski (1993) and produced amplification products.
A field survey has been planned to screen these primers further. However, theseprimers could be made more universal if sequence data from CSSV isolates from othercountries could be incorporated. It must be pointed out also that these primers onlydetect the bacilliform, double stranded DNA genome, and would not detect infectionsby virus such as the spherical cocoa necrosis virus described by Adomako et al.(1974). The main objective of these studies is to provide a sensitive, specificdiagnostic system for CSSV indexing.
Inoculation systems
Application of virus inoculum for challenging new progenies is a critical part of theresistance-breeding programme. The objective is to apply the same amount of thepathogen to the seeds/seedlings in order to evaluate the relative impact on them. ForCSSV, the current methods include grafting, mealybug transmission and mechanicalinoculation using virus purified from infected tissue. Regarding the first two methods,the amount of inoculum applied cannot be determined. While mechanical inoculation ispredisposed to being more empirical, the infectivity of highly purified virus tends to beerratic. Consequently, there remains a need for quantitative methods for inoculumdelivery.
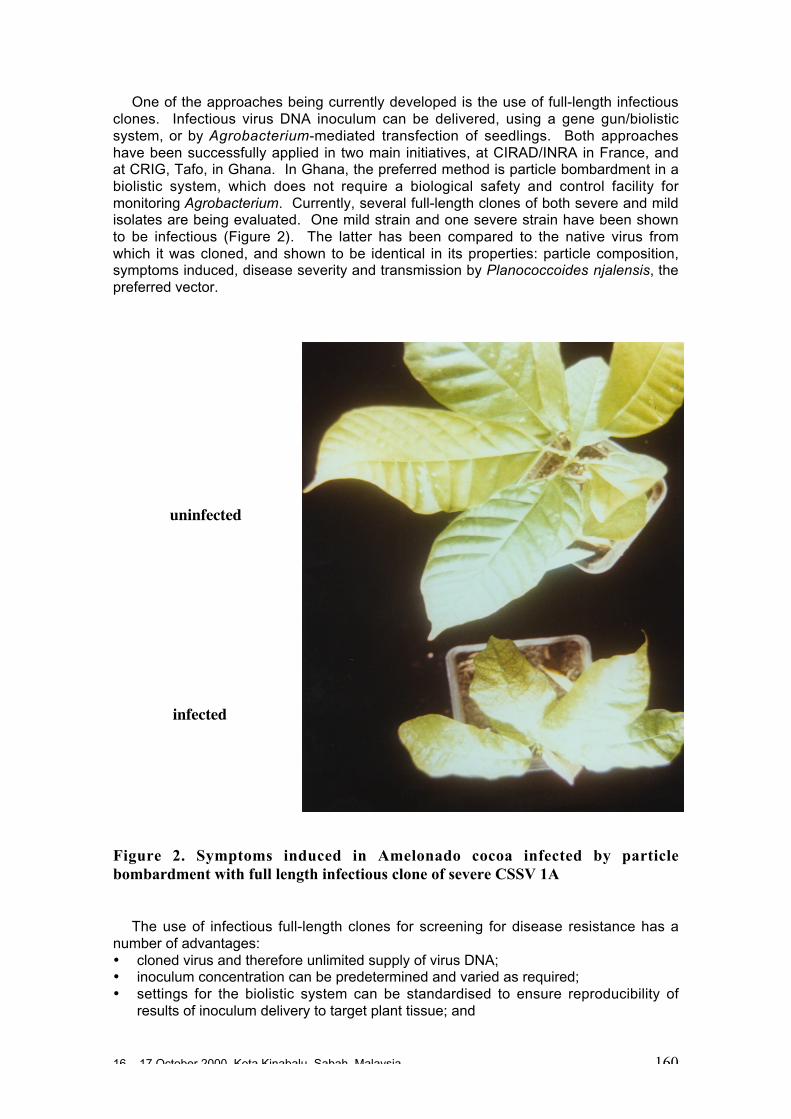
16 – 17 October 2000, Kota Kinabalu, Sabah, Malaysia 160
One of the approaches being currently developed is the use of full-length infectiousclones. Infectious virus DNA inoculum can be delivered, using a gene gun/biolisticsystem, or by Agrobacterium-mediated transfection of seedlings. Both approacheshave been successfully applied in two main initiatives, at CIRAD/INRA in France, andat CRIG, Tafo, in Ghana. In Ghana, the preferred method is particle bombardment in abiolistic system, which does not require a biological safety and control facility formonitoring Agrobacterium. Currently, several full-length clones of both severe and mildisolates are being evaluated. One mild strain and one severe strain have been shownto be infectious (Figure 2). The latter has been compared to the native virus fromwhich it was cloned, and shown to be identical in its properties: particle composition,symptoms induced, disease severity and transmission by Planococcoides njalensis, thepreferred vector.
Figure 2. Symptoms induced in Amelonado cocoa infected by particlebombardment with full length infectious clone of severe CSSV 1A
The use of infectious full-length clones for screening for disease resistance has anumber of advantages:• cloned virus and therefore unlimited supply of virus DNA;• inoculum concentration can be predetermined and varied as required;• settings for the biolistic system can be standardised to ensure reproducibility of
results of inoculum delivery to target plant tissue; and
uninfected
infected
16 – 17 October 2000, Kota Kinabalu, Sabah, Malaysia 161
• inoculum can be customised, i.e. different inocula representing the predominantsevere isolates in different cocoa areas for screening cultivars suitable to thoseareas.
The current CRIG programme in this respect is therefore to clone as many isolatesas possible from different cocoa growing districts. These would be compared by RFLPand nucleotide sequencing to determine the relationships between them. Theirbiological effect on the Amelonado host, the susceptible positive control, would also beevaluated before use. Virus clones can, in theory, be selected for screening of cocoaprogenies for different areas based on the predominant virus form in those areas.
Tissue culture
Another technology that could benefit breeders in this regard is tissue culture,particularly somatic embryogenesis. Tissue culture potentially can provide breederswith the means to rapidly multiply suitable cocoa clones. It can also be combined withnew methods for inoculum delivery (particle bombardment and Agrobacteriummediated transfection) to screen progenies or clones. When beans/seedlings arescreened, the number of samples and space required can be limiting. Screening ofsomatic embryos eliminates these limitations, allowing for large numbers of clones andreplicates to be screened. It is furthermore of interest to study the possibility, as withzygotic embryos, that the virus might be eliminated in the somatic embryogenesisprocess. This would be very useful to facilitate intermediate quarantine procedures.
Conclusion
In conclusion, there are many new emerging technologies that may be applied tovarious breeding programmes for cocoa improvement. The key to current research isincreased collaboration between institutions and scientists. Such collaboration, amongother benefits, results in a wider range of pathotypes for the development of assaysystems and sharing of information related to new techniques. Thus, for example,access to CSSV isolates from other countries in the West African sub-region wouldenable development of universal diagnostic system for detection of all Badnaviruses ofcocoa in the region where that pathogen is endemic.
Acknowledgements
Funding support for molecular cloning, PCR and biolistic inoculation was fromAmerican Cocoa Research Institute, and additional support for PCR research was fromGhana Cocoa Growing Research Association of the UK.
References
Adomako D., D.E. Lessemann and H.L. Paul. 1983. Improved method for the purification anddetection of cocoa swollen shoot virus. Ann Appl Biol. 103: 109-116.
Adomako D., G.K. Owusu and K.K. Oduro. 1974. Purification of cocoa necrosis virus fromcocoa leaves. Phytopathology 64: 1325-1330.
Anonymous. 1936a Report of the Agronomy Section, West African Cocoa Research Institute,Tafo Station. Ghana.
Anonymous. 1936b. A new disease of cocoa in the Gold Coast. Gold Coast Farmer 5: 122.Brunt A.A., R.H. Kenten and H.L. Nixon. 1964. Some properties of cocoa swollen shoot virus.
J. Gen. Microbiol. 36: 303-309.
16 – 17 October 2000, Kota Kinabalu, Sabah, Malaysia 162
Hagen L.S., M. Jacquemond, A. Lepingle, H. Lot and M. Tepfer. 1993. Nucleotide sequenceand genomic organisation of cocoa swollen shoot virus. Virology 196: 619-628.
Hoffmann K., S.T. Sackey, H.J. Vetten, E. Maisse and D. Adomako. 1997. Immunocapturepolymerase chain reaction for the detection and identification of cocoa swollen shoot virus1A isolates. J. Phytopathology 145: 205-212.
Hughes J. d'A. and L.A.A. Ollennu. 1993. The virobacterial agglutination test as a rapid meansof detecting cocoa swollen shoot virus. Ann. Appl. Biol. 122: 299-310.
Lockhart B.E.L. 1990. Evidence for a double stranded DNA genome in a second group of plantviruses. Phytopathology 80: 127-131.
Lockhart B.E. and N. Olszewski. 1993. Serological and genomic heterogeneity of bananastreak Badnavirus: Implications for virus detection in Musa plants. Pages 105-113 inBreeding Banana and Plantain for resistance to diseases and pests. (Ganry, J., ed)Proceedings of the International Symposium on Genetic improvement of bananas forresistance to diseases and pests. 7-9 September 1992. Montpellier, France. CIRAD/INIBAP.
Lot H., E. Djiekpor and M. Jacquemond. 1991. Characterisation of the genome of cacaoswollen shoot virus. J. Gen. Virol. 72: 1735-1739.
Ollennu L.A.A.., G.K. Owusu and J.M. Thresh. 1989. The cocoa swollen shoot virus eradicationcampaign in Ghana. Cocoa Growers’ Bulletin 42: 25-35.
Sackey S.T., F. Osae-Awuku and M. Manu-Boafo. 1990. Pages 145 in Annual Report of theCocoa Research Institute of Ghana, CRIG, Accra, Ghana.
Sackey S.T, S.T. Lowor, H.D-Obiatey, G.K. Owusu, D. Adomako, K. Hoffmann, H.J. Vetten andE. Maiss. 1995. Polymerase chain reaction and nucleic acid hybridisation methods for thedetection and differentiation of cocoa swollen shoot virus isolates. Pages 191-200 inProceedings of First International Cocoa Pests and Diseases Seminar, 6-10 November1995, Accra, Ghana.
Sackey S.T., N.E. Olzewski and B.E.L. Lockhart. 1998. (In press) Isolation of CSSV genomicspecies by molecular cloning: prospects for application to mild strain cross protection. InProceedings of the 2nd International Cocoa Pests and Diseases Seminar, 19-24 January1998, Yamoussoukro, Côte d’Ivoire.
Sagemann W., H.L. Paul, D. Adomako and G.K. Owusu. 1983. The use of enzyme linkedimmunosorbent assay (ELISA) for detection of cacao swollen shoot virus (CSSV) inTheobroma cacao. Phytopath. Z. 106: 281-284.
Sagemann W., D.E. Lesemann, H.L. Paul, D. Adomako and G.K. Owusu. 1985. Detection andcomparison of some Ghanaian isolates of cacao swollen shoot virus (CSSV) by enzymelinked immunosorbent assay (ELISA) and immunoelectron microscopy (IEM) using anantiserum to CSSV strain 1A.. Phytopath. Z. 144: 79-89.
Thresh J.M. 1980. The origins and epidemiology of some important plant virus diseases. Ann.Appl. Biol. 5: 1-65.
Thresh J.M. 1991. The ecology of tropical plant viruses. Plant Pathology 40: 324-339.Thresh J.M. and G.K. Owusu. 1986. The control of cocoa swollen shoot disease in Ghana: an
evaluation of eradication procedures. Crop Protection 5: 41-52.Thresh J.M., G.K. Owusu and L.A. Ollennu. 1988. Cocoa swollen shoot: an archetypal crowd
disease. J. Plant Disease 95: 428-446
16 – 17 October 2000, Kota Kinabalu, Sabah, Malaysia 163
Recent Advances in the Tissue Culture of Cocoa from SomaticEmbryos to Bentwood Gardens - a Short Review
Mark J. Guiltinan and Siela Maximova
ACRI Molecular Biology Laboratory, Tyson Building, The Pennsylvania State University,University Park, PA, 16802 ([email protected], [email protected])
Abstract
An efficient in-vitro clonal propagation method for cocoa has been developed (somaticembryogenesis, SE) through the efforts of an international group of cocoa researchers. Theintent of this manuscript is not to cover all aspects of the field or its history, but to review recentresults. This review includes information from papers presented at the 3rd INGENIC Workshopand the 13th International Cocoa Research Conference, both of which were held in KotaKinabalu, Malaysia in October 2000. Recent progress has shown that while primary somaticembryos arise from a multi-cellular pathway, secondary somatic embryos arise predominantlyfrom single cells. Secondary somatic embryos also exhibit a higher quality and conversion ratecompared to primary somatic embryos as well as a higher production rate for most genotypes.Variations in hormonal and other treatments were reported, and significant differences ingenotypic response observed. It was estimated that about 100 different genotypes have beensuccessfully propagated via somatic embryogenesis, in approximately nine laboratoriesworldwide. Several reports discussed the development of low cost, SE-coupled downstreampropagation systems, including mini-cuttings and bentwood gardens, capable of multiplying theSE plants and producing orthotropic rooted cuttings. These systems hold great potential forresearch and production, however full validation of such plants awaits the results of long-termfield-testing now underway.
Introduction
Since the early work of cocoa researchers, vegetative propagation systems have beenan important tool, enabling the multiplication of wild or selected genotypes forgermplasm collection, distribution and for production of clonal materials for replicateperformance trials. While traditional rooted cutting and grafting systems have beenused throughout the world for propagation of cocoa, to date, a vast majority ofproduction stock is grown from seed. Due to the high heterozygosity of most cocoagenotypes, this results in a large degree of yield and resistance variation, bringing themean yield well below that of individual, high yielding and/or disease resistantindividuals. For example, over a four-year survey period of yield data from Costa Ricanhybrid varieties, Irizarry and Rivera (1998) showed that 3% of the plants produced over60% of the yield. In the past, researchers and nurserymen turned to rooted cuttingsand grafting techniques to develop clonal propagation systems. These systems usepredominantly plagiotropic cuttings, since this type of material is much more abundantin the field, but these cuttings do not grow orthotropically, nor will they produce ataproot. In some cases, this may present problems with water deficit and anchorageduring drought or in high winds, especially during plantlet establishment.
In the 1950’s and 1960’s, plant tissue culture methods were developed for thepropagation of a wide variety of species, but were not applied to cocoa until the late1970’s and even then with only limited success. Recently, research conducted at anumber of laboratories worldwide has led to the development of efficient methods forsomatic embryogenesis (SE) of cocoa. The first report of cocoa SE by Esan (1975)described a method using immature zygotic embryo tissue explants, similar methodswere henceforth reported by others (Pence, et al. 1979, Villalobos and Aguilar 1990).
16 – 17 October 2000, Kota Kinabalu, Sabah, Malaysia 164
However, while a step forward, these methods do not reproduce clonal plants.Subsequent efforts were directed towards the development of tissue culture systemsvia different sporophytic tissues including leaves (Litz 1986), nucellus (Chatelet et al.1992; Figueira and Janick 1993; Sondahl et al. 1993) and floral explants includingpetals and staminodes (López-Baez et al. 1993, Alemanno et al. 1996a, Alemanno, etal. 1996b, Alemanno et al. 1997). However, these systems were limited by genotypicvariability and low plant conversion rates. More recently an efficient SE system usingstaminode and petal explants, which is capable of propagating a wide variety of cocoagenotypes with high efficiency, was reported (Li et al. 1998).
In addition to somatic embryogenesis, a number of related in vitro, and ex vitropropagation systems have also been developed, combining the power of tissue culturewith the simplicity of rooted cuttings. The intent of this manuscript is not to cover allaspects of this field of research nor its history, but to review recent advances in cocoatissue culture, ex vitro performance, and multiplication of plants produced by thismethod. This review includes information from papers presented at the 3rd INGENICWorkshop and at the 13th International Cocoa Research Conference held in October2000, Kota Kinabalu, Malaysia. Apologies are extended to those left out, if any.
But first a precautionary note. While the propagation methods reviewed hereare potentially very powerful, it should be noted that they are relatively newtechnologies that have yet to be fully evaluated in the field. Although early field andgreenhouse tests have been very promising, the use of somatic embryo derived plantsfor large-scale propagation and production must clearly await full validation throughmulti-locational field trails with multiple genotypes. Such trials are now underway inseveral countries, but until fully evaluated, we must regard these new technologies asresearch tools.
Recent advances in cocoa embryogenesis
During the past two years, researchers at the Penn State Cocoa Molecular BiologyLaboratory have continued to refine the somatic embryogenesis procedure developedin 1998, and to investigate the cellular origins and developmental pathways operativein this system. We have developed a secondary embryogenesis system, in whichexplants from primary somatic embryos are re-cultured on induction media, andsecondary embryos are formed (Maximova et al. 2000). The morphological andultrastructural changes occurring over time during both primary and secondary cocoasomatic embryogenesis were studied by Dr. Siela Maximova of Penn State incollaboration with Dr. Laurence Alemanno of CIRAD, using a combination of electronand light microscopy for the genotype Scavina 6 (Alemanno et al. 2000). This analysisshowed that primary embryos arise predominantly from clusters of cells which co-operatively form embryonic nodules perhaps resulting from complex interactions ofhundreds of cells. Interestingly, secondary embryos usually arise from the division ofsingle epidermal cells, in a pathway reminiscent of zygotic embryogenesis. Thus, thetwo types of embryos originate through pathways that differ in the number and locationof the cells contributing to embryo formation. One manifestation of these twodevelopmental pathways is the resulting conformity of embryo morphology. In bothsystems, not all embryos formed are "normal" shaped with a single well-defined axisand balanced root/shoot symmetry. Sometimes fused embryos or embryos with otherabnormalities are observed. However, as might be predicted in retrospect, secondaryembryos, which arise from a uni-cellular origin, exhibit a higher rate of normal embryoconformity (approximately 85%) than do primary embryos (approximately 18%).Another striking difference reported was the number of embryos produced per explantin each of the systems. Secondary embryos were produced at a much higher rate(average 70 per cotyledon explant) than were primary embryos (average 17 perstaminode explant). Secondary embryos also performed better than primary embryos
16 – 17 October 2000, Kota Kinabalu, Sabah, Malaysia 165
during the conversion step, when embryos begin to grow into plantlets capable ofautotrophic growth in soil, with approximately 55% success compared to a rate of 32%for primary embryos.
The influence of genotype on efficiency and conformity was also examined, andshown to have a strong influence, with up to ten-fold differences in embryogenicpotential between genotypes observed. However, this research has shown that nearlyevery genotype tested to date has produced at least a minimal number of somaticembryos, and that these can then be used for secondary embryogenesis to scale upproduction. Another contrast in the cellular morphology observed between the twopathways was the difference in plasmodesmatal frequency. Epidermal cells withinstaminodes (the tissue explants for primary embryogenesis) have moreplasmodesmata than do epidermal cells of cotyledons from primary embryos (thesource of tissue for secondary embryo production). It is possible that the higher level ofintercellular connections seen in staminode tissues is in part responsible for the higherdegree of cellular co-ordination seen in primary embryogenesis as compared tosecondary embryogenesis, but this hypothesis awaits experimental testing. This studyconcluded that, despite the losses due to abnormal embryos and during the conversionprocedure, it is theoretically possible to produce over 4,000 secondary embryo derivedplants from a single flower in approximately one year (using Scavina 6).
This method of producing plants is currently estimated to cost approximately$10 per plant, using US based labour costs. One possibility to reduce this high costwould be to couple the tissue culture based systems to downstream, greenhouse orfield based, low cost classical propagation systems. One such system presented bythese authors utilises the concept of ‘Bentwood Gardens’ (Guiltinan et al. 2000a;Guiltinan et al. 2000b). In this system, the stems of juvenile somatic embryo plants,approximately 3-4 feet in height, are bent and secured in a horizontal position. Thisreleases the strong apical dominance normally exhibited by cocoa plants and results inthe outgrowth of the previously dormant meristems in the lower portion of the plant,typically resulting in the growth of approximately five shoots per plant. After about twomonths, each shoot can be excised, and about ten nodal cuttings produced and rootedusing well-known conventional methods in a greenhouse. The bent plant will thencontinue to produce more shoots, which can be harvested repeatedly for long periodsof time. The rooted cutting will grow with the orthotropic architecture of a normalseedling plant. Importantly, these plants also exhibit a strong dominant root, orperhaps two, which grow straight down in a similar way to a taproot. This is quitedifferent from rooted cuttings developed from plagiotropic or fan branch materials,which form shallow, fibrous root systems without a taproot. Using this system, nearly250 plants can be produced from each somatic embryo plant per year, greatly reducingthe cost per plant compared to use of tissue culture alone. The development of plantsproduced by this method is still under evaluation.
Smilija Lambert of Mars Inc. presented work performed at the Almirante Centrefor Cocoa Studies in collaboration with researchers from Penn State (Lambert et al.2000). She described a system for downstream propagation of somatic embryo plantsreferred to as mini-cuttings. In these experiments, the team used small tissue culturedplantlets, acclimated to greenhouse conditions, as sources of apical cuttings whichwere then rooted and grown in the greenhouse for three to four months after whichthey were ready for transfer to the field. Very high success rates were obtained. Similarto the Bentwood technique described above, the original stock plants continue toproduce orthotropic shoots from which additional cuttings can be made. This is anothersystem that provides a rapid way to produce large numbers of orthotropic plantlets at alower cost than tissue culture alone.
During the 3rd INGENIC workshop, Dr. Lopez Baez from the State University ofChiapas, Mexico presented the results of recent work using modified MS salts basedme dia (López-Baez et al. 2000). Differing from the hormonal system used by thePenn State method, 2,4-D or 2,4,6-T (1 mg/l) and kinetin (0.26 mg/l) were used for
16 – 17 October 2000, Kota Kinabalu, Sabah, Malaysia 166
induction of embryogenesis, and this system successfully produced embryos fromtwelve different genotypes with success rates varying between 20% and 41%. Glucoseand sucrose concentrations used were between 50 mg/l and 80 mg/l. A cold shocktreatment of the flowers prior to culture, consisting of exposure to 0°C for 15 or 20 minand 5°C for 120 min, was shown to enhance embryogenesis efficiency.
Dr. Douglas Furtek presented research conducted at the Malaysian CocoaBoard which also examined the different factors affecting somatic embryogenesis ofcocoa (Furtek et al. 2000; Tan et al. 2000). This group tested interactions betweendifferent genotypes, carbon sources, basal media and plant growth regulators. Thirtyclones were evaluated for their potential to produce somatic embryos. The percentageof calli producing embryos ranged from 0% to 18.2%. It was determined that differentclones vary in their response to given carbohydrate sources, plant growth regulators orbasal media. The results indicated that it may be necessary to optimise the procedurefor the individual genotype of interest in order to obtain the highest success rates.Similar to the results reported by other researchers, normal and abnormal embryoswere also observed using this procedure. Seven different clones produced 18 embryosof normal appearance that have been converted into plantlets and transferred to pots.
The research group in the University of Yaounde, Cameroon, investigated thedifferences between embryogenic and non-embryogenic callus at the biochemical level(Niemenak et al. 2000). The results presented by Dr. Niemenak at the 13th
International Cocoa Research Conference demonstrated levels of activities ofperoxidase and IAA-oxidase three to five times higher in embryogenic callus comparedto non-embryogenic callus. The highest peroxidase activity was detected in the solublefractions and the highest IAA-oxidase activity was detected in the ionic enzymaticfraction. The tissue culture media used in the course of this study were: MS/2 and 2,4-D/Kinetin (2/0,5 mg/l)for callus induction with 57% success and MS/2 and IBA at 2 mg/lfor embryo development, with 25% success.
Technology transfer and field test establishment
Beginning in March of 2000, a Penn State research associate, living in Africa, hasworked to establish the cocoa embryogenesis system in Ghana and Ivory Coast. Thework, although initially hindered by some difficult conditions and malfunctioningequipment, has been successful, and the first plants propagated via somaticembryogenesis and micropropagation have been produced and acclimated, and willsoon be planted in the field in both countries. At the end of the first year, there weremore than 800 somatic embryos produced in Ivory Coast and more than 400 embryosin Ghana. With support from Sustainable Tree Crop Program, USAID during 2001, thetechnology will also be also transferred to scientists in Cameroon and Nigeria. Fieldtest sites have also been established in St. Lucia and Brazil, and are planned for othercountries. Scientists from over eight different countries have participated in technologytransfer workshops.
Conclusion
Systems for cocoa somatic embryogenesis have now been well developed in a numberof laboratories worldwide, and technology transfer will ensure the spread of thetechnique to producing countries in the future. The two basic systems forembryogenesis induction in use (one 2,4-D based and the second TDZ based), resultin embryo production but some differences in efficiencies are apparent. The DKWbasal salts media appears to be superior to MS media for cocoa tissue culture, andalthough modifications of MS have given adequate results, most laboratories have now
16 – 17 October 2000, Kota Kinabalu, Sabah, Malaysia 167
switched to DKW based media. Downstream variants of rooted cutting systems havebeen developed, which offer the possibility of cost reductions on a per plant basis. Fieldtests of plants produced by these methods are necessary to fully validate the systemsfor use in large-scale propagation systems. These methods hold great promise for thefuture of cocoa genetic improvement and production by contributing to the ability topropagate elite genotypes rapidly for research and production. The tissue culturesystem may also be further developed to include disease indexing, useful forproduction of clean stock, for international germplasm exchange, for cryopreservationand for germplasm conservation.
References
Alemanno L., M. Berthouly and N. Michaux-Ferrière. 1996a. Embryogenèse somatique ducacaoyer à partir de pièces florales. Plantations Recherche Développement 3: 225-237.
Alemanno L., M. Berthouly and N. Michaux-Ferrière. 1996b. Histology of somaticembryogenesis from floral tissues cocoa. Plant Cell, Tissue and Organ Culture 46: 187-194.
Alemanno L., M. Berthouly and N. Michaux-Ferrière. 1997. A comparison between Theobromacacao L. zygotic embryogenesis and somatic embryogenesis from floral explants. In VitroCell. Dev. Bio. Plant. 33: 163-172.
Alemanno L., S. Maximova, N. Ferrier and M.J. Guiltinan. 2000. Comparison del'embryogenèse somatique primaire et secondaire: évaluation de l'efficacité et ontogenèsedes embryons somatiques. In Proceedings of 13th Int. Cocoa Research Conf., KotaKinabalu, Sabah, Malaysia.
Chatelet P., N. Michaux-Ferrière and P. Dublin. 1992. Potentialités embryogènes du nucelle etdu tégument interne de graines immatures de cacaoyer (Theobroma cacao L.). CR AcadSci Paris 315: 55-62.
Esan E.B. 1975. Tissue culture studies on cacao (Theobroma cacao L.). Pages 116-125 inProceedings of 5th Int. Cocoa Research Conf. Ibadan, Nigeria.
Figueira A. and J. Janick. 1993. Development of nucellar somatic embryos of Theobromacacao. Acta Horticulturae, In Vitro Culture 336: 231-238.
Furtek D., R. Kasran, C.L. Tan, L. Johnsiul, A. Mohammed, V. Hartney, M.M. Yusof, K. Laminand L.M. Tong. 2000. Biotechnology research by the Malaysian Cocoa Board. In Abstr. 3rd
INGENIC Workshop on the New Technologies and Cocoa Breeding, Kota Kinabalu, Sabah,Malaysia.
Guiltinan M., C. Miller, A. Traore and S. N. Maximova. 2000a. Greenhouse and field evaluationof orthotropic cacao plants produced via somatic embryogenesis, micro and macro-propagation. In Proceedings of 13th Int. Cocoa Research Conf., Kota Kinabalu, Sabah,Malaysia.
Guiltinan M., S.N. Maximova, A. Traore, C. Miller, M. Robinson, G. Antunez de Mayolo,E. Barreto, A. Young and S. Pishak. 2000b. Integrated systems for the propagation ofcacao: tissue culture, bentwood gardens and rooted cuttings. In Abstr. 3rd INGENICWorkshop on the New Technologies and Cocoa Breeding, Kota Kinabalu, Sabah, Malaysia.
Irizarry H. and E. Rivera. 1998. Early yield of five cacao families at three locations in PuertoRico. J. Agric. Univ. P.R. 82 (3-4): 163-171.
Lambert S.V., M. Guiltinan, S. Maximova and W.M. Aitken. 2000. Ex vitro propagation ofacclimated somatic embryo derived cocoa plants. In Proceedings of 13th Int. CocoaResearch Conf., Kota Kinabalu, Sabah, Malaysia.
Li Z., A. Traore, S. Maximova and M.J. Guiltinan. 1998. Somatic embryogenesis and plantregeneration from floral explants of cacao (Theobroma cacao L.) using thidiazuron. In VitroCell. Dev. Biol. Plant 34: 293-299.
Litz R.E. 1986. Tissue culture studies with Theobroma cacao. Pages 111-120 in: (Dimick, P.S.,ed) Cacao biotechnology symposium, Tropical Research and Education Center: University ofFlorida, IFAS Department of Food Science, College of Agriculture, The Pennsylvania StateUniversity.
López-Baez O., H. Bollon, A.B. Eskes and V. Pétiard. 1993. Embryogenèse somatique decacaoyer Theobroma cacao L., à partir de pièces florales. CR Acad Sci Paris 316: 579-584.
16 – 17 October 2000, Kota Kinabalu, Sabah, Malaysia 168
López-Baez O., J.L. Moreno-Martinez and S. Pacheco-Rodas. 2000. Advances in cocoaTheobroma cacao propagation by somatic embryogenesis in Mexico. In Abstr. 3rd INGENICWorkshop on the New Technologies and Cocoa Breeding, Kota Kinabalu, Sabah, Malaysia.
Maximova S.N., L. Alemanno, A. Young, A. Traore, N. Michaux-Ferrière and M. Guiltinan. 2000.Efficiency, origin and quality of cacao somatic embryogenesis. In Proceedings of 13th Int.Cocoa Research Conf., Kota Kinabalu, Sabah, Malaysia.
Niemenak N., P.F. Djogoue, G. Tsala Ndzomo and D. Omokolo Ndoumou. 2000. Activitésperoxydasique et auxine-oxidasique de l'embryogenèse somatique in vitro chez Theobromac a c a o L. In Proceedings of 13th Int. Cocoa Research Conf., Kota Kinabalu, Sabah,Malaysia.
Pence V.C., P.M. Hasegawa and J. Janick. 1979. Asexual embryogenesis in Theobroma cacaoL. J. Amer. Soc. Hort. Sci. 104: 145-148.
Sondahl M.R., S. Liu, C. Bellato and A. Bragin. 1993. Cacao somatic embryogenesis. ActaHorticulturae 336: 245-248.
Tan C.L., M.R. Davey, K.C. Lowe, J.B. Power and D.B. Furtek. 2000. A study on the factorsaffecting somatic embryogenesis in Theobroma cacao L. In Proceedings of 13th Int. CocoaResearch Conf., Kota Kinabalu, Sabah, Malaysia.
Villalobos V. and M.E. Aguilar. 1990. Plant regeneration of cacao (Theobroma cacao L.) bymicro-grafting somatic embryos. In Abstr. VIIth Int. Congr Plant Tissue and Cell Culture,Amsterdam, Assoc. for Plant Tissue Culture 140.
16 – 17 October 2000, Kota Kinabalu, Sabah, Malaysia 169
Avanzos en Propagación de Cacao - Theobroma cacao - porEmbriogénesis Somática en México
Orlando López-Baez, Jose Luis Moreno-Martinez y Sonia Pacheco-Rodas
Facultad De Ciencias Agricolas, Universidad Autonoma De Chiapas, Apartado Postal 34,Tapachula, Chiapas, 30700 Mexico
Resumen
El cacao es uno de los cultivos que está íntimamente ligado a la tradición y la cultura Mexicanay es uno de los productos domesticados por los antiguos habitantes de México. Las técnicasde propagación son importantes en este cultivo ya que de estas depende el éxito o el fracasode la productividad de las plantaciones. El mejoramiento de la propagación vegetativa de estaespecie es de gran importancia debido a que las técnicas hortícolas actualmente disponibles noalcanzan a cubrir la demanda de plantas requeridas para la renovación de las plantacionesestablecidas. Dado el potencial que representa la embriogénesis somática para la clonacióndel cacao, en diversos centros de investigación del mundo se desarrollan experienciastendientes a su perfeccionamiento. En esta comunicación se presentan resultados deexperiencias desarrolladas con la finalidad de adaptar un protolo previamente desarrollado a laclonación de genotipos seleccionados en México. Los factores estudiados fueron el efecto dereguladores del crecimiento auxinas y citoquininas, azúcares, sales minerales y pretratamientosa bajas temperaturas de explantes antes de la siembra. Como explantes se utilizaron piezasflorales (pétalos, estaminodios, filamentos de anteras) que fueron tratados y cultivados deacuerdo a un protocolo desarrollado previamente. Los mejores resultados de inducción detejido embriogénico se obtuvieron en explantes cultivados en el medio nutritivo “MS”modificado, enriquecido con glucosa 50g/l y ajustandose a un pH de 5,5. La mejor composiciónhormonal favorable a la inducción en el medio de inducción primario resultó de lascombinaciones de 2,4,5-T (1mg/l) o 2,4-D (1mg/l) + kinetina (0,25mg/l) durante 3 semanas. Enel medio secundario para la expresión de la embriogénesis se determinó que la presencia dereguladores de crecimiento no es necesaria para la obtención de tejido embriogénico. Lospretratamientos de bajas temperaturas a los botones florales antes de la siembra queresultaron favorables al proceso de embriogénesis fueron una incubación durante 15 a 20 mina una temperatura de 0 oC y de 30 y 120 min a una temperatura de 5 oC. El protocolomodificado fue aplicado al cultivo de explantes de 12 genotipos Mexicanos, algunos de ellosconsiderados recalcitrantes, los resultados obtenidos fueron positivos ya que se logró lainducción de tejido embriogénico en todos los genotipos evaluados, con una tasa deembriogénesis que varió de 1,09% al 41%. De estas experiencias se concluye que lacapacidad embriogénica es el resultado de la interacción del genotipo del explante, del balancehormonal y de la composición mineral y energética del medio de cultivo en el medio primario deinducción de la embriogénesis.
Advances in Cocoa - Theobroma cacao - Propagation bySomatic Embryogenesis in Mexico
Abstract
Cocoa is one of the crops that it is intimately linked to Mexican tradition and culture. It is one ofthe products that was domesticated by the ancient inhabitants of Mexico. Propagationtechniques are important in cocoa cultivation since success or failure of the plantations isdependent on such techniques. The improvement of micropropagation is of great importancedue to the fact that the currently available horticultural techniques do not cover the demandrequired for the renovation of the established plantations. In this communication, we presentresults from a series of modifications to a previously developed protocol for regenerationthrough somatic embryogenesis, and the application of the improved protocol to selected
16 – 17 October 2000, Kota Kinabalu, Sabah, Malaysia 170
genotypes in Mexico. Explants were derived from floral parts (petals, staminodes and antherfilaments) that had been treated and cultivated according to the previously developed protocol.The control culture medium, known to give good results for the induction of embryogenic calli,was a modified MS medium enriched with glucose 50 g/l and with the pH adjusted to 5.5. Thisculture medium was modified to include various carbohydrate sources, minerals and growthhormones to investigate their effect on the induction of embryogenic calli. Glucose atconcentrations of 50 and 60g/l and saccharose to 80g/l resulted in the highest frequency ofembryogenic calli. Auxins (2,4,5-T or 2,4-D at 1mg/l) and kinetin (0,25mg/l) also increased thefrequency of somatic embryogenic calli. However, it was established that the presence ofgrowth regulators is not necessary for embryogenesis expression in the secondary medium.The pretreatment of floral explants before the in vitro culture at temperatures of 0oC for 15 or 20minutes, or at 5 oC for 120 minutes resulted in a increase in the percentage of embryogenic calliformed. These results allowed us to modify the original protocol for embryogenesis and test thismodified version on explants from 12 genotypes, some of which are considered as recalcitrant.The rates of embryogenesis obtained varied between 1 and 41%. We conclude thatembryogenic capacity is a result of the interaction between the genotype of the explant, thehormonal balance and the mineral and carbohydrate composition of the primary culture mediumused to induce embryogenesis.
Introducción
El cacao es un cultivo perenne, alógamo y tropical, del cual en México son cultivadas90 000 ha distribuidas 60 000 en Tabasco y 30 000 en Chiapas, la producción anual seestima en 43 000 ton de cacao seco. De este cultivo se benefician de manera directa35 000 familias de las que 12 000 se encuentran en Chiapas y 23 000 en Tabasco.
Entre los factores que limitan la producción del cacao en México destacan:• la presencia de la enfermedad “mancha negra” del fruto (Phytophthora palmivora),• el cultivo de variedades de bajo potencial productivo,• la edad avanzada de las plantaciones, ya que se estima que aproximadamente el
80% tienen más de 40 años y el deficiente manejo agronómico de las mismas.Como resultado de investigaciones en el mejoramiento genético, existe material
seleccionado con rendimientos superiores a una ton/ha de cacao seco y de altaresistencia a la mancha negra; este material constituye la base del programa derenovación de plantaciones emprendido por el gobierno mexicano desde 1996. Parala producción masiva de plantas de clones mejorados de cacao, actualmente seaplican las técnicas de injertado en plántula y el enraizamiento de ramas; sin embargo,a pesar de la eficiencia de estas técnicas, no se alcanza a cubrir la demanda deplantas requeridas para la renovación de las plantaciones, que tan solo para el estadode Chiapas son del orden de cinco millones de plantas al año.
En el ámbito agronómico, se reconoce que el cacao es una especie difícil depropagar vegetativamente; esta dificultad no es exclusiva de la cacaocultura mexicana,ya que la clonación del cacao es reconocida como una limitante a nivel mundial por loque las investigaciones que se desarrollan en diferentes centros de investigación seorientan al perfeccionamiento de las técnicas de clonamiento ya disponibles como son:el injertado convencional, el enraizado de ramas, el microinjertado en plántula y laaplicación de nuevas tecnologías como la propagación mediante el cultivo de tejidos invitro (Aguilar et al. 1993; Yow y Lim 1994; Flores y Vera 1995; López 1997).
La embriogénesis somática in vitro como via de propagación es elprocedimiento que permite la obtención de embriones a partir de tejido somático, esdecir, sin la intervención de células gameticas. Los embriones obtenidos por esta víallamados “somáticos” presentan una morfología y un desarrollo similares a losembriones obtenidos por la fecundación, pero contrariamente a estos, tienen laparticularidad de presentar una estructura genética idéntica a la de la planta de origen(López 1996). En el caso del cacao, desde hace ya algunos años, se han venidodesarrollando investigaciones concernientes a la propagación in vitro. La primera
16 – 17 October 2000, Kota Kinabalu, Sabah, Malaysia 171
obtención de embriones somáticos aunque sin la obtención de plantas de cacao fuereportada por Esan (1977) a partir de explantes de embriones cigoticos inmaduros;esta aptitud fue posteriormente confirmada por otros autores (Kononowicz et al. 1984;Adu-Ampomah et al.1988; Lizt 1986; Sondahl et al. 1988, Chatelet et al. 1992; Penceet al. 1989). Con sus investigaciones, demostraron la potencialidad de diferentesexplantes somáticos como las hojas, las nucelas, el tegumento interno del ovario y delos pétalos.
Los resultados obtenidos por López y colaboradores (1993; 1996) mostraron laposibilidad de inducción de tejido con aptitud embriogénica asi como el desarrollo delos embriones somáticos y de plantas aptas al cultivo, a partir del cultivo in vitro depétalos, estaminodios y filamentos de anteras; una consideración a tomar en cuenta esque este protocolo fue desarrollado trabajando con genotipos del grupo genéticoForastero. La inducción de embriogénesis es efectuada en un medio sólidocomplementado con los reguladores del crecimiento 2,4-D y kinetina seguida de unafase de expresión en un medio sin reguladores. Para su desarrollo, los embrionessomáticos son sucesivamente cultivados en medios de maduración, germinación y deconversión de plántulas, después del cual son transferidos a invernadero paraaclimatación. La eficiencia de este protocolo ha sido superior tanto en cantidad comoen calidad de la embriogénesis, a los reportados anteriormente para cacao.
La conformidad genética ex vitro de las plantas obtenidas por esta vía ha sidoevaluada por López et al. (1996) a través del estudio del nivel de ploidia del ADNnuclear de plantas regeneradas por embriogénesis somática con el protocoloanteriormente señalado; los resultados obtenidos indican que no hubo modificación delnivel de ploidia y del contenido de ADN nuclear en el proceso de embriogénesissomática. El hábito de crecimiento y de desarrollo de las plantas obtenidas parecenormal y el comportamiento reproductivo de las plantas es similar a las obtenidas desemilla.
No obstante, la reproducción de este protocolo bajo condiciones de paísesproductores de cacao y con genotipos diferentes ha resultado difícil (Alemanno 1995;López et al. 1997a) por lo que debido al enorme interés que representa la aplicación agran escala de esta vía a la propagación del cacao se ha considerado de vitalimportancia desarrollar investigaciones para su perfeccionamiento y adecuación a lascondiciones y genotipos, como es el caso de México y de otros centros deinvestigación.
De lo expuesto anteriormente se deduce que a pesar de que existen técnicas declonación actualmente disponibles para la producción masiva de plantas de cacao,estas no son suficientes para abastecer la demanda; y a nivel mundial se reconoce lanecesidad de desarrollar técnicas más eficientes para la propagación masiva deárboles de cacao de alto valor agronómico e industrial.
Por otra parte, desde el punto de vista del mejoramiento genético, la clonación delcacao se considera la próxima etapa necesaria para optimizar la explotación de losbeneficios directos de un genotipo seleccionado o creado para responder anecesidades diversas como son la resistencia a parásitos, altos rendimientos, altacalidad chocolatera (López 1996).
En el caso particular de México, existe el interés por desarrollar a nivel comercial lapropagación in vitro, ya que de acuerdo a la experiencia de otros cultivos, estapresenta un potencial mayor para la multiplicación de genotipos seleccionados. Losavances obtenidos al presente en la obtención de tejido embriogénico y el desarrollode plantas a partir de este tejido, permiten disponer de un protocolo de propagación anivel experimental de embriogénesis somática que necesita ser adecuado a losgenotipos de interés asi como perfeccionado en sus diferentes etapas a fin de quepueda ser aplicado a la escala comercial. Tomando en cuenta los puntos anteriores,en esta comunicación se presentan resultados obtenidos en la extrapolación agenotipos de interés comercial; un mejoramiento de la inducción de tejidoembriogénico primario, asi como el desarrollo de embriones y conversión a plántulas.
16 – 17 October 2000, Kota Kinabalu, Sabah, Malaysia 172
Materiales y métodos
Material vegetalComo material vegetal para el estudio se utilizaron botones florales de dos clones porcada experimento, posteriormente tomando en cuenta los resultados obtenidos en losdiversos ensayos, se hizo una evaluación de genotipos considerando los clonessiguientes: RIM-24, RIM-44, RIM-56, RIM-88, RIM-105, H-12, H-13, H-16, H-20, H-31,seleccionados para el estado de Chiapas.
Protocolo experimentalLa inducción de tejido embriogénico se realizó a partir de explantes de piezas florales(pétalos, estaminodios y filamentos de anteras) tomados de botones antes de laapertura de acuerdo al protocolo técnico desarrollado por López (1994). Los botonesflorales fueron desinfectados por inmersión en cloralex al 80% durante 13 min yenjuagados tres veces en agua destilada estéril. Una vez esterilizados, los botonesflorales fueron disectados y los explantes (pétalos, filamentos de las anteras yestaminodios) puestos en cultivo en cajas de Petri de 5,5 cm de diámetro quecontenían los medios de cultivo con los diferentes tratamientos de estudio. Comomedio básico nutricional se utilizó la formulación del medio denominado “MS” y “MS”modificado que corresponde a una modificación en la concentración de losmacroelementos y microelementos del medio de Murashige y Skoog (Ammirato 1989;Carman 1990), complementado con glucosa 50g/l, gelrite 2,5g/l y el pH ajustado a 5,5Anexo 1).
La esterilización de los medios de cultivo fue realizada en autoclaves de presión devapor a 12oC durante 15 min Una vez sembrados los explantes, los cultivos fueronincubados en salas de cultivo en condiciones de obscuridad y a una temperaturamedia de 25oC.
Factores estudiadosLos factores de estudio evaluados fueron:• La importancia de la composición mineral del medio de cultivo.• El efecto de la fuente de carbono.• El efecto hormonal dado por la composición hormonal en el medio primario de
inducción y el medio secundario de expresión.• El efecto de pretratamientos a bajas temperaturas de los botones florales antes de
la siembra.• El efecto del genotipo.Las variables de respuesta cuantificadas en esta investigación fueron:• Explantes oxidados sin reacción: Se tomaron como explantes oxidados aquellos
que presentaron una coloración café marrón sin la formación de callo.• Frecuencia de aparición de callos embriogénicos: como callos embriogénicos se
consideraron aquellos de color cremoso, de forma acuosa y con estructurasnodulares proembrionarias visibles al microscopio.
• Calidad de la embriogénesis obtenida, describiendose la aparición de embrionesanormales.
Las lecturas para toma de datos fueron realizadas entre la sexta y octava semanadespués de la puesta en cultivo. Todas las observaciones y tomas de datos serealizaron con la ayuda de un microscopio estereoscopio a 2,5 X.
Los tratamientos fueron distribuidos en base a un diseño completamente al azar,donde cada unidad experimental estuvo representada por una caja de Petri de 5,5 cmde diámetro con dos botones florales; cada uno de los tratamientos estuvorepresentado por 10 repeticiones. La eficiencia de cada tratamiento fue evaluadamediante la prueba de independencia de medias de Chi cuadrado al 5% (Dagnelie1975).
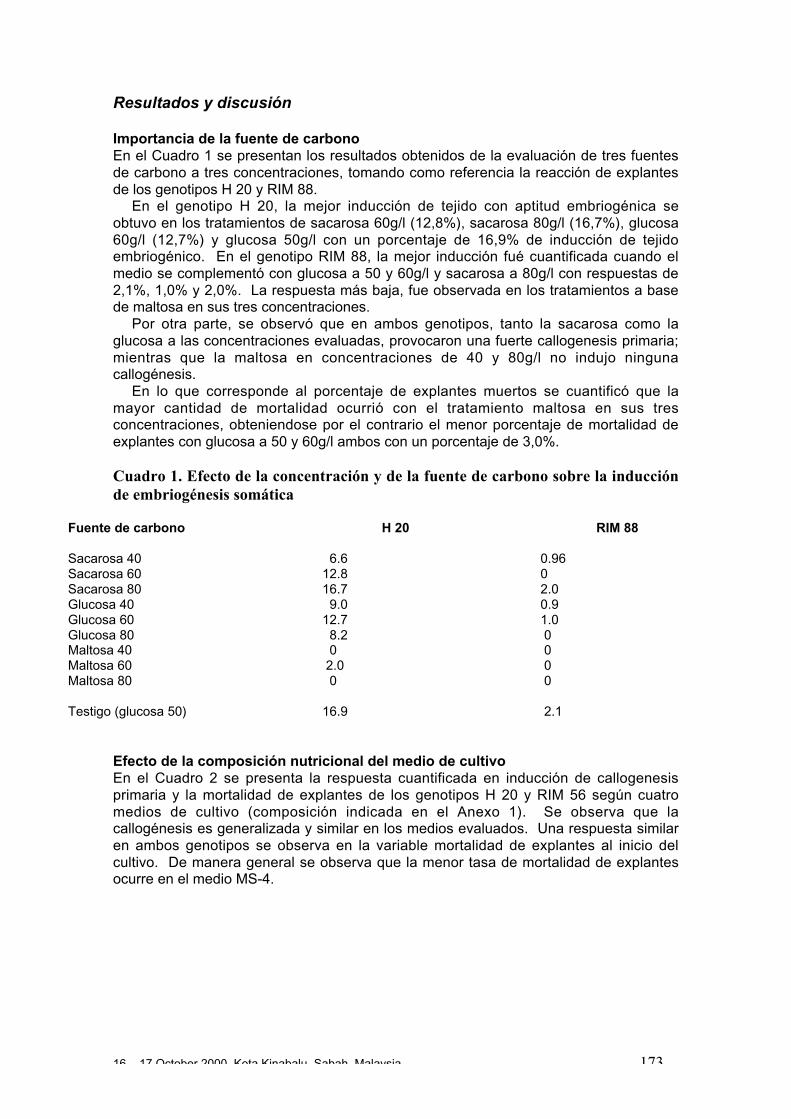
16 – 17 October 2000, Kota Kinabalu, Sabah, Malaysia 173
Resultados y discusión
Importancia de la fuente de carbonoEn el Cuadro 1 se presentan los resultados obtenidos de la evaluación de tres fuentesde carbono a tres concentraciones, tomando como referencia la reacción de explantesde los genotipos H 20 y RIM 88.
En el genotipo H 20, la mejor inducción de tejido con aptitud embriogénica seobtuvo en los tratamientos de sacarosa 60g/l (12,8%), sacarosa 80g/l (16,7%), glucosa60g/l (12,7%) y glucosa 50g/l con un porcentaje de 16,9% de inducción de tejidoembriogénico. En el genotipo RIM 88, la mejor inducción fué cuantificada cuando elmedio se complementó con glucosa a 50 y 60g/l y sacarosa a 80g/l con respuestas de2,1%, 1,0% y 2,0%. La respuesta más baja, fue observada en los tratamientos a basede maltosa en sus tres concentraciones.
Por otra parte, se observó que en ambos genotipos, tanto la sacarosa como laglucosa a las concentraciones evaluadas, provocaron una fuerte callogenesis primaria;mientras que la maltosa en concentraciones de 40 y 80g/l no indujo ningunacallogénesis.
En lo que corresponde al porcentaje de explantes muertos se cuantificó que lamayor cantidad de mortalidad ocurrió con el tratamiento maltosa en sus tresconcentraciones, obteniendose por el contrario el menor porcentaje de mortalidad deexplantes con glucosa a 50 y 60g/l ambos con un porcentaje de 3,0%.
Cuadro 1. Efecto de la concentración y de la fuente de carbono sobre la inducciónde embriogénesis somática
Fuente de carbono H 20 RIM 88
Sacarosa 40 6.6 0.96Sacarosa 60 12.8 0Sacarosa 80 16.7 2.0Glucosa 40 9.0 0.9Glucosa 60 12.7 1.0Glucosa 80 8.2 0Maltosa 40 0 0Maltosa 60 2.0 0Maltosa 80 0 0
Testigo (glucosa 50) 16.9 2.1
Efecto de la composición nutricional del medio de cultivoEn el Cuadro 2 se presenta la respuesta cuantificada en inducción de callogenesisprimaria y la mortalidad de explantes de los genotipos H 20 y RIM 56 según cuatromedios de cultivo (composición indicada en el Anexo 1). Se observa que lacallogénesis es generalizada y similar en los medios evaluados. Una respuesta similaren ambos genotipos se observa en la variable mortalidad de explantes al inicio delcultivo. De manera general se observa que la menor tasa de mortalidad de explantesocurre en el medio MS-4.
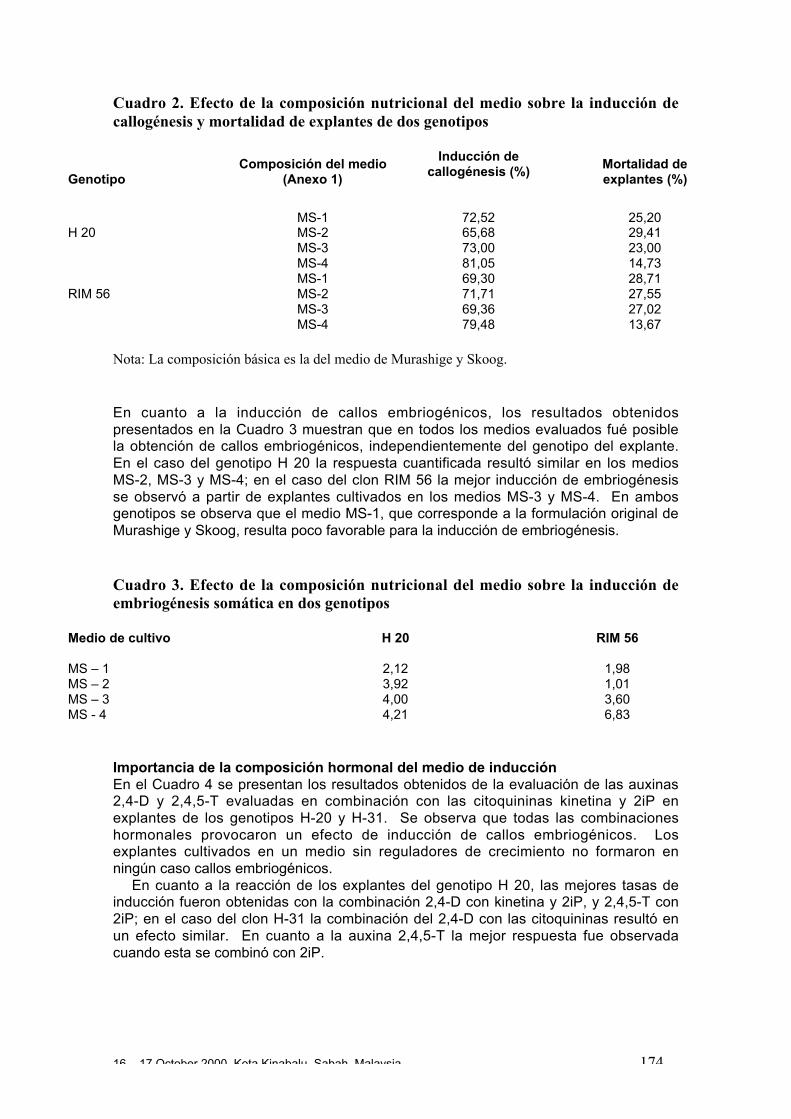
16 – 17 October 2000, Kota Kinabalu, Sabah, Malaysia 174
Cuadro 2. Efecto de la composición nutricional del medio sobre la inducción decallogénesis y mortalidad de explantes de dos genotipos
GenotipoComposición del medio
(Anexo 1)
Inducción decallogénesis (%)
Mortalidad deexplantes (%)
H 20MS-1MS-2MS-3MS-4
72,5265,6873,0081,05
25,2029,4123,0014,73
RIM 56MS-1MS-2MS-3MS-4
69,3071,7169,3679,48
28,7127,5527,0213,67
Nota: La composición básica es la del medio de Murashige y Skoog.
En cuanto a la inducción de callos embriogénicos, los resultados obtenidospresentados en la Cuadro 3 muestran que en todos los medios evaluados fué posiblela obtención de callos embriogénicos, independientemente del genotipo del explante.En el caso del genotipo H 20 la respuesta cuantificada resultó similar en los mediosMS-2, MS-3 y MS-4; en el caso del clon RIM 56 la mejor inducción de embriogénesisse observó a partir de explantes cultivados en los medios MS-3 y MS-4. En ambosgenotipos se observa que el medio MS-1, que corresponde a la formulación original deMurashige y Skoog, resulta poco favorable para la inducción de embriogénesis.
Cuadro 3. Efecto de la composición nutricional del medio sobre la inducción deembriogénesis somática en dos genotipos
Medio de cultivo H 20 RIM 56
MS – 1 2,12 1,98MS – 2 3,92 1,01MS – 3 4,00 3,60MS - 4 4,21 6,83
Importancia de la composición hormonal del medio de inducciónEn el Cuadro 4 se presentan los resultados obtenidos de la evaluación de las auxinas2,4-D y 2,4,5-T evaluadas en combinación con las citoquininas kinetina y 2iP enexplantes de los genotipos H-20 y H-31. Se observa que todas las combinacioneshormonales provocaron un efecto de inducción de callos embriogénicos. Losexplantes cultivados en un medio sin reguladores de crecimiento no formaron enningún caso callos embriogénicos.
En cuanto a la reacción de los explantes del genotipo H 20, las mejores tasas deinducción fueron obtenidas con la combinación 2,4-D con kinetina y 2iP, y 2,4,5-T con2iP; en el caso del clon H-31 la combinación del 2,4-D con las citoquininas resultó enun efecto similar. En cuanto a la auxina 2,4,5-T la mejor respuesta fue observadacuando esta se combinó con 2iP.
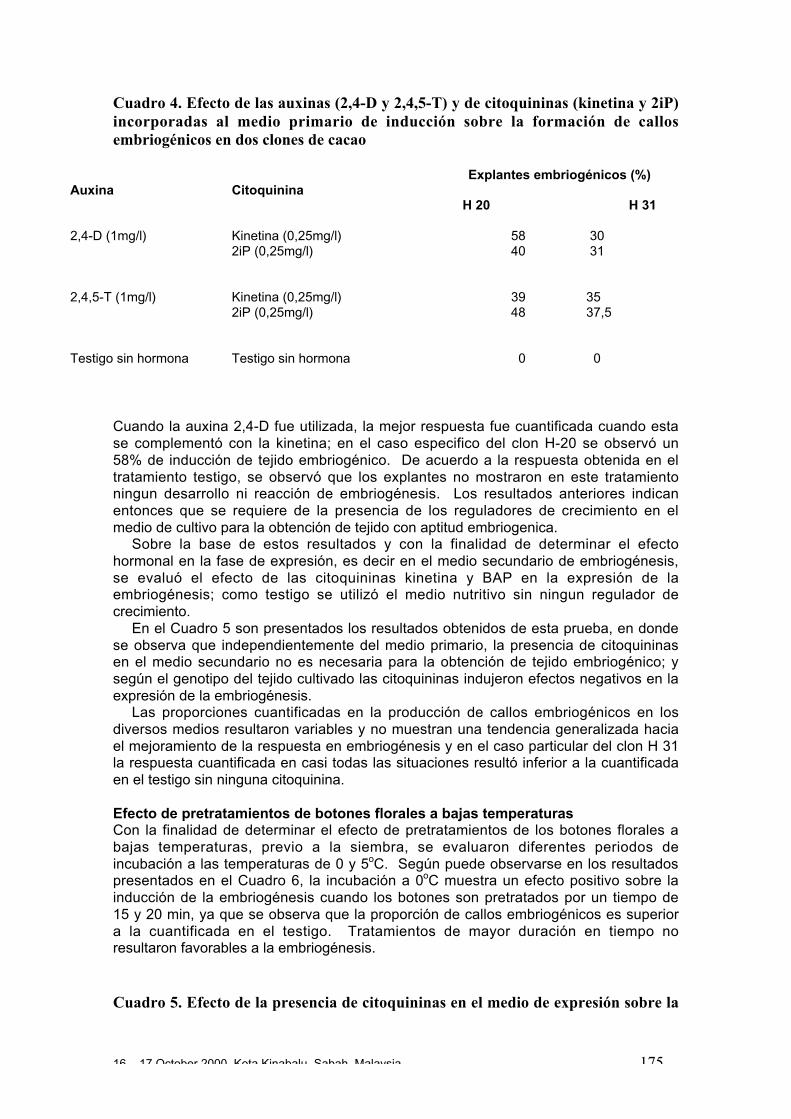
16 – 17 October 2000, Kota Kinabalu, Sabah, Malaysia 175
Cuadro 4. Efecto de las auxinas (2,4-D y 2,4,5-T) y de citoquininas (kinetina y 2iP)incorporadas al medio primario de inducción sobre la formación de callosembriogénicos en dos clones de cacao
Explantes embriogénicos (%)Auxina Citoquinina
H 20 H 31
2,4-D (1mg/l) Kinetina (0,25mg/l)2iP (0,25mg/l)
5840
30 31
2,4,5-T (1mg/l) Kinetina (0,25mg/l)2iP (0,25mg/l)
3948
35 37,5
Testigo sin hormona Testigo sin hormona 0 0
Cuando la auxina 2,4-D fue utilizada, la mejor respuesta fue cuantificada cuando estase complementó con la kinetina; en el caso especifico del clon H-20 se observó un58% de inducción de tejido embriogénico. De acuerdo a la respuesta obtenida en eltratamiento testigo, se observó que los explantes no mostraron en este tratamientoningun desarrollo ni reacción de embriogénesis. Los resultados anteriores indicanentonces que se requiere de la presencia de los reguladores de crecimiento en elmedio de cultivo para la obtención de tejido con aptitud embriogenica.
Sobre la base de estos resultados y con la finalidad de determinar el efectohormonal en la fase de expresión, es decir en el medio secundario de embriogénesis,se evaluó el efecto de las citoquininas kinetina y BAP en la expresión de laembriogénesis; como testigo se utilizó el medio nutritivo sin ningun regulador decrecimiento.
En el Cuadro 5 son presentados los resultados obtenidos de esta prueba, en dondese observa que independientemente del medio primario, la presencia de citoquininasen el medio secundario no es necesaria para la obtención de tejido embriogénico; ysegún el genotipo del tejido cultivado las citoquininas indujeron efectos negativos en laexpresión de la embriogénesis.
Las proporciones cuantificadas en la producción de callos embriogénicos en losdiversos medios resultaron variables y no muestran una tendencia generalizada haciael mejoramiento de la respuesta en embriogénesis y en el caso particular del clon H 31la respuesta cuantificada en casi todas las situaciones resultó inferior a la cuantificadaen el testigo sin ninguna citoquinina.
Efecto de pretratamientos de botones florales a bajas temperaturasCon la finalidad de determinar el efecto de pretratamientos de los botones florales abajas temperaturas, previo a la siembra, se evaluaron diferentes periodos deincubación a las temperaturas de 0 y 5oC. Según puede observarse en los resultadospresentados en el Cuadro 6, la incubación a 0oC muestra un efecto positivo sobre lainducción de la embriogénesis cuando los botones son pretratados por un tiempo de15 y 20 min, ya que se observa que la proporción de callos embriogénicos es superiora la cuantificada en el testigo. Tratamientos de mayor duración en tiempo noresultaron favorables a la embriogénesis.
Cuadro 5. Efecto de la presencia de citoquininas en el medio de expresión sobre la
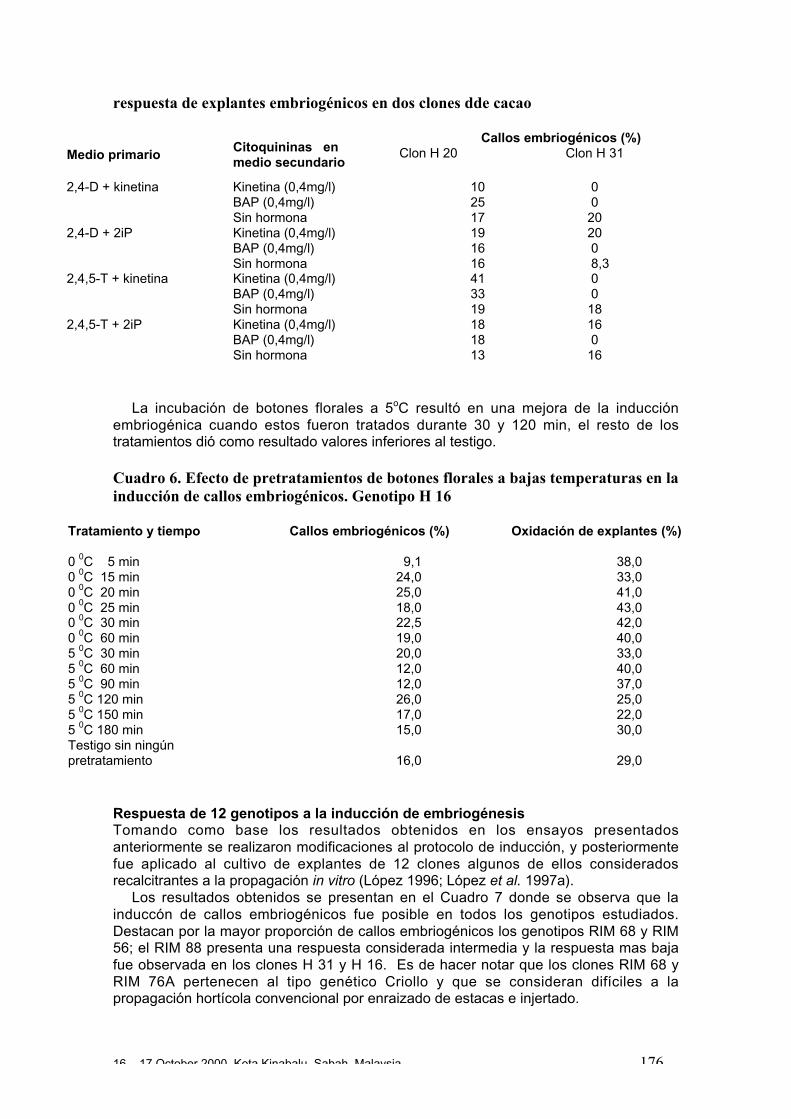
16 – 17 October 2000, Kota Kinabalu, Sabah, Malaysia 176
respuesta de explantes embriogénicos en dos clones dde cacao
Callos embriogénicos (%)Medio primario
Citoquininas enmedio secundario
Clon H 20 Clon H 31
2,4-D + kinetina Kinetina (0,4mg/l)BAP (0,4mg/l)Sin hormona
102517
0 0 20
2,4-D + 2iP Kinetina (0,4mg/l)BAP (0,4mg/l)Sin hormona
191616
20 0 8,3
2,4,5-T + kinetina Kinetina (0,4mg/l)BAP (0,4mg/l)Sin hormona
413319
0 0 18
2,4,5-T + 2iP Kinetina (0,4mg/l)BAP (0,4mg/l)Sin hormona
181813
16 0 16
La incubación de botones florales a 5oC resultó en una mejora de la inducciónembriogénica cuando estos fueron tratados durante 30 y 120 min, el resto de lostratamientos dió como resultado valores inferiores al testigo.
Cuadro 6. Efecto de pretratamientos de botones florales a bajas temperaturas en lainducción de callos embriogénicos. Genotipo H 16
Tratamiento y tiempo Callos embriogénicos (%) Oxidación de explantes (%)
0 0C 5 min 9,1 38,00 0C 15 min 24,0 33,00 0C 20 min 25,0 41,00 0C 25 min 18,0 43,00 0C 30 min 22,5 42,00 0C 60 min 19,0 40,05 0C 30 min 20,0 33,05 0C 60 min 12,0 40,05 0C 90 min 12,0 37,05 0C 120 min 26,0 25,05 0C 150 min 17,0 22,05 0C 180 min 15,0 30,0Testigo sin ningúnpretratamiento 16,0 29,0
Respuesta de 12 genotipos a la inducción de embriogénesisTomando como base los resultados obtenidos en los ensayos presentadosanteriormente se realizaron modificaciones al protocolo de inducción, y posteriormentefue aplicado al cultivo de explantes de 12 clones algunos de ellos consideradosrecalcitrantes a la propagación in vitro (López 1996; López et al. 1997a).
Los resultados obtenidos se presentan en el Cuadro 7 donde se observa que lainduccón de callos embriogénicos fue posible en todos los genotipos estudiados.Destacan por la mayor proporción de callos embriogénicos los genotipos RIM 68 y RIM56; el RIM 88 presenta una respuesta considerada intermedia y la respuesta mas bajafue observada en los clones H 31 y H 16. Es de hacer notar que los clones RIM 68 yRIM 76A pertenecen al tipo genético Criollo y que se consideran difíciles a lapropagación hortícola convencional por enraizado de estacas e injertado.
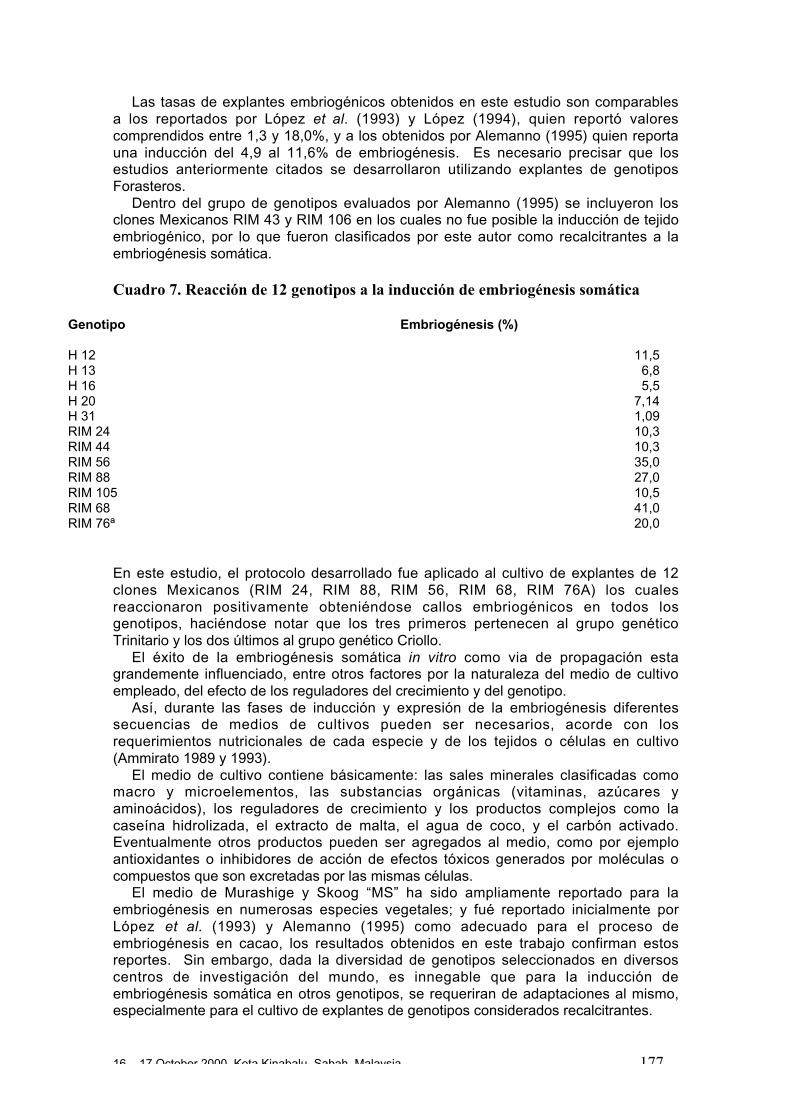
16 – 17 October 2000, Kota Kinabalu, Sabah, Malaysia 177
Las tasas de explantes embriogénicos obtenidos en este estudio son comparablesa los reportados por López et al. (1993) y López (1994), quien reportó valorescomprendidos entre 1,3 y 18,0%, y a los obtenidos por Alemanno (1995) quien reportauna inducción del 4,9 al 11,6% de embriogénesis. Es necesario precisar que losestudios anteriormente citados se desarrollaron utilizando explantes de genotiposForasteros.
Dentro del grupo de genotipos evaluados por Alemanno (1995) se incluyeron losclones Mexicanos RIM 43 y RIM 106 en los cuales no fue posible la inducción de tejidoembriogénico, por lo que fueron clasificados por este autor como recalcitrantes a laembriogénesis somática.
Cuadro 7. Reacción de 12 genotipos a la inducción de embriogénesis somática
Genotipo Embriogénesis (%)
H 12 11,5H 13 6,8H 16 5,5H 20 7,14H 31 1,09RIM 24 10,3RIM 44 10,3RIM 56 35,0RIM 88 27,0RIM 105 10,5RIM 68 41,0RIM 76ª 20,0
En este estudio, el protocolo desarrollado fue aplicado al cultivo de explantes de 12clones Mexicanos (RIM 24, RIM 88, RIM 56, RIM 68, RIM 76A) los cualesreaccionaron positivamente obteniéndose callos embriogénicos en todos losgenotipos, haciéndose notar que los tres primeros pertenecen al grupo genéticoTrinitario y los dos últimos al grupo genético Criollo.
El éxito de la embriogénesis somática in vitro como via de propagación estagrandemente influenciado, entre otros factores por la naturaleza del medio de cultivoempleado, del efecto de los reguladores del crecimiento y del genotipo.
Así, durante las fases de inducción y expresión de la embriogénesis diferentessecuencias de medios de cultivos pueden ser necesarios, acorde con losrequerimientos nutricionales de cada especie y de los tejidos o células en cultivo(Ammirato 1989 y 1993).
El medio de cultivo contiene básicamente: las sales minerales clasificadas comomacro y microelementos, las substancias orgánicas (vitaminas, azúcares yaminoácidos), los reguladores de crecimiento y los productos complejos como lacaseína hidrolizada, el extracto de malta, el agua de coco, y el carbón activado.Eventualmente otros productos pueden ser agregados al medio, como por ejemploantioxidantes o inhibidores de acción de efectos tóxicos generados por moléculas ocompuestos que son excretadas por las mismas células.
El medio de Murashige y Skoog “MS” ha sido ampliamente reportado para laembriogénesis en numerosas especies vegetales; y fué reportado inicialmente porLópez et al. (1993) y Alemanno (1995) como adecuado para el proceso deembriogénesis en cacao, los resultados obtenidos en este trabajo confirman estosreportes. Sin embargo, dada la diversidad de genotipos seleccionados en diversoscentros de investigación del mundo, es innegable que para la inducción deembriogénesis somática en otros genotipos, se requeriran de adaptaciones al mismo,especialmente para el cultivo de explantes de genotipos considerados recalcitrantes.
16 – 17 October 2000, Kota Kinabalu, Sabah, Malaysia 178
En base a la totipotencialidad de la célula vegetal, todas las partes de una plantason aptas a formar embriones somáticos, sin embargo, en la práctica se hademostrado que los tejidos más adecuados son en general los más juveniles y menosdiferenciados (Ammirato 1993; Carman 1990); aunque también ha sido reportado elefecto inductor de pretratamientos a los tejidos antes de la siembra.
La obtención de tejidos embriogénicos a partir de piezas florales ha sido reportadaen varias especies como por ejemplo: Hemerocallis citrina (Zhou et al. 1984), Secalecereale (Linacero y Vazquez 1990), Punica granatum (Mahishi 1992).
En el caso especifico del cacao, el potencial embriogénico de las piezas florales(pétalos, estaminodios y filamentos de anteras) como explante inicial para la formaciónde la embriogénesis, ya había sido reportado anteriormente por (López et al. 1993;López 1994 y 1996) y Alemanno (1995) el cual es confirmado por los valoresregistrados en las tasas de inducción de tejido embriogénico obtenidos en esteestudio.
Por otra parte, los reguladores del crecimiento desempeñan un papel determinanteen la inducción de la embriogénesis, destacando el tipo de hormona, la concentraciónen el medio de cultivo y la duración de la fase de inducción. Estos reguladores actúande manera específica sobre el comportamiento celular, como por ejemplo, laestimulación de la división celular y la orientación de las células hacia ladesdiferenciación. De manera general el proceso de embriogénesis se inicia en unmedio de cultivo que contiene principalmente auxinas y citocininas, solas ocombinadas.
López et al. (1993), López (1994) y Alemanno (1995) reportan que la embriogénesissomática a partir de piezas florales de cacao es posible en un medio enriquecido conel balance hormonal 2,4-D (1mg/l) + kinetina (0,25mg/l), datos que se confirman conlos cuantificados en esta investigación. Aunque es de hacer notar que en estainvestigación se reporta por primera vez el efecto positivo sobre la inducción deembriogénesis de la auxina 2,4,5-T en concentración de 1mg/l, no existén reportesprevios que indiquen la aplicación de este regulador del crecimiento en la inducción deembriogénesis somática en Theobroma cacao.
En cuanto al efecto inductor de bajas temperaturas en la embriogénesis a partir detejidos somáticos, este ha sido reportado en diversas especies, es importante hacernotar que no existen reportes bibliograficos previos en cacao que permitan estableceruna comparación con los resultados obtenidos en esta investigación. No obstante, losresultados observados ponen en evidencia el efecto mejorador de la embriogénesis depretratamientos de los botones florales antes de la puesta en cultivo a temperaturas de0 y 5 grados centigrados.
Debido a la importancia de los reguladores de crecimiento en el proceso deembriogénesis, se confirma la necesidad de estos en el medio de cultivo inicial parainducir la reacción embriogénica; sin embargo en el medio secundario de expresión lascitoquininas no son necesarias. Lo anterior indica que para que el proceso deembriogénesis se desarrolle es necesario un protocolo de inducción – expresión, en elcual los reguladores de crecimiento solo estarían presentes en el medio primario paraprovocar la inducción, posteriormente las hormonas se suprimen para favorecer laexpresión. La eficiencia de este protocolo es corroborada por la buena calidad de laembriogénesis obtenida como se aprecia en la Figura 1 ya que los embrionesobtenidos fueron capaces de desarrollarse hasta plantas en condiciones deinvernadero, lo cual indica entonces que estos tienen la capacidad para el desarrolloposterior sin que ocurra ninguna malformación ni el bloqueo de estos. El crecimientoobservado en las plantas regeneradas por esta vía es similar al de una plantaoriginada de semilla.
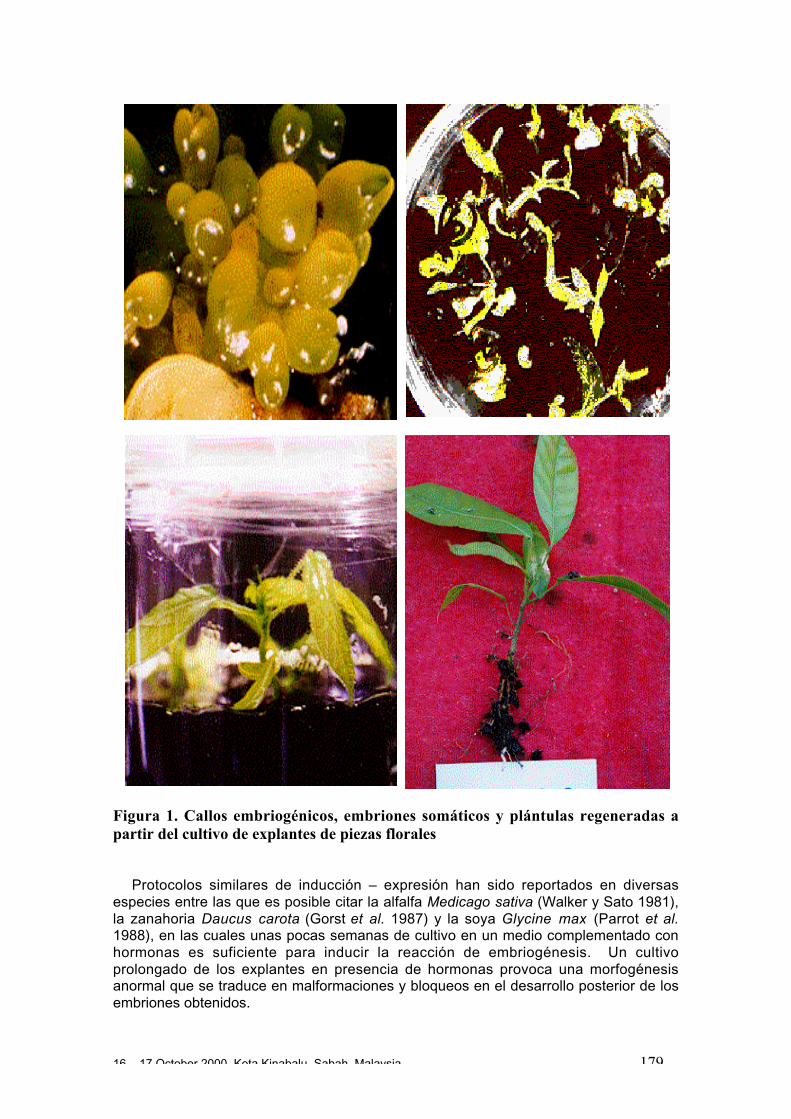
16 – 17 October 2000, Kota Kinabalu, Sabah, Malaysia 179
Figura 1. Callos embriogénicos, embriones somáticos y plántulas regeneradas apartir del cultivo de explantes de piezas florales
Protocolos similares de inducción – expresión han sido reportados en diversasespecies entre las que es posible citar la alfalfa Medicago sativa (Walker y Sato 1981),la zanahoria Daucus carota (Gorst et al. 1987) y la soya Glycine max (Parrot et al.1988), en las cuales unas pocas semanas de cultivo en un medio complementado conhormonas es suficiente para inducir la reacción de embriogénesis. Un cultivoprolongado de los explantes en presencia de hormonas provoca una morfogénesisanormal que se traduce en malformaciones y bloqueos en el desarrollo posterior de losembriones obtenidos.
16 – 17 October 2000, Kota Kinabalu, Sabah, Malaysia 180
De acuerdo con López et al. (1997a) los clones de la serie RIM seleccionados en elCE Rosario Izapa, constituyen una población bastante homogénea y emparentada, porlo que puede preveerse una respuesta similar en estos materiales.
Este estudio muestra entonces, que adaptaciones a la composición nutricional yhormonal del medio desarrollado por López et al. (1993) resultaron favorables para laobtención de tejido embriogénico en genotipos considerados reclacitrantes. Si bien escierto que la respuesta embriogénica es variable según el genotipo, los resultadosobtenidos indican la factibilidad de aplicación de esta vía de propagación a clones deinterés industrial por su alta calidad como son los genotipos Criollos, que en generalson considerados de difícil propagación por las técnicas hortícolas convencionales(Enríquez 1985; León 1987; Flores y Vera 1995).
Sin embargo, este estudio no permite concluir de manera definitiva a cerca de larespuesta embriogénica y el genotipo del material (Criollos, Trinitarios y Forasteros)definidos en cacao (Cope 1984; León 1987), los resultados obtenidos son indicadoresde que el potencial embriogénico existe en genotipos de estos grupos genéticos y quepara desarrollar este se requieren adaptaciones o adecuaciones al protocolo.
Potencial de la propagación de Theobroma cacao por embriogénesis somaticaLa forma de perpetuarse de el cultivo de cacao es mediante la propagación ya seasexual o asexual (Enríquez 1985; León 1987). Sin embargo, debido a la naturalezaalogama del cultivo no se recomienda realizarse vía sexual ya que las plantasobtenidas presentan alta variación genética.
La propagación de plantas de cacao es una limitante a nivel mundial por lo que lasinvestigaciones que se desarrollan en diferentes partes del mundo se encaminan haciael perfeccionamiento de las técnicas de clonamiento ya disponibles como son: elinjertado convencional, el enraizado de ramas, el microinjertado en plántula y lasnuevas tecnologías de cultivo de tejidos como la embriogénesis somática (Yow y Lim1994; Flores y Vera 1995; López 1996; Furtek et al. 1994).
Debido a que Las técnicas disponibles de propagación clonal no son suficientespara cubrir la demanda de plantas requeridas para poder renovar las plantaciones,como ejemplo se tiene que para el caso del estado de Chiapas en México se necesitan40 000 000 de plantas para renovar las 30 000 ha que existen, a una densidad deplantado de 1100 árboles por ha, de manera que los estudios hacia la optimización delproceso de embriogénesis somática han cobrado mayor interés.
Los resultados obtenidos en este trabajo de investigación indican, que la inducciónde la embriogénesis somática es factible desarrollarla en genotipos denominadosrecalcitrantes, y que además tiene aplicación inmediata para poder optimizar elproceso.
Tomando en cuenta el potencial que ofrece esta técnica hay necesidad deperfeccionarla para poder aplicarla a la escala comercial.
La embriogénesis somática ya desarrollada permitiría aplicar otras técnicas debiotecnología como son la ingeniería genética y la fusión de protoplastos, técnicas quepermitirían desarrollar en un tiempo relativamente corto (3 – 4 años) nuevos clones, adiferencia del mejoramiento convencional que requiere de 20 a 30 años paraobtenerlas.
La optimización del proceso de embriogénesis somática en medio liquido, porejemplo en bioreactores, será de gran importancia económica ya que permitirá laproducción a gran escala y con un costo reducido de grandes cantidades de plantasde una variedad determinada. Estas plantas podrán ser utilizadas de manera directapara el establecimiento de cultivos o bien conservarse.
Conclusiones y perspectivas
La composición mineral del medio MS-4, que corresponde a una modificafión de laformulación original, resultó la mas adecuada para desarrollar el proceso de
16 – 17 October 2000, Kota Kinabalu, Sabah, Malaysia 181
embriogénesis somática a partir de explantes de piezas florales de cacao en genotiposseleccionados en México.
Las composiciones hormonales a base de 2,4,5-T (1mg/l) o 2,4-D (1mg/l) y kinetina(0,25mg/l) en el medio primario, resultaron las mas adecuadas para la inducción detejido embriogénico. La glucosa en concentraciones de 50 y 60g/l y sacarosa a 80g/lresultaron las fuentes de carbono mas adecuadas para la inducción de explantesembriogénicos. En el medio secundario de expresión de la embriogénesis no esnecesaria la presencia de citocininas para la obtención de tejido embriogénico. Elpretratamiento de botones florales antes de la siembra a temperatura de 0oC durante15 y 20 min, 0 a 5oC durante 120 min inducen una mejora en la proporción de tejidoembriogénico formado.
Los resultados obtenidos permitieron integrar modificaciones al protocolo deembriogénesis previamente desarrollado, el cual mostró su eficiencia ya que fueposible la inducción de tejido embriogénico en explantes de 12 genotipos, algunos deellos considerados recalcitrantes.
Los resultados obtenidos indicarian que la obtención de tejido con aptitudembriogénica es una resultante de la interacción del genotipo del explante, del balancehormonal y de la composición mineral y energética presente en el medio primario deinducción.
Bibliografia
Adú-Ampomah Y., F.J. Novak, R. Afza, M. Van Duren y M. Perea-Dallos. 1988. Initiation andgrowth of somatic embryos of cocoa (Theobroma cacao L.). Café Cacao Thé 32: 187–199.
Aguilar M.E., M.V. Villalobos y N. Vazquez. 1992. Production of cocoa plants (Theobromacacao L.) vía micrografting of somatic embryos. In vitro Cell. Dev. Biol. 28: 15-41.
Alemanno L. 1995. Embryogenèse somatique du cacaoyer Theobroma cacao L. Contraintes etperspectives. Thèse de Docteur en Sciences. Université de Montpellier II, Sciences etTechniques du Languedoc. 193 pp.
Ammirato P.V. 1989. Recent progress in somatic embriogenesis. Int. Assoc. for Plant TissueCulture Newsletter 57: 2-16.
Ammirato P.V. 1993. Embryogenesis. Paginas 82-123 in Handbook of plant cell culture.Techniques for propagation and breeding. Vol I. (Evans, D. A, Sharp, W. R., Ammirato, P.and Yamada, Y., eds). McMillan, New York, United States of America.
Carman J.G. 1990. Embryogenic cells in plant tissue cultures: ocurrence and behaviour. InVitro Cell. Dev. Biol. 26: 746-753.
Chatelet P., N. Michaux-Ferrière y P. Dublin. 1992. Potentialités embryogènes du nucelle dutégument interne de graines immatures de cacaoyer (Theobroma cacao L.) Compte-Rendusde l’Académie des Sciences. Paris 315: 55-62.
Cope F. W. 1984. Cacao Theobroma cacao L. (Sterculiaceae). In Simmons N. W. (ed).Evolution of crop plants. Longman, London.
Dagnelie P. 1975. Théorie et méthodes statistiques: applications agronomiques. Les PressesAgronomiques de Gembloux, Gembloux, Belgique. 463 pp.
Enríquez G.A. 1985. Curso sobre el cultivo del cacao. Turrialba, Costa Rica, CATIE. Seriemateriales de enseñanza n°. 22. 239p.
Esan E.B. 1977. Tissue culture studies on cocoa (Theobroma cacao L.) A supplementation ofcurrent research. Paginas 116-125 in Actes de la 5a. Conférence Internationale sur laRecherche Cacaoyére, September 1-9, 1975, Ibadan, Nigeria.
Flores F. y B.J. Vera. 1995. Influencia de la fenología sobre el enraisamiento de ramillas yprendimiento de injertos en clones de cacao. El Cacaotero Colombiano 14: 26–34.
Furtek D., Anderbran T., Chunyan G., Glazier B., Patel V., Sain S., Simka H. y Traore A. 1994.Applications of biotechnology for cocoa tree improvement. Paginas 11-12 in MalaysianInternational Cocoa Conference, 20-21 october, Kuala Lumpur, Malaysia. Malaysia CocoaBoard. Extended Abstracts.
Gorst J., Overall R. L. y Wemeke, 1987. Ionic currents traversing cell cluster from carrotsuspension cultures reveal perpetuation of morphgenetic potential as distinct from inductionof embryogenesis. Cell Differentiation 21: 101-109.
16 – 17 October 2000, Kota Kinabalu, Sabah, Malaysia 182
Kononowicz H., A.K. Kononowicz y J. Janick. 1984. Asexual embryogenesis via callus ofTheobroma cacao L. Zeitschrift fúr Pflanzenphysiologie 113: 347-358.
León J. 1987. Paginas 337 –343 in Botánica de los cultivos tropicales. IICA, San José, CostaRica.
Linacero R. y A.M. Vazquez. 1990. Somatic embryogenesis from inmature inflrescences of rye.Plant Science 72: 253–258.
Lizt R.E. 1986. Tissue culture studies with Theobroma cacao. Paginas 111-120 in Proceedingsof the Cacao Biotechnology Symposium. (Dimick, P.S., ed). Pennsylvania State UniversityPress, University Park, Pa, United States of America.
Litz R.E. 1987. Application of tissue culture to tropical fruits. Paginas 407-418 in: Plant tissueand cell culture. (Green, C. E. et al., eds). Alan R. Liss, New York, United Kingdom.
López B.O. 1994. Embryogenèse somatique et régénération de plantes de cacaoyerTheobroma cacao L. à partir de pièces florales. Thése de Docteur en Sciences, EcoleNationale Supérieure Agronomique de Rennes, France. 137 pp.
López B.O. 1996. Biotecnologías aplicadas al mejoramiento genético y propagación del cacao.Paginas 176-179 in: Actas de la IX Reunión Científica-Tecnológica Forestal y Agropecuaria,5-6 de Diciembre, Villahermosa, Tabasco, Mexico.
López B.O., H. Bollon, A.B. Eskes y V. Pétiard V. 1993. Embryogenèse somatique de cacaoyerTheobroma cacao L., à partir de pièces florales. Compte-Rendus de I´Académie desSciences 316: 579-584.
López B.O., H. Bollón, M. Alvarez y V. Pétiard. 1996. Ex-vitro performance and nuclear DNAploidy of cocoa plants regenerated by somatic embryogenesis. Paginas 589-594 inProceedings of the 12th, International Cocoa Research Conference, November 17-23, 1996,Salvador, Bahía, Brazil.
López B.O., G.M. Esponda, V.B. Hernandez, V.G. Fraire, H.M. Evans y A. Fontanel. 1997a.Les biotechnologies appliquées à I’amélioration génétique et la propagation du cacaoyer auMexique. Paginas 8-9 in Résumés Vièmes Journées Scientifiques du RéseauBiotecnologies-Génie Génétique des plantes de I’APELF.UREF. Université de Paris Sud,Centre Universitaire d’Orsay, Francia. 30 junio al 3 de julio de 1997.
López B.O., G.M. Esponda, V.B. Hernandez, V.G. Fraire, H.M. Evans y A. Fontanel. 1997b.Progresos recientes en el clonamiento del cacao. Paginas 15-16 in Actas del PrimerCongreso Venezolano del Cacao y su Industria, 18 al 21 de noviembre 1997, Maracay,Aragua, Venezuela.
Mahishi D.M. 1992. Regeneration of petal callus in Punica granatum. Pagina 39 in Advancesin gene technology: feeding the world in the 21st century. Short reports Vol 1. (Whelan, W. J.et al., ed). Miami, Florida, United States of America.
Parrot W.A.., G. Dryden, S. Vogt, D.F. Hildebrand, G.B. Collins y E.G. Williams. 1988.Optimization of somatic embryogenesis and embryo germination in soybean. In Vitro Cell.Dev. Biol. 24: 817–820.
Pence V.C. 1989. Cacao (Theobroma cacao L.). Paginas 203-221 in: Biothecnology inAgriculture and Forestry. Vol 5. Trees II. (Bajaj, Y.P.S., ed). Springer-Verlag, Berlin.
Pétiard V., J.P. Ducos, B. Florin, C. Lecouteux, H. Tessereau y A. Zamarripa. 1993. Productionen masse et conservation des embryons somatiques. Paginas 175-191 in Vol. IProceedings of the 4ème Rencontres Internationales sur les Semences. AspectsFondamentaux et Appliqués de la Biologie de Semences, Angers, France, 1992. (Comé D.et Corbineau F., eds).
Sondhal M. R., T.H.B. Sereduk, C.M. Bellato y Z. Chen. 1998. Somatic embryogenesis andplant regeneration of cacao. European Patent Application, Publication 0293598 A2.Munchen, Germany. 11pp.
Yow S.T. y D.H.L. Lim. 1994. Green-patch budding on very young cocoa rootstocks and sidegrafting of mature trees. Cocoa Grower´s Bulletin 47: 27–41.
Walker K. A. y S.J. Sato. 1981. Morphogenesis in callus tissue of Medicago sativa: the role ofammonium ion on somatic embryogenesis. Plant Cell, Tissue and Organ Culture 1:109–121.
Zhou P., J. Hu y H. Fan. 1984. Studies on inducing embryoid and plant from stamens andunripe seeds of long yellow day-lily in vitro. Pagina 72 in Abstracts International Symposiumon Genetic Manipulation in Crops. Beijing, China, 1984.
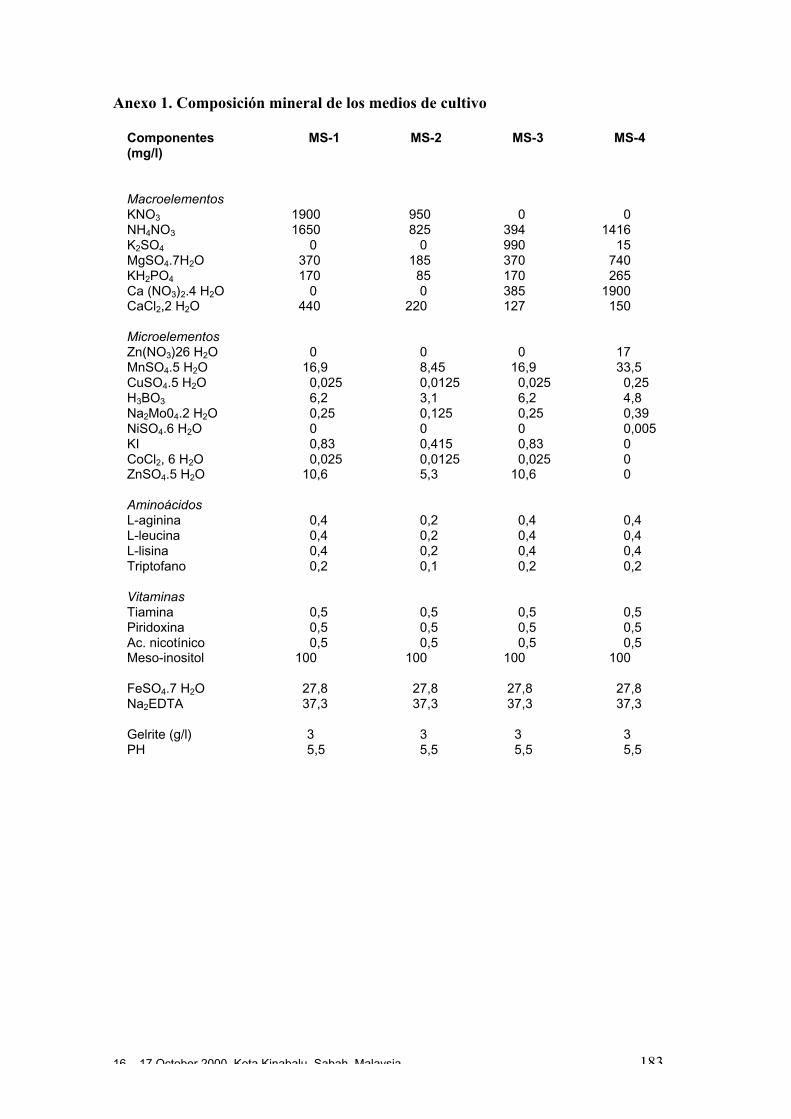
16 – 17 October 2000, Kota Kinabalu, Sabah, Malaysia 183
Anexo 1. Composición mineral de los medios de cultivo
Componentes(mg/l)
MS-1 MS-2 MS-3 MS-4
MacroelementosKNO3
NH4NO3
K2SO4
MgSO4.7H2OKH2PO4
Ca (NO3)2.4 H2OCaCl2,2 H2O
1900 1650 0 370 170 0 440
950 825 0 185 85 0 220
0 394 990 370 170 385 127
0 1416 15 740 265 1900 150
MicroelementosZn(NO3)26 H2OMnSO4.5 H2OCuSO4.5 H2OH3BO3
Na2Mo04.2 H2ONiSO4.6 H2OKICoCl2, 6 H2OZnSO4.5 H2O
0 16,9 0,025 6,2 0,25 0 0,83 0,025 10,6
0 8,45 0,0125 3,1 0,125 0 0,415 0,0125 5,3
0 16,9 0,025 6,2 0,25 0 0,83 0,025 10,6
17 33,5 0,25 4,8 0,39 0,005 0 0 0
AminoácidosL-agininaL-leucinaL-lisinaTriptofano
0,4 0,4 0,4 0,2
0,2 0,2 0,2 0,1
0,4 0,4 0,4 0,2
0,4 0,4 0,4 0,2
VitaminasTiaminaPiridoxinaAc. nicotínicoMeso-inositol
0,5 0,5 0,5 100
0,5 0,5 0,5 100
0,5 0,5 0,5 100
0,5 0,5 0,5 100
FeSO4.7 H2ONa2EDTA
27,8 37,3
27,8 37,3
27,8 37,3
27,8 37,3
Gelrite (g/l)PH
3 5,5
3 5,5
3 5,5
3 5,5
16 – 17 October 2000, Kota Kinabalu, Sabah, Malaysia 184
Mass Multiplication on a Semi-industrial Scale of Cocoa Clonesby Rooted Cuttings in Brazil
Jesus B. Palacios1 and Wilson R. Monteiro2
1 - Instituto Biofábrica de Cacau, Uruçuca, Bahia, Brazil2 - Universidade Estadual Santa Cruz –UESC, Ilhéus, BA, Brazil2 - CEPLAC - Centro de Pesquisas do Cacau, CP7, 45600-000, Itabuna, Bahia, Brazil
Abstract
To give the necessary support to the programme of rehabilitation of cocoa plantations in Bahia,the State and Federal authorities together with the producer’s co-operatives (CREDICOOGRAPand COOGRAP) decided to create the ‘Instituto Biofábrica de Cacau’. This organisation is incharge of the mass multiplication of witches’ broom resistant clonal varieties selected andrecommended by CEPLAC for replanting old cocoa farms and for the establishment of newplantings. The details of the functioning of this unit are given as well the protocol for raising therooted cuttings.
Introduction
The cocoa plantations of the State of Bahia have suffered badly due to the severity ofthe witches’ broom disease, caused by Crinipellis perniciosa Stahel. The disease wasfirst identified in these cocoa areas in 1989. The cocoa economy of the area, alreadybadly affected by low productivity in the mid-1980’s and the current cocoa price crisis,suffered further with the spread of witches’ broom disease and this has been a majorfactor in the process of regional impoverishment. Since then, an ambitious programmefor the rehabilitation of the cocoa plantations was implemented involving both clonaland seminal resistant varieties. The project of the ‘Instituto Biofábrica de Cacau’(hereafter identified as ‘Biofábrica’) was initiated to fulfil the farmers urgent need forresistant varieties to accelerate this programme of rehabilitation.
Given the highly favourable conditions for the spread and development of thefungus, the disease soon reached epidemic proportions in almost all of the cocoaplantations, causing plant debilitation, a significant drop in production and death oftrees. Because of the lack of an efficient means to control the disease, many ruralproperties were abandoned. Many cocoa growers are investing in other agriculturalactivities. This has been leading to the degradation of the natural resources in theremaining areas of the Atlantic Forest, causing alterations and imbalance in theecosystems.
For all these reasons, the Agriculture Bureau of the State of Bahia and the FederalGovernment, represented by CEPLAC, formed an alliance with the co-operatives ofproducers (CREDICOOGRAP and COOGRAP) for technical, managerial and financialco-operation to give effective support to the rehabilitation programme for the cocoaplantations. The setting-up phase of the Biofábrica project began in December 1997and ended in October 1999. It has as its objective the mass multiplication anddistribution to cocoa growers of the witches’ broom resistant cocoa clonesrecommended by CEPLAC. The overall cost for the implementation of Biofábrica wasaround two million US dollars. The rooting house and nurseries have the capacity for adaily production of 50,000 rooted cuttings but at present a shortage of cuttings isrestricting the daily production to approximately 10,000 rooted cuttings (see Table 1).The price of one budstick, with three buds, for grafting is currently about 5 US$ centswhereas the rooted cuttings cost 15 US$ cents (the latter still being subsidised).
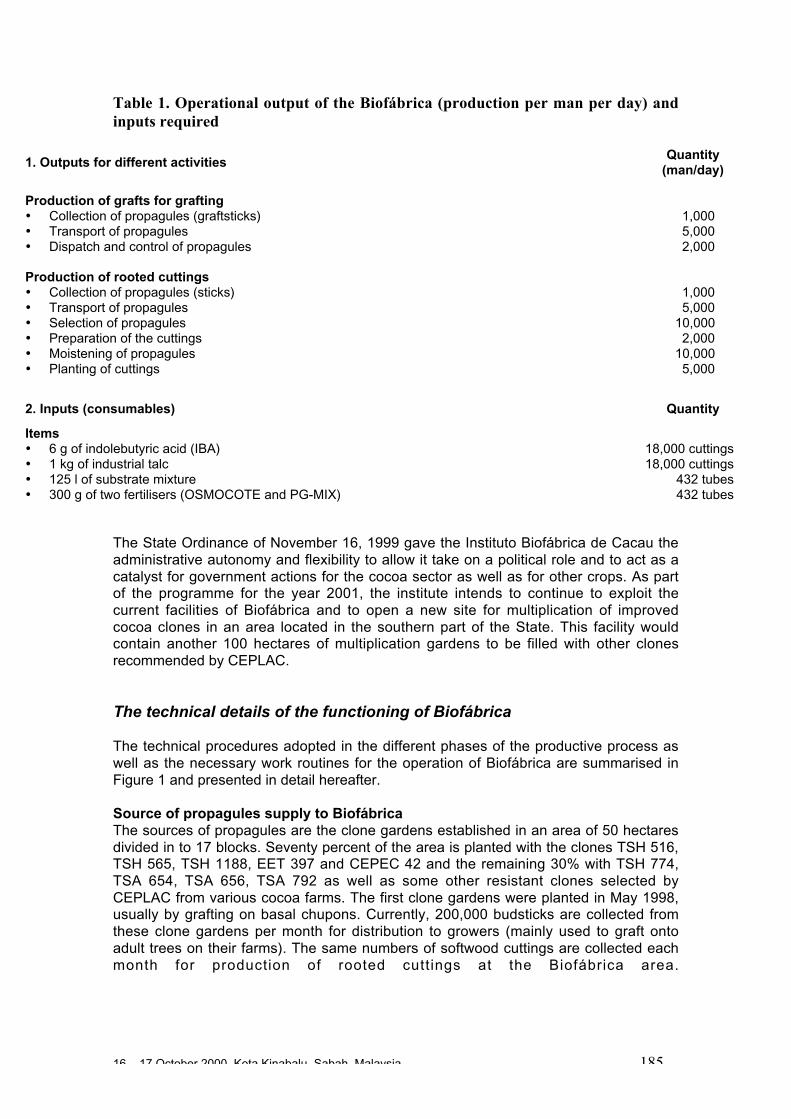
16 – 17 October 2000, Kota Kinabalu, Sabah, Malaysia 185
Table 1. Operational output of the Biofábrica (production per man per day) andinputs required
1. Outputs for different activitiesQuantity
(man/day)
Production of grafts for grafting• Collection of propagules (graftsticks) 1,000• Transport of propagules 5,000• Dispatch and control of propagules 2,000
Production of rooted cuttings• Collection of propagules (sticks) 1,000• Transport of propagules 5,000• Selection of propagules 10,000• Preparation of the cuttings 2,000• Moistening of propagules 10,000• Planting of cuttings 5,000
2. Inputs (consumables) Quantity
Items• 6 g of indolebutyric acid (IBA) 18,000 cuttings• 1 kg of industrial talc 18,000 cuttings• 125 l of substrate mixture 432 tubes• 300 g of two fertilisers (OSMOCOTE and PG-MIX) 432 tubes
The State Ordinance of November 16, 1999 gave the Instituto Biofábrica de Cacau theadministrative autonomy and flexibility to allow it take on a political role and to act as acatalyst for government actions for the cocoa sector as well as for other crops. As partof the programme for the year 2001, the institute intends to continue to exploit thecurrent facilities of Biofábrica and to open a new site for multiplication of improvedcocoa clones in an area located in the southern part of the State. This facility wouldcontain another 100 hectares of multiplication gardens to be filled with other clonesrecommended by CEPLAC.
The technical details of the functioning of Biofábrica
The technical procedures adopted in the different phases of the productive process aswell as the necessary work routines for the operation of Biofábrica are summarised inFigure 1 and presented in detail hereafter.
Source of propagules supply to BiofábricaThe sources of propagules are the clone gardens established in an area of 50 hectaresdivided in to 17 blocks. Seventy percent of the area is planted with the clones TSH 516,TSH 565, TSH 1188, EET 397 and CEPEC 42 and the remaining 30% with TSH 774,TSA 654, TSA 656, TSA 792 as well as some other resistant clones selected byCEPLAC from various cocoa farms. The first clone gardens were planted in May 1998,usually by grafting on basal chupons. Currently, 200,000 budsticks are collected fromthese clone gardens per month for distribution to growers (mainly used to graft ontoadult trees on their farms). The same numbers of softwood cuttings are collected eachmonth for production of rooted cuttings at the Biofábrica area.
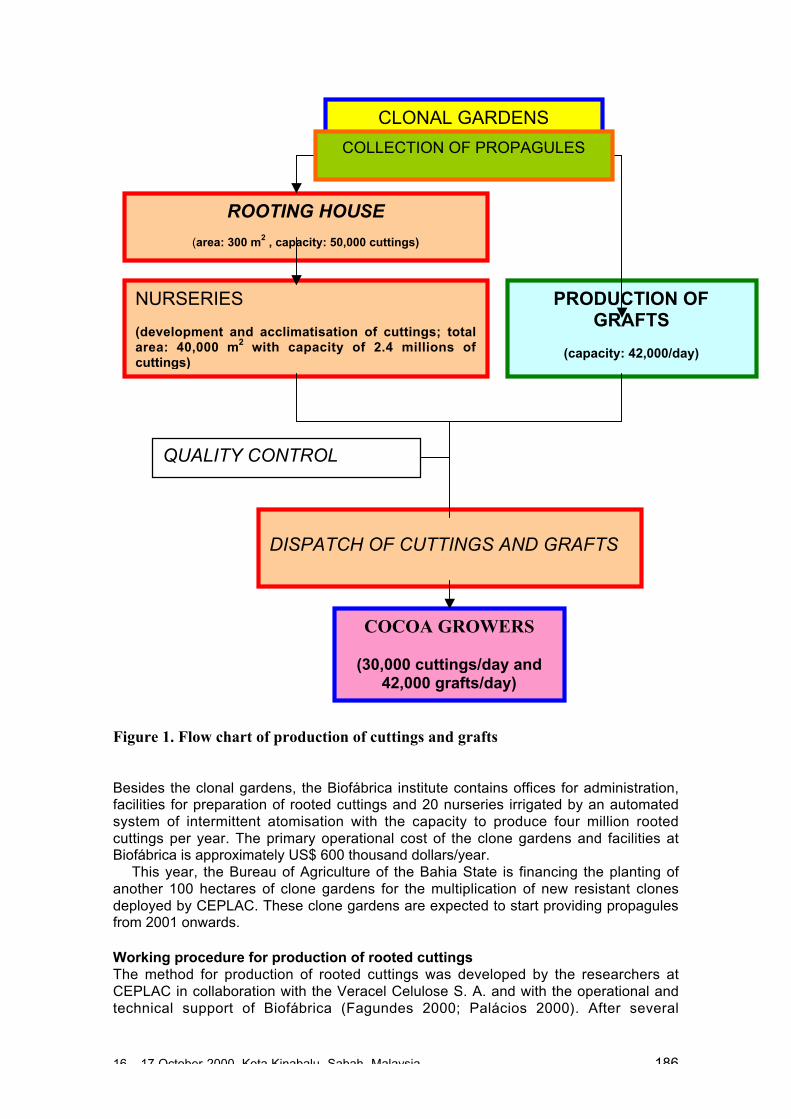
16 – 17 October 2000, Kota Kinabalu, Sabah, Malaysia 186
Figure 1. Flow chart of production of cuttings and grafts
Besides the clonal gardens, the Biofábrica institute contains offices for administration,facilities for preparation of rooted cuttings and 20 nurseries irrigated by an automatedsystem of intermittent atomisation with the capacity to produce four million rootedcuttings per year. The primary operational cost of the clone gardens and facilities atBiofábrica is approximately US$ 600 thousand dollars/year.
This year, the Bureau of Agriculture of the Bahia State is financing the planting ofanother 100 hectares of clone gardens for the multiplication of new resistant clonesdeployed by CEPLAC. These clone gardens are expected to start providing propagulesfrom 2001 onwards.
Working procedure for production of rooted cuttingsThe method for production of rooted cuttings was developed by the researchers atCEPLAC in collaboration with the Veracel Celulose S. A. and with the operational andtechnical support of Biofábrica (Fagundes 2000; Palácios 2000). After several
CLONAL GARDENS(222,200 plants in 50 ha)
COLLECTION OF PROPAGULES
ROOTING HOUSE
(area: 300 m2 , capacity: 50,000 cuttings)
NURSERIES
(development and acclimatisation of cuttings; totalarea: 40,000 m2 with capacity of 2.4 millions ofcuttings)
DISPATCH OF CUTTINGS AND GRAFTS
COCOA GROWERS
(30,000 cuttings/day and42,000 grafts/day)
PRODUCTION OFGRAFTS
(capacity: 42,000/day)
QUALITY CONTROL
16 – 17 October 2000, Kota Kinabalu, Sabah, Malaysia 187
adjustments, this procedure has been improved substantially resulting in an increase in“take” from 55 to 80%.
The procedure has been standardised for the utilisation of the non-woody portion ofplagiotropic fan branches only, cut at 30 cm from the terminal apices. The cuttingswere originally prepared so that the final cutting had 1/3 of the leaf blade and noterminal bud. Nowadays, they are prepared so that the cutting retains 2/3 of the leafblades and the terminal bud.
Once collected, the material is put inside polystyrene boxes, hydrated and thentransported to the rooting house where the cuttings are prepared (with five buds andwith 2/3 of leaf blades). During preparation, the cuttings are continuously hydrated.Before planting the cuttings into tubes containing 288 ml of rooting mixture, the base ofthe cutting is treated with an indolebutyric acid (IBA) solution at 6,000 ppm. The rootingmixture used in the tubes is composed of 50% commercial product containingvermiculite, perlita and pine tree husk powder, and 50% of ground coconut fibre. Tothis mixture are added 300 g of each of two fertilisers (10-06-20 and 14-16-18 of NPK,respectively). The tubes are placed on trays with 54 units in each.
The cuttings, once planted in the tubes, are transferred to the nurseries where theyare shaded by a 70% sunscreen. They are generally maintained under a regime ofirrigation, consisting of atomising for 30s at intervals of 4 to 5 min, over a period ofapproximately 60 days. At the end of this period the roots can normally be seengrowing out of the tubes. At this point the cuttings enter a seven day acclimatisationstage where the irrigation interval is changed to every 10 minutes. After that, thefrequency of watering continues to be reduced progressively until the plants are onlyirrigated three times per day. The scheme of irrigation may however vary according tothe prevailing climatic conditions. To produce a rooted cutting ready for field plantingtakes on average four to five months, depending on the clone and the climate. Theoperational output of rooted cutting production by this procedure currently varies from2,000 to 2,500 cuttings/day.
From 2001 onwards, Biofábrica will investigate the re-rooting of primary branchesderived from these rooted cuttings during the acclimatisation stage in order to increasethe number of propagules. At present, the net take for producing these secondaryrooted cuttings is around 60%. Studies are underway to improve the success rates andefficiency of the procedure for obtaining secondary rooted cuttings. The cuttingsobtained from this source take from 10 to 12 months in total to achieve the ideal levelof development for field planting.
Operational process for the production of rooted cuttings on a semi-industrial scale
The production process described hereafter involves all the stages from the collectionof the propagules in the clone gardens to the distribution of grafts and cuttings to thefinal consumer.
Collection of propagulesThe collection of propagules in the clone gardens begins at 05:30 in the morning. Fanbranches are cut with the aid of pruning scissors. The branches are selected accordingto their diameter; those with diameters between 15 and 20 mm are destined forgrafting, while those with diameters between 3 and 5 mm are used for rooted cuttings.Special care is taken to ensure that the clone gardens are maintained so that they canprovide an abundant supply of high quality propagules. Branches are collected fromeach clone individually and these batches of branches are carefully labelled.
16 – 17 October 2000, Kota Kinabalu, Sabah, Malaysia 188
Transport of the propagulesStems with larger diameters are transported to the distribution shed, while the othersare sent to the rooted cutting preparation house. As stated above, it is essential to keepthe material properly hydrated to ensure good success rates in the rooting phase.
Substrate preparation and filling of the tubesThis operation is done in a unit that is subdivided as follows: a) room for preparation ofcuttings (180m2); b) room for the preparation of the substrate (56m2); c) stock room(48m2); and d) toilets (8m2). In preparing the substrate for filling the tubes, 150 l of acommercial organic compost mix is added to the same amount of powdered coconutfibre. Three hundred grams of each of the two chemical fertilisers are then added. Thesubstrate is initially dry-mixed, with the help of a cement mixer, to provide goodhomogenisation and, after that 50 l of water is added.
Cleaning of trays and tubesThe cleaning and asepsis of the trays and tubes is done before the tubes are filled, bywashing with jets of water at 80ºC for 10 seconds.
The filling of tubesThe tubes are placed in appropriate trays and filled with the humidified substrate.During this operation the trays and their tubes are submitted to a vibration treatment foreight seconds to guarantee an adequate compactness of the substrate. Once this iscompleted, the trays are transferred to the room where the planting of the cuttings willbe accomplished.
Reception and preparation of the propagules for rootingBranches of smaller diameter collected in the clonal gardens are taken to the receptionroom, where they are kept humid. These branches are distributed over several tablesadapted for the preparation of the cuttings. The trained workers begin the preparationof the cuttings by cutting them, with aid of special scissors, in to segments with four tofive axillary buds and leaving three leaves with 2/3 of each leaf blade. In this phase,any branch that does not meet that quality standard set by Biofábrica is discarded. Theprepared cuttings are placed in the upright position inside a small plastic box containing30 mm of water. The root induction treatment and the planting of the cuttings willnormally take place on the same day as the propagules are collected. However, whenit is not possible to treat all the material collected on one day, any remainingpropagules are wetted and maintained inside the reception room in polystyrene boxes.On the following day, these will be the first materials to be prepared. It is known thatthe success rates for rooting these materials will be lower. All discarded materials aretaken back to the clonal gardens and spread in the area.
Cleaning of the environment and asepsis of the toolsAt the end of the day, the working rooms are swept and are more thoroughly cleaned atthe end of every week. The working tools used in the preparation of the cuttings, aswell as the boxes used for storage of the propagules, are disinfected at the end of eachday, by immersion and washing in a chlorine solution at 0.2%.
Planting of the cuttingsOnce the cuttings are prepared, they are treated with a root inducing compound(indolebutyric acid 6,000ppm mixed in neutral talc). The cuttings are planted in thecentre of the tubes and the substrate is compressed to provide the right firmness. Oncethe planting is completed, the trays are transferred to the nursery.
16 – 17 October 2000, Kota Kinabalu, Sabah, Malaysia 189
The nurseriesThe treated cuttings will stay in the nurseries during the whole period of root formationand acclimatisation. The first phase, involving the development of roots and of primarybranches, takes approximately 60 days. During this period, the cuttings are humidifiedunder a regime of intermittent water atomisation in such a way that the humidity at theleaf surface is constantly 100% and that of the nursery environment between 60 and70%. The average temperature inside the nurseries is approximately 25°C and the lightintensity is approximately 70% of full daylight. After 60 days, the frequency ofatomisation is decreased progressively as the cuttings enter the acclimatisation stage.Thus, in the first week, the wetting interval increases to 10 minutes and in the secondweek to 20 minutes, with each irrigation event lasting 2 to 3 minutes. After this, theplants are irrigated for 5 minutes every 3 hours and, finally, for 5 minutes every 6hours. On rainy days the irrigation regime may be modified.
Fertilisation of the cuttingsThe fertilisers are mixed together in appropriate proportions and quantities in a plasticbox in the machinery house that controls the irrigation of all the nurseries. The initialapplication of both macro- and micro-nutrient fertilisers is made to the cuttings via theirrigation system after 50 or 60 days. Thereafter the fertilisation is repeated every 10days.
Cleaning and pest/disease control in the nurseriesThe cleaning operation involves the removal of dead leaves, as well as the removal ofthe tubes containing cuttings that failed to root. The aim is to eliminate possible pestand disease sources. The waste materials are discarded and the tubes and trays sentto the wash section for cleaning with hot water jets. Insecticides and fungicides, appliedvia irrigation at the end of the day, are applied weekly to control and prevent pests anddiseases. Additional pest and disease control is carried out as required. The nurseriesare disinfected after all the cuttings have been dispatched by the application of asolution of chlorine and fungicides. The treated nursery is isolated with plastic curtains.The treatment is made during the weekends to reduce staff exposure to the chemicalsand prevent interruption of the other activities. Cleaning of the drains is done atintervals of 25 days, to ensure free drainage of the water and other debris.
Dispatch of cuttingsThe cuttings are generally ready to be transplanted to the field at the age of 120 days.In order to be dispatched, they must meet the quality standards defined by the StateAuthorities related to the Secretary of Agriculture. Any that do not meet thesestandards will be maintained longer in the nursery until they are suitable for dispatch tothe farms. The cuttings are dispatched within the tubes in their respective trays (54tubes per tray).
Transportation of the cuttingsThe rooted cuttings are transported in covered trucks to protect against sunshine andwinds. The trays are accommodated in such a way that the risks of damage to thecuttings during the transportation are minimal.
Preparation and packing of branches for on-farm grafting
The branches collected for grafting purpose are maintained with leaves and cut in sucha way that each fan branch supplies two to three grafts, each with five axillary buds.The extremities are treated with paraffin wax and then the stem segments are wrappedin moistened newspapers and placed in polystyrene boxes for transport to the place
16 – 17 October 2000, Kota Kinabalu, Sabah, Malaysia 190
where they will be used. The recommended procedure at the farm level is grafting ontobasal chupons by using one or two grafts on each chupon.
References
Fagundes N. B. 2000. Eucalyptus cloning. Pages 92-94 in Proceedings of The TechnicalMeeting “State of Knowledge on Mass Production of Genetically Improved Propagules ofCocoa “, 19th – 23rd October, 1998, Ilhéus, BA, Brazil. CEPLAC, Itabuna, Brazil.
Palacios J. B. 2000. Disponibilidade de material de clonagem no campo: Logística,operação/produçãoe custos. Pages 98-103 in Proceedings of The Technical Meeting “Stateof Knowledge on Mass Production of Genetically Improved Propagules of Cocoa “, 19th –23rd October, 1998, Ilhéus, BA, Brazil. CEPLAC, Itabuna, Brazil.
16 – 17 October 2000, Kota Kinabalu, Sabah, Malaysia 191
WORKSHOP PROGRAMME
New Technologies and Cocoa Breeding
15-17 October 2000Hotel Shangri-La’s Tanjung Aru Resort, Kota Kinabalu, Malaysia
Monday 16 October
Opening Session (together with INCOPED)
Session 1: IntroductionChairperson: Lee Ming Tong; Secretary: D. Ahnert• Introductory notes (A.B. Eskes)• Application and constraints of new technologies in plant breeding (M. Wilkinson)
Session 2: Use of molecular markers for identification of cocoa genotypesChairperson: T. Lass; Secretary: D. Furtek• Use of microsatellites for identification and genome analysis of cocoa genotypes
(A.M. Risterucci)• The detection of mislabelled trees in the International Cocoa Genebank, Trinidad
(ICG,T) (O. Sounigo)• Report on the BCCCA colloquium ‘Germplasm Characterisation Using Molecular
Tools’ (M. Gilmour)
Session 3: Use of molecular markers for genetic diversity studiesChairperson: Y. Adu-Ampomah; Secretary: J. N’Goran• Genetic structure, characterisation and selection of Nacional cocoa (D. Crouzillat)• Evaluation and use of the genetic diversity present in the International Cocoa
Genebank (ICG,T) in Trinidad (O. Sounigo)• Genetic structure and use of the CEPEC collection in Bahia, Brazil (J-L Pires)• Implication of the genetic structure of Theobroma cocoa for breeding strategies
(C. Lanaud)• USDA DNA fingerprinting programme for identification of T. cacao accessions
(J.A. Saunders)
INGENIC General Assembly
Tuesday 17 October
Session 4: Correlation of molecular markers with economically important traitsChairperson: M. Gilmour; Secretary: M. Wilkinson• Use of QTL’s detected for resistance to Phytophthora (C. Lanaud)• Use of QTLs for resistance to witches’ broom in cocoa breeding (D. Ahnert)• QTL studies carried out for agronomic, technological and quality traits in Ecuador
(D. Crouzillat)• QTL related to yield components and vigour traits identified in cocoa progenies and
perspectives for MAS (D. Clément)Session 5: Other topicsChairperson: B. Eskes; Secretary: O. Sounigo
16 – 17 October 2000, Kota Kinabalu, Sabah, Malaysia 192
• Resistance gene homologues for marker-assisted breeding of cocoa (J.S. Brown)• Proposal for a Gene Expression Micro-array Consortium (M. Guiltinan)• Biotechnology research at the Malaysian Cocoa Board (D. Furtek)• Novel technologies for cocoa swollen shoot virus indexing and resistance breeding
(S. Sackey)
Session 6: Propagation methodsChairperson: S. Maximova; Secretary: L. Alemanno• Integrated system for the propagation of cocoa: tissue culture, bentwood gardens
and rooted cuttings (M.J. Guiltinan)• Advances in cocoa (Theobroma cacao) propagation by somatic embryogenesis in
Mexico (O. López-Baez)• Mass multiplication of cocoa clones on a semi-industrial scale by tube rooted
cuttings in Brazil (J.B. Palacios)
Session 7: General discussions and conclusionsChairperson: D. Ahnert; Secretary: M. EndFormulation of conclusions and recommendations (based on presentations by thechairpersons of each session)
Closing Session
16 – 17 October 2000, Kota Kinabalu, Sabah, Malaysia 193
LIST OF PARTICIPANTS
Name Organisation / Address Tel / Fax / E-mail
Andrea Cattaruzza Mars Confectionery, Division ofMars U.K. Ltd, DundeeRoad, Slough, SL1 4JX,United Kingdom
Tel. +44 1753 514369Fax. +44 1753 [email protected]
Ange MarieRisterucci
Cirad-Amis, TA 40/03, Av.Agropolis, 34398Montpellier Cedex 5, France
Tel. +33 4 67 61 56 94Fax. +33 4 67 6156 [email protected]
rAntonio Figueira Av. Centenario 303, CP-96,
Piracicaba SP 13400-970, Brazil
Tel. +55 194294814Fax. +55 [email protected]
Ayoola Fasina Cocoa Research Institute ofNigeria, KM 14, Ibadan-Ijebu-Uda Road, PMB 5244,Ibadan, Nigeria
Tel. +234 22410040Fax. +234 [email protected]
gAzhar Mohammed Malaysian Cocoa Board, 5th &
6th Floor, Wisma SEDCO,Locked Bag 211, 88999Kota Kinabalu, Sabah,Malaysia
Tel. +60 88-252572Fax. +60 88-
253037/[email protected]
Albertus Eskes Cirad-Cp, TA 80/02, Av.Agropolis, 34398Montpellier Cedex 5, France
Tel. +33 4 67 61 56 10Fax. +33 4 67 61 57 [email protected]
Boamah Adomako Cocoa Research Institute ofGhana, P. O. Box 8, Tafo-Akim, Ghana
Tel. +233 27609900Fax. +233 [email protected].
ghCarol Knight 128 N. Wildcat Run Court,
Advance, NC 27006, UnitedStates of America
Tel. +1 336 9403492Fax. +1 336 9403393cknight@acri-
cocoa.orgCaroline Ford University of Reading, School
of Plant Sciences,Whiteknights, P. O. Box221, Reading, RG6 2AS,United Kingdom
Tel. +44 118 9318071Fax. +44 118 [email protected]
Chong Tan Chun Agriculture Research Station,Quoin Hill, P.O. Box 324,91007 Tawau, Sabah,Malaysia
Tel. +60 89-915011Fax. +60 89-915914
Claire Lanaud Cirad-Amis, TA 40/03, Av.Agropolis, 34398Montpellier Cedex 5, France
Tel. +33 4 67 61 56 94Fax. +33 4 67 6156 [email protected]
Dario Ahnert Universidade Estadual deSanta Cruz, Prs-Reitorio dePesquisa e Pss-Graduagco,Km 16, Rodovia Ilheus-Itabuna, CEP: 45650-000Brazil
Tel. +55 [email protected]
16 – 17 October 2000, Kota Kinabalu, Sabah, Malaysia 194
David Lim P. O. Box 298, 91007 Tawau,Sabah, Malaysia
Tel. +60 88-75747Fax. +60 [email protected]
David Iwaro Cocoa Research Unit,University of Indies, St.Augustine, Trinidad &Tobago
Tel. +1 809 6624996Fax. +1 809 [email protected]
Didier Clément Cirad-Cp, TA 80/02, Av.Agropolis, 34398Montpellier Cedex 5, France
Tel. +33 4 67 61 71 13Fax. +33 4 67 61 57 [email protected]
Didier Paulin Cirad-Cp, TA 80/02, Av.Agropolis, 34398Montpellier Cedex 5, France
Tel. +33 4 67 61 71 13Fax. +33 4 67 61 57 [email protected]
Dominique Crouzillat Nestlé, Centre deBiotechnologieVégétale,101 Av. Gustave-Eiffel, Notre-Dame d'Oe, B.P. 9716, 37097 Tours,Cedex 2, France
Tel. +33 2 47 62 83 83Fax. +33 2 47 49 14 [email protected]
Douglas Furtek Malaysian Cocoa Board, 5th &6th Floor, Wisma SEDCO,Locked Bag 211, 88999Kota Kinabalu, Sabah,Malaysia
Tel. +60 88-252572Fax. +60 88-
253037/[email protected]
Francis Aloysius Malaysian Cocoa Board, 5th &6th Floor, Wisma SEDCO,Locked Bag 211, 88999Kota Kinabalu, Sabah,Malaysia
Tel. +60 88-252572Fax. +60 88-
253037/[email protected]
Hiroyuki Utsunomiya Meiji Seika Kaisha, Ltd FoodR&D Laboratories, 5-3-1Chiyoda; Sakado ShiSaitama Ken, Japan
Tel. +81 492 5617Fax. +81 [email protected]
Hong Ngit Ming P. O. Box 33, 91007 Tawau,Sabah, Malaysia
Tel. +60 89-761180Fax. +60 [email protected]
Juan CarlosMotamayor
Cirad, TA 40/03, Av. Agropolis,34398 Montpellier Cedex 5,France
Tel. +33 4 67 61 55 01Fax. +33 4 67 61 56 [email protected]
James Saunders USDA, Bldg 50, Room 100,Beltsville, MD 20705, UnitedStates of America
Tel. +1 301 5047477Fax. +1 301 [email protected]
Jeanne N'Goran Central Centre National deRecherche Agricole, 01 BP1827, Bingerville, Abidjan01, Côte d'Ivoire
Tel. +225 23 45 31 16Fax. +225 23 45 33 05
Julie Flood CAB International, Dept.Horticulture and PlantationCrops, Wallingford, Oxon,OX 10 8DE, UnitedKingdom
Tel. +44 1491 829000Fax. +44 1491 [email protected]
Keith Chapman Plant Production Officer,Industrial Crops, FAO/RAP,39 Phra Artit Rd.,Banglambu, 10200Bangkok, Thailand
Tel. +66 22 817844 ext306
Fax. +66 2 [email protected]
g
16 – 17 October 2000, Kota Kinabalu, Sabah, Malaysia 195
Kelvin Lamin Malaysian Cocoa Board, 5th &6th Floor, Wisma SEDCO,Locked Bag 211, 88999Kota Kinabalu, Sabah,Malaysia
Tel. +60 88-252572Fax. +60 88-
253037/[email protected]
Laurence Alemanno Cirad-Cp TA 80/02, Av.Agropolis, 34398Montpellier Cedex 5, France
Tel. +33 4 67 61 7107Fax. +33 4 67 61 57 93laurence.alemanno@ci
rad.fr
Lee Ming Tong Malaysian Cocoa Board, 5th &6th Floor, Wisma SEDCO,Locked Bag 211, 88999Kota Kinabalu, Sabah,Malaysia
Tel. +60 88-252572Fax. +60 88-
253037/[email protected]
Mark Guiltinan 516 Wartik Laboratory, ACRIMolecular Biology, ThePennsylvania StateUniversity, PA 16802,United States of America
Tel. +1 814 8637286Fax. +1 814 [email protected]
Martin Aitken Almirante Centro de Estudosde Cacau, Caixa Postal 55-45630, Itajuipe, Bahia,Brazil
Tel. +55 732111001Fax. +55 [email protected]
omMartin Gilmour Mars Confectionery, Division of
Mars U.K. Ltd, DundeeRoad, Slough, SL1 4JX,United Kingdom
Tel. +44 175 3514369Fax. +44 175 [email protected]
m.comMichelle End BCCCA, 37-41 Bedford Row,
London WC1R 4JH, UnitedKingdom
Tel. +44 20 74049111Fax. +44 20 [email protected]
g.ukMike Wilkinson University of Reading, School
of Plant Sciences,Whiteknights, P. O. Box221, Reading, RG6 2AS,United Kingdom
Tel. +44 118 9318075Fax. +44 118 9316577m.j.wilkinson@reading.
ac.uk
Mohd Yusoff Abd.Samad
Malaysian Cocoa Board,Research Centre andManagement of CocoaQuality, P.O. Box 60237,91012 Tawau, Sabah,Malaysia
Tel. +60 89-915605 / 4Fax. +60 [email protected]
Nguyen Lam Sou 32 bis Nguyen Van Mai Dist 3HCM City, Vietnam
Tel. +84 8-9300557/8114994
Fax. +84 [email protected]
Nguyen ManhThong
32 bis Nguyen Von Mai, Dist. 3HCM City, Vietnam
Tel. +84-8-8231164/9300557
Fax. +84 [email protected]
Nguyen Thi MyNguyet
University of Agriculture &Forestry of HCM City,Vietnam
Tel. +84 [email protected]
n
Nguyen VinhPhuoc
114A, Tran Quang Khai St.,Dist, 1, HCM City, Vietnam
Tel. +84 88484292/9300557
Fax. +84 8 [email protected]
16 – 17 October 2000, Kota Kinabalu, Sabah, Malaysia 196
Niemenak Nicolas University of Yaounde I, HigherTeacher’s Training College,BP47, Yaounde, Cameroon
Tel. +237 [email protected]
et.cm
Nik Aziz Nik Mat Malaysian Cocoa Board, 5th &6th Floor, Wisma SEDCO,Locked Bag 211, 88999Kota Kinabalu, Sabah,Malaysia
Tel. +60 88-252572Fax. +60 88-
253037/239575
Orlando López-Baez
Universidad Autonoma DeChiapas. Fac. De CienciasAgricola. Apdo Postal No.34, Tapachula, Chiapas,37000 Mexico
Fax. +52 962 70128
Olivier Deheuvels c/o Délégation du Cirad, 01 BP6483, Abidjan 01, Côted'Ivoire
Tel. +225 20 21 16 25Tel. +225 20 22 18 69Fax. +225 20 21 43 68olivier.deheuvels@cira
d.fr
Olivier Sounigo Cocoa Research Unit,University of the WestIndies, St. Augustine,Trinidad & Tobago
Tel. +1 868 662 87 88Fax. +1 868 662 87 [email protected]
Osman Yusof Malaysian Cocoa Board, 5th &6th Floor, Wisma SEDCO,Locked Bag 211, 88999Kota Kinabalu, Sabah,Malaysia
Tel. +60 88-252572Fax. +6088-
253037/239575
Peter Epaina Cocoa Breeder, PNG Cocoa &Coconut Research Institute,P. O. Box 1846, Rabaul,Papua New Guinea
Tel. +675 9839131Fax. +675 [email protected]
Pham Hong DucPhuoc
181/493A Q10, Tan Phuoc,HCM City, Vietnam
Tel. +84 8 8966946Fax. +84 8 [email protected]
nPhilippe Bastide CP 375 São Tomé, R. D. São
Tomé é Príncipe, FranceTel. +239 12 23 342Fax. +239 12 23 343philippe.bastide@cirad.
frRosmin Kasran Malaysian Cocoa Board, 5th &
6th Floor, Wisma SEDCO,Locked Bag 211, 88999Kota Kinabalu, Sabah,Malaysia
Tel. +60 88-252572Fax. +60 88-
253037/[email protected]
Salomon Nyassé IRAD, B. P. 2067, Yaoundé,Cameroon
Tel. +237 237 436Fax. +237 237 [email protected]
Sammy Sackey Dept. of BiochemistryUniversity of GhanaLegon, Accra, Ghana
Tel. +233 [email protected]
Sapiyah Hj. Subali Malaysian Cocoa Board, 5th &6th Floor, Wisma SEDCO,Locked Bag 211, 88999Kota Kinabalu, Sabah,Malaysia
Tel. +60 88-252572Fax. +60 88-
253037/[email protected]
16 – 17 October 2000, Kota Kinabalu, Sabah, Malaysia 197
Siela Maximova 113 Tyson, ACRI MolecularBiology, The PennsylvaniaState University, PA 16802,United States of America
Tel. +1 814 8637286Fax. +1 814 [email protected]
Steven Brown USDA, Subtropical HorticultureResearch Station, 13601Old Cutler Road, Miami,Florida 33158, UnitedStates of America
Tel. +1 305 254 [email protected].
gov
Tan Chia Lock Malaysian Cocoa Board, 5th &6th Floor, Wisma SEDCO,Locked Bag 211, 88999Kota Kinabalu, Sabah,Malaysia
Tel. +60 88-252572Fax. +60 88-
253037/[email protected]
Tony Lass Cadburys International Ltd., P.O. Box 122, Bournville,Birmingham, B30 2LU,United Kingdom
Tel. +44 121 4514560Fax. +44 121 [email protected]
Trinh Duc Minh International CooperationDepartment Hoa Thang,Buon Ma Thuot City, DakLace Province, Vietnam
Tel. +84 50862845Fax. +84 [email protected]
Vic Hartney Malaysian Cocoa Board, 5th &6th Floor, Wisma SEDCO,Locked Bag 211, 88999Kota Kinabalu, Sabah,Malaysia
Tel. +60 88-252572Fax. +60 88-
253037/[email protected]
Wilbert Phillips Ap. 7170, CATIE, Turrialba,Costa Rica
Tel. +506 5566440Fax. +506 556 [email protected]
Yaw Adu-Ampomah Plant Breeding, CocoaResearch Institute ofGhana, Private Mail Bag,International Airport, Accra,Ghana
Tel. +233 27609900Fax. +233 [email protected].
gh