Embed Size (px)
Citation preview
1
Measuring the Effects of Internationalization on
Technological Innovation Efficiency
Cruz Cázares Claudio University of Barcelona, Av. Diagonal 690, 08034 Barcelona
Filipescu Diana Andreea EADA Business School, Carrer d'Aragó, 204, 08011 Barcelona
Abstract
It is argued that international firms are more innovative than non-international ones as they are
able to scan and integrate knowledge and technology. In this paper we aim to observe whether this
internationalization advantage also helps firms to improve the efficiency of the technological
innovation process. Following a two-stage methodology, we first estimate the technological
innovation efficiency by means of an intertemporal DEA and then explain it based on firm
internationalization. Results of the first stage indicate that there is much room to improve the
technological innovation efficiency of the firms under analysis and results from the second stage
indicate that firm internationalization foster innovation efficiency.
Keywords: Internationalization, innovation, efficiency
INTRODUCTION
It is widely agreed that technological innovation represents a source of competitive advantage
that positively affects firms’ internationalization (Kyläheiko et al., 2011; Lachenmaier & Wössmann,
2006; Pla & Alegre, 2007; Vila & Kuster; 2007). Innovation leads to internationalization when firms
are able to create a new product that generates demand not only in the home market but also in other
foreign markets (Basile, 2001; Cassiman & Golovko, 2010). However, the relation between these two
processes does not end here and firms, once they develop activities abroad, acquire knowledge about
2
foreign markets and competitors and can become more competitive themselves (Golovko & Valentini,
2011). This need of competitiveness is associated with a higher commitment to innovation (Hitt et al.,
1997), especially to product one and patents.
However, a question arises when we look at the efficiency of the technological innovation in
international environments. Does internationalization make firms be more efficient in their
technological innovation process? To answer this question we develop a two-stage paper. In the first-
stage we propose a measurement of technological innovation process efficiency and in the second-
stage we explain this efficiency based on firms’ internationalization. In the first-stage we do not use a
simple measure of innovation input or innovation output since the result would be one-eyed. Tidd and
Bessant (2009) stress that innovation is a complex process and that it should be evaluated as such, not
as a single input or output activity. On one hand, solely considering the innovation inputs could lead to
misleading results (Koellinger, 2008), e.g. R&D expenditures that are not transformed into
innovations are sunk cost that could negatively alter the efficiency score. On the other hand, only
considering the innovation outputs without taking into consideration the effort needed to achieve those
outputs (innovation inputs) might overestimate the efficiency score.
The aim of this research is tow-fold. First, considering two innovation inputs (R&D capital
stock and technological knowledge) and two outputs (number of product innovations and patents) we
estimate the technological innovation efficiency in order to observe how efficient firms are when
transforming the innovation inputs into innovation outputs. Second, we aim to evaluate how
internationalization affects this technological innovation efficiency. To achieve our objective we
analyze a panel data sample of 3456 observations corresponding to 536 Spanish manufacturing firms
for the period 1992-2005.
Although few studies have sought to measure technological innovation efficiency, most of
them have employed mixed innovation inputs or outputs beyond the innovation process (Guan et al.,
2006; Zhong et al., 2011), others have disregarded the lag effect of R&D on innovation outputs (Guan
et al., 2006; Lee et al., 2010) or have used macro-level data (Lee et al., 2010). Moreover, the linkage
between firms’ internationalization and technological innovation efficiency is practically non-existent.
Within this context, the contribution of this paper is threefold. First, we estimate a technological
3
innovation efficiency measure considering exclusively innovation inputs and outputs in the analysis,
which allows an objective evaluation of the technological innovation process. Second, this paper takes
into consideration the lagged effects of innovation inputs in producing the desired outputs while
estimating efficiency. And thirdly, we link the efficiency of the technological innovation process with
firms’ internationalization – all these at a micro-level.
This paper proceeds as follows. In the second section the theoretical framework is developed
and the hypotheses are presented. The data and methods for developing the empirical analysis are
described in the third section. The results from the first- and second-stage estimations are shown in the
fourth section, while the fifth is reserved for discussion and conclusions.
THEORETICAL FRAMEWORK
The evolution of the international economy has revealed important changes regarding the
structure of the relationships among economic agents and the variables determining the conditions of
competitiveness (Fletcher, 2001). There are two main factors that stand out over many others: the first
is the growing number of elements of economic organization affected by internationalization; the
second refers to the increasing complexity of the innovative process (Molero, 1998; Rogers, 2004).
Internationalization is an important issue for firms that often results in vital growth, useful
learning outcomes and superior financial performance (Prashantham, 2005). The first important steps
in firms’ internationalization process are generally assumed to be trade related, and although import
activity is considered to play a role, it is export activity that is most often recognized as being the
initial real step in the internationalization process (Jones, 2001). However, this is not an easy process
because international markets face a greater competitive pressure than national markets (Prashantham,
2005).
In order to survive in the competitive scene that companies have faced in recent years, which
is characterized by a high level of dynamism (Díaz et al., 2008; López & García, 2005; Teece, 1998),
the continual renewal of competitive advantage through innovation and the development of new
capabilities have become necessary (Cho & Pucik, 2005; Grant, 1996). In this context, technology
4
represents one of the most important factors in increasing the national and international
competitiveness of the firms (Cassiman & Golovko, 2010), while successful technological innovation
in new products and processes is increasingly more regarded as the central issue in economic
development (Porter, 1998).
Although a lot of research is being focused on the internationalization of the firm and the
technological innovation process (Cassiman & Golovko, 2010; Díaz et al., 2008; Filipescu et al. 2009;
Golovko & Valentini, 2011; López & García, 2005; Monreal et al., 2012; Salomon & Shaver, 2005),
up to the best of our knowledge there is no evidence regarding the effect that internationalization has
upon the efficiency of the technological innovation process.
Learning by Doing Concept
Internationalization is generally argued to be a very beneficial strategy for a firm. Firms
engaged in international activities provide gains for employees in the form of higher pay and better
employment, show faster productivity growth, are more innovative and have higher survival chances
compared to their home counterparts (Bernard & Jensen, 1999). Academic evidence emphasizes the
so-called learning-by-exporting concept (MacGarvie, 2006; Salomon & Shaver, 2005; Zhang et al.,
2010) according to which internationalization may also serve as a way to acquire new information, in
particular new technological knowledge not available in the home markets that may increase firm
innovation. Indeed, once a firm is involved in more international markets and/or more deeply in a
given one, it is more likely to proactively acquire new knowledge about foreign competition, markets,
products, which are unavailable in the home market (Damijan et al., 2010). This is useful for pursuing
larger-scale R&D projects and developing other innovative activities through further investments in
technology, since constant innovation is required to sustain competitiveness (Salomon & Shaver,
2005; Zhang et al., 2010).
Internationalization can also reduce costs associated with innovation and, consequently,
achieve greater returns from continuous technological innovations; thus, firm internationalization is
considered one of the main determinants of its innovation (Kotabe et al., 2002). In other words,
increased international involvement induces a firm to subsequently develop more innovations and to
5
achieve greater returns from innovation by operating in more markets (Harris & Li, 2009; Hitt et al.,
1997). Therefore, firms could enhance their competency base by learning from their interactions with
international markets and, thus develop their innovative capacities even further (Harris & Li, 2009;
Zhang et al., 2010). Such learning derived from global markets can foster increased R&D and
product/process innovation within firms through gains in firm productivity. To sum up, a firm’s
increased presence in international contexts boosts the returns to its sustained innovative efforts
(Alvarez & Robertson, 2004), and may also lead to more rapid capitalization of R&D and innovation
costs.
Technological Innovation Efficiency Concept
When evaluating the performance implications of innovation activities, some studies have
focused on the short-term direct effect of innovation inputs on firm performance (George et al., 2002),
while others seek the long-term indirect effect through the innovations achieved (Balkin et al., 2000).
In addition, different types of innovation inputs have been used, such as R&D expenditures (O’Regan
et al., 2006), R&D intensity (Hitt et al., 1997) and R&D manpower (Wang & Huang, 2007), and a
variety of innovation outputs like product innovations (Li, 2000), process innovations (Akgün et al.,
2009) and patents (Zahra & Nielsen, 2002). This use of a wide range of measurements and effects has
led to results that are often inconclusive and ambiguous, highlighting the need for further examination
of the innovation-performance relationship.
Technological innovations are achieved through a long and complex process, involving the
phases of searching, selecting, implementing and capturing value (Tidd & Bessant, 2009) and a
realistic evaluation of the how the technological innovation activities are effected should encompass
the innovation process as a whole. The resource-based view (RBV) gives us support for considering
innovation as a process and for evaluating it from an efficiency perspective; RBV supports the concept
of the transformation of firm resources – R&D – into desirable outputs – innovations – through the
use of the internal capabilities – efficiency. These capabilities are defined as the firm ability to use and
transform the owned resources to a desired end. Furthermore, without these capabilities – efficiency –
the mere possession of a large quantity of resources – R&D – does not guarantee the creation of a
6
competitive advantage – innovations – or superior performance (Song et al., 2007). As previously
commented, we define technological innovation efficiency as the relative capability of a firm to
maximize innovation outputs given a certain quantity of innovation inputs.
Measuring efficiency of innovation activities from the technical efficiency perspective (Farrel,
1957) is not new in the literature but the relevant empirical evidence is limited. Divergences can be
observed in these studies as some included inputs and outputs beyond the technological innovation
process (e.g. Guan et al., 2006; Hashimoto & Haneda, 2008) and some did not take into consideration
the time lag required before R&D projects are completed and innovation outputs are achieved (Guan
et al., 2006; Revilla et al., 2003). Finally, those papers at a micro-level that exclusively considered
inputs and outputs of the technological innovation process and controlled for the lagged effects (e.g.
Guan & Chen, 2010; Wang & Huang, 2007) do not explain the efficiency based on the international
firm activity. Following the above-mentioned, our hypothesis is posed:
Hypothesis: High rates of firm internationalization positively affect the efficiency of the
technological innovation process.
METHODS
Data and Sample
In order to empirically test our hypothesis we used the Survey of Business Strategy (SBS),
which is a firm-level panel dataset of Spanish innovating and non-innovating manufacturing firms
covering the period from 1990 to 2005. The SBS is random and stratified according to industry sector
- NACE-Rev.1 classification- and firm size (Fariñas & Jaumandreu, 2000)1. The aim of the SBS is to
document the evolution of the characteristics of the strategies used by Spanish firms. It provides
information on markets, customers, products, employment, outcome results, corporate strategy, human
resources, and technological activities.
1 Firms with between 10 and 200 employees are selected trough a random stratified sample. Firms with more than 200
employees are surveyed on a census based.
7
The sample consist of an unbalanced panel since not all the firms answered throughout the 16
years, that is, new firms are were added each year and others ceased to provide information2. After
deleting observations with missing values in the variables under analysis, we considered two main
aspects to restrict the firms in our data. First, firms should have answered the SBS for at least six
consecutive years. Second, since the one key component of the paper is to calculate the efficiency of
the technological innovations, those firms that did not registered any R&D expenditures during any
year of the panel were excluded from the sample. As explain latter, we calculated the inputs and
outputs of the technological innovation efficiency as the mean of the current year plus the three
previous years, leading to remain with a sample covering the period from 1994-2005. Due to the
sensibility to extreme values of the program used to estimate the intertemporal DEA, those
observations that registered cero outputs were removed from the sample. In order to avoid the creation
of a spurious or mediocre frontier in the first-step, we kept as much information as possible. That is,
whether a firm with six observations of positive inputs had the second and fourth observations with
cero outputs, we removed from the sample uniquely the second and fourth observations and kept the
rest for performing the DEA bootstrap. Nevertheless, due to a restriction of the method used in the
second-stage (Tobit model with random effects) we had to remove all observations of this example,
leading a difference in the sample size between the two stages.
Then, the final sample of the first-stage consists of 2472 observations of 415 firms. In the
second-stage analysis the sample gathers 2315 observations of 362 firms from which 11.34 percent
have observations for the complete panel.
Measurement of Technological Innovation Efficiency
The traditional cost-benefit analysis, following a parametric approach, in which the single
optimized regression is assumed to apply to each firm under the analysis, has the major weakness that
it requires the imposition of a specific function form and specific assumption about the error
2 In the first wave of the SBS, in 1990, 2188 firms were surveyed according the criteria above mentioned in footnote 3. By the year 2005, SBS had an unbalanced panel of 4050 firms surveyed. Aiming keeping the original firms during the complete panel motivated the consecutives waves of the SBS. Each year, the SBS intended to add to the sample all the new firms with more than 200 employees and a random and stratified sample which, approximately, represent the 5% of the new firms with between 10 and 200 employees. The annual response rate was around 90% (see http://www.funep.es/esee/sp/sinfo_cobertura.asp for detail information of the SBS).
8
distribution. Additionally, for a standard parametric method is very problematic to jointly consider
multiple inputs and multiple outputs, as the innovation activity usually embraces. Data envelopment
analysis (DEA) overcomes these problems since it uses a mathematical programming model to
estimate the best-practice frontier without a specific functional form assumption and, permits the
evaluation of firms based on simultaneous dimensions given that it allows the use of multiple inputs
and outputs. DEA can be used to calculate the maximal performance measurement of each decision
making unit (DMU) -firms in this case- given a certain number of inputs, relative to all DMUs in the
sample.
Farrell (1957) introduced the first systematic measurement of technical efficiency. Latter,
Charnes et al. (1978) established he CCR DEA model under the assumption of that production
exhibited constant returns to scale (CRS). This model was extended, by Banker et al. (1984), for the
case where there are variable returns to scale (VRS). The main difference between the CRS and the
VRS is that the former assumes that the plant is operating at its optimal scale or minimum average
cost, while the latter avoids this assumption. Following Alvarez and Crespi (2003) we use the VRS to
estimate our model since we consider it more accurate in the sense that small firms, generally, operate
with a production scale lower than the optimal. Furthermore, Frantz (1992) argues that usually plants
do not operate at optimal scale due to market structure and the competitive market pressures the firm
are subjugated to. Additionally, the VRS allows us to exclusively measure the inefficiency caused by
the suboptimal level of outputs given a certain amount of inputs and not the inefficiency caused by the
inadequate plant size. We use the VRS intertemporal DEA output-oriented since we consider that
firms first establish the R&D budgets (inputs) and then seek innovation achievements, that is, output
maximization.
We consider more convenient using the intertemporal estimation rather than a cross-sectional
estimation because the latter assumes a yearly technical change while the intertemporal model
assumes stability and comparability between firms over the years of analysis (Mittal et al., 2005).
Shepard’s distances are employed in the model, where the efficiency score are less or equal than the
unity. If a firm obtaining a score equal to the unit indicates that it is on the frontier and, thus, is
9
efficient in the transformation of inputs to obtain the desires outputs. The efficiency score obtained
were transformed into percentage, where the 100% indicates that firm is 100% efficient in
transforming its innovation inputs into innovation outputs. The model estimation was carried out
using FEAR software (Wilson, 2008).
Inputs and Outputs Selection
Recall that RBV considers that firms use their multiple resources (inputs) and transform them
into multiple outputs through the use of their capabilities. Based on this productive perspective and on
the existent literature we select the two technological innovation inputs to be transformed into two
technological innovation outputs. R&D capital stock and high-skilled staff3 are the two inputs
selected. The R&D capital stock has been used in previous studies analyzing the innovative firm
efficiency following the DEA approach (e.g. Wang, 2007). It was estimated using the traditional way
(Griliches, 1979), where the R&D capital stock (RDCS) depends on the R&D expenditure (RD) of
firm i at time t plus the previous R&D expenditures done by the firm affected by a depreciation rate
( ). The previous R&D expenditures goes up to four years before t (w=1…4) and the
depreciation rate was set to 20%.
RDCS�� = RD�� + ∑ (1 − γ)��� RD�(���)
Since DEA methodology demands it, R&D expenditures were deflated at year 1995 before
calculating RDCS. Due to the lack of a suitable deflator for R&D expenditures (Lichtenberg, 1984) we
selected as a deflator the intermediate input price indices from the EU KLEMS (2008) database.
The high-skilled staff, representing the technical knowledge resources, is also considered in
the literature as innovation inputs (Damanpour & Aravind, 2006). The basis of this argument is that
the technical employees and employees with higher academic training, with diversified backgrounds
and managerial skills, influence positively the transformation of technological investments into
product and process innovation achievements through the generation of ideas (Ettlie et al., 1984;
3 Some authors (Guan & Chen, 2010) also considered the number of R&D employees as an input but in our case we do not include it since the R&D expenditures also includes the salaries of the R&D personnel.
(1)
10
Koellinger, 2008). Thus, the second input used in this study is the mean of the current year plus three
previous years of the number of high-skill staff.
As mentioned before, we selected two outputs of the innovation process that account for the
number of product innovations (NPI) and the number of patents (NPAT). Some studies have
considered new product rate or sales due to new product as the innovation output in their efficiency
analysis (Guan et al., 2006; Guan & Chen, 2010) but we consider the first measurement as a better one
fitting to our objective since NIP only account for the technological innovation process and not for the
firm capacity to profit from the innovations. As well, the rate of patents achieved is a common
innovation output used in the literature to account for innovation outputs (e.g. Revilla et al., 2003;
Hashimoto & Haneda, 2008)4. Both rate of new products and patents were calculated as the mean of
the last four years.
The Model
In order to test our hypothesis, we take the technological innovation efficiency, estimated in
the first state, as the dependent variable. The main explanatory variable in our analysis is the firm
internationalization that is measured as the percentage of total sales due to international sales. The
theoretical and empirical evidence offer guidance regarding what variables should also be included as
explanatory variables. Firm age is included in our model since it represents the firm experience,
learning capacity and knowledge base and entrepreneurial behavior of firms (Sorensen & Stuart, 2000;
Galende & De la Fuente, 2003; Santamaría et al., 2009). Firm age embodies management and
organizational excellence, enhancing absorption capacity, and enabling the integration of the external
knowledge acquired in international markets (Bughin & Jacques, 1994; Dyerson & Mueller, 1999). To
calculate firm age, we subtracted the year of the firm’s foundation year from the current year t.
The model also controls for the possible effect of industry competitiveness on the
technological innovation efficiency. Firms competing in dynamic markets or in markets with high
concentration rates might not have tolerance to be inefficient in order to compete successfully. We
4 Although, the process innovations might also derived from R&D activities, due to lack of data we could not include it in the analysis. The OECD (2005) also considers organization and marketing innovations as outcomes but they are not included in the analysis due to the fact that they might not depend on R&D activities.
11
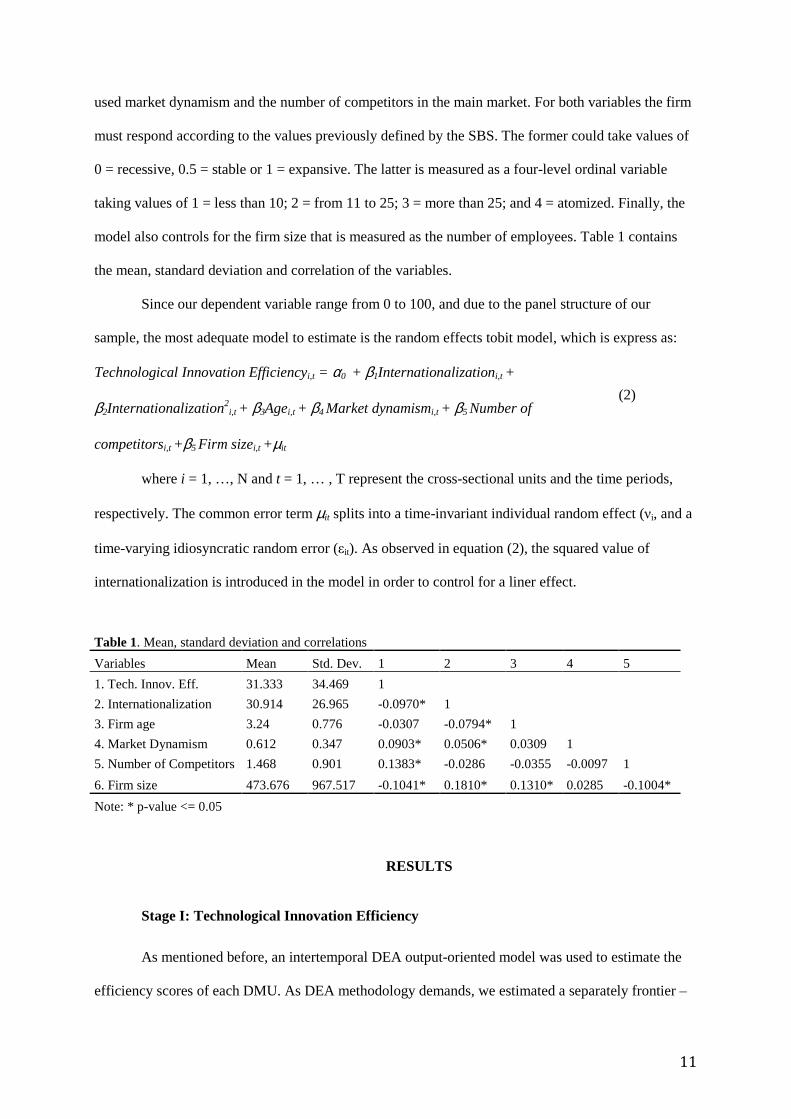
used market dynamism and the number of competitors in the main market. For both variables the firm
must respond according to the values previously defined by the SBS. The former could take values of
0 = recessive, 0.5 = stable or 1 = expansive. The latter is measured as a four-level ordinal variable
taking values of 1 = less than 10; 2 = from 11 to 25; 3 = more than 25; and 4 = atomized. Finally, the
model also controls for the firm size that is measured as the number of employees. Table 1 contains
the mean, standard deviation and correlation of the variables.
Since our dependent variable range from 0 to 100, and due to the panel structure of our
sample, the most adequate model to estimate is the random effects tobit model, which is express as:
Technological Innovation Efficiencyi,t = α0 + β1Internationalizationi,t +
β2Internationalization2i,t + β3Agei,t + β4 Market dynamismi,t + β5 Number of
competitorsi,t +β5 Firm sizei,t +µit
where i = 1, …, N and t = 1, … , T represent the cross-sectional units and the time periods,
respectively. The common error term µit splits into a time-invariant individual random effect (νi, and a
time-varying idiosyncratic random error (εit). As observed in equation (2), the squared value of
internationalization is introduced in the model in order to control for a liner effect.
Table 1. Mean, standard deviation and correlations
Variables Mean Std. Dev. 1 2 3 4 5
1. Tech. Innov. Eff. 31.333 34.469 1
2. Internationalization 30.914 26.965 -0.0970* 1
3. Firm age 3.24 0.776 -0.0307 -0.0794* 1
4. Market Dynamism 0.612 0.347 0.0903* 0.0506* 0.0309 1
5. Number of Competitors 1.468 0.901 0.1383* -0.0286 -0.0355 -0.0097 1
6. Firm size 473.676 967.517 -0.1041* 0.1810* 0.1310* 0.0285 -0.1004*
Note: * p-value <= 0.05
RESULTS
Stage I: Technological Innovation Efficiency
As mentioned before, an intertemporal DEA output-oriented model was used to estimate the
efficiency scores of each DMU. As DEA methodology demands, we estimated a separately frontier –
(2)
12
DEA model- for each of the 19 industries under analysis in our sample, assuming that each subsample
fulfill the three necessary conditions of homogeneity (Haas & Murphy, 2003); a) the DMUs are
engaged in the same process; b) all DMUs are evaluated under the same measures of efficiency and; c)
all DMUs operates under the same conditions.
Recall that the efficiency scores range from 0 to 100. The interpretation of these values should
be that the difference between the score obtained and 100 is the percentage of inefficiency. For
example, a firm with a score of 84 would indicate that at the same level of inputs the firm is 16%
inefficient, relative to its industry, due to the lack of capability to transform innovation inputs into
innovation outputs. This score also indicates the firm is 84% efficient.
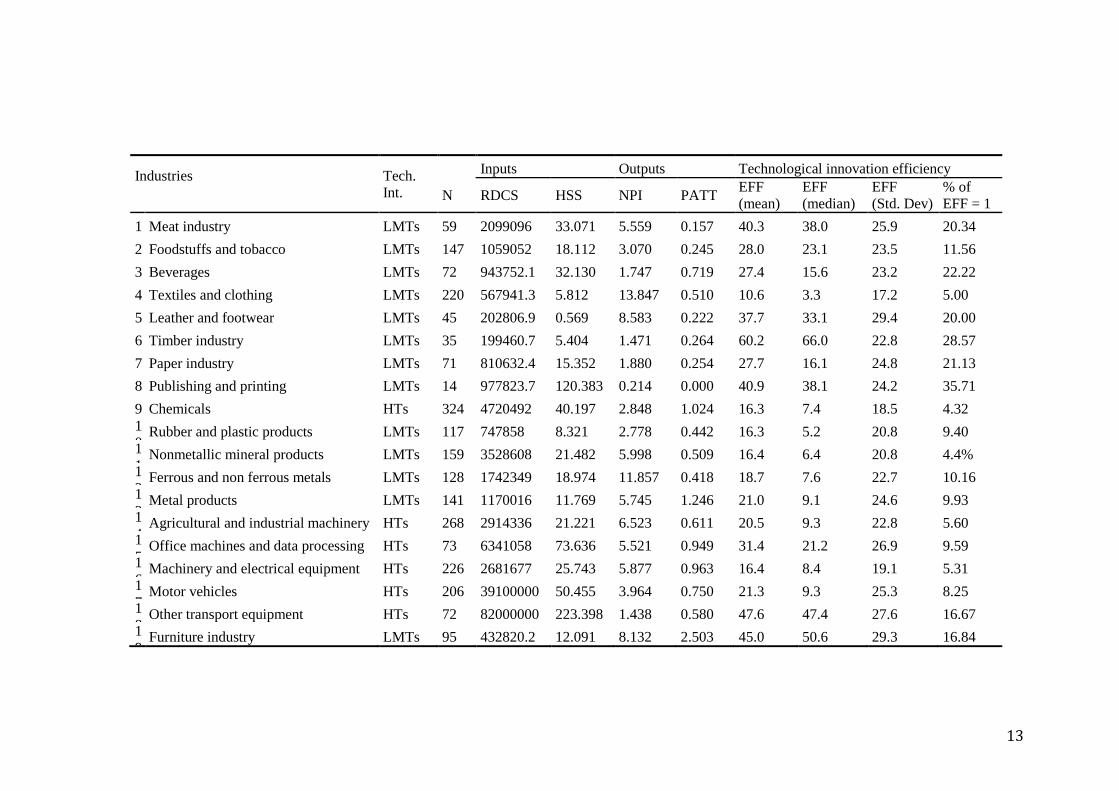
Due to a limitation of space, we cannot show the efficiency score for each firm under analysis,
but in Table 2 we present the mean and median of the efficiency scores (EFF) and the percentage of
efficient firms by industry. In this table there are also presented the number of firms analyzed as well
as the mean of the inputs and outputs used for calculating the efficiency scores. What calls our
attention is the observe heterogeneity between the different industries regarding the efficiency scores.
As observed in Table 2, six of the industries under analysis showed a mean of the efficiency
scores lower than the 20%, showing a great room for improving the technological innovation
efficiency of the Spanish manufacturing firms. Nevertheless, five industries show efficiency scores
averages larger than the 40%. The highest mean of the technological innovation efficiency is the one
of the timber industry (60.2%), followed by the other transport equipment industry with an efficiency
average of 47.6%. Contrary, the lowest averages of the efficiency scores are those for the textile and
clothing (10.6%), chemical (16.3%) and rubber and plastic products (16.3%). Based on these results,
we cannot say that one industry is more efficient than other since no common frontier has been
established due to the DEA methodology requirements (Brown, 2006). But what we can learn from
these results is that the uncertainty or risk associate to successful innovations outcomes is higher in
those sectors with lower efficiency scores. In other words, it is easier to obtain innovations in the
timber industry where technology and products are not as complex as those in chemical industries
where many attempts and tests have to be performed before launching the new –or improved- product.
13
Industries
Tech. Int.
Inputs Outputs Technological innovation efficiency
N RDCS HSS NPI PATT EFF (mean)
EFF (median)
EFF (Std. Dev)
% of EFF = 1
1 Meat industry LMTs 59 2099096 33.071 5.559 0.157 40.3 38.0 25.9 20.34
2 Foodstuffs and tobacco LMTs 147 1059052 18.112 3.070 0.245 28.0 23.1 23.5 11.56
3 Beverages LMTs 72 943752.1 32.130 1.747 0.719 27.4 15.6 23.2 22.22
4 Textiles and clothing LMTs 220 567941.3 5.812 13.847 0.510 10.6 3.3 17.2 5.00
5 Leather and footwear LMTs 45 202806.9 0.569 8.583 0.222 37.7 33.1 29.4 20.00
6 Timber industry LMTs 35 199460.7 5.404 1.471 0.264 60.2 66.0 22.8 28.57
7 Paper industry LMTs 71 810632.4 15.352 1.880 0.254 27.7 16.1 24.8 21.13
8 Publishing and printing LMTs 14 977823.7 120.383 0.214 0.000 40.9 38.1 24.2 35.71
9 Chemicals HTs 324 4720492 40.197 2.848 1.024 16.3 7.4 18.5 4.32 10
Rubber and plastic products LMTs 117 747858 8.321 2.778 0.442 16.3 5.2 20.8 9.40 11
Nonmetallic mineral products LMTs 159 3528608 21.482 5.998 0.509 16.4 6.4 20.8 4.4% 12
Ferrous and non ferrous metals LMTs 128 1742349 18.974 11.857 0.418 18.7 7.6 22.7 10.16 13
Metal products LMTs 141 1170016 11.769 5.745 1.246 21.0 9.1 24.6 9.93 14
Agricultural and industrial machinery HTs 268 2914336 21.221 6.523 0.611 20.5 9.3 22.8 5.60 15
Office machines and data processing HTs 73 6341058 73.636 5.521 0.949 31.4 21.2 26.9 9.59 16
Machinery and electrical equipment HTs 226 2681677 25.743 5.877 0.963 16.4 8.4 19.1 5.31 17
Motor vehicles HTs 206 39100000 50.455 3.964 0.750 21.3 9.3 25.3 8.25 18
Other transport equipment HTs 72 82000000 223.398 1.438 0.580 47.6 47.4 27.6 16.67 19
Furniture industry LMTs 95 432820.2 12.091 8.132 2.503 45.0 50.6 29.3 16.84
14
As commented in the theoretical framework, few attempts have been performed in the literature in
order to measure the technological innovation efficiency, limiting the comparative of our results with
previous results since those studies uniquely considering innovation inputs and innovation outputs
were performed analyzing 30 different countries (Wang, 2007; Wang & Huang, 2007) ortwenty six
regions of China (Guan & Chen, 2010). If the reader claims a point of reference we could say that
Wang (2007) obtain a mean of the efficiency scores of 65% and a mean of 86% for the study of Wang
& Huang (2007) and for the sample of the regions of China the mean of the efficiency scores is 45.3%.
Results presented in Table 2 also enable us to observe the heterogeneity of firms within
industries. For example, the publishing and printing industry has the highest percentage of efficient
firms (35.71%) but the mean and median of the efficiency scores are not the highest but the standard
deviation is among the largest. This indicates that in this industry the firms tend to be in the poles, that
is, highly efficient or highly inefficient. For the textiles and clothing industry there seems to be less
variation but a clear tendency to inefficiency. Observe how the standard deviation, mean and median
are the lowest and the how the percentage of efficient firms is very low. That is, there are very few
firms in the best practice frontier and the rest are very far from the frontier.
Stage II: Effect of Internationalization on Technological Innovation Efficiency
In order to empirically test our hypothesis that, thanks to the knowledge gain in international
markets, firm internationalization will have a positive effect on the technological innovation
efficiency. In Table 3 we present the estimates of the random effects Tobit model.
In Model 1 we introduce the internationalization variable without the squared term. As
observer, internationalization does not produce a significant effect on the technological innovation
efficiency. Firms competing in dynamic markets seem to be more efficiency that those firms
competing in stable or recessive markets. This indicates how completion demand firms to be more
efficient in the transformation of innovation inputs into innovation outputs. Interestingly, firm size
does produce a negative and significant effect indicating that larger firms trend to be more inefficient
that SMEs. One possible explanation of this behavior is that thanks to the flexibility that characterize
SMEs, they are able do adapt and adjust their process easily and faster than large firms.
15
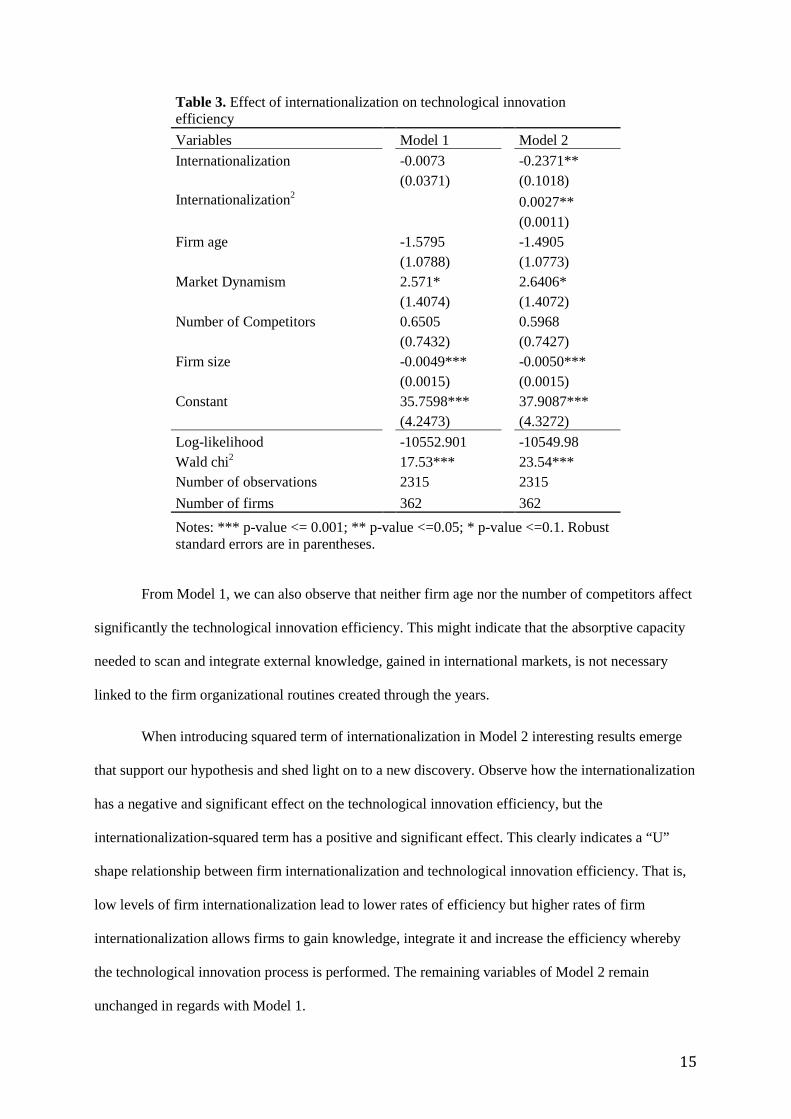
Table 3. Effect of internationalization on technological innovation efficiency
Variables Model 1 Model 2
Internationalization -0.0073 -0.2371** (0.0371) (0.1018)
Internationalization2 0.0027**
(0.0011) Firm age -1.5795 -1.4905
(1.0788) (1.0773) Market Dynamism 2.571* 2.6406*
(1.4074) (1.4072) Number of Competitors 0.6505 0.5968
(0.7432) (0.7427) Firm size -0.0049*** -0.0050***
(0.0015) (0.0015) Constant 35.7598*** 37.9087*** (4.2473) (4.3272)
Log-likelihood -10552.901 -10549.98 Wald chi2 17.53*** 23.54*** Number of observations 2315 2315
Number of firms 362 362
Notes: *** p-value <= 0.001; ** p-value <=0.05; * p-value <=0.1. Robust standard errors are in parentheses.
From Model 1, we can also observe that neither firm age nor the number of competitors affect
significantly the technological innovation efficiency. This might indicate that the absorptive capacity
needed to scan and integrate external knowledge, gained in international markets, is not necessary
linked to the firm organizational routines created through the years.
When introducing squared term of internationalization in Model 2 interesting results emerge
that support our hypothesis and shed light on to a new discovery. Observe how the internationalization
has a negative and significant effect on the technological innovation efficiency, but the
internationalization-squared term has a positive and significant effect. This clearly indicates a “U”
shape relationship between firm internationalization and technological innovation efficiency. That is,
low levels of firm internationalization lead to lower rates of efficiency but higher rates of firm
internationalization allows firms to gain knowledge, integrate it and increase the efficiency whereby
the technological innovation process is performed. The remaining variables of Model 2 remain
unchanged in regards with Model 1.
16
CONCLUSIONS
It has been repeatedly emphasized in the literature that it is highly important to jointly
consider internationalization and technological innovation when referring to firms’ competitiveness
abroad (Cassiman & Golovko, 2010; Filipescu et al. 2009; Hitt et al., 1997; Monreal et al., 2012).
Technological innovations are a source of competitive advantages for firms and help them become
more competitive in new international markets (Kyläheiko et al., 2011; Lachenmaier & Wössmann,
2006; Pla & Alegre, 2007; Vila & Kuster; 2007). While firms are developing their activities abroad,
they enter into contact with global and local competitors, different types of customers and other
participants in the market and learn about them. This acquired knowledge makes firms develop more
technological innovations, become more competitive and further increase their international market
presence (Filipescu et al., 2009). However, it is important to see whether these internationalization
advantages also help firms improve the efficiency of the technological innovation process. This was
exactly the aim of this paper and, in order to fulfill it, we employed a firm-level panel dataset of
Spanish innovating and non-innovating manufacturing firms covering the period from 1990 to 2005.
With regards to the methodology approach, we calculate an intertemporal output-oriented
DEA bootstrap. The efficiency scores are calculated by each firm corresponding to a specific industry,
which are classified in 19 different sectors according to the CNAE.Rev.1 classification. In the second
stage of the study, we explain the obtained efficiency scores based on firms’ internationalization.
Results of the first stage of the analysis show that most Spanish manufacturing firms are
operating at very inefficient rates. The most efficient industry is the Wood industry, followed by the
Transport equipment industry, operating at the 49% and 48% of efficiency, respectively. On the
contrary, the most inefficient industry is the Textiles and wearing apparel (10% of efficiency as a
mean) followed by the Non-metallic mineral products industry. As for the second stage of the analysis,
results indicate that indeed high rates of internationalization register significant higher score of the
technological innovation efficiency.
This research shows the importance of taking into consideration both inputs and outputs of
technological innovation in order to measure how internationalization affects them. For a

17
practitioner’s point of view, this research allows to observe that in order to become more efficient in
terms of technological innovations firms should focus on international markets as the knowledge
obtained from them is very valuable and can make them much more competitive in the global market.
18
REFERENCES
Alvarez, R., & Crespi G. 2003. Determinants of technical efficiency of small firms. Small
Business Economics, 20 (3), 233-244.
Alvarez, R., & Robertson, R. 2004. Exposure to foreign markets and plant-level innovation:
evidence from Chile and Mexico. Journal of International Trade and Economic Development, 13 (1):
57-87.
Akgün, A.E., & Keskin, H., & Byrne, J., 2009. Organizational emotional capability, product
and process innovation, and firm performance: An empirical analysis. Journal of Engineering and
Technology Management 26 (3): 103-130.
Balkin, D.B., & Markman, G.D., & Gomez-Mejia, L. R., 2000. Is CEO pay in high technology
firms related to innovation? Academy of Management Journal 43: 1118–1129.
Banker, R.D., & Charnes, A., & Cooper, W.W. 1984. Some models for estimating technical
and scale inefficiencies in DEA. Management Science, 32: 1613-1627.
Basile, R. 2001. Export behavior of Italian manufacturing firms over the nineties: The role of
innovation. Research Policy, 30 (8): 1185-1201.
Bernard, A., & Jensen, J. 1999. Exceptional exporter performance: Cause, effect or both?
Journal of International Economics, 47 (1): 1-25.
Brown, R. 2006. Mismanagement or mismeasurement? Pitfalls and protocols for DEA studies
in the financial services sector. European Journal of Operational Research, 174 (2): 1100-1116.
Bughin, J., & Jacques, J.M. 1994. Managerial efficiency and the Schumpeterian link between
size, market structure and innovation revisited. Research Policy, 23 (4): 653–659.
Cassiman, B., & Golovko, E. 2010. Innovation and internationalization through exports.
Journal of International Business Studies, 42 (1): 1-20.
Charnes, A., & Cooper, W.W., & Rhodes, E. 1978. Measuring the efficiency of decision
making units. European Journal of Operational Research, 2 (4): 429-444.
Cho, H.J., & Pucik, V. 2005. Relationship between innovativeness, quality, growth,
profitability, and market value. Strategic Management Journal, 26 (6): 555-575.
19
Damanpour, F., & Aravind, D. 2006. Product and process innovations: A Review of
organizational and environmental determinants. In. Hage, J. and M. Meeus, Innovation, Science, and
Institutional Change: A Research Handbook. 38-66. Oxford: Oxford University Press.
Damijan, J. P., & Kostevc, Č., & Polanec S. 2010. From innovation to exporting or vice versa?
The World Economy, 33 (3): 374–398
Díaz, N.L.,& Aguiar, I., & Saá, P.D. 2008. The effect of technological knowledge assets on
performance: The innovative choice in Spanish firms. Research Policy, 37 (9): 1515-1529.
Dyerson, R., & Mueller, F.U. 1999. Learning, teamwork and appropriability: managing
technological change in the Department of Social Security. Journal of Management Studies, 36 (5):
629-652.
Ettlie, J.E., & Bridges, W.P., & O'Keefe, R.D. 1984. Organization strategy and structural
differences for radical versus incremental innovation. Management Science, 30 (6): 682-695.
EU KLEMS. 2008. EU KLEMS growth and productivity accounts; Release 2008. Available
at: http://www.euklems.net/.
Fariñas, J.C., & Jaumandreu, J., 2000. Diez años de Encuesta sobre Estrategias Empresariales
(ESEE). Economía Industrial, 329: 29-42.
Farrell, M.J. 1957. The measurement of productive efficiency. Journal of the Royal Statistic
Society, Series A CXX 3: 253-290.
Filipescu, D.A., & Rialp. A., & Rialp, J. 2009. Internationalization and technological
innovation: Empirical evidence on their mutual relationship. In R.R. Sinkovics and P.N. Ghauri (Ed.),
New Challenges to International Marketing (Advances in International Marketing, Volume 20): 125-
154. Emerald Group Publishing Limited.
Fletcher, R. 2001. A holistic approach to internationalisation. International Business Review,
10 (1): 25-49.
Frantz, R. 1992. X-Efficiency and allocative efficiency: What we have learned. American
Economic Review. 82 (2) (papers and proceedings): 434-438.
20
George, G., & Zahra, S., & Wood, R. 2002. The effects of business–university alliances on
innovative output and financial performance: A study of publicly traded biotechnology companies.
Journal of Business Venturing 17, 577–609.
Golovko, E., & Valentini, G. 2011. Exploring the complementarity between innovation and
export for SMEs’ growth. Journal of International Business Studies, 42 (3): 362-380.
Grant, R.M. 1991. The resource-based theory of competitive advantage: Implications for
strategy formulation. California Management Review, 33 (3): 114-135.
Grant, R.M. 1996. Toward a knowledge-based theory of the firm. Strategic Management
Journal, 17 (Winter): 109-122.
Griliches, Z., 1979. Issues in Assessing the Contribution of Research and Development to
Productivity Growth. The Bell Journal of Economics. 10 (1): 92-116.
Guan J.C., & Chen, K., 2010. Measuring the innovation production process: A cross-region
empirical study of China’s high-tech innovations. Technovation 30, 348-358.
Guan, J.C., & Yam, R.C.M., & Mok, C.K., & Ma, N. 2006. A study of the relationship
between competitiveness and technological innovation capability based on DEA models. European
Journal of Operational Research 170, 971-986.
Harris, R., & Li, Q.C. 2009. Exporting, R&D, and absorptive capacity in UK establishments.
Oxford Economic Papers, 61: 74–103
Hashimoto, A., & Haneda, S. 2008. Measuring the change in R&D efficiency of the Japanese
pharmaceutical industry. Research Policy 37, 1829-1836.
Hass, D.A., & Murphy, F.H. 2003. Compensating for non-homogeneity in decision-making
units in data envelopment analysis. European Journal of Operational Research. 144 (3): 530-544.
Hitt, M.A., & Hoskisson, R.E., & Kim, H. 1997. International diversification: Effects on
innovation and firm performance in product-diversified firms. Academy of Management Journal, 40
(4): 767-798.
Jones, M.V. 2001. First steps in internationalisation: Concepts and evidence from a sample of
small high technology firms. Journal of International Management, 7 (3): 191-210.
21
Koellinger, P. 2008. The relationship between technology, innovation, and firm performance:
Empirical evidence from e-business in Europe. Research Policy 37, 1317-1328.
Kotabe, M., & Srinivasan, S. S., & Aulakh, P. S. 2002. Multinationality and firm performance:
The moderating role of R&D and marketing capabilities. Journal of International Business Studies,
33(1): 79–97.
Kyläheiko, K., & Jantunen, A., & Puumalainen, K., & Saarenketo, S., & Tuppura, A. 2011.
Innovation and internationalization as growth strategies: The role of technological capabilities and
appropriability. International Business Review, 20 (5): 508-520.
Lachenmaier, S., & Wöβmann, L. 2006. Does innovation cause export? Evidence from
exogenous innovation impulses and obstacles using German micro data. Oxford Economic Press, 58
(2): 317-350.
Lee, S.K., & Mogi, G., & Lee, S.K., & Hui, K.S., & Kim, J.W. 2010. Econometric analysis of
the R&D performance in the national hydrogen energy technology development for measuring relative
efficiency: The fuzzy AHP/DEA integrated model approach. International Journal of Hydrogen
Energy 35, 2236-2246.
Li, L.X. 2000. An analysis of sources of competitiveness and performance of Chinese
manufacturers. International Journal of Operational Production Management 20, 299–315.
Lichtenberg, F.R. 1984. The relationship between federal contract R&D and company R&D.
American Economic Review, 74 (2): 73-78.
López, J., & García, R.M. 2005. Technology and export behaviour: A resource-based view
approach. International Business Review, 14 (5): 539-557.
MacGarvie, M. 2006. Do firms learn from international trade. The Review of Economics and
Statistics, 88 (1): 46-60.
Mittal, V., & Anderson, E.W., & Sayrak, A., & Tadikamalla, P. 2005. Dual emphasis and the
long-term financial impact of customer satisfaction. Marketing Science, 24 (4): 544-555.
Molero, J., & Buesa, M. 1996. Patterns of technological change among Spanish innovative
firms: The case of the Madrid region. Research Policy, 25 (4): 647-663.
22
Monreal, J., & Aragón, A., & Sánchez, G. 2012. A longitudinal study of the relationship
between export activity and innovation in the Spanish firm: The moderating role of productivity.
International Business Review, 21 (5): 862-877.
OECD, 2005. Proposed guidelines for collecting and interpreting technological innovation
data. Oslo manual. OECD Publishing, Paris (Third Edition).
O’Regan, N., & Ghobadian, A., & Gallear, D. 2006. In search of the drivers of high growth in
manufacturing SMEs. Technovation 26, 30-41.
Pla, J., & Alegre, J. 2007. Analyzing the link between export intensity, innovation and firm
size in a science-based industry. International Business Review, 16 (3): 275-293.
Prashantham, S. 2005. Toward a knowledge-based conceptualisation of internationalisation.
Journal of International Entrepreneurship, 3 (1): 37-52.
Revilla, E., & Sarkis, J., & Modrego, A. 2003. Evaluating performance of public-private
research collaborations: A DEA analysis. Journal of Operational Research Society 54, 165-174.
Rogers, M. 2004. Networks, firm size and innovation. Small Business Economics, 22 (2): 141-
153.
Salomon, R., & Shaver, J. 2005. Learning-by-exporting: New insights from examining firm
innovation. Journal of Economics and Management Strategy, 14 (2): 431-461.
Santamaría, L., & Nieto, M.J., & Barge-Gil, A. 2009. Beyond formal R&D: Taking advantage
of other sources of innovation in low- and medium-technology industries. Research Policy, 38 (3):
507-517.
Song, M., & Benedetto, A.D., & Nason, R.W. 2007. Capabilities and financial performance:
The moderating effect of strategic type. Journal of the Academy of Marketing Science 35(1), 18-34.
Sørensen, J.B., & Stuart, T.E. 2000. Aging, obsolescence, and organizational innovation.
Administrative Science Quarterly, 45 (1): 81-112.
Teece, D.J. 1986. Profiting from technological innovation: Implications for integration,
collaboration, licensing and public policy. Research Policy, 15 (6): 285-305.
Tidd, J., & Bessant, J. 2009. Managing innovation; integrating technological, market and
organizational change. 4th ed. John Wiley & Sons Ltd., Chichester, England.
23
Vila, N., & Kuster, I. 2007. The importance of innovation in international textile firms.
European Journal of Marketing, 41-1 (2): 17-36.
Wang, E.C., & Huang, W. 2007. Relative efficiency of R&D activities: A cross-country study
accounting for environmental factors in DEA approach. Research Policy 36, 260-273.
Wang, E.C. 2007. R&D efficiency and economic performance: A cross-country analysis using
the stochastic frontier approach. Journal of Policy Modeling, 29 (2): 345-360.
Wilson, P.W. 2008. FEAR 1,11 User Guide, download form: http://www.eco.utexas.edu
/faculty/Wilson/Software/FEAR/fear.html
Zahra, S.A., & Nielsen, A. 2002. Sources of capabilities, integration and technological
commercialization. Strategic Management Journal 23, 377-398.
Zhang, H., & Shu, C., & Jiang, X., & Malter, A.J. 2010. Managing knowledge for innovation:
The role of cooperation, competition, and alliance nationality. Journal of International Marketing, 18
(4): 74-94.
Zhong, W., & Yuan, W., & Li, S., & Huang, Z., 2011. The performance evaluation of regional
R&D investments in China: An application of DEA based on the first official economic census data.
Omega 39, 447-455.