Embed Size (px)
Citation preview
Interpreting velocity ratios from 4C seismic data and well logs in the presence of gas and
anisotropyFabio Mancini*, The University of Edinburgh; Xiang-Yang Li, British Geological Survey; Anton Ziolkowski, The University of Edinburgh; Tim Pointer, BG Group.
Summary
In processing multicomponent seismic data the velocity
ratio vp/vs is a parameter of great importance. Converted
wave binning relies upon it and the use of an incorrect
value may lead to poor imaging results. Seismic anisotropy
and subsurface heterogeneities, such as gas clouds, cause
changes in the velocity ratio. This paper performs an
integrated analysis of well and seismic data to understand
the meaning of the different velocity ratios and the way
they are influenced by the presence of anisotropy and/or
gas.
Introduction
Interest in multicomponent seismic data is growing year
after year. The advantages of having shear wave
information and a better image in the presence of gas
clouds make this technology an important tool for reservoir
characterisation. The main processing problems are well
known: binning converted waves (CCP positioning) and the
effects of anisotropy and gas on seismic velocities. The
binning problem is precisely linked to the velocity ratio
vp/vs. This ratio determines the common converted point
trajectory in depth. In this paper we analyse different
velocity ratios in the Lomond field, North Sea. The
Lomond field is a gas/condensate field and its structure is a
salt induced anticline heavily faulted on top. Gas leaks
through these faults producing a large gas cloud which
causes distortions and bright spots in the imaging when P
waves are used. For this reason using converted waves,
which are much less affected by the presence of gas, was
considered. Geco Prakla acquired a 3D 4C seismic data
over the Lomond field. Three 2D lines were also acquired,
with inline shooting. Compressional and shear logs are also
available.
Velocity Ratios
In order to achieve good imaging for converted waves
different velocity ratios are required. With vcn, vpn and vsn
we indicate the short spread stacking velocity for C-waves,
P-waves and S-waves respectively, vc0, vp0 and vs0 are the
vertical velocities again for the 3 wave-types, γn is the
stacking velocity ratio, γ0 is the vertical velocity ratio and
γeff is the effective velocity ratio. The main relationships are
(Thomsen, 1999):
(1)
(2)
Gamma zero, γ0
The conventional flow for joint processing of
multicomponent seismic data requires processing P-waves
as a starting point followed by a sequence for C-waves
which more or less is: asymptotic binning (ACCP);
isotropic velocity analysis; stacking and event correlation
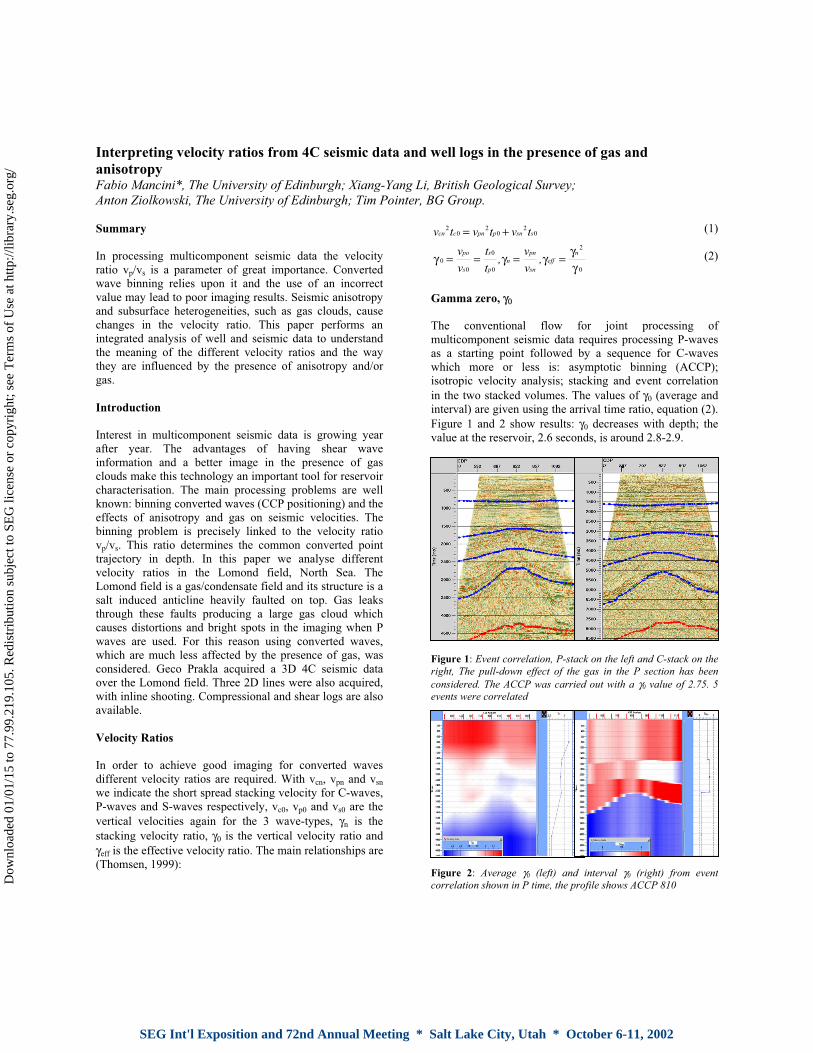
in the two stacked volumes. The values of γ0 (average and
interval) are given using the arrival time ratio, equation (2).
Figure 1 and 2 show results: γ0 decreases with depth; the
value at the reservoir, 2.6 seconds, is around 2.8-2.9.
Figure 1: Event correlation, P-stack on the left and C-stack on the
right, The pull-down effect of the gas in the P section has been
considered. The ACCP was carried out with a γ0 value of 2.75. 5
events were correlated
Figure 2: Average γ0 (left) and interval γ0 (right) from event
correlation shown in P time, the profile shows ACCP 810
v t v t v t
v
v
t
t
v
v
cn c pn p sn s
po
s
s
p
n
pn
sn
eff
n
20
20
20
0
0
0
0
2
0
= +
= = = =γ γ γγγ
, ,
SEG Int'l Exposition and 72nd Annual Meeting * Salt Lake City, Utah * October 6-11, 2002
Dow
nloa
ded
01/0
1/15
to 7
7.99
.219
.105
. Red
istr
ibut
ion
subj
ect t
o SE
G li
cens
e or
cop
yrig
ht; s
ee T
erm
s of
Use
at h
ttp://
libra
ry.s
eg.o
rg/
Interpreting velocity ratios
v v v vpn po sn s= + = +1 2 1 20δ σ,
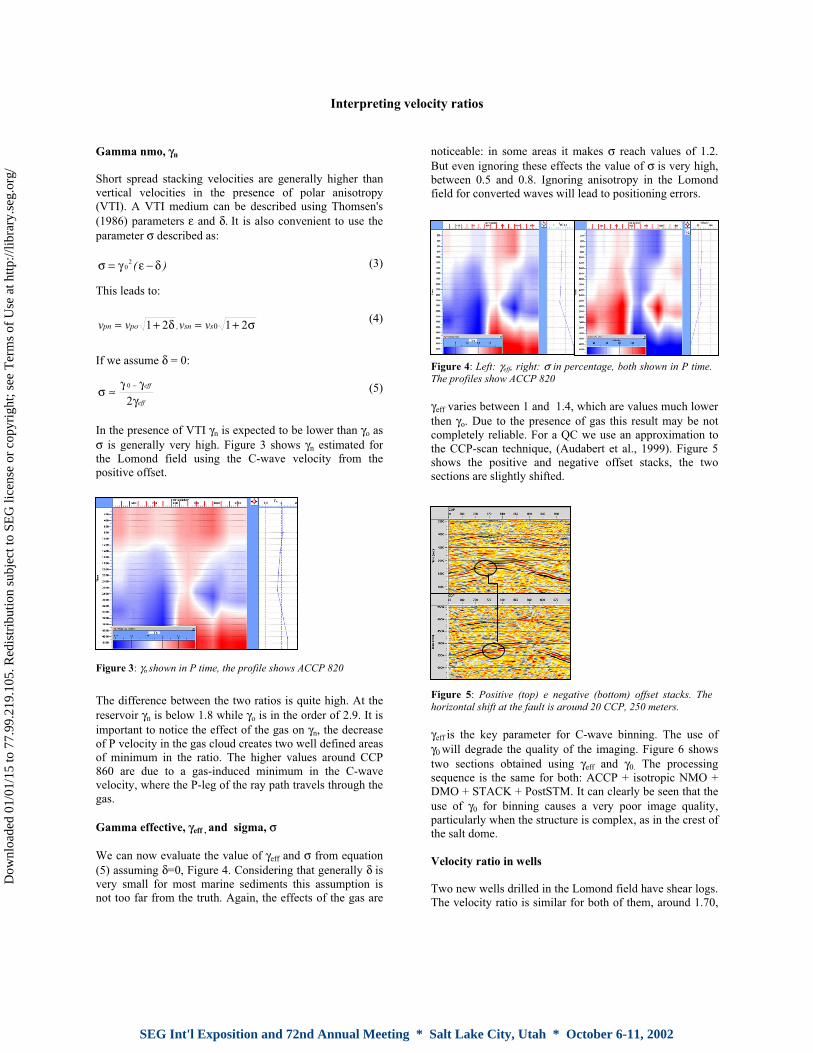
Gamma nmo, γn
Short spread stacking velocities are generally higher than
vertical velocities in the presence of polar anisotropy
(VTI). A VTI medium can be described using Thomsen's
(1986) parameters ε and δ. It is also convenient to use the
parameter σ described as:
(3)
This leads to:
(4)
If we assume δ = 0:
(5)
In the presence of VTI γn is expected to be lower than γo as
σ is generally very high. Figure 3 shows γn estimated for
the Lomond field using the C-wave velocity from the
positive offset.
The difference between the two ratios is quite high. At the
reservoir γn is below 1.8 while γo is in the order of 2.9. It is
important to notice the effect of the gas on γn, the decrease
of P velocity in the gas cloud creates two well defined areas
of minimum in the ratio. The higher values around CCP
860 are due to a gas-induced minimum in the C-wave
velocity, where the P-leg of the ray path travels through the
gas.
Gamma effective, γeff , and sigma, σ
We can now evaluate the value of γeff and σ from equation
(5) assuming δ=0, Figure 4. Considering that generally δ is
very small for most marine sediments this assumption is
not too far from the truth. Again, the effects of the gas are
noticeable: in some areas it makes σ reach values of 1.2.
But even ignoring these effects the value of σ is very high,
between 0.5 and 0.8. Ignoring anisotropy in the Lomond
field for converted waves will lead to positioning errors.
γeff varies between 1 and 1.4, which are values much lower
then γo. Due to the presence of gas this result may be not
completely reliable. For a QC we use an approximation to
the CCP-scan technique, (Audabert et al., 1999). Figure 5
shows the positive and negative offset stacks, the two
sections are slightly shifted.
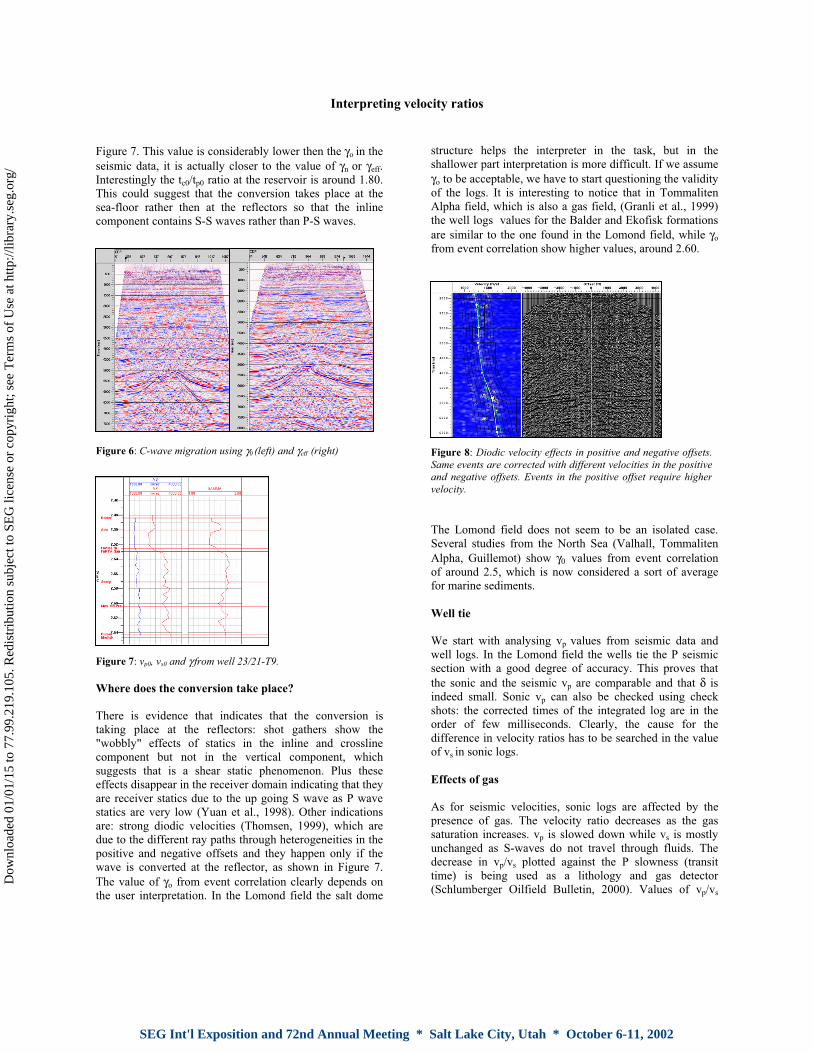
γeff is the key parameter for C-wave binning. The use of
γ0 will degrade the quality of the imaging. Figure 6 shows
two sections obtained using γeff and γ0. The processing
sequence is the same for both: ACCP + isotropic NMO +
DMO + STACK + PostSTM. It can clearly be seen that the
use of γ0 for binning causes a very poor image quality,
particularly when the structure is complex, as in the crest of
the salt dome.
Velocity ratio in wells
Two new wells drilled in the Lomond field have shear logs.
The velocity ratio is similar for both of them, around 1.70,
Figure 3: γn shown in P time, the profile shows ACCP 820
Figure 4: Left: γeff, right: σ in percentage, both shown in P time.
The profiles show ACCP 820
Figure 5: Positive (top) e negative (bottom) offset stacks. The
horizontal shift at the fault is around 20 CCP, 250 meters.
σ γ ε δ= −02 ( )
σγ γ
γ≈
−0
2
eff
eff
SEG Int'l Exposition and 72nd Annual Meeting * Salt Lake City, Utah * October 6-11, 2002
Dow
nloa
ded
01/0
1/15
to 7
7.99
.219
.105
. Red
istr
ibut
ion
subj
ect t
o SE
G li
cens
e or
cop
yrig
ht; s
ee T
erm
s of
Use
at h
ttp://
libra
ry.s
eg.o
rg/
Interpreting velocity ratios
Figure 7. This value is considerably lower then the γo in the
seismic data, it is actually closer to the value of γn or γeff.
Interestingly the tc0/tp0 ratio at the reservoir is around 1.80.
This could suggest that the conversion takes place at the
sea-floor rather then at the reflectors so that the inline
component contains S-S waves rather than P-S waves.
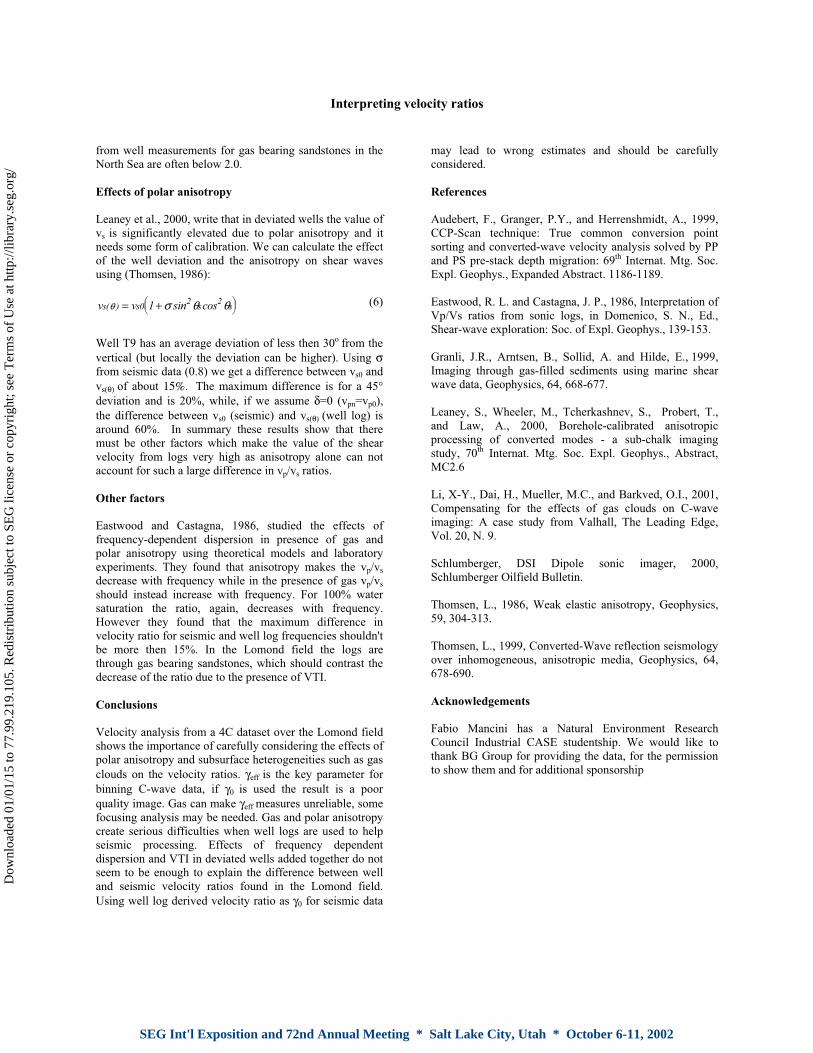
Where does the conversion take place?
There is evidence that indicates that the conversion is
taking place at the reflectors: shot gathers show the
"wobbly" effects of statics in the inline and crossline
component but not in the vertical component, which
suggests that is a shear static phenomenon. Plus these
effects disappear in the receiver domain indicating that they
are receiver statics due to the up going S wave as P wave
statics are very low (Yuan et al., 1998). Other indications
are: strong diodic velocities (Thomsen, 1999), which are
due to the different ray paths through heterogeneities in the
positive and negative offsets and they happen only if the
wave is converted at the reflector, as shown in Figure 7.
The value of γo from event correlation clearly depends on
the user interpretation. In the Lomond field the salt dome
structure helps the interpreter in the task, but in the
shallower part interpretation is more difficult. If we assume
γo to be acceptable, we have to start questioning the validity
of the logs. It is interesting to notice that in Tommaliten
Alpha field, which is also a gas field, (Granli et al., 1999)
the well logs values for the Balder and Ekofisk formations
are similar to the one found in the Lomond field, while γo
from event correlation show higher values, around 2.60.
The Lomond field does not seem to be an isolated case.
Several studies from the North Sea (Valhall, Tommaliten
Alpha, Guillemot) show γ0 values from event correlation
of around 2.5, which is now considered a sort of average
for marine sediments.
Well tie
We start with analysing vp values from seismic data and
well logs. In the Lomond field the wells tie the P seismic
section with a good degree of accuracy. This proves that
the sonic and the seismic vp are comparable and that δ is
indeed small. Sonic vp can also be checked using check
shots: the corrected times of the integrated log are in the
order of few milliseconds. Clearly, the cause for the
difference in velocity ratios has to be searched in the value
of vs in sonic logs.
Effects of gas
As for seismic velocities, sonic logs are affected by the
presence of gas. The velocity ratio decreases as the gas
saturation increases. vp is slowed down while vs is mostly
unchanged as S-waves do not travel through fluids. The
decrease in vp/vs plotted against the P slowness (transit
time) is being used as a lithology and gas detector
(Schlumberger Oilfield Bulletin, 2000). Values of vp/vs
Figure 6: C-wave migration using γ0 (left) and γeff (right)
Figure 7: vp0, vs0 and γ from well 23/21-T9.
Figure 8: Diodic velocity effects in positive and negative offsets.
Same events are corrected with different velocities in the positive
and negative offsets. Events in the positive offset require higher
velocity.
SEG Int'l Exposition and 72nd Annual Meeting * Salt Lake City, Utah * October 6-11, 2002
Dow
nloa
ded
01/0
1/15
to 7
7.99
.219
.105
. Red
istr
ibut
ion
subj
ect t
o SE
G li
cens
e or
cop
yrig
ht; s
ee T
erm
s of
Use
at h
ttp://
libra
ry.s
eg.o
rg/
Interpreting velocity ratios
v vs s s s( ) sin cosθ σ θ θ= +02 21
from well measurements for gas bearing sandstones in the
North Sea are often below 2.0.
Effects of polar anisotropy
Leaney et al., 2000, write that in deviated wells the value of
vs is significantly elevated due to polar anisotropy and it
needs some form of calibration. We can calculate the effect
of the well deviation and the anisotropy on shear waves
using (Thomsen, 1986):
(6)
Well T9 has an average deviation of less then 30o from the
vertical (but locally the deviation can be higher). Using σfrom seismic data (0.8) we get a difference between vs0 and
vs(θ) of about 15%. The maximum difference is for a 45°
deviation and is 20%, while, if we assume δ=0 (vpn=vp0),
the difference between vs0 (seismic) and vs(θ) (well log) is
around 60%. In summary these results show that there
must be other factors which make the value of the shear
velocity from logs very high as anisotropy alone can not
account for such a large difference in vp/vs ratios.
Other factors
Eastwood and Castagna, 1986, studied the effects of
frequency-dependent dispersion in presence of gas and
polar anisotropy using theoretical models and laboratory
experiments. They found that anisotropy makes the vp/vs
decrease with frequency while in the presence of gas vp/vs
should instead increase with frequency. For 100% water
saturation the ratio, again, decreases with frequency.
However they found that the maximum difference in
velocity ratio for seismic and well log frequencies shouldn't
be more then 15%. In the Lomond field the logs are
through gas bearing sandstones, which should contrast the
decrease of the ratio due to the presence of VTI.
Conclusions
Velocity analysis from a 4C dataset over the Lomond field
shows the importance of carefully considering the effects of
polar anisotropy and subsurface heterogeneities such as gas
clouds on the velocity ratios. γeff is the key parameter for
binning C-wave data, if γ0 is used the result is a poor
quality image. Gas can make γeff measures unreliable, some
focusing analysis may be needed. Gas and polar anisotropy
create serious difficulties when well logs are used to help
seismic processing. Effects of frequency dependent
dispersion and VTI in deviated wells added together do not
seem to be enough to explain the difference between well
and seismic velocity ratios found in the Lomond field.
Using well log derived velocity ratio as γ0 for seismic data
may lead to wrong estimates and should be carefully
considered.
References
Audebert, F., Granger, P.Y., and Herrenshmidt, A., 1999,
CCP-Scan technique: True common conversion point
sorting and converted-wave velocity analysis solved by PP
and PS pre-stack depth migration: 69th Internat. Mtg. Soc.
Expl. Geophys., Expanded Abstract. 1186-1189.
Eastwood, R. L. and Castagna, J. P., 1986, Interpretation of
Vp/Vs ratios from sonic logs, in Domenico, S. N., Ed.,
Shear-wave exploration: Soc. of Expl. Geophys., 139-153.
Granli, J.R., Arntsen, B., Sollid, A. and Hilde, E., 1999,
Imaging through gas-filled sediments using marine shear
wave data, Geophysics, 64, 668-677.
Leaney, S., Wheeler, M., Tcherkashnev, S., Probert, T.,
and Law, A., 2000, Borehole-calibrated anisotropic
processing of converted modes - a sub-chalk imaging
study, 70th Internat. Mtg. Soc. Expl. Geophys., Abstract,
MC2.6
Li, X-Y., Dai, H., Mueller, M.C., and Barkved, O.I., 2001,
Compensating for the effects of gas clouds on C-wave
imaging: A case study from Valhall, The Leading Edge,
Vol. 20, N. 9.
Schlumberger, DSI Dipole sonic imager, 2000,
Schlumberger Oilfield Bulletin.
Thomsen, L., 1986, Weak elastic anisotropy, Geophysics,
59, 304-313.
Thomsen, L., 1999, Converted-Wave reflection seismology
over inhomogeneous, anisotropic media, Geophysics, 64,
678-690.
Acknowledgements
Fabio Mancini has a Natural Environment Research
Council Industrial CASE studentship. We would like to
thank BG Group for providing the data, for the permission
to show them and for additional sponsorship
SEG Int'l Exposition and 72nd Annual Meeting * Salt Lake City, Utah * October 6-11, 2002
Dow
nloa
ded
01/0
1/15
to 7
7.99
.219
.105
. Red
istr
ibut
ion
subj
ect t
o SE
G li
cens
e or
cop
yrig
ht; s
ee T
erm
s of
Use
at h
ttp://
libra
ry.s
eg.o
rg/