Embed Size (px)
Citation preview

Interrelationship Digraphs
1
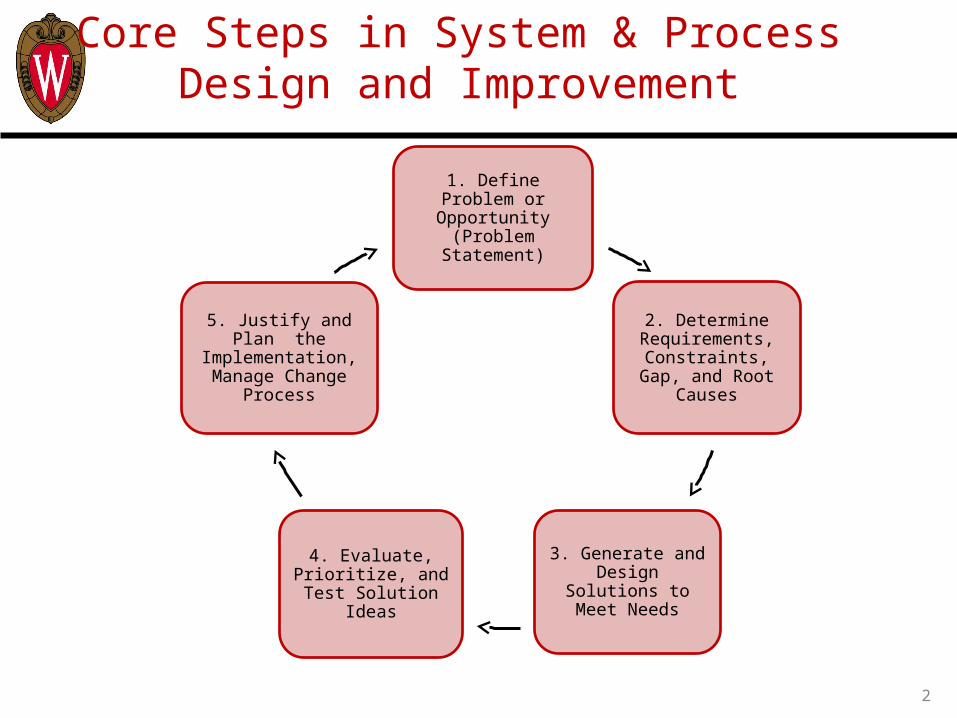
1. Define Problem or Opportunity
(Problem Statement)
2. Determine Requirements,
Constraints, Gap, and Root Causes
3. Generate and Design Solutions to Meet Needs
4. Evaluate, Prioritize, and Test Solution
Ideas
5. Justify and Plan the
Implementation, Manage Change
Process
Core Steps in System & Process Design and Improvement
2

Analysis Tools for Step 2:Establish Needs and Causes
Define Needs, Gaps or Causes
• Listen to the “Voice of the Customer”• Use Cause and Effect Diagrams.
Determine Root Causes
and Key Issues
• Ask WHY 5 Times• Use Interrelationship Digraphs
3

Learning Objectives
Upon completing this module, you will be able to:
Understand the purpose and use of the Interrelationship Digraph (ID)
Construct, interpret, and revise an ID
Graphically display the complete pattern of cause and effect relationships within complex sets of issues
Identify root causes and key issues in order to develop effective solutions and action plans
4

Interrelationship Digraph
This tool takes complex, multi-variable problems or desired outcomes and explores and displays all of the interrelated factors involved.
It graphically shows the logical (and often causal) relationships between factors.
5

Interrelationship Digraph
Allows for “multidirectional” rather than “linear” thinking (“web of causes” not just straight line cause and effect)
Graphically maps out the cause and effect links among all items in complex situations that contains many intertwined factors
Employs the clustering of relationship arrows to indicate the issues/causes that are the most fundamental among all the items
6
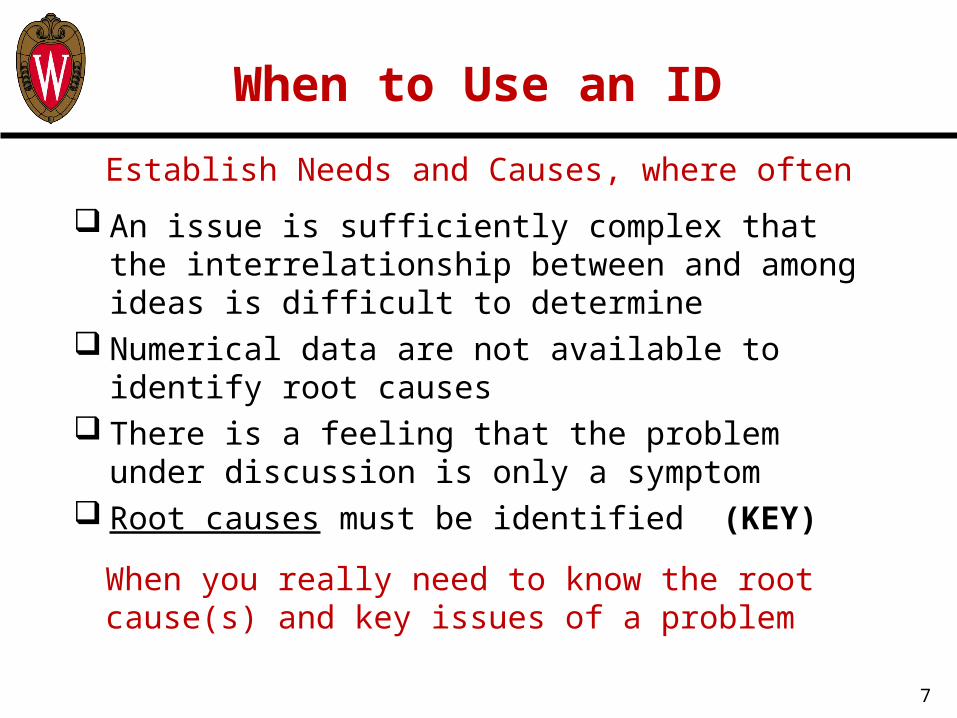
When to Use an ID
An issue is sufficiently complex that the interrelationship between and among ideas is difficult to determine
Numerical data are not available to identify root causes
There is a feeling that the problem under discussion is only a symptom
Root causes must be identified (KEY)
7
Establish Needs and Causes, where often
When you really need to know the root cause(s) and key issues of a problem

Construction Steps
8
Step 1: Assemble the Right Team
Step 6: Select Key Items in the Finalized ID
Step 2: Agree Upon an Issue/Problem Statement
Step 3: Display the Completed Cards
Step 4: Draw the Relationship Arrows
Step 5: Review and Revise the First Round ID
Step 7: Draw the final ID

Construction Steps
1. Assemble the Right Team Four to Six members Intimate knowledge of issue
2. Agree Upon an Issue/Problem Statement Various sources: From Scratch, Affinity Diagram, Cause & Effect Diagram
9

10
Construction Steps
3. Display the Completed Cards
• Pre-organized, e.g., by Affinity Diagram headers, plus any additional causes or issues not included in the AD headers
• Random Distribution
• One by one, e.g., clustered

11
Construction Steps
4. Draw the Relationship Arrows Ask of each card: “Does this card cause/influence any of the other cards displayed?” Repeat until all cards considered Draw one-way arrows only as the question is repeated
A B

12
Construction Steps
5. Review and Revise the First Round ID
• Review by team and non-team members
• Individuals indicate changes and opinions on basic causes
• Incorporate suggested changes that the teams agrees upon

13
Construction Steps
6. Select Key Items in the Finalized ID
• Find cards with the highest total # of arrows, then cards with the next highest totals, etc.
• Review all cards for those with predominantly outgoing or incoming arrows
• Apply the “rule of experience” to the items passing the “arrow test”

Root Cause
Root CausePredominantly Outgoing Arrows
14

Key Issue
Key IssuePredominantly Incoming Arrows
15

16
Construction Steps
7. Draw the Final ID
Identify the key issues and root causes by double boxing
e.g.

17
Interrelationship digraph
Root Cause
Key Issues
Identify Physical differences
Optimize environment
Identify environmental
differences
Optimize equipment
Optimize inputs
Optimize Protocol
Identify time differences
Quantify inputs/outputs
Identify variables only present in the
robotic process

Matrix Format
18
1. Lack of family consensus on location
2. Ineffective Travel Agent
3. Bad weather
5. Too much to do
6. Expect too much from it
7. Too little to do
9. Bored kids
1 2 3 4 5 6 7 8 9 Out In Total
6 1 7
5 2 7
3 0 3
1 4 5
2 3 5
2 4 6
78. No time for research into location 0 7
1 5 6
4. We can’t relax 0 8 8
What are the barriers to a great vacation?
Root Cause Key Issues

Advantages
The key issues and root causes in problem solving become readily apparent
Explanation of complex issues to others is simplified
As further information is added, it is easy to update
19

Disadvantages
Despite appearances, constructing an adequate diagram is surprisingly difficult
If the diagram is too complicated, it becomes difficult to understand and important factors might be overlooked
If the factors are expressed too simply, the arrows may point in many misleading directions.
20
Always use a noun and a verb to succinctly define the factor

21
Thank You


![Interrelationship Digraphs and Sociograms using SAS(R) · Shigeru Mizuno [2] published information about IDs and six other tools in 1988 as a collection of methods for engineering,](https://img.pdfslide.net/doc/110x75/5e2076ee966f1d414335ca97/interrelationship-digraphs-and-sociograms-using-sasr-shigeru-mizuno-2-published.jpg)