Embed Size (px)
Citation preview
IntraIntra--Day Trading Techniques Day Trading Techniques and Trading Day Preparationand Trading Day Preparation
With With
Dan GibbyDan GibbyLead Moderator, Pristine.com Advanced Stocks and Derivatives Lead Moderator, Pristine.com Advanced Stocks and Derivatives
Trading Room and West Coast ManagerTrading Room and West Coast Manager
Copyright 2003, Pristine Capital Holdings, Inc.Copyright 2003, Pristine Capital Holdings, Inc.
Pristine.com PresentsPristine.com Presents
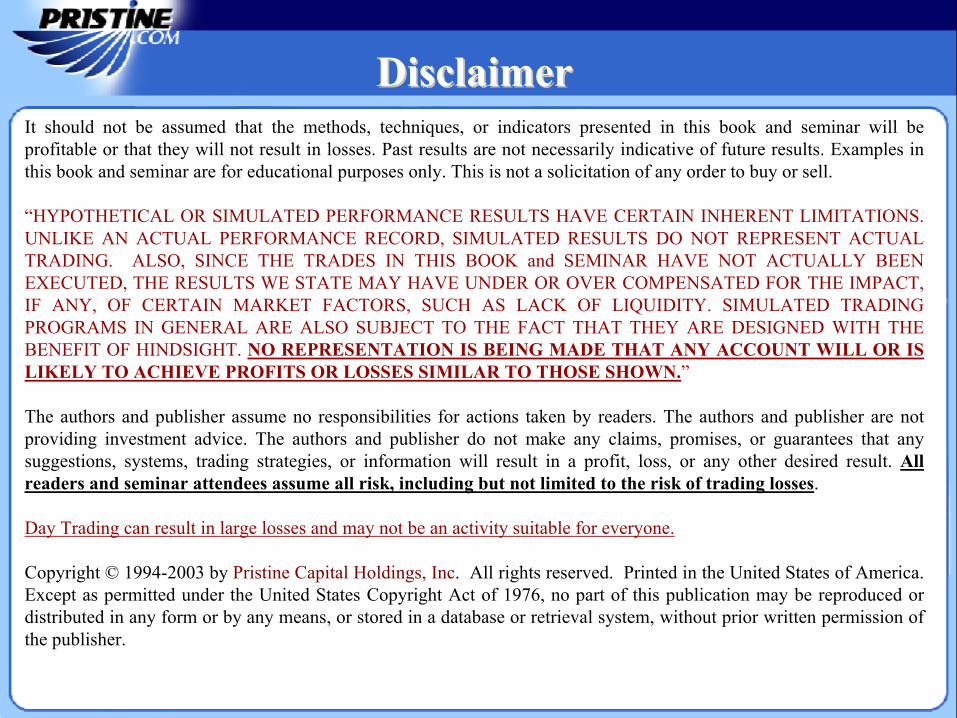
DisclaimerDisclaimerIt should not be assumed that the methods, techniques, or indicators presented in this book and seminar will be profitable or that they will not result in losses. Past results are not necessarily indicative of future results. Examples in this book and seminar are for educational purposes only. This is not a solicitation of any order to buy or sell.
“HYPOTHETICAL OR SIMULATED PERFORMANCE RESULTS HAVE CERTAIN INHERENT LIMITATIONS. UNLIKE AN ACTUAL PERFORMANCE RECORD, SIMULATED RESULTS DO NOT REPRESENT ACTUAL TRADING. ALSO, SINCE THE TRADES IN THIS BOOK and SEMINAR HAVE NOT ACTUALLY BEEN EXECUTED, THE RESULTS WE STATE MAY HAVE UNDER OR OVER COMPENSATED FOR THE IMPACT, IF ANY, OF CERTAIN MARKET FACTORS, SUCH AS LACK OF LIQUIDITY. SIMULATED TRADING PROGRAMS IN GENERAL ARE ALSO SUBJECT TO THE FACT THAT THEY ARE DESIGNED WITH THE BENEFIT OF HINDSIGHT. NO REPRESENTATION IS BEING MADE THAT ANY ACCOUNT WILL OR IS LIKELY TO ACHIEVE PROFITS OR LOSSES SIMILAR TO THOSE SHOWN.”
The authors and publisher assume no responsibilities for actions taken by readers. The authors and publisher are not providing investment advice. The authors and publisher do not make any claims, promises, or guarantees that any suggestions, systems, trading strategies, or information will result in a profit, loss, or any other desired result. All readers and seminar attendees assume all risk, including but not limited to the risk of trading losses.
Day Trading can result in large losses and may not be an activity suitable for everyone.
Copyright © 1994-2003 by Pristine Capital Holdings, Inc. All rights reserved. Printed in the United States of America. Except as permitted under the United States Copyright Act of 1976, no part of this publication may be reproduced or distributed in any form or by any means, or stored in a database or retrieval system, without prior written permission of the publisher.
Table of ContentsTable of Contents
IntroductionIntroduction
Subjectivity of T/A
Day Trading Defined
Psychological Requirements
The Key ConceptsThe Key ConceptsCandlesticksCandlesticksMoving AveragesMoving Averages
Market TimingMarket TimingSupport & ResistanceSupport & Resistance
Multiple Times Frames
Pristine Buy & Sell Setup
Moving Average InterpretationMoving Average Interpretation
Candlesticks SimplifiedCandlesticks Simplified
FoundationFoundationPutting It TogetherPutting It Together
Combining Foundation and Combining Foundation and Key Concepts for Mastering Key Concepts for Mastering IntraIntra--day Tradingday Trading
IntroductionIntroduction
IntroductionIntroduction
Pristine IntraPristine Intra--day Trading day Trading
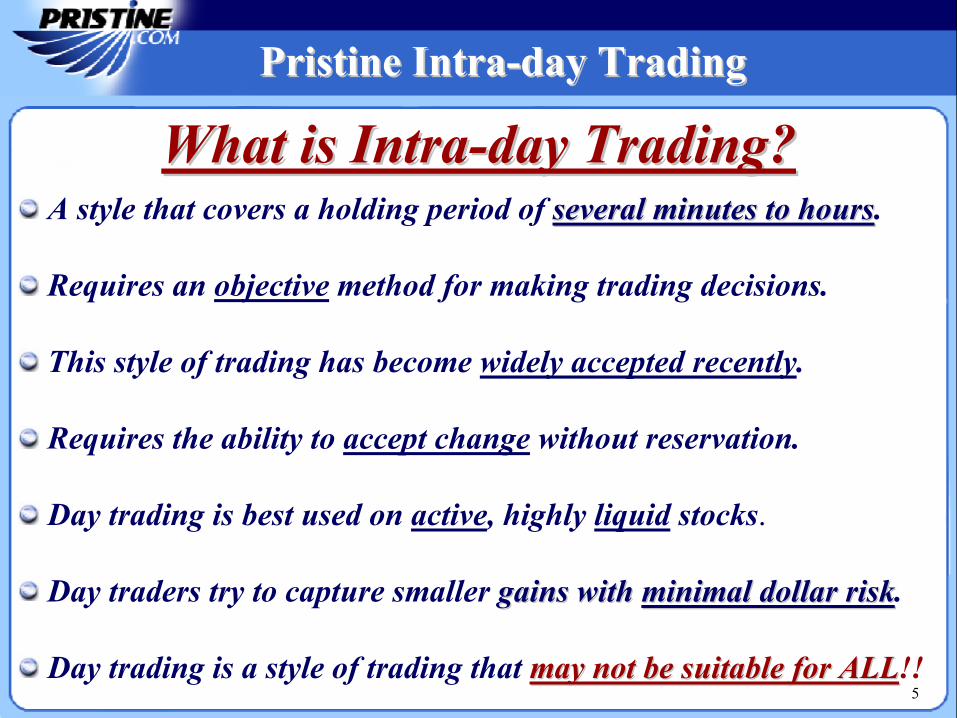
What is IntraWhat is Intra--day Trading?day Trading?
5
A style that covers a holding period of several minutes to hoursseveral minutes to hours.
Requires an objective method for making trading decisions.
This style of trading has become widely accepted recently.
Requires the ability to accept change without reservation.
Day trading is best used on active, highly liquid stocks.
Day traders try to capture smaller gains with gains with minimal dollar riskminimal dollar risk.
Day trading is a style of trading that may not be suitable for ALLmay not be suitable for ALL!!
Psychological Requirements
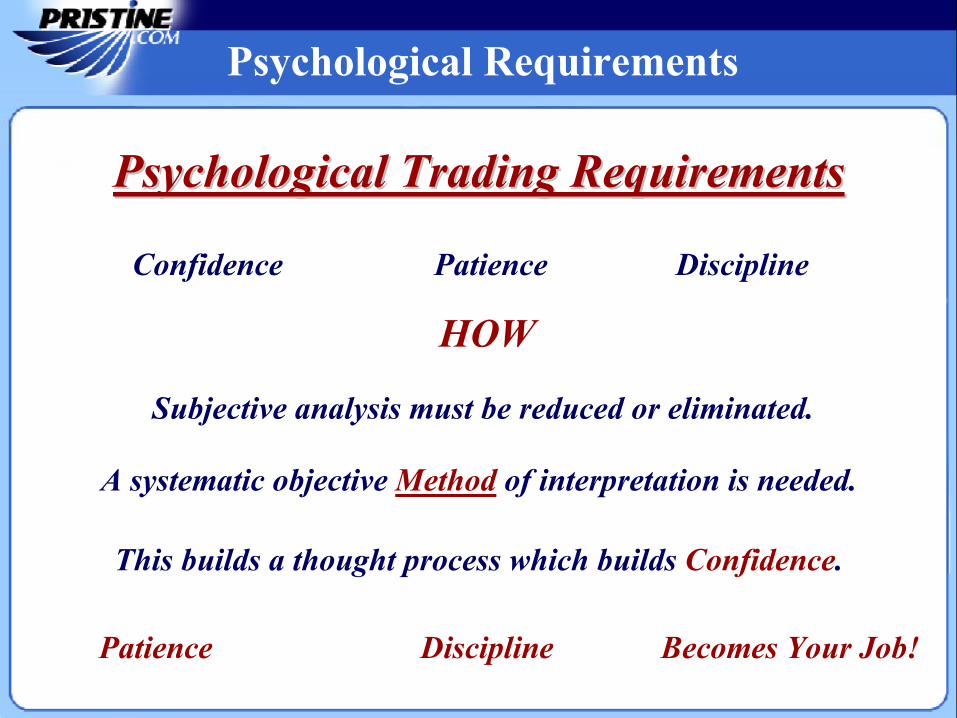
Psychological Trading RequirementsPsychological Trading Requirements
Confidence Patience Discipline
HOW
A systematic objective Method of interpretation is needed.
Subjective analysis must be reduced or eliminated.
This builds a thought process which builds Confidence.
Patience Discipline Becomes Your Job!
Subjective Analysis Subjective Analysis
7
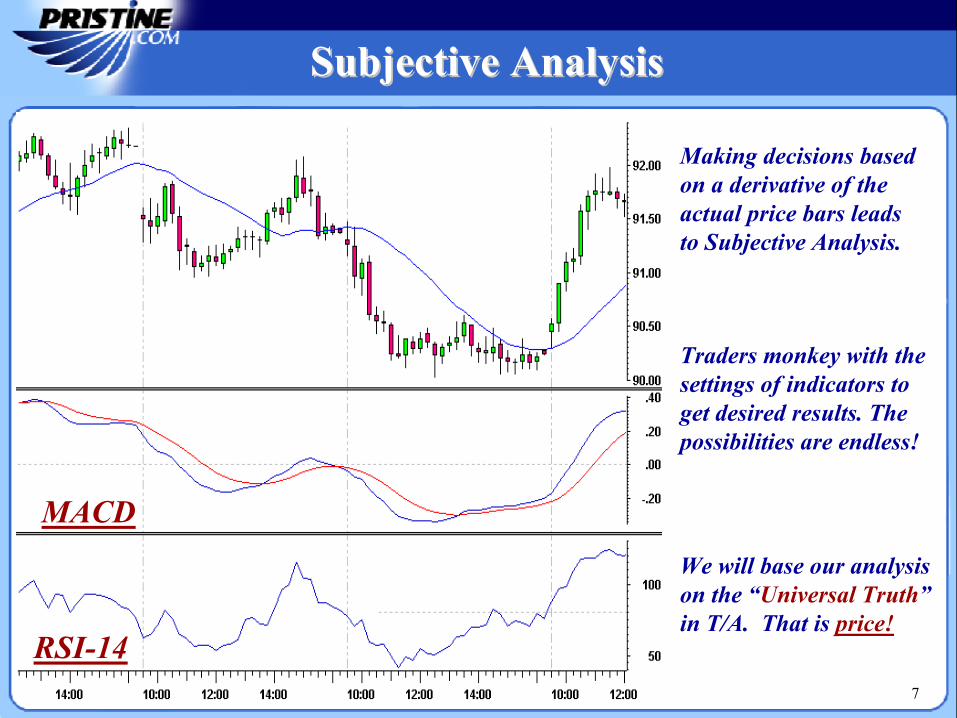
RSI-14
MACD
Making decisions based on a derivative of the actual price bars leads to Subjective Analysis.
We will base our analysis on the “Universal Truth”in T/A. That is price!
Traders monkey with the settings of indicators to get desired results. The possibilities are endless!
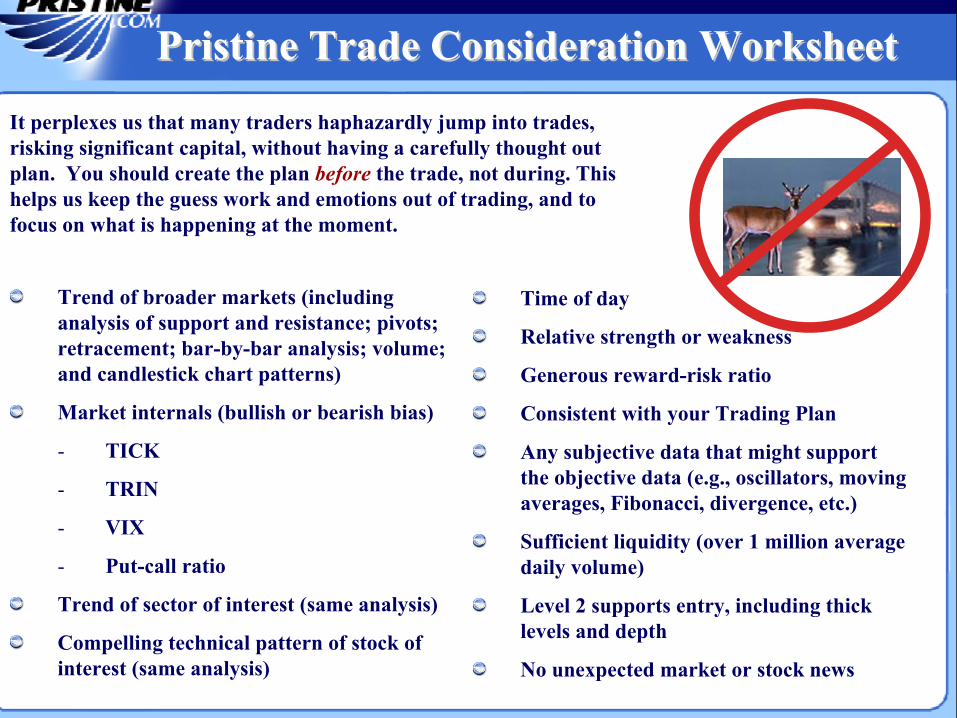
Pristine Trade Consideration WorksheetPristine Trade Consideration WorksheetIt perplexes us that many traders haphazardly jump into trades, risking significant capital, without having a carefully thought out plan. You should create the plan before the trade, not during. This helps us keep the guess work and emotions out of trading, and tofocus on what is happening at the moment.
Trend of broader markets (including analysis of support and resistance; pivots; retracement; bar-by-bar analysis; volume; and candlestick chart patterns)
Market internals (bullish or bearish bias)
- TICK
- TRIN
- VIX
- Put-call ratio
Trend of sector of interest (same analysis)
Compelling technical pattern of stock of interest (same analysis)
Time of day
Relative strength or weakness
Generous reward-risk ratio
Consistent with your Trading Plan
Any subjective data that might support the objective data (e.g., oscillators, moving averages, Fibonacci, divergence, etc.)
Sufficient liquidity (over 1 million average daily volume)
Level 2 supports entry, including thick levels and depth
No unexpected market or stock news
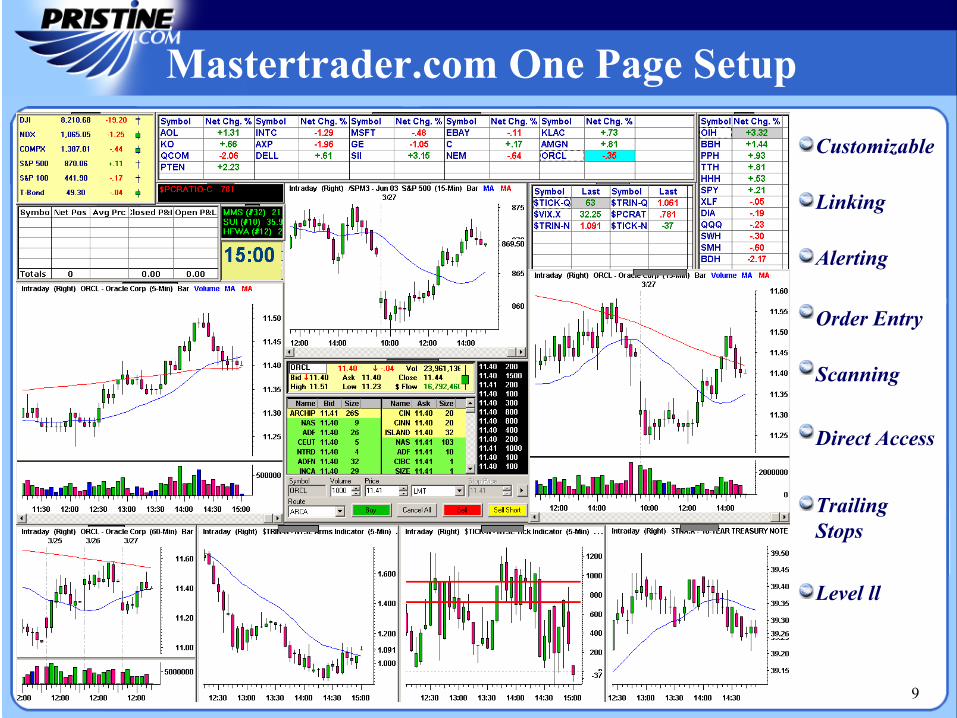
Mastertrader.com One Page Setup
9
Customizable
Linking
Alerting
Order Entry
Scanning
Direct Access
Trailing Stops
Level ll

FoundationFoundation
The Building BlocksThe Building Blocks
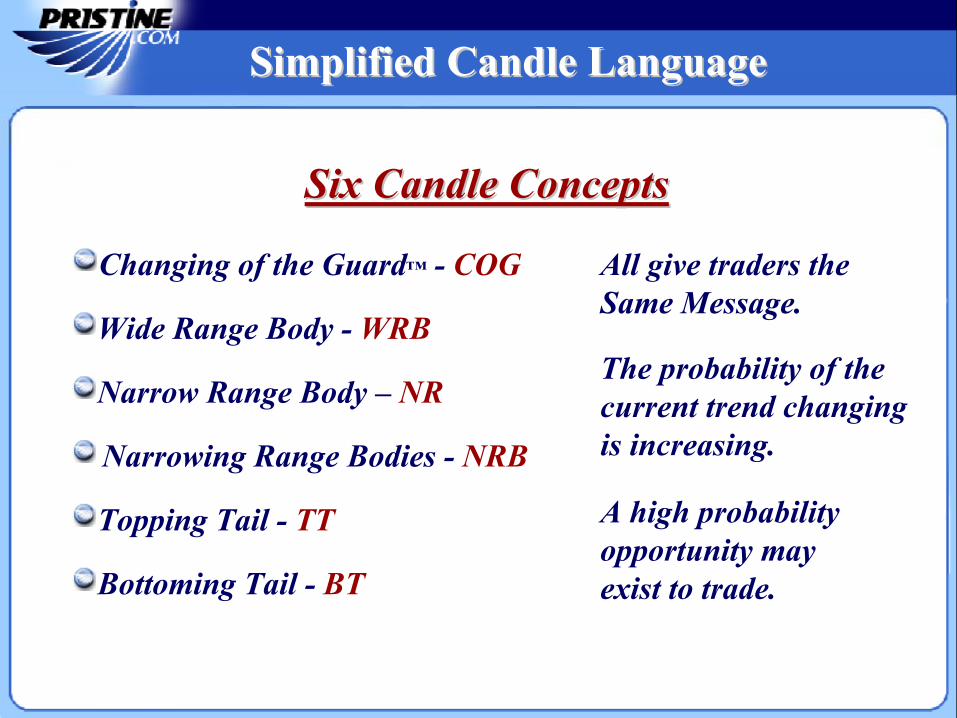
Simplified Candle LanguageSimplified Candle Language
Six Candle ConceptsSix Candle Concepts
All give traders the Same Message.
The probability of the current trend changing is increasing.
A high probability opportunity may exist to trade.Bottoming Tail - BT
Topping Tail - TT
Narrowing Range Bodies - NRB
Narrow Range Body – NR
Wide Range Body - WRB
Changing of the Guard™ - COG
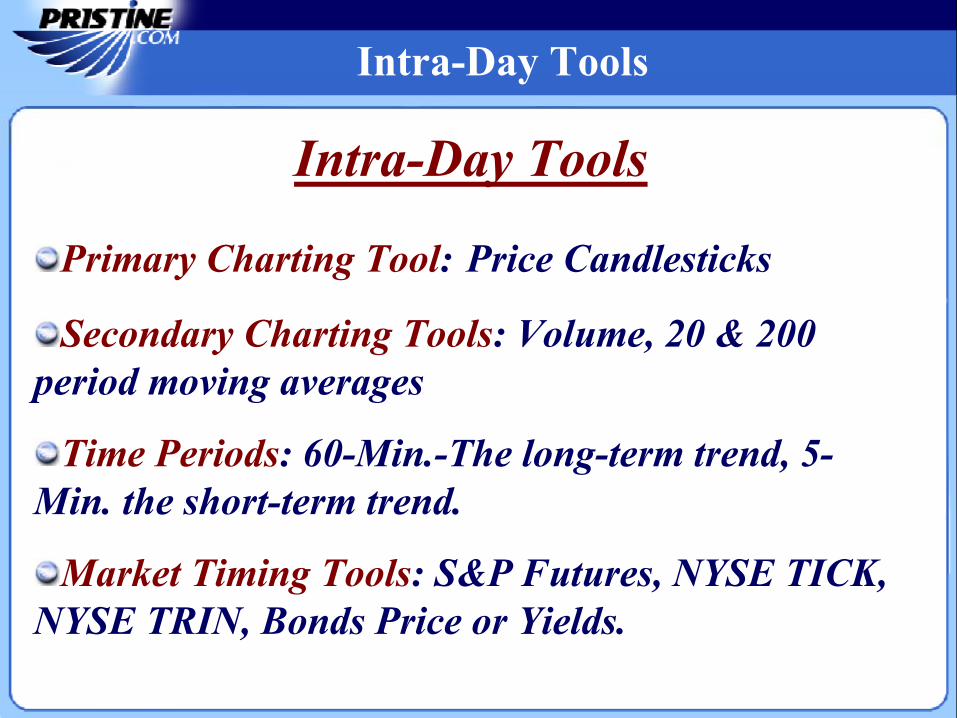
Intra-Day Tools
Primary Charting Tool: Price Candlesticks
Secondary Charting Tools: Volume, 20 & 200 period moving averages
Time Periods: 60-Min.-The long-term trend, 5-Min. the short-term trend.
Market Timing Tools: S&P Futures, NYSE TICK, NYSE TRIN, Bonds Price or Yields.
Intra-Day Tools
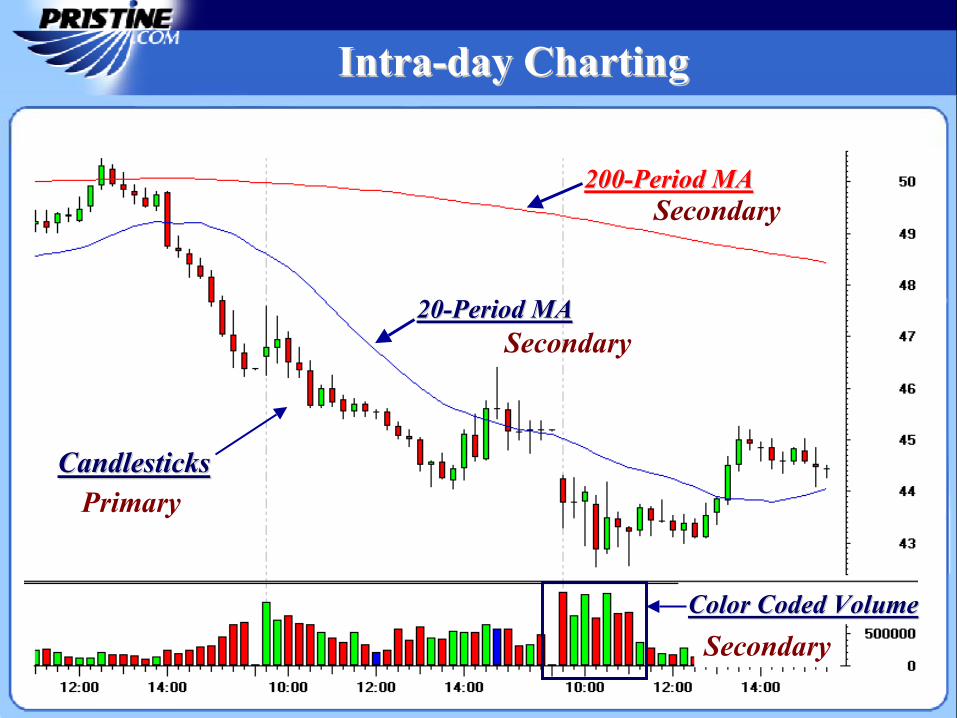
IntraIntra--day Chartingday Charting
2020--Period MAPeriod MA
200200--Period MAPeriod MA
CandlesticksCandlesticks
Color Coded VolumeColor Coded Volume
Primary
Secondary
Secondary
Secondary
The Pristine Buy and Sell SetupThe Pristine Buy and Sell Setup
Pristine Buy & Sell Setup Facts:Pristine Buy & Sell Setup Facts:
The setup can be traded in all time frames.
This combination of bars is a segment or smaller part of the overall pattern.
It is a set of bars that occurs in a detailed formation.
It offers high probability with low risk.
Pristine Capital Holdings, Inc.
The Pristine Buy and Sell SetupThe Pristine Buy and Sell Setup
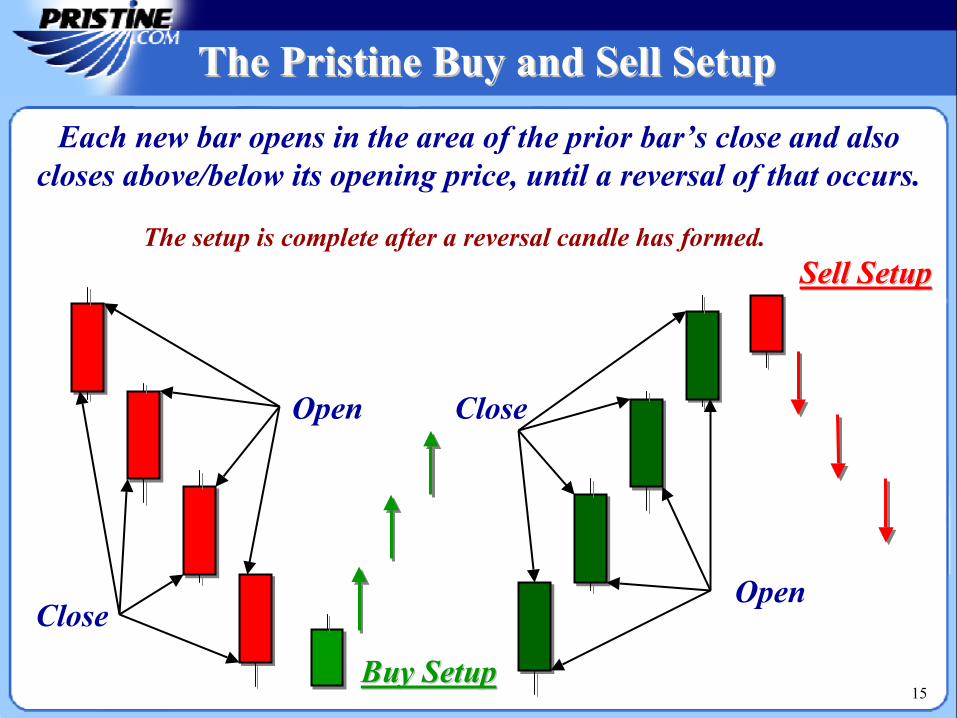
Sell SetupSell Setup
Buy SetupBuy Setup
Each new bar opens in the area of the prior bar’s close and alsocloses above/below its opening price, until a reversal of that occurs.
Close
Open Close
Open
The setup is complete after a reversal candle has formed.
15
Pristine Capital Holdings, Inc.
The Pristine Buy and Sell SetupThe Pristine Buy and Sell Setup
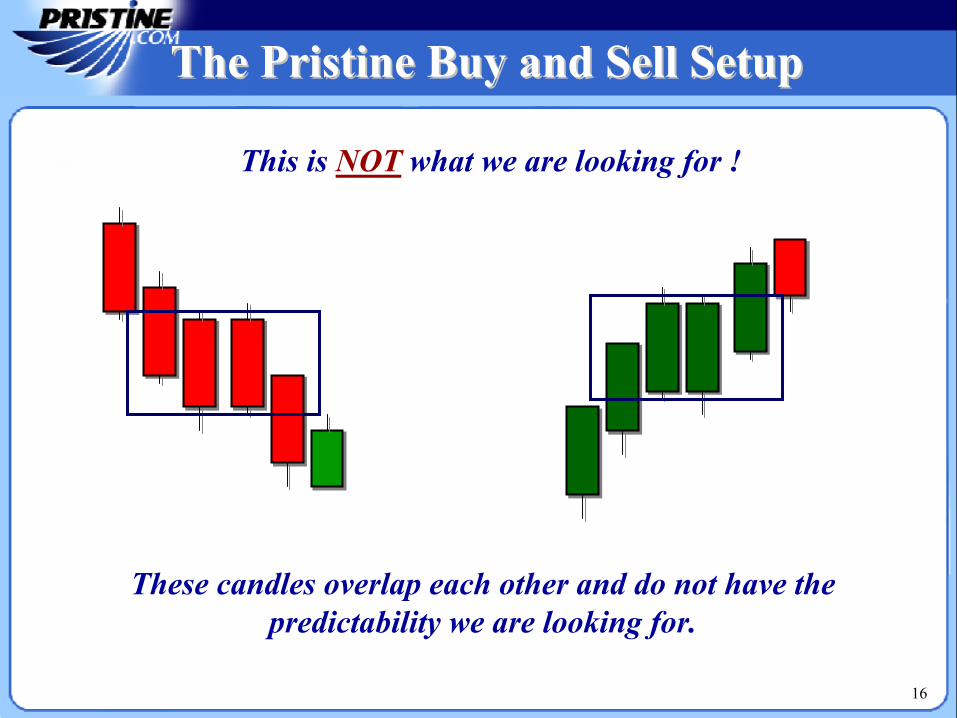
This is NOT what we are looking for !
These candles overlap each other and do not have the predictability we are looking for.
16
Pristine Capital Holdings, Inc.
Moving Average AnalysisMoving Average Analysis
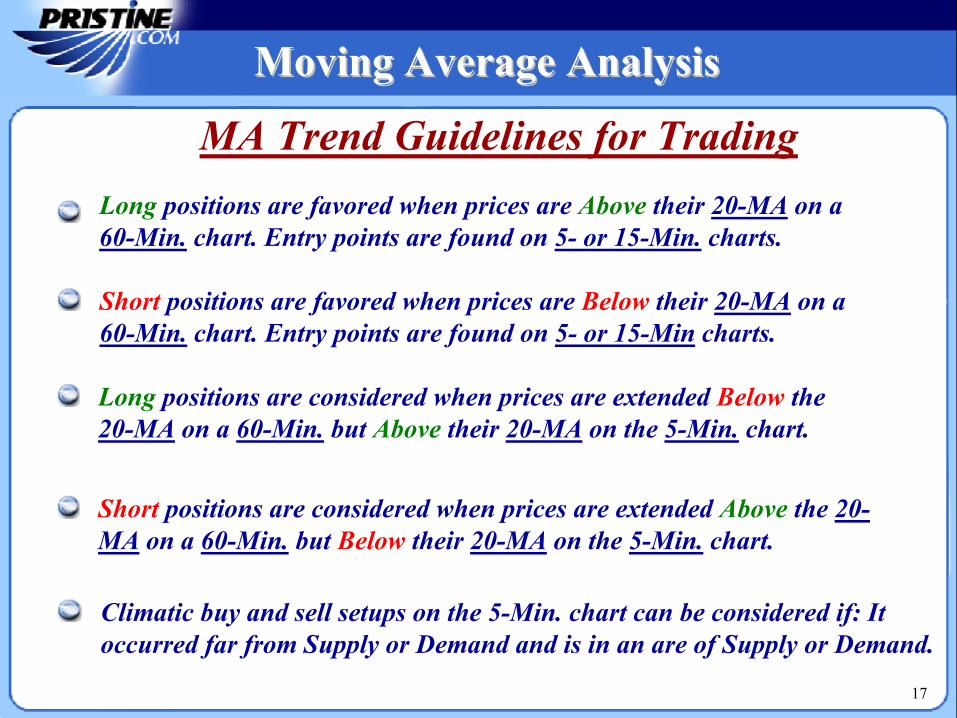
MA Trend Guidelines for TradingLong positions are favored when prices are Above their 20-MA on a 60-Min. chart. Entry points are found on 5- or 15-Min. charts.
Long positions are considered when prices are extended Below the 20-MA on a 60-Min. but Above their 20-MA on the 5-Min. chart.
Short positions are considered when prices are extended Above the 20-MA on a 60-Min. but Below their 20-MA on the 5-Min. chart.
Short positions are favored when prices are Below their 20-MA on a 60-Min. chart. Entry points are found on 5- or 15-Min charts.
17
Climatic buy and sell setups on the 5-Min. chart can be considered if: It occurred far from Supply or Demand and is in an are of Supply or Demand.
Pristine Capital Holdings, Inc.
Moving Average GuidelinesMoving Average Guidelines
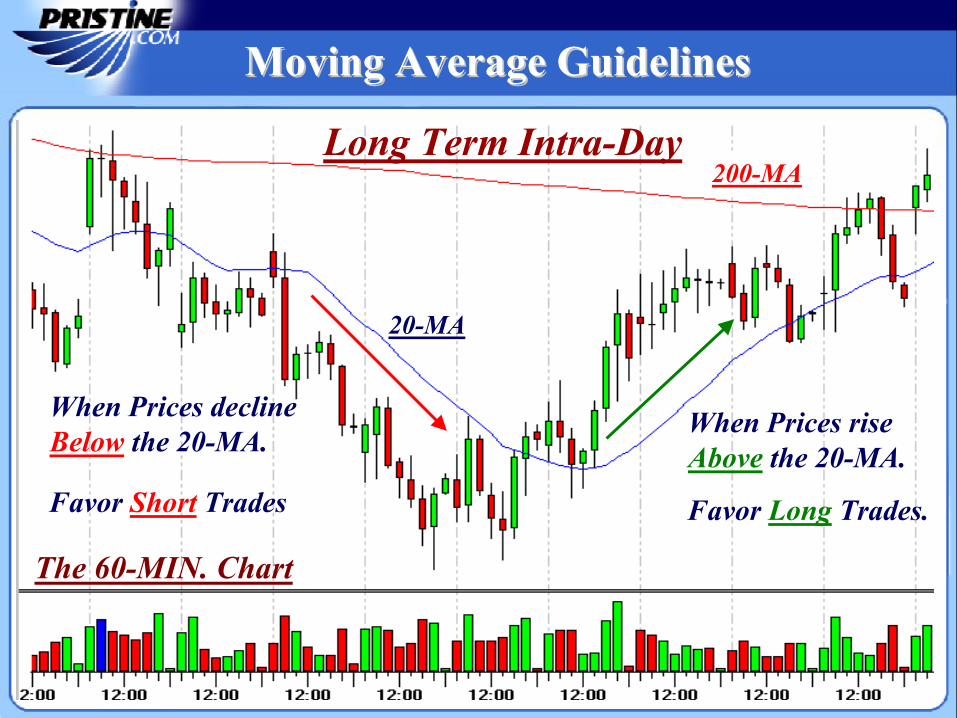
The 60-MIN. Chart
Long Term Intra-Day
When Prices rise Above the 20-MA.
When Prices decline Below the 20-MA.
20-MA
200-MA
Favor Short Trades Favor Long Trades.
195-Min.
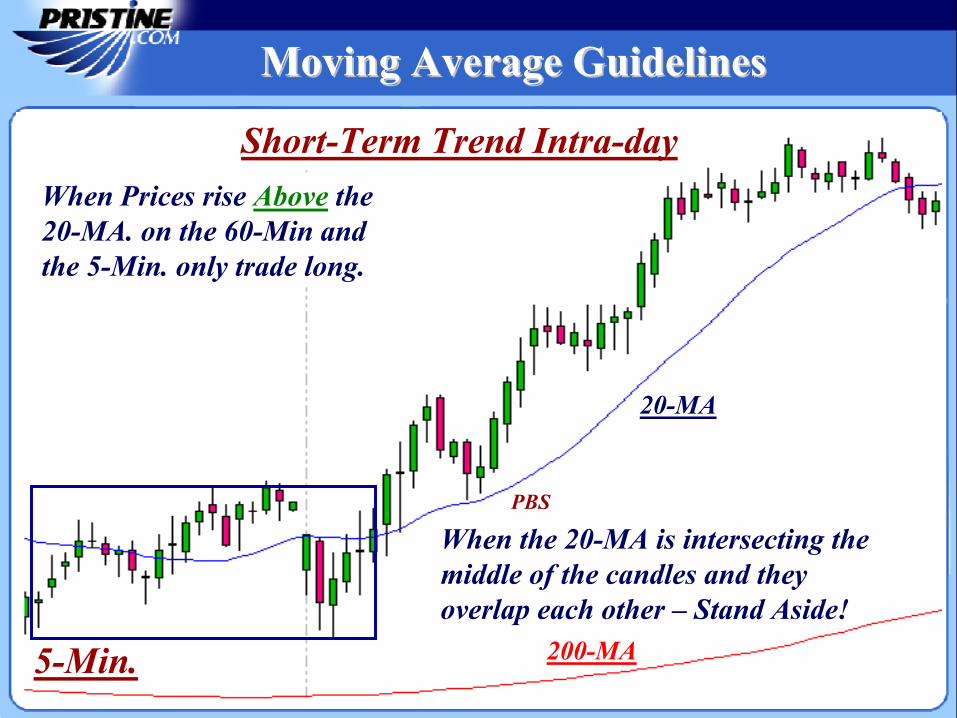
Short-Term Trend Intra-day
200-MA
20-MA
When Prices rise Above the 20-MA. on the 60-Min and the 5-Min. only trade long.
Moving Average GuidelinesMoving Average Guidelines
When the 20-MA is intersecting the middle of the candles and they overlap each other – Stand Aside!
PBS
Pristine Capital Holdings, Inc.
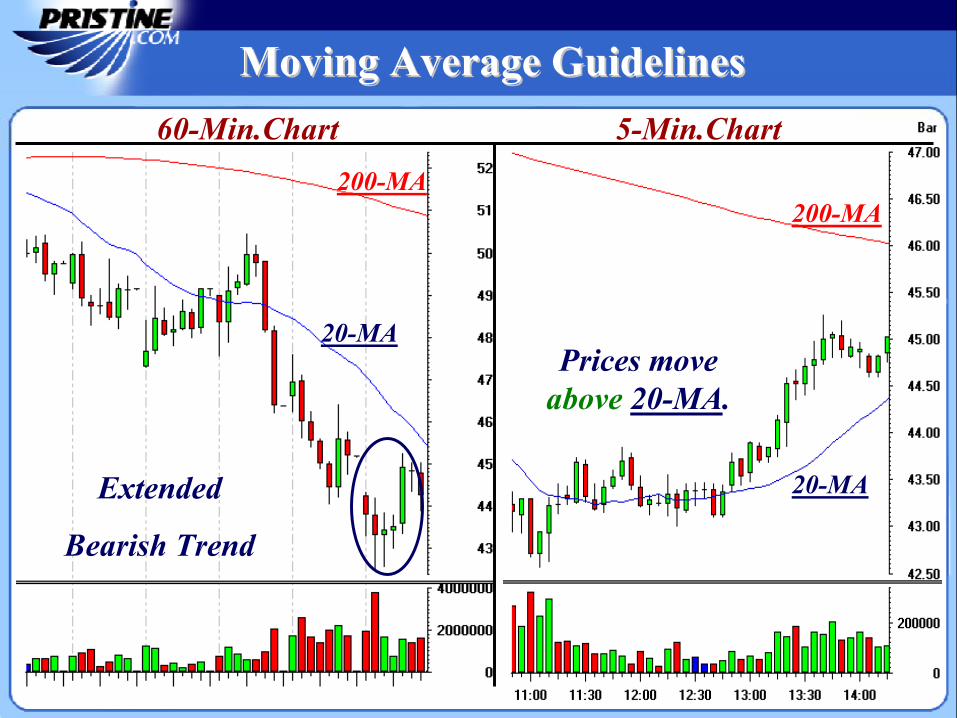
Moving Average GuidelinesMoving Average Guidelines
Extended
Bearish Trend
Prices move above 20-MA.
60-Min.Chart 5-Min.Chart
20-MA
20-MA
200-MA200-MA

UnderstandingUnderstanding
CandlesticksCandlesticks21
Pristine Capital Holdings, Inc.
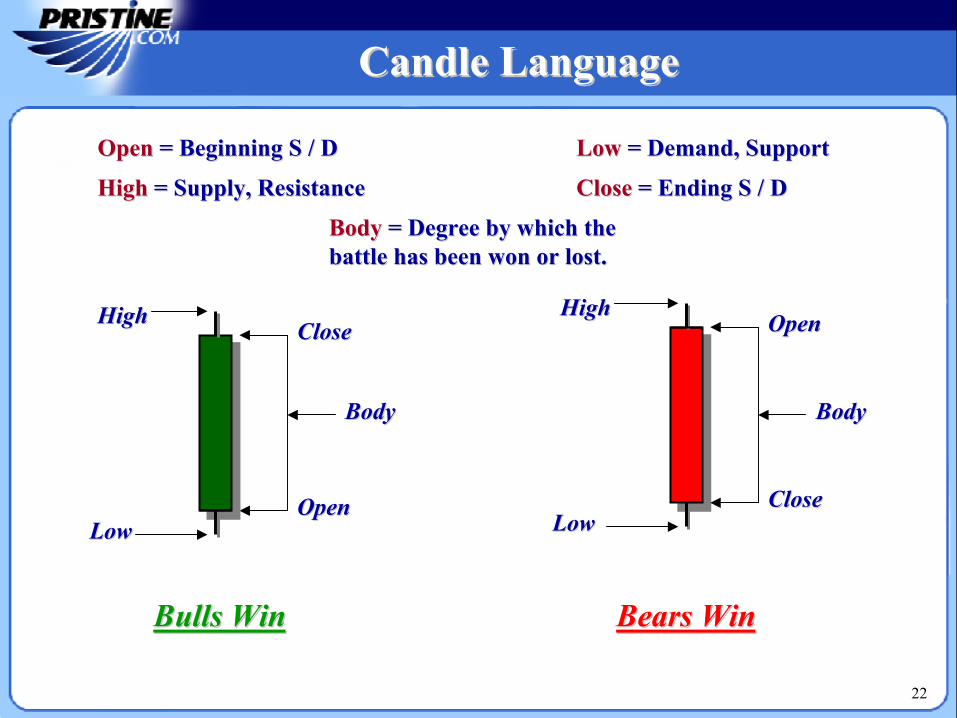
Bears WinBears WinBulls WinBulls Win
HighHigh
LowLow
CloseClose
OpenOpen
OpenOpen
CloseClose
HighHigh
LowLow
BodyBody BodyBody
HighHigh = Supply, Resistance= Supply, ResistanceLowLow = Demand, Support= Demand, Support
BodyBody = Degree by which the = Degree by which the battle has been won or lost.battle has been won or lost.
OpenOpen = Beginning S / D= Beginning S / D
CloseClose = Ending S / D= Ending S / D
22
Candle LanguageCandle Language
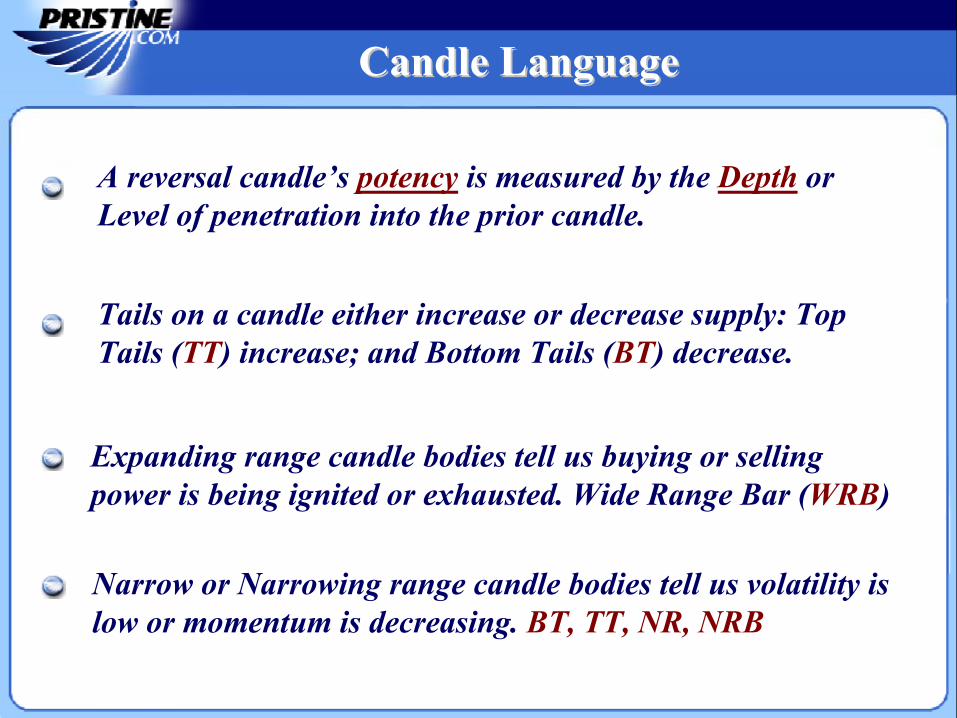
Narrow or Narrowing range candle bodies tell us volatility is low or momentum is decreasing. BT, TT, NR, NRB
Expanding range candle bodies tell us buying or selling power is being ignited or exhausted. Wide Range Bar (WRB)
A reversal candle’s potency is measured by the Depth or Level of penetration into the prior candle.
Tails on a candle either increase or decrease supply: Top Tails (TT) increase; and Bottom Tails (BT) decrease.
Candle LanguageCandle Language
Candle LanguageCandle Language
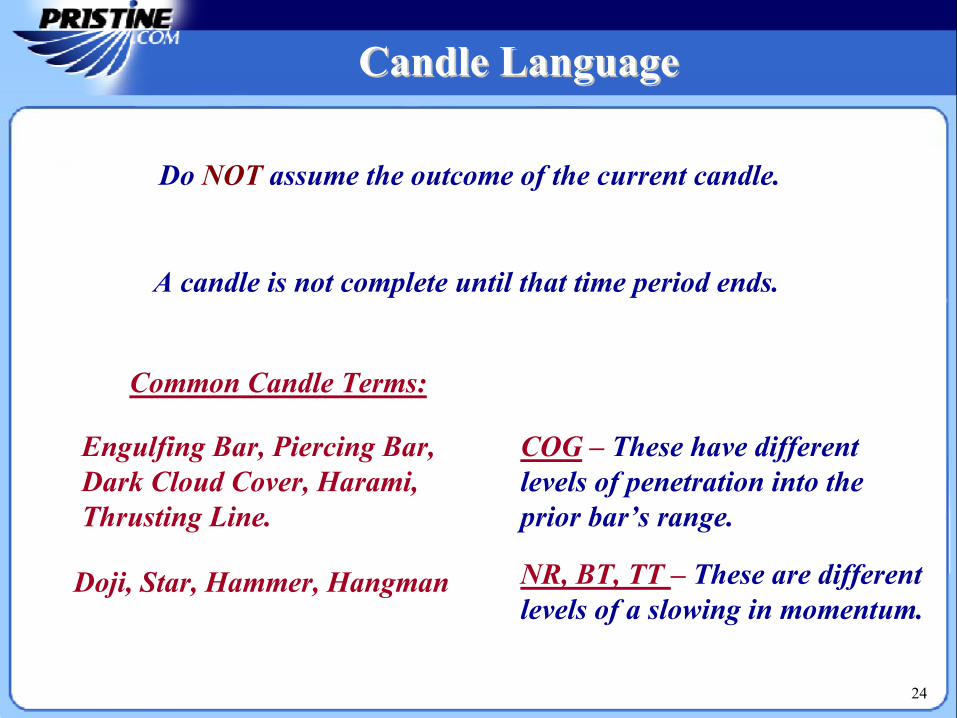
A candle is not complete until that time period ends.
Do NOT assume the outcome of the current candle.
Common Candle Terms:
Engulfing Bar, Piercing Bar, Dark Cloud Cover, Harami, Thrusting Line.
Doji, Star, Hammer, Hangman
COG – These have different levels of penetration into theprior bar’s range.
NR, BT, TT – These are differentlevels of a slowing in momentum.
24
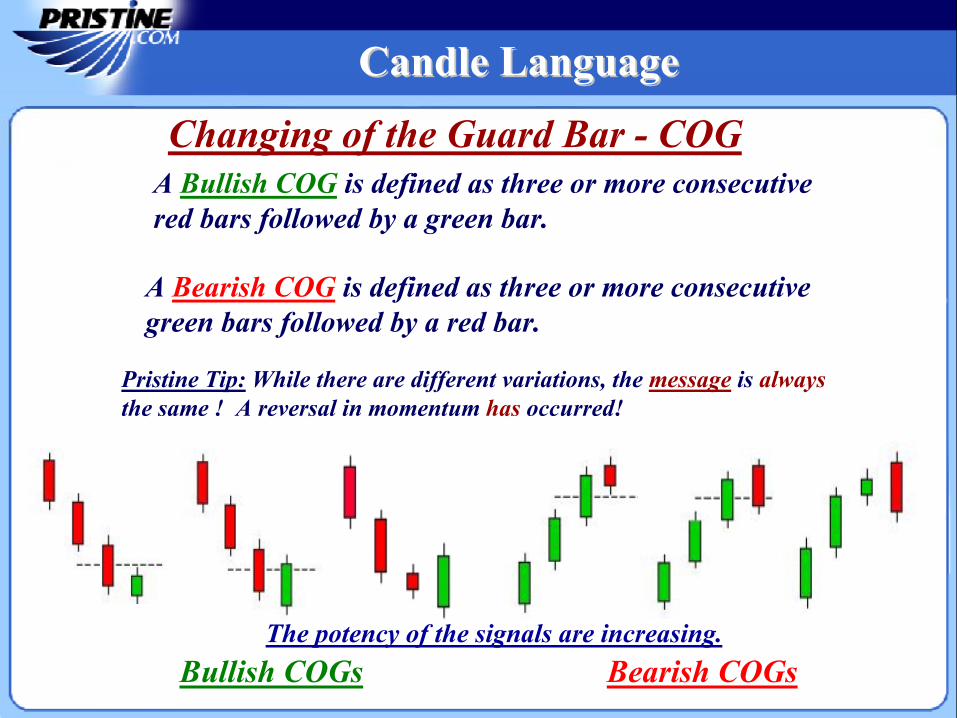
Changing of the Guard Bar - COGA Bullish COG is defined as three or more consecutive red bars followed by a green bar.
Pristine Tip: While there are different variations, the message is always the same ! A reversal in momentum has occurred!
A Bearish COG is defined as three or more consecutive green bars followed by a red bar.
Bullish COGs Bearish COGsThe potency of the signals are increasing.
Candle LanguageCandle Language
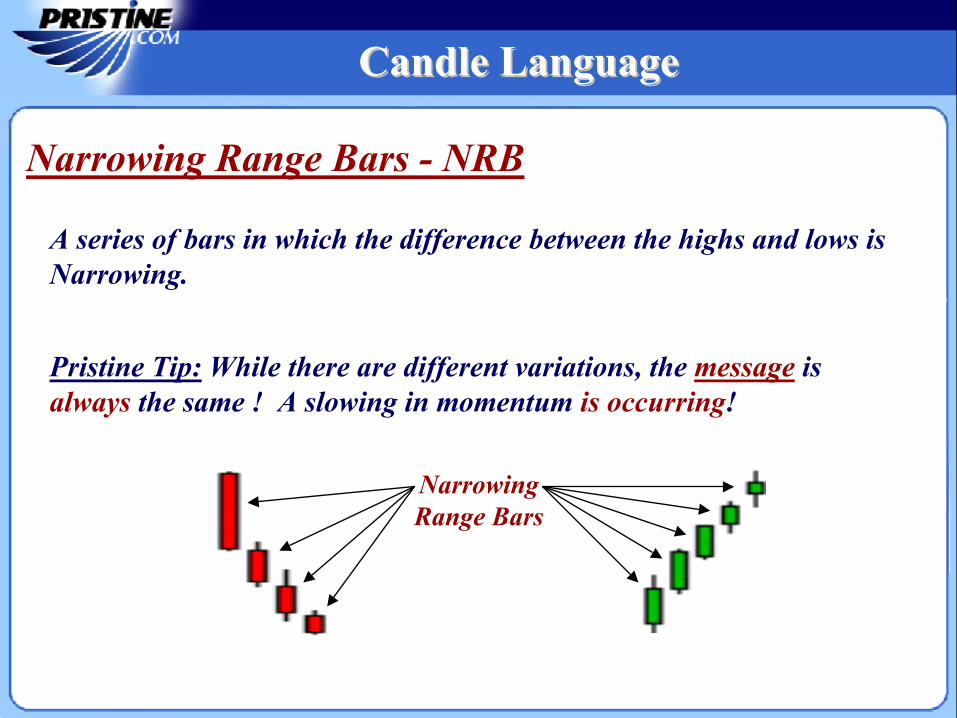
Narrowing Range Bars - NRB
Pristine Tip: While there are different variations, the message is always the same ! A slowing in momentum is occurring!
Narrowing Range Bars
A series of bars in which the difference between the highs and lows is Narrowing.
Candle LanguageCandle Language
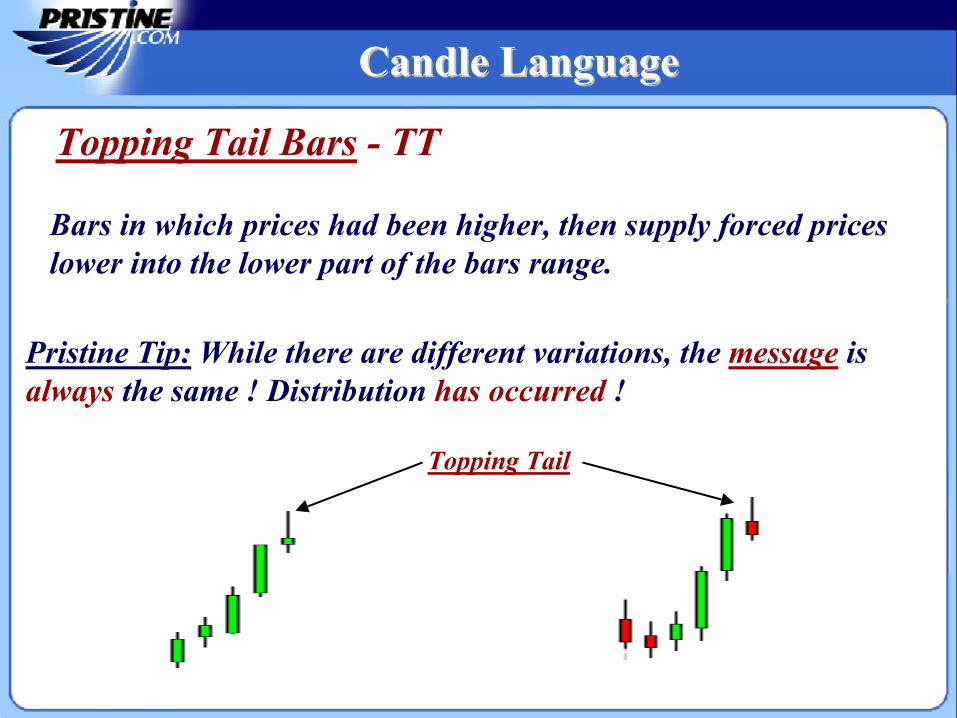
Topping Tail Bars - TT
Bars in which prices had been higher, then supply forced prices lower into the lower part of the bars range.
Pristine Tip: While there are different variations, the message is always the same ! Distribution has occurred !
Topping Tail
Candle LanguageCandle Language
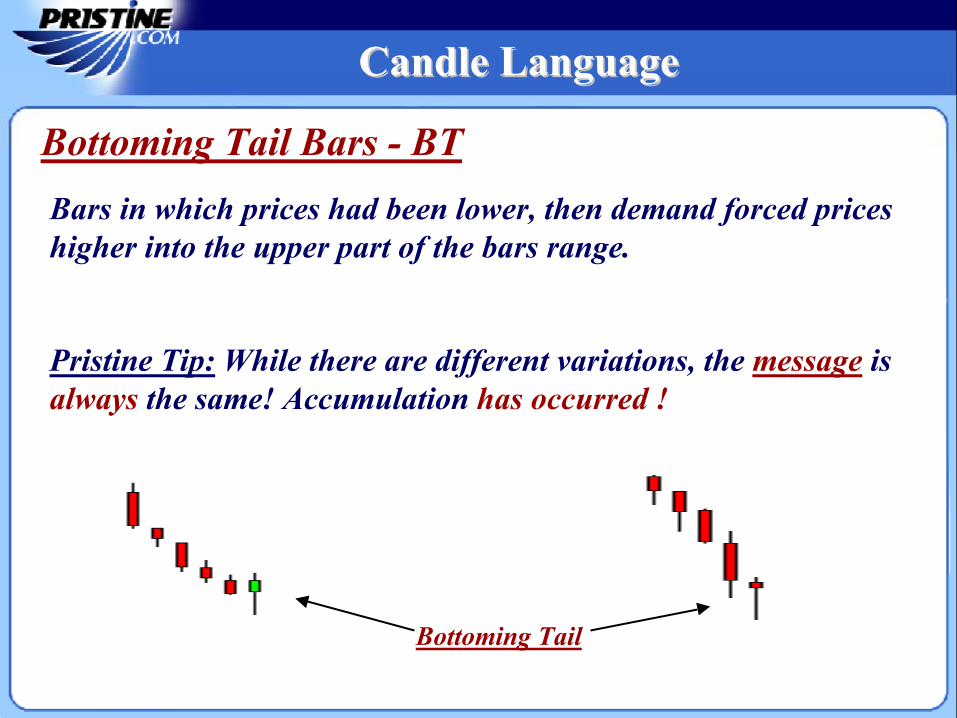
Bottoming Tail Bars - BTBars in which prices had been lower, then demand forced prices higher into the upper part of the bars range.
Pristine Tip: While there are different variations, the message is always the same! Accumulation has occurred !
Bottoming Tail
Candle LanguageCandle Language
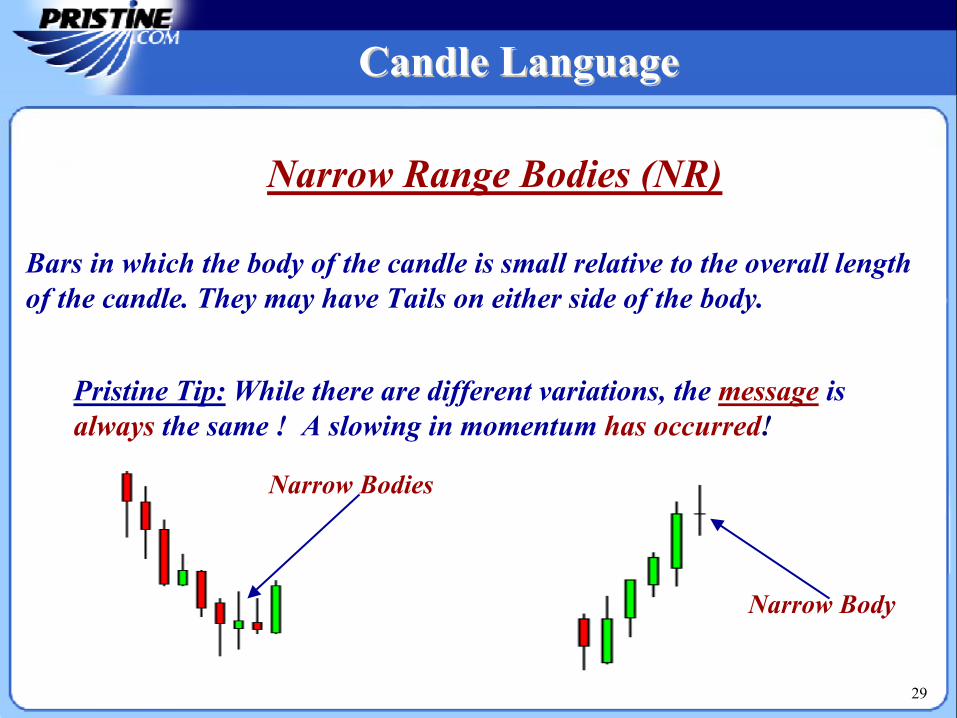
Narrow Range Bodies (NR)
Pristine Tip: While there are different variations, the message isalways the same ! A slowing in momentum has occurred!
Bars in which the body of the candle is small relative to the overall length of the candle. They may have Tails on either side of the body.
Narrow Body
Narrow Bodies
29
Candle LanguageCandle Language
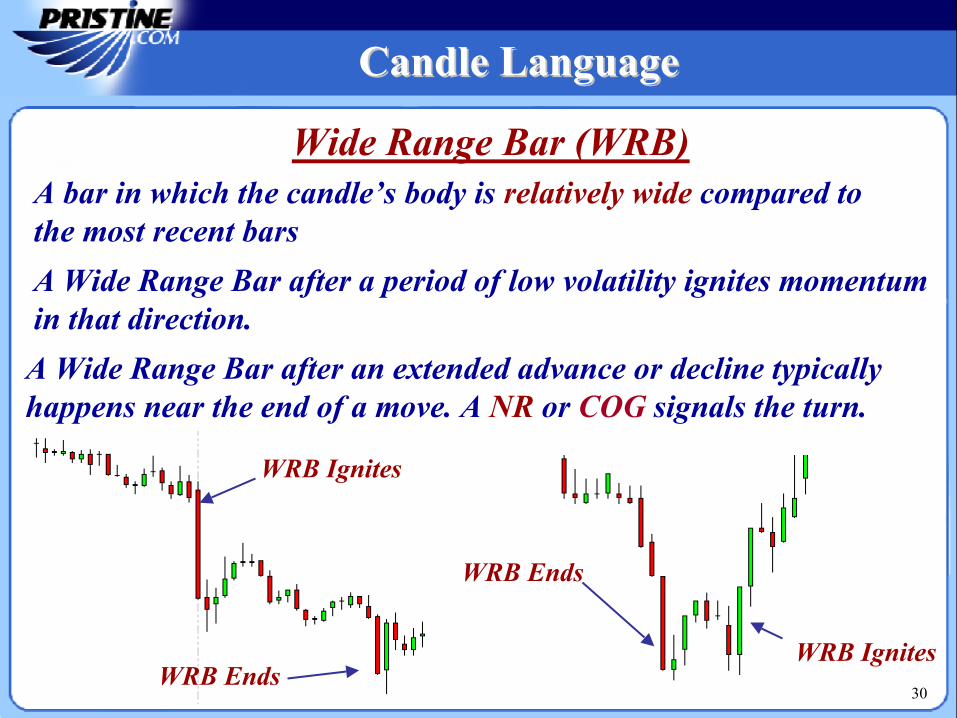
Wide Range Bar (WRB)A bar in which the candle’s body is relatively wide compared to the most recent bars
A Wide Range Bar after an extended advance or decline typically happens near the end of a move. A NR or COG signals the turn.
A Wide Range Bar after a period of low volatility ignites momentum in that direction.
WRB Ends
WRB Ignites
30
WRB IgnitesWRB Ends
Candle LanguageCandle Language
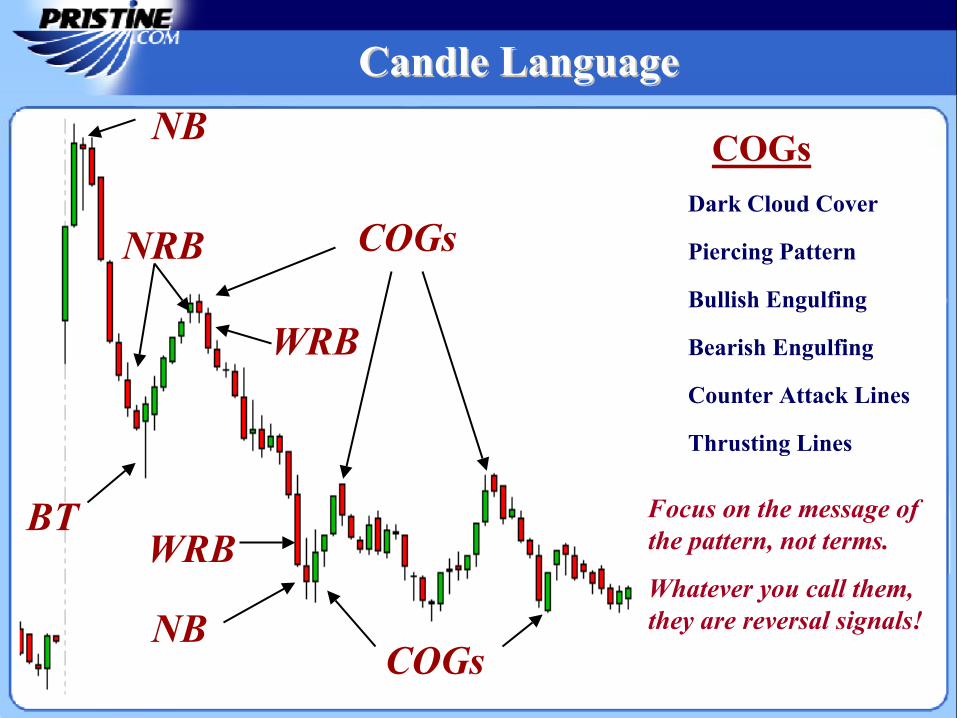
Dark Cloud Cover
Piercing Pattern
Bullish Engulfing
Bearish Engulfing
Counter Attack Lines
Thrusting Lines
COGs
COGs
COGs
BT
NB
NB
NRB
WRB
WRBFocus on the message of the pattern, not terms.
Whatever you call them, they are reversal signals!
Candle LanguageCandle Language

Supply Supply
& Demand& Demand32
Pristine Capital Holdings, Inc.
Support and Resistance AnalysisSupport and Resistance Analysis
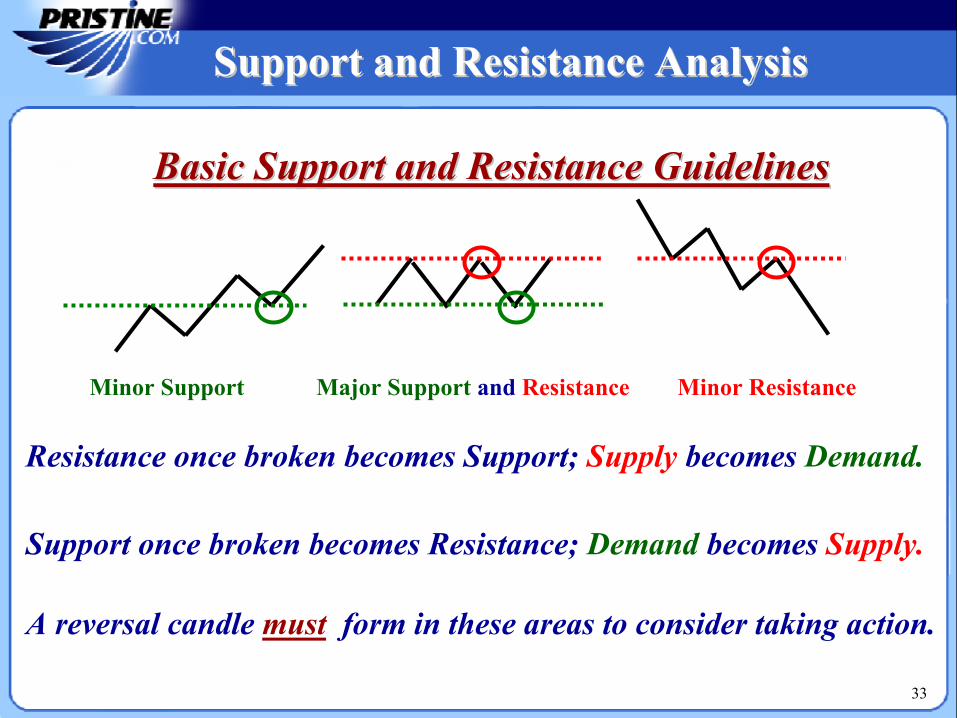
Minor Support Major Support and Resistance Minor Resistance
A reversal candle must form in these areas to consider taking action.
Basic Support and Resistance GuidelinesBasic Support and Resistance Guidelines
Resistance once broken becomes Support; Supply becomes Demand.
Support once broken becomes Resistance; Demand becomes Supply.
33
Pristine Capital Holdings, Inc.
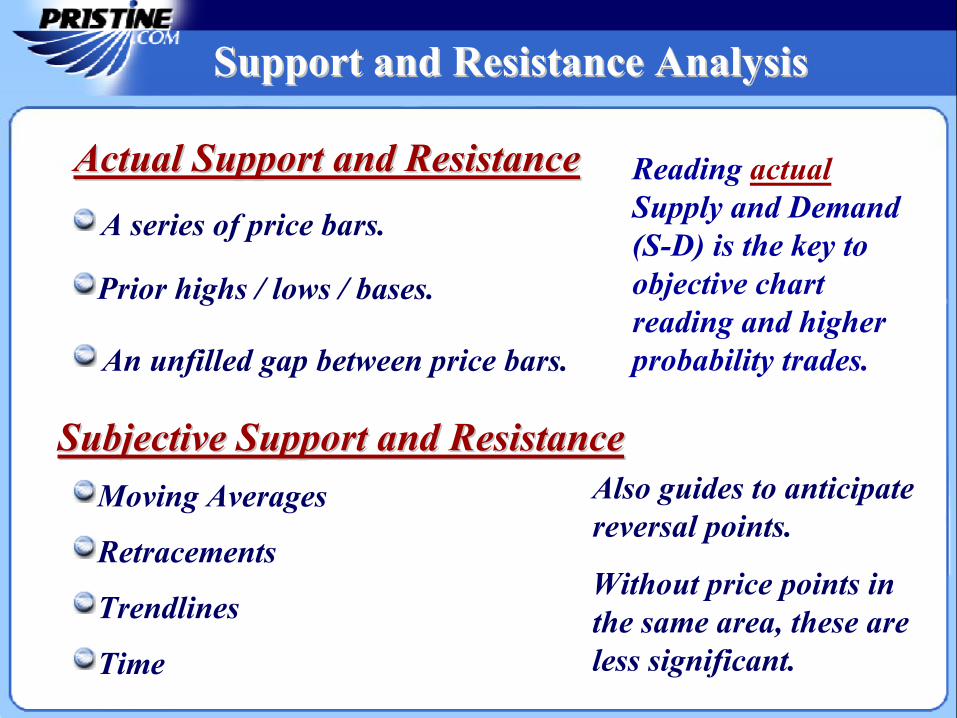
Actual Support and ResistanceActual Support and Resistance
Subjective Support and ResistanceSubjective Support and Resistance
Without price points in the same area, these are less significant.Time
Retracements
Moving Averages
An unfilled gap between price bars.
Prior highs / lows / bases.
A series of price bars.
Also guides to anticipate reversal points.
Trendlines
Support and Resistance AnalysisSupport and Resistance Analysis
Reading actual Supply and Demand (S-D) is the key to objective chart reading and higher probability trades.
Support and Resistance Questions
35
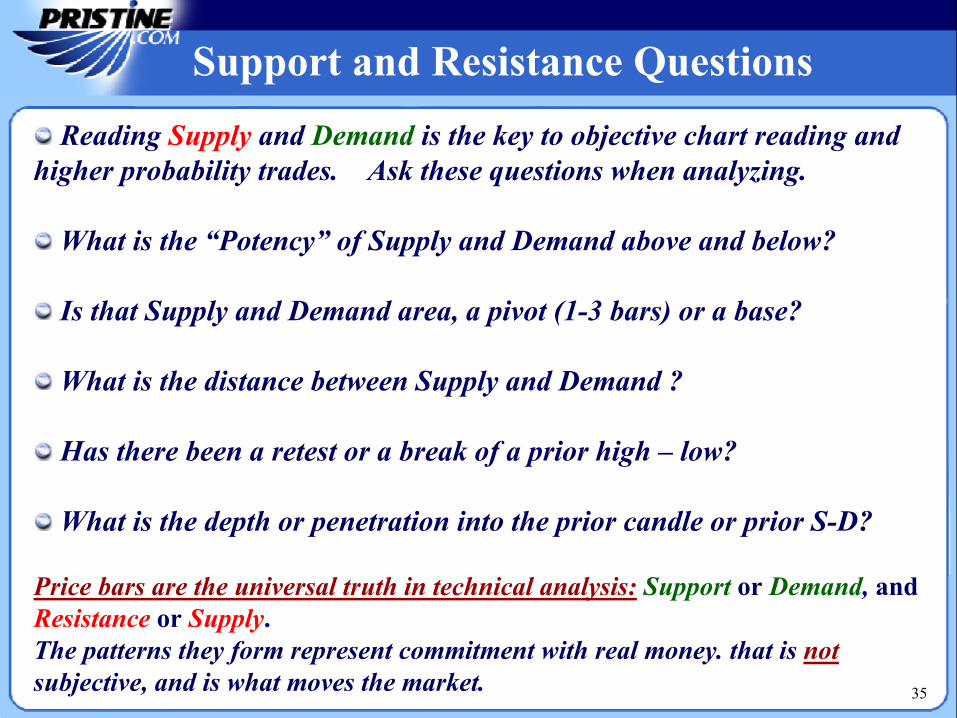
Reading Supply and Demand is the key to objective chart reading and higher probability trades. Ask these questions when analyzing.
What is the “Potency” of Supply and Demand above and below?
Is that Supply and Demand area, a pivot (1-3 bars) or a base?
What is the distance between Supply and Demand ?
Has there been a retest or a break of a prior high – low?
What is the depth or penetration into the prior candle or prior S-D?
Price bars are the universal truth in technical analysis: Support or Demand, andResistance or Supply. The patterns they form represent commitment with real money. that is notsubjective, and is what moves the market.
Pristine Capital Holdings, Inc.
Support and Resistance AnalysisSupport and Resistance Analysis
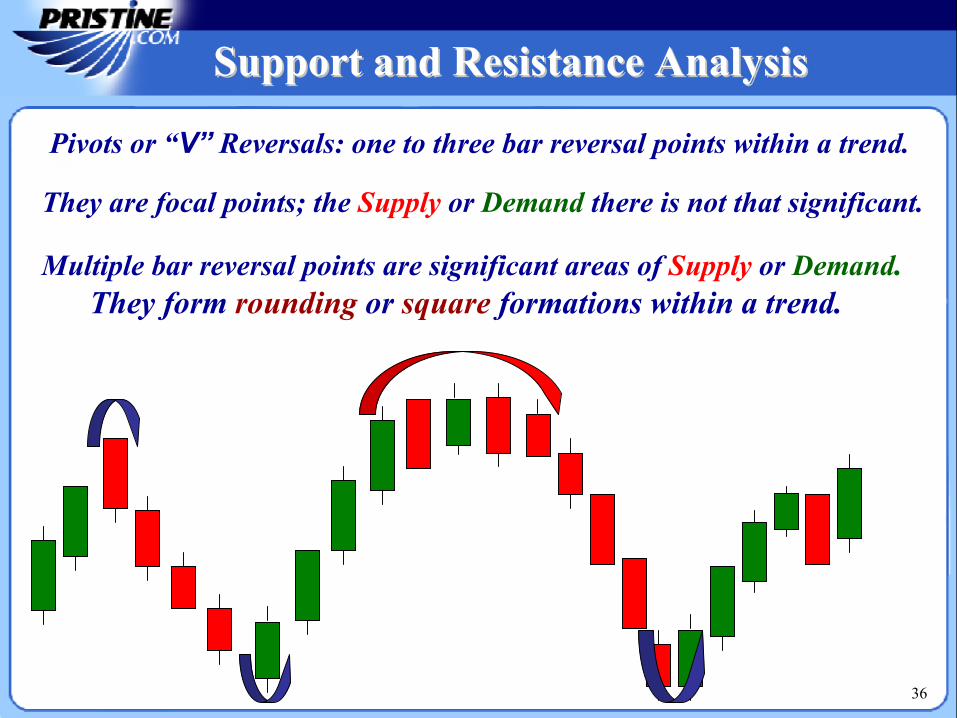
Pivots or “V” Reversals: one to three bar reversal points within a trend.
They are focal points; the Supply or Demand there is not that significant.
Multiple bar reversal points are significant areas of Supply or Demand.They form rounding or square formations within a trend.
36
Pristine Capital Holdings, Inc.
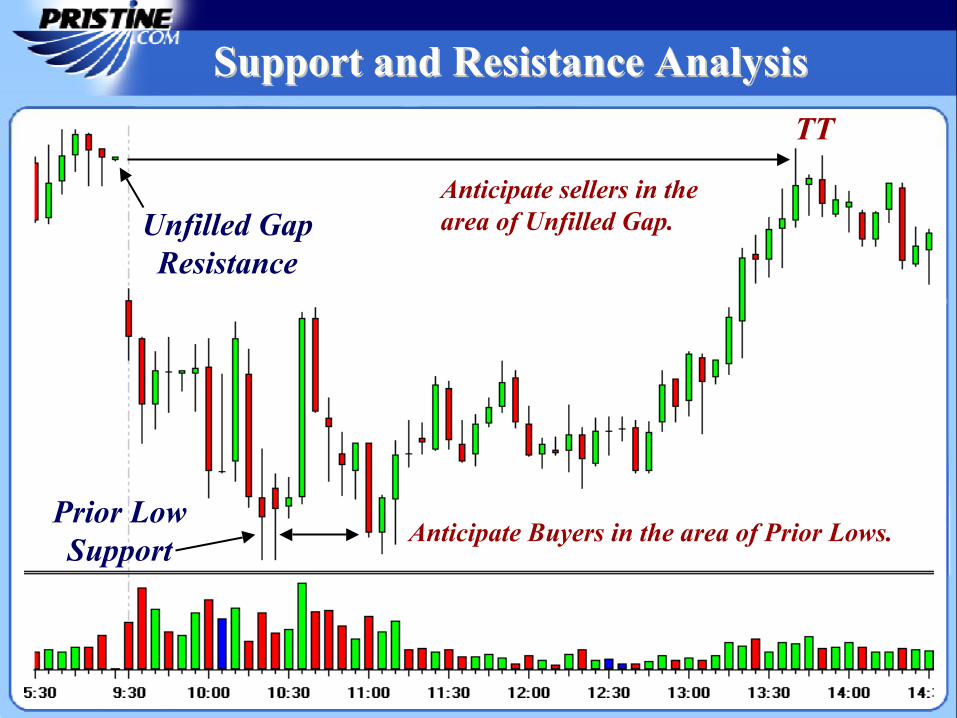
Anticipate sellers in the area of Unfilled Gap.
Anticipate Buyers in the area of Prior Lows.
TT
Unfilled Gap Resistance
Prior Low Support
Support and Resistance AnalysisSupport and Resistance Analysis
Pristine Capital Holdings, Inc.
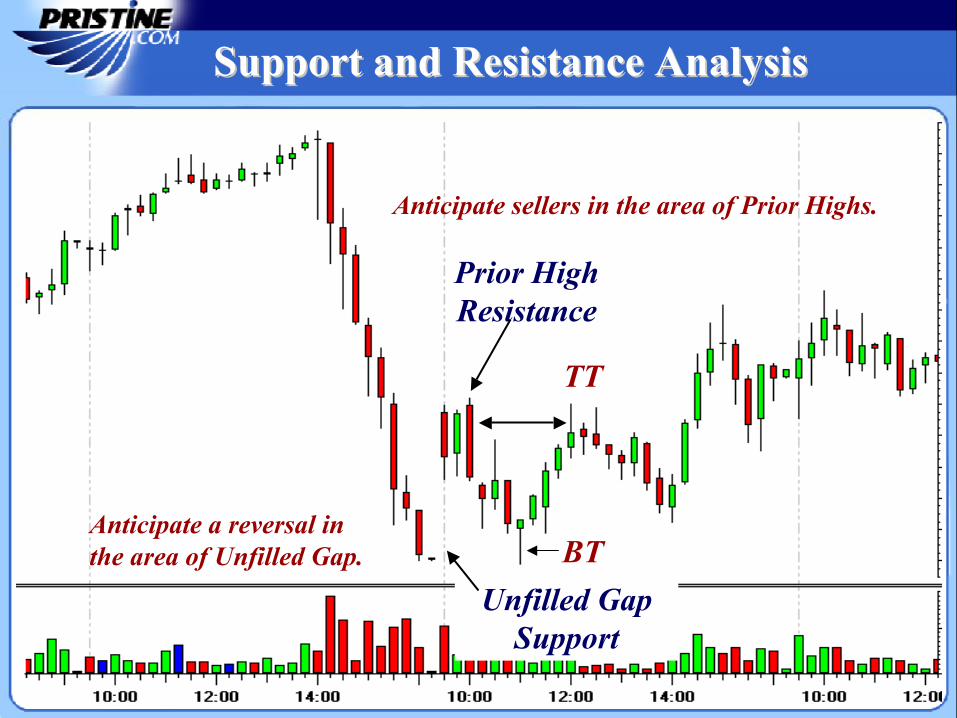
Unfilled Gap Support
Prior High Resistance
TT
BT
Anticipate sellers in the area of Prior Highs.
Anticipate a reversal in the area of Unfilled Gap.
Support and Resistance AnalysisSupport and Resistance Analysis
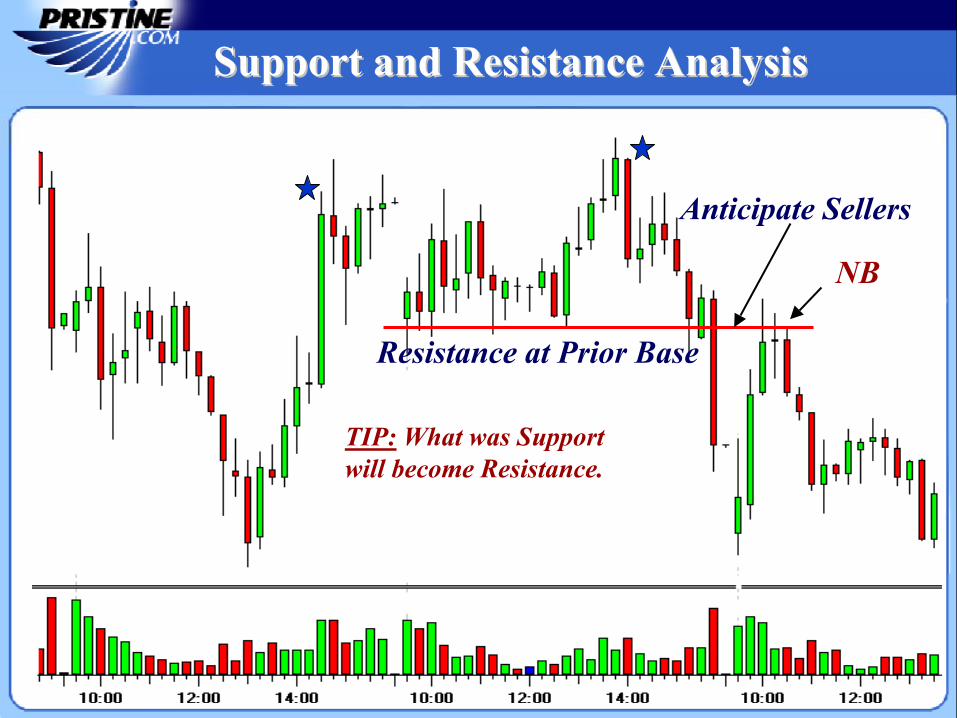
Resistance at Prior Base
Anticipate Sellers
NB
TIP: What was Support will become Resistance.
Support and Resistance AnalysisSupport and Resistance Analysis
Moving Moving AveragesAverages
40
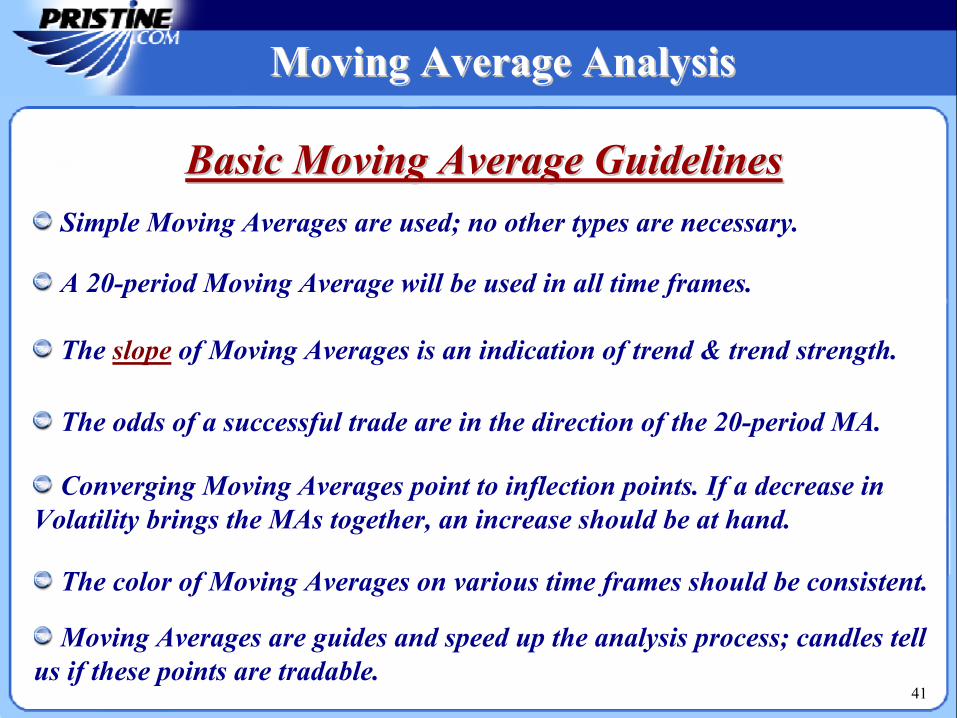
Basic Moving Average GuidelinesBasic Moving Average GuidelinesSimple Moving Averages are used; no other types are necessary.
The slope of Moving Averages is an indication of trend & trend strength.
A 20-period Moving Average will be used in all time frames.
Converging Moving Averages point to inflection points. If a decrease in Volatility brings the MAs together, an increase should be at hand.
Moving Averages are guides and speed up the analysis process; candles tell us if these points are tradable.
The odds of a successful trade are in the direction of the 20-period MA.
The color of Moving Averages on various time frames should be consistent.
41
Moving Average AnalysisMoving Average Analysis
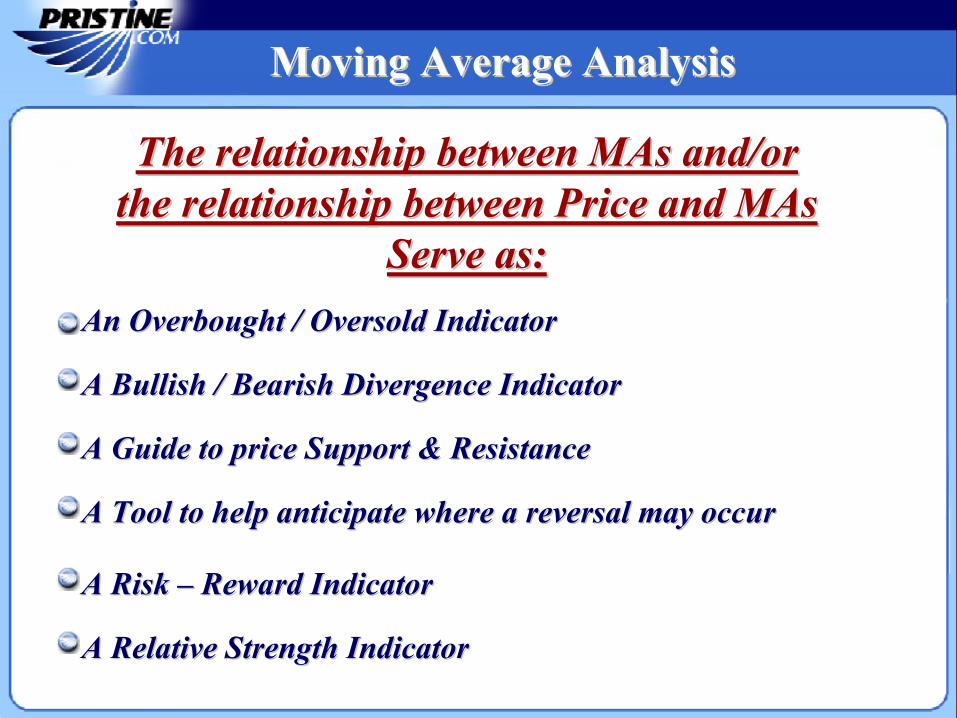
The relationship between MAs and/orThe relationship between MAs and/orthe relationship between Price and MAsthe relationship between Price and MAs
Serve as: Serve as: An Overbought / Oversold IndicatorAn Overbought / Oversold Indicator
A Relative Strength IndicatorA Relative Strength Indicator
A Risk A Risk –– Reward IndicatorReward Indicator
A Tool to help anticipate where a reversal may occurA Tool to help anticipate where a reversal may occur
A Guide to price Support & ResistanceA Guide to price Support & Resistance
A Bullish / Bearish Divergence IndicatorA Bullish / Bearish Divergence Indicator
Moving Average AnalysisMoving Average Analysis
Pristine Capital Holdings, Inc.
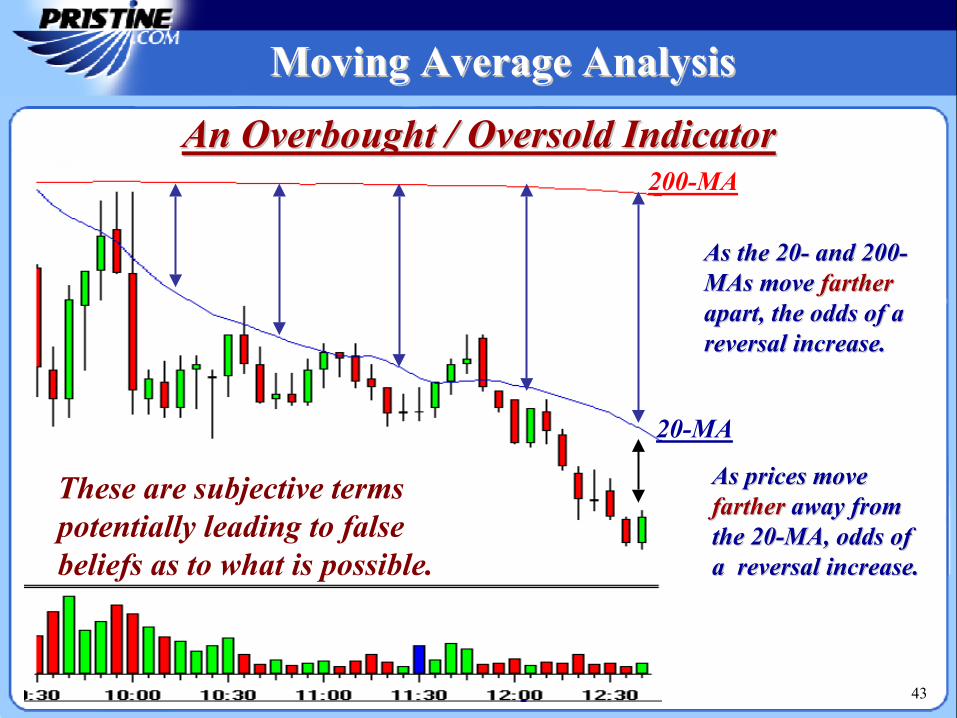
An Overbought / Oversold IndicatorAn Overbought / Oversold Indicator
As the 20As the 20-- and 200and 200--MAs move MAs move fartherfartherapart, the odds of a apart, the odds of a reversal increase.reversal increase.
As prices move As prices move fartherfarther away from away from the 20the 20--MA, odds of MA, odds of a reversal increase.a reversal increase.
20-MA
200-MA
43
Moving Average AnalysisMoving Average Analysis
These are subjective terms potentially leading to false beliefs as to what is possible.
Pristine Capital Holdings, Inc.
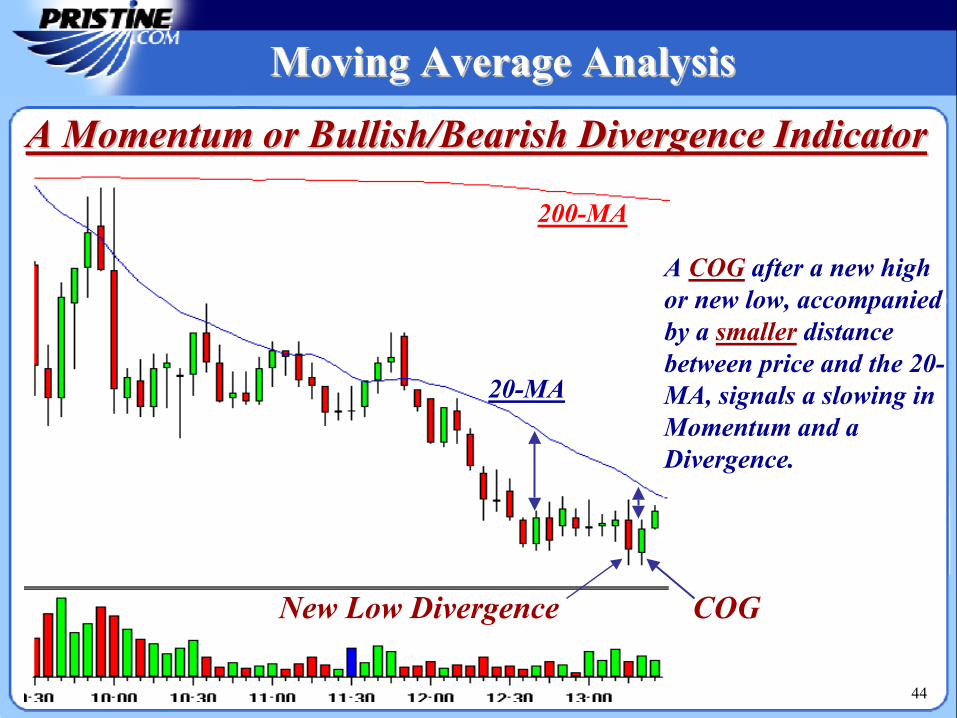
A Momentum or Bullish/Bearish Divergence IndicatorA Momentum or Bullish/Bearish Divergence Indicator
A COG after a new high or new low, accompanied by a smaller distance between price and the 20-MA, signals a slowing in Momentum and a Divergence.
New Low Divergence COG
200-MA
20-MA
44
Moving Average AnalysisMoving Average Analysis
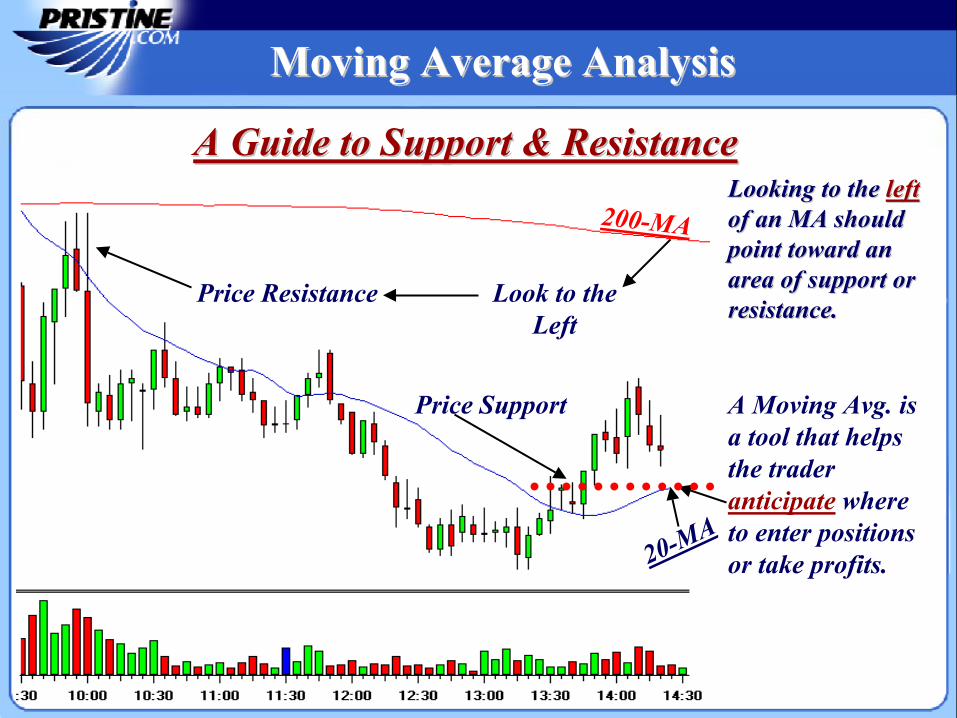
A Guide to Support & ResistanceA Guide to Support & ResistanceLooking to the Looking to the leftleftof an MA should of an MA should point toward an point toward an area of support or area of support or resistance.resistance.
Price ResistancePrice Resistance
200-MA
Look to the Left
Price Support
20-MA
A Moving Avg. is a tool that helps the trader anticipate where to enter positions or take profits.
Moving Average AnalysisMoving Average Analysis
Pristine Capital Holdings, Inc.
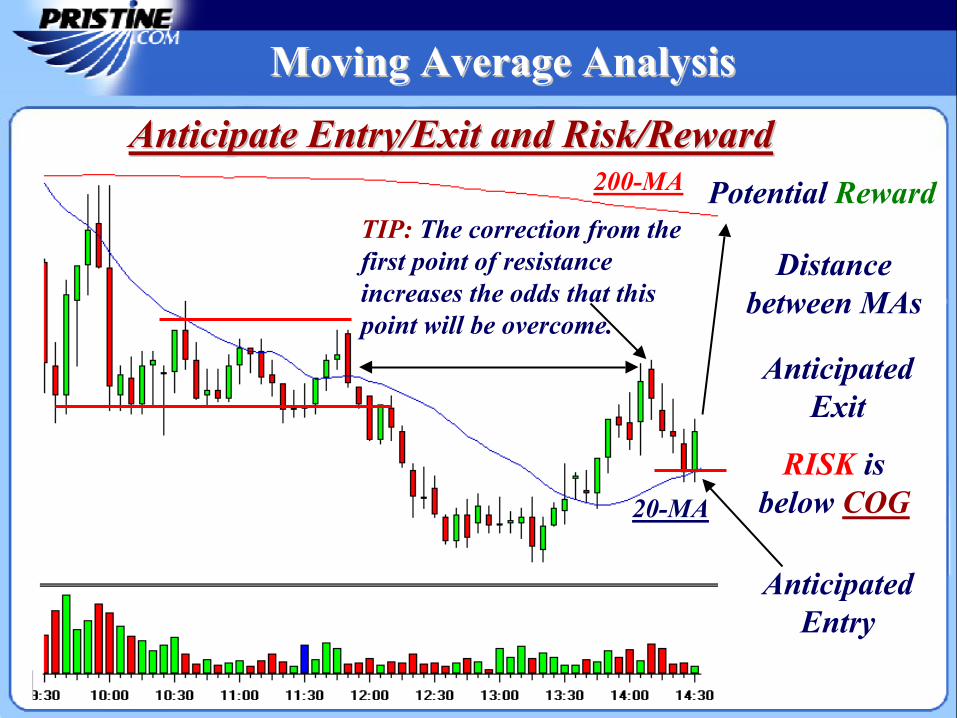
Anticipate Entry/Exit and Risk/RewardAnticipate Entry/Exit and Risk/Reward
As prices move As prices move further from an further from an MA odds of a MA odds of a reversal increase.reversal increase.
RISK is below COG
Potential Reward
Anticipated Exit
TIP: The correction from the first point of resistance increases the odds that this point will be overcome.
Distance between MAs
Anticipated Entry
20-MA
200-MA
Moving Average AnalysisMoving Average Analysis
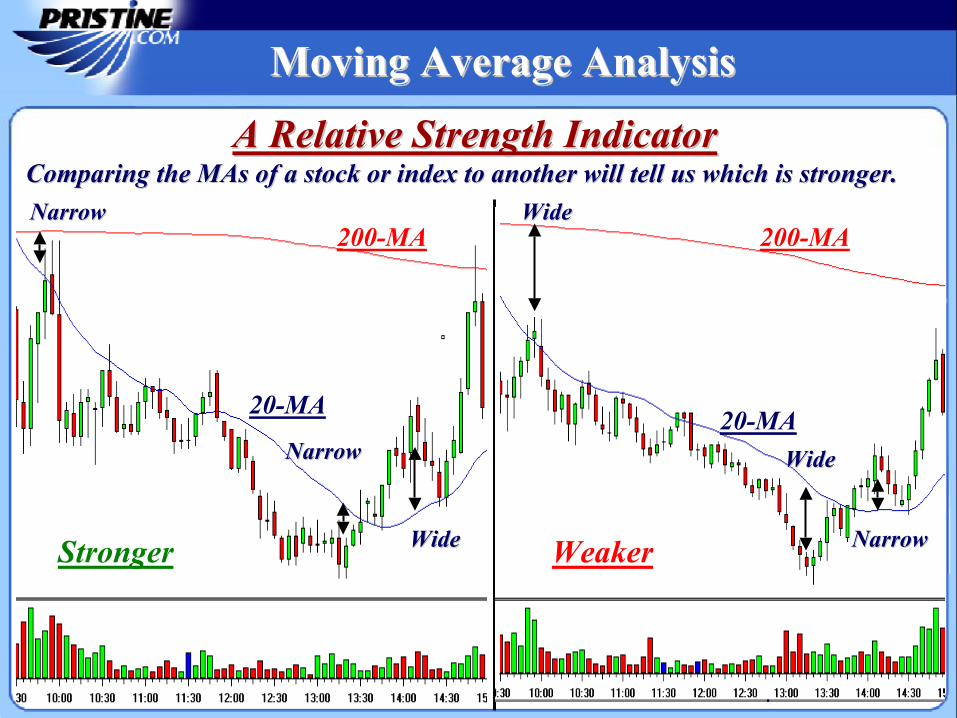
A Relative Strength IndicatorA Relative Strength IndicatorComparing the MAs of a stock or index to another will tell us whComparing the MAs of a stock or index to another will tell us which is stronger.ich is stronger.
WideWide
WideWide NarrowNarrow
200-MA200-MA
20-MA 20-MA
Stronger Weaker
NarrowNarrow WideWide
NarrowNarrow WideWide
Moving Average AnalysisMoving Average Analysis
48
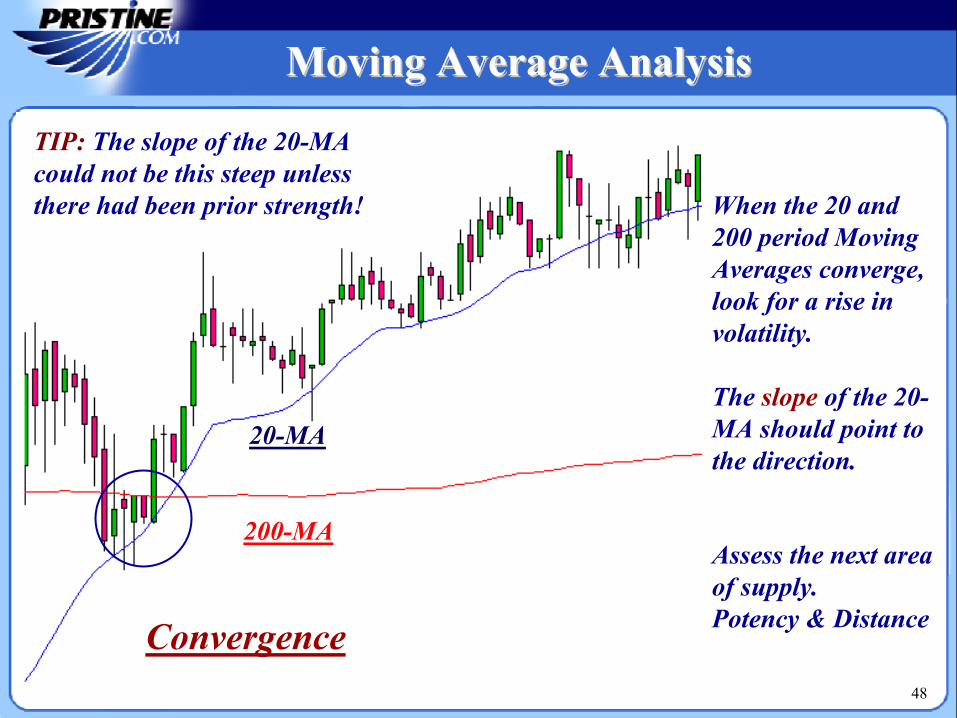
When the 20 and 200 period Moving Averages converge, look for a rise in volatility.
The slope of the 20-MA should point to the direction.
Assess the next area of supply. Potency & DistanceConvergence
20-MA
200-MA
TIP: The slope of the 20-MA could not be this steep unless there had been prior strength!
Moving Average AnalysisMoving Average Analysis

RecognizingRecognizing
QualityQuality49
The quality of a trend is key to the reliability of our setups.
Not all trends are tradable!
When a trend is tight, the majority of opening prices will be in the areaof a prior bar’s close. Typically, not more than 20% into that range.
Pullbacks against a tight trend should fail in the area of minor Demand (Uptrend) or minor Supply (Downtrend).
This pattern of opens and closes will produce few Engulfing, Piercingor Outside bars in a tight trend. A picture of certainty.
Trend Quality
50
Recognizing Quality
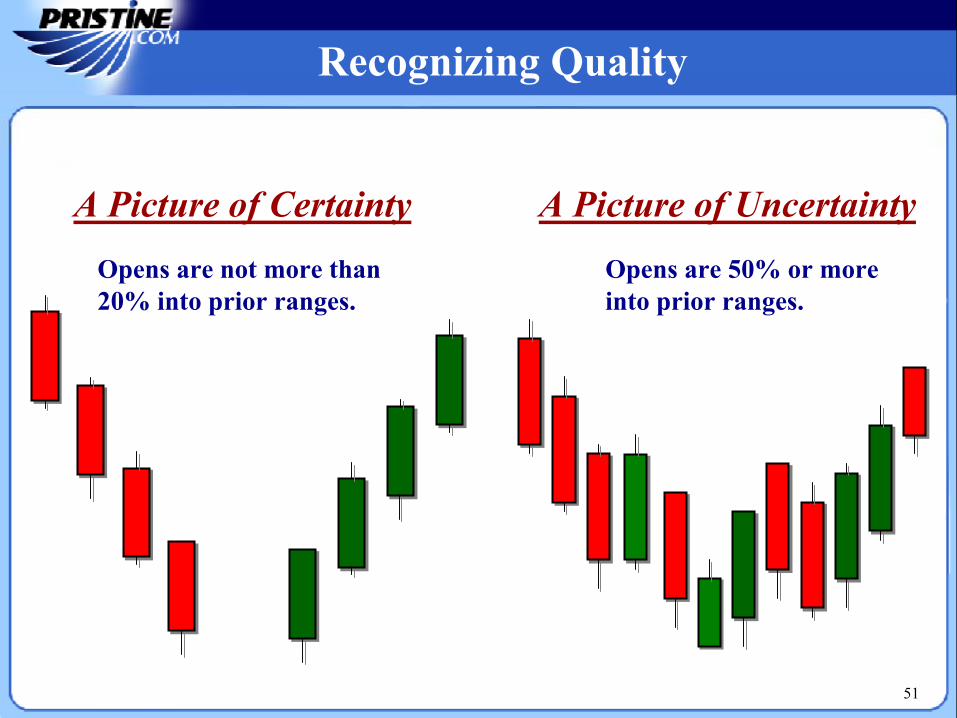
A Picture of UncertaintyA Picture of Certainty
Opens are 50% or more into prior ranges.
Opens are not more than 20% into prior ranges.
51
Recognizing Quality
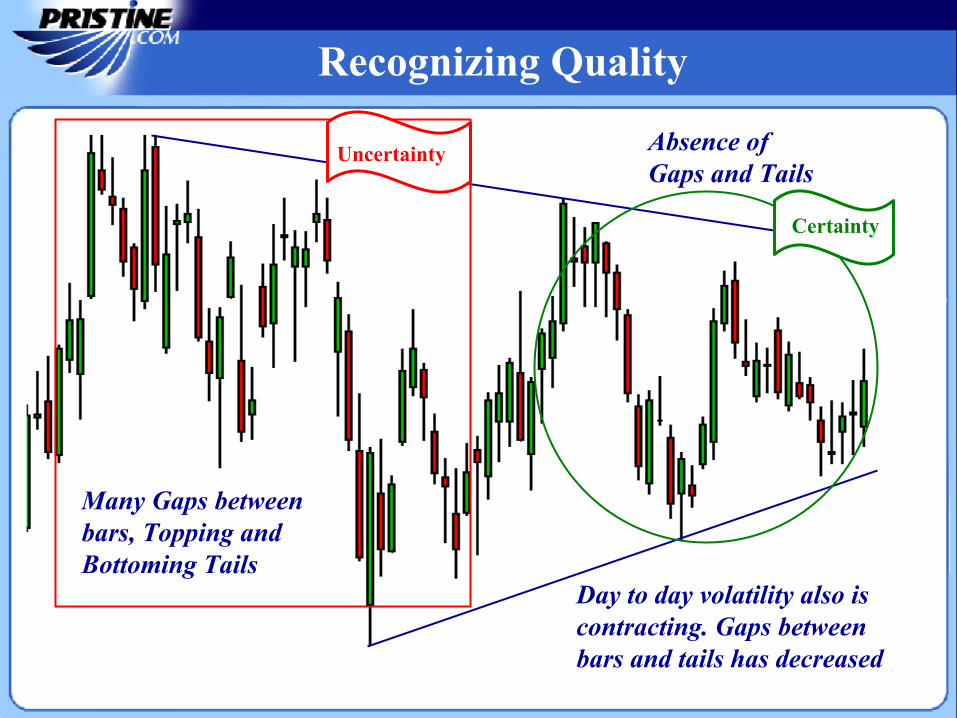
Day to day volatility also is contracting. Gaps between bars and tails has decreased
Many Gaps between bars, Topping and Bottoming Tails
Absence of Gaps and Tails
Uncertainty
Certainty
Recognizing Quality
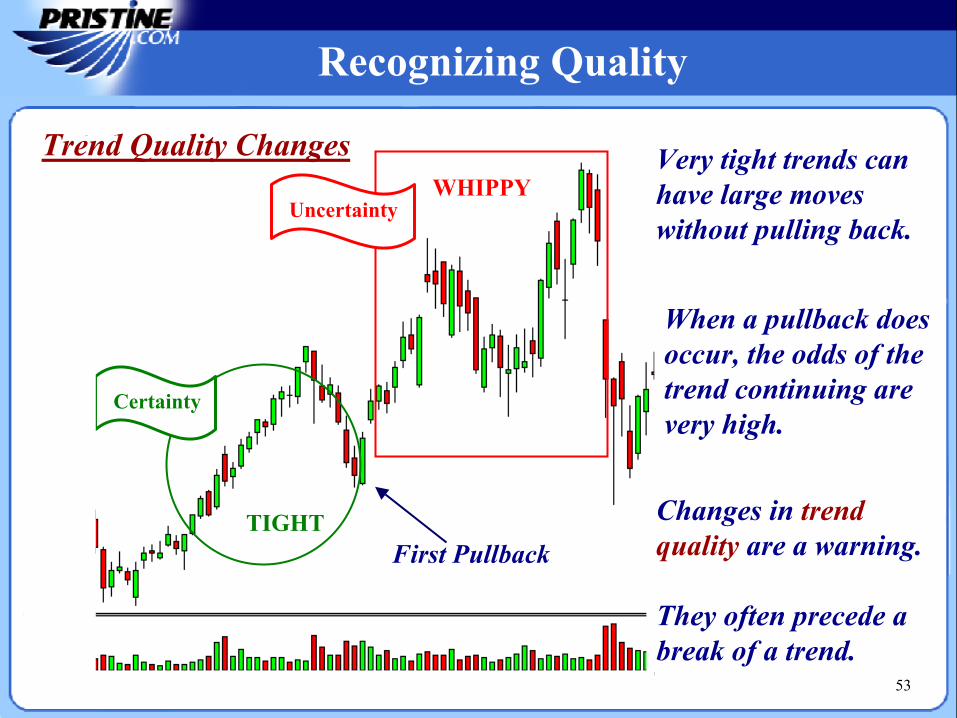
TIGHT
WHIPPY
Changes in trend quality are a warning.
They often precede a break of a trend.
Very tight trends canhave large moves without pulling back.
Certainty
Uncertainty
When a pullback doesoccur, the odds of the trend continuing are very high.
53
First Pullback
Trend Quality Changes
Recognizing Quality
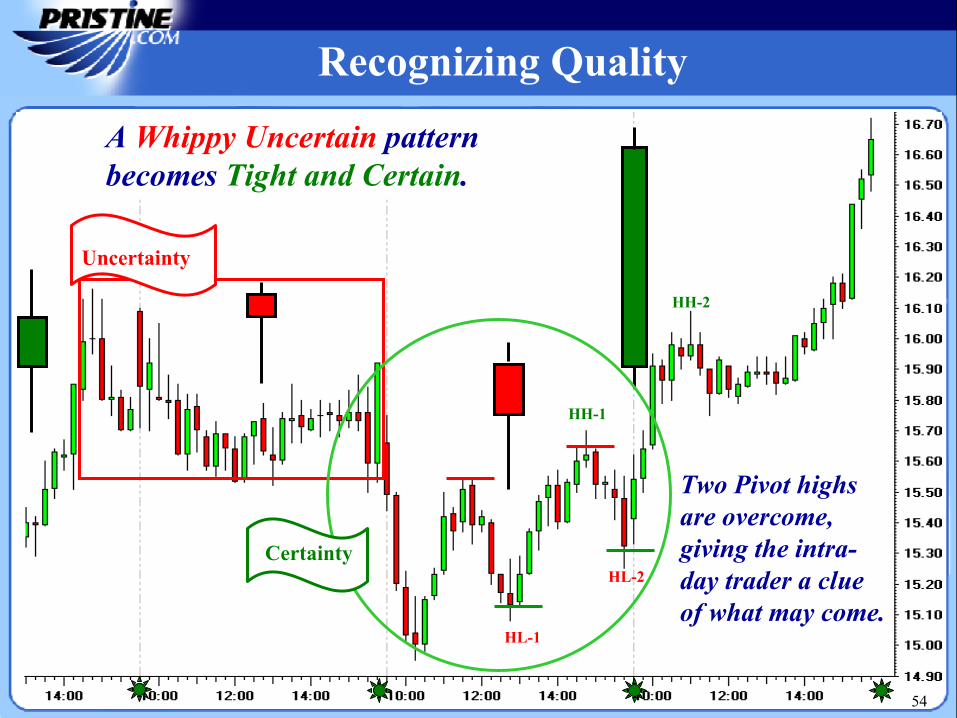
HH-1
HL-1
HL-2
HH-2
Two Pivot highs are overcome, giving the intra-day trader a clue of what may come.
54
A Whippy Uncertain pattern becomes Tight and Certain.
Uncertainty
Certainty
Recognizing Quality
55
What are the relationship of the candles’ opens and closes in the pattern?
Are the bars in the pattern overlapping each other?
What are the size of the bars that preceded the reversal?
What is the size and type of bar that signaled the turn?
Are the arrangement of high and low pivots "V" or is there congestion?
Are there an excessive amount of gaps?
Are the an excessive amount of bottom and top tails?
Are retracements against the prior move deep or shallow?
Recognizing Quality
Buy and Sell Buy and Sell SetupsSetups
56
S & R Trading Guidelines
57
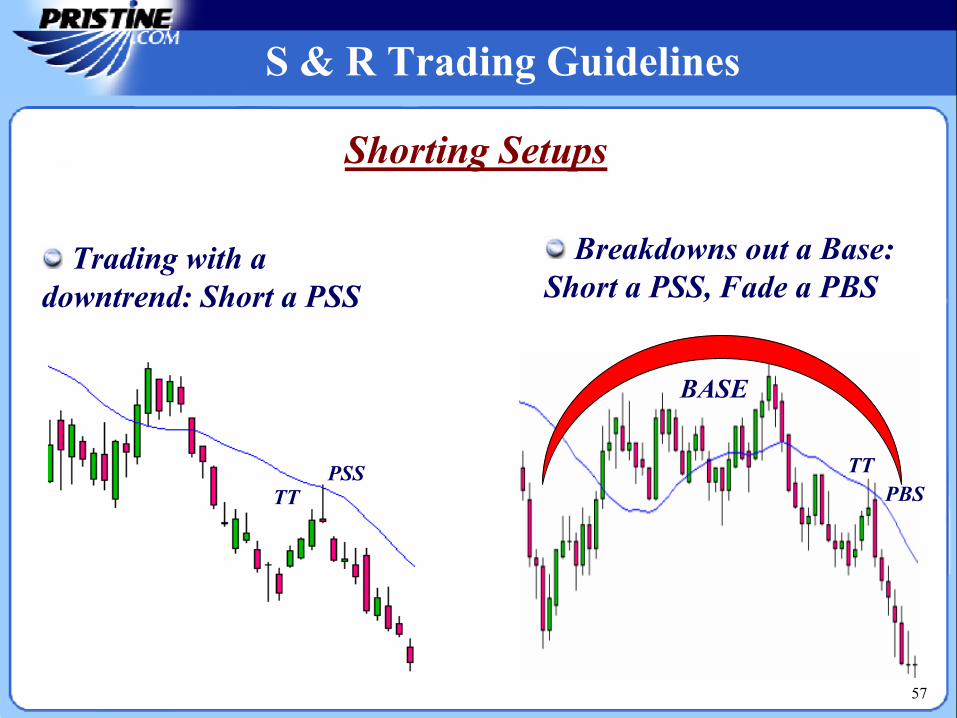
Breakdowns out a Base: Short a PSS, Fade a PBS
Trading with a downtrend: Short a PSS
Shorting Setups
PBS
BASE
TTTTPSS
S & R Trading Guidelines
58
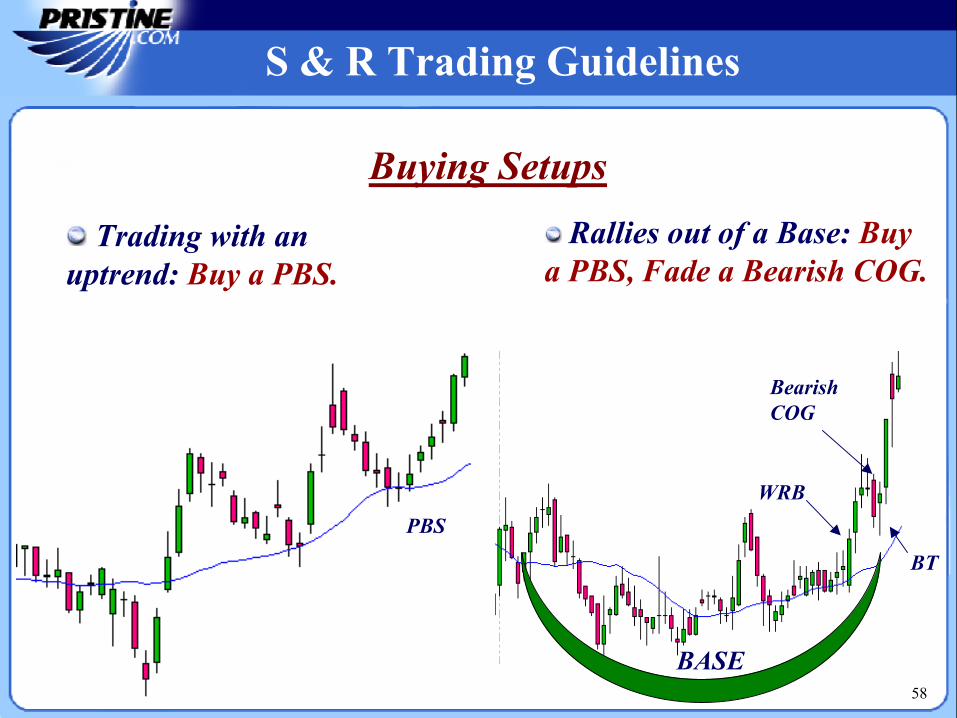
Trading with an uptrend: Buy a PBS.
Bearish COG
BASE
WRB
BT
Rallies out of a Base: Buy a PBS, Fade a Bearish COG.
Buying Setups
PBS
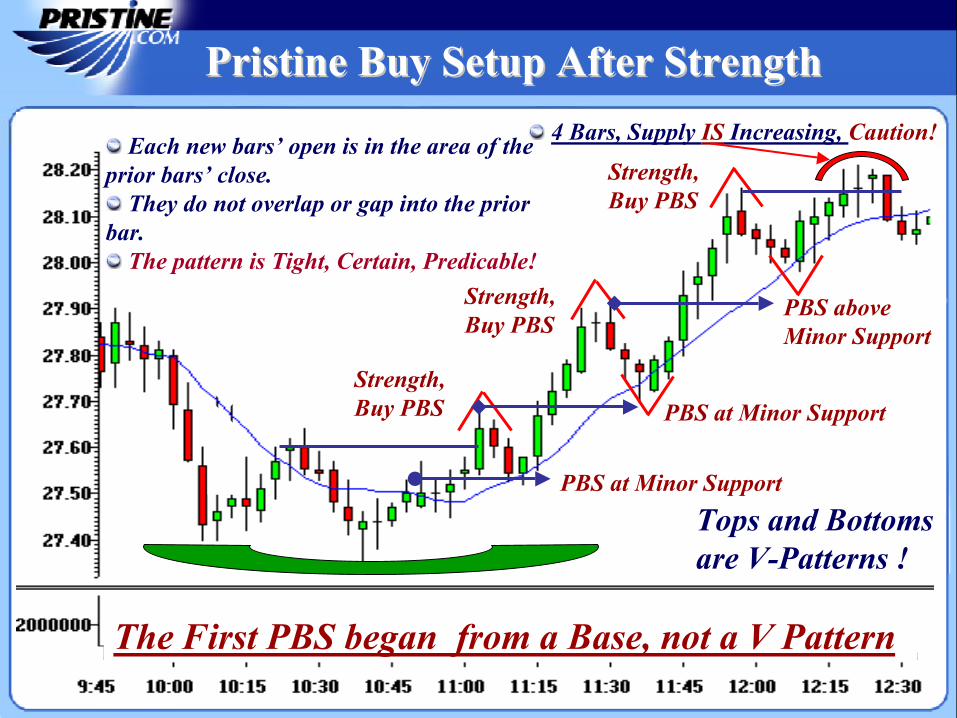
Strength,Buy PBS
PBS at Minor Support
The First PBS began from a Base, not a V Pattern
PBS above Minor Support
PBS at Minor Support
Strength,Buy PBS
Strength,Buy PBS
Each new bars’ open is in the area of the prior bars’ close.
They do not overlap or gap into the prior bar.
The pattern is Tight, Certain, Predicable!
Tops and Bottoms are V-Patterns !
4 Bars, Supply IS Increasing, Caution!
Pristine Buy Setup After StrengthPristine Buy Setup After Strength
Market TimingMarket Timing
60
61
Value of Market Internals
Market Internals are used to keep your opinion about the market’s direction in alignment with the market, not what you “want to happen.”
Need to constantly interpret prior support and resistance levels, as well as the trend of internals.
Best used in combination with other internals for confirmation.
We can anticipate probable market turns when internals reach extreme levels, or use them for confirmation of a bullish or bearish bias.
Odds of pattern failure decreases by having internals in agreement with your trading signals.
Conflicting signals give valuable clues to stand aside.
Market Timing ToolsMarket Timing Tools
Pristine Capital Holdings, Inc.
Market Timing ToolsMarket Timing Tools
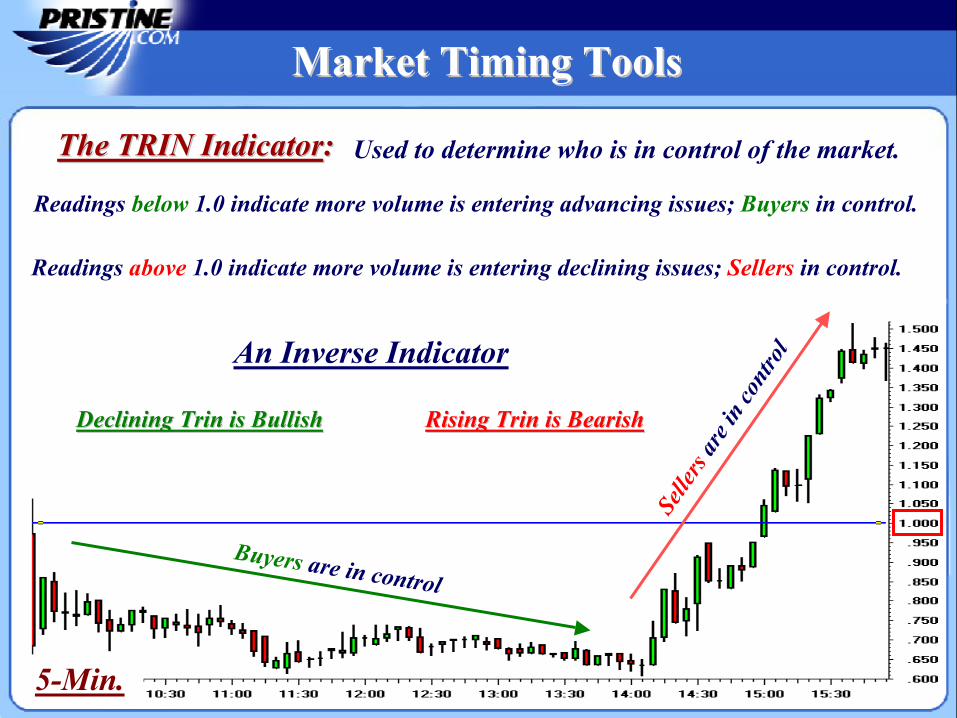
The TRIN IndicatorThe TRIN Indicator::
Selle
rsar
e in
cont
rol
Buyers are in control
Readings below 1.0 indicate more volume is entering advancing issues; Buyers in control.
Readings above 1.0 indicate more volume is entering declining issues; Sellers in control.
An Inverse Indicator
Used to determine who is in control of the market.
Declining Trin is BullishDeclining Trin is Bullish Rising Trin is BearishRising Trin is Bearish
5-Min.
Pristine Capital Holdings, Inc.
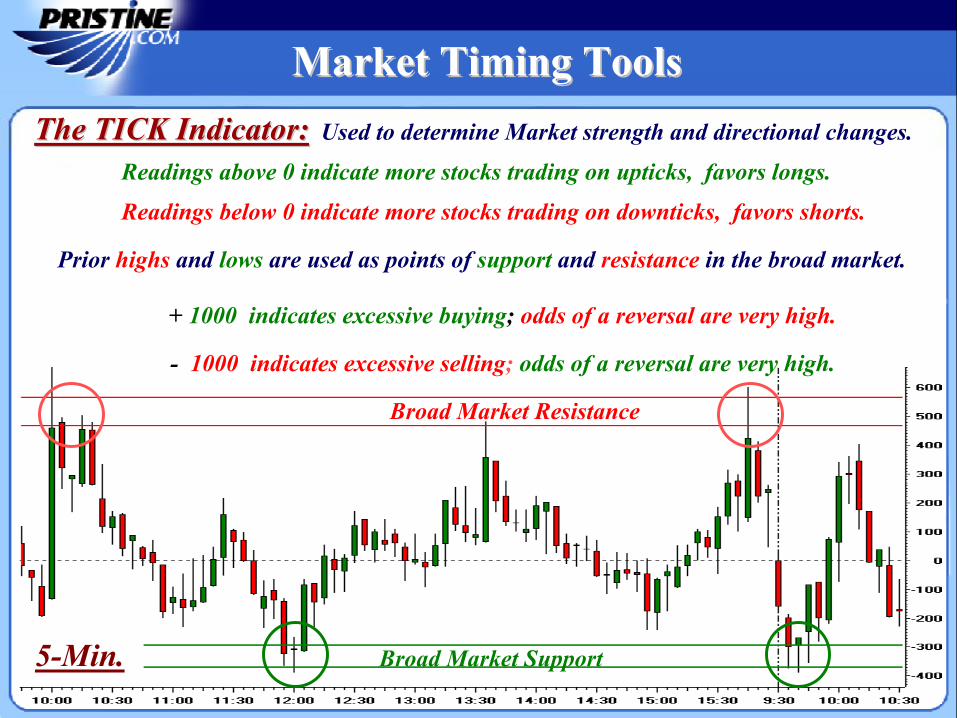
Market Timing ToolsMarket Timing ToolsThe TICK Indicator:The TICK Indicator: Used to determine Market strength and directional changes.
Prior highs and lows are used as points of support and resistance in the broad market.
Broad Market Resistance
Broad Market Support
Readings above 0 indicate more stocks trading on upticks, favors longs.
Readings below 0 indicate more stocks trading on downticks, favors shorts.
+ 1000 indicates excessive buying; odds of a reversal are very high.
- 1000 indicates excessive selling; odds of a reversal are very high.
5-Min.
64
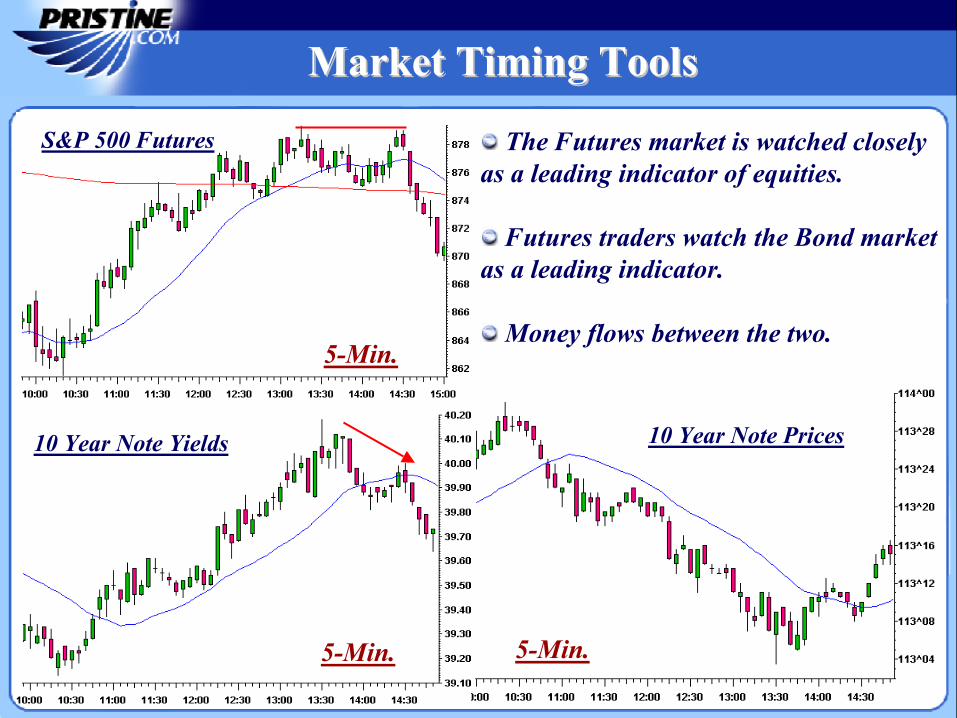
S&P 500 Futures
10 Year Note Yields
The Futures market is watched closely as a leading indicator of equities.
Futures traders watch the Bond market as a leading indicator.
Money flows between the two.
5-Min.
5-Min.
10 Year Note Prices
5-Min.
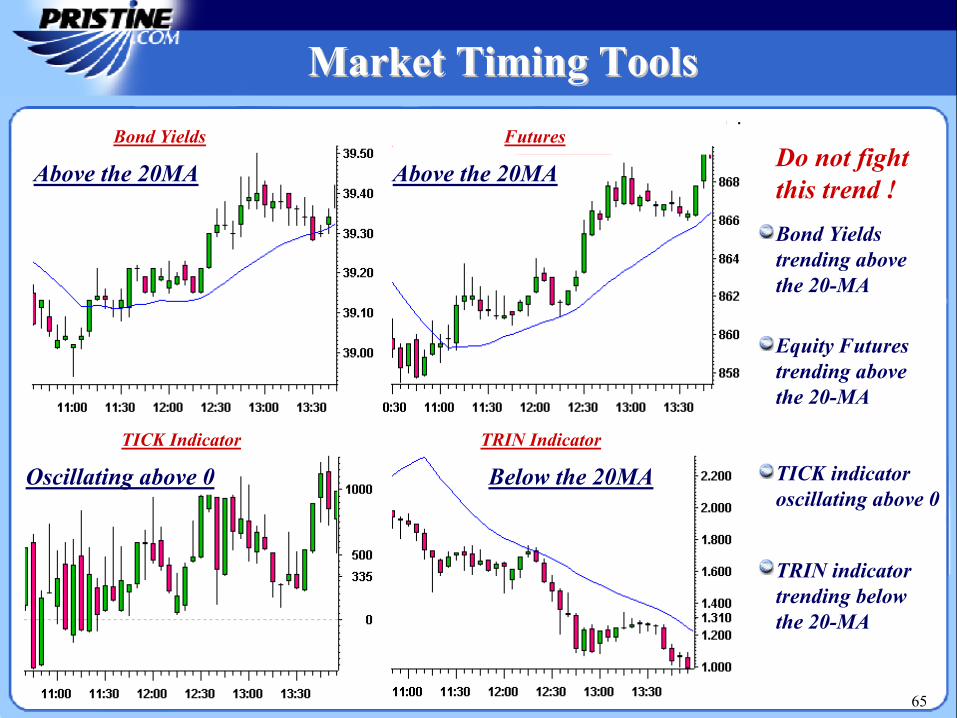
Market Timing ToolsMarket Timing Tools
65
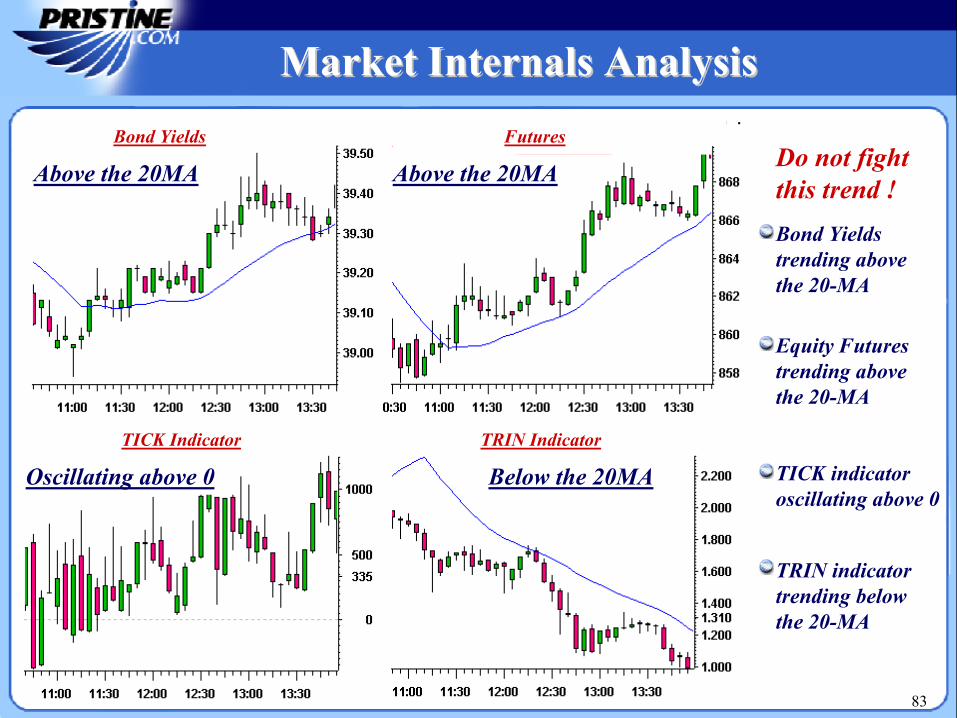
Oscillating above 0
Above the 20MA Above the 20MA
Below the 20MA
Bond Yields trending above the 20-MA
Equity Futures trending above the 20-MA
TICK indicator oscillating above 0
TRIN indicator trending below the 20-MA
Do not fight this trend !
Bond Yields Futures
TICK Indicator TRIN Indicator
Market Timing ToolsMarket Timing Tools

ReviewReview
Putting it All TogetherPutting it All Together
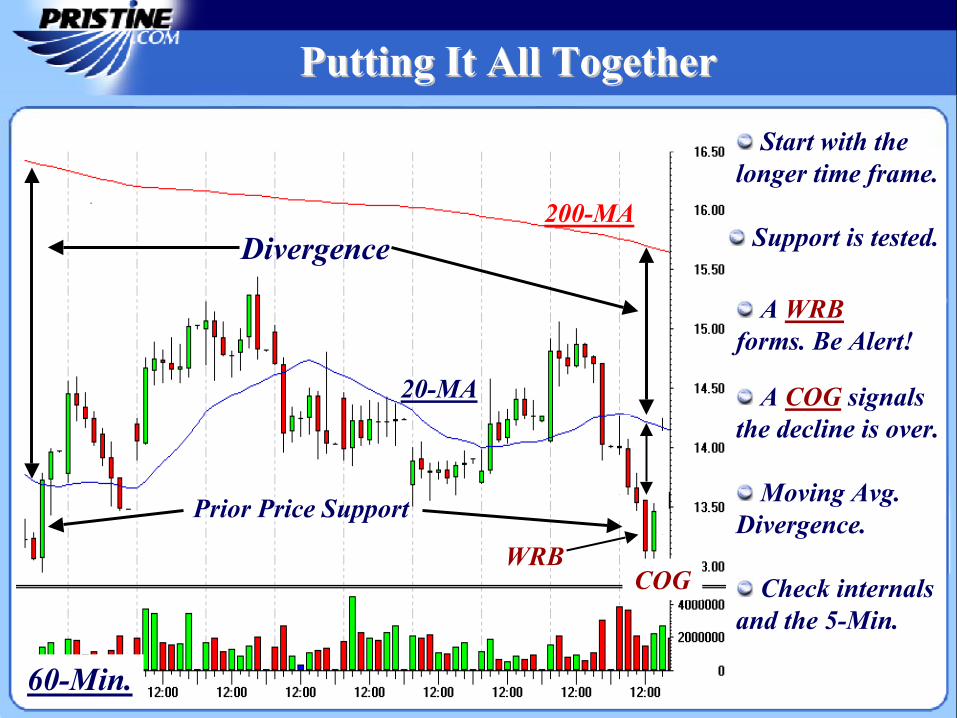
Putting It All TogetherPutting It All Together
COG
60-Min.
WRB
Divergence200-MA
20-MA
Moving Avg. Divergence.Prior Price Support
Support is tested.
A WRBforms. Be Alert!
A COG signals the decline is over.
Start with the longer time frame.
Check internals and the 5-Min.
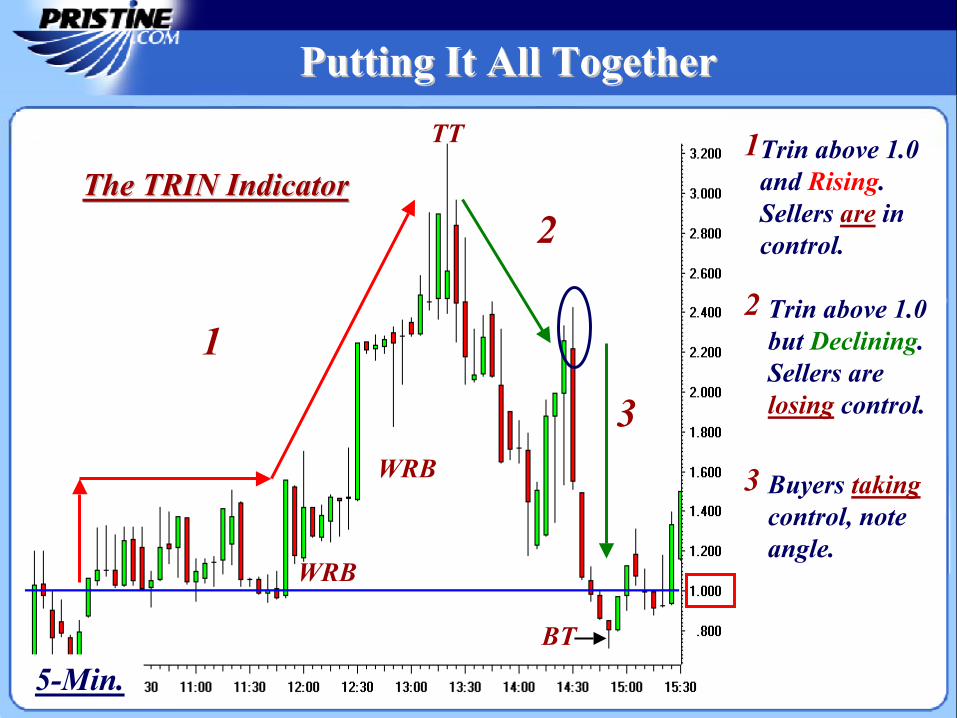
Putting It All TogetherPutting It All TogetherTT
5-Min.
The TRIN IndicatorThe TRIN Indicator
WRB
WRB
BT
1
Trin above 1.0 and Rising. Sellers are in control.
1
2
Trin above 1.0 but Declining. Sellers are losing control.
2
3
Buyers takingcontrol, note angle.
3
Putting It All TogetherPutting It All Together
Support
Resistance
COG
BT
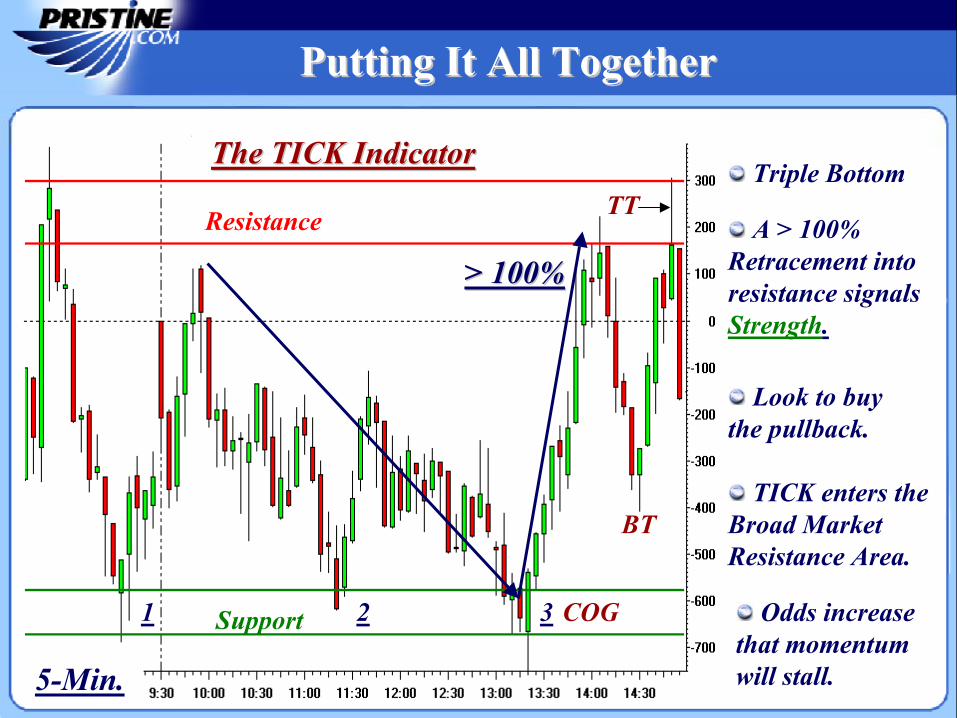
> 100%> 100%A > 100%
Retracement into resistance signals Strength.
TICK enters the Broad Market Resistance Area.
5-Min.
The TICK IndicatorThe TICK IndicatorTriple Bottom
1 32
Look to buy the pullback.
Odds increase that momentum will stall.
TT
Putting It All TogetherPutting It All Together
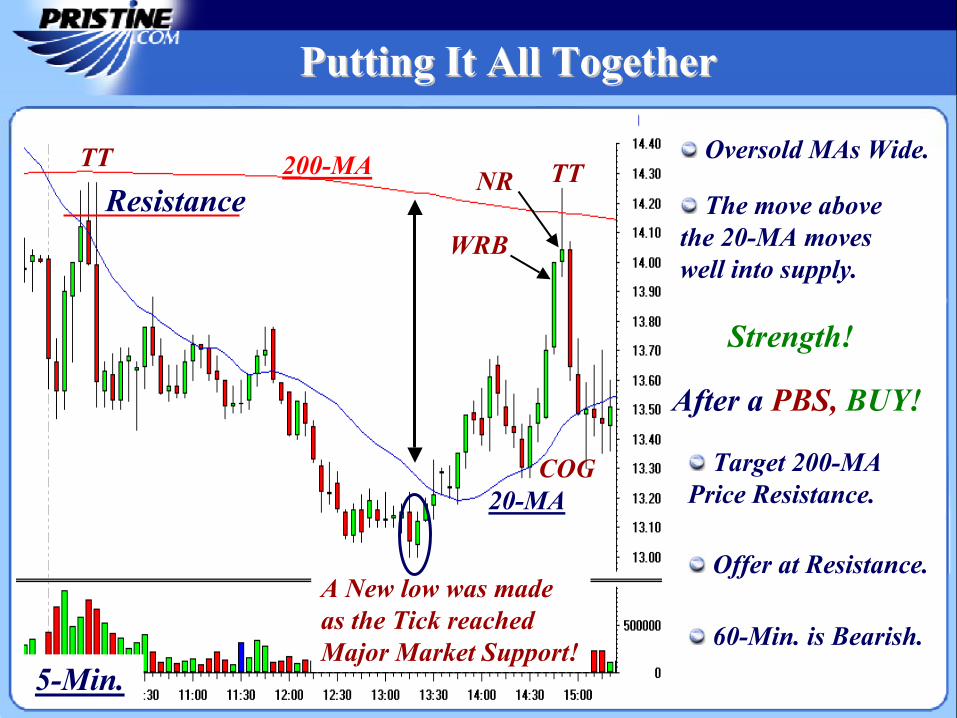
TT
COG
Oversold MAs Wide.
The move above the 20-MA moves well into supply.
After a PBS, BUY!
Target 200-MA Price Resistance.
Offer at Resistance.
TT
60-Min. is Bearish.
WRB
NR
A New low was made as the Tick reached Major Market Support!
5-Min.
200-MA
20-MA
Strength!
Resistance
Pristine Capital Holdings, Inc.
Putting It All TogetherPutting It All Together
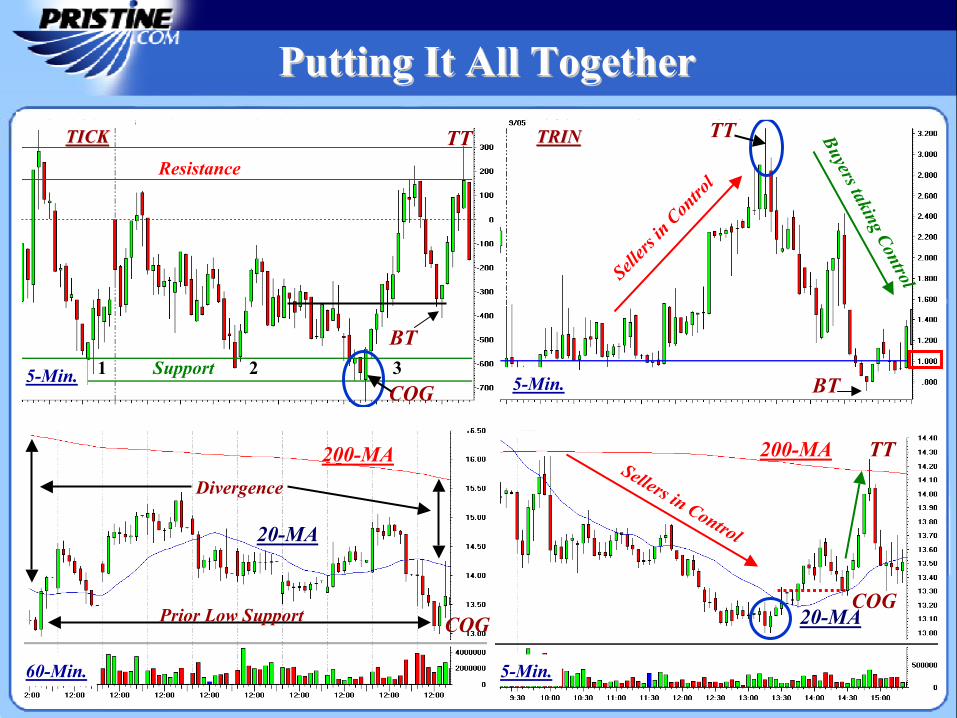
200-MA 200-MA
20-MA
20-MA
Support
Resistance
Sellers
in Con
trol
Sellers in Control
BT
TICKTICK TRINTRIN
5-Min.60-Min.
Prior Low Support
Buyers taking Control
TT
COG
COG
5-Min. 5-Min.
TT
COG
1 32
TT
BT
Divergence

Setups From UniverseSetups From Universe
1. Pristine Buy Setup
2. Pristine Sell Setup
3. Volume spikes
4. Breakouts
5. WRBs at S - D
6. Tails
7. Failed patterns
8. CBS, CSS
9. Engulfing Bars
Then Cherry Pick From List:
Trend on multiple time frames
Tight vs. Whippy
Support/resistance
Sector strength
Relative Strength
MAs
Best reward-risk
No pending news
Setups (Provided MeetsYour Trading Plan!)
72

Updating Market InternalsUpdating Market InternalsAt the end of each market day, we mark off significant support and resistance points on the market internals and broader markets, extending the lines into the following day for reference points (NOTE: and continuously update them intra-day). See how well the morning’s range on the second day held the prior day’s highs and lows? Then the TICK exploded through resistance after the doldrums with the futures.
Support
Resistance
73
Trading Day Preparation Trading Day Preparation and and
AdjustingAdjusting Market Bias In Market Bias In The Morning Reversal The Morning Reversal
PeriodsPeriods74
Trading Day PreparationTrading Day Preparation
Trading Preparation Begins After The Prior Day’s Market Close
Monitor post-market news and stock movers to see how they affect existing or new trade opportunities.
Analyze (on multiple time frames) trend, support and resistance of:
1. Broader markets
2. Sectors
3. Market internals
Review day’s trades/charts and complete Trading Diary.
Review all watch list items for possible inclusion in next day’s watch list.
Go exercise and take a break to start back fresh! 75
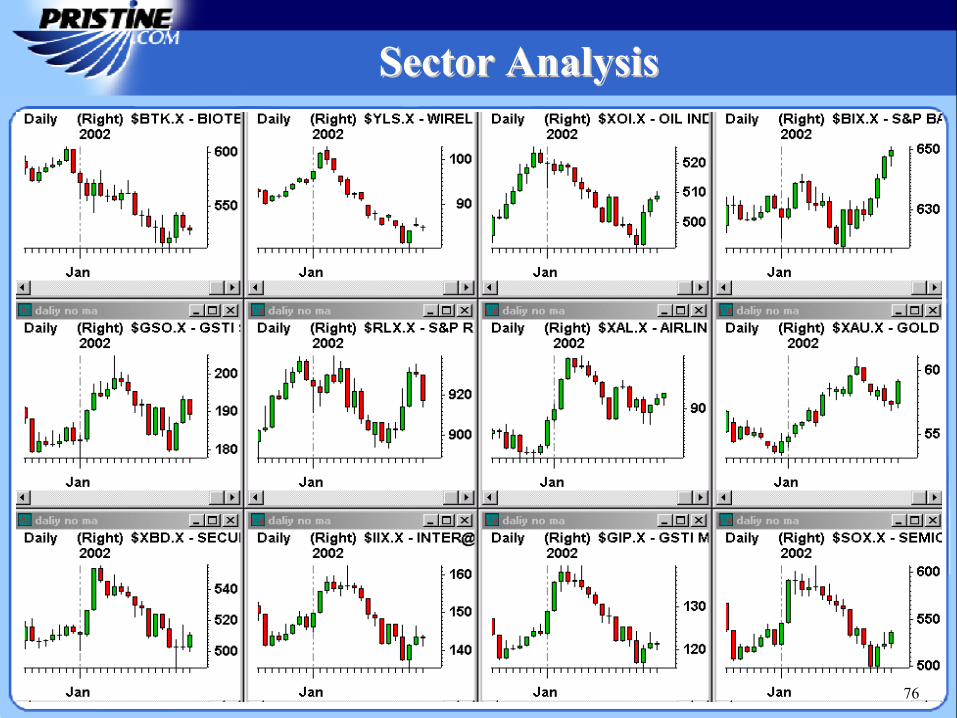
Sector AnalysisSector Analysis
76
Trading Day PreparationTrading Day Preparation
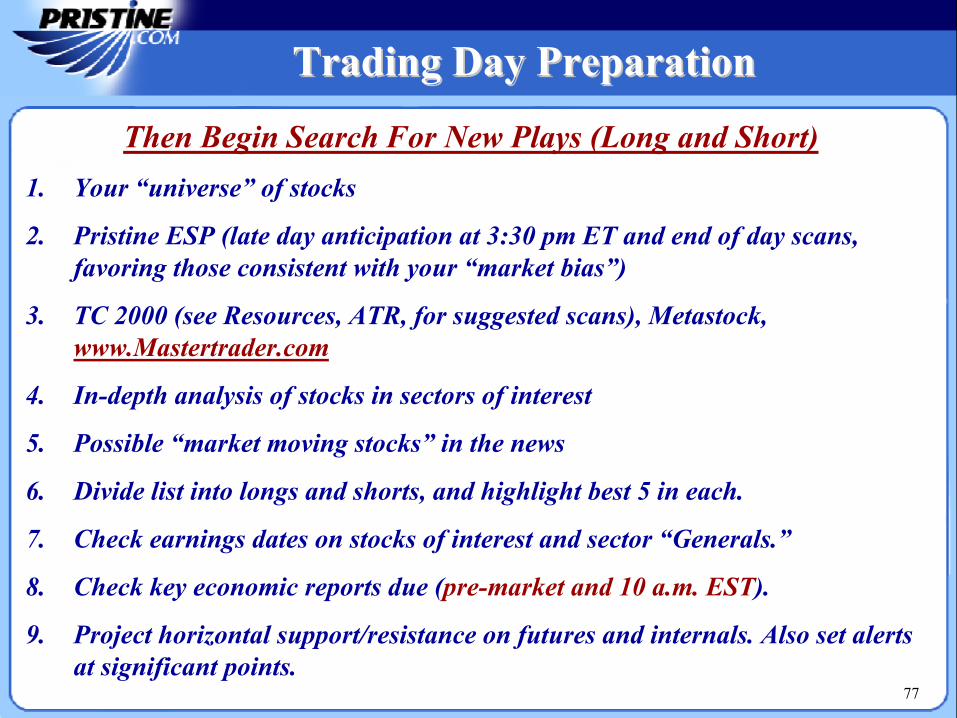
Then Begin Search For New Plays (Long and Short) 1. Your “universe” of stocks
2. Pristine ESP (late day anticipation at 3:30 pm ET and end of day scans, favoring those consistent with your “market bias”)
3. TC 2000 (see Resources, ATR, for suggested scans), Metastock, www.Mastertrader.com
4. In-depth analysis of stocks in sectors of interest
5. Possible “market moving stocks” in the news
6. Divide list into longs and shorts, and highlight best 5 in each.
7. Check earnings dates on stocks of interest and sector “Generals.”
8. Check key economic reports due (pre-market and 10 a.m. EST).
9. Project horizontal support/resistance on futures and internals. Also set alerts at significant points.
77
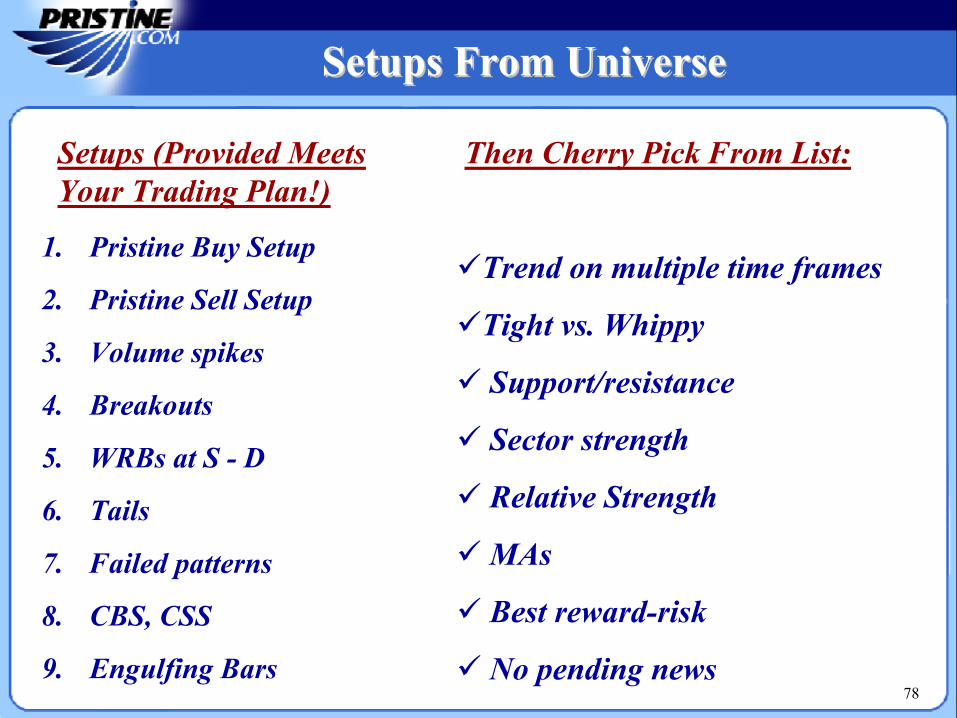
Setups From UniverseSetups From Universe
1. Pristine Buy Setup
2. Pristine Sell Setup
3. Volume spikes
4. Breakouts
5. WRBs at S - D
6. Tails
7. Failed patterns
8. CBS, CSS
9. Engulfing Bars
Then Cherry Pick From List:
Trend on multiple time frames
Tight vs. Whippy
Support/resistance
Sector strength
Relative Strength
MAs
Best reward-risk
No pending news
Setups (Provided MeetsYour Trading Plan!)
78
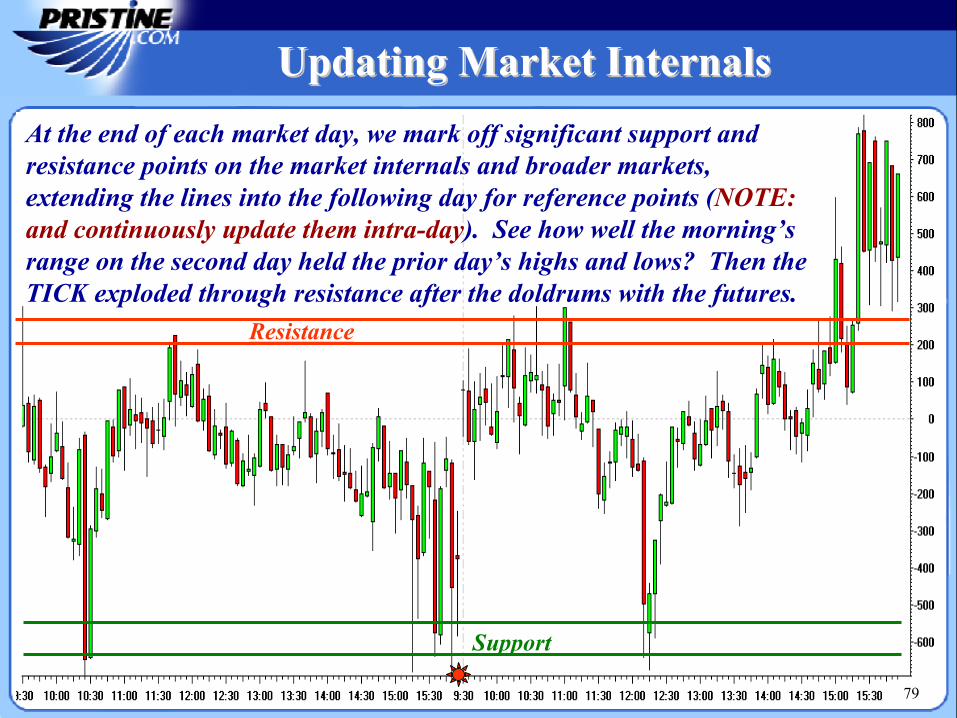
Updating Market InternalsUpdating Market InternalsAt the end of each market day, we mark off significant support and resistance points on the market internals and broader markets, extending the lines into the following day for reference points (NOTE: and continuously update them intra-day). See how well the morning’s range on the second day held the prior day’s highs and lows? Then the TICK exploded through resistance after the doldrums with the futures.
Support
Resistance
79
PrePre--Market ResearchMarket Research
1. Research pre-market news and movers (Briefing.com, Isld.com, Bloomberg.com, Nasdaq.com’s Heat Map).
2. Determine where futures are gapping to (support or resistance).
3. Mark overnight globex futures highs/lows, E-Mini’s.
4. Watch trend of any large gap in futures pre-market.
5. Sort minder by Percentage and Price Gap.
6. Check gaps on open trades and trades of interest.
7. Develop trading “bias” for open and first 30 minutes.
8. Narrow watch list of longs and shorts and decide how to trade the top picks (e.g., COG on 2-min chart gap fill; 5-min high), if at all.
9. Put stocks of interest in Minder and set alarms. Use Computer.
10. Watch pre-market trades on 20/20 bar trades. May suggest early entry.80
Trading Day Preparation Trading Day Preparation
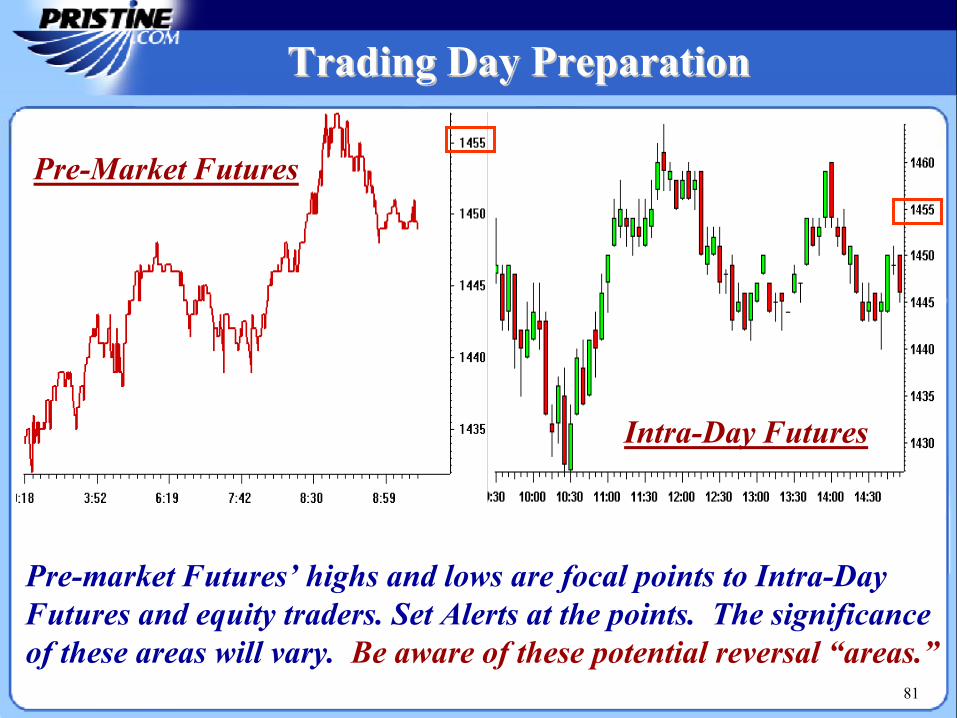
Pre-Market Futures
Intra-Day Futures
Pre-market Futures’ highs and lows are focal points to Intra-Day Futures and equity traders. Set Alerts at the points. The significance of these areas will vary. Be aware of these potential reversal “areas.”
81
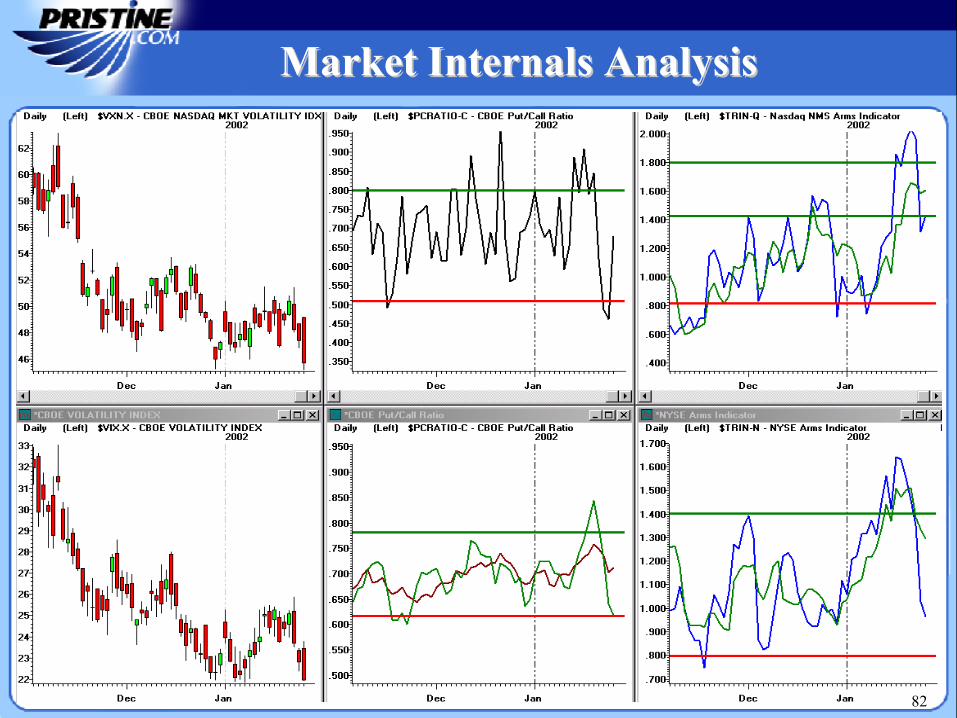
Market Internals AnalysisMarket Internals Analysis
82
Market Internals AnalysisMarket Internals Analysis
83
Oscillating above 0
Above the 20MA Above the 20MA
Below the 20MA
Bond Yields trending above the 20-MA
Equity Futures trending above the 20-MA
TICK indicator oscillating above 0
TRIN indicator trending below the 20-MA
Do not fight this trend !
Bond Yields Futures
TICK Indicator TRIN Indicator
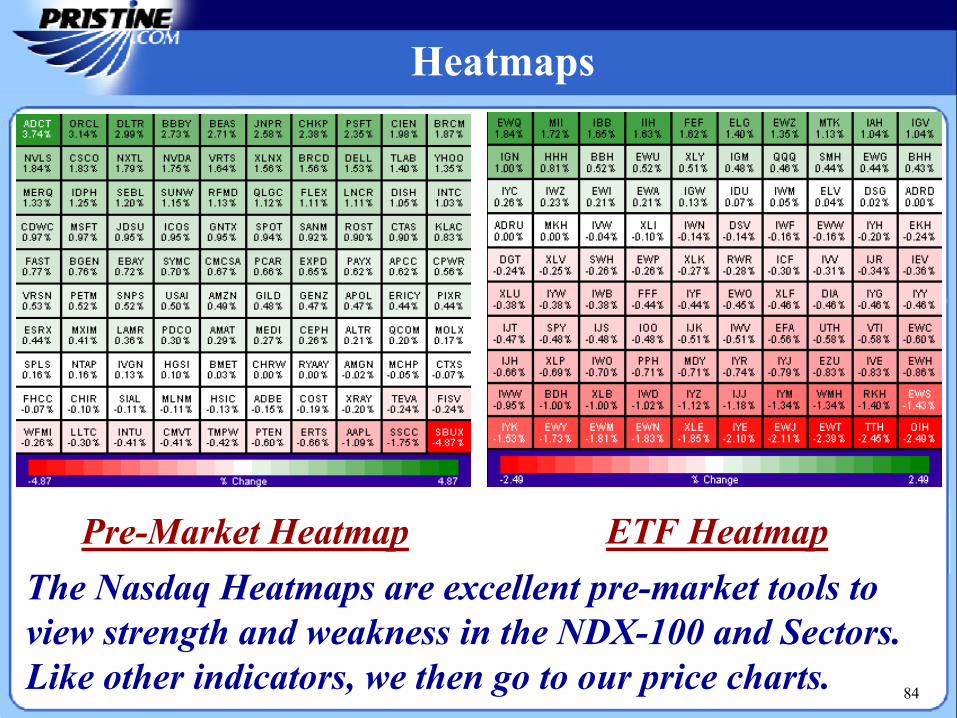
Heatmaps
Pre-Market Heatmap ETF HeatmapThe Nasdaq Heatmaps are excellent pre-market tools to view strength and weakness in the NDX-100 and Sectors.Like other indicators, we then go to our price charts. 84
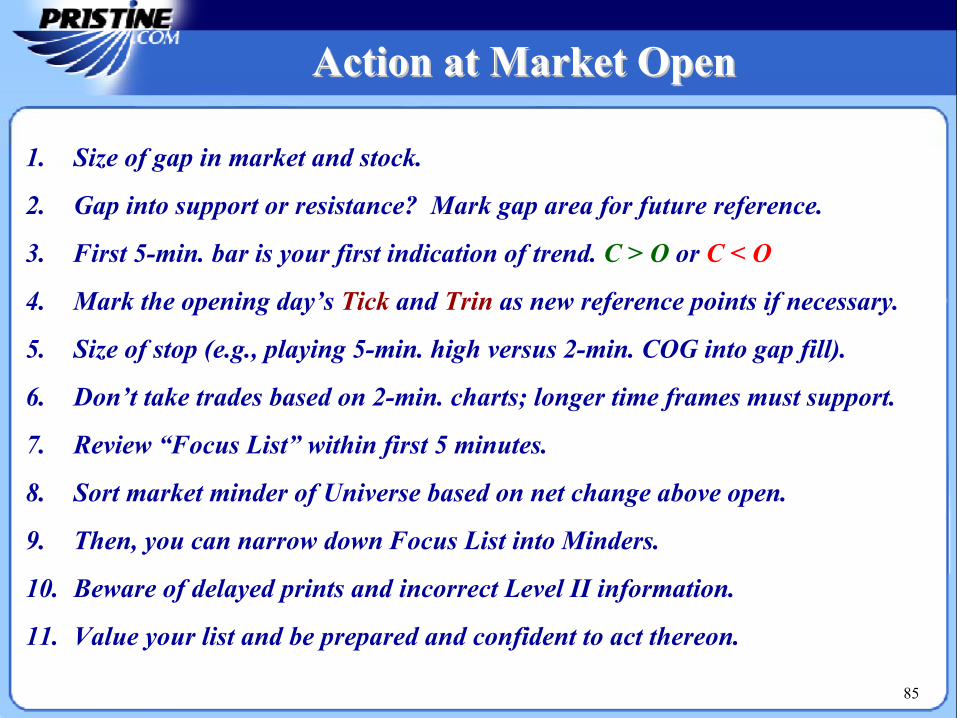
Action at Market OpenAction at Market Open
1. Size of gap in market and stock.
2. Gap into support or resistance? Mark gap area for future reference.
3. First 5-min. bar is your first indication of trend. C > O or C < O
4. Mark the opening day’s Tick and Trin as new reference points if necessary.
5. Size of stop (e.g., playing 5-min. high versus 2-min. COG into gap fill).
6. Don’t take trades based on 2-min. charts; longer time frames must support.
7. Review “Focus List” within first 5 minutes.
8. Sort market minder of Universe based on net change above open.
9. Then, you can narrow down Focus List into Minders.
10. Beware of delayed prints and incorrect Level II information.
11. Value your list and be prepared and confident to act thereon.
85
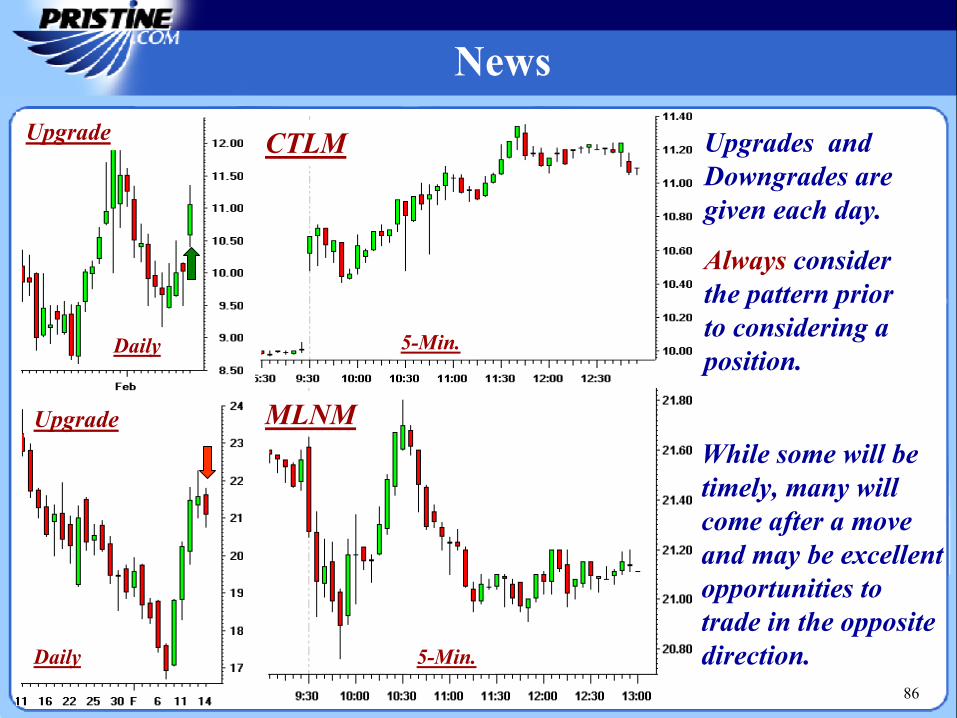
News
Upgrades and Downgrades are given each day.
Always consider the pattern prior to considering a position.
CTLM
MLNM
Upgrade
UpgradeWhile some will be timely, many will come after a move and may be excellent opportunities to trade in the opposite direction.
Daily
Daily
5-Min.
5-Min.86
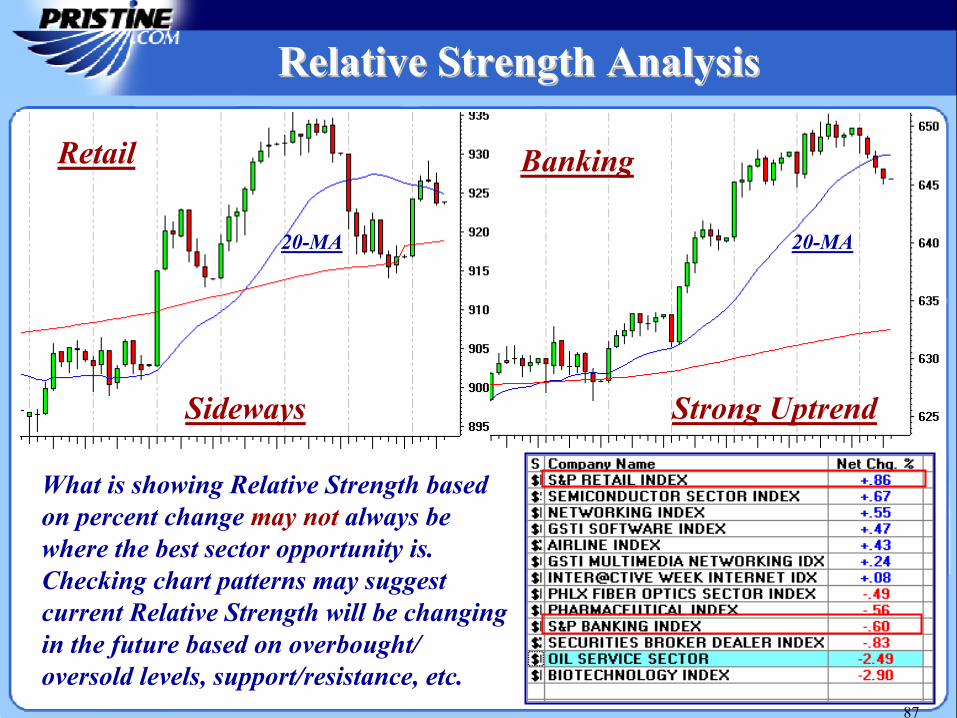
Relative Strength AnalysisRelative Strength Analysis
Retail Banking
What is showing Relative Strength based on percent change may not always be where the best sector opportunity is. Checking chart patterns may suggest current Relative Strength will be changing in the future based on overbought/ oversold levels, support/resistance, etc.
Sideways Strong Uptrend
20-MA20-MA
87
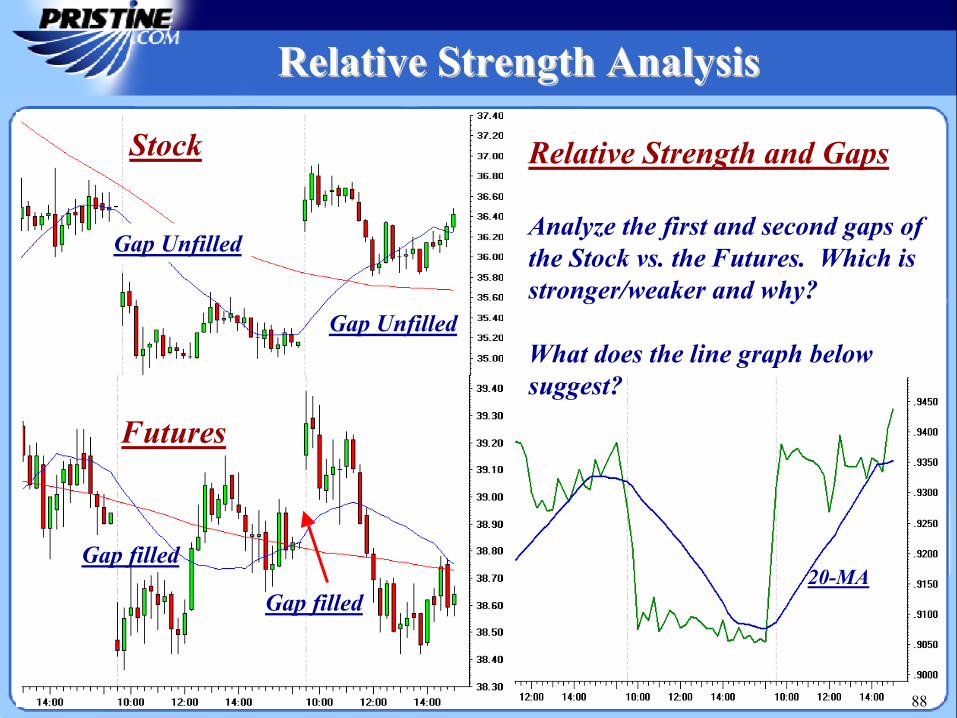
Relative Strength AnalysisRelative Strength Analysis
Relative Strength and Gaps
Analyze the first and second gaps of the Stock vs. the Futures. Which is stronger/weaker and why?
What does the line graph below suggest?
Futures
Stock
20-MA
Gap Unfilled
Gap filled
Gap filled
Gap Unfilled
88
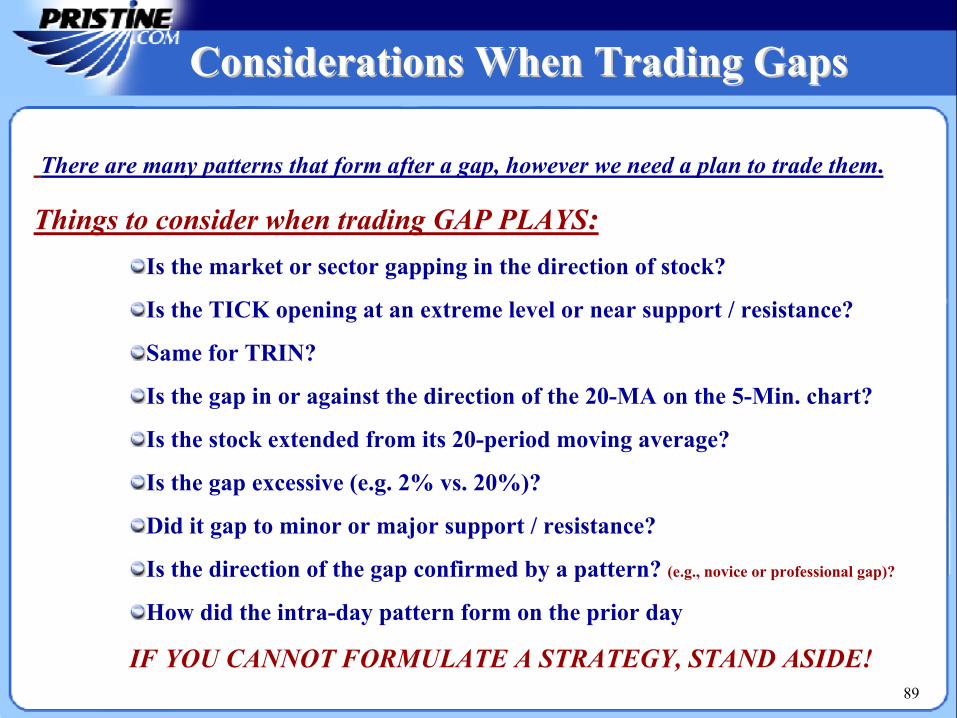
Considerations When Trading GapsConsiderations When Trading Gaps
There are many patterns that form after a gap, however we need a plan to trade them.
Things to consider when trading GAP PLAYS:Is the market or sector gapping in the direction of stock?
Is the TICK opening at an extreme level or near support / resistance?
Same for TRIN?
Is the gap in or against the direction of the 20-MA on the 5-Min. chart?
Is the stock extended from its 20-period moving average?
Is the gap excessive (e.g. 2% vs. 20%)?
Did it gap to minor or major support / resistance?
Is the direction of the gap confirmed by a pattern? (e.g., novice or professional gap)?
How did the intra-day pattern form on the prior day
IF YOU CANNOT FORMULATE A STRATEGY, STAND ASIDE!89
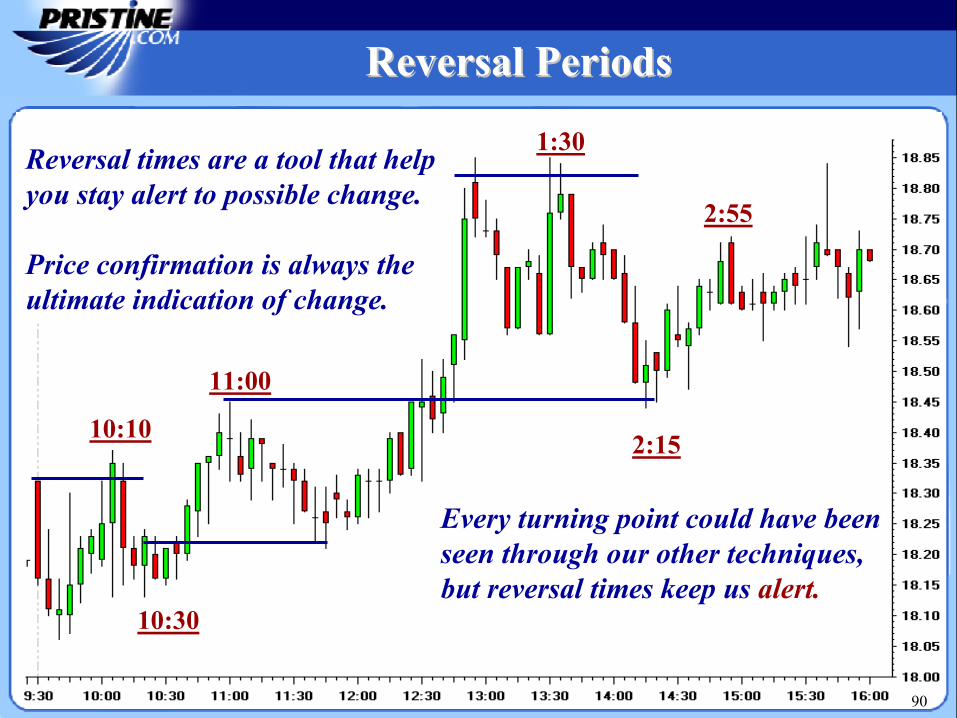
Reversal PeriodsReversal Periods
2:15
1:30
10:10
10:30
11:00
2:55
Reversal times are a tool that help you stay alert to possible change.
Price confirmation is always the ultimate indication of change.
Every turning point could have been seen through our other techniques, but reversal times keep us alert.
90
Weekly Market AnalysisWeekly Market Analysis
1. Review weekly and monthly charts of broader markets.
2. Scan Universe based on weekly, daily and 60-min. charts only.
3. Review market internals, and 5- and 10-day MAs of same.
4. Review sentiment indicators.
5. Determine which sectors/stocks might move per Barron’s articles.
6. Browse other trade journals and web sites of interest.
7. Update Trading Diary and trades of week.
8. Doing your own homework will ensure faster development.
9. Relax and Smell the Roses!
91
Weekend Market Review Weekend Market Review
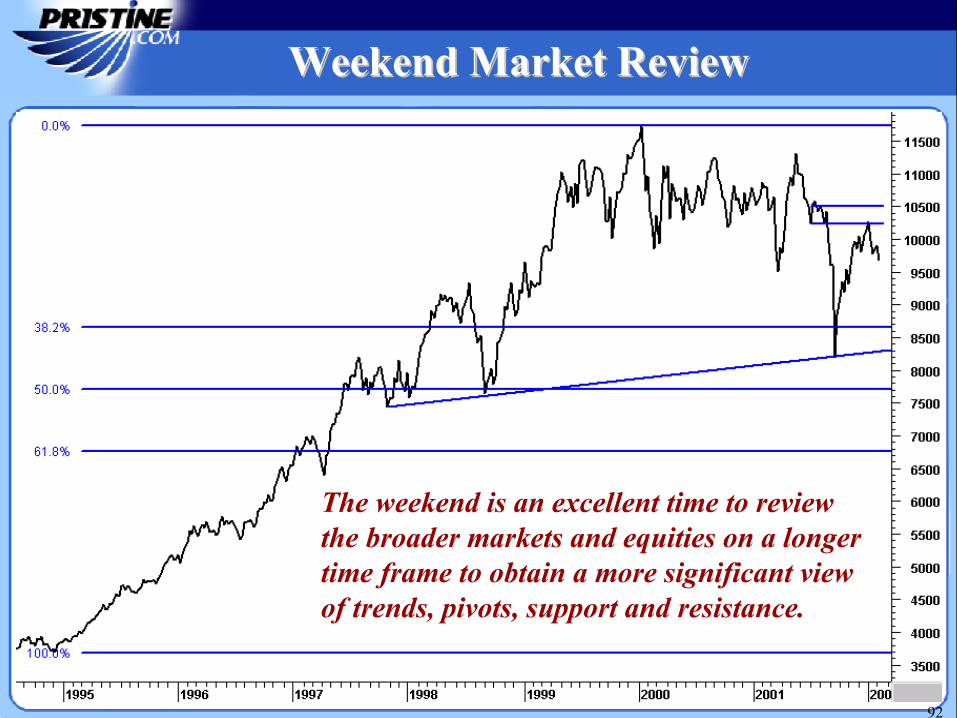
The weekend is an excellent time to review the broader markets and equities on a longer time frame to obtain a more significant view of trends, pivots, support and resistance.
92
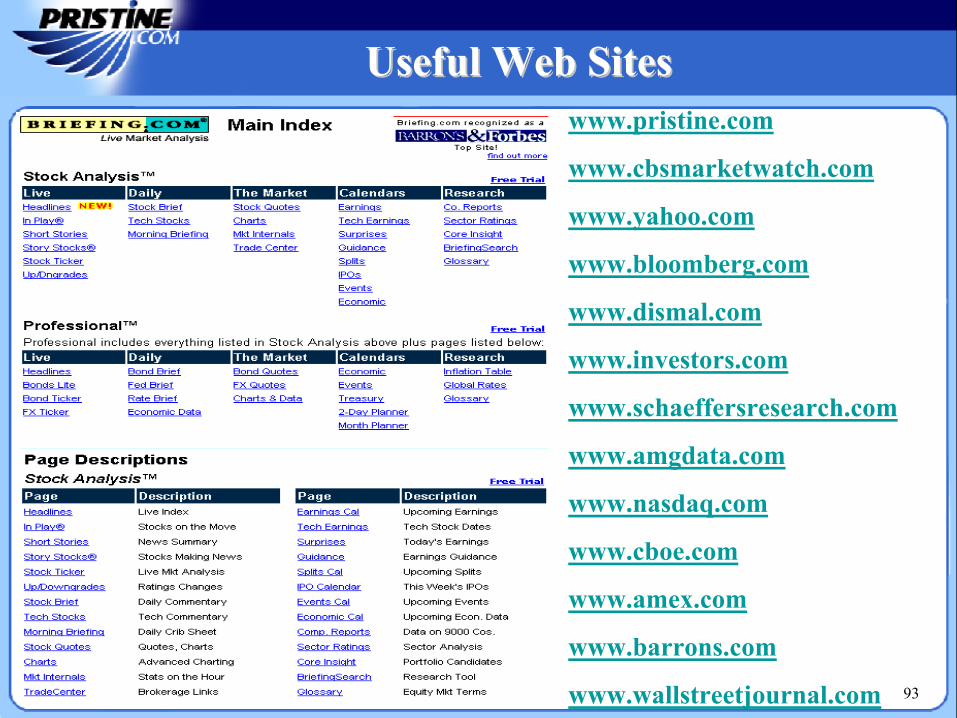
Useful Web Sites Useful Web Sites www.pristine.com
www.cbsmarketwatch.com
www.yahoo.com
www.bloomberg.com
www.dismal.com
www.investors.com
www.schaeffersresearch.com
www.amgdata.com
www.nasdaq.com
www.cboe.com
www.amex.com
www.barrons.com
www.wallstreetjournal.com 93
What Is Pristine ESPTM ?
94
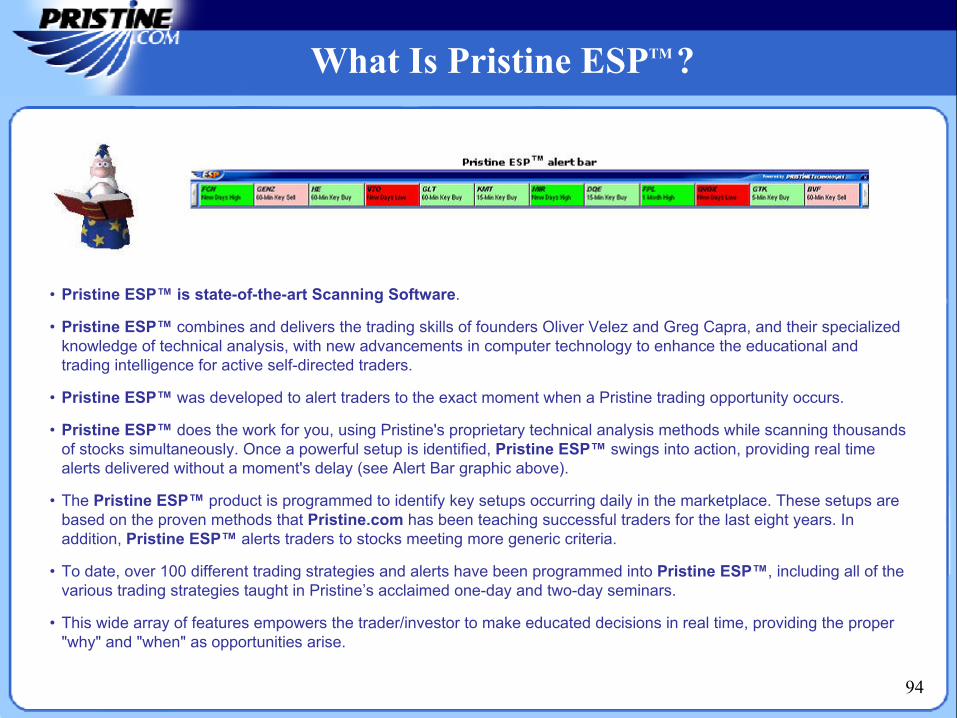
• Pristine ESP™ is state-of-the-art Scanning Software.
• Pristine ESP™ combines and delivers the trading skills of founders Oliver Velez and Greg Capra, and their specialized knowledge of technical analysis, with new advancements in computer technology to enhance the educational and trading intelligence for active self-directed traders.
• Pristine ESP™ was developed to alert traders to the exact moment when a Pristine trading opportunity occurs.
• Pristine ESP™ does the work for you, using Pristine's proprietary technical analysis methods while scanning thousandsof stocks simultaneously. Once a powerful setup is identified, Pristine ESP™ swings into action, providing real time alerts delivered without a moment's delay (see Alert Bar graphic above).
• The Pristine ESP™ product is programmed to identify key setups occurring daily in the marketplace. These setups are based on the proven methods that Pristine.com has been teaching successful traders for the last eight years. In addition, Pristine ESP™ alerts traders to stocks meeting more generic criteria.
• To date, over 100 different trading strategies and alerts have been programmed into Pristine ESP™, including all of the various trading strategies taught in Pristine’s acclaimed one-day and two-day seminars.
• This wide array of features empowers the trader/investor to make educated decisions in real time, providing the proper "why" and "when" as opportunities arise.
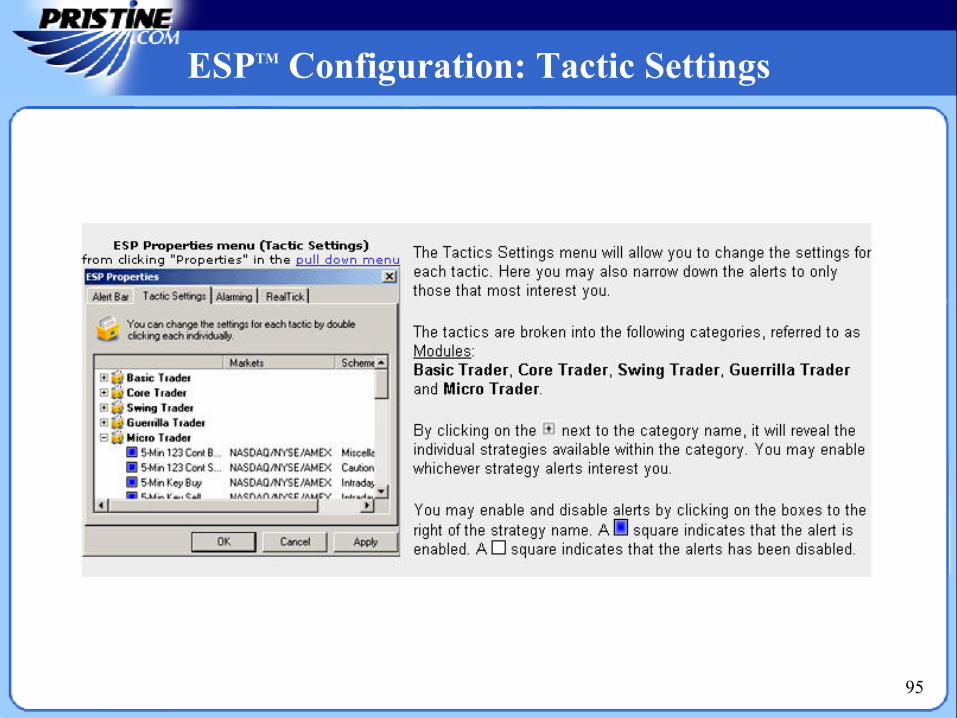
ESPTM Configuration: Tactic Settings
95
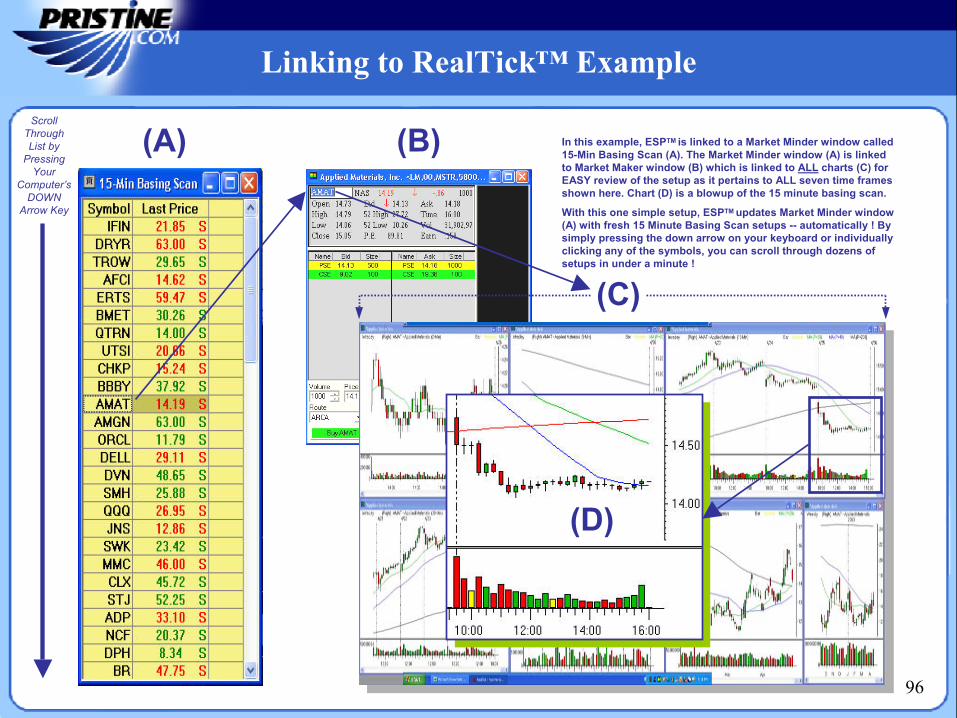
Linking to RealTick™ Example
96
In this example, ESPTM is linked to a Market Minder window called 15-Min Basing Scan (A). The Market Minder window (A) is linked to Market Maker window (B) which is linked to ALL charts (C) for EASY review of the setup as it pertains to ALL seven time framesshown here. Chart (D) is a blowup of the 15 minute basing scan.
With this one simple setup, ESPTM updates Market Minder window (A) with fresh 15 Minute Basing Scan setups -- automatically ! By simply pressing the down arrow on your keyboard or individually clicking any of the symbols, you can scroll through dozens of setups in under a minute !
(A) (B)
(C)
(D)
ScrollThroughList by
PressingYour
Computer’sDOWN
Arrow Key
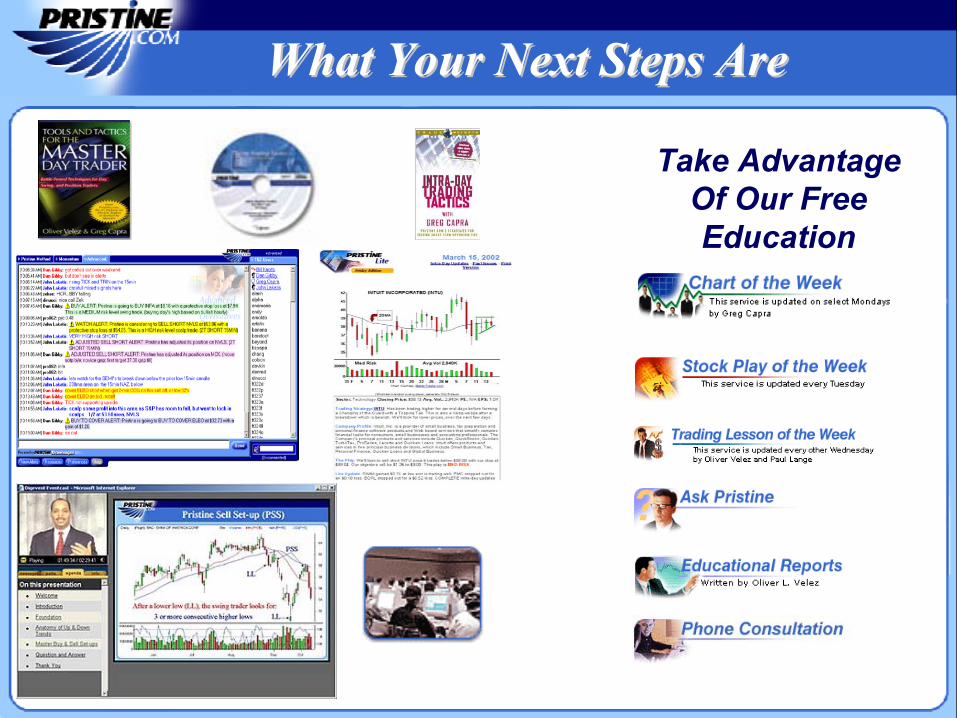
Take Advantage Of Our Free Education
What Your Next Steps AreWhat Your Next Steps Are
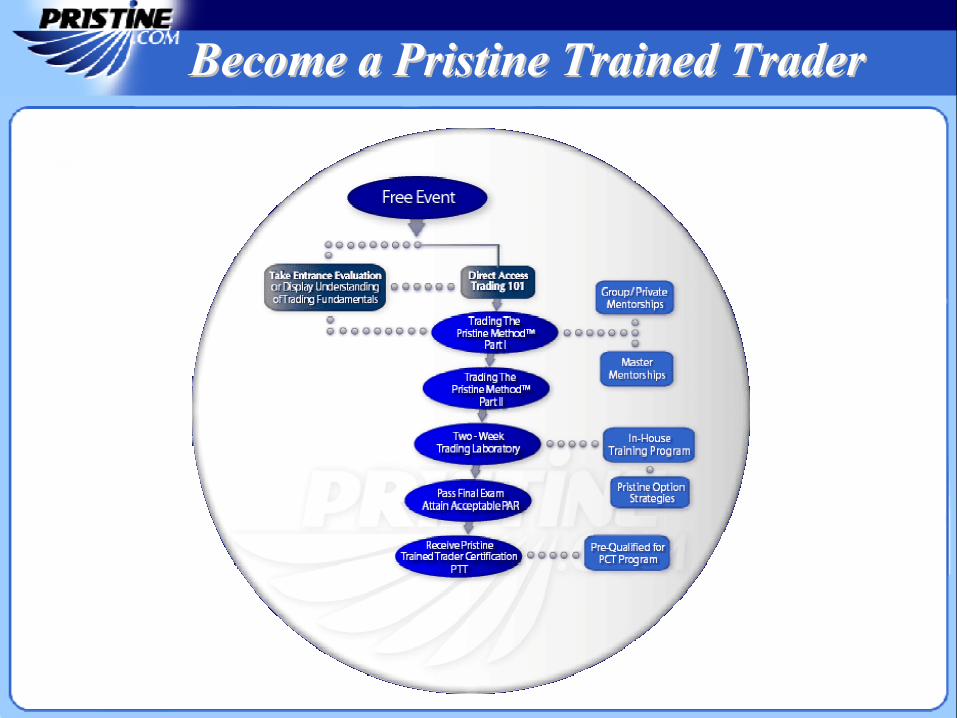
Become a Pristine Trained TraderBecome a Pristine Trained Trader
At this point, you have the information to build on. It’s up to you to work with the material and now make it yours.
There are no secrets or proprietary indicators to making money in the markets. Defining an opportunity, where the odds are in your favor, then having the discipline to follow your trading and money management rules is all that you can do. Your job is to objectively monitor, then change as the market suggests you should.
In closing, we at Pristine wish you great success!99
Thank You For Joining UsThank You For Joining Us
You may download these slides for future reference. They are available in Adobe Acrobat format at the following location.
http://www.pristine.com/ptunotes/denver.htm
To contact a Pristine counselor, please call us at 800-340-6477 and ask for Marvin Balat.
100
DownloadDownload