Embed Size (px)
Citation preview
1
Intracellular half-life of cisplatin in malignant cells A kinetic study of the decline rate of intracellular cisplatin concentration in in-vitro grown cells determined by LC-ICP-MS following exposure to clinically relevant cisplatin doses
Liem Nguyen Van Degree Thesis in Chemistry 30 ECTS
Master’s Level
Report passed:
Supervisor: Erik Björn
Examiner: Solomon Tesfalidet
2
Abstract Cisplatin is a common cancer therapy substance used against several types of malignant tumors and often shows great efficiency. The most important tumour killing mechanism is believed to be formation of Pt-DNA adducts. It is however a common phenomenon that tumors develop resistance causing inefficient treatment.
It is generally believed that Pt-DNA adduct formation follows after intracellular “activation” of the drug substances by hydrolysis reactions due to the lower chloride concentration intra- compared to extra-cellular. The kinetics for these activation processes and other potential metabolic reactions for the Pt-drugs in-vivo are virtually unknown.
The presence of free intracellular cisplatin in in-vitro grown human malignant melanoma cell lines have been shown previously and the aim of this study is to determine the kinetics of decline in intracellular cisplatin concentration in in-vitro grown cells following exposure to clinically relevant cisplatin doses 2, 20 and100µM with 60 minutes exposure time.
Species were separated on a 2.1 x 150mm, 3.5 µm, 200Å ZIC-HILIC column and detected online by selective platinum (m/z 194 and 195) monitoring using ICP-MS. The system was optimized with respect to detection limit (0.5pg) to be able to use low exposure concentration of cisplatin in the cell incubation experiments. The half life and the kinetic curve were determined by using the incubation time of 0 to 30 minutes in cisplatin free medium. A ceramic bead method was used for cell lysis, and cisplatin, total platinum and total protein concentration were measured in the lysates.
The, intracellular concentration of cisplatin and total platinum as well as the intracellular half life of cisplatin, were determined in both cisplatin sensitive (T289 wild type) and resistant (T289 DDP) malignant melanoma cells. The half life and total platinum depends on the type of cells and the exposure doses. For sensitive cells, with low exposure doses (2, 20µM), the half life was determined to 12 minutes and with high exposure dose, the half life reduced quickly and was determined to be 6 minutes. For resistant cells, the half life was determined to 16, 14, and10 minutes for 2, 20, and 100µM exposure doses, respectively. The intracellular cisplatin and total platinum in resistant cells were lower than in sensitive cells.
The reaction order for the metabolism of intracellular cisplatin was also investigated. The decline in cisplatin concentration did not really follow the first or second order reaction. However, for sensitive cells, the reduction seemed to be close to the first order at low exposure doses (2, 20µM) and the second order with the high exposure dose (100µM) and for resistant cells, the reduction of cisplatin seemed to follow the first order in all exposure doses.

3
4
Abbreviations ICP-MS, inductively coupled plasma mass spectrometry;
HILIC, hydrophilic interaction liquid chromatography;
PBS, phosphate-buffered saline;
ZIC, zwitterionic;
CDDP, Cisplatin, cis-diamminedichloroplatinum(II);
MH-CDDP, Monohydrolysedcisplatin
Carboplatin, cis-diammine(1,1-cyclobutanedicarboxylato)platinum(II);
Oxaliplatin, (1R,2R-diaminocyclohexane)oxalatoplatinum(II);
RPLC, reversed phase liquid chromatography
5
Table of Contents 1. Introduction ........................................................................................................................ 6
1.1 Aim of project ................................................................................................................ 6
1.2. Theoretical background ................................................................................................. 7
1.2.1. ICP-MS .................................................................................................................... 7
1.2.2. HILIC ....................................................................................................................... 8
1.3. Methods.......................................................................................................................... 9
1.3.1. Experimental set up.................................................................................................. 9
1.3.2. Reagents and chemicals ......................................................................................... 10
1.3.3. Preparation of cell samples .................................................................................... 10
1.3.4. Total platinum measurement in the whole cell lysate ............................................ 11
2. Procedures ........................................................................................................................ 11
2.1.Optimization of ICP- MS ............................................................................................... 11
2.2. Optimization of LC ...................................................................................................... 11
3. Results and discussion ...................................................................................................... 12
3.1. Optimization .................................................................................................................. 12
3.1.1. ICP- MS .................................................................................................................. 12
3.1.2. LC ........................................................................................................................... 13
3.2. Retention mechanism of cisplatin in Zwitterionic column ........................................... 14
3.3. Standard correction ....................................................................................................... 16
3.4. Investigation of samples storage condition and membrane filter .................................. 16
3.5. Determination of intracellular half life of cisplatin ....................................................... 19
3.5.1. Summary of rate of reactions and determination of order reaction [12]................ 19
3.5.2. Determination of intracellular half life of cisplatin ............................................... 20
4. Conclusion ........................................................................................................................ 29
Reference ................................................................................................................................. 30
Appendix .................................................................................................................................. 31
6
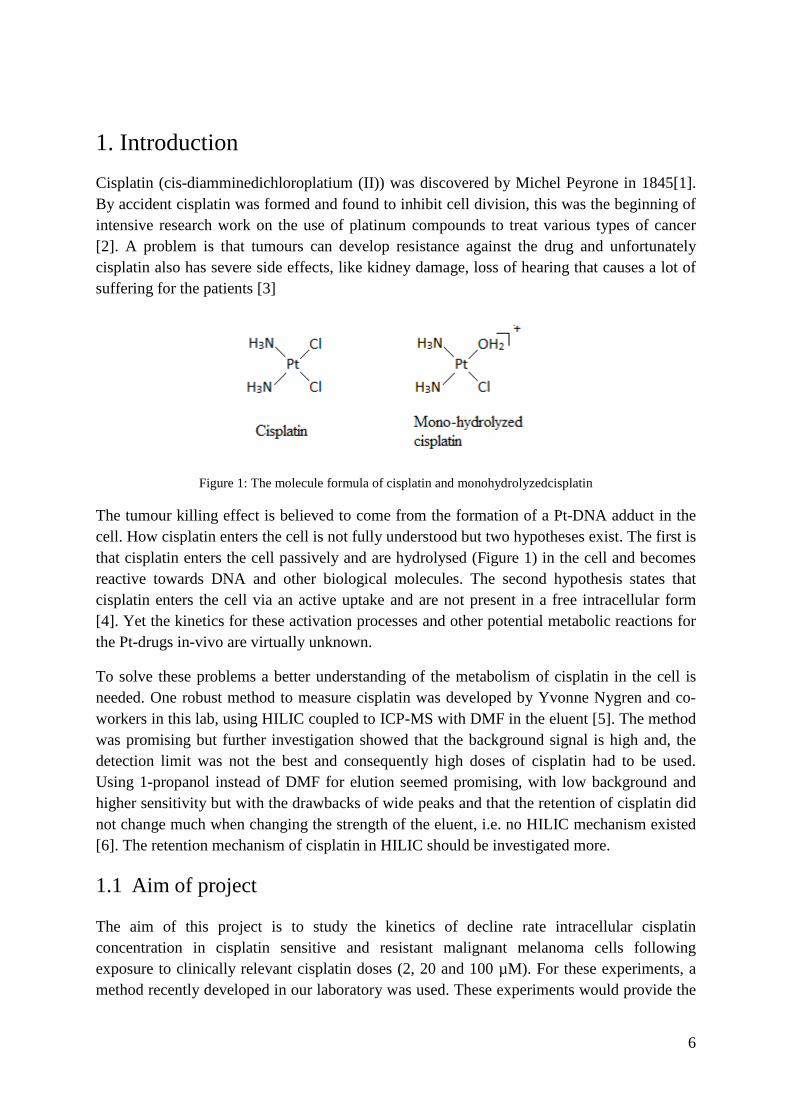
1. Introduction Cisplatin (cis-diamminedichloroplatium (II)) was discovered by Michel Peyrone in 1845[1]. By accident cisplatin was formed and found to inhibit cell division, this was the beginning of intensive research work on the use of platinum compounds to treat various types of cancer [2]. A problem is that tumours can develop resistance against the drug and unfortunately cisplatin also has severe side effects, like kidney damage, loss of hearing that causes a lot of suffering for the patients [3]
Figure 1: The molecule formula of cisplatin and monohydrolyzedcisplatin
The tumour killing effect is believed to come from the formation of a Pt-DNA adduct in the cell. How cisplatin enters the cell is not fully understood but two hypotheses exist. The first is that cisplatin enters the cell passively and are hydrolysed (Figure 1) in the cell and becomes reactive towards DNA and other biological molecules. The second hypothesis states that cisplatin enters the cell via an active uptake and are not present in a free intracellular form [4]. Yet the kinetics for these activation processes and other potential metabolic reactions for the Pt-drugs in-vivo are virtually unknown.
To solve these problems a better understanding of the metabolism of cisplatin in the cell is needed. One robust method to measure cisplatin was developed by Yvonne Nygren and co-workers in this lab, using HILIC coupled to ICP-MS with DMF in the eluent [5]. The method was promising but further investigation showed that the background signal is high and, the detection limit was not the best and consequently high doses of cisplatin had to be used. Using 1-propanol instead of DMF for elution seemed promising, with low background and higher sensitivity but with the drawbacks of wide peaks and that the retention of cisplatin did not change much when changing the strength of the eluent, i.e. no HILIC mechanism existed [6]. The retention mechanism of cisplatin in HILIC should be investigated more.
1.1 Aim of project
The aim of this project is to study the kinetics of decline rate intracellular cisplatin concentration in cisplatin sensitive and resistant malignant melanoma cells following exposure to clinically relevant cisplatin doses (2, 20 and 100 µM). For these experiments, a method recently developed in our laboratory was used. These experiments would provide the
7
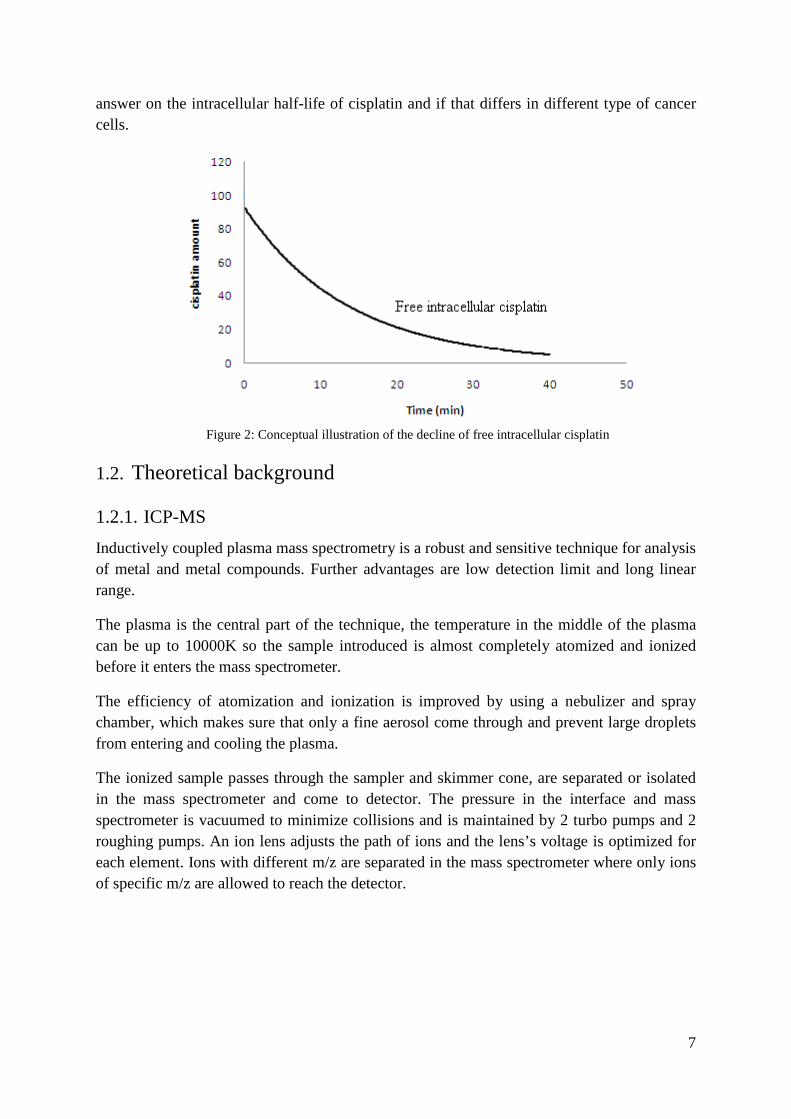
answer on the intracellular half-life of cisplatin and if that differs in different type of cancer cells.
Figure 2: Conceptual illustration of the decline of free intracellular cisplatin
1.2. Theoretical background
1.2.1. ICP-MS Inductively coupled plasma mass spectrometry is a robust and sensitive technique for analysis of metal and metal compounds. Further advantages are low detection limit and long linear range.
The plasma is the central part of the technique, the temperature in the middle of the plasma can be up to 10000K so the sample introduced is almost completely atomized and ionized before it enters the mass spectrometer.
The efficiency of atomization and ionization is improved by using a nebulizer and spray chamber, which makes sure that only a fine aerosol come through and prevent large droplets from entering and cooling the plasma.
The ionized sample passes through the sampler and skimmer cone, are separated or isolated in the mass spectrometer and come to detector. The pressure in the interface and mass spectrometer is vacuumed to minimize collisions and is maintained by 2 turbo pumps and 2 roughing pumps. An ion lens adjusts the path of ions and the lens’s voltage is optimized for each element. Ions with different m/z are separated in the mass spectrometer where only ions of specific m/z are allowed to reach the detector.
8
Figure 3: The schematic of ICP-MS [7]
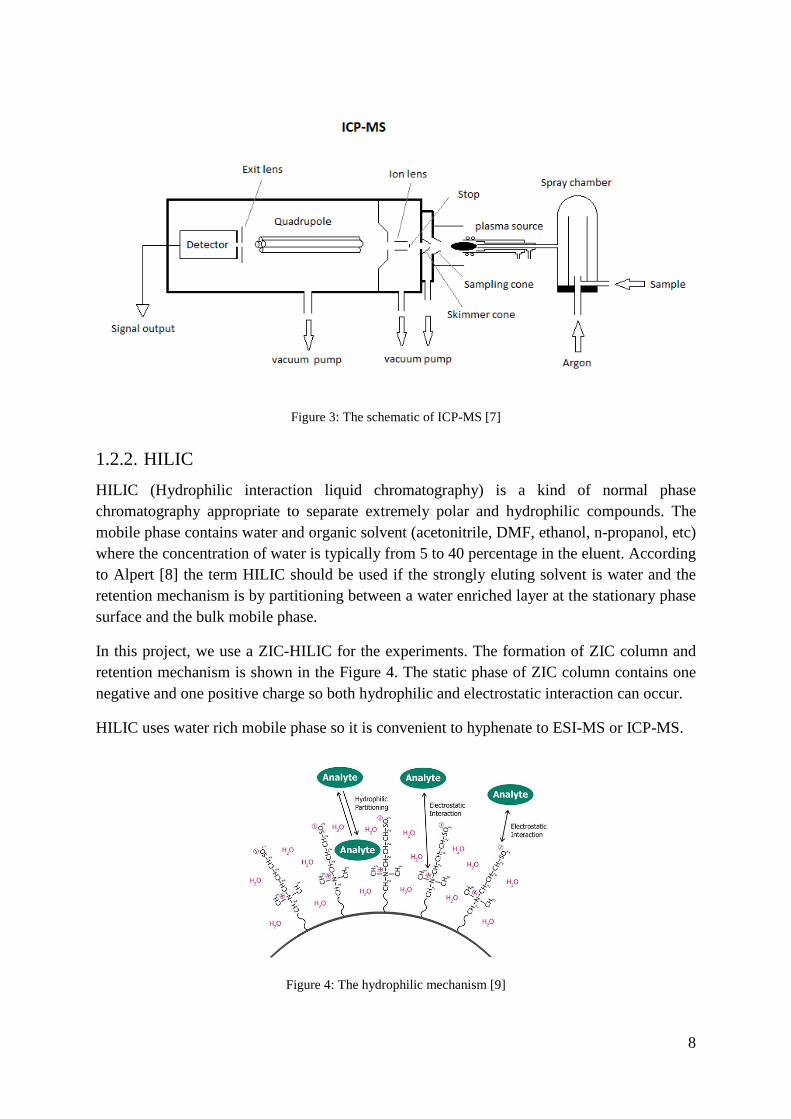
1.2.2. HILIC HILIC (Hydrophilic interaction liquid chromatography) is a kind of normal phase chromatography appropriate to separate extremely polar and hydrophilic compounds. The mobile phase contains water and organic solvent (acetonitrile, DMF, ethanol, n-propanol, etc) where the concentration of water is typically from 5 to 40 percentage in the eluent. According to Alpert [8] the term HILIC should be used if the strongly eluting solvent is water and the retention mechanism is by partitioning between a water enriched layer at the stationary phase surface and the bulk mobile phase.
In this project, we use a ZIC-HILIC for the experiments. The formation of ZIC column and retention mechanism is shown in the Figure 4. The static phase of ZIC column contains one negative and one positive charge so both hydrophilic and electrostatic interaction can occur.
HILIC uses water rich mobile phase so it is convenient to hyphenate to ESI-MS or ICP-MS.
Figure 4: The hydrophilic mechanism [9]
9
1.3. Methods
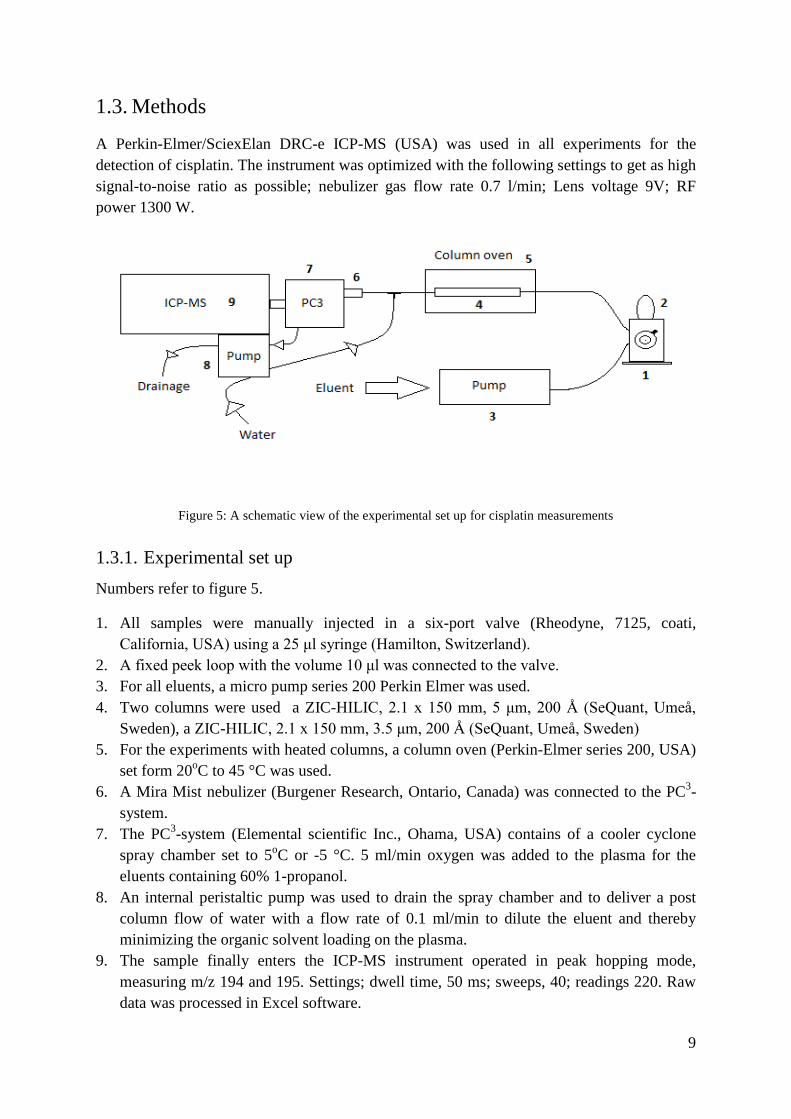
A Perkin-Elmer/SciexElan DRC-e ICP-MS (USA) was used in all experiments for the detection of cisplatin. The instrument was optimized with the following settings to get as high signal-to-noise ratio as possible; nebulizer gas flow rate 0.7 l/min; Lens voltage 9V; RF power 1300 W.
Figure 5: A schematic view of the experimental set up for cisplatin measurements
1.3.1. Experimental set up Numbers refer to figure 5.
1. All samples were manually injected in a six-port valve (Rheodyne, 7125, coati, California, USA) using a 25 μl syringe (Hamilton, Switzerland).
2. A fixed peek loop with the volume 10 μl was connected to the valve. 3. For all eluents, a micro pump series 200 Perkin Elmer was used. 4. Two columns were used a ZIC-HILIC, 2.1 x 150 mm, 5 μm, 200 Å (SeQuant, Umeå,
Sweden), a ZIC-HILIC, 2.1 x 150 mm, 3.5 μm, 200 Å (SeQuant, Umeå, Sweden) 5. For the experiments with heated columns, a column oven (Perkin-Elmer series 200, USA)
set form 20oC to 45 °C was used. 6. A Mira Mist nebulizer (Burgener Research, Ontario, Canada) was connected to the PC3-
system. 7. The PC3-system (Elemental scientific Inc., Ohama, USA) contains of a cooler cyclone
spray chamber set to 5oC or -5 °C. 5 ml/min oxygen was added to the plasma for the eluents containing 60% 1-propanol.
8. An internal peristaltic pump was used to drain the spray chamber and to deliver a post column flow of water with a flow rate of 0.1 ml/min to dilute the eluent and thereby minimizing the organic solvent loading on the plasma.
9. The sample finally enters the ICP-MS instrument operated in peak hopping mode, measuring m/z 194 and 195. Settings; dwell time, 50 ms; sweeps, 40; readings 220. Raw data was processed in Excel software.
10
1.3.2. Reagents and chemicals For all aqueous solutions, 18 MΩ water was used. Ammonium acetate was used as buffer in all eluents and was prepared by dissolving the salt (Starlan, AM0254, Reagent grade, ACS) in water to concentrations form 1 to 50mM.
The eluents were prepared by mixing 1-propanol (Analytical reagent, Fischer scientific, UK) with suitable concentration of ammonium acetate to 0 to 60 % (v/v). The eluents were filtered through 0.45 µm membrane (Milipore) and degassed in ultrasonic bath after preparation.
The standards of cisplatin1000 μg/ml (MEDA, Sweden) and platinum1000±3μg/ml (Inorganic Ventures) stock solutions were diluted in 50mM NH4Cl and 2.5% 1-propanol before using, respectively.
The mono-hydrolysed metabolite of cisplatin was achieved by heating 10 ppb cisplatin solution in miliQ water at 36 °C in 2 hours.
1.3.3. Preparation of cell samples The human malignant melanoma cell line T289wt was grown to a confluence of approximately 75-90% in +37°C and 5% CO2 in T-75 flasks (Sarstedt, Nümbrecht, Germany). As growth medium, RPMI 1640 (Gibco, Life Technologies, Paisley, UK) was used together with a mixture of the following:10% fetal bovine serum (Biowest, Nuaillé, France), 10 nM hydrocortisone, 5 μg/ml human transferring, 10 nM estradiol, 5 ng/ml selenium (Sigma-Aldrich, St. Louis, MO, USA), penicillin (100 U/ml) and streptomycin (100 U/ml) (Gibco, Life Technologies, Paisley, UK).
The T-75 flasks were exposed to 2, 20 or 100μMcisplatin for 60 minutes, the control sample is an unexposed sample. The cells were then washed with 7.5 ml PBS (3 times) and incubated in free growth medium form 0 to30 minutes and then loosen from the walls of flask with a cell scraper in 10 ml PBS. The cells from each flask were then lysed individually by ceramic bead method. After lysis the cell samples were centrifuged at 14000 rpm for 15 minutes at 4 °C to condense cells.
Resistant cisplatin (T298 DDP) cells were previously prepared by adding 3µM [10] cisplatin during the cell growing. Most cells were killed by this treatment but there was small amount of cells still surviving and they have resistance to cisplatin. In the present study the resistant cell samples were exposed and incubated with the same procedure as sensitive cisplatin (wild type) cells.
The procedure of ceramic bead method: The cell sample is put in the plastic tube and shaken, 6500 agitations per minute, for 30 seconds (two times).
The concentration of protein was determined by The Bio-Rad DC Protein Assay. That is a colorimetric assay for protein concentration following detergent solubilization. The assay is based on the reaction of protein with an alkaline copper tartrate solution and Folin reagent.
11
All the cell samples were prepared at the Department of Surgery at Umeå University Hospital, Sweden.
The cell sample was filtered through 3kDa or 10kDa filter membrane by centrifugating 12000 rpm at 16oC for15 minutes before introduction to the HILIC-ICP-MS system.
1.3.4. Total platinum measurement in the whole cell lysate The measurements of total platinum were done by ICP-MS continuous sample introduction. The cell sample was diluted 50 times with 2.5%1-propanol before introduction to the ICP- MS using a peristaltic pump at a flow rate of 0.2ml/min. The monitoring was recorded after 25 seconds sampling flush, 25 seconds delay with 1000ms dwell time, 1reading, 3 sweeps, and 5 replicates. Total measurement time was 65 seconds.
2. Procedures
2.1.Optimization of ICP- MS
The position of the torch (XY position) and the ion lens’s voltage, sweeps, nebulizer flow rate, RF power were optimized to get highest signal for a 5ppb platinum standard solution.
2.2. Optimization of LC
The concentration of 1- propanol and ammonium acetate in the eluent were optimized to get highest signal intensity and the separation of cisplatin and monohydrolysedcisplatin. The detection limit was calculated based on the signal to noise ratio by running a test solution with low concentration of cisplatin (0.05µgL-1). The reproducibility was evaluated by analyzing a 10 ppb cisplatin standard in triplicates at optimized condition.
The Van Deemter curve was plotted with flow rate that varied form 0.05 ml/min to 0.35 ml/min to choose the flow rate for highest efficiency of the column.
Experiments were done to try to understand the retention mechanism of cisplatin and monohydrolysedcisplatin in ZIC-HILIC, and these include changing pH of eluent, varying the concentration of 1-propanol, ammonium acetate, using monomer of hydrophilic static phase (zwitterionic). The temperature of column was also considered to determine the energy binding of cisplatin and mono-hydrolysedcisplatin to immobile phase.
The relative sensitivity between cisplatin and platinum standard in different solutions such as water, 1% HCl and 2.5% 1-propanolwas also investigated.
12
3. Results and discussion
3.1. Optimization
3.1.1. ICP- MS The position of torch was adjusted by changing the XY control position of the torch, to get the highest signal for 5 pg/ ml platinum standard continuously injected during the measurement.
10, 20, 40sweepswere evaluated and based on the results 40 sweeps was chosen because of lowest noise signal.
The RF power was set to 1300W as a compromise between high analyte signal intensity and generator and coil life time. If the RF power is set too high, it could damage the torch and 1600 W is the limit of RF power.
The nebulizer gas flow affect much the analyte sensitivity, these small droplets were made by gush of gas flow through liquid and then they were carried to the plasma. The optimized flow rate was 0.7 l/min.
The direction of the ions was adjusted by changing the voltage of the ion lens, each element has a different optimum ion lens’s voltage which also dependent on the concentration of organic components in the eluent. The results showed that, for 2.5% of 1-propanol in the eluent, 11V gave highest signal for 195Pt+. However, for 25% of 1-propanol the optimum voltage was 9V.
That result was explained with high organic solvent (25%) much organic solvent come to plasma and therefore the ionization of analyte was suppressed and more organic ions were created. Those organic ions competed to the target ions to come to mass spectrometer so the voltage of ion lens must be low (9V) to separate the direction of target ions and organic ions. For low percentage of organic (2.5%), not much organic ions come to mass spectrometer so the ion lens voltage was high to force the flow of target ions to get much ions can enter yhe mass spectrometer. Consequently, the sensitivity of cisplatin with low organic (2.5%) much more sensitive than high organic solvent (25%) and the background also lower was showed in the Figure 6 below.
The optimum lens voltage for analyte could be changed if ion lens was dirty because of running with very high concentration of organic in the eluent and then if the sensitivity of system was reduced, the cleaning of the ion lens should be considered.
13
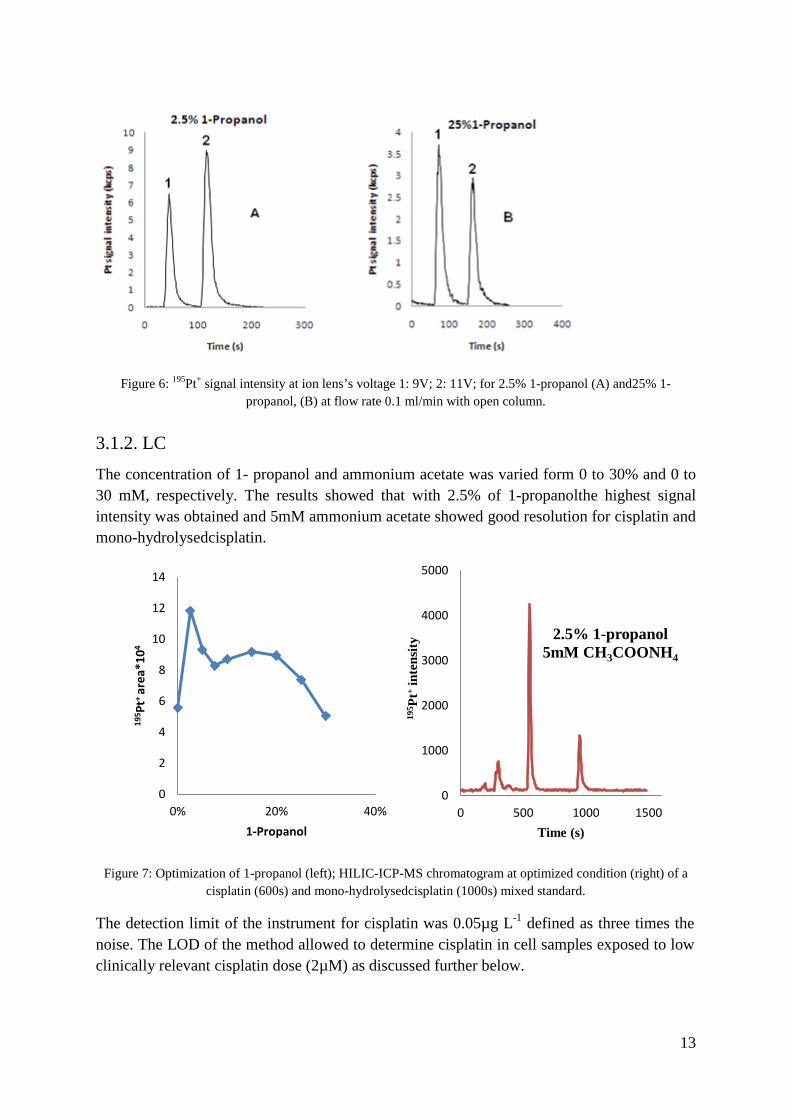
Figure 6: 195Pt+ signal intensity at ion lens’s voltage 1: 9V; 2: 11V; for 2.5% 1-propanol (A) and25% 1-propanol, (B) at flow rate 0.1 ml/min with open column.
3.1.2. LC The concentration of 1- propanol and ammonium acetate was varied form 0 to 30% and 0 to 30 mM, respectively. The results showed that with 2.5% of 1-propanolthe highest signal intensity was obtained and 5mM ammonium acetate showed good resolution for cisplatin and mono-hydrolysedcisplatin.
Figure 7: Optimization of 1-propanol (left); HILIC-ICP-MS chromatogram at optimized condition (right) of a cisplatin (600s) and mono-hydrolysedcisplatin (1000s) mixed standard.
The detection limit of the instrument for cisplatin was 0.05µg L-1 defined as three times the noise. The LOD of the method allowed to determine cisplatin in cell samples exposed to low clinically relevant cisplatin dose (2µM) as discussed further below.
0
2
4
6
8
10
12
14
0% 20% 40%
195 P
t+ ar
ea*1
04
1-Propanol
0
1000
2000
3000
4000
5000
0 500 1000 1500
195 P
t+ int
ensit
y
Time (s)
2.5% 1-propanol 5mM CH3COONH4
14
The results also showed good reproducibility in retention time and signal intensity of cisplatin. Three cisplatin standards were prepared in 50 mM NH4Cl solution to reduce hydrolysis and run with the optimized procedure, giving an RSD of 0.45% for signal intensity and 0.40% for retention time.
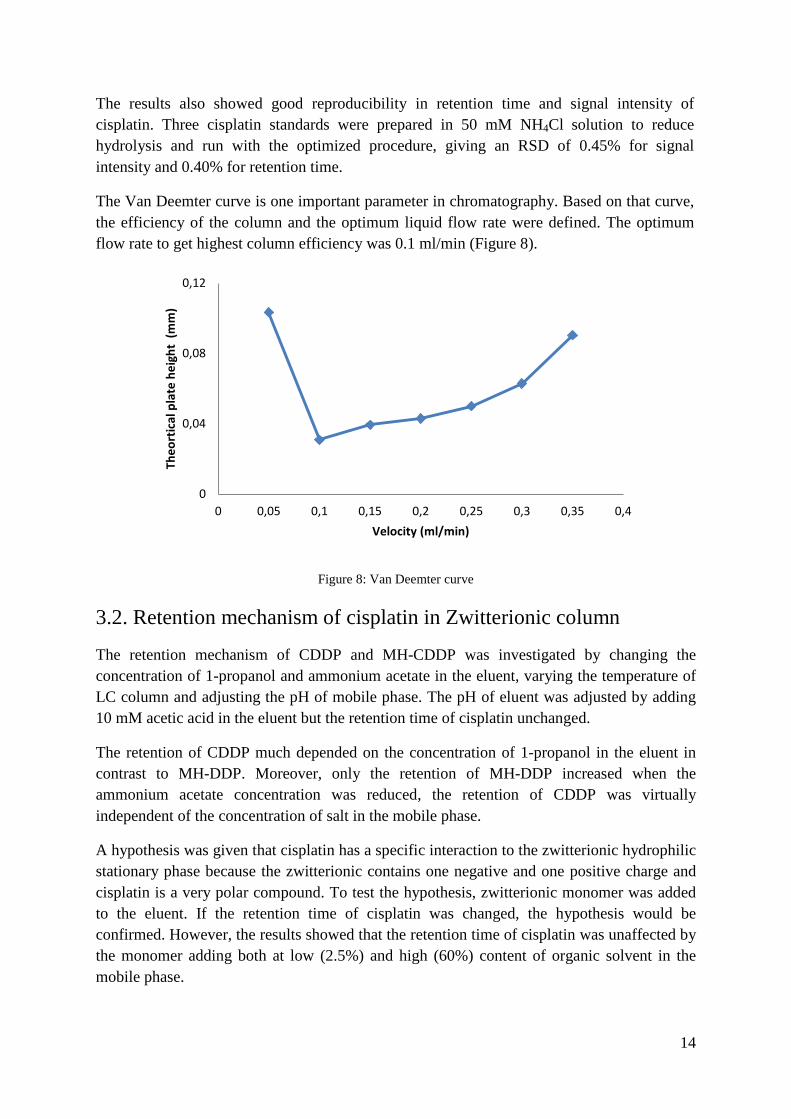
The Van Deemter curve is one important parameter in chromatography. Based on that curve, the efficiency of the column and the optimum liquid flow rate were defined. The optimum flow rate to get highest column efficiency was 0.1 ml/min (Figure 8).
Figure 8: Van Deemter curve
3.2. Retention mechanism of cisplatin in Zwitterionic column
The retention mechanism of CDDP and MH-CDDP was investigated by changing the concentration of 1-propanol and ammonium acetate in the eluent, varying the temperature of LC column and adjusting the pH of mobile phase. The pH of eluent was adjusted by adding 10 mM acetic acid in the eluent but the retention time of cisplatin unchanged.
The retention of CDDP much depended on the concentration of 1-propanol in the eluent in contrast to MH-DDP. Moreover, only the retention of MH-DDP increased when the ammonium acetate concentration was reduced, the retention of CDDP was virtually independent of the concentration of salt in the mobile phase.
A hypothesis was given that cisplatin has a specific interaction to the zwitterionic hydrophilic stationary phase because the zwitterionic contains one negative and one positive charge and cisplatin is a very polar compound. To test the hypothesis, zwitterionic monomer was added to the eluent. If the retention time of cisplatin was changed, the hypothesis would be confirmed. However, the results showed that the retention time of cisplatin was unaffected by the monomer adding both at low (2.5%) and high (60%) content of organic solvent in the mobile phase.
0
0,04
0,08
0,12
0 0,05 0,1 0,15 0,2 0,25 0,3 0,35 0,4
Theo
rtic
al p
late
hei
ght
(mm
)
Velocity (ml/min)
15
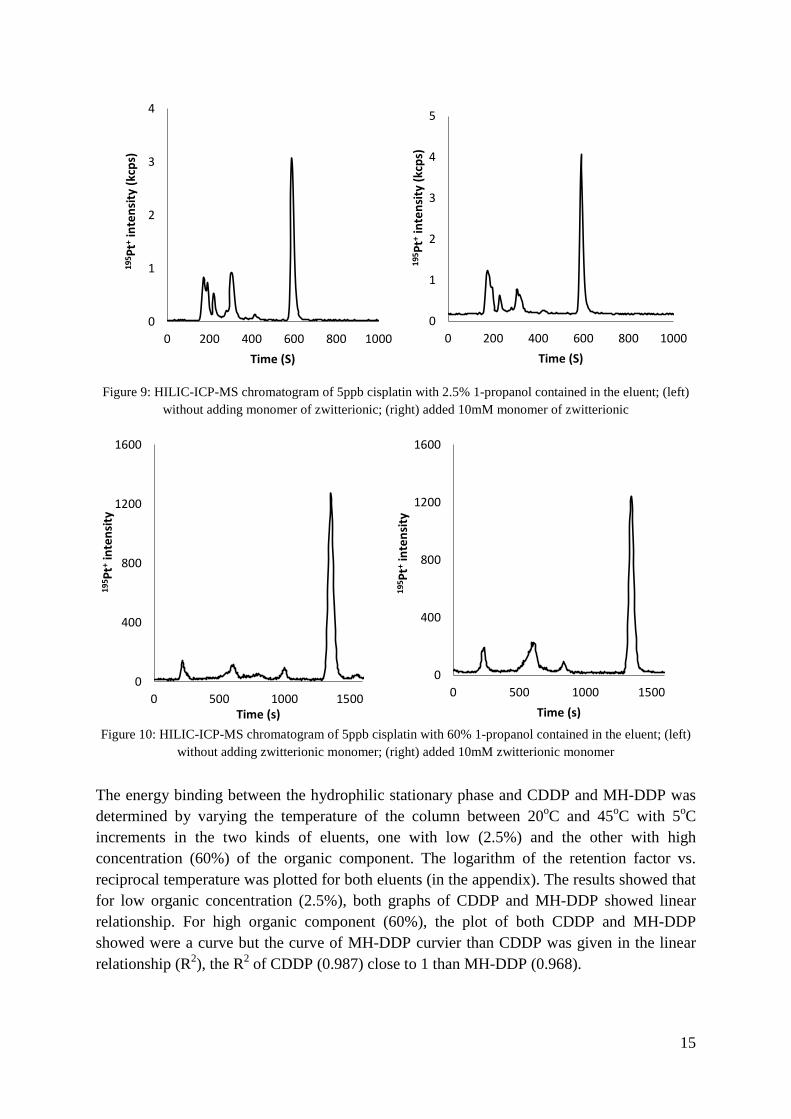
Figure 9: HILIC-ICP-MS chromatogram of 5ppb cisplatin with 2.5% 1-propanol contained in the eluent; (left)
without adding monomer of zwitterionic; (right) added 10mM monomer of zwitterionic
Figure 10: HILIC-ICP-MS chromatogram of 5ppb cisplatin with 60% 1-propanol contained in the eluent; (left)
without adding zwitterionic monomer; (right) added 10mM zwitterionic monomer
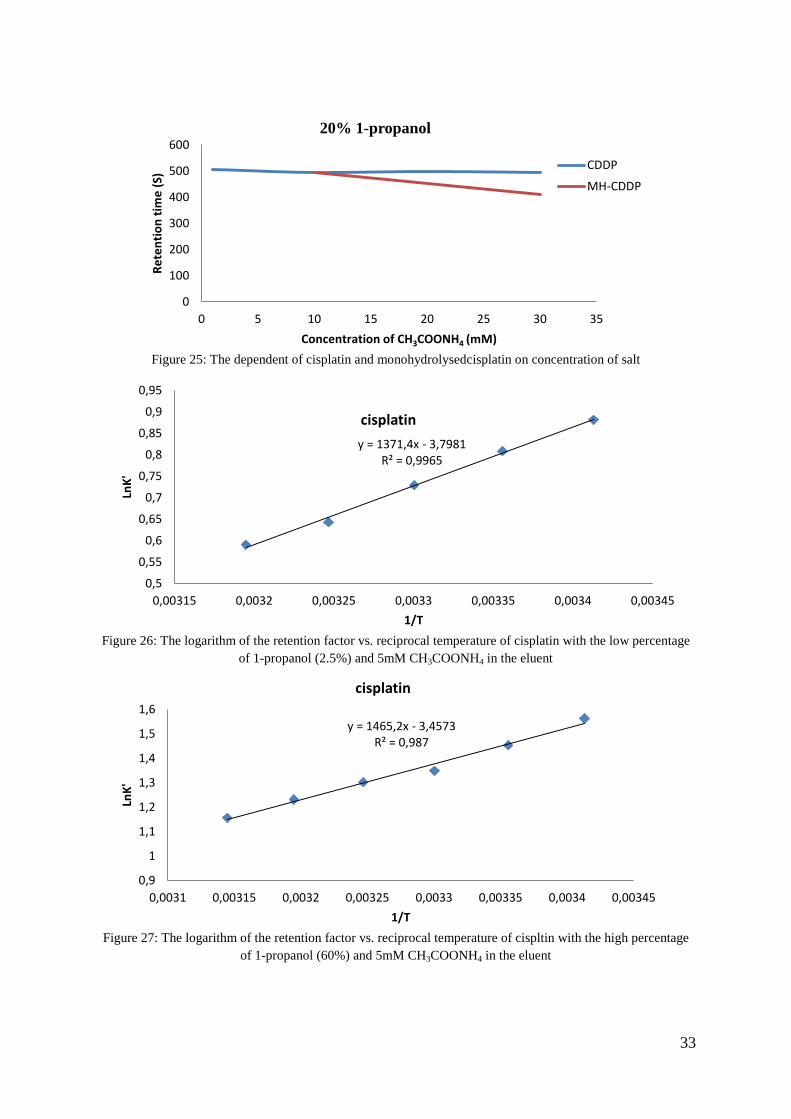
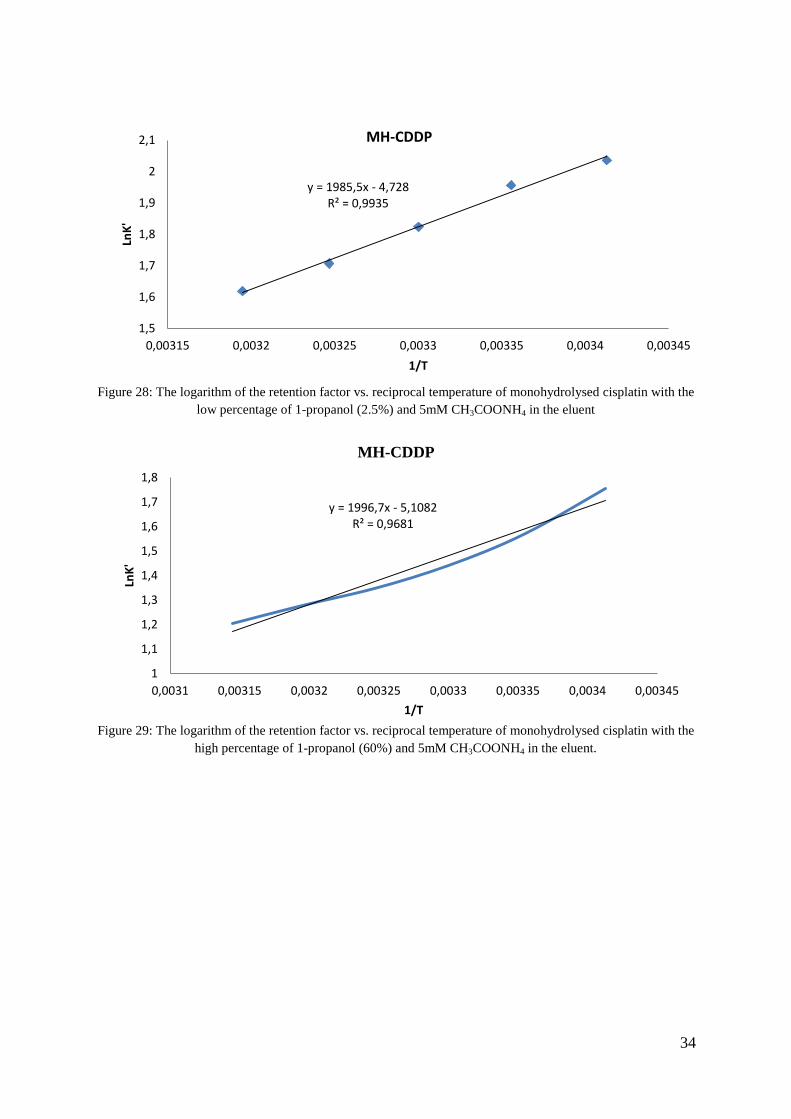
The energy binding between the hydrophilic stationary phase and CDDP and MH-DDP was determined by varying the temperature of the column between 20oC and 45oC with 5oC increments in the two kinds of eluents, one with low (2.5%) and the other with high concentration (60%) of the organic component. The logarithm of the retention factor vs. reciprocal temperature was plotted for both eluents (in the appendix). The results showed that for low organic concentration (2.5%), both graphs of CDDP and MH-DDP showed linear relationship. For high organic component (60%), the plot of both CDDP and MH-DDP showed were a curve but the curve of MH-DDP curvier than CDDP was given in the linear relationship (R2), the R2 of CDDP (0.987) close to 1 than MH-DDP (0.968).
0
1
2
3
4
0 200 400 600 800 1000
195 P
t+ int
ensi
ty (k
cps)
Time (S)
0
1
2
3
4
5
0 200 400 600 800 1000
195 P
t+ int
ensi
ty (k
cps)
Time (S)
0
400
800
1200
1600
0 500 1000 1500
195 P
t+ int
ensi
ty
Time (s)
0
400
800
1200
1600
0 500 1000 1500
195 P
t+ int
ensi
ty
Time (s)
16
This indicates that MH-DDP follows an electrostatic interaction mechanism at the low organic rate, and both electrostatic interaction and hydrophilic mechanisms at high organic solvent [11].For cisplatin, the hydrophilic mechanism affected to CDDP at high organic solvent but not strong because of the relative relationship still close to 1(R2= 0.987) and even with 100% of water in the eluent CDDP still retained in the zwitterionic column so beside hydrophilic mechanism still have another mechanism affected to the retention of CDDP.
3.3. Standard correction
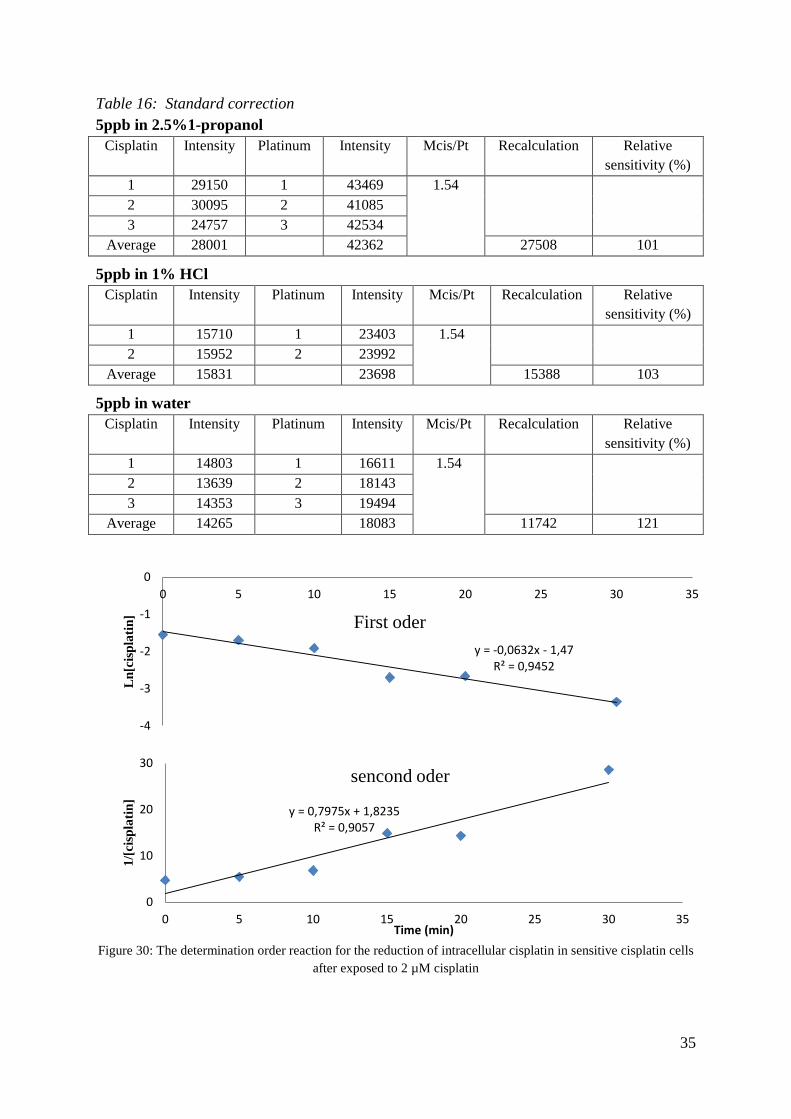
The reliability of the analysis is promoted if the analyte standard is compared to another standard of different source. Here, the cisplatin standard was tested against a platinum chloride standard. These standards were stabilized in different solutions: water, 1%HCl and 2.5%1-propanol. The results showed good agreement in the 2.5%1-propanal and 1%HCl and higher sensitivity in 2.5% 1-propanol. The signal of the platinum chloride standard was not stable in the water which could be due to the low concentration of Cl-, giving rise to other forms of Pt4+which is easily adsorbed to the wall tube.
Table 1: The correction standard stock solution
5ppb standard in 195pt+signal intensity Relative Sensitivity (%)
Cisplatin Platinum
2.5%1-propanol 28001 27508 101 1% HCl 15831 15388 103 Water 14265 11742 121
3.4. Investigation of samples storage condition and membrane filter It is convenient if the samples could be stabilized and stored for longer times in a freezer. Several batches of samples were done and kept in the freezer form 0 to seven days, before analyzed
The first experiments were done by using the fresh samples; 3kDa filter membrane, exposure time 60 minutes, and cisplatin exposure dose 16.7 µM to get overview data.
17
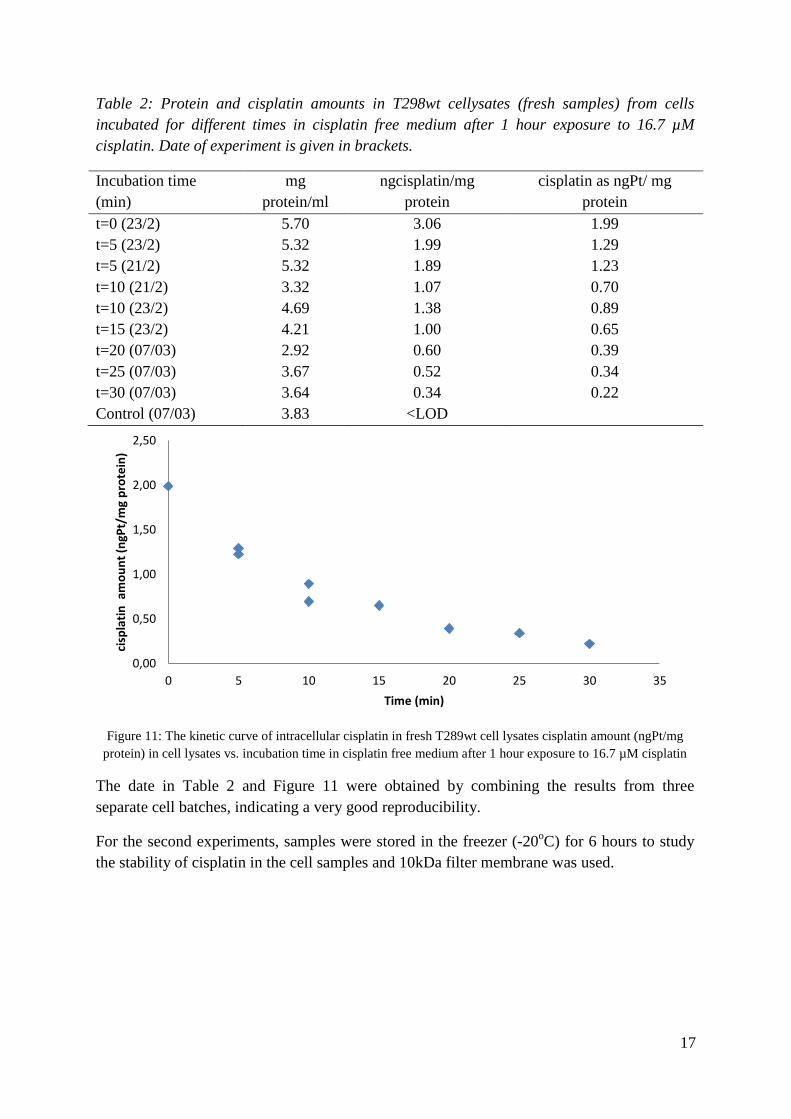
Table 2: Protein and cisplatin amounts in T298wt cellysates (fresh samples) from cells incubated for different times in cisplatin free medium after 1 hour exposure to 16.7 µM cisplatin. Date of experiment is given in brackets.
Incubation time (min)
mg protein/ml
ngcisplatin/mg protein
cisplatin as ngPt/ mg protein
t=0 (23/2) 5.70 3.06 1.99 t=5 (23/2) 5.32 1.99 1.29 t=5 (21/2) 5.32 1.89 1.23 t=10 (21/2) 3.32 1.07 0.70 t=10 (23/2) 4.69 1.38 0.89 t=15 (23/2) 4.21 1.00 0.65 t=20 (07/03) 2.92 0.60 0.39 t=25 (07/03) 3.67 0.52 0.34 t=30 (07/03) 3.64 0.34 0.22 Control (07/03) 3.83 <LOD
Figure 11: The kinetic curve of intracellular cisplatin in fresh T289wt cell lysates cisplatin amount (ngPt/mg
protein) in cell lysates vs. incubation time in cisplatin free medium after 1 hour exposure to 16.7 µM cisplatin
The date in Table 2 and Figure 11 were obtained by combining the results from three separate cell batches, indicating a very good reproducibility.
For the second experiments, samples were stored in the freezer (-20oC) for 6 hours to study the stability of cisplatin in the cell samples and 10kDa filter membrane was used.
0,00
0,50
1,00
1,50
2,00
2,50
0 5 10 15 20 25 30 35
cisp
latin
am
ount
(ngP
t/m
g pr
otei
n)
Time (min)
18
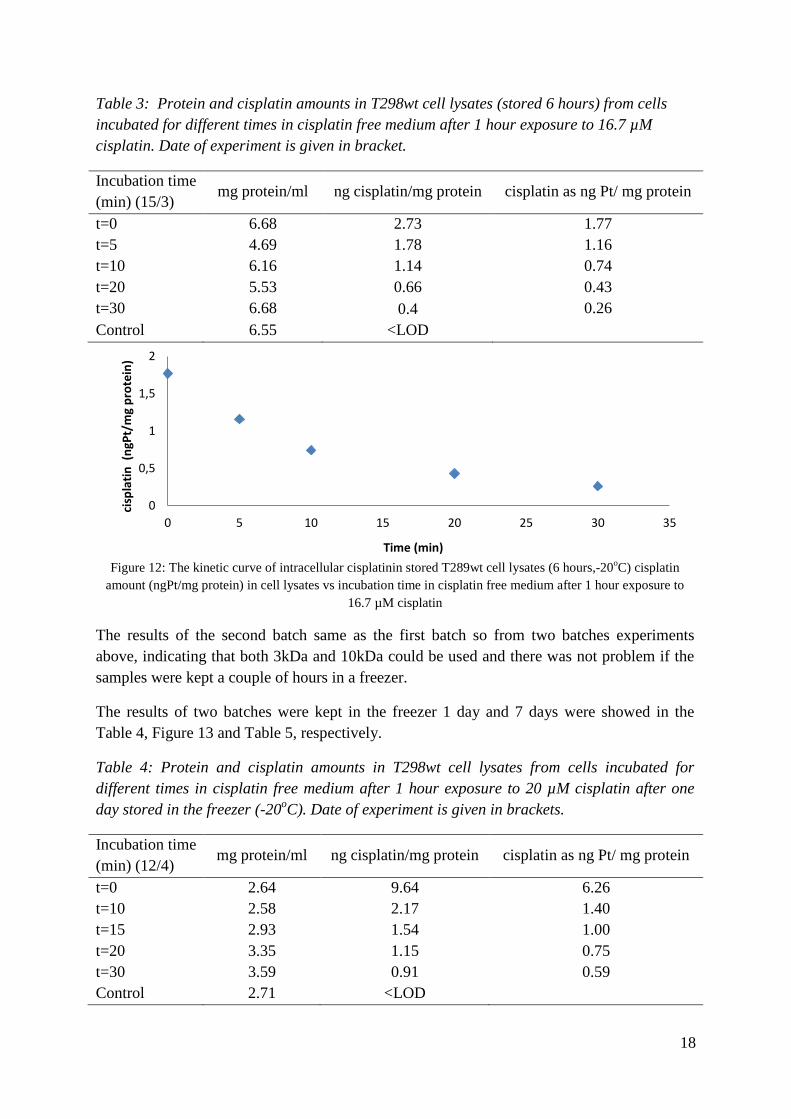
Table 3: Protein and cisplatin amounts in T298wt cell lysates (stored 6 hours) from cells incubated for different times in cisplatin free medium after 1 hour exposure to 16.7 µM cisplatin. Date of experiment is given in bracket.
Incubation time (min) (15/3)
mg protein/ml ng cisplatin/mg protein cisplatin as ng Pt/ mg protein
t=0 6.68 2.73 1.77 t=5 4.69 1.78 1.16 t=10 6.16 1.14 0.74 t=20 5.53 0.66 0.43 t=30 6.68 0.4 0.26 Control 6.55 <LOD
Figure 12: The kinetic curve of intracellular cisplatinin stored T289wt cell lysates (6 hours,-20oC) cisplatin
amount (ngPt/mg protein) in cell lysates vs incubation time in cisplatin free medium after 1 hour exposure to 16.7 µM cisplatin
The results of the second batch same as the first batch so from two batches experiments above, indicating that both 3kDa and 10kDa could be used and there was not problem if the samples were kept a couple of hours in a freezer.
The results of two batches were kept in the freezer 1 day and 7 days were showed in the Table 4, Figure 13 and Table 5, respectively.
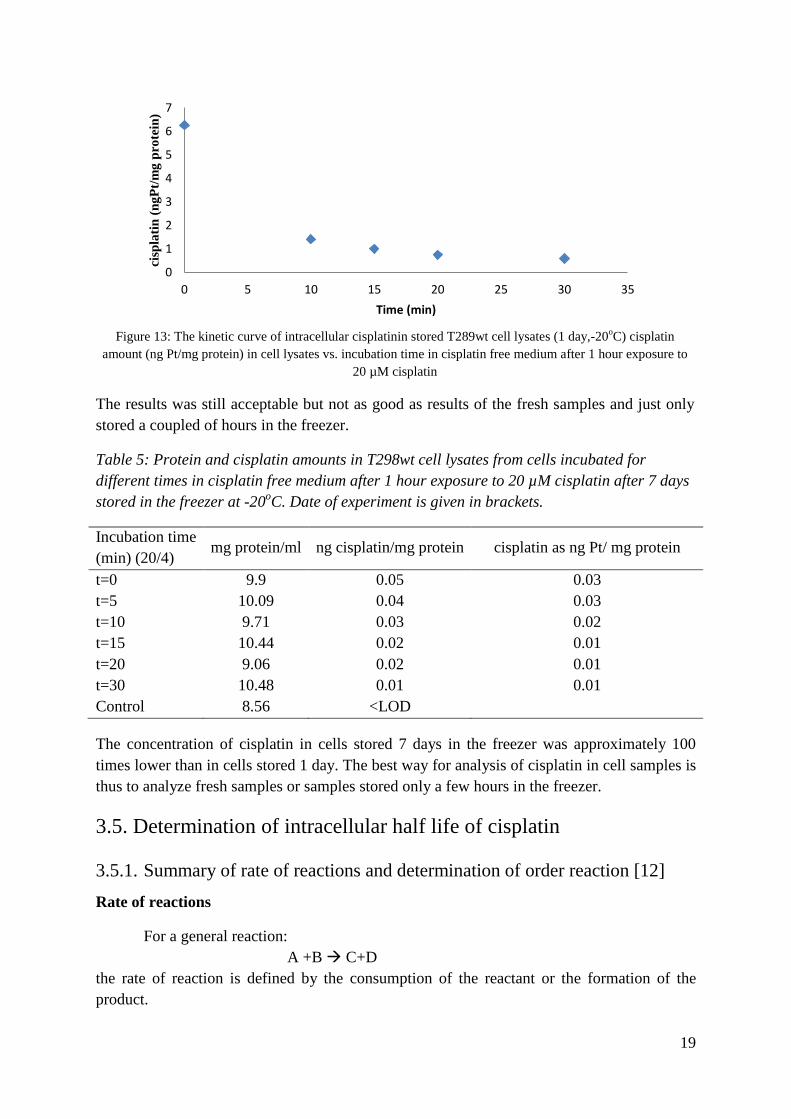
Table 4: Protein and cisplatin amounts in T298wt cell lysates from cells incubated for different times in cisplatin free medium after 1 hour exposure to 20 µM cisplatin after one day stored in the freezer (-20oC). Date of experiment is given in brackets.
Incubation time (min) (12/4)
mg protein/ml ng cisplatin/mg protein cisplatin as ng Pt/ mg protein
t=0 2.64 9.64 6.26 t=10 2.58 2.17 1.40 t=15 2.93 1.54 1.00 t=20 3.35 1.15 0.75 t=30 3.59 0.91 0.59 Control 2.71 <LOD
0
0,5
1
1,5
2
0 5 10 15 20 25 30 35
cisp
latin
(ng
Pt/m
g pr
otei
n)
Time (min)
19
Figure 13: The kinetic curve of intracellular cisplatinin stored T289wt cell lysates (1 day,-20oC) cisplatin
amount (ng Pt/mg protein) in cell lysates vs. incubation time in cisplatin free medium after 1 hour exposure to 20 µM cisplatin
The results was still acceptable but not as good as results of the fresh samples and just only stored a coupled of hours in the freezer.
Table 5: Protein and cisplatin amounts in T298wt cell lysates from cells incubated for different times in cisplatin free medium after 1 hour exposure to 20 µM cisplatin after 7 days stored in the freezer at -20oC. Date of experiment is given in brackets.
Incubation time (min) (20/4)
mg protein/ml ng cisplatin/mg protein cisplatin as ng Pt/ mg protein
t=0 9.9 0.05 0.03 t=5 10.09 0.04 0.03 t=10 9.71 0.03 0.02 t=15 10.44 0.02 0.01 t=20 9.06 0.02 0.01 t=30 10.48 0.01 0.01 Control 8.56 <LOD
The concentration of cisplatin in cells stored 7 days in the freezer was approximately 100 times lower than in cells stored 1 day. The best way for analysis of cisplatin in cell samples is thus to analyze fresh samples or samples stored only a few hours in the freezer.
3.5. Determination of intracellular half life of cisplatin
3.5.1. Summary of rate of reactions and determination of order reaction [12] Rate of reactions
For a general reaction: A +B C+D
the rate of reaction is defined by the consumption of the reactant or the formation of the product.
0
1
2
3
4
5
6
7
0 5 10 15 20 25 30 35
cisp
latin
(ngP
t/mg
prot
ein)
Time (min)
20
For reactant, the rate of reaction is expressed υA= -d[A]/dt
And the rate of formation of product is υC=d[C]/dt
Determination of order of reaction
Determination of order of a reaction is frequently very complicated. A reaction normally is first or second order, very rare to get higher then second order reaction. The normally empirical way to determine the order of a reaction is to plot the concentration of reactant against reaction time following the equation of the first order or the second order.
A first order reaction is mathematically described as:
[A]= [A]oe-kt (1)
or
ln([A]/[A]o)=-kt (1a)
The equation (1a) shows that if ln([A]/[A]o) is plotted against t, then a first order reaction will give a straight line of the slope –k.
The half life is the time for [A] decrease from [A]o to ½[A]o for the half life of the first order reaction. The half life can be easily determined form equation 1a by substituting t1/2 by t and [A]=1/2[A]o
Hence t1/2= ln2/k (1c)
Form equation (1c), indicating the half time of the first order reaction not dependent on [A]o
The equation of the second order reaction is expressed as:
1/[A] – 1/[A]o = kt (2)
The equation (2) shows that to test for a second order reaction, 1/[A] is plotted against t. Expecting a straight line the slope of the line will be k.
It is easy to shows form equation (2) by substituting t=t1/2 and [A]=1/2[A]o
Hence t1/2=1/k[A]o (2a)
Form equation (2a), unlike the first order reaction, the half life of second order reaction varies with the initial concentration [A]o.
3.5.2. Determination of intracellular half life of cisplatin
The consumption of intracellular cisplatin follows many and unknown mechanisms including both chemical and physical mechanisms such as reaction with protein or DNA and transport out of cell for example by diffusion. Therefore, the determination of reaction order and
21
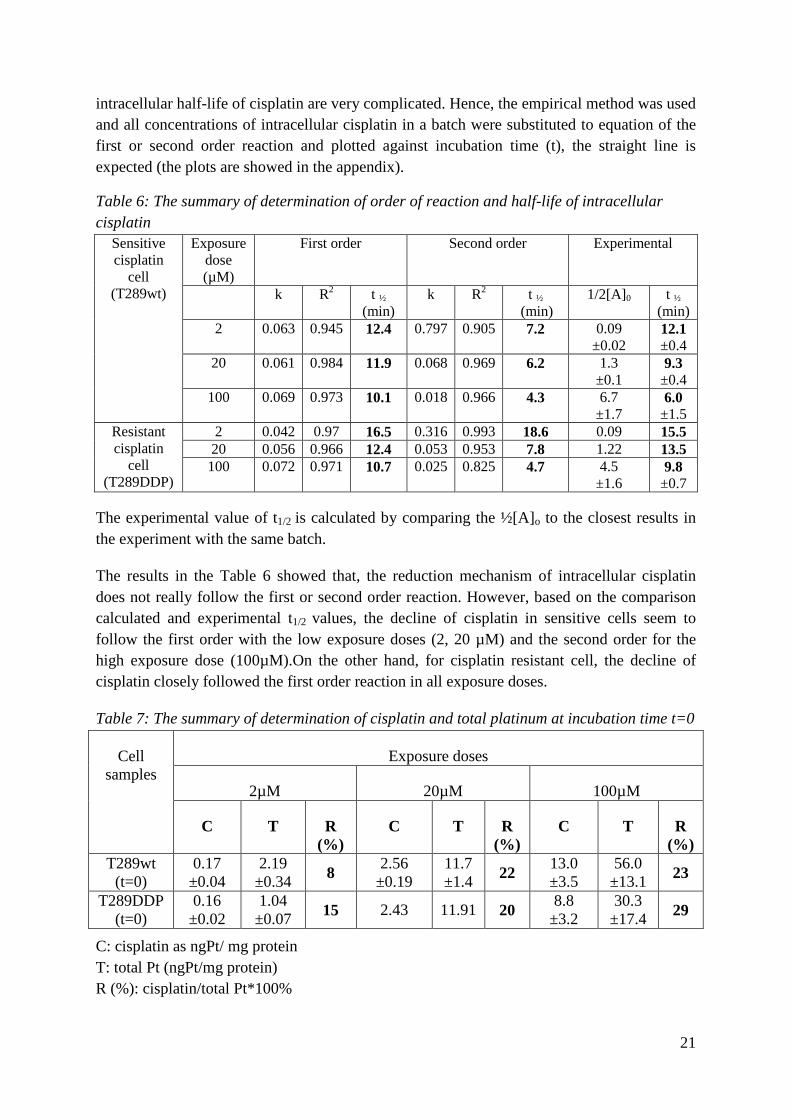
intracellular half-life of cisplatin are very complicated. Hence, the empirical method was used and all concentrations of intracellular cisplatin in a batch were substituted to equation of the first or second order reaction and plotted against incubation time (t), the straight line is expected (the plots are showed in the appendix).
Table 6: The summary of determination of order of reaction and half-life of intracellular cisplatin
Sensitive cisplatin
cell (T289wt)
Exposure dose (µM)
First order Second order Experimental
k R2 t ½ (min)
k R2 t ½
(min) 1/2[A]0 t ½
(min) 2 0.063 0.945 12.4 0.797 0.905 7.2 0.09
±0.02 12.1±0.4
20 0.061 0.984 11.9 0.068 0.969 6.2 1.3 ±0.1
9.3 ±0.4
100 0.069 0.973 10.1 0.018 0.966 4.3 6.7 ±1.7
6.0 ±1.5
Resistant cisplatin
cell (T289DDP)
2 0.042 0.97 16.5 0.316 0.993 18.6 0.09 15.5 20 0.056 0.966 12.4 0.053 0.953 7.8 1.22 13.5
100 0.072 0.971 10.7 0.025 0.825 4.7 4.5 ±1.6
9.8 ±0.7
The experimental value of t1/2 is calculated by comparing the ½[A]o to the closest results in the experiment with the same batch.
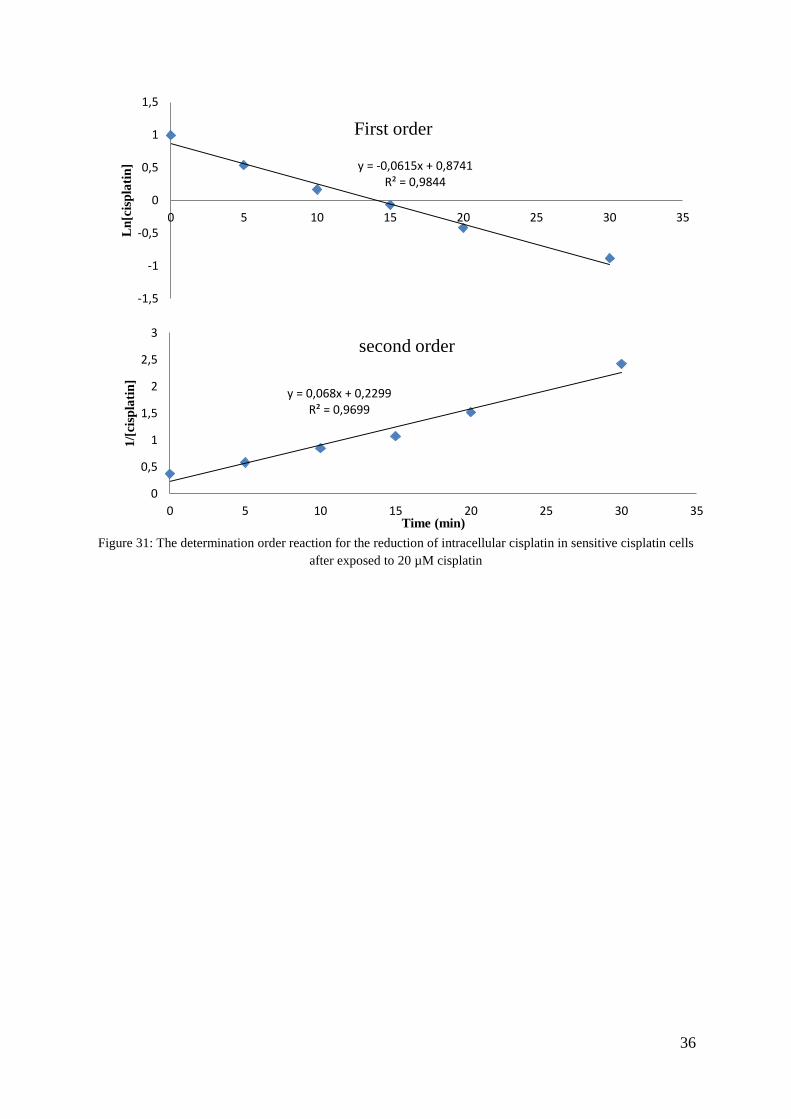
The results in the Table 6 showed that, the reduction mechanism of intracellular cisplatin does not really follow the first or second order reaction. However, based on the comparison calculated and experimental t1/2 values, the decline of cisplatin in sensitive cells seem to follow the first order with the low exposure doses (2, 20 µM) and the second order for the high exposure dose (100µM).On the other hand, for cisplatin resistant cell, the decline of cisplatin closely followed the first order reaction in all exposure doses.
Table 7: The summary of determination of cisplatin and total platinum at incubation time t=0
Cell samples
Exposure doses
2µM 20µM 100µM
C T R (%)
C T R (%)
C T R (%)
T289wt (t=0)
0.17 ±0.04
2.19 ±0.34 8 2.56
±0.19 11.7 ±1.4 22 13.0
±3.5 56.0
±13.1 23
T289DDP (t=0)
0.16 ±0.02
1.04 ±0.07 15 2.43 11.91 20 8.8
±3.2 30.3
±17.4 29
C: cisplatin as ngPt/ mg protein T: total Pt (ngPt/mg protein) R (%): cisplatin/total Pt*100%
22
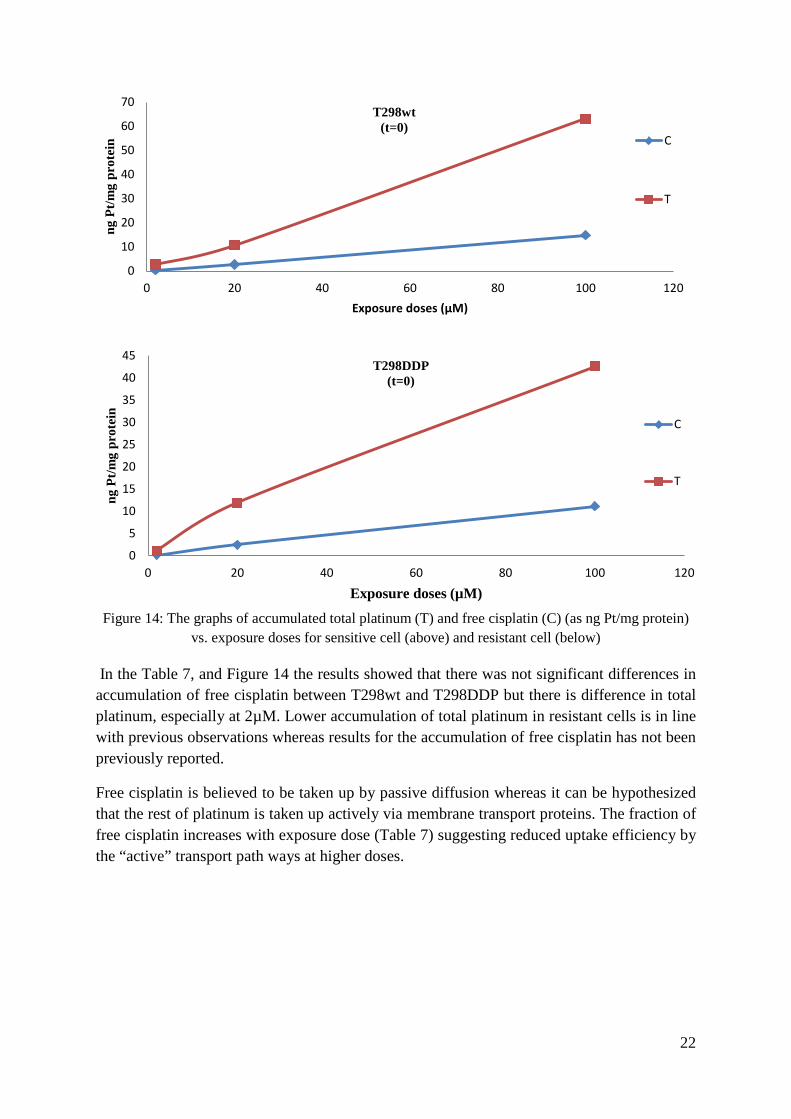
Figure 14: The graphs of accumulated total platinum (T) and free cisplatin (C) (as ng Pt/mg protein)
vs. exposure doses for sensitive cell (above) and resistant cell (below)
In the Table 7, and Figure 14 the results showed that there was not significant differences in accumulation of free cisplatin between T298wt and T298DDP but there is difference in total platinum, especially at 2µM. Lower accumulation of total platinum in resistant cells is in line with previous observations whereas results for the accumulation of free cisplatin has not been previously reported.
Free cisplatin is believed to be taken up by passive diffusion whereas it can be hypothesized that the rest of platinum is taken up actively via membrane transport proteins. The fraction of free cisplatin increases with exposure dose (Table 7) suggesting reduced uptake efficiency by the “active” transport path ways at higher doses.
0
10
20
30
40
50
60
70
0 20 40 60 80 100 120
ng P
t/mg
prot
ein
Exposure doses (µM)
T298wt (t=0)
C
T
0
5
10
15
20
25
30
35
40
45
0 20 40 60 80 100 120
ng P
t/mg
prot
ein
Exposure doses (µM)
T298DDP (t=0)
C
T
23
Sensitive cisplatin (T298wt) malignant melanoma cells
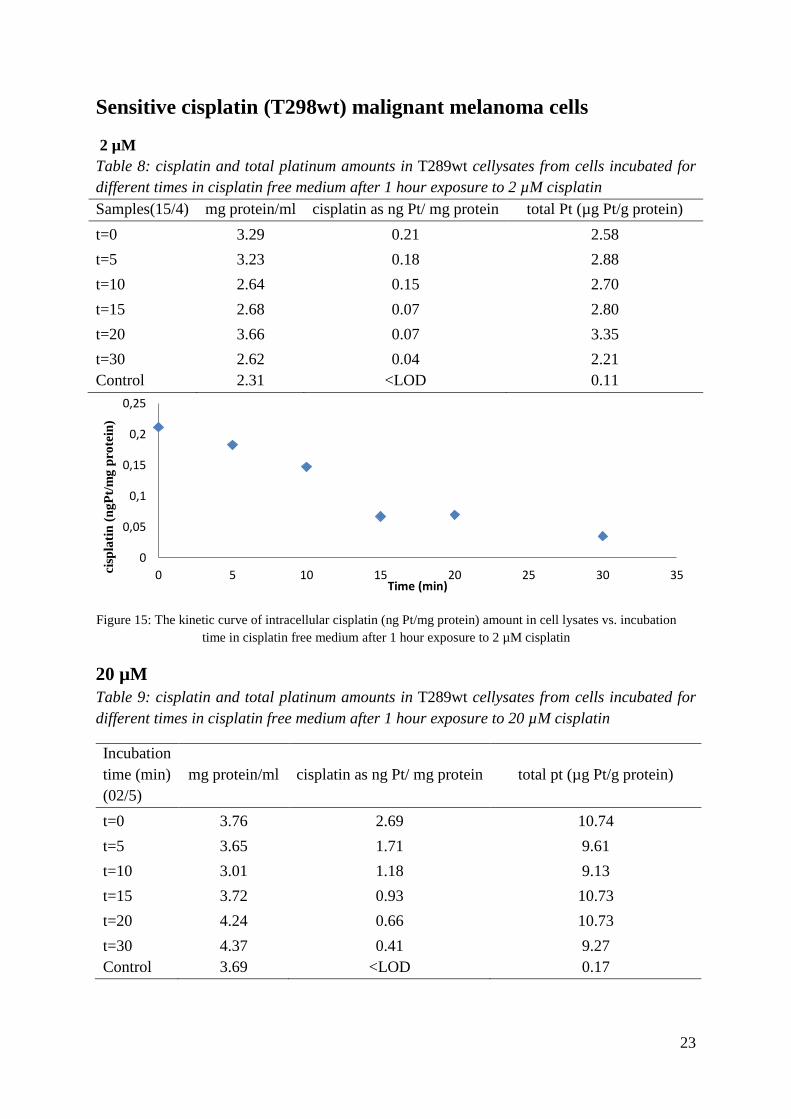
2 µM Table 8: cisplatin and total platinum amounts in T289wt cellysates from cells incubated for different times in cisplatin free medium after 1 hour exposure to 2 µM cisplatin Samples(15/4) mg protein/ml cisplatin as ng Pt/ mg protein total Pt (µg Pt/g protein) t=0 3.29 0.21 2.58 t=5 3.23 0.18 2.88 t=10 2.64 0.15 2.70 t=15 2.68 0.07 2.80 t=20 3.66 0.07 3.35 t=30 2.62 0.04 2.21 Control 2.31 <LOD 0.11
Figure 15: The kinetic curve of intracellular cisplatin (ng Pt/mg protein) amount in cell lysates vs. incubation time in cisplatin free medium after 1 hour exposure to 2 µM cisplatin
20 µM Table 9: cisplatin and total platinum amounts in T289wt cellysates from cells incubated for different times in cisplatin free medium after 1 hour exposure to 20 µM cisplatin
Incubation time (min) (02/5)
mg protein/ml cisplatin as ng Pt/ mg protein total pt (µg Pt/g protein)
t=0 3.76 2.69 10.74 t=5 3.65 1.71 9.61 t=10 3.01 1.18 9.13 t=15 3.72 0.93 10.73 t=20 4.24 0.66 10.73 t=30 4.37 0.41 9.27 Control 3.69 <LOD 0.17
0
0,05
0,1
0,15
0,2
0,25
0 5 10 15 20 25 30 35cisp
latin
(ngP
t/mg
prot
ein)
Time (min)
24
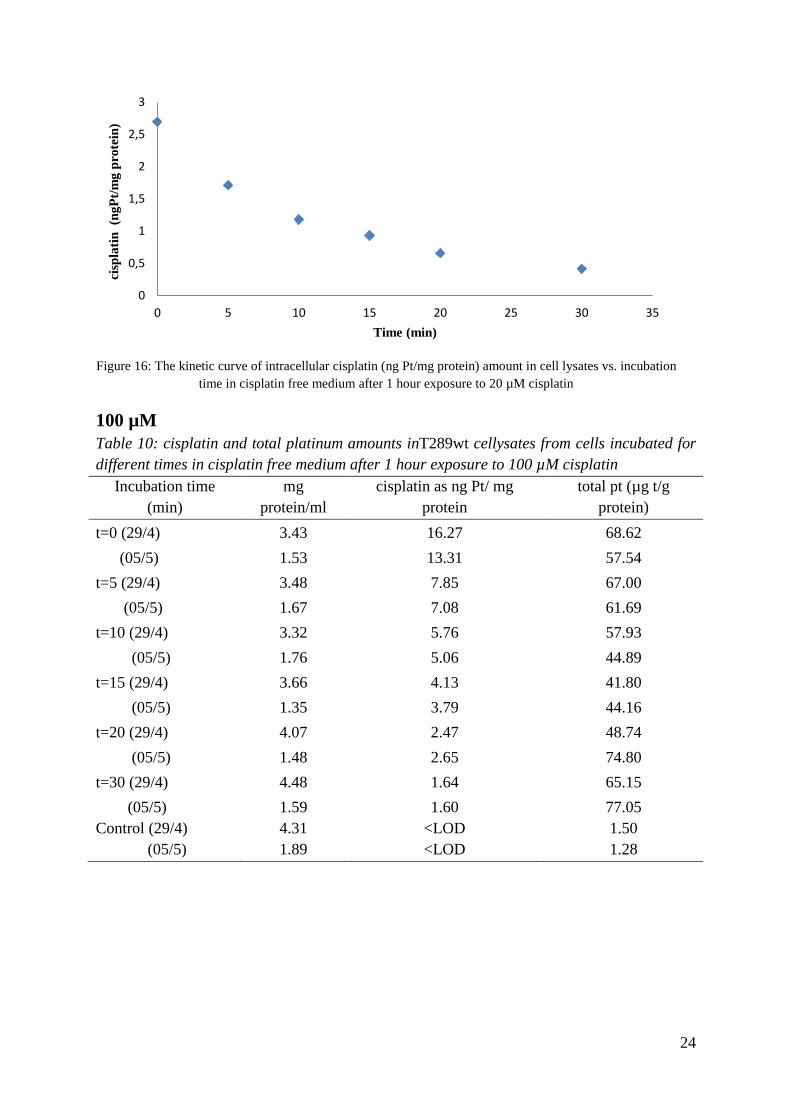
Figure 16: The kinetic curve of intracellular cisplatin (ng Pt/mg protein) amount in cell lysates vs. incubation
time in cisplatin free medium after 1 hour exposure to 20 µM cisplatin
100 µM Table 10: cisplatin and total platinum amounts inT289wt cellysates from cells incubated for different times in cisplatin free medium after 1 hour exposure to 100 µM cisplatin
Incubation time (min)
mg protein/ml
cisplatin as ng Pt/ mg protein
total pt (µg t/g protein)
t=0 (29/4) 3.43 16.27 68.62 (05/5) 1.53 13.31 57.54 t=5 (29/4) 3.48 7.85 67.00 (05/5) 1.67 7.08 61.69 t=10 (29/4) 3.32 5.76 57.93 (05/5) 1.76 5.06 44.89 t=15 (29/4) 3.66 4.13 41.80 (05/5) 1.35 3.79 44.16 t=20 (29/4) 4.07 2.47 48.74 (05/5) 1.48 2.65 74.80 t=30 (29/4) 4.48 1.64 65.15 (05/5) 1.59 1.60 77.05 Control (29/4) 4.31 <LOD 1.50 (05/5) 1.89 <LOD 1.28
0
0,5
1
1,5
2
2,5
3
0 5 10 15 20 25 30 35
cisp
latin
(ng
Pt/m
g pr
otei
n)
Time (min)
25
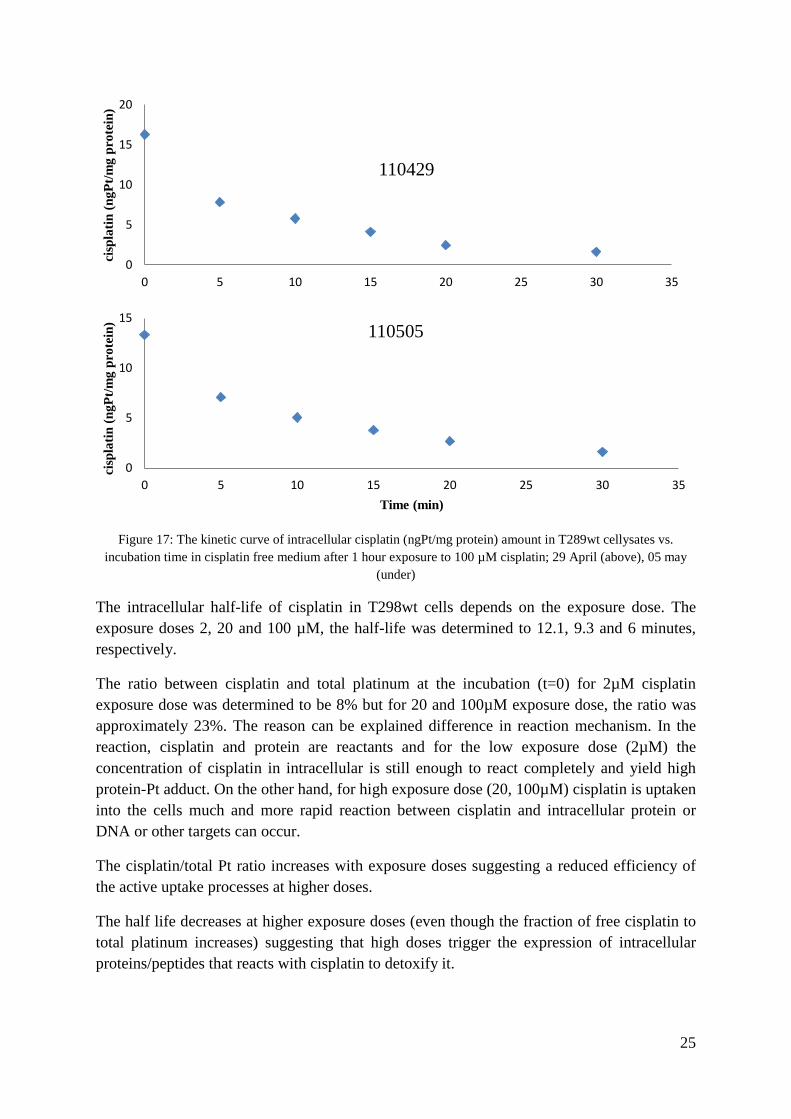
Figure 17: The kinetic curve of intracellular cisplatin (ngPt/mg protein) amount in T289wt cellysates vs. incubation time in cisplatin free medium after 1 hour exposure to 100 µM cisplatin; 29 April (above), 05 may
(under)
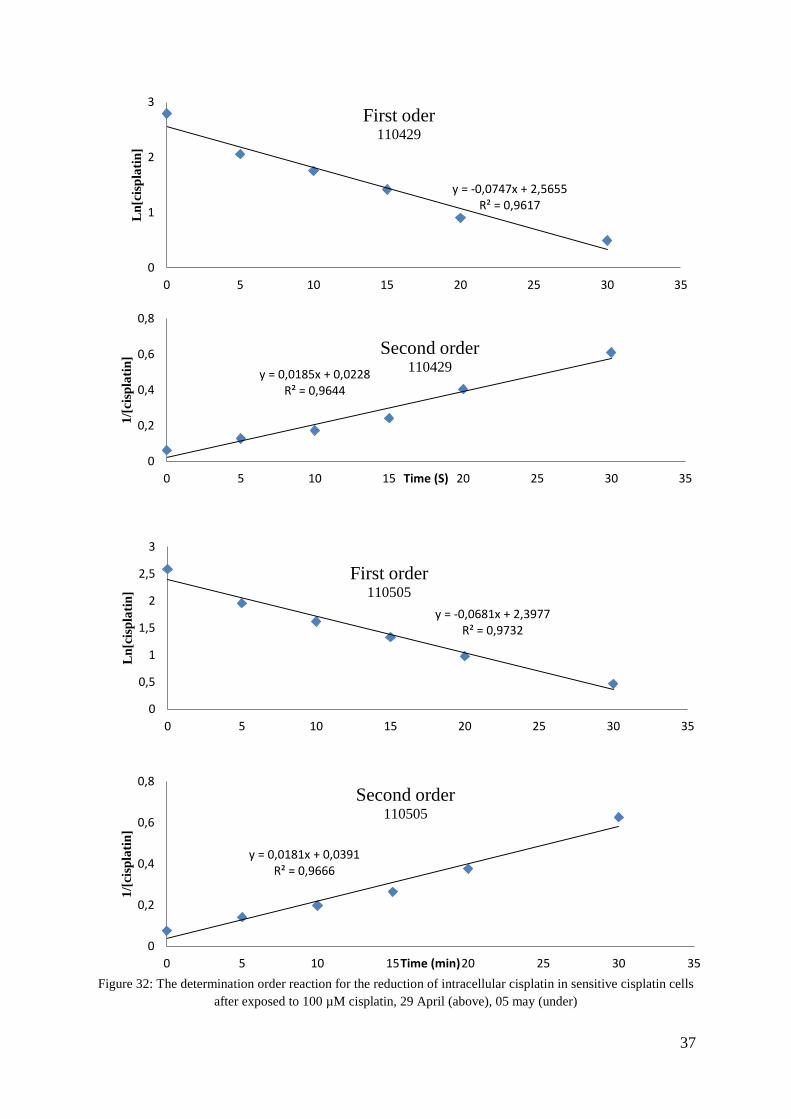
The intracellular half-life of cisplatin in T298wt cells depends on the exposure dose. The exposure doses 2, 20 and 100 µM, the half-life was determined to 12.1, 9.3 and 6 minutes, respectively.
The ratio between cisplatin and total platinum at the incubation (t=0) for 2µM cisplatin exposure dose was determined to be 8% but for 20 and 100µM exposure dose, the ratio was approximately 23%. The reason can be explained difference in reaction mechanism. In the reaction, cisplatin and protein are reactants and for the low exposure dose (2µM) the concentration of cisplatin in intracellular is still enough to react completely and yield high protein-Pt adduct. On the other hand, for high exposure dose (20, 100µM) cisplatin is uptaken into the cells much and more rapid reaction between cisplatin and intracellular protein or DNA or other targets can occur.
The cisplatin/total Pt ratio increases with exposure doses suggesting a reduced efficiency of the active uptake processes at higher doses.
The half life decreases at higher exposure doses (even though the fraction of free cisplatin to total platinum increases) suggesting that high doses trigger the expression of intracellular proteins/peptides that reacts with cisplatin to detoxify it.
0
5
10
15
20
0 5 10 15 20 25 30 35
cisp
latin
(ngP
t/mg
prot
ein)
110429
0
5
10
15
0 5 10 15 20 25 30 35
cisp
latin
(ngP
t/mg
prot
ein)
Time (min)
110505
26
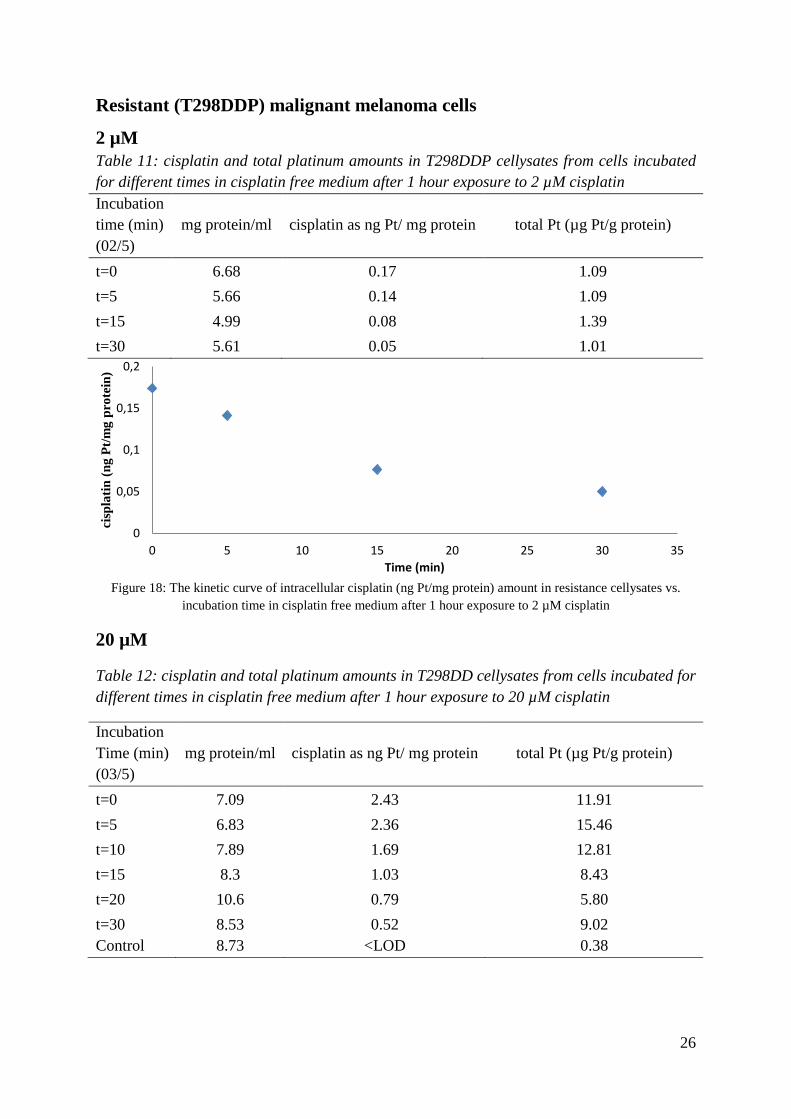
Resistant (T298DDP) malignant melanoma cells
2 µM Table 11: cisplatin and total platinum amounts in T298DDP cellysates from cells incubated for different times in cisplatin free medium after 1 hour exposure to 2 µM cisplatin Incubation time (min) (02/5)
mg protein/ml cisplatin as ng Pt/ mg protein total Pt (µg Pt/g protein)
t=0 6.68 0.17 1.09 t=5 5.66 0.14 1.09 t=15 4.99 0.08 1.39 t=30 5.61 0.05 1.01
Figure 18: The kinetic curve of intracellular cisplatin (ng Pt/mg protein) amount in resistance cellysates vs.
incubation time in cisplatin free medium after 1 hour exposure to 2 µM cisplatin
20 µM
Table 12: cisplatin and total platinum amounts in T298DD cellysates from cells incubated for different times in cisplatin free medium after 1 hour exposure to 20 µM cisplatin
Incubation Time (min) (03/5)
mg protein/ml cisplatin as ng Pt/ mg protein total Pt (µg Pt/g protein)
t=0 7.09 2.43 11.91 t=5 6.83 2.36 15.46 t=10 7.89 1.69 12.81 t=15 8.3 1.03 8.43 t=20 10.6 0.79 5.80 t=30 8.53 0.52 9.02 Control 8.73 <LOD 0.38
0
0,05
0,1
0,15
0,2
0 5 10 15 20 25 30 35
cisp
latin
(ng
Pt/m
g pr
otei
n)
Time (min)
27
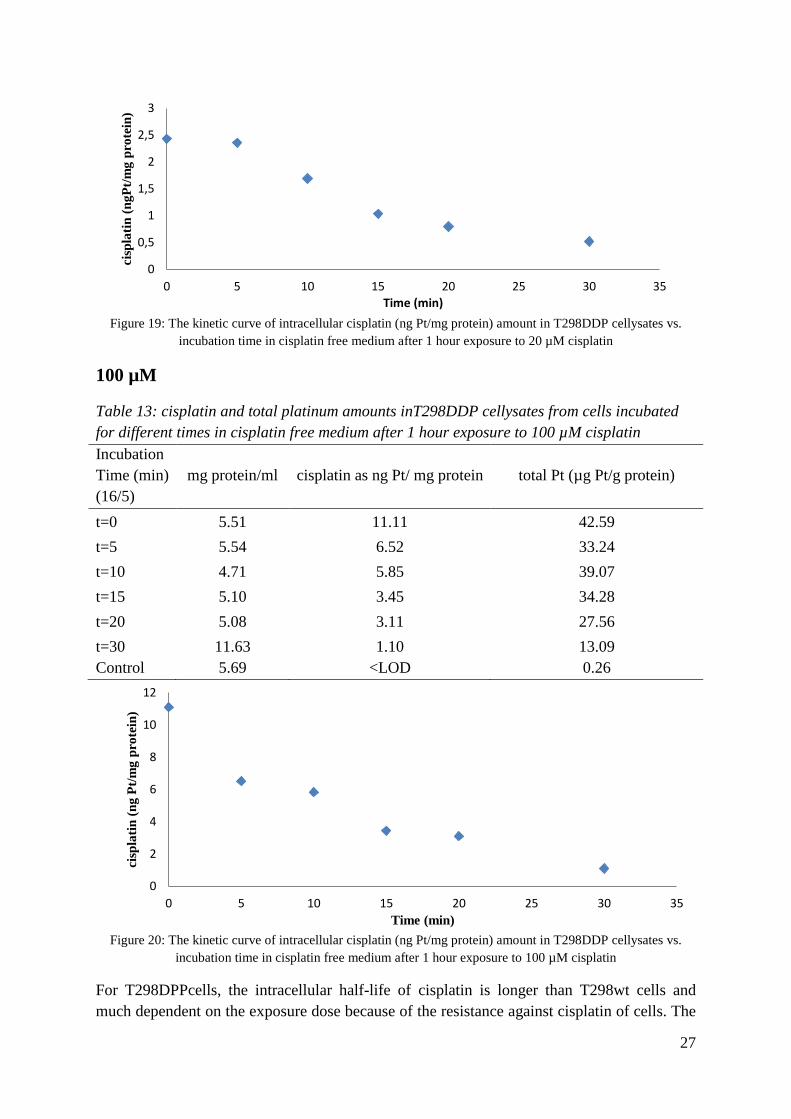
Figure 19: The kinetic curve of intracellular cisplatin (ng Pt/mg protein) amount in T298DDP cellysates vs.
incubation time in cisplatin free medium after 1 hour exposure to 20 µM cisplatin
100 µM
Table 13: cisplatin and total platinum amounts inT298DDP cellysates from cells incubated for different times in cisplatin free medium after 1 hour exposure to 100 µM cisplatin Incubation Time (min) (16/5)
mg protein/ml cisplatin as ng Pt/ mg protein total Pt (µg Pt/g protein)
t=0 5.51 11.11 42.59 t=5 5.54 6.52 33.24 t=10 4.71 5.85 39.07 t=15 5.10 3.45 34.28 t=20 5.08 3.11 27.56 t=30 11.63 1.10 13.09 Control 5.69 <LOD 0.26
Figure 20: The kinetic curve of intracellular cisplatin (ng Pt/mg protein) amount in T298DDP cellysates vs.
incubation time in cisplatin free medium after 1 hour exposure to 100 µM cisplatin
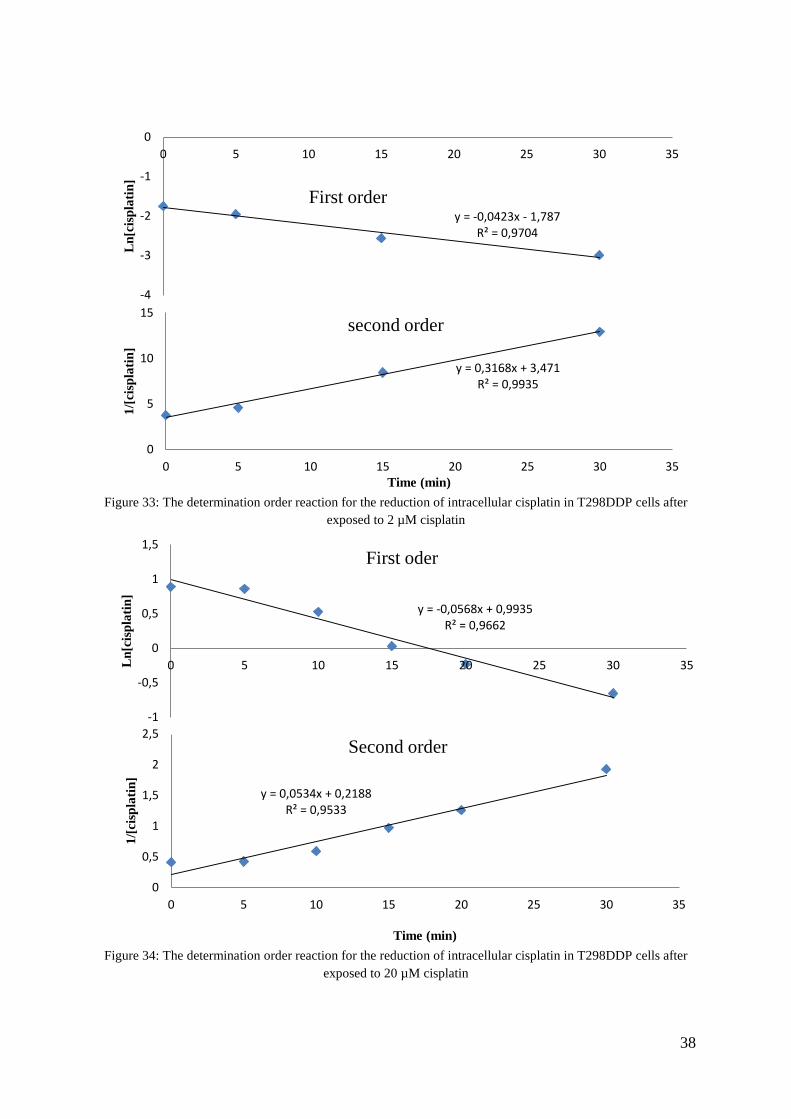
For T298DPPcells, the intracellular half-life of cisplatin is longer than T298wt cells and much dependent on the exposure dose because of the resistance against cisplatin of cells. The
0
0,5
1
1,5
2
2,5
3
0 5 10 15 20 25 30 35
cisp
latin
(ngP
t/mg
prot
ein)
Time (min)
0
2
4
6
8
10
12
0 5 10 15 20 25 30 35
cisp
latin
(ng
Pt/m
g pr
otei
n)
Time (min)
28
half-life was determined to 16, 14, and 10 minutes for 2, 20 and 100µM cisplatin exposure doses, respectively.
The ratio of cisplatin to total platinum in resistant cells with varying exposure doses not differ significantly from the sensitive cisplatin cells. For resistance cell sample was exposed to 2µM cisplatin, the ratio is determined to 15% not as low as sensitive cell 8%. However, for the higher exposure doses 20 and 100µM that ratio not much difference and were determined to 20% and 29%, respectively.
29
4. Conclusion This project was successful in the cisplatin method development work and in the determination of intracellular half life time of cisplatin in some type of malignant melanoma cells at different exposure doses.
The method showed low detection limit, good reproducibility and resolution for cisplatin. The low percentage of organic solvent in the eluent minimizes the risk for damage of the ICP instrument and ion lens. With the new method for cell lysis (ceramic bead) the speed of processing cell samples was minimized. Unfortunately, the cell samples could not be stabilized for a long time in the freezer so they should be analysed right away.
The metabolism of cisplatin intracellular is very complicated to follow. It is therefore difficult to determine exactly the reaction order of the reduction. The intracellular half-life of cisplatin depends on the type of cells and exposure doses and was found to be longer in the resistance cells compared with the sensitive cells.
More replicates of cell samples should be analysed next time to get more reliable results and continuously study the retention mechanism of cisplatin using zwitterionic columns.
Acknowledgments I would like to thank Erik Björn my supervisor, who has provided me the opportunity to finish my thesis and helped me during the project. I would like to thank Christina Lundin, who helped me to preparing the cell samples. I would like to thank Phuoc and Tobias for their suggestion about determination of cisplatin retention.
I would also like to thank Solomon and all staff at the chemistry faculty at Umea University for their supports. And finally, I would like to give my grateful to my family and my friends for their helping during the time I was living here.
30
Reference [1] M. Peyrone, Ann Chemie Pharm., 1844,51, (1): 1–29.
[2] B. Rosenberg, L. Vancamp, T. Krigas, Nature, 1965, 205,698.
[3] S. P. Fricker, 4904 Dalton Trans., 2007, 4903-4917
[4] M. D. Hall, M. Okabe, D-W. Shen, X-J.Liang, M. M. Gottesman, Annu. Rev. Pharmacol. Toxicol., 2008, 48, 495-535
[5] Y. Nygren, P. Hemström, C. Åstot, P. Naredi, E. Björn, J. Anal. At. Spectrom.,2008, 23, 948-954
[6] P. Hemström, Y. Nygren, E. Björn, K. Irgum, J. Sep. Sci., 2008, 31, 599-603
[7] E. de Hoffman, V. Strobant, Mass Spectrometry, 2007, 3 ed, Wily, England
[8] Alpert, A.J., J. Chromatogr.1990, 499, 177-196
[9] The novelty of zwitterionic stationary phases for HILIC, Sequant Company, 2006
[10] Edward F.Mc, K. D. Albright, Tamoxifen Modulation of Cisplatin Sensitivity in Human Malignant Melanoma Cells, University of Califonia, 1571-1576, April 1993.
[11]J. Urban, F. Svec, J. Chromotogr A., 2010, 1217, 8212-8221
[12] P. W. Atkins, physical chemistry, 5th edition, 1994
31
Appendix Optimization of LC
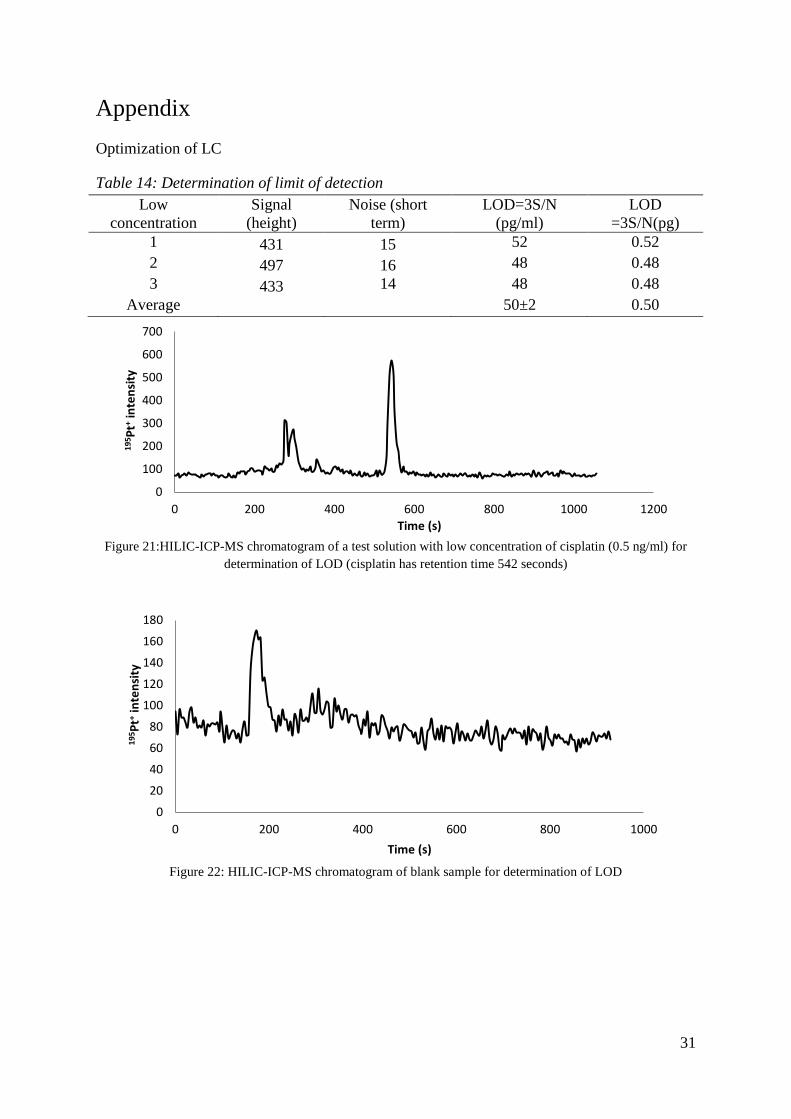
Table 14: Determination of limit of detection Low
concentration Signal
(height) Noise (short
term) LOD=3S/N
(pg/ml) LOD
=3S/N(pg) 1 431 15 52 0.52 2 497 16 48 0.48 3 433 14 48 0.48
Average 50±2 0.50
Figure 21:HILIC-ICP-MS chromatogram of a test solution with low concentration of cisplatin (0.5 ng/ml) for
determination of LOD (cisplatin has retention time 542 seconds)
Figure 22: HILIC-ICP-MS chromatogram of blank sample for determination of LOD
0
100
200
300
400
500
600
700
0 200 400 600 800 1000 1200
195 P
t+ int
ensi
ty
Time (s)
0
20
40
60
80
100
120
140
160
180
0 200 400 600 800 1000
195 P
t+ int
ensi
ty
Time (s)
32
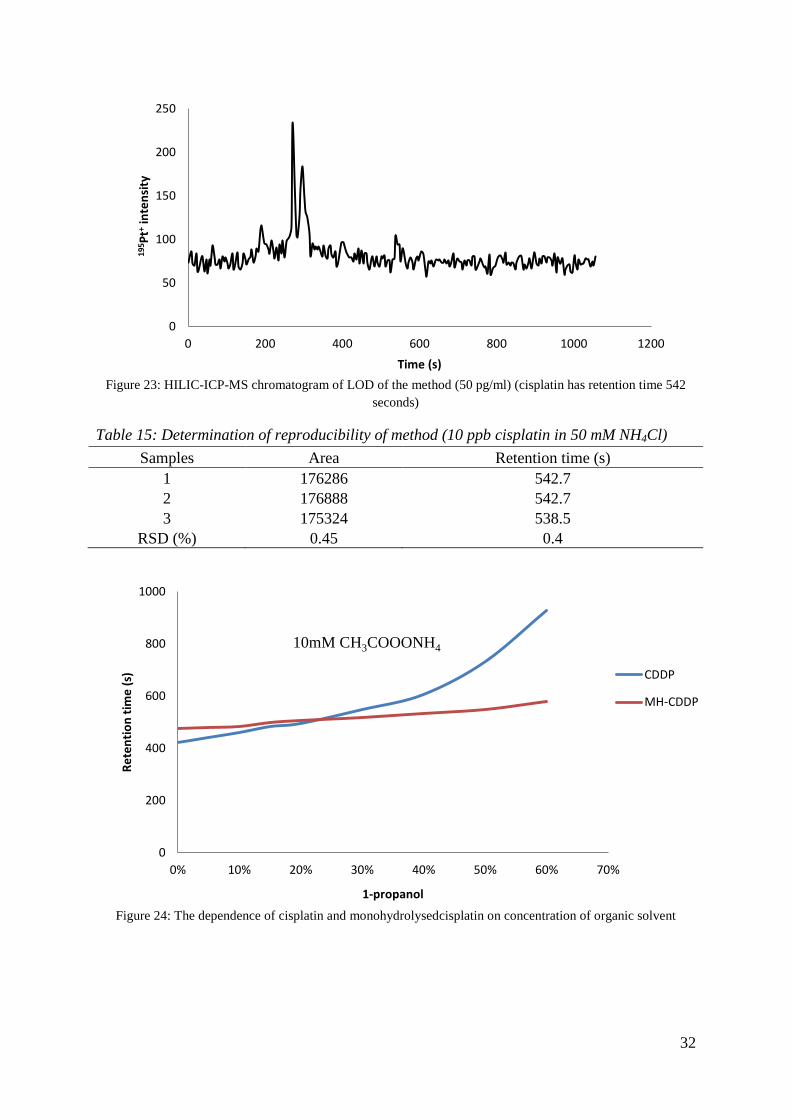
Figure 23: HILIC-ICP-MS chromatogram of LOD of the method (50 pg/ml) (cisplatin has retention time 542
seconds)
Table 15: Determination of reproducibility of method (10 ppb cisplatin in 50 mM NH4Cl) Samples Area Retention time (s)
1 176286 542.7 2 176888 542.7 3 175324 538.5
RSD (%) 0.45 0.4
Figure 24: The dependence of cisplatin and monohydrolysedcisplatin on concentration of organic solvent
0
50
100
150
200
250
0 200 400 600 800 1000 1200
195 P
t+ int
ensi
ty
Time (s)
0
200
400
600
800
1000
0% 10% 20% 30% 40% 50% 60% 70%
Rete
ntio
n tim
e (s
)
1-propanol
10mM CH3COOONH4
CDDP
MH-CDDP
33
Figure 25: The dependent of cisplatin and monohydrolysedcisplatin on concentration of salt
Figure 26: The logarithm of the retention factor vs. reciprocal temperature of cisplatin with the low percentage
of 1-propanol (2.5%) and 5mM CH3COONH4 in the eluent
Figure 27: The logarithm of the retention factor vs. reciprocal temperature of cispltin with the high percentage
of 1-propanol (60%) and 5mM CH3COONH4 in the eluent
0
100
200
300
400
500
600
0 5 10 15 20 25 30 35
Rete
ntio
n tim
e (S
)
Concentration of CH3COONH4 (mM)
20% 1-propanol
CDDP
MH-CDDP
y = 1371,4x - 3,7981 R² = 0,9965
0,5
0,55
0,6
0,65
0,7
0,75
0,8
0,85
0,9
0,95
0,00315 0,0032 0,00325 0,0033 0,00335 0,0034 0,00345
LnK'
1/T
cisplatin
y = 1465,2x - 3,4573 R² = 0,987
0,9
1
1,1
1,2
1,3
1,4
1,5
1,6
0,0031 0,00315 0,0032 0,00325 0,0033 0,00335 0,0034 0,00345
LnK'
1/T
cisplatin
34
Figure 28: The logarithm of the retention factor vs. reciprocal temperature of monohydrolysed cisplatin with the
low percentage of 1-propanol (2.5%) and 5mM CH3COONH4 in the eluent
Figure 29: The logarithm of the retention factor vs. reciprocal temperature of monohydrolysed cisplatin with the
high percentage of 1-propanol (60%) and 5mM CH3COONH4 in the eluent.
y = 1985,5x - 4,728 R² = 0,9935
1,5
1,6
1,7
1,8
1,9
2
2,1
0,00315 0,0032 0,00325 0,0033 0,00335 0,0034 0,00345
LnK'
1/T
MH-CDDP
y = 1996,7x - 5,1082 R² = 0,9681
1
1,1
1,2
1,3
1,4
1,5
1,6
1,7
1,8
0,0031 0,00315 0,0032 0,00325 0,0033 0,00335 0,0034 0,00345
LnK'
1/T
MH-CDDP
35
Table 16: Standard correction 5ppb in 2.5%1-propanol
Cisplatin Intensity Platinum Intensity Mcis/Pt Recalculation Relative sensitivity (%)
1 29150 1 43469 1.54 2 30095 2 41085 3 24757 3 42534
Average 28001 42362 27508 101
5ppb in 1% HCl Cisplatin Intensity Platinum Intensity Mcis/Pt Recalculation Relative
sensitivity (%) 1 15710 1 23403 1.54 2 15952 2 23992
Average 15831 23698 15388 103
5ppb in water Cisplatin Intensity Platinum Intensity Mcis/Pt Recalculation Relative
sensitivity (%) 1 14803 1 16611 1.54 2 13639 2 18143 3 14353 3 19494
Average 14265 18083 11742 121
Figure 30: The determination order reaction for the reduction of intracellular cisplatin in sensitive cisplatin cells
after exposed to 2 µM cisplatin
y = -0,0632x - 1,47 R² = 0,9452
-4
-3
-2
-1
00 5 10 15 20 25 30 35
Ln[
cisp
latin
] First oder
y = 0,7975x + 1,8235 R² = 0,9057
0
10
20
30
0 5 10 15 20 25 30 35
1/[c
ispla
tin]
Time (min)
sencond oder
36
Figure 31: The determination order reaction for the reduction of intracellular cisplatin in sensitive cisplatin cells
after exposed to 20 µM cisplatin
y = -0,0615x + 0,8741 R² = 0,9844
-1,5
-1
-0,5
0
0,5
1
1,5
0 5 10 15 20 25 30 35
Ln[
cisp
latin
] First order
y = 0,068x + 0,2299 R² = 0,9699
0
0,5
1
1,5
2
2,5
3
0 5 10 15 20 25 30 35
1/[c
ispl
atin
]
Time (min)
second order
37
Figure 32: The determination order reaction for the reduction of intracellular cisplatin in sensitive cisplatin cells
after exposed to 100 µM cisplatin, 29 April (above), 05 may (under)
y = -0,0747x + 2,5655 R² = 0,9617
0
1
2
3
0 5 10 15 20 25 30 35
Ln[
cisp
latin
] First oder
110429
y = 0,0185x + 0,0228 R² = 0,9644
0
0,2
0,4
0,6
0,8
0 5 10 15 20 25 30 35
1/[c
ispl
atin
]
Time (S)
Second order 110429
y = -0,0681x + 2,3977 R² = 0,9732
0
0,5
1
1,5
2
2,5
3
0 5 10 15 20 25 30 35
Ln[
cisp
latin
]
First order 110505
y = 0,0181x + 0,0391 R² = 0,9666
0
0,2
0,4
0,6
0,8
0 5 10 15 20 25 30 35
1/[c
ispla
tin]
Time (min)
Second order 110505
38
Figure 33: The determination order reaction for the reduction of intracellular cisplatin in T298DDP cells after
exposed to 2 µM cisplatin
Figure 34: The determination order reaction for the reduction of intracellular cisplatin in T298DDP cells after
exposed to 20 µM cisplatin
y = -0,0423x - 1,787 R² = 0,9704
-4
-3
-2
-1
00 5 10 15 20 25 30 35
Ln[
cisp
latin
]
First order
y = 0,3168x + 3,471 R² = 0,9935
0
5
10
15
0 5 10 15 20 25 30 35
1/[c
ispl
atin
]
Time (min)
second order
y = 0,0534x + 0,2188 R² = 0,9533
0
0,5
1
1,5
2
2,5
0 5 10 15 20 25 30 35
1/[c
ispla
tin]
Time (min)
Second order
y = -0,0568x + 0,9935 R² = 0,9662
-1
-0,5
0
0,5
1
1,5
0 5 10 15 20 25 30 35Ln[
cisp
latin
]
First oder
39
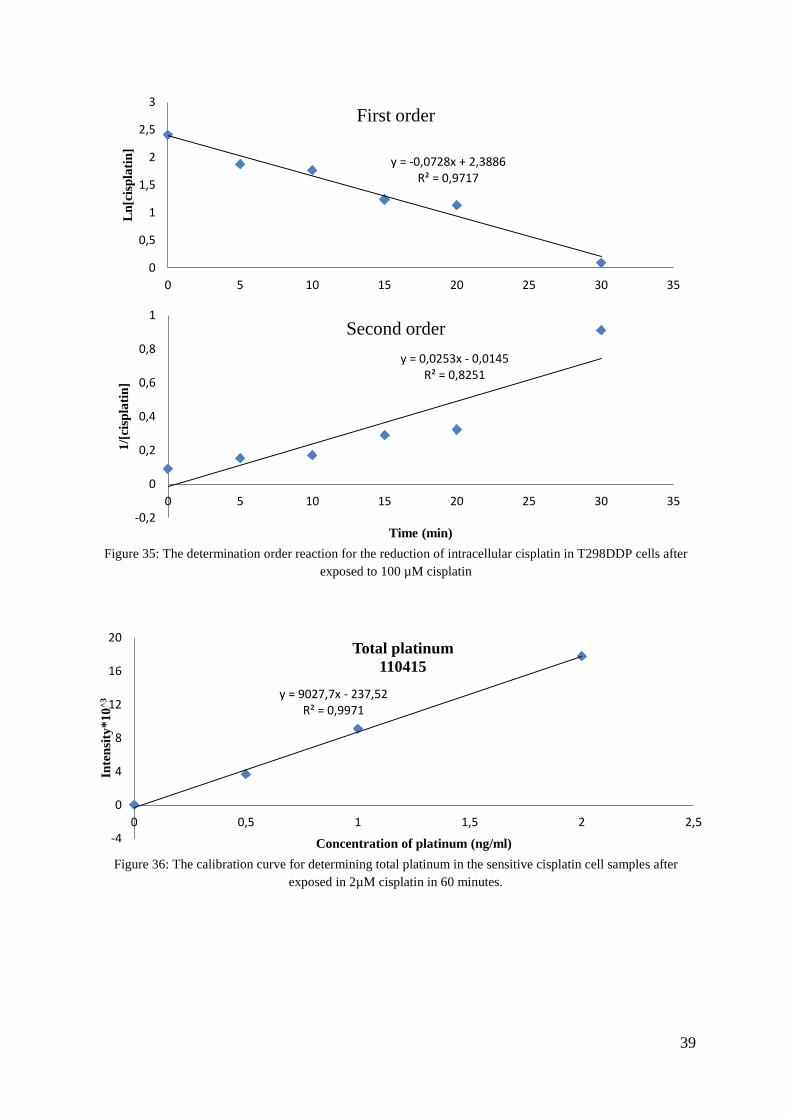
Figure 35: The determination order reaction for the reduction of intracellular cisplatin in T298DDP cells after
exposed to 100 µM cisplatin
Figure 36: The calibration curve for determining total platinum in the sensitive cisplatin cell samples after
exposed in 2µM cisplatin in 60 minutes.
y = -0,0728x + 2,3886 R² = 0,9717
0
0,5
1
1,5
2
2,5
3
0 5 10 15 20 25 30 35
Ln[
cisp
latin
] First order
y = 0,0253x - 0,0145 R² = 0,8251
-0,2
0
0,2
0,4
0,6
0,8
1
0 5 10 15 20 25 30 35
1/[c
ispl
atin
]
Time (min)
Second order
y = 9027,7x - 237,52 R² = 0,9971
-4
0
4
8
12
16
20
0 0,5 1 1,5 2 2,5
Inte
nsity
*10^3
Concentration of platinum (ng/ml)
Total platinum 110415
40
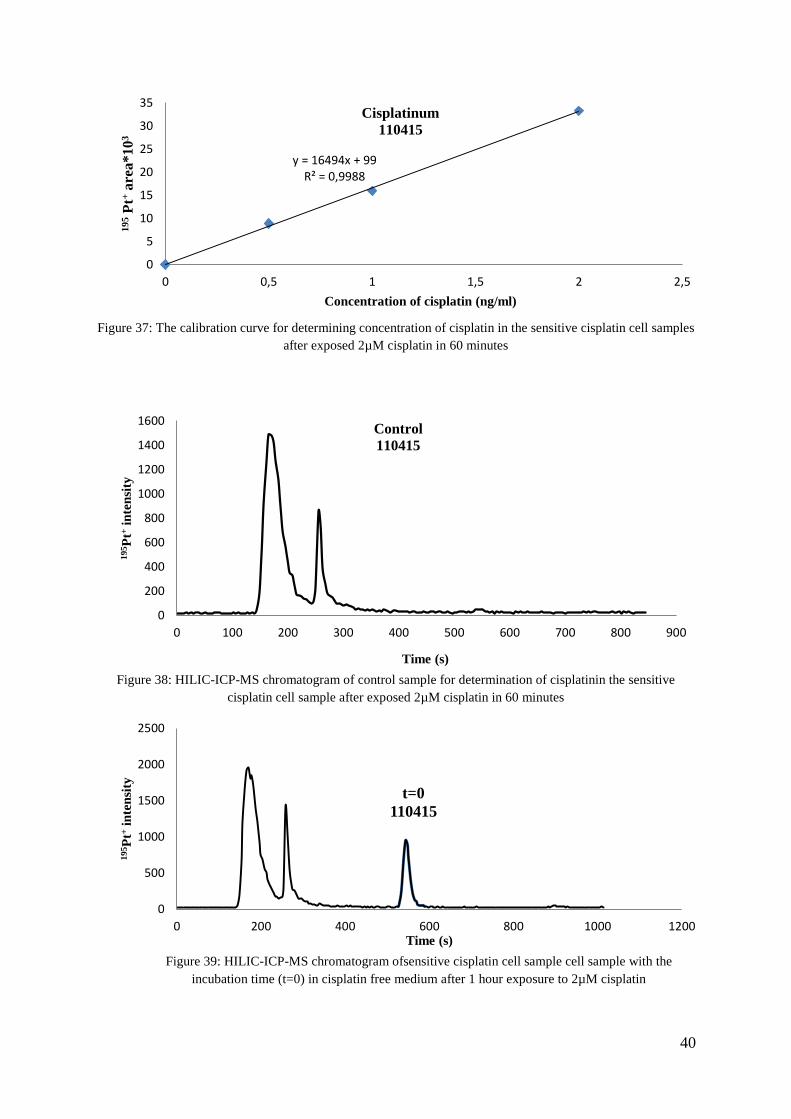
Figure 37: The calibration curve for determining concentration of cisplatin in the sensitive cisplatin cell samples after exposed 2µM cisplatin in 60 minutes
Figure 38: HILIC-ICP-MS chromatogram of control sample for determination of cisplatinin the sensitive
cisplatin cell sample after exposed 2µM cisplatin in 60 minutes
Figure 39: HILIC-ICP-MS chromatogram ofsensitive cisplatin cell sample cell sample with the
incubation time (t=0) in cisplatin free medium after 1 hour exposure to 2µM cisplatin
y = 16494x + 99 R² = 0,9988
0
5
10
15
20
25
30
35
0 0,5 1 1,5 2 2,5
195 P
t+ are
a*10
3
Concentration of cisplatin (ng/ml)
Cisplatinum 110415
0
200
400
600
800
1000
1200
1400
1600
0 100 200 300 400 500 600 700 800 900
195 P
t+ int
ensit
y
Time (s)
Control 110415
0
500
1000
1500
2000
2500
0 200 400 600 800 1000 1200
195 P
t+ int
ensi
ty
Time (s)
t=0 110415
41
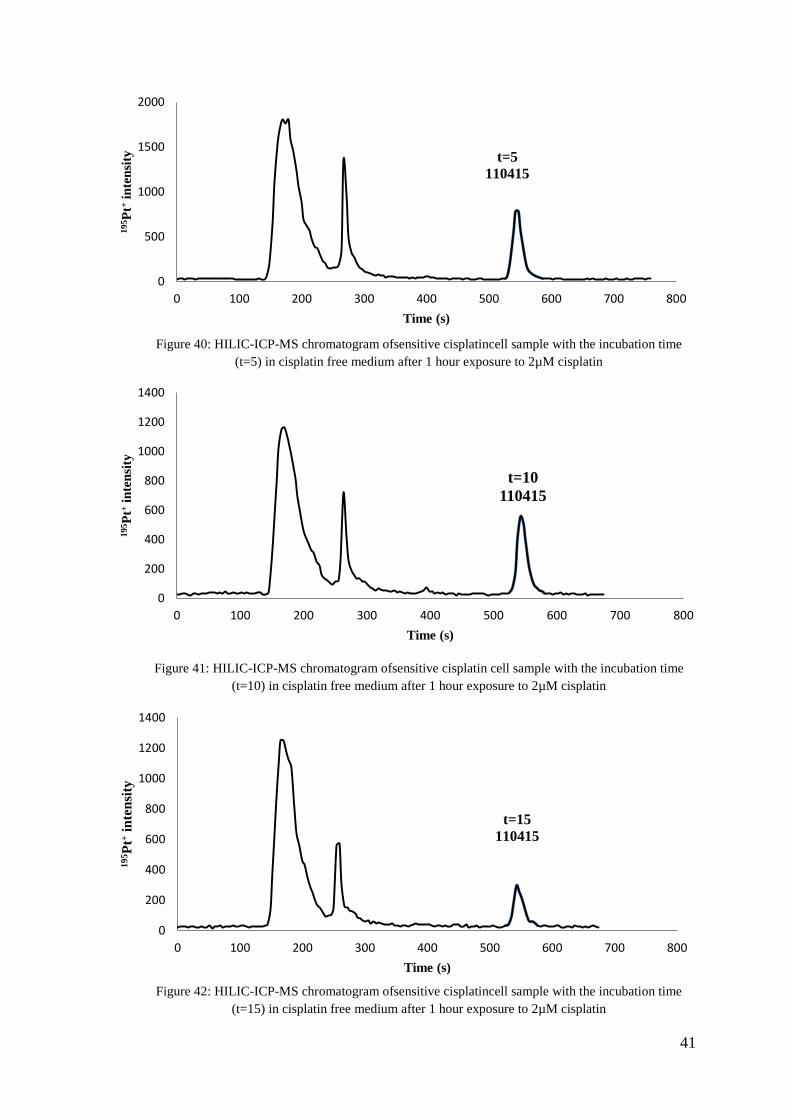
Figure 40: HILIC-ICP-MS chromatogram ofsensitive cisplatincell sample with the incubation time
(t=5) in cisplatin free medium after 1 hour exposure to 2µM cisplatin
Figure 41: HILIC-ICP-MS chromatogram ofsensitive cisplatin cell sample with the incubation time
(t=10) in cisplatin free medium after 1 hour exposure to 2µM cisplatin
Figure 42: HILIC-ICP-MS chromatogram ofsensitive cisplatincell sample with the incubation time
(t=15) in cisplatin free medium after 1 hour exposure to 2µM cisplatin
0
500
1000
1500
2000
0 100 200 300 400 500 600 700 800
195 P
t+ int
ensit
y
Time (s)
t=5 110415
0
200
400
600
800
1000
1200
1400
0 100 200 300 400 500 600 700 800
195 P
t+ int
ensit
y
Time (s)
t=10 110415
0
200
400
600
800
1000
1200
1400
0 100 200 300 400 500 600 700 800
195 P
t+ int
ensit
y
Time (s)
t=15 110415
42
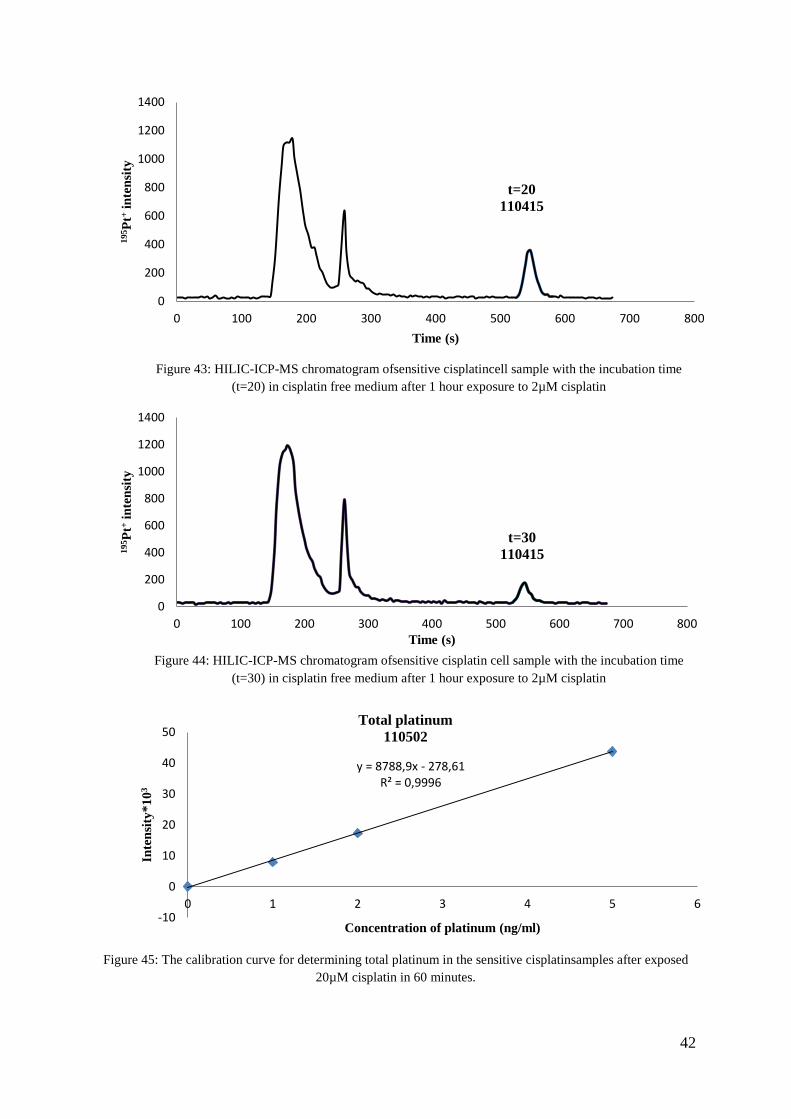
Figure 43: HILIC-ICP-MS chromatogram ofsensitive cisplatincell sample with the incubation time
(t=20) in cisplatin free medium after 1 hour exposure to 2µM cisplatin
Figure 44: HILIC-ICP-MS chromatogram ofsensitive cisplatin cell sample with the incubation time
(t=30) in cisplatin free medium after 1 hour exposure to 2µM cisplatin
Figure 45: The calibration curve for determining total platinum in the sensitive cisplatinsamples after exposed
20µM cisplatin in 60 minutes.
0
200
400
600
800
1000
1200
1400
0 100 200 300 400 500 600 700 800
195 P
t+ int
ensit
y
Time (s)
t=20 110415
0
200
400
600
800
1000
1200
1400
0 100 200 300 400 500 600 700 800
195 P
t+ int
ensit
y
Time (s)
t=30 110415
y = 8788,9x - 278,61 R² = 0,9996
-10
0
10
20
30
40
50
0 1 2 3 4 5 6
Inte
nsity
*103
Concentration of platinum (ng/ml)
Total platinum 110502
43
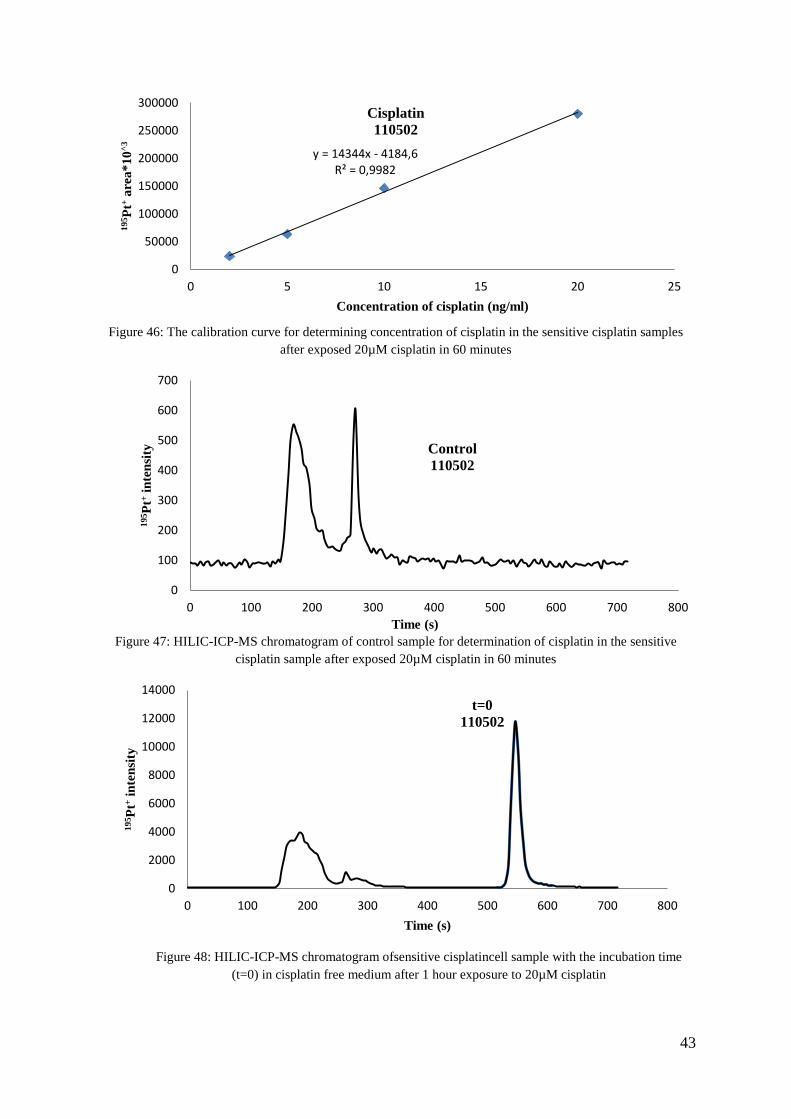
Figure 46: The calibration curve for determining concentration of cisplatin in the sensitive cisplatin samples
after exposed 20µM cisplatin in 60 minutes
Figure 47: HILIC-ICP-MS chromatogram of control sample for determination of cisplatin in the sensitive cisplatin sample after exposed 20µM cisplatin in 60 minutes
Figure 48: HILIC-ICP-MS chromatogram ofsensitive cisplatincell sample with the incubation time
(t=0) in cisplatin free medium after 1 hour exposure to 20µM cisplatin
y = 14344x - 4184,6 R² = 0,9982
0
50000
100000
150000
200000
250000
300000
0 5 10 15 20 25
195 P
t+ are
a*10
^3
Concentration of cisplatin (ng/ml)
Cisplatin 110502
0
100
200
300
400
500
600
700
0 100 200 300 400 500 600 700 800
195 P
t+ int
ensit
y
Time (s)
Control 110502
0
2000
4000
6000
8000
10000
12000
14000
0 100 200 300 400 500 600 700 800
195 P
t+ int
ensit
y
Time (s)
t=0 110502
44
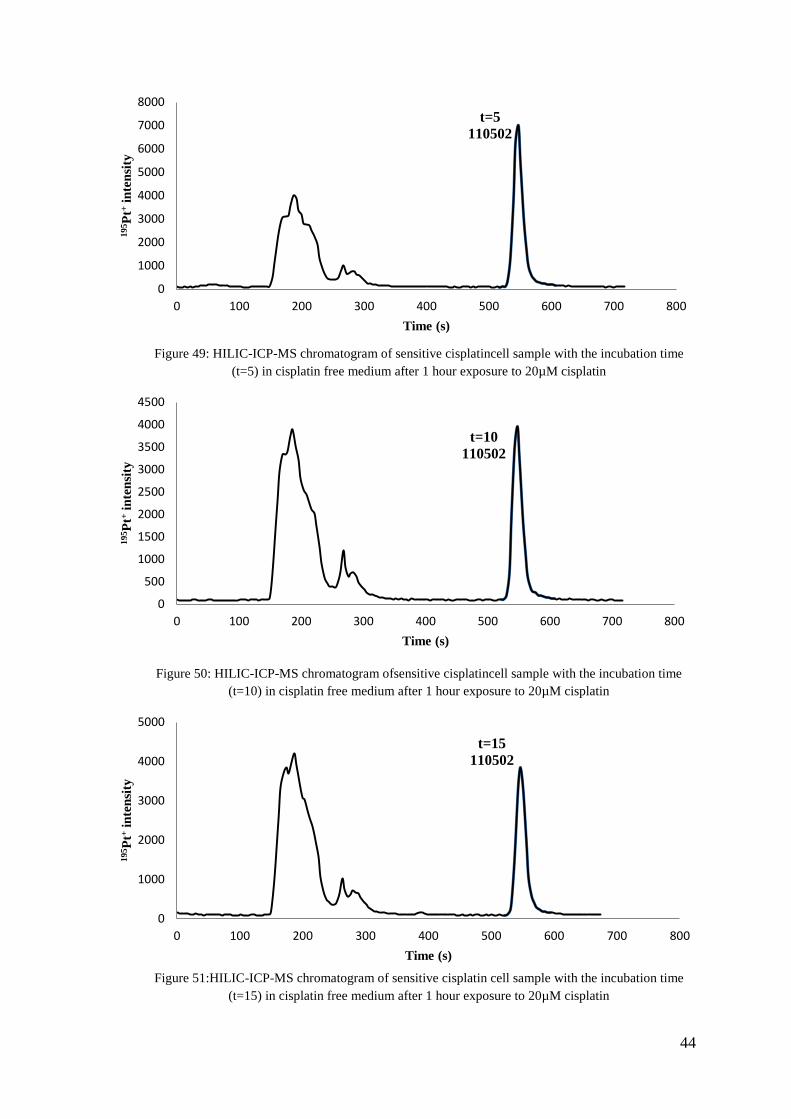
Figure 49: HILIC-ICP-MS chromatogram of sensitive cisplatincell sample with the incubation time
(t=5) in cisplatin free medium after 1 hour exposure to 20µM cisplatin
Figure 50: HILIC-ICP-MS chromatogram ofsensitive cisplatincell sample with the incubation time
(t=10) in cisplatin free medium after 1 hour exposure to 20µM cisplatin
Figure 51:HILIC-ICP-MS chromatogram of sensitive cisplatin cell sample with the incubation time
(t=15) in cisplatin free medium after 1 hour exposure to 20µM cisplatin
0
1000
2000
3000
4000
5000
6000
7000
8000
0 100 200 300 400 500 600 700 800
195 P
t+ int
ensit
y
Time (s)
t=5 110502
0
500
1000
1500
2000
2500
3000
3500
4000
4500
0 100 200 300 400 500 600 700 800
195 P
t+ int
ensit
y
Time (s)
t=10 110502
0
1000
2000
3000
4000
5000
0 100 200 300 400 500 600 700 800
195 P
t+ int
ensit
y
Time (s)
t=15 110502
45
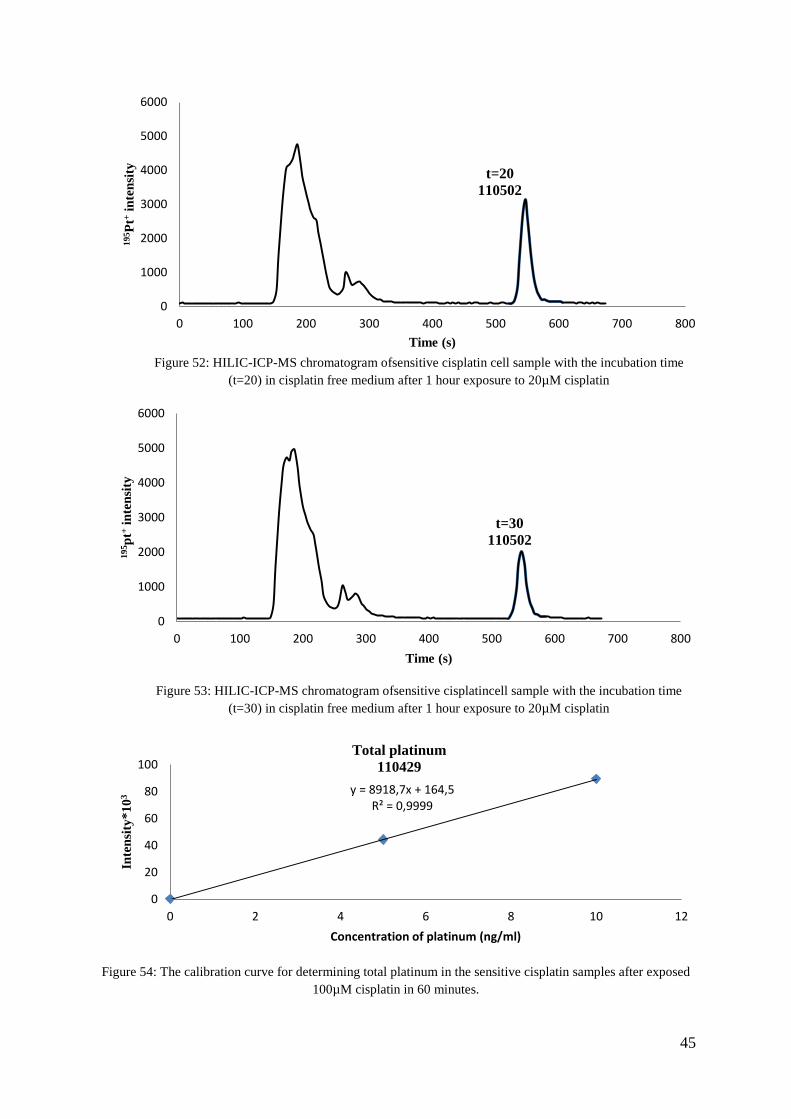
Figure 52: HILIC-ICP-MS chromatogram ofsensitive cisplatin cell sample with the incubation time
(t=20) in cisplatin free medium after 1 hour exposure to 20µM cisplatin
Figure 53: HILIC-ICP-MS chromatogram ofsensitive cisplatincell sample with the incubation time
(t=30) in cisplatin free medium after 1 hour exposure to 20µM cisplatin
Figure 54: The calibration curve for determining total platinum in the sensitive cisplatin samples after exposed
100µM cisplatin in 60 minutes.
0
1000
2000
3000
4000
5000
6000
0 100 200 300 400 500 600 700 800
195 P
t+ int
ensit
y
Time (s)
t=20 110502
0
1000
2000
3000
4000
5000
6000
0 100 200 300 400 500 600 700 800
195 p
t+ int
ensit
y
Time (s)
t=30 110502
y = 8918,7x + 164,5 R² = 0,9999
0
20
40
60
80
100
0 2 4 6 8 10 12
Inte
nsity
*103
Concentration of platinum (ng/ml)
Total platinum 110429
46
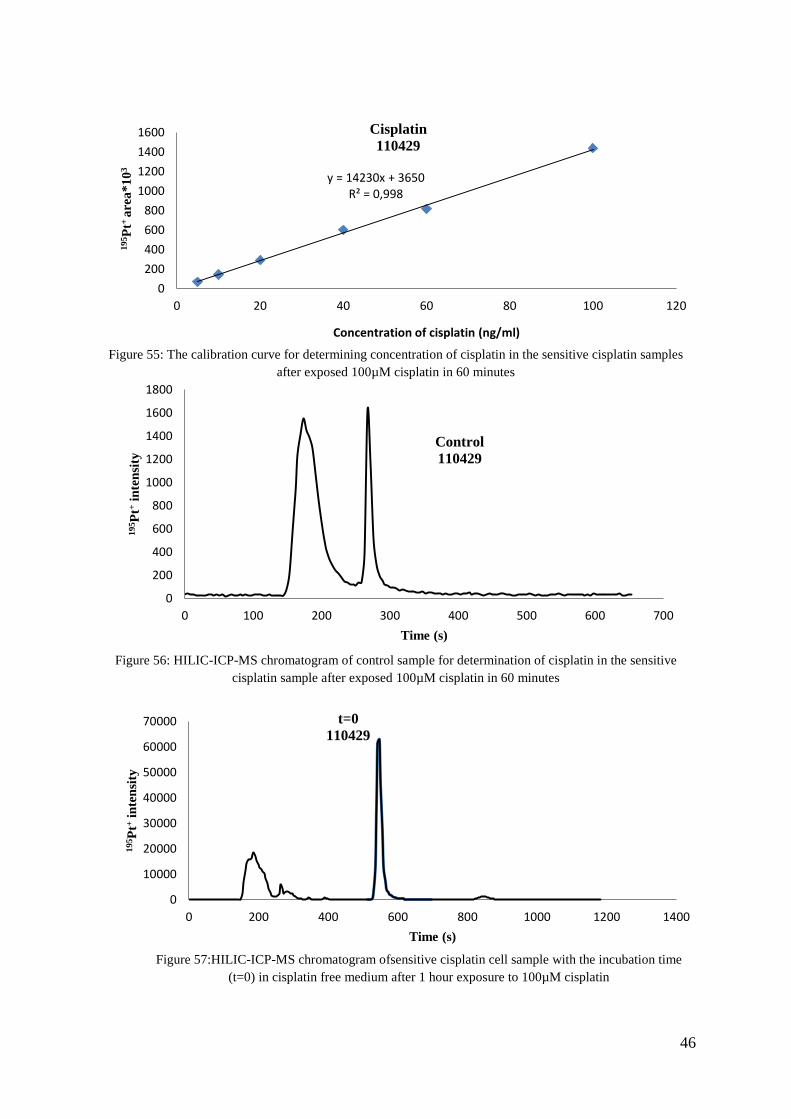
Figure 55: The calibration curve for determining concentration of cisplatin in the sensitive cisplatin samples
after exposed 100µM cisplatin in 60 minutes
Figure 56: HILIC-ICP-MS chromatogram of control sample for determination of cisplatin in the sensitive
cisplatin sample after exposed 100µM cisplatin in 60 minutes
Figure 57:HILIC-ICP-MS chromatogram ofsensitive cisplatin cell sample with the incubation time
(t=0) in cisplatin free medium after 1 hour exposure to 100µM cisplatin
y = 14230x + 3650 R² = 0,998
0200400600800
1000120014001600
0 20 40 60 80 100 120
195 P
t+ ar
ea*1
03
Concentration of cisplatin (ng/ml)
Cisplatin 110429
0
200
400
600
800
1000
1200
1400
1600
1800
0 100 200 300 400 500 600 700
195 P
t+ int
ensit
y
Time (s)
Control 110429
0
10000
20000
30000
40000
50000
60000
70000
0 200 400 600 800 1000 1200 1400
195 P
t+ int
ensit
y
Time (s)
t=0 110429
47
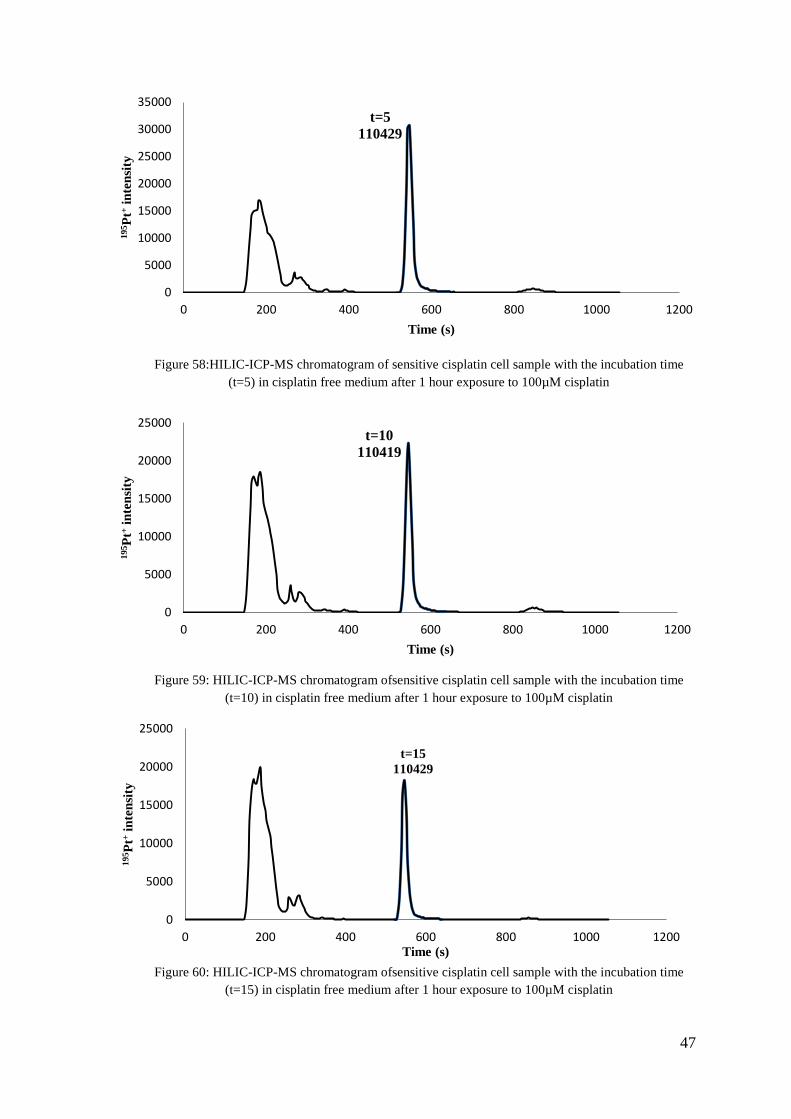
Figure 58:HILIC-ICP-MS chromatogram of sensitive cisplatin cell sample with the incubation time
(t=5) in cisplatin free medium after 1 hour exposure to 100µM cisplatin
Figure 59: HILIC-ICP-MS chromatogram ofsensitive cisplatin cell sample with the incubation time
(t=10) in cisplatin free medium after 1 hour exposure to 100µM cisplatin
Figure 60: HILIC-ICP-MS chromatogram ofsensitive cisplatin cell sample with the incubation time
(t=15) in cisplatin free medium after 1 hour exposure to 100µM cisplatin
0
5000
10000
15000
20000
25000
30000
35000
0 200 400 600 800 1000 1200
195 P
t+ int
ensit
y
Time (s)
t=5 110429
0
5000
10000
15000
20000
25000
0 200 400 600 800 1000 1200
195 P
t+ int
ensit
y
Time (s)
t=10 110419
0
5000
10000
15000
20000
25000
0 200 400 600 800 1000 1200
195 P
t+ int
ensi
ty
Time (s)
t=15 110429
48
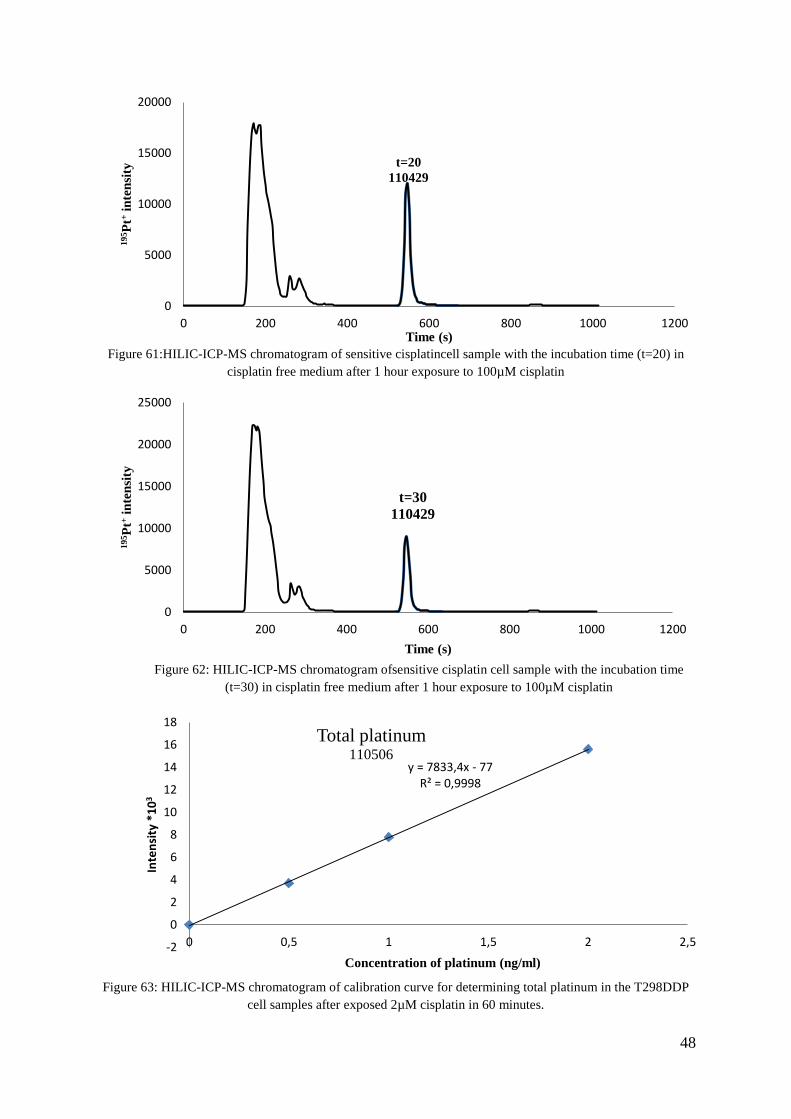
Figure 61:HILIC-ICP-MS chromatogram of sensitive cisplatincell sample with the incubation time (t=20) in cisplatin free medium after 1 hour exposure to 100µM cisplatin
Figure 62: HILIC-ICP-MS chromatogram ofsensitive cisplatin cell sample with the incubation time
(t=30) in cisplatin free medium after 1 hour exposure to 100µM cisplatin
Figure 63: HILIC-ICP-MS chromatogram of calibration curve for determining total platinum in the T298DDP
cell samples after exposed 2µM cisplatin in 60 minutes.
0
5000
10000
15000
20000
0 200 400 600 800 1000 1200
195 P
t+ int
ensit
y
Time (s)
t=20 110429
0
5000
10000
15000
20000
25000
0 200 400 600 800 1000 1200
195 P
t+ int
ensit
y
Time (s)
t=30 110429
y = 7833,4x - 77 R² = 0,9998
-2
0
2
4
6
8
10
12
14
16
18
0 0,5 1 1,5 2 2,5
Inte
nsity
*10
3
Concentration of platinum (ng/ml)
Total platinum 110506
49
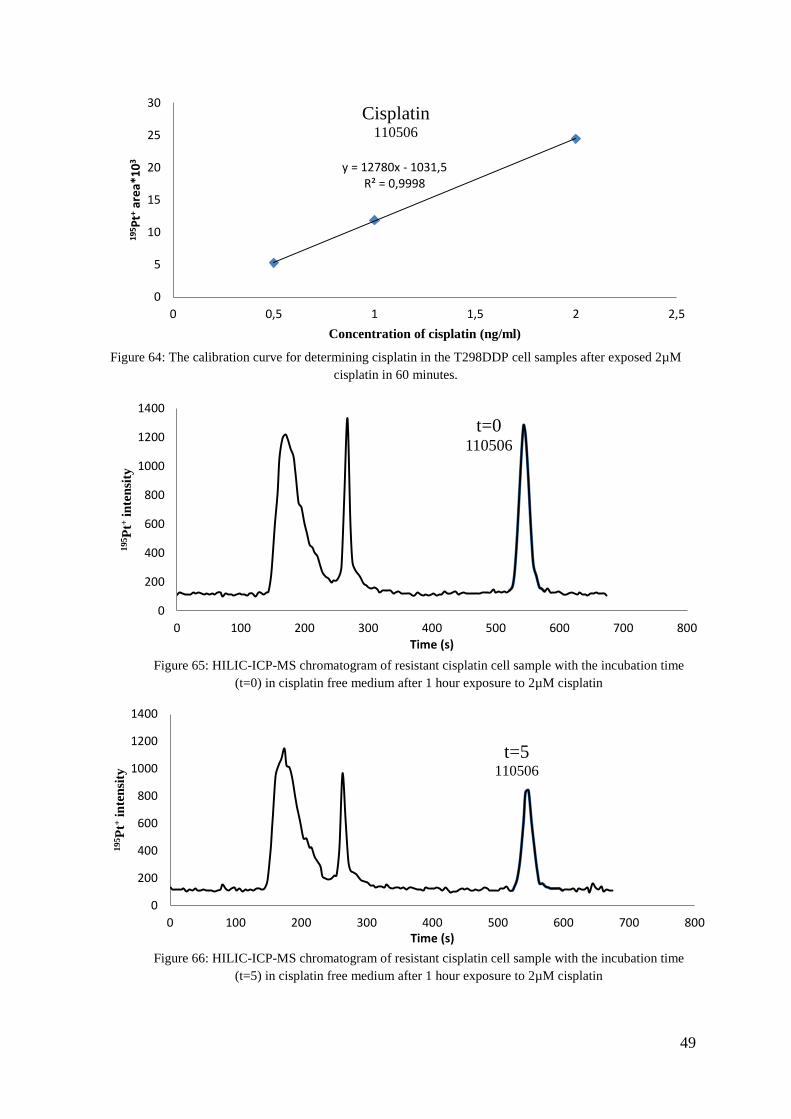
Figure 64: The calibration curve for determining cisplatin in the T298DDP cell samples after exposed 2µM
cisplatin in 60 minutes.
Figure 65: HILIC-ICP-MS chromatogram of resistant cisplatin cell sample with the incubation time
(t=0) in cisplatin free medium after 1 hour exposure to 2µM cisplatin
Figure 66: HILIC-ICP-MS chromatogram of resistant cisplatin cell sample with the incubation time
(t=5) in cisplatin free medium after 1 hour exposure to 2µM cisplatin
y = 12780x - 1031,5 R² = 0,9998
0
5
10
15
20
25
30
0 0,5 1 1,5 2 2,5
195 P
t+ are
a*10
3
Concentration of cisplatin (ng/ml)
Cisplatin 110506
0
200
400
600
800
1000
1200
1400
0 100 200 300 400 500 600 700 800
195 P
t+ int
ensit
y
Time (s)
t=0 110506
0
200
400
600
800
1000
1200
1400
0 100 200 300 400 500 600 700 800
195 P
t+ int
ensit
y
Time (s)
t=5 110506
50
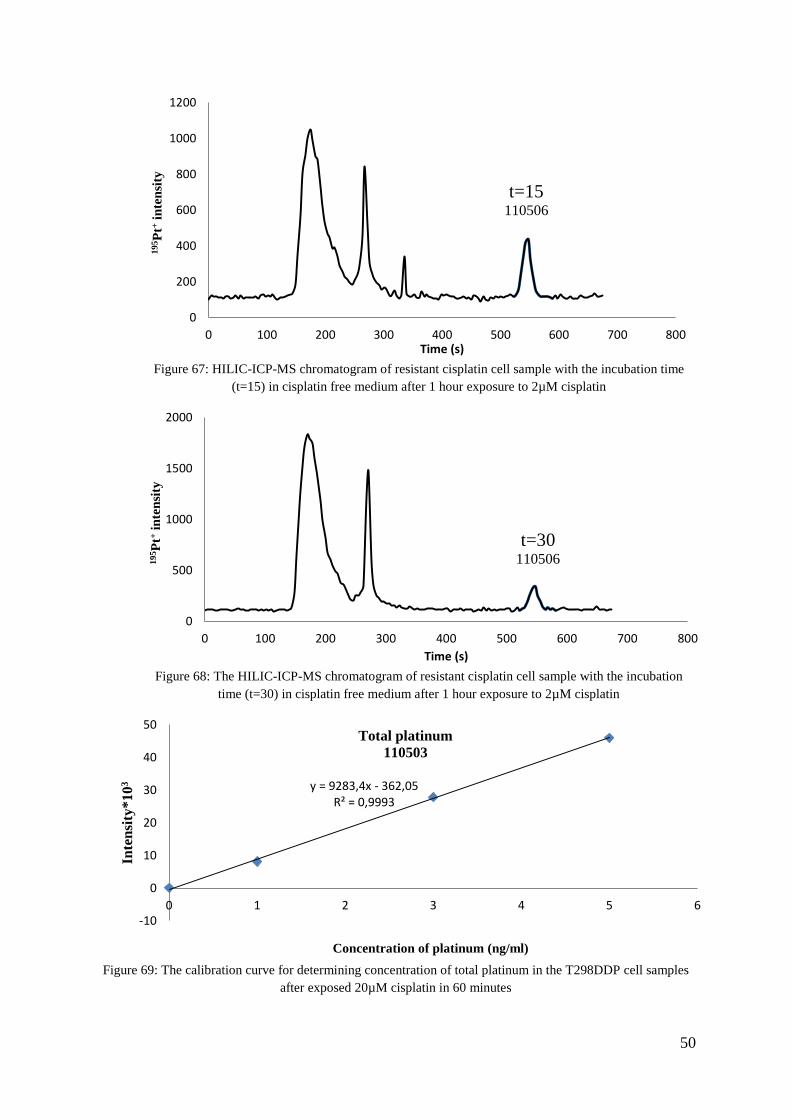
Figure 67: HILIC-ICP-MS chromatogram of resistant cisplatin cell sample with the incubation time
(t=15) in cisplatin free medium after 1 hour exposure to 2µM cisplatin
Figure 68: The HILIC-ICP-MS chromatogram of resistant cisplatin cell sample with the incubation
time (t=30) in cisplatin free medium after 1 hour exposure to 2µM cisplatin
Figure 69: The calibration curve for determining concentration of total platinum in the T298DDP cell samples
after exposed 20µM cisplatin in 60 minutes
0
200
400
600
800
1000
1200
0 100 200 300 400 500 600 700 800
195 P
t+ int
ensit
y
Time (s)
t=15 110506
0
500
1000
1500
2000
0 100 200 300 400 500 600 700 800
195 P
t+ int
ensit
y
Time (s)
t=30 110506
y = 9283,4x - 362,05 R² = 0,9993
-10
0
10
20
30
40
50
0 1 2 3 4 5 6
Inte
nsity
*103
Concentration of platinum (ng/ml)
Total platinum 110503
51
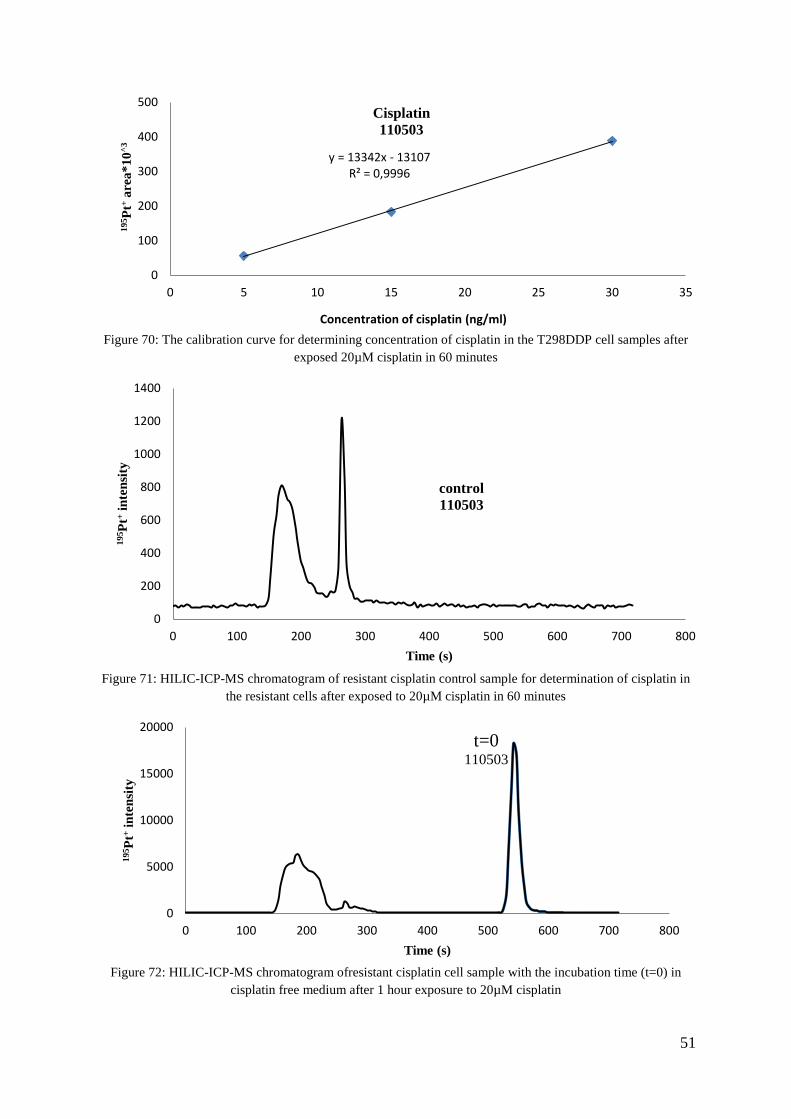
Figure 70: The calibration curve for determining concentration of cisplatin in the T298DDP cell samples after
exposed 20µM cisplatin in 60 minutes
Figure 71: HILIC-ICP-MS chromatogram of resistant cisplatin control sample for determination of cisplatin in
the resistant cells after exposed to 20µM cisplatin in 60 minutes
Figure 72: HILIC-ICP-MS chromatogram ofresistant cisplatin cell sample with the incubation time (t=0) in
cisplatin free medium after 1 hour exposure to 20µM cisplatin
y = 13342x - 13107 R² = 0,9996
0
100
200
300
400
500
0 5 10 15 20 25 30 35
195 P
t+ are
a*10
^3
Concentration of cisplatin (ng/ml)
Cisplatin 110503
0
200
400
600
800
1000
1200
1400
0 100 200 300 400 500 600 700 800
195 P
t+ int
ensit
y
Time (s)
control 110503
0
5000
10000
15000
20000
0 100 200 300 400 500 600 700 800
195 P
t+ int
ensi
ty
Time (s)
t=0 110503
52
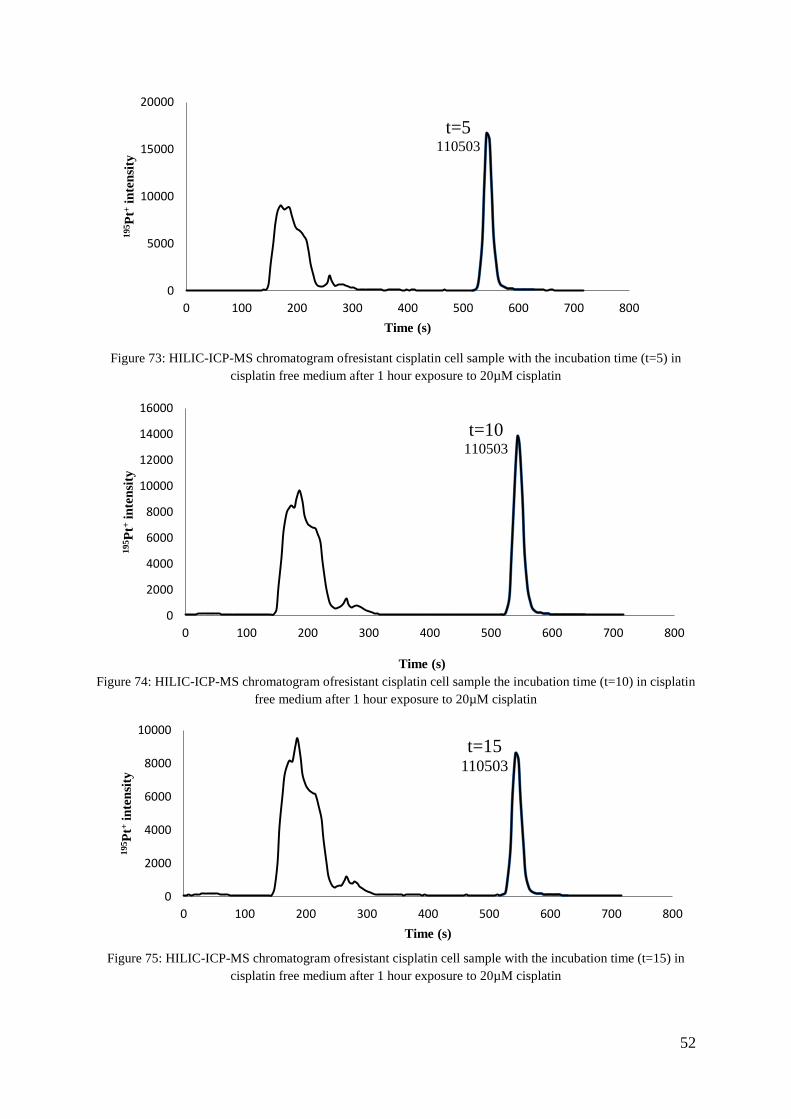
Figure 73: HILIC-ICP-MS chromatogram ofresistant cisplatin cell sample with the incubation time (t=5) in
cisplatin free medium after 1 hour exposure to 20µM cisplatin
Figure 74: HILIC-ICP-MS chromatogram ofresistant cisplatin cell sample the incubation time (t=10) in cisplatin free medium after 1 hour exposure to 20µM cisplatin
Figure 75: HILIC-ICP-MS chromatogram ofresistant cisplatin cell sample with the incubation time (t=15) in
cisplatin free medium after 1 hour exposure to 20µM cisplatin
0
5000
10000
15000
20000
0 100 200 300 400 500 600 700 800
195 P
t+ int
ensit
y
Time (s)
t=5 110503
0
2000
4000
6000
8000
10000
0 100 200 300 400 500 600 700 800
195 P
t+ int
ensit
y
Time (s)
t=15 110503
0
2000
4000
6000
8000
10000
12000
14000
16000
0 100 200 300 400 500 600 700 800
195 P
t+ int
ensit
y
Time (s)
t=10 110503
53
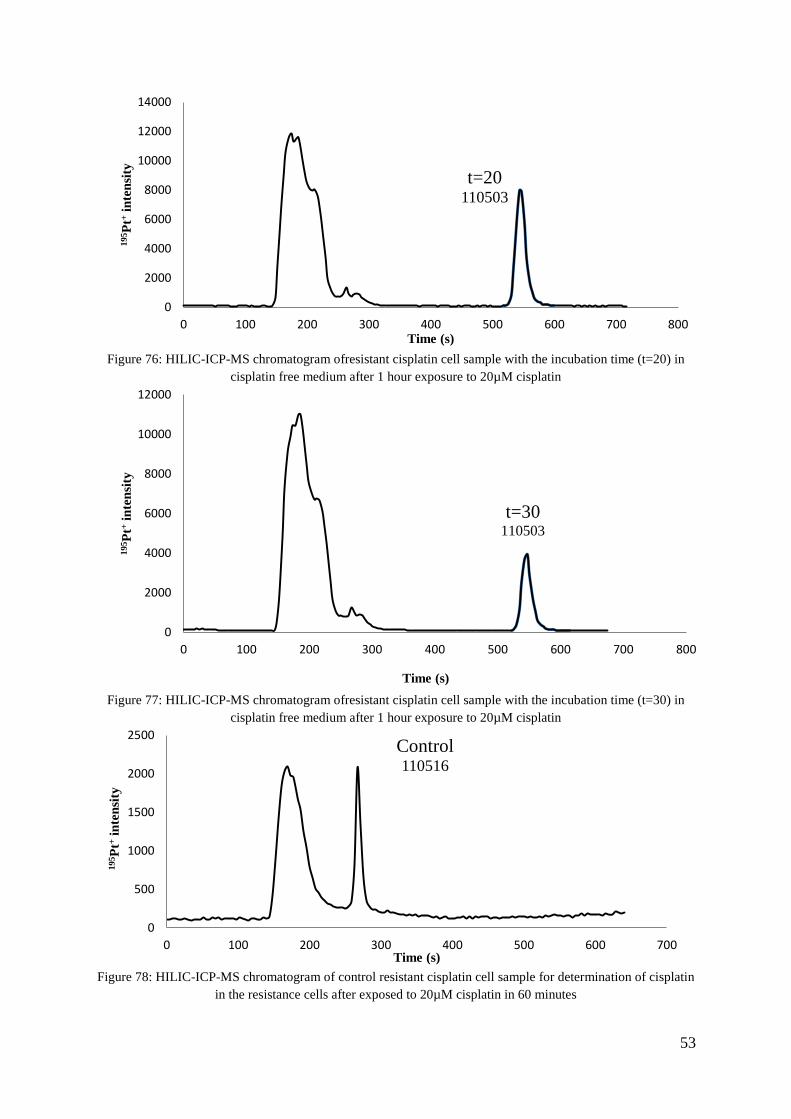
Figure 76: HILIC-ICP-MS chromatogram ofresistant cisplatin cell sample with the incubation time (t=20) in
cisplatin free medium after 1 hour exposure to 20µM cisplatin
Figure 77: HILIC-ICP-MS chromatogram ofresistant cisplatin cell sample with the incubation time (t=30) in
cisplatin free medium after 1 hour exposure to 20µM cisplatin
Figure 78: HILIC-ICP-MS chromatogram of control resistant cisplatin cell sample for determination of cisplatin
in the resistance cells after exposed to 20µM cisplatin in 60 minutes
0
2000
4000
6000
8000
10000
12000
14000
0 100 200 300 400 500 600 700 800
195 P
t+ int
ensit
y
Time (s)
t=20 110503
0
2000
4000
6000
8000
10000
12000
0 100 200 300 400 500 600 700 800
195 P
t+ int
ensit
y
Time (s)
t=30 110503
0
500
1000
1500
2000
2500
0 100 200 300 400 500 600 700
195 P
t+ int
ensi
ty
Time (s)
Control 110516
54
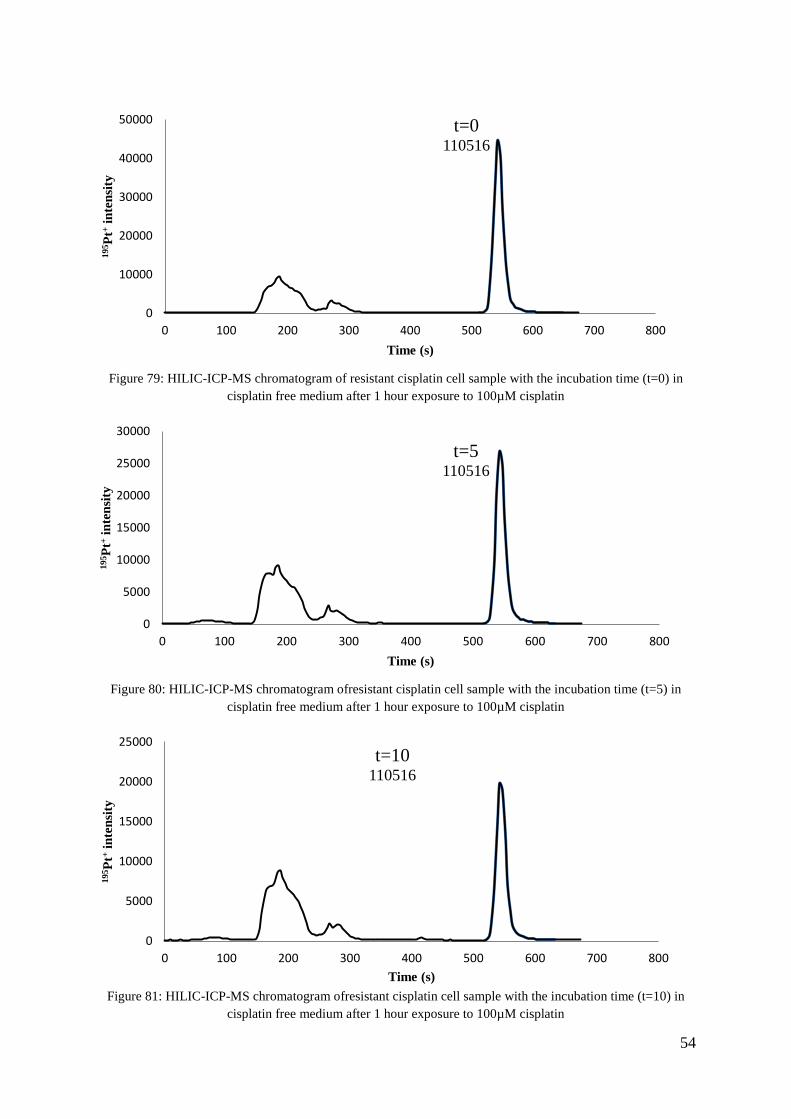
Figure 79: HILIC-ICP-MS chromatogram of resistant cisplatin cell sample with the incubation time (t=0) in
cisplatin free medium after 1 hour exposure to 100µM cisplatin
Figure 80: HILIC-ICP-MS chromatogram ofresistant cisplatin cell sample with the incubation time (t=5) in
cisplatin free medium after 1 hour exposure to 100µM cisplatin
Figure 81: HILIC-ICP-MS chromatogram ofresistant cisplatin cell sample with the incubation time (t=10) in
cisplatin free medium after 1 hour exposure to 100µM cisplatin
0
10000
20000
30000
40000
50000
0 100 200 300 400 500 600 700 800
195 P
t+ int
ensit
y
Time (s)
t=0 110516
0
5000
10000
15000
20000
25000
30000
0 100 200 300 400 500 600 700 800
195 P
t+ int
ensit
y
Time (s)
t=5 110516
0
5000
10000
15000
20000
25000
0 100 200 300 400 500 600 700 800
195 P
t+ int
ensit
y
Time (s)
t=10 110516
55
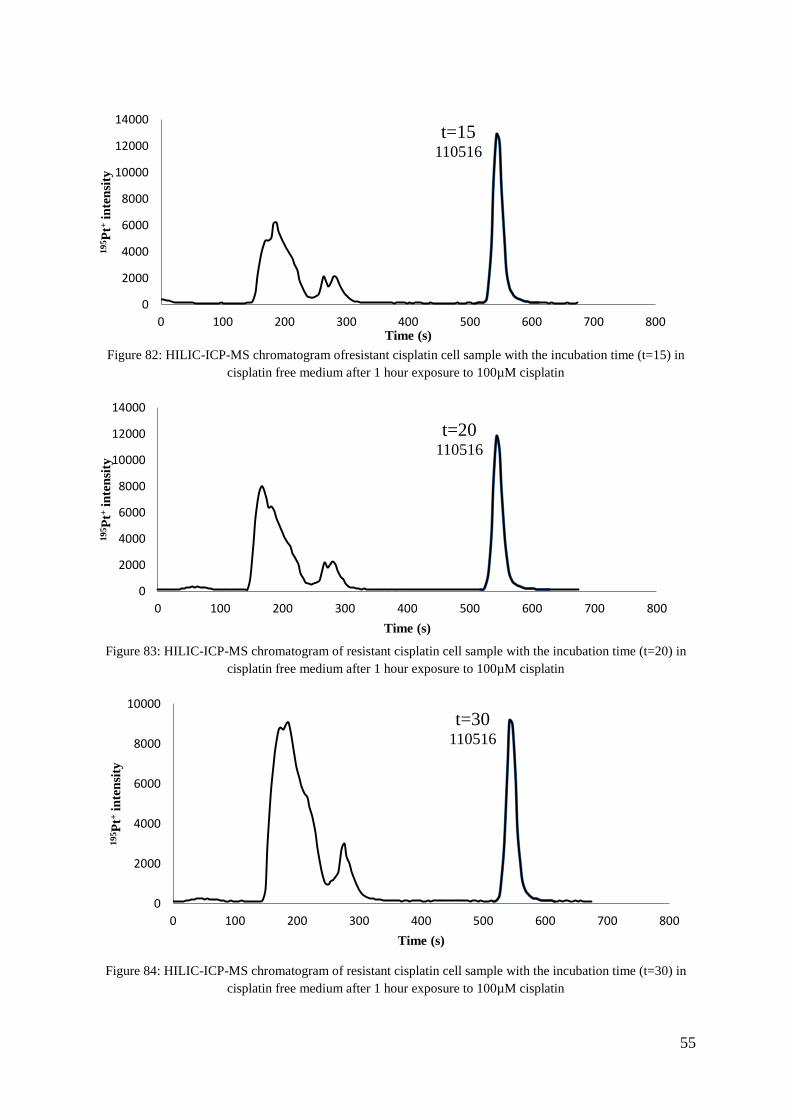
Figure 82: HILIC-ICP-MS chromatogram ofresistant cisplatin cell sample with the incubation time (t=15) in
cisplatin free medium after 1 hour exposure to 100µM cisplatin
Figure 83: HILIC-ICP-MS chromatogram of resistant cisplatin cell sample with the incubation time (t=20) in
cisplatin free medium after 1 hour exposure to 100µM cisplatin
Figure 84: HILIC-ICP-MS chromatogram of resistant cisplatin cell sample with the incubation time (t=30) in
cisplatin free medium after 1 hour exposure to 100µM cisplatin
0
2000
4000
6000
8000
10000
12000
14000
0 100 200 300 400 500 600 700 800
195 P
t+ int
ensit
y
Time (s)
t=15 110516
0
2000
4000
6000
8000
10000
12000
14000
0 100 200 300 400 500 600 700 800
195 P
t+ int
ensit
y
Time (s)
t=20 110516
0
2000
4000
6000
8000
10000
0 100 200 300 400 500 600 700 800
195 P
t+ int
ensit
y
Time (s)
t=30 110516


![S-1 plus cisplatin versus fluorouracil plus cisplatin in ... · AGC patients included cisplatin, fluorouracil, oxaliplatin, irinotecan and taxane [3, 9-12]. S-1 is one of the oral](https://img.pdfslide.net/doc/110x75/60a5bdbe5dedbc68f44d7cf1/s-1-plus-cisplatin-versus-fluorouracil-plus-cisplatin-in-agc-patients-included.jpg)