Embed Size (px)
Citation preview

1
Intraseasonal Kelvin Waves in Makassar Strait 1
2
3
Kandaga Pujiana1 and Arnold L. Gordon 4
Lamont-Doherty Earth Observatory, Palisades, New York 5
6
Janet Sprintall 7
Scripps Institution of Oceanography, La Jolla, California 8
9
10
11
12
13
14
15 1 Corresponding author address: Kandaga Pujiana, Lamont-Doherty Earth Observatory, 61 Route 9W, Palisades, NY 10964. E-mail: [email protected]

2
Abstract 16
Time series observations during 2004-2006 reveal the presence of 60-90 days 17
intraseasonal events that impact the transport and mixing environment within Makassar 18
Strait. The observed velocity and temperature fluctuations within the pycnocline reveal 19
the presence of Kelvin waves including vertical energy propagation, energy equipartition, 20
and non-dispersive relationship. Two current meters at 750 m and 1500 m provide further 21
evidence that the vertical structure of the downwelling Kelvin wave resembles that of the 22
second baroclinic wave mode. The Kelvin waves derive their energy from the equatorial 23
Indian Ocean winds, including those associated with the Madden-Julian Oscillations, and 24
propagate from Lombok Strait to Makassar Strait along the 100-m isobath. The 25
northward propagating Kelvin Waves within the pycnocline reduce the southward 26
Makassar Strait throughflow by up to 2 Sv and induce a vertical mixing rate of 1-5x10⁻⁵ 27
m2s-1. 28
29
30
31
32
33
34
35
36
37

3
1. Introduction 38
The Makassar Strait (Fig. 1) throughflow is a prominent component of the 39
Indonesian Throughflow (ITF; Gordon et al., 1996, 2003, and 2005). Makassar strait is 40
not only the main inflow conduit for the ITF (Gordon et al., 2008 and 2010) but also part 41
of a waveguide extending along the equatorial Indian Ocean to the southwestern coasts of 42
Indonesia then to Makassar Strait, via Lombok Strait (Fig. 1; Wijffels and Meyers, 2004). 43
Previous modeling studies have discussed the role of the waveguide in connecting wind 44
energy in the equatorial Indian Ocean to the Makassar Strait throughflow variability with 45
timescales varying from semiannual to intraseasonal (Qiu et al., 1999; Sprintall et al., 46
2000; Schiller et al., 2010; Shinoda et al., 2012). The studies of Sprintall et al. (2000) 47
and Shinoda et al. (2012) argued that semiannual variations (180 day) in the equatorial 48
Indian Ocean zonal winds induced a response in the South Java Current (SJC) through 49
coastally trapped Kelvin waves (CTKWs). The semiannual CTKWs propagate farther 50
east along the southern coasts of Indonesian archipelago into the Savu Sea, but part of the 51
wave energy is transmitted through the narrow Lombok Strait, which then move 52
equatorward to force northward Makassar Strait throughflow. At intraseasonal timescales 53
(20-90 days), Qiu et al. (1999) and Schiller et al. (2010) modeled the intraseasonal 54
variation in the Indo-Pacific region and proposed that the equatorial Indian Ocean wind-55
forced CTKWs also accounted for intraseasonal variability in the ITF passages. These 56
modeling studies emphasized the ITF reversal event as an indicator of the CTKW 57
passage in Makassar Strait but did not elaborate on the mechanism of the CTKW 58
transmission from Lombok Strait to Makassar Strait. 59
4
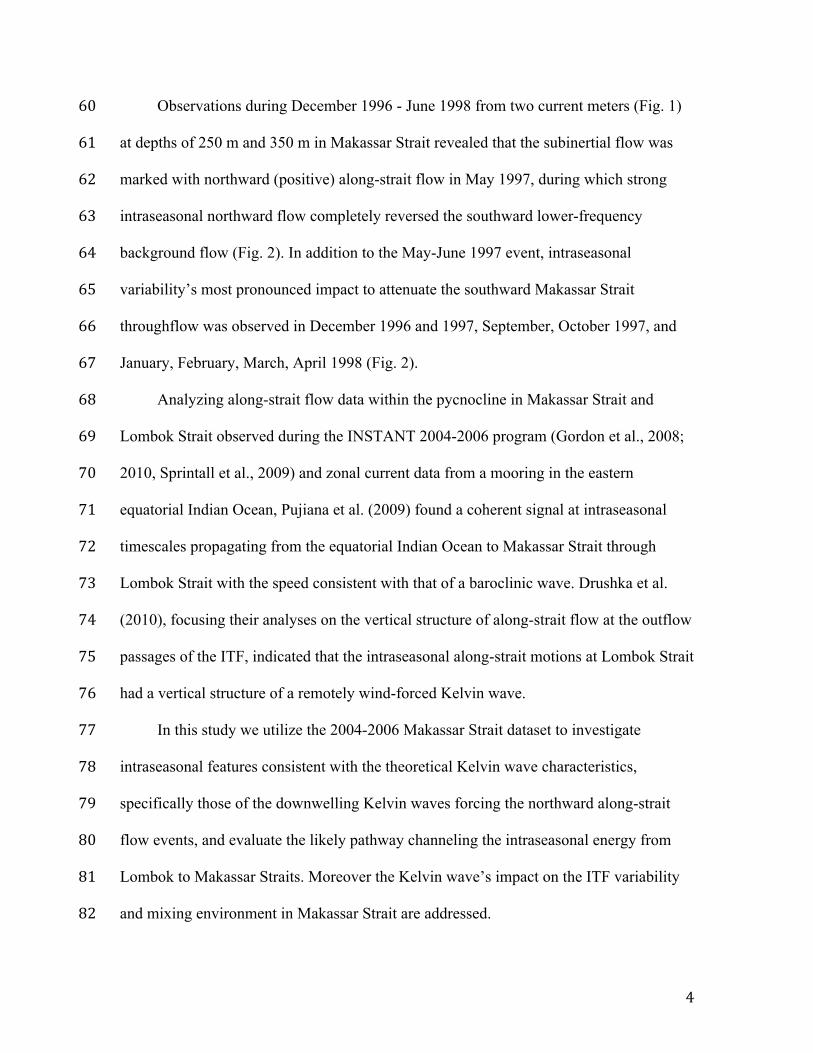
Observations during December 1996 - June 1998 from two current meters (Fig. 1) 60
at depths of 250 m and 350 m in Makassar Strait revealed that the subinertial flow was 61
marked with northward (positive) along-strait flow in May 1997, during which strong 62
intraseasonal northward flow completely reversed the southward lower-frequency 63
background flow (Fig. 2). In addition to the May-June 1997 event, intraseasonal 64
variability’s most pronounced impact to attenuate the southward Makassar Strait 65
throughflow was observed in December 1996 and 1997, September, October 1997, and 66
January, February, March, April 1998 (Fig. 2). 67
Analyzing along-strait flow data within the pycnocline in Makassar Strait and 68
Lombok Strait observed during the INSTANT 2004-2006 program (Gordon et al., 2008; 69
2010, Sprintall et al., 2009) and zonal current data from a mooring in the eastern 70
equatorial Indian Ocean, Pujiana et al. (2009) found a coherent signal at intraseasonal 71
timescales propagating from the equatorial Indian Ocean to Makassar Strait through 72
Lombok Strait with the speed consistent with that of a baroclinic wave. Drushka et al. 73
(2010), focusing their analyses on the vertical structure of along-strait flow at the outflow 74
passages of the ITF, indicated that the intraseasonal along-strait motions at Lombok Strait 75
had a vertical structure of a remotely wind-forced Kelvin wave. 76
In this study we utilize the 2004-2006 Makassar Strait dataset to investigate 77
intraseasonal features consistent with the theoretical Kelvin wave characteristics, 78
specifically those of the downwelling Kelvin waves forcing the northward along-strait 79
flow events, and evaluate the likely pathway channeling the intraseasonal energy from 80
Lombok to Makassar Straits. Moreover the Kelvin wave’s impact on the ITF variability 81
and mixing environment in Makassar Strait are addressed. 82
5
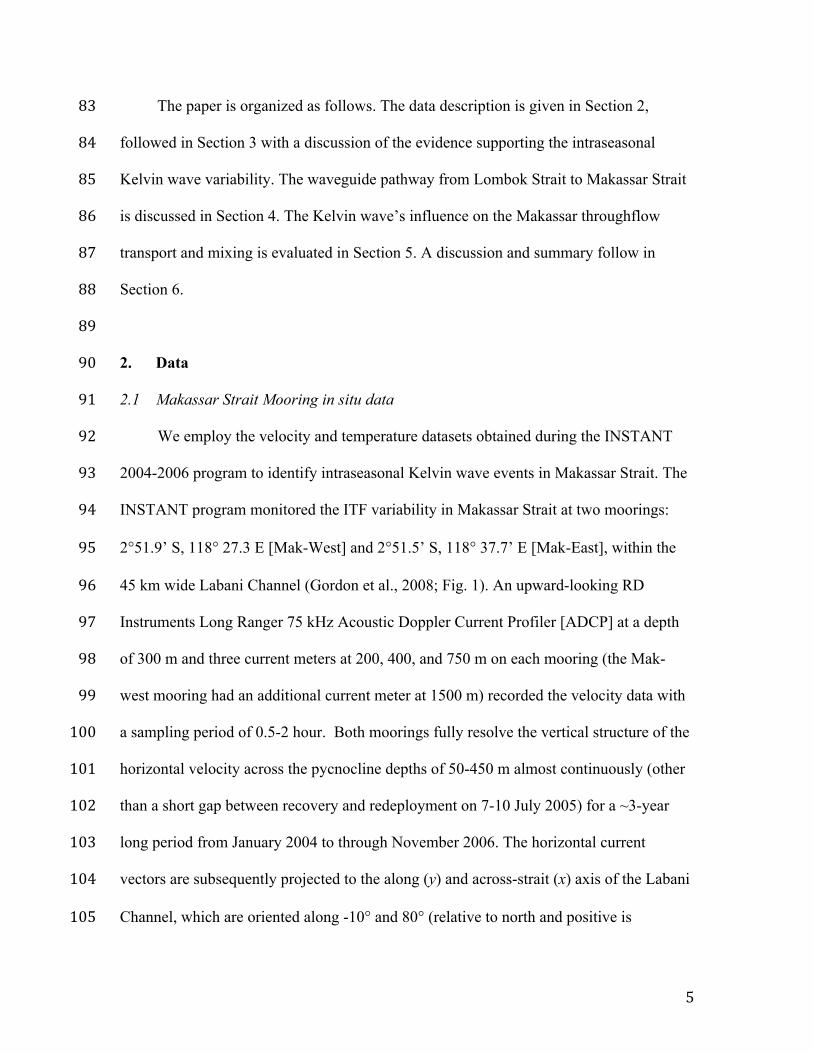
The paper is organized as follows. The data description is given in Section 2, 83
followed in Section 3 with a discussion of the evidence supporting the intraseasonal 84
Kelvin wave variability. The waveguide pathway from Lombok Strait to Makassar Strait 85
is discussed in Section 4. The Kelvin wave’s influence on the Makassar throughflow 86
transport and mixing is evaluated in Section 5. A discussion and summary follow in 87
Section 6. 88
89
2. Data 90
2.1 Makassar Strait Mooring in situ data 91
We employ the velocity and temperature datasets obtained during the INSTANT 92
2004-2006 program to identify intraseasonal Kelvin wave events in Makassar Strait. The 93
INSTANT program monitored the ITF variability in Makassar Strait at two moorings: 94
2°51.9’ S, 118° 27.3 E [Mak-West] and 2°51.5’ S, 118° 37.7’ E [Mak-East], within the 95
45 km wide Labani Channel (Gordon et al., 2008; Fig. 1). An upward-looking RD 96
Instruments Long Ranger 75 kHz Acoustic Doppler Current Profiler [ADCP] at a depth 97
of 300 m and three current meters at 200, 400, and 750 m on each mooring (the Mak-98
west mooring had an additional current meter at 1500 m) recorded the velocity data with 99
a sampling period of 0.5-2 hour. Both moorings fully resolve the vertical structure of the 100
horizontal velocity across the pycnocline depths of 50-450 m almost continuously (other 101
than a short gap between recovery and redeployment on 7-10 July 2005) for a ~3-year 102
long period from January 2004 to through November 2006. The horizontal current 103
vectors are subsequently projected to the along (y) and across-strait (x) axis of the Labani 104
Channel, which are oriented along -10° and 80° (relative to north and positive is 105
6
clockwise) respectively (Fig.1), to yield gridded along (v) and across-strait (u) currents. 106
In addition to the moored velocity datasets in Makassar Strait, we also use the hourly 107
velocity data at pycnocline depth of 50-150 m from INSTANT moorings in Lombok 108
Strait (Fig. 1. For more information on the Lombok mooring configurations, see Sprintall 109
et al., 2004 and 2009). 110
Temperature stratification from 100 to 400 m within the Makassar Strait pycnocline 111
are resolved by the temperature and pressure sensors attached to Mak-West and Mak-East 112
moorings. Mak-West mooring provided higher resolution with 17 sensors attached, while 113
Mak-East mooring only had 5 sensors. Since the vertical structure of temperature 114
variability is less well resolved at the Mak-East mooring, we will only analyze the 115
temperature profile dataset from Mak-West. The sensors sampled temperature and 116
pressure at 6-minute intervals over the entire 3 years INSTANT deployment period. The 117
temperature datasets are linearly interpolated onto a 25-m depth grid for each two-hour 118
time step to provide the gridded temperature data from 150 to 350 m of water column. 119
120
2.2 Shallow-pressure gauge and satellite-derived data 121
In addition to the moored data in Makassar and Lombok Straits, we also employ the 122
sea level anomaly (SLA) data from two shallow pressure gauges (Pw and Pe) in Lombok 123
Strait (Fig. 1) and from the gridded SLA products (merged and delayed time products) of 124
Archiving, Validation, and Interpretation of Satellite Oceanographic Data (AVISO, Ducet 125
et al, 2000). The shallow pressure gauge data are daily, and more information on the 126
pressure gauge setting can be found in Sprintall et al. (2004). The satellite-derived SLA 127
has a horizontal resolution of 0.25° x 0.25° and temporal resolution of 7 days, and the 128

7
emphasis of our analysis will be on the SLA variability in Lombok Strait and along the 129
southeastern coasts of Indonesia archipelago (Fig.1). Furthermore we will be focusing on 130
the SLA variability during April-June 2004 (Fig. 3), one of the events when both 131
moorings in Makassar and Lombok Straits display strong northward flow. The northward 132
flow observed in Makassar Strait on May 30th 2004 (Fig. 4b-d) was preceded by mass 133
pilling up (+η) against the southwestern coasts of Sumatra on 12 May, followed up by 134
southeastward propagation of the +η signal so that the southern coasts of Java was 135
marked with +η on 19 May (Fig. 3). The occurrence of +η signal extended from the 136
southern coasts of Java to the mooring sites in Makassar Strait via Lombok Strait on 26 137
May although there are some concerns on the SLA data quality within the internal 138
Indonesian seas. 139
140
3. Intraseasonal variability in Makassar Strait 141
3.1 Weakened ITF events at intraseasonal timescales 142
Focusing on the weakened or reversed southward flow in Makassar Strait, the v 143
component at the base of the pycnocline at 450 m depth (Fig. 4d) demonstrates that 144
southward subinertial flow, vs (low-passed v time series with cut off periods of 9 days) 145
reversed to northward flow five times over the course of 2004-2006: May 2004 and 2005, 146
September 2005 and 2006, and November 2006. Although no ITF reversal was observed 147
at depths shallower than 250 m, the northward vs phases in May 2004 and 2005 and in 148
November 2006 were observed as shallow as 350 m. One feature consistently revealed 149
within the along channel pycnocline flow is the strong influence of intraseasonal 150

8
variability, v’ (band-passed v timeseries with cut off periods of 20 and 90 days) on vs: a 151
northward vs event always corresponds with a northward v’ phase (Fig. 4b-d). 152
Over the course of 2004-2006, there were 17 northward (+v’) events with recurring 153
period of 2-3 months (Fig. 4b-d). The +v’ during May 2004 and 2005 was the most 154
energetic of all +v’ events, while other less energetic +v’ events peaked in February, 155
March, August and December 2004; January, March, July, September, and November 156
2005; January, April, June, August, September, and November 2006. The +v’ episodes 157
demonstrated a strong correlation with the zonal winds in the eastern equatorial Indian 158
Ocean (not shown) and those particularly occurring in March and May 2004; May, and 159
September 2005 were preceded by significant MJO phases (Pujiana et al., 2009, Fig. 4a) 160
with the +v’ events in Makassar Strait lagging the MJO by 19-25 days (Fig. 4e). Zhou 161
and Murtugudde (2010) conjectured that the MJO influenced the intraseasonal variability 162
at Lombok Strait. They further suggested that the meridional currents were reversed from 163
southward to northward at Lombok Strait 15 days after the day of a peak MJO index. 164
Thus the lag of 19-25 days revealed by +v’ in Makassar Strait, with respect to a strong 165
MJO event, indicates a link between the intraseasonal variability in Makassar Strait and 166
MJO episodes. More discussion on the relationship between the +v’ events in Makassar 167
Strait and the MJO significant phases are given in Section 6. 168
169
3.2 Subpycnocline intraseasonal variability 170
The v timeseries at 750 m and 1500 m also display significant intraseasonal 171
variability with a diminished subinertial background flow marked with recurring 172
intraseasonal oscillation with a 60-day period (Fig. 5a,b). The intraseasonal variation 173
9
explains ~80% of the total variance of the subpycnocline current meters v timeseries. 174
Aside from their energetic intraseasonal signatures, the v’ at 750 m and 1500 m in 175
Makassar Strait also displays a unique characteristic that is not expected to be observed at 176
depths where the stratification frequency is quasi-homogeneous: the flows at 750 m and 177
1500 m are out of phase. A lagged correlation between the v’ data at 750 m and that at 178
1500 m shows a statistically significant correlation with r2 = -0.8, and a coherence 179
analysis further indicates that the 60-day oscillation is the most coherent among the v’ 180
data at both depths with a phase shift of 180° (not shown). 181
The time series from the two subpycnocline current meters (Fig. 5a,b) are used to 182
analyze the vertical profiles of v’ from 50-1500 m attributed to the +v’ events observed in 183
the pycnocline depths (Fig. 4b-d). With over the 17 +v’ episodes during 2004-2006, the v’ 184
data consistently exhibit a vertical structure which signifies a baroclinic structure with 185
two zero crossing depths, indicative of a second baroclinic wave mode. Examples of the 186
measured v’ vertical structure in May, September and November of 2005 when the +v’ 187
was maximum are shown in Fig. 5c. 188
189
3.3 Kelvin Wave Signatures 190
As discussed above, intraseasonal motions account for a significant proportion of 191
the variance of the Makassar Strait variability (Figs. 4 and 5) and are clearly evident in 192
the datasets as +v’. In this subsection, we provide evidence linking the +v’ attributes to 193
theoretical Kelvin wave characteristics such as a vertically propagating wave, normal 194
mode approximation, energy equipartition, and semi-geostrophic balance. 195
196

10
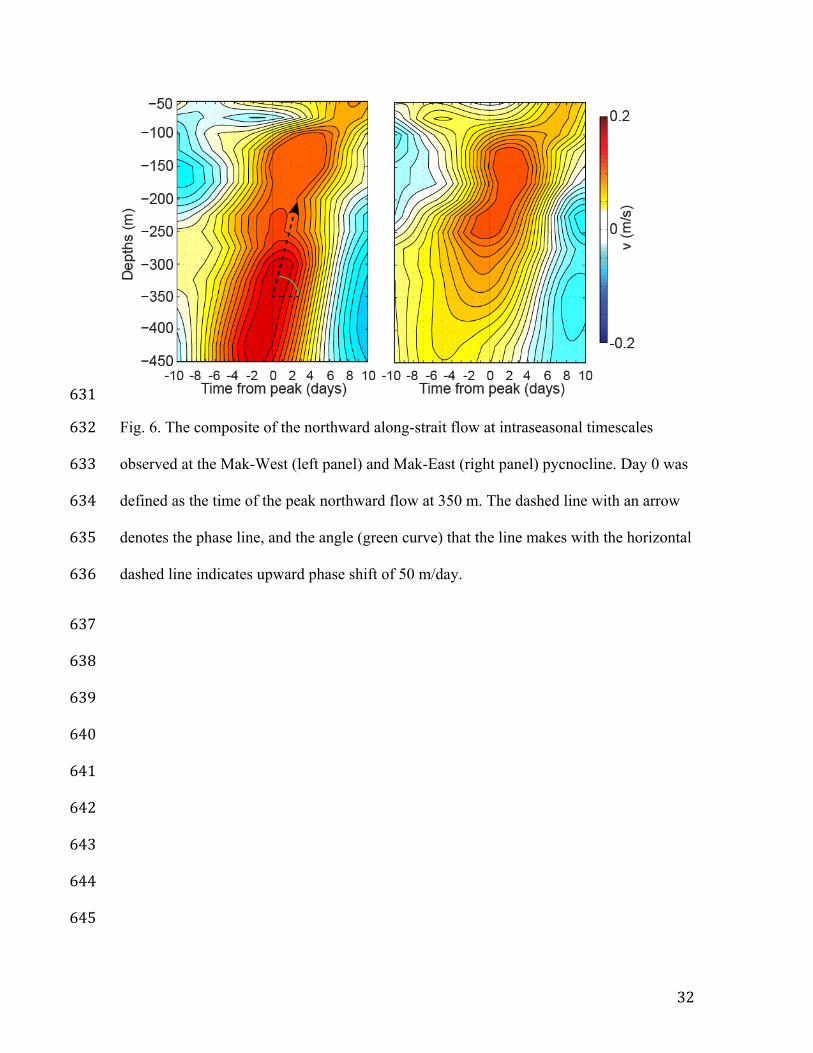
3.3.1 Vertically propagating waves 197
Over the 17 occasions when vs turned northward or was greatly attenuated during 198
2004-2006, one consistent feature was that the v’ profile across the pycnocline indicated 199
upward phase propagation as +v’ at deeper levels led that at shallower levels. The 200
composites of the v’ data, formed by isolating each +v’ event and then averaging over the 201
set of events observed during 2004-2006, demonstrated weak flow at depths shallower 202
than 100 m, velocity core in the lower thermocline at 200 m at Mak-East and 350 m at 203
Mak-West (Fig. 6). There is an upward phase tilt (dz/dt) associated with the v’ of 50 204
m/day (Fig. 6). 205
What ocean dynamics might force this upward phase propagation of +v’ events in 206
Makassar Strait? We suggest that this trait is consistent with the dynamics of vertically 207
propagating Kelvin waves. If a wind-forced Kelvin wave perturbed the surface of a 208
stratified ocean, the energy attributed to the perturbation would not only propagate 209
horizontally away from the perturbation point but also downward making a horizontal 210
slope of θ = ω/N = dz/dx, where ω is a wave frequency, N is stratification frequency, z is 211
depth, and x is horizontal distance. As our composite plots are in depth and time domains, 212
the slope equation can be equivalently written as dz/dt = ω.c/N, where c is a theoretical 213
phase speed of a baroclinic wave mode and t is time. Thus an observer, stationed at a 214
distance away from where a Kelvin wave is generated, would see the linear wave 215
signature arrives deeper in the water column first. 216
To test whether the observed phase slope (Fig. 6) inferred from the +v’ composite is 217
consistent with the slope formula, we use an averaged stratification profile (N) from 218
several CTD casts along the projected ray path (Fig. 1). The phase speed (c) is inferred 219

11
from the normal mode analysis of N (Fig. 1). Given ω = 2π/(20-90)-day, c = 1.2-2.5 m/s 220
(the phase speed for the first two wave modes), and N = 0.0068 s-1. Thus dz/dt varies 221
within 15-115 m/day which agrees fairly well with the phase slope inferred from the v’ 222
composite (Fig. 6). Thus the pattern of upward phase shift with a slope of 50 m/day 223
observed in the v’ composite likely expresses a linear Kelvin wave signature. 224
A vertically propagating Kelvin wave can also be identified from how temperature 225
fluctuations and velocity vectors associated with the wave are related. The pressure 226
perturbation (p’) and its corresponding vertical velocity (w’) for a vertically propagating 227
Kelvin wave are written as !′ !,!, !, ! = !!
! cos(!") !" and !′ = −(!!
!!)!!!′/228
!"!# respectively, where m is vertical wavenumber and ρo is background density. 229
Assuming density (ρ’) fluctuations can be represented by temperature (T’) fluctuations 230
and vertical displacements of density surfaces are solely driven by the vertical velocity 231
following !"′/!" + !′!!/!" = 0, it is implied that the highs and lows of T’ and p’ are 232
separated by π/2. Since p’ is in phase with the wave induced horizontal velocity vectors 233
(u’, v’), it is also implied that T’ and (u’, v’) attributed to a theoretical Kelvin wave would 234
have the same phase shift. Plots of the v’ and T’ timeseries for several depths, which 235
focus on an episode of strong +v’ in late May 2004, demonstrate that maximum 236
northward along-strait flow occurs prior to maximum temperature oscillations with a lead 237
of approximately ¼ cycle (Fig. 7) implying that T’ would lead v’ in a space domain by 238
about π/2. This agrees well with the phase relationship required for an upward 239
propagating Kelvin wave. 240
241
3.3.2 Normal Mode Approximation 242

12
The velocity vectors associated with a theoretical Kelvin wave in a strait are 243
separable into their across-strait and vertical components, and the vertical component can 244
be written as !!!!
!!!+ !!
!!! = 0, where v’ denotes along-strait flow, N is stratification 245
frequency, c is baroclinic wave speed. With proper boundary conditions and arbitrary N, 246
Gill (1982) suggests that the amplitude and phase of v’ were proportional to N1/2 e±i(1/c)∫Ndz 247
and !"# respectively. The moored datasets in Makassar Strait reveal that v’ at 200 m is 248
significantly coherent with that at deeper levels for the period band of 45-90 days (see 249
Fig. 5 of Pujiana et al., 2009) and shows the maximum coherence with the 60-day 250
oscillation (Fig. 8a). Furthermore v’ at 200 m lags that at 450 m by 40° (Fig. 8b). Because 251
the phase difference is proportional to the summation of the magnitudes of N with depth 252
between two depth limits, we may define the phase lag between 200 and 450 m as 253
!!"" − !!"#~( !"#/!"#!"" !"#!"""
! )(!! − !!"""). Assume θ0 - θ2200 is the phase 254
difference for a full cycle over the ocean depth (i.e. 360°), the ratio between (θ200 - θ450) 255
and (θ0 - θ2000) should be equivalent to 0.11, which is reasonably close to the measured 256
value of 0.15 given by ( !"#/!"#!"" !"#!"""
! ) (Fig. 8c). The theoretical Kelvin wave 257
solution is thereby applicable to explain the relationship between the observed vertical 258
structure of v’ and N. 259
260
3.3.3 Energy Equipartition 261
As in the oscillation of a pendulum, a theoretical Kelvin wave also expresses equal 262
partition between its corresponding kinetic and potential energies (Pedlosky, 2003). We 263
use the v’ and T’ data to examine whether the energy equipartition in the wave field also 264
13
characterizes the intraseasonal motions observed in the Makassar Strait pycnocline. To 265
estimate the potential energy (PE), the temperature timeseries over several depths ranging 266
the pycnocline of the Mak-West mooring are converted to vertical displacements (η’) 267
using a heat equation of η’(z,t)=T’(z,t)/∂T’/∂z, in which horizontal advection, diffusion, 268
and heat sources are neglected. We also remove the effect of static stability on the 269
thermal field through normalizing η’ with the ratio between N and its corresponding 270
vertical average No, η’n(z,t) = η’(z,t)(N/No), where z, t, and subscript n denote depth, time 271
and normalized respectively. The PE per unit mass is computed as 0.5!!!!!!", where !!" 272
is the variance of vertical displacements averaged over intraseasonal frequency band and 273
ρo is averaged density across pycnocline depths. Kinetic energy (KE) is inferred from the 274
spectra of v’ and defined as 0.5!!!!", where !′! is variance attributed to v’ averaged over 275
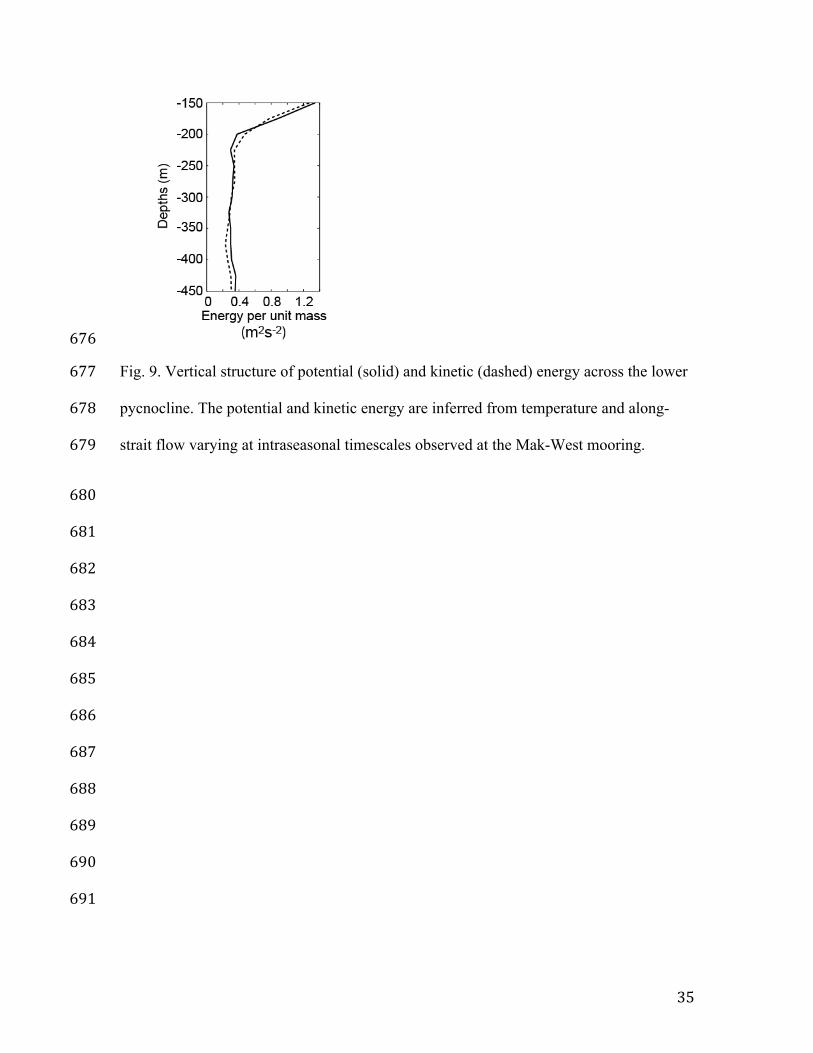
intraseasonal periods. Vertical structures of PE and KE (Fig. 9) demonstrate that PE and 276
KE have similar amplitudes, indicative of equipartition between PE and KE, which 277
further supports our hypothesis that the Kelvin wave field contributes significantly to 278
intraseasonal motion in the Makassar Strait thermocline. 279
280
3.3.4 Dispersion relation 281
The dispersion relation for a Kelvin wave in Makassar Strait, a North-South 282
oriented channel, would be ω = l c, where l and c are wavenumber in the y direction and 283
wave phase speed, signifying a constant phase speed or non-dispersive. We employ the v’ 284
datasets at Lombok and Makassar Straits to investigate whether the coherent oscillation 285
transmitting from Lombok Strait to Makassar Strait reported by Pujiana et al. (2009) 286
exhibits a dispersion relationship consistent with a Kelvin wave. 287
14
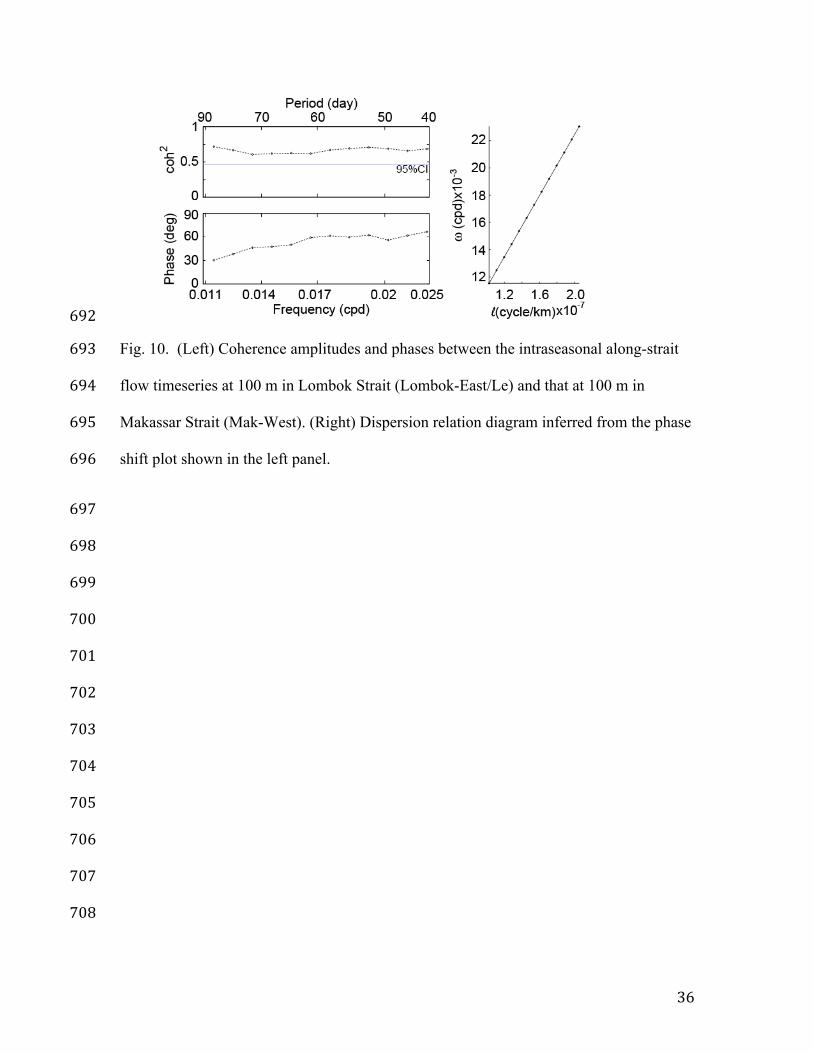
The v’ time series at the upper 200 m of Lombok Strait and that at depths below 75 288
m of Makassar Strait are statistically coherent above the 95% significance level across 289
the period band of 45-90 days, and the corresponding phase differences linearly decrease 290
with period. For example, v’ at 100 m in Lombok Strait and Makassar Strait are not only 291
statistically coherent but also show a linear trend of decreasing phase difference with 292
period (Fig. 10), indicative of a propagating feature with a quasi-constant phase speed of 293
1.3 ± 0.01 m/s from Lombok Strait to Makassar Strait (a distance of 1240 km, the 100-m 294
isobath length connecting the moorings at Lombok and Makassar Straits, is used in the 295
computation). Thus the relationship between ω and l inferred from the coherence analysis 296
exemplifies a non-dispersive wave. 297
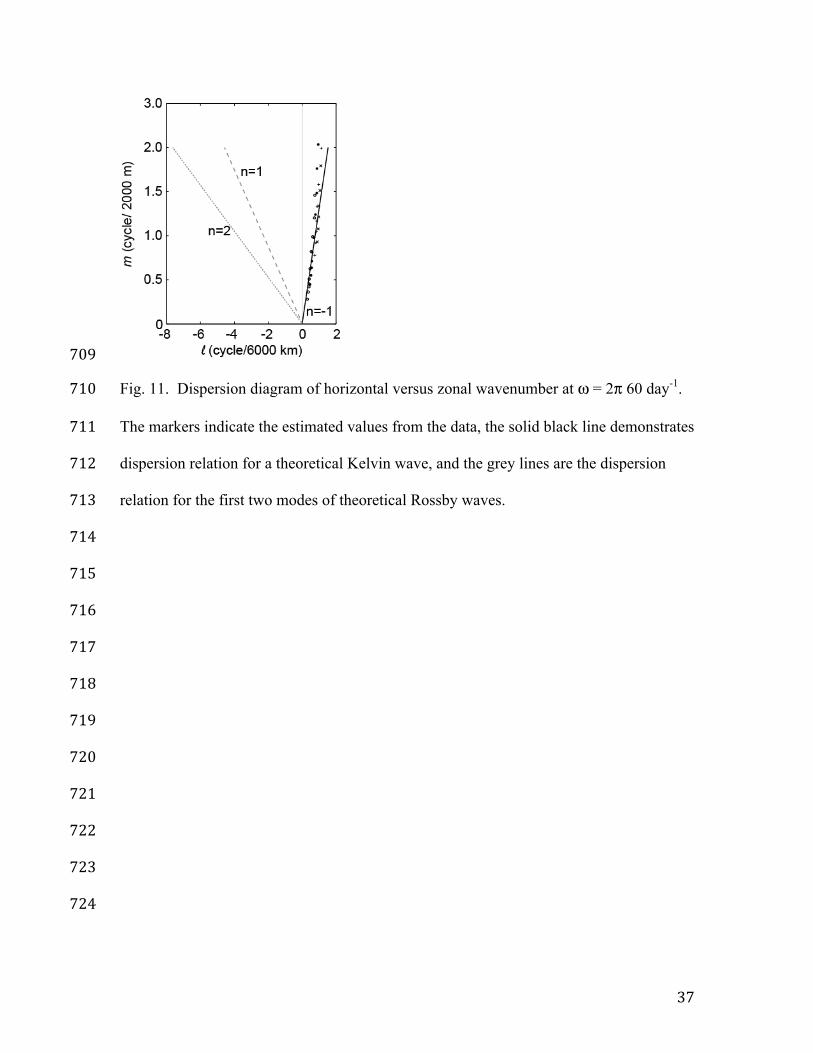
In addition to the relation between ω and l, the relation between l and m (vertical 298
wavenumber) is also useful to determine the wave classification. The equatorial wave 299
dispersion relation, (k2No/mβ)+(kNo/ω m)-(ω 2m/Noβ)+2n+1 = 0, can be simplified as k = 300
- (2n+1)mω/No, where k is zonal wavenumber, No is averaged stratification frequency 301
over depths, m is vertical wavenumber, β is beta effect, and n is meridional mode number 302
(n = -1, 1, 2, …). Because of the Makassar mooring’s proximity to the equator, we 303
propose that the equatorial wave dynamics are suitable to explain any waveforms 304
captured in the study area. Nevertheless the wave properties are now assumed to vary 305
zonally because the main axis of the Makassar Strait is nearly parallel to the y-direction, 306
so the corresponding dispersion relation is l = - (2n+1)mω/No. The estimated l and m at 307
ω = 2π/60-day-1 obtained from coherence analyses of v’ at Lombok and Makassar Straits 308
also well approximate the Kelvin wave dispersion curve (Fig. 11). 309
310
15
3.3.5 Semi-geostrophic balance and increased decay scale 311
Observations and numerical experiments agree that the Kelvin wave energy 312
originating in the equatorial Indian Ocean significantly influences the intraseasonal 313
variability at Lombok Strait (Arief and Murray, 1996; Qiu et al., 1999, Schiller et al., 314
2010, Drushka et al., 2010). Drushka et al. (2010) proposed that the vertical structure of 315
the observed Lombok Strait throughflow at intraseasonal timescales was best explained 316
by a baroclinic Kelvin wave. We will be discussing two other Kelvin wave attributes 317
measured at Lombok Strait: semi-geostrophic balance and reflected Kelvin wave. 318
A simple wave equation and its boundary condition applicable for simplified 319
Lombok Strait, a channel bounded by vertical walls, are given as, 320
!!!!!!!
+ !!!!!!
!!− !! !′ = 0 and !
!!!!!!
+ !(!!) !′ = 0, ! = 0,!, where η’ is sea level 321
anomaly across the strait, l is wavenumber in the along-strait axis direction, and W is the 322
strait width. The general solution, with ω = ± lc, is !′ !, ! = !!!!!"! cos (!" − !"), 323
where c denotes Kelvin wave phase speed. Given the corresponding momentum equation 324
is !′ !! − !! − !" !"!!"+ ! !!!!
!"!#= 0 we can then obtain !′ = !
!!"!!"
which implies a 325
semi-geostrophic balance. 326
The u’, v’ obtained from moorings, and η’ from the pressure gauges and altimeter 327
are employed to examine the Kelvin wave signatures in Lombok Strait. We focus on the 328
May 2004 event during which the instruments were all operational. Moorings and 329
pressure gauges in Lombok Strait demonstrated that +v’ and +η’ characterized the 330
Lombok Strait intraseasonal variability during May 2004 (Fig 12). We also identify that 331
the across-strait SLA slopes down towards the east (∂η’/∂x < 0), with higher sea level at 332

16
Pw than Pe, when v’ > 0 during May 2004 (Fig. 12), indicative a balance between ∂η’/∂x 333
and zonal coriolis force. Meanwhile the along-strait sea surface tilt (∂η’/∂y), inferred 334
from satellite-derived SLA measured at two locations in Lombok Strait (Pn and Ps; Fig. 1), 335
is not balanced by f in the y-direction as the sea surface slopes up towards the south 336
(∂η’/∂y <0) when u’ > 0 (Fig. 12b and c; Fig. 13a), indicative of ageostrophy. Moreover 337
the estimated geostrophic +v’ inferred from ∂η’/∂x does not differ significantly from +v’ 338
measured from moorings (Fig. 13b), which confirms a partial geostrophic balance in the 339
x-direction. 340
The two shallow pressure gauges at the zonal boundaries of Lombok Strait also 341
indicated enhanced across-strait decay scale, another Kelvin wave attribute. The 342
estimated η’ variability at Pe, η’Pe = η’Pw e-W/R; with W = 0.3R is the distance between the 343
two pressure gauges and R is Rossby radius of deformation, is less than the observed η’Pe 344
(Fig. 13c). The discrepancy between the measured and estimated η’Pe implies increased 345
across-strait decay scale. Durland and Qiu (2003) connected a low-frequency Kelvin 346
wave passage in a strait with enhanced across-strait decay scale, mainly forced by the 347
formation of a reflected Kelvin wave whose direction was 180° out of phase with the 348
incident wave. When a Kelvin wave in Lombok Strait reaches an entrance into a larger 349
basin, it does not contain the required energy to force a wave of equal amplitude in that 350
basin which leads to the genesis of a reflected wave in order to preserve the continuity of 351
pressure at the strait mouth. Since the maximum amplitude of the reflected wave is on the 352
opposite side of the strait to the maximum amplitude of the incident wave, the reflection 353
subtracts more from the minimum amplitude of the incident wave than it does from the 354
17
maximum amplitude. This likely results in an enhanced across-strait pressure gradient 355
such as observed in Lombok Strait (Fig. 13c). 356
357
4. Waveguide from Lombok Strait to Makassar Strait 358
We have demonstrated that observations at Makassar and Lombok Straits reveal 359
intraseasonal motions with Kelvin wave signatures, which signify propagation from 360
Lombok Strait to Makassar Strait. Discontinuous coastlines separate the moorings at both 361
straits raising the question of the pathway guiding the wave from Lombok Strait to 362
Makassar Strait. Given the averaged depth across section A (Fig. 14a) is 145 m, a 363
barotropic Kelvin wave with a deformation radius of 1900 km would overcome the gap 364
of ~475 km and force another barotropic Kelvin wave of reduced amplitude to propagate 365
along the southern Kalimantan coasts into the Makassar Strait. In contrast the gap is too 366
wide for the observed baroclinic Kelvin wave with a deformation radius of less than 100 367
km to “jump over”. 368
A route which extends for 5195 km and runs along the northern Bali and Java, and 369
eastern Sumatra coasts, the equator (across the South China Sea) and southern 370
Kalimantan coasts (Fig. 14a) would serve as a viable waveguide for a baroclinic Kelvin 371
wave originating in Lombok Strait because the gaps in Bali and Sunda Straits (Fig. 14a) 372
are less than the deformation radius. Nevertheless the first two modes of a baroclinic 373
Kelvin wave with a speed of 1.2-2.5 m/s would take at least 25 days to propagate along 374
this waveguide, whereas the lags between the v’ at Makassar Strait and that at Lombok 375
Strait vary from 12-16 days (Fig. 14b), indicative a shorter pathway connecting both 376
18
Straits. The third mode of a baroclinic Kelvin wave with a speed of 0.8 m/s would take 377
even longer. 378
A shorter pathway from Lombok Strait to Makassar Strait is along the isobaths, 379
across the Sunda continental slope and at depths greater than 50 m (Fig. 14a), where a 380
slope-trapped baroclinic Kelvin wave may propagate towards Makassar Strait with 381
shallower water to the left. The propagation of a baroclinic Kelvin wave along an isobath 382
has been studied through both laboratory experiments and observations (Codiga et al., 383
1999; Hallock et al., 2009). Fig. 14a depicts the 100-m isobath, which extends for ~1240 384
km and links the moorings in Lombok and Makassar Straits. A baroclinic Kelvin wave 385
with a speed of 0.8-1.2 m/s, equivalent with a speed of the second and third modes 386
theoretical baroclinic Kelvin waves inferred from stratification, would take 12-18 days to 387
reach Makassar Strait, which is in good agreement with the observations (12-16 days, Fig. 388
14b). We thus speculate that the Kelvin wave propagates as the second and third 389
baroclinic modes along the 100-m isobath directly linking Lombok to Makassar Strait. 390
391
5. Transport and mixing associated with Kelvin wave in Makassar Strait 392
5.1 Transport 393
We have provided supportive evidence for Kelvin wave propagation from the 394
velocity vectors, temperature and stratification datasets. We now address a question of 395
the relevance of Kelvin waves to ITF studies, more specifically, what are the transport 396
anomalies associated with the intraseasonal baroclinic Kelvin waves in Makassar Strait? 397
To deduce the estimated transport anomalies, we use the v’ datasets at depths of 125-450 398
m from the Mak-West and Mak-East moorings. At each depth of z, we fit the v’ 399

19
timeseries from both moorings using an exponential function of !! = !!"#!!"#$! !!!/!, 400
which results in the across-strait structure of v’, v’ (x, z, t), where b is the horizontal scale 401
coefficient, and x = 0:L (x = 0 and x = L correspond with the Mak-West and Mak-East 402
mooring sites respectively). The transport is then computed as 403
!! !, !, ! !"!#!!!!!!
!!!!"#!!!!"# . The transport variability observed during 2004-2006 across 404
the pycnocline (Fig. 15) indicates that a downwelling intraseasonal Kelvin wave passage 405
could drive northward mass transport of 0.75 ± 0.4 Sv (mean ± standard deviation) across 406
depths of 125-450 m within the Makassar Strait pycnocline with a maximum northward 407
transport of ~2 Sv recorded in late May 2005 (Fig. 15). 408
409
5.2 Mixing 410
Ffield and Gordon (1992), using an archive of CTD datasets and 1-D advection and 411
diffusion equation, characterized tidal currents as the main forcing for the strong vertical 412
mixing with vertical diffusivity in excess of 10-4 m-2/s-1 in the Makassar Strait 413
thermocline. At intraseasonal timescales, Figs. 4b-d, 5 and 6 demonstrate that a Kelvin 414
wave episode in Makassar Strait is marked with the vertically sheared v’, which 415
potentially yields unstable stratification through Kelvin-Helmholtz instability and 416
contributes to the vertical mixing strength. In a steady, inviscid, non-diffusive, and stably 417
stratified, small disturbances are stable provided the Richardson number, Ri = 418
N2/(dv’/dz)2, is greater than ¼ everywhere in the fluid. The relationship between a Kelvin 419
wave and Kelvin-Helmholtz instability arises from the Kelvin’s wave perturbation to v’ 420
and T’. Thus if a Kelvin wave were important to govern the v’ variation across the 421
20
pycnocline depths in Makassar Strait, we would expect that the energetic wave episodes 422
correspond with small Ri. 423
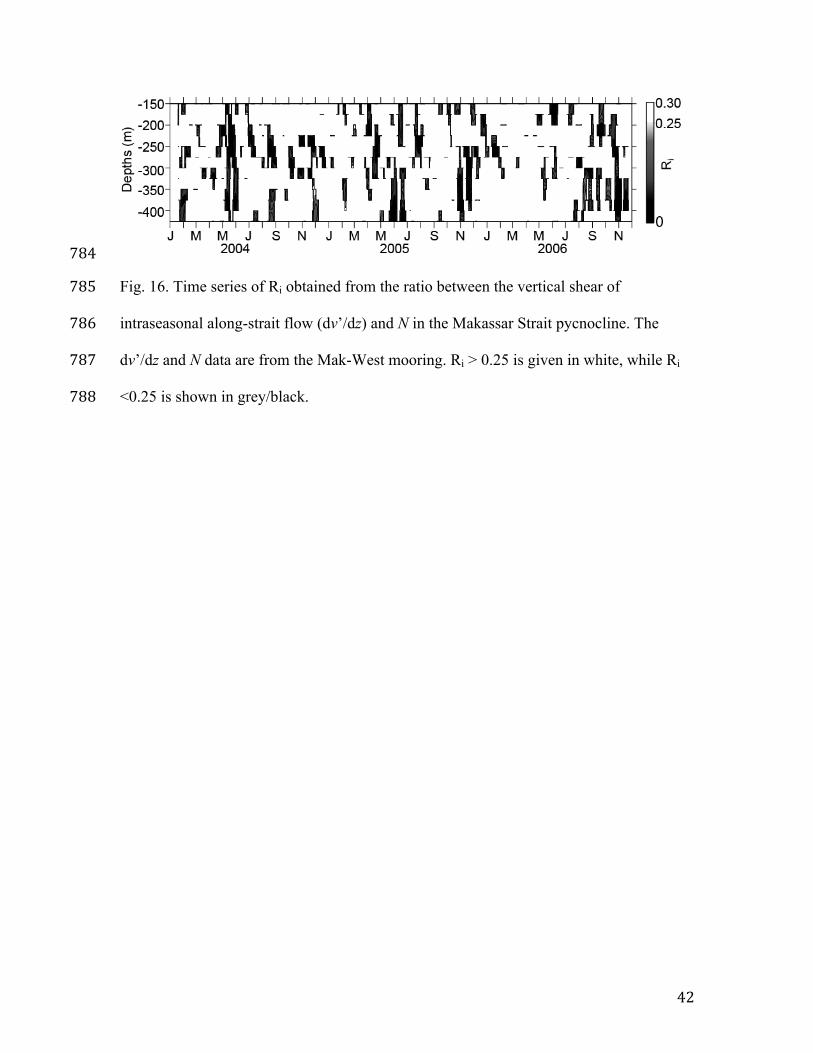
The Ri variability (Fig. 16) across the Makassar Strait pycnocline is computed using 424
the observed v’ and N at the Mak-West site, where N was computed by assuming ρ’ is 425
equivalent to T’. Fig. 16 demonstrates that the likelihood of unstable stratification within 426
the lower pycnocline depths is greater during the period when observed Kelvin wave 427
signatures are stronger in Makassar Strait (e.g. late May, August 2004, December 2004, 428
June 2005, November 2005). Furthermore the corresponding eddy viscosity coefficient is 429
parameterized using, Kv = 5.6 x 10⁻⁸ Ri-8.2, a formula appropriate in a region where 430
density variations are dominated by those of temperature (Thorpe, 2004) such as in 431
Makassar Strait, and the vertical diffusivity during strong Kelvin wave events varies from 432
1-5 x10⁻⁵ m2/s-1. 433
434
6. Discussion and Summary 435
We have described the characteristics of the 2-3 month oscillations measured in 436
Makassar Strait during 2004-2006, marking the weakened ITF transport across the 437
pycnocline and the vertically sheared v’ at the subpycnocline. A composite of the 17 +v’ 438
events found within the pycnocline depths exhibits an upward phase tilt, which implies a 439
vertically propagating wave attribute with a non-local origin. The v’ and T’ data across 440
the pycnocline show a quarter cycle of phase shift, which favors downward energy 441
propagation, and also the kinetic-potential energy equipartition. Warmer pycnocline 442
occuring during the +v’ episodes is also evident from the relation between v’ and T’. 443
Furthermore a normal mode approximation is also applicable to explain the link between 444
21
the vertical structure of v’ and stratification. We suggest that these characteristics 445
pertinent to the 2-3 month variability observed in the Makassar Strait are in agreement 446
with the theoretical downwelling Kelvin wave signatures. 447
The η’, u’ and v’ data in Lombok Strait also demonstrate two Kelvin wave 448
attributes in the semi geostrophic balance between v’ and dη’/dx and in enhanced dη’/dx, 449
which corroborates those reported by Drushka et al. (2010). The v’ data in Lombok Strait 450
and that in Makassar Strait are coherent and yield a Kelvin wave dispersion relationship 451
between the wavenumber and wave frequency. The waves propagate from Lombok Strait 452
to Makassar Strait with a phase speed of ~1.3 m/s, a 2nd mode baroclinic Kelvin wave 453
speed. The 2nd baroclinic wave mode inferred from the measured Kelvin wave phase 454
speed affirms the baroclinic vertical structure attributed to the +v’ events in Makassar 455
Strait which exhibits two-zero crossing points over depths. Through the comparison of 456
the +v’ episodes in Lombok Strait and Makassar Strait, we suggest that the Kelvin waves 457
navigate along the 100-m isobath and extends for ~1240 km, to transmit its energy from 458
Lombok Strait to Makassar Strait. Another shallower route, encompassing a distance of ~ 459
5195 km along the coasts of Java, Sumatra, and Kalimantan, is too long a pathway for a 460
baroclinic Kelvin wave to propagate over within the 12-16 days, the lags that the +v’ 461
events in Makassar Strait display relative to that in Lombok Strait. Thus the intraseasonal 462
Kelvin waves in Makassar Strait are linked to that in Lombok Strait. 463
Drushka et al. (2010) demonstrated that the model v’ data in Lombok Strait, 464
simulated by a simple wind-forced model forced by zonal winds in the eastern equatorial 465
Indian Ocean and along-shore winds along the Sumatra and Java coasts, showed a good 466
agreement with observation. Because the intraseasonal motions in Makassar Strait and 467
22
Lombok Strait are significantly correlated, the intraseasonal Kelvin waves in Makassar 468
Strait derive their energy from the same southeastern Indian Ocean winds. 469
Significant MJO phases preceded the Kelvin wave episodes in Makassar Strait 470
occurring in March and May 2004; May, and September 2005 with the maximum +v’ at 471
150 m associated with the Kelvin wave trailing the peak of MJO by 19-25 days. 472
Meanwhile the MJO leads +v’ at 150 m by 6-11 days, implying that the MJO’s footprint 473
in Makassar Strait lags that in Lombok Strait by 13-14 days, consistent with the number 474
of days a baroclinic Kelvin wave requires to propagate from the Lombok Strait moorings 475
to the Makassar Strait moorings. Unlike the study of Zhou and Murtugudde (2010), 476
which suggested that the MJO affected the intraseasonal variability only at the ITF 477
outflow passages such as Lombok Strait, we propose that the MJO-related oceanic Kelvin 478
wave is also observed in Makassar Strait. 479
The downwelling Kelvin wave passages affect the ITF transport anomalies, in 480
which a wave episode results in an averaged northward anomaly of ~0.75 Sv across the 481
pycnocline depths of 100-450 m. The wave passages are also commensurate with the 482
small Richardson number phases, during which dv’/dz is intensified amplifying the 483
likelihood of Kelvin-Helmholtz instability resulting in a vertical mixing with Kz of 1-484
5x10⁻⁵ m2s-1. 485
486
Acknowledgements 487
This work is supported by the National Science Foundation grant OCE-0219782 and 488
OCE-0725935 (LDEO) and OCE-0725476 (SIO). The altimeter data were produced by 489
SSALTO/DUACS and distributed by AVISO. The MJO index was obtained from 490
23
http://cawcr.gov.au/staff/mwheeler/maproom/RMM/RMM1RMM2.74toRealtime.txt). 491
This is Lamont-Doherty contribution number xxxx. 492
493
References 494
Arief, D., and S. P. Murray, 1996. Low-frequency fluctuations in the Indonesian 495
throughflow through Lombok Strait, J. Geophys. Res., 101(C5), 12, 455-12, 464, 496
doi:10.1029/96JC00051 497
Codiga, D. L., D. P. Renouard, and A. Fincham, 1999. Experiments on waves trapped 498
over the continental slope and shelf in a continuously stratified rotating ocean, and 499
their incidence on a canyon. J. Mar. Res., 57, 585-612. 500
Ducet, N., P. Y. Le Traon, and G. Reverdin, 2000. Global high-resolution mapping of 501
ocean circulation from TOPEX/POSEIDON and ERS-1 and -2. J. Geophys. Res., 502
105 (C8), 19, 477-498. 503
Drushka, K., Sprintall, K., Gille, S., Brodjonegoro, I., 2010. Vertical Structure of Kelvin 504
waves in the Indonesian Throughflow Exit Passages, J. Phys. Oceanogr., 40, 1965-505
1987. 506
Durland, T., and B. Qiu, 2003: Transmission of subinertial Kelvin waves through a strait. 507
J. Phys. Oceanogr., 33, 1337–1350. 508
Ffield, A., and A. L. Gordon, 1992. Vertical Mixing in the Indonesian Thermocline, J. 509
Phys. Oceanogr., 22, 184-195. 510
Gill, A. E., 1982. Atmosphere-Ocean Dynamics, Academic Press, NY, 662 pp. 511
24
Gordon, A.L. and Kamenkovich, V.M., 2010. Modelling and observing the Indonesian 512
Throughflow. A special issue of Dynamics of Atmosphere and Ocean. Dyn. Atmos. 513
Oceans, doi: 10.1016/j.dynatmoce.2010.04.003. 514
Gordon, A.L., Sprintall, J., Van Aken, H.M., Susanto D., Wijffels, S., Molcard, R., Ffield, 515
A., Pranowo, W. and Wirasantosa, S., 2010. The Indonesian Throughflow during 516
2004-2006 as Observed by the INSTANT program. Dyn. Atmos. Oceans, doi: 517
10.1016/j.dynatmoce.2009.12.002. 518
Gordon, A.L. and Fine, R. A., 1996. Pathways of Water between the Pacific and Indian 519
Oceans in the Indonesian Seas. Nature, 379, 146-149, doi: 10.1038/379146a0. 520
Gordon, A.L., Susanto, R.D., Ffield, A., Huber, B.A., Pranowo, W. and Wirasantosa, S., 521
2008. Makassar Strait Throughflow, 2004 to 2006. Geophys. Res. Lett., 35, L24605, 522
doi: 10.1029/2008GL036372. 523
Gordon, A. L., Susanto, R.D., Vranes, K., 2003. Cool Indonesian throughflow as a 524
consequence of restricted surface layer flow. Nature, 425, 824-828, doi: 525
10.1038/Nature02038 526
Gordon, A. L., 2005. Oceanography of the Indonesian Seas. Oceanography, 18(4):13, 527
http://dx.doi.org/10.5670/oceanog.2005.18 528
Hallock, Z. R, Teague, W. J., Jarosz, E., 2009. Subinertial slope-trapped waves in the 529
northeastern Gufl of Mexico. J. Phys. Oceanogr., 39, 1474-1485. 530
Pedlosky, J., 2003. Waves in the Ocean and Atmosphere, Springer-Verlaag, 276 pp. 531
Pujiana, K., Gordon, A.L, Sprintall, J. and Susanto, R.D., 2009. Intraseasonal variability 532
in the Makassar Strait Thermocline. J. Mar. Res., 67, 757-777. 533

25
Qiu, B., Mao, M. and Kashino, Y., 1999. Intraseasonal Variability in the Indo-Pacific 534
Throughflow and the Regions Surrounding the Indonesian Seas. J. Phys. Oceanogr., 535
29, 1599-1618, doi: 10.1175/1520-0485(1999)029<1599:IVITIP>2.0.CO;2. 536
Schiller, A., Wijffels, S.E., Sprintall, J., Molcard, R., Oke, P.R., 2010. Pathways of 537
intraseasonal variability in the Indonesian throughflow region. Dynamics of 538
Atmospheres and Oceans 50, 174-200, doi:10.1016/j.dynatmoce.2010.02.003. 539
Shinoda, T., Han, W., Metzger, E.J., and Hurlburt, H., 2012. Seasonal Variation of the 540
Indonesian Throughflow in Makassar Strait. J. Phys. Oceanogr., in press. 541
Sprintall., A. L. Gordon, R. Murtugudde, and R. D. Susanto., 2000. A Semiannual Indian 542
Ocean forced Kelvin wave observed in the Indonesian seas in May 1997. J. 543
Geophys. Res., 105(C7), 17, 217-17, 230, doi: 10.1029/2000JC900065. 544
Sprintall, J., Wijffels, S., Gordon, A.L., Ffield, A., Molcard, R., Susanto, R.D., Soesilo, I., 545
Sopaheluwakan, J., Surachman, Y. and Van Aken, H., 2004. INSTANT: A New 546
International Array to Measure the Indonesian Throughflow. Eos Trans. 547
AGU, 85(39), doi: 10.1029/2004EO390002. 548
Sprintall, J., S. Wijffels, R. Molcard, and I. Jaya, 2009. Direct estimates of the Indonesian 549
Throughflow entering the Indian Ocean, J. Geophys. Res. , 114, C07001, doi: 550
10.1029/2008JC005257. 551
Thorpe, S. A., 2004. Recent Developments in the Study of Ocean Turbulence, Ann. Rev. 552
Earth Planet. Sci., 32, pp. 91-109. 553
Wijffels, S., Meyers, G., 2004. An Intersection of Oceanic Waveguides: Variability in the 554
Indonesian Throughflow Region. J. Phys. Oceanogr., 34, 1232-1253. doi: 555
http://dx.doi.org/10.1175/1520-0485(2004)034<123:AIOOWV>2.0.CO;2. 556

26
Zhou, L. and R. Murtugudde, 2010. Influences of Madden-Julian Oscillations on the 782 557
eastern Indian Ocean and the maritime continent. Dyn. Atmos. Oceans, 50, 257-274. 558
559
560
561
562
563
564
565
566
567
568
569
570
571
572
573
574
575
576
577
578
579
27
580
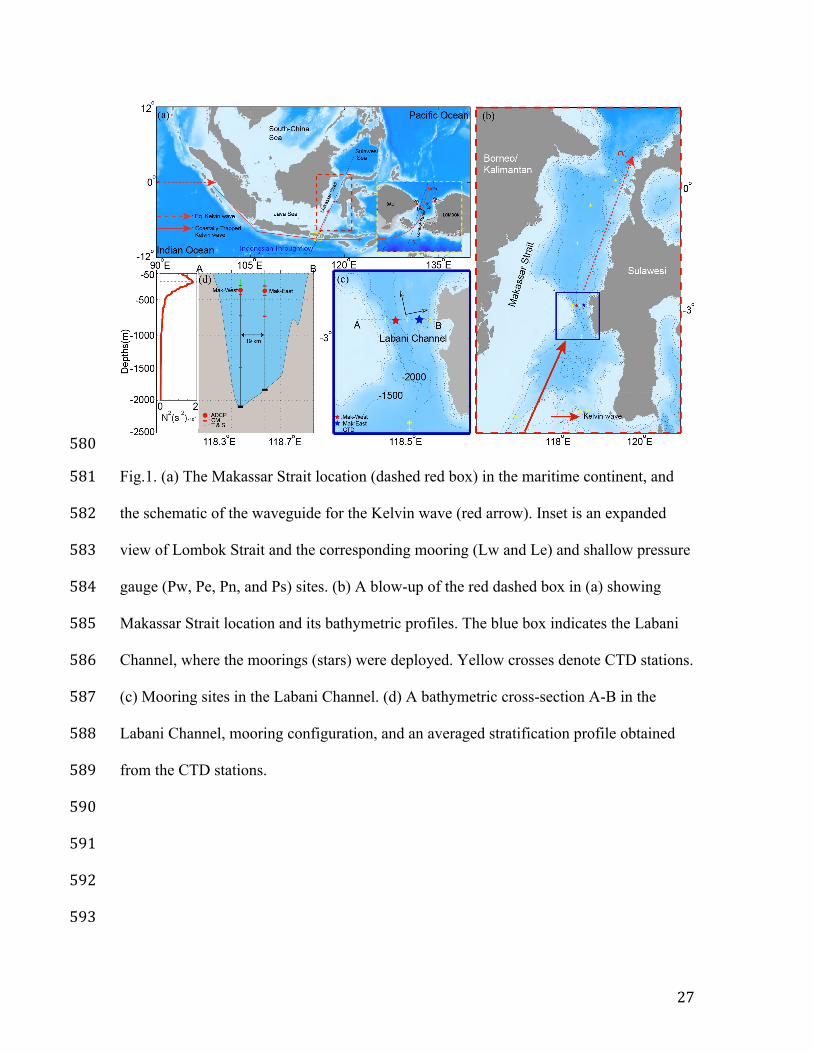
Fig.1. (a) The Makassar Strait location (dashed red box) in the maritime continent, and 581
the schematic of the waveguide for the Kelvin wave (red arrow). Inset is an expanded 582
view of Lombok Strait and the corresponding mooring (Lw and Le) and shallow pressure 583
gauge (Pw, Pe, Pn, and Ps) sites. (b) A blow-up of the red dashed box in (a) showing 584
Makassar Strait location and its bathymetric profiles. The blue box indicates the Labani 585
Channel, where the moorings (stars) were deployed. Yellow crosses denote CTD stations. 586
(c) Mooring sites in the Labani Channel. (d) A bathymetric cross-section A-B in the 587
Labani Channel, mooring configuration, and an averaged stratification profile obtained 588
from the CTD stations. 589
590
591
592
593
28
594
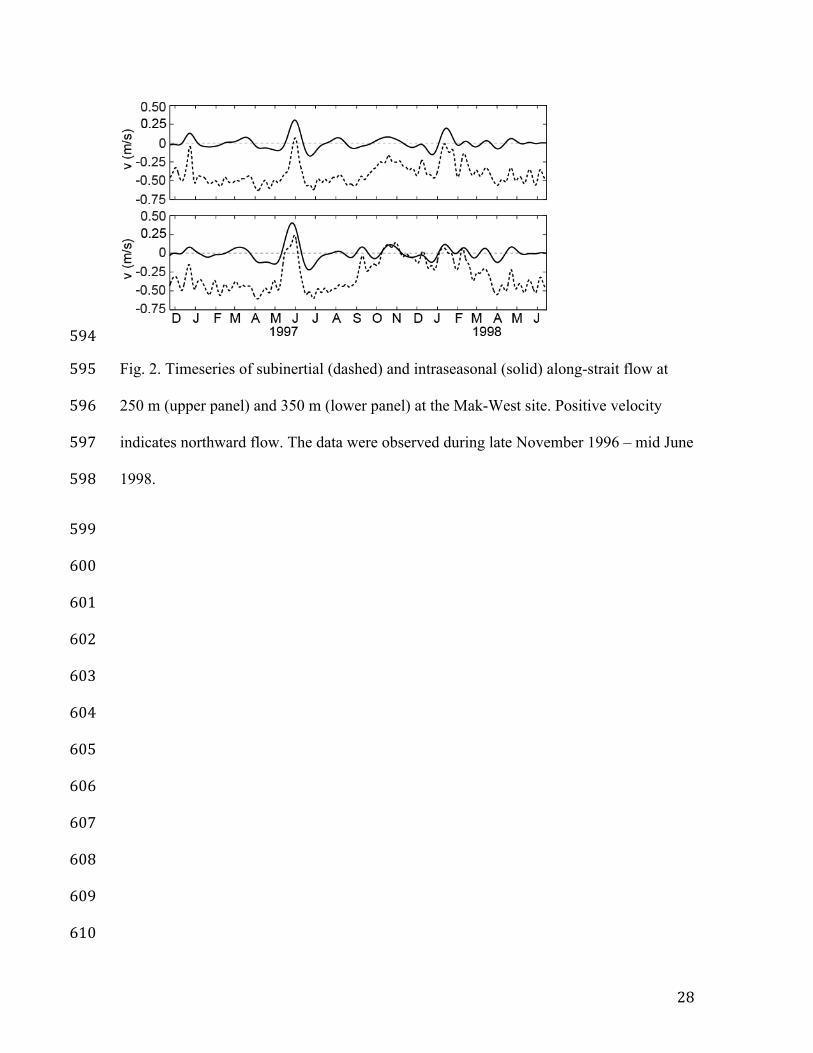
Fig. 2. Timeseries of subinertial (dashed) and intraseasonal (solid) along-strait flow at 595
250 m (upper panel) and 350 m (lower panel) at the Mak-West site. Positive velocity 596
indicates northward flow. The data were observed during late November 1996 – mid June 597
1998. 598
599
600
601
602
603
604
605
606
607
608
609
610
29
611
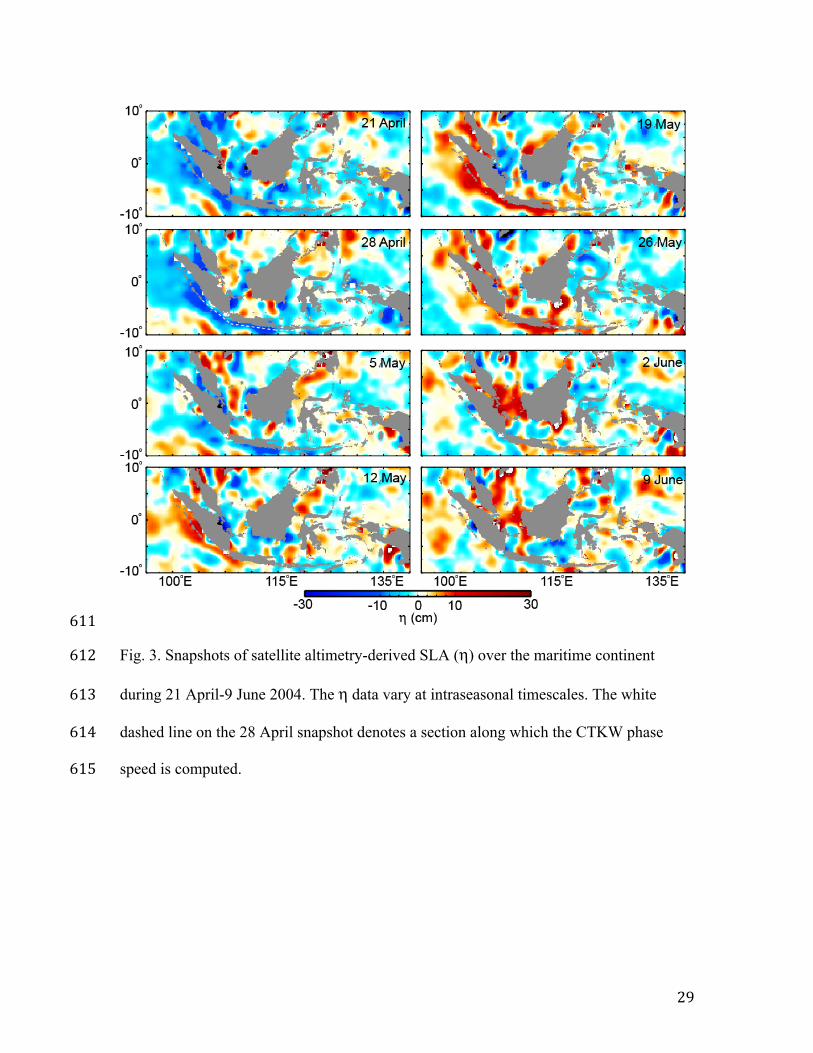
Fig. 3. Snapshots of satellite altimetry-derived SLA (η) over the maritime continent 612
during 21 April-9 June 2004. The η data vary at intraseasonal timescales. The white 613
dashed line on the 28 April snapshot denotes a section along which the CTKW phase 614
speed is computed. 615
30
616
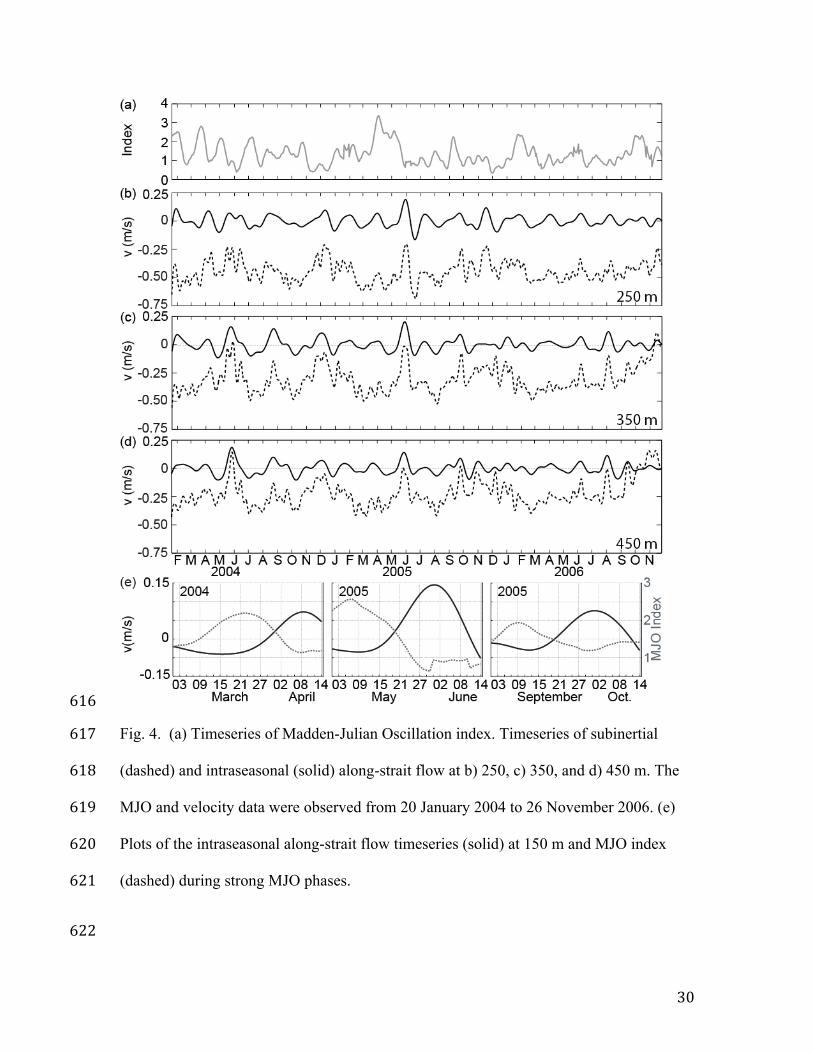
Fig. 4. (a) Timeseries of Madden-Julian Oscillation index. Timeseries of subinertial 617
(dashed) and intraseasonal (solid) along-strait flow at b) 250, c) 350, and d) 450 m. The 618
MJO and velocity data were observed from 20 January 2004 to 26 November 2006. (e) 619
Plots of the intraseasonal along-strait flow timeseries (solid) at 150 m and MJO index 620
(dashed) during strong MJO phases. 621
622

31
623
Fig. 5. The along-strait flow timeseries varying at subinertial (dashed) and intraseasonal 624
timescales (solid) observed at 750 m (a) and 1500 m (b) within the Mak-West 625
subpycnocline. (c) Vertical structure of the intraseasonal along-strait flow data across the 626
pycnocline and at two subpycnocline depths at three events when the intraseasonal along-627
strait flow at the pycnocline attains maximum value. 628
629
630
32
631
Fig. 6. The composite of the northward along-strait flow at intraseasonal timescales 632
observed at the Mak-West (left panel) and Mak-East (right panel) pycnocline. Day 0 was 633
defined as the time of the peak northward flow at 350 m. The dashed line with an arrow 634
denotes the phase line, and the angle (green curve) that the line makes with the horizontal 635
dashed line indicates upward phase shift of 50 m/day. 636
637
638
639
640
641
642
643
644
645

33
646
Fig. 7. The along strait flow (solid) and temperature (dashed) timeseries varying at 647
intraseasonal timescales observed at several depths within the Mak-West pycnocline 648
during May-June 2004. Positive velocity indicates northward flow. 649
650
651
652
653
654
655
656
657
658
659
660

34
661
Fig. 8. (a and b) Coherence amplitudes and phases between intraseasonal along-strait 662
flow at 200 m and that at deeper levels observed at the Mak-West lower pycnocline. The 663
coherence amplitudes and phases are for along-strait flow at a period of 60-days. (c) An 664
averaged profile of Brunt-Vaisalla frequency inferred from several Conductivity-665
Temperature-Depth (CTD) casts (yellow crosses in Fig.1) in Makassar Strait during 666
1996-1998. 667
668
669
670
671
672
673
674
675
35
676
Fig. 9. Vertical structure of potential (solid) and kinetic (dashed) energy across the lower 677
pycnocline. The potential and kinetic energy are inferred from temperature and along-678
strait flow varying at intraseasonal timescales observed at the Mak-West mooring. 679
680
681
682
683
684
685
686
687
688
689
690
691
36
692
Fig. 10. (Left) Coherence amplitudes and phases between the intraseasonal along-strait 693
flow timeseries at 100 m in Lombok Strait (Lombok-East/Le) and that at 100 m in 694
Makassar Strait (Mak-West). (Right) Dispersion relation diagram inferred from the phase 695
shift plot shown in the left panel. 696
697
698
699
700
701
702
703
704
705
706
707
708
37
709
Fig. 11. Dispersion diagram of horizontal versus zonal wavenumber at ω = 2π 60 day-1. 710
The markers indicate the estimated values from the data, the solid black line demonstrates 711
dispersion relation for a theoretical Kelvin wave, and the grey lines are the dispersion 712
relation for the first two modes of theoretical Rossby waves. 713
714
715
716
717
718
719
720
721
722
723
724
38
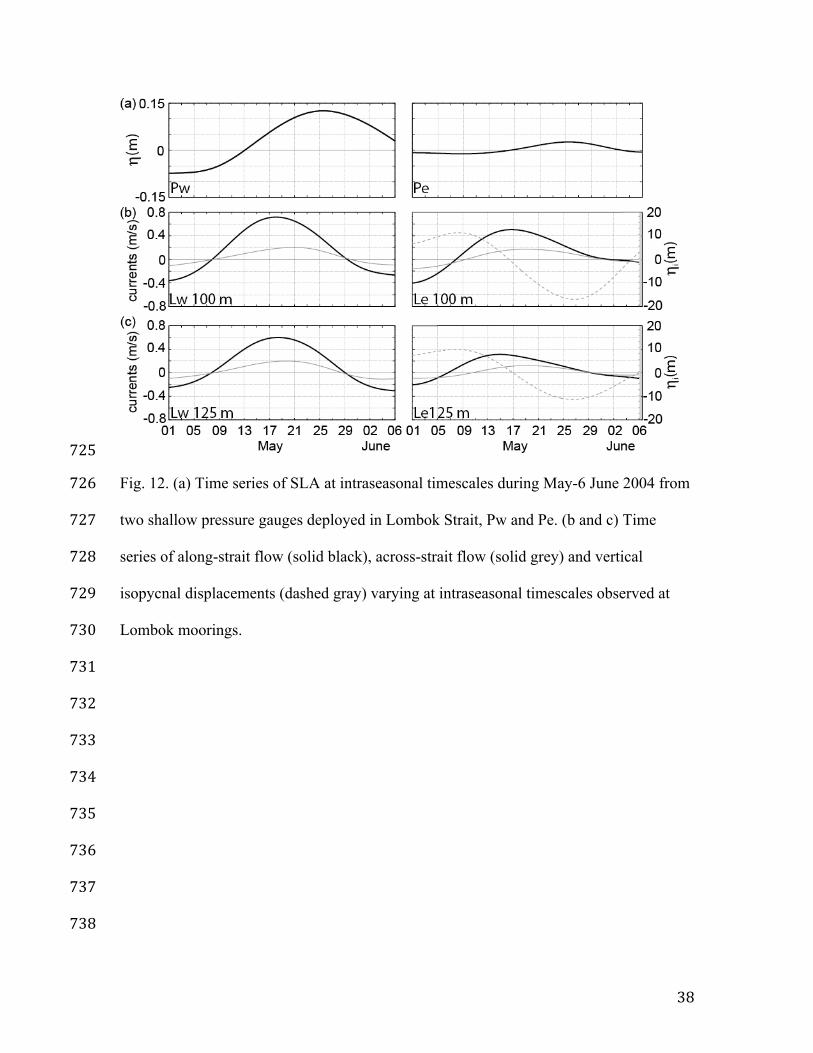
725
Fig. 12. (a) Time series of SLA at intraseasonal timescales during May-6 June 2004 from 726
two shallow pressure gauges deployed in Lombok Strait, Pw and Pe. (b and c) Time 727
series of along-strait flow (solid black), across-strait flow (solid grey) and vertical 728
isopycnal displacements (dashed gray) varying at intraseasonal timescales observed at 729
Lombok moorings. 730
731
732
733
734
735
736
737
738
39
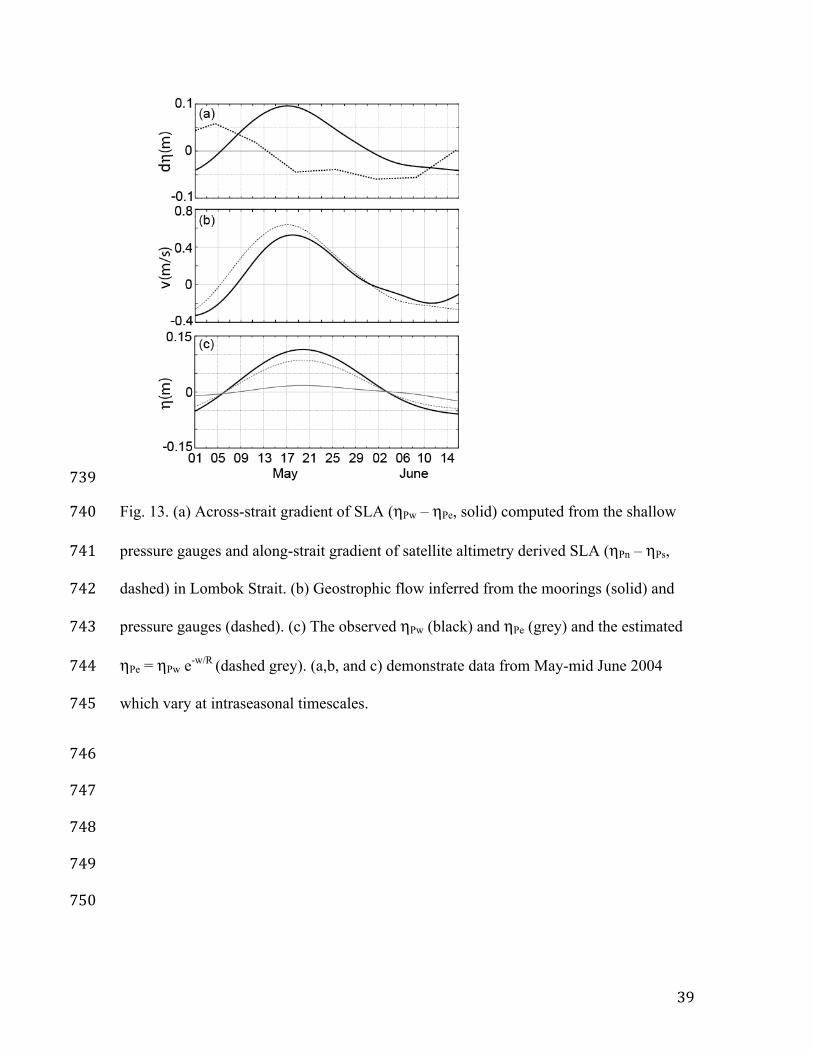
739
Fig. 13. (a) Across-strait gradient of SLA (ηPw – ηPe, solid) computed from the shallow 740
pressure gauges and along-strait gradient of satellite altimetry derived SLA (ηPn – ηPs, 741
dashed) in Lombok Strait. (b) Geostrophic flow inferred from the moorings (solid) and 742
pressure gauges (dashed). (c) The observed ηPw (black) and ηPe (grey) and the estimated 743
ηPe = ηPw e-w/R (dashed grey). (a,b, and c) demonstrate data from May-mid June 2004 744
which vary at intraseasonal timescales. 745
746
747
748
749
750
40
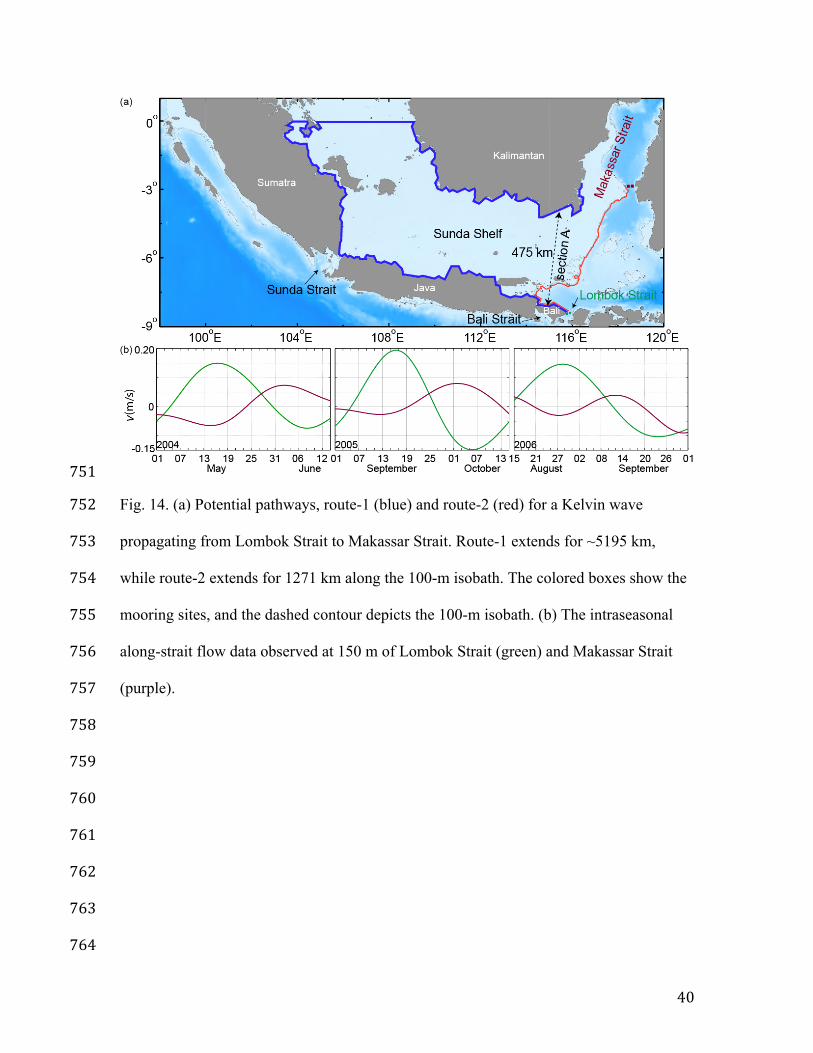
751
Fig. 14. (a) Potential pathways, route-1 (blue) and route-2 (red) for a Kelvin wave 752
propagating from Lombok Strait to Makassar Strait. Route-1 extends for ~5195 km, 753
while route-2 extends for 1271 km along the 100-m isobath. The colored boxes show the 754
mooring sites, and the dashed contour depicts the 100-m isobath. (b) The intraseasonal 755
along-strait flow data observed at 150 m of Lombok Strait (green) and Makassar Strait 756
(purple). 757
758
759
760
761
762
763
764
41
765
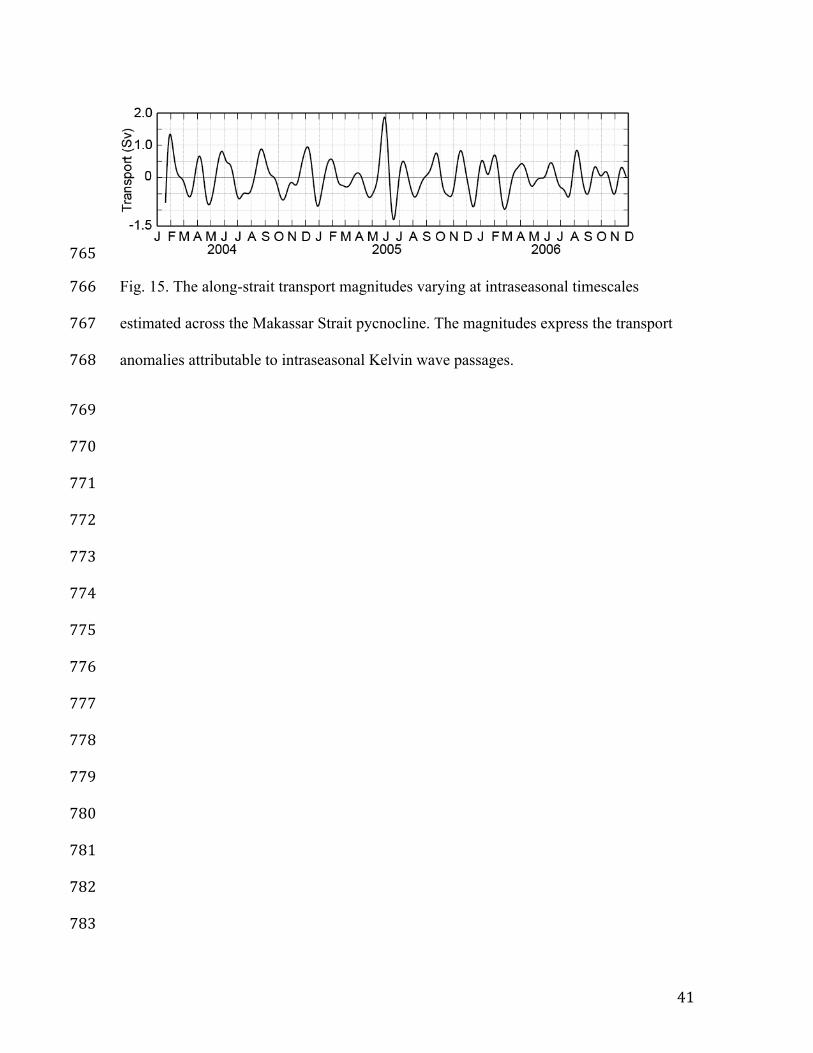
Fig. 15. The along-strait transport magnitudes varying at intraseasonal timescales 766
estimated across the Makassar Strait pycnocline. The magnitudes express the transport 767
anomalies attributable to intraseasonal Kelvin wave passages. 768
769
770
771
772
773
774
775
776
777
778
779
780
781
782
783
42
784
Fig. 16. Time series of Ri obtained from the ratio between the vertical shear of 785
intraseasonal along-strait flow (dv’/dz) and N in the Makassar Strait pycnocline. The 786
dv’/dz and N data are from the Mak-West mooring. Ri > 0.25 is given in white, while Ri 787
<0.25 is shown in grey/black. 788