Embed Size (px)
Citation preview
Title of Lesson: Introduction to Exponential FunctionsSubject: Algebra II HonorsGrade level: Sophomore, JuniorTeacher: Jaime Trainor
Objective(s): Recognize patterns in a table of values. Determine an equation for x based on a table of values. Relate a real-world example to exponential growth. Compare this to decay. Understand the graph of exponential functions including dependent and independent variables. Explain why a given function is exponential. Communicate ideas and thoughts in with one another as well as with the teacher Understand how to explain when answering questions or writing explanations/reflections.
Common Core Standards: IF.B.4 For a function that models a relationship between two quantities, interpret key features of graphs and
tables in terms of the quantities, and sketch graphs showing key features given a verbal description of the relationship.
IF.C.7 Graph functions expressed symbolically and show key features of the graph, by hand in simple cases and using technology for more complicated cases.
IF.C.7E Graph exponential and logarithmic functions, showing intercepts and end behavior, and trigonometric functions, showing period, midline, and amplitude.
IF.C.8 Write a function defined by an expression in different but equivalent forms to reveal and explain different properties of the function.
IF.C.8B Use the properties of exponents to interpret expressions for exponential functions. IF.C.9 Compare properties of two functions each represented in a different way (algebraically, graphically,
numerically in tables, or by verbal descriptions). For example, given a graph of one quadratic function and an algebraic expression for another, say which has the larger maximum.
Prerequisites: Students must have knowledge of linear and quadratic equations. They must have an understanding of working with a table of values and recognizing patterns. They must also be able to read and/or create a graph. Students must know how to effectively work in pairs to share thoughts and ideas.
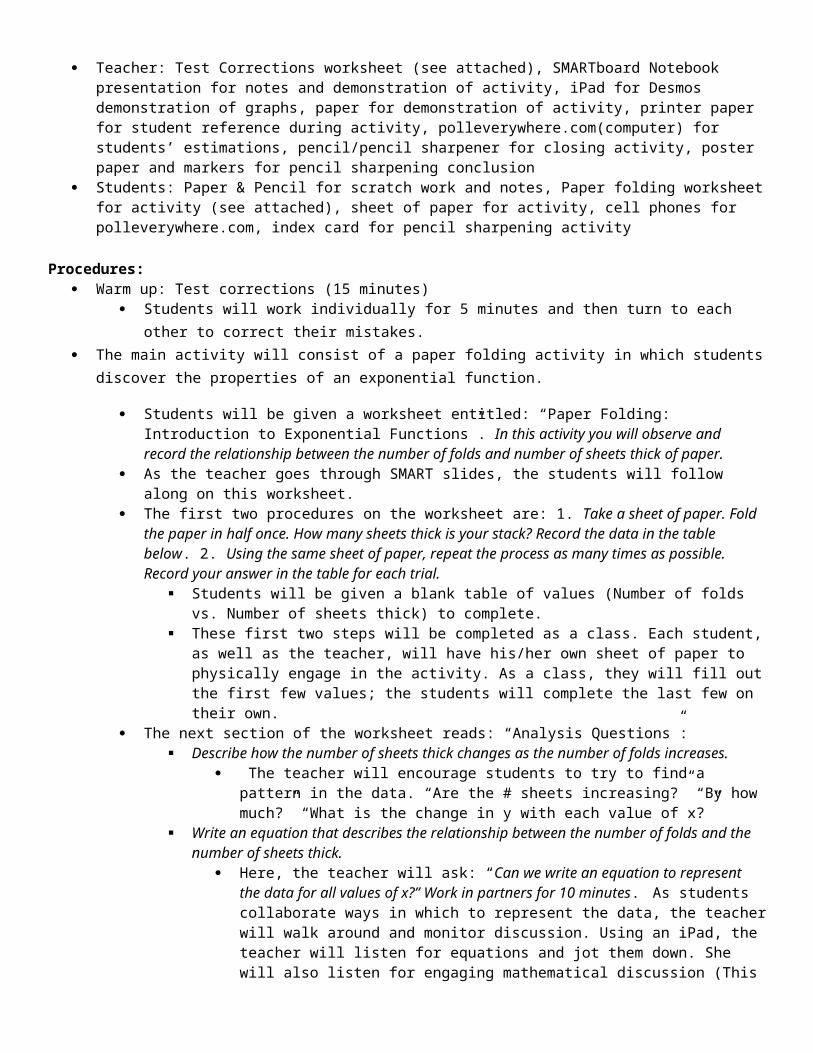
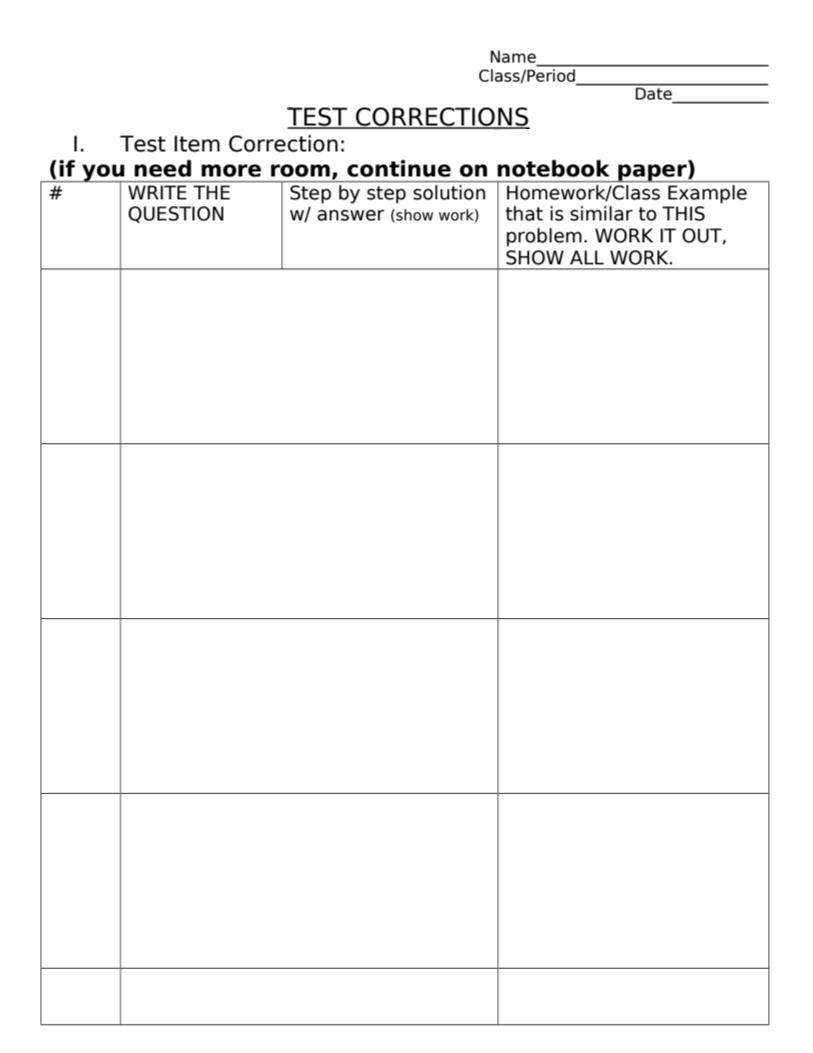
Materials/Preparation: Teacher: Test Corrections worksheet (see attached), SMARTboard Notebook presentation for notes and
demonstration of activity, iPad for Desmos demonstration of graphs, paper for demonstration of activity, printer paper for student reference during activity, polleverywhere.com(computer) for students’ estimations, pencil/pencil sharpener for closing activity, poster paper and markers for pencil sharpening conclusion
Students: Paper & Pencil for scratch work and notes, Paper folding worksheet for activity (see attached), sheet of paper for activity, cell phones for polleverywhere.com, index card for pencil sharpening activity
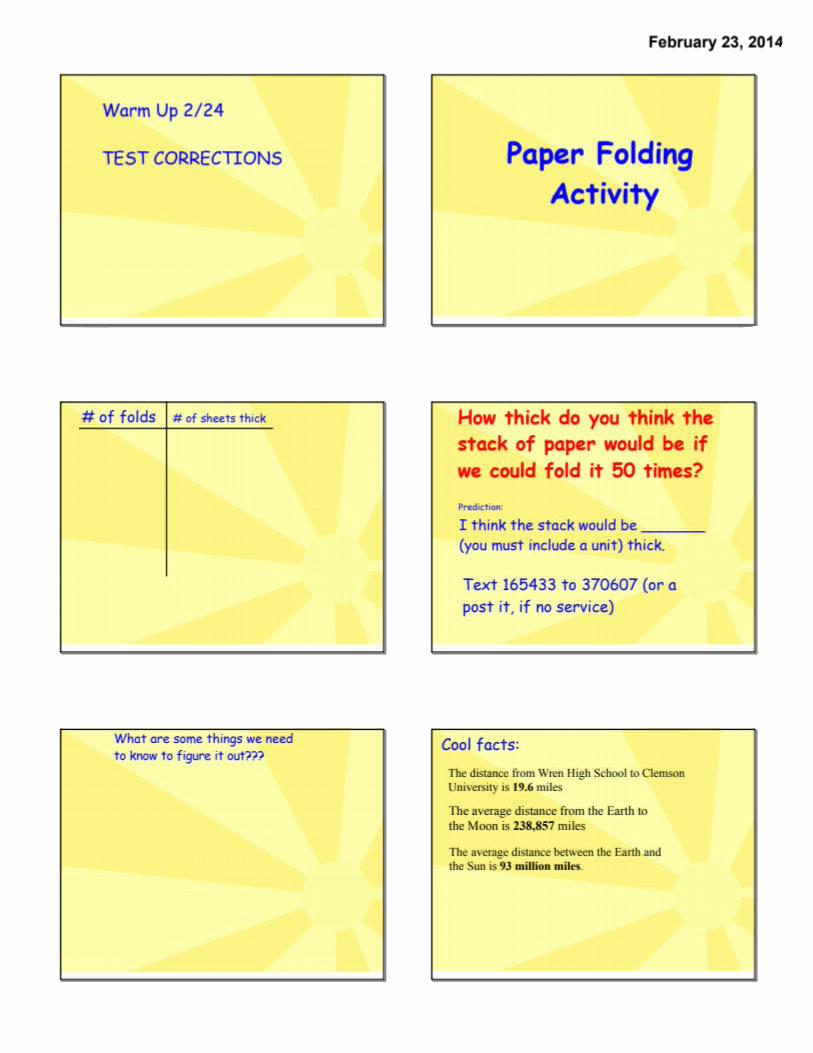
Procedures: Warm up: Test corrections (15 minutes)
Students will work individually for 5 minutes and then turn to each other to correct their mistakes. The main activity will consist of a paper folding activity in which students discover the properties of an
exponential function.
Students will be given a worksheet entitled: “Paper Folding: Introduction to Exponential Functions”. In this activity you will observe and record the relationship between the number of folds and number of sheets thick of paper.
As the teacher goes through SMART slides, the students will follow along on this worksheet. The first two procedures on the worksheet are: 1. Take a sheet of paper. Fold the paper in half once.
How many sheets thick is your stack? Record the data in the table below. 2. Using the same sheet of paper, repeat the process as many times as possible. Record your answer in the table for each trial.
Students will be given a blank table of values (Number of folds vs. Number of sheets thick) to complete.
These first two steps will be completed as a class. Each student, as well as the teacher, will have his/her own sheet of paper to physically engage in the activity. As a class, they will fill out the first few values; the students will complete the last few on their own.
The next section of the worksheet reads: “Analysis Questions”: Describe how the number of sheets thick changes as the number of folds increases.
The teacher will encourage students to try to find a pattern in the data. “Are the # sheets increasing?” “By how much?” “What is the change in y with each value of x?”
Write an equation that describes the relationship between the number of folds and the number of sheets thick.
Here, the teacher will ask: “Can we write an equation to represent the data for all values of x?” Work in partners for 10 minutes. As students collaborate ways in which to represent the data, the teacher will walk around and monitor discussion. Using an iPad, the teacher will listen for equations and jot them down. She will also listen for engaging mathematical discussion (This will serve as part of their participation grades for the day).
Following partner work, the class will engage in a discussion about the data. The teacher will begin by plotting the points from the table on a graph (using Desmos). She will then graph some of the equations overheard. Students will be able to visualize how only one equation (y=2x) goes through every point from the table. Therefore, that must be our function for this situation. The teacher will ask students: “What exactly does this equation tell us?” You can tell the number of sheets thick by solving 2(# folds)
Students will then skip to the graphing section of their worksheets and graph the data. The teacher will ask: “What are our independent and dependent variables?” “How do you know which is which?” The number of sheets thick depends on the number of folds.
Here, students are expected to include a title, labeled axes, and an appropriate scale (not too big/small)
The teacher will additionally print the Desmos graph for students to use in their portfolios (it will also be used at the end of class).
Following the graph, students will answer the next question on their worksheets: How thick do you think the stack of paper would be if we could fold it 50 times? Prediction (include units): ________________________________.
Students will think for 30 seconds and then be asked to text their answer to polleverywhere.com. Here, their predictions will pop up on the screen.
The teacher will address that we need some guidelines for actually solving this problem. What are some things that we need to know to figure it out?
The teacher will provide a reference for students to relate to (a pack of printer paper) The teacher will additionally provide students will conversion logistics that are necessary
for the problem. Students should know that: y=250=1.125x10¹⁵ sheets thick. But how tall is that exactly? After solving the problem, students will be given “cool facts” to relate their answer to
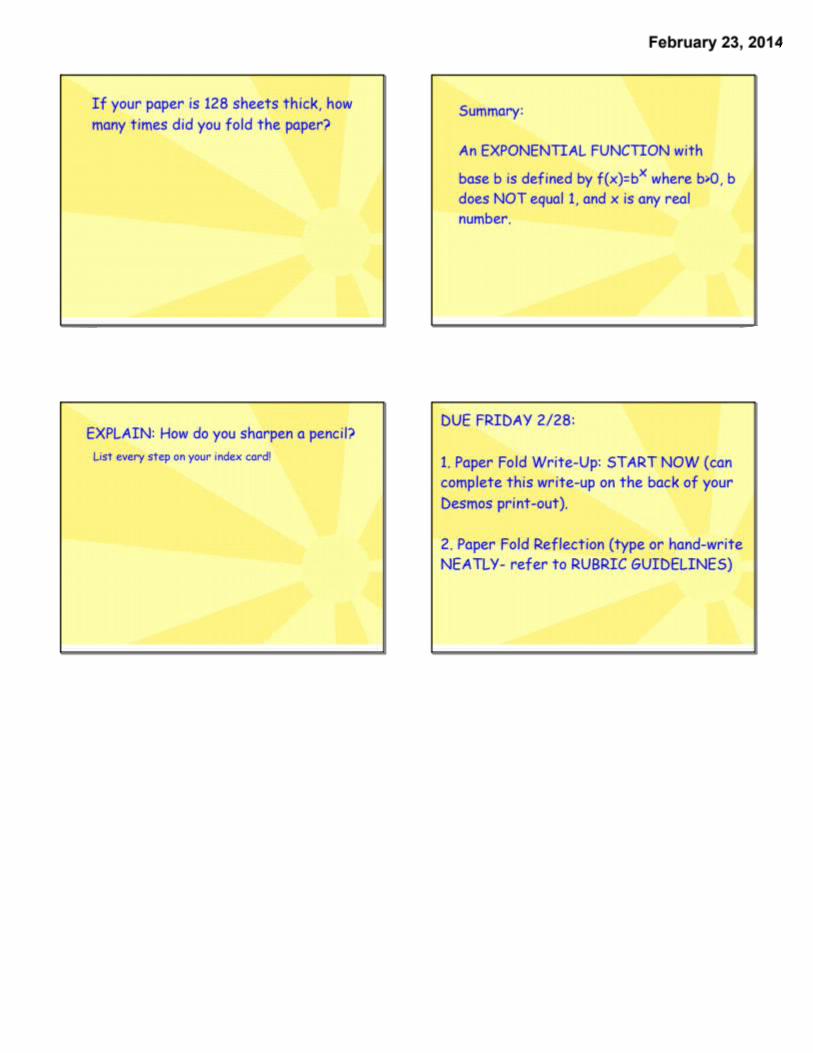
real-life. For instance, the distance from Clemson to Wren is 19.6 miles, etc. Following this activity, students will answer the next question: If your paper is 128 sheets thick,
how many times did you fold the paper? Students should easily see to plug 128 in for y and solve for x (number of folds): x=7
folds
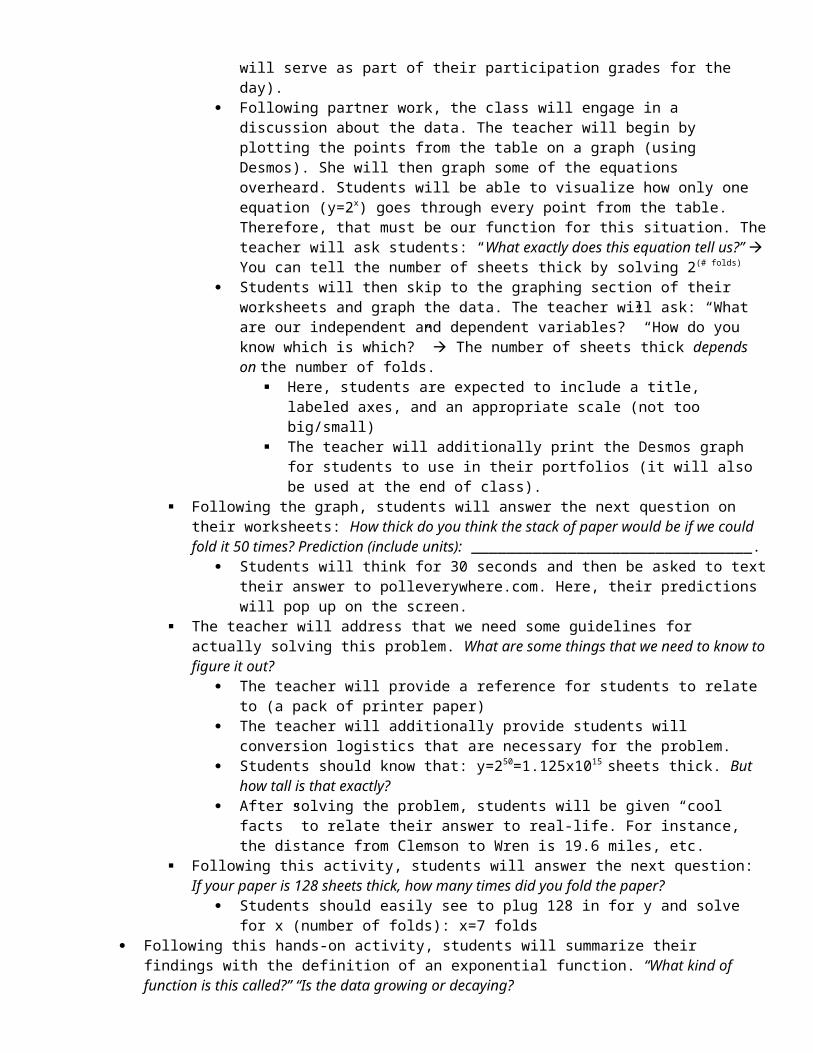
Following this hands-on activity, students will summarize their findings with the definition of an exponential function. “What kind of function is this called?” “Is the data growing or decaying?
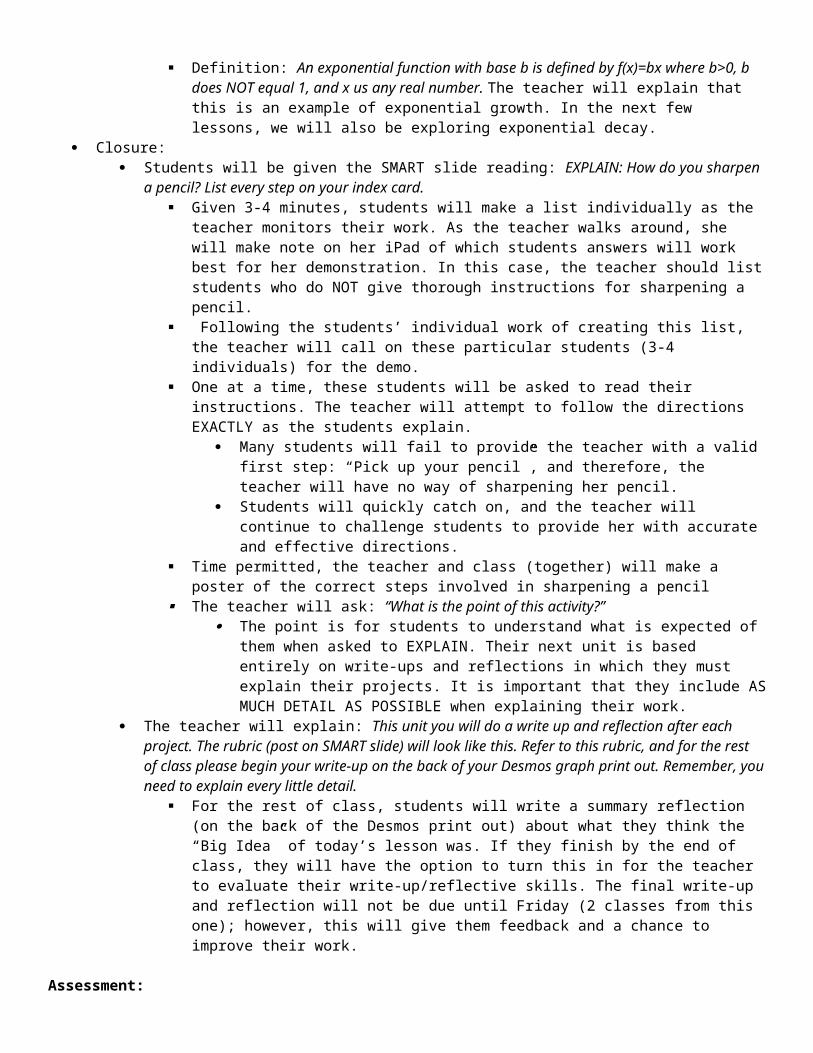
Definition: An exponential function with base b is defined by f(x)=bx where b>0, b does NOT equal 1, and x us any real number. The teacher will explain that this is an example of exponential growth. In the next few lessons, we will also be exploring exponential decay.
Closure: Students will be given the SMART slide reading: EXPLAIN: How do you sharpen a pencil? List every step
on your index card. Given 3-4 minutes, students will make a list individually as the teacher monitors their work. As
the teacher walks around, she will make note on her iPad of which students answers will work best for her demonstration. In this case, the teacher should list students who do NOT give thorough instructions for sharpening a pencil.
Following the students’ individual work of creating this list, the teacher will call on these particular students (3-4 individuals) for the demo.
One at a time, these students will be asked to read their instructions. The teacher will attempt to follow the directions EXACTLY as the students explain.
Many students will fail to provide the teacher with a valid first step: “Pick up your pencil”, and therefore, the teacher will have no way of sharpening her pencil.
Students will quickly catch on, and the teacher will continue to challenge students to provide her with accurate and effective directions.
Time permitted, the teacher and class (together) will make a poster of the correct steps involved in sharpening a pencil
The teacher will ask: “What is the point of this activity?” The point is for students to understand what is expected of them when asked to
EXPLAIN. Their next unit is based entirely on write-ups and reflections in which they must explain their projects. It is important that they include AS MUCH DETAIL AS POSSIBLE when explaining their work.
The teacher will explain: This unit you will do a write up and reflection after each project. The rubric (post on SMART slide) will look like this. Refer to this rubric, and for the rest of class please begin your write-up on the back of your Desmos graph print out. Remember, you need to explain every little detail.
For the rest of class, students will write a summary reflection (on the back of the Desmos print out) about what they think the “Big Idea” of today’s lesson was. If they finish by the end of class, they will have the option to turn this in for the teacher to evaluate their write-up/reflective skills. The final write-up and reflection will not be due until Friday (2 classes from this one); however, this will give them feedback and a chance to improve their work.
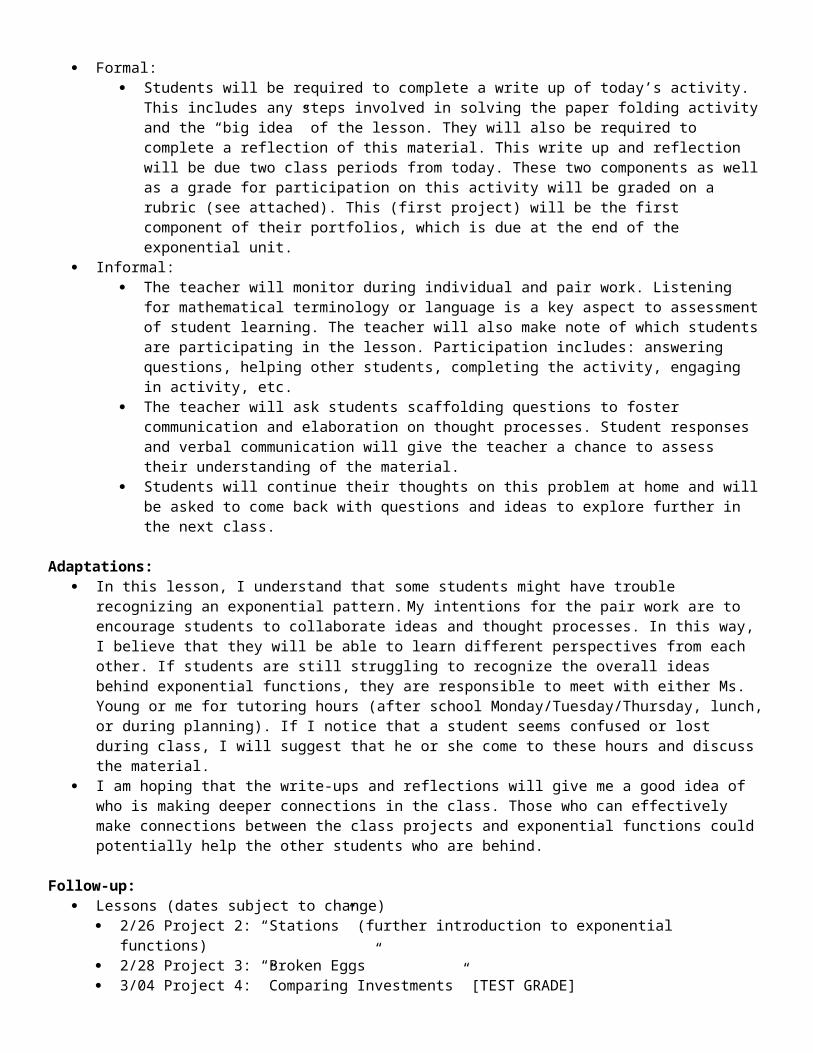
Assessment: Formal:
Students will be required to complete a write up of today’s activity. This includes any steps involved in solving the paper folding activity and the “big idea” of the lesson. They will also be required to complete a reflection of this material. This write up and reflection will be due two class periods from today. These two components as well as a grade for participation on this activity will be graded on a rubric (see attached). This (first project) will be the first component of their portfolios, which is due at the end of the exponential unit.
Informal: The teacher will monitor during individual and pair work. Listening for mathematical terminology or
language is a key aspect to assessment of student learning. The teacher will also make note of which students are participating in the lesson. Participation includes: answering questions, helping other students, completing the activity, engaging in activity, etc.
The teacher will ask students scaffolding questions to foster communication and elaboration on thought processes. Student responses and verbal communication will give the teacher a chance to assess their understanding of the material.
Students will continue their thoughts on this problem at home and will be asked to come back with questions and ideas to explore further in the next class.
Adaptations: In this lesson, I understand that some students might have trouble recognizing an exponential pattern. My
intentions for the pair work are to encourage students to collaborate ideas and thought processes. In this way, I believe that they will be able to learn different perspectives from each other. If students are still struggling to recognize the overall ideas behind exponential functions, they are responsible to meet with either Ms. Young or me for tutoring hours (after school Monday/Tuesday/Thursday, lunch, or during planning). If I notice that a student seems confused or lost during class, I will suggest that he or she come to these hours and discuss the material.
I am hoping that the write-ups and reflections will give me a good idea of who is making deeper connections in the class. Those who can effectively make connections between the class projects and exponential functions could potentially help the other students who are behind.
Follow-up: Lessons (dates subject to change)
2/26 Project 2: “Stations” (further introduction to exponential functions) 2/28 Project 3: “Broken Eggs” 3/04 Project 4: ”Comparing Investments” [TEST GRADE] 3/06 Project 5: “The Forgotten Account” 3/10 Project 6: “Logarithms-Alice” 3/12: Project 7: ”Continuously Compounded Interest” (natural base e connection) PORTFOLIO DUE
Reflection:
Algebra 2 Honors Name: Class/Period:_________Date:
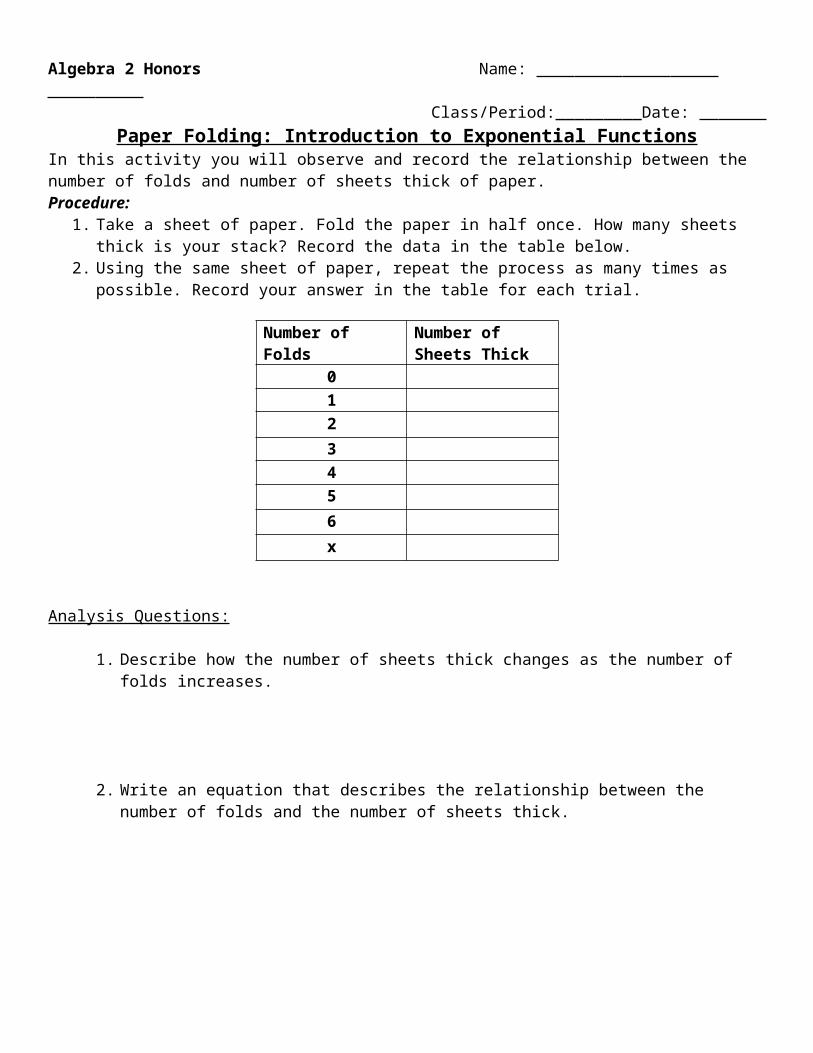
Paper Folding: Introduction to Exponential FunctionsIn this activity you will observe and record the relationship between the number of folds and number of sheets thick of paper. Procedure:
1. Take a sheet of paper. Fold the paper in half once. How many sheets thick is your stack? Record the data in the table below.
2. Using the same sheet of paper, repeat the process as many times as possible. Record your answer in the table for each trial.
Analysis Questions:
1. Describe how the number of sheets thick changes as the number of folds increases.
2. Write an equation that describes the relationship between the number of folds and the number of sheets thick.
Number of Folds Number of Sheets Thick
0123456x
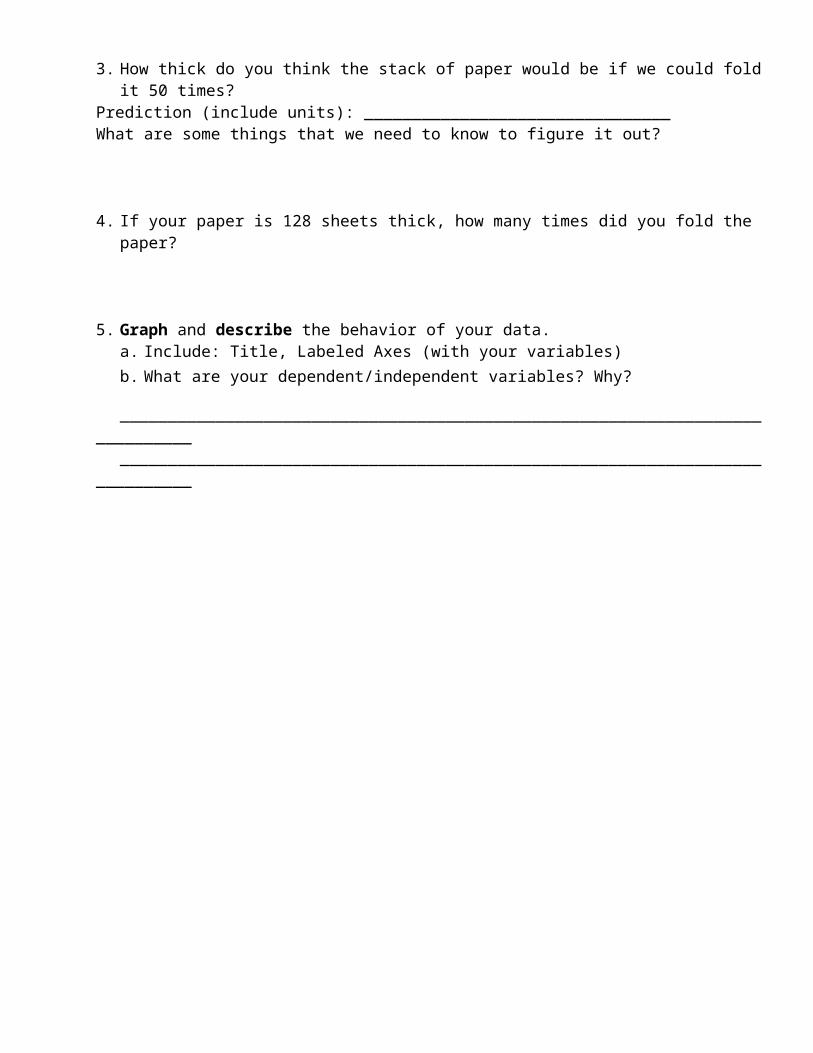
3. How thick do you think the stack of paper would be if we could fold it 50 times?Prediction (include units): ________________________________What are some things that we need to know to figure it out?
4. If your paper is 128 sheets thick, how many times did you fold the paper?
5. Graph and describe the behavior of your data. a. Include: Title, Labeled Axes (with your variables)b. What are your dependent/independent variables? Why?
__________________________________________________________________________________________________________________________________________________________c. Appropriate Scale (should fit the page…i.e. not too small/big)
Algebra 2 Honors Name: Class/Period:_________Date:
Paper Folding: Introduction to Exponential FunctionsIn this activity you will observe and record the relationship between the number of folds and number of sheets thick of paper. Procedure:
3. Take a sheet of paper. Fold the paper in half once. How many sheets thick is your stack? Record the data in the table below.
4. Using the same sheet of paper, repeat the process as many times as possible. Record your answer in the table for each trial.
Analysis Questions:
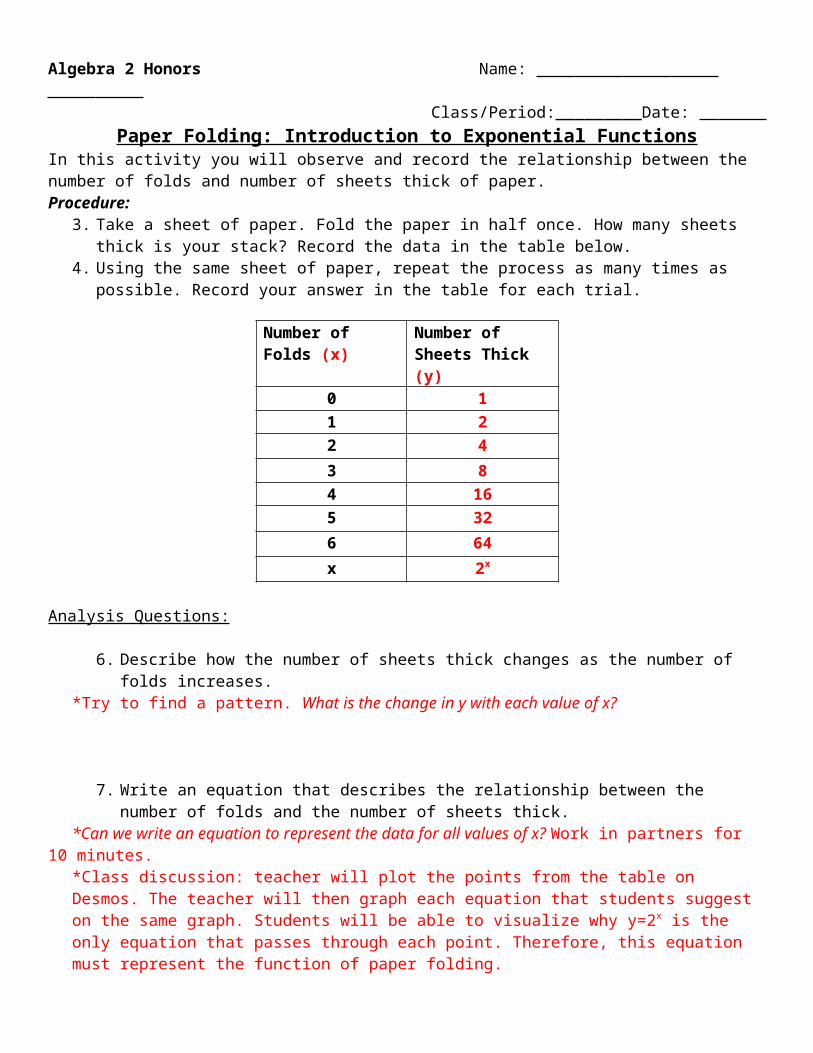
6. Describe how the number of sheets thick changes as the number of folds increases. *Try to find a pattern. What is the change in y with each value of x?
7. Write an equation that describes the relationship between the number of folds and the number of sheets thick.
*Can we write an equation to represent the data for all values of x? Work in partners for 10 minutes. *Class discussion: teacher will plot the points from the table on Desmos. The teacher will then graph each equation that students suggest on the same graph. Students will be able to visualize why y=2x is the only equation that passes through each point. Therefore, this equation must represent the function of paper folding.*Ask students: What exactly does this equation tell us? You can tell the number of sheets thick by solving 2(# folds)
Number of Folds (x) Number of Sheets Thick (y)
0 11 22 43 84 165 326 64x 2x
8. How thick do you think the stack of paper would be if we could fold it 50 times?Prediction (include units): ________________________________What are some things that we need to know to figure it out?*y=250=1.125x10¹⁵ sheets thick. But how tall is that exactly? Compare to this stack of printer paper.
9. If your paper is 128 sheets thick, how many times did you fold the paper? *Plug 128 in for y and solve for x (number of folds): x=7 folds
10. Graph and describe the behavior of your data. d. Include: Title, Labeled Axes (with your variables) *Number of Folds vs. Sheets Thicke. What are your dependent/independent variables? Why?
*Dependent (x): # Sheets thick, Independent (y): # folds the # of sheets thick depends on how many folds.
f. Appropriate Scale (should fit the page…i.e. not too small/big) *Which quadrant is our graph in? Why?
Name__________________________________________________________Class______________________Date_______________________
Unsatisfactory (0-1) Developing (2-3) Proficient (4-5) Points
Participation Student comes to class unprepared for group project. Student shows no effort, communication, or participation during group project.
Student is prepared and stays on task during activity; however he/she does not play an active role in contributing ideas and questions to the group. Student demonstrates correct mathematical understanding, but lacks effective group communication.
Student is actively engaged in the project and is an effective contributor to the group. Student asks meaningful questions and seeks perspective from other group members. Student stays on task during activity and is prepared with correct materials for the lesson.
Write-Up & Class work
Problem is not attempted, shows virtually no understanding, or has significant flaws or omissions.
Work demonstrates good understanding of the problem, but has some minor flaws or omissions.
Work demonstrates understanding and underlying concepts of the activity. Work sufficiently addresses each component of the problem and has a correct solution.
Unsatisfactory (0-2) Developing (3-6) Proficient (7-10) PointsReflection Reflection is not attempted or
does not include a “Big Idea” of the activity. Reflection does not include personal strengths/weaknesses of this activity and/or lacks description of student’s role in his/her group.
Reflection demonstrates good understanding of the “Big Idea” of the problem, but lacks description of personal strengths/weaknesses of this activity (or lacks description of student’s role in his/her group).
Reflection demonstrates understanding of the “Big Idea” of the problem. Reflection addresses personal strengths/weaknesses of this activity and includes a description of student’s role in his/her group. (Will vary)
Project (Rubric):__________________________________________________________________________________
PORTFOLIO:
1. Projects (6) [140 pts]a. Paper Folding (2/24)b. Stations (2/26)c. Broken Eggs (2/28)d. Comparing Investments (3/4)pre/post assessment & activity TEST GRADEe. The Forgotten Account (3/6)f. Logarithms: Alice (3/10)g. Natural Base e connection with continuous compound interest (3/12)h. Final Portfolio TBD
*Class work for projects includes a formal write up as well as any pictures/graphs/charts/tables from the activity.
2. Self-Evaluation/Reflection [60 pts]a. Self-growthb. Knowledge of content (skills learned)c. Personal strengths, weaknessesd. Participation with your group (your role)e. Group communication problems you encounteredf. Specific positive group interactions that you encounteredg. Perspective on the unit: Did you like it?
* Students will complete work/activity and write a reflection in class. They will be provided a rubric to guide their work around expectations for the lesson. Students will formally type/hand-write class work and reflections at home (or in school at lab). Deadlines will indicate when a write up or reflection is due. Deadlines will allow for students to receive feedback on these projects and have the option to improve their work before the final Portfolio is due. This will allow for students to progressively work towards a complete portfolio for the exponential/logarithmic unit.