Embed Size (px)
Citation preview

McGRAW-HILL
INTRODUCING GIVI™: THE S&P GLOBAL INTRINSIC VALUE INDEX May 2012
Launched in March 2012, the S&P GIVI™ (Global Intrinsic Value Index) is a rules-based, global equity strategy index designed to capture two well-documented, persistent anomalies in the equity markets – namely, the low-volatility and value anomalies. The S&P GIVI tries to deliver – in a single index – both lower volatility and an alternative stock weighting scheme, whereby each stock is weighted by its intrinsic value, rather than its market capitalization. Based on our review of the time period studied, we find that when the performance of the S&P GIVI and its sub-indices is compared to that of well-known market cap-weighted benchmarks, the S&P GIVI outperforms across the nine regions studied: global, developed markets, emerging markets, U.S., Europe, U.K., Japan, emerging Asia Pacific, and Pan Asia ex Japan, Australia and New Zealand. Both low-volatility screening and the intrinsic value weighting scheme systematically contribute to the S&P GIVI’s tendency to outperform. We have also compared the S&P GIVI to various existing alternatively weighted indices, with a focus on factor exposures and the practicalities of institutional investing. We find that the S&P GIVI incorporates a unique alternative index strategy combining important features of fundamental-based and low-volatility strategies. Its intrinsic value weighting not only appears to capture the value premium, but also enables more exposure to growth opportunities than traditional fundamentally weighted indices. In addition, the index tends to retain the important characteristics of a fundamental-based index strategy, such as broad economic representation, high investment capacity and moderate implementation cost. These characteristics suggest that it may efficiently capture the equity risk premium, while simultaneously harvesting the value and low-volatility factor premia. 1: Introduction Among practical applications of financial theory, indexing remains one of the most straightforward manifestations of theoretical thoughts in action, and often reflects the generally accepted investment paradigm of its time. Since Standard & Poor’s introduced the first market capitalization-weighted index in 1923, cap-weighting has become the dominant weighting scheme of index investing. Today, broad market indices weighted by market cap are widely used by both institutional and individual investors to access market beta in an efficient and cost-effective manner. The success of market cap-weighted indices is the culmination of academic
Contributors: Priscilla Luk Director Index Research & Design [email protected] Xiaowei Kang Director Index Research & Design [email protected] Frank Luo Global Head Index Research & Design [email protected]

S&P DOW JONES INDICES | INTRODUCING GIVI: THE GLOBAL INTRINSIC VALUE INDEX May 2012
2 McGRAW-HILL
and empirical studies of the past several decades. Though they were once revolutionary ideas, MPT, Modern Portfolio Theory (Markowitz, 1952), the CAPM, Capital Asset Pricing Model (Sharpe, 1964) and the EMH, Efficient Market Hypothesis (Fama, 1970), have become generally accepted wisdom. The practical applications of these studies form the foundations of modern portfolio management. While the current paradigm is well accepted and routinely used in investment management, there are exceptions to the orthodoxy. Over the years, researchers and practitioners have identified some systematic anomalies that are not taken into account by the current investment paradigm. Among them, the low-volatility and value anomalies are two that are documented to be persistent and applicable globally across regions. 1.1 The Low-Volatility Anomaly The persistent outperformance of low-volatility stocks relative to high-volatility stocks is known as the “low-volatility anomaly.” It is considered an anomaly because it deviates from the CAPM theory, which predicts that a stock’s return is proportional to its beta, implying that a high-beta, high-volatility stock should outperform. However, empirical studies show that high-risk stocks underperform low-risk stocks on a risk-adjusted basis, where risk is measured by volatility or beta. The outperformance of low-volatility stocks has been documented by numerous academic studies, and has occurred over a long period of time in numerous markets. Haugen and Baker (1991) studied the low-volatility stocks in the Wilshire 5000 index from 1972 through 1989 and found that the portfolio of low-volatility stocks exhibited better performance than the market cap-weighted benchmark with a consistently higher Sharpe ratio. Fama and French (2004) offered evidence that low-beta stocks traded on U.S. exchanges generate higher returns than market cap-weighted benchmarks, and that high-beta stocks underperform the CAPM prediction. They changed the size of the window used in the estimation of the stock beta from 24 to 60 months to show that results are robust for this parameter. Baker, Bradley and Wurgler (2011) used the Center for Research in Security Prices (CRSP) data to show that from January 1968 through December 2008, for all publicly traded stocks including the top 1000 largest stocks by market cap, the stocks with the lowest beta substantially outperformed the high-beta stocks. Frazzini and Pedersen (2010) studied global stocks and showed that the low-volatility anomaly applies not only to U.S. stocks but also to global equities. Practitioners have long tried to incorporate this anomaly into portfolio management. In fact, as far back as 1972, there was an attempt to design an investment vehicle to explore the anomaly. Wells Fargo Investment Advisors launched StageCoach, a mutual fund designed to specifically invest in low-beta stocks (Mehrling 2005). The fund was based on the ideas and observations of Fischer Black, Michael Jensen and Myron Scholes, who had found that low-beta stocks tended to outperform higher-beta stocks. However, Wells Fargo eventually discontinued this fund due to concerns about market sector concentrations that could hinder the ability of the fund to diversify. This anecdote illustrates the importance of taking into account practicalities of the institutional investment process; while achieving low volatility might be a primary goal, it is also important to balance investment capacity, costs and the need for diversification. Such lessons are reflected in our current approach to incorporating low volatility; instead of solely minimizing portfolio volatility, we remove only the most volatile stocks, while maintaining the diversification and economic representation of a broad equity portfolio.

S&P DOW JONES INDICES | INTRODUCING GIVI: THE GLOBAL INTRINSIC VALUE INDEX May 2012
3 McGRAW-HILL
1.2 The Value Anomaly The second phenomenon is known as the value anomaly: overvalued stocks, as measured by basic accounting data, generate poor returns relative to undervalued stocks. The value approach stems from the observation that behaviors of market participants can lead to boom-bust scenarios for stock prices, and thus the dislocation of market price from a company’s true value, or “intrinsic value.” Value as an investment principal predates modern methods of portfolio management (Graham and Dodd 1934), and has proven to be a successful investment strategy over the long term. When broad market indices are weighted by market cap, as determined by stock price, they may systematically over-weight overvalued stocks and under-weight undervalued stocks in a portfolio due to the automatic link between stocks’ prices and their index weights. This effect has been most evident during stock market bubbles, such as the Japanese asset price bubble in the late 1980s and the global information technology bubble in the late 1990s. As investment processes evolve, practitioners are increasingly seeking to apply some of the core principals of value investing in a systematic manner, in the form of alternative index strategies. Value based index strategies offer a time-tested alternative that breaks the automatic link between the stock price and weighting. Although it is difficult to calculate a stock’s true value in an absolute sense, several approaches have been developed to provide a good proxy in a relative sense. Among them, fundamental-based strategies such as fundamental indices have generated much discussion (Arnott, Hsu and Moore, 2005). In this framework, fundamental measures of company size, such as sales, cash flow and book value, are used as proxies for measuring a company’s true value, and the indices are weighted using these fundamental accounting measures. Thus, fundamentally weighted indices essentially represent value strategies, with a systematic value tilt relative to market cap-weighted indices. Another approach, based on the intrinsic value model, builds on previous fundamental-based strategies and is the strategy we adopted to create the S&P GIVI. Using this approach, an equity valuation model (Pinto, Henry, Robinson and Stowe, 2010) based on discounted future residue income is used to give a quantitative estimation of a stock’s intrinsic value. A stock’s weight in the intrinsic value index is determined by its theoretical intrinsic value, rather than its market capitalization. There are some important features that differentiate intrinsic value indices from fundamentally weighted indices. Fundamentally weighted indices use historical accounting measures, such as sales and book value, to measure the economic size of companies. This means that, relative to market cap-weighted indices, fundamentally weighted indices systematically over-weight companies with lower valuation ratios, such as price-to-sales and price-to-book. However, such an approach also systematically under-weights companies whose economic size cannot be measured using only historical accounting measures, such as sales and book value. This is because fundamental weighting does not take into account information regarding the future growth prospects of companies. By incorporating the present value of growth opportunities into the intrinsic value measure, intrinsic value indices use a more forward-looking measure of economic size. Of course, neither the intrinsic value model nor any equity valuation model can produce accurate measures of the “true value” of all stocks. However, by using intrinsic value estimates, intrinsic value weighting may help eliminate market cap-weighted indices’ bias of systematically over-weighting overvalued stocks and under-weighting undervalued stocks. In addition, this approach may help eliminate fundamental weighting’s bias of systematically under-weighting companies with higher growth prospects. In short, the approach does not rely on the premise that intrinsic value estimates capture the “true value” of all stocks. Rather, it leverages intrinsic value estimates to derive the intrinsic value weighting, which may suffer from less systematic biases than other weighting schemes.

S&P DOW JONES INDICES | INTRODUCING GIVI: THE GLOBAL INTRINSIC VALUE INDEX May 2012
4 McGRAW-HILL
1.3 Combining Low-Volatility and Value Strategies in the S&P GIVI Methodology The S&P GIVI is designed to capture the two anomalies discussed in a systematic, rules-based way. The index is constructed using two simple steps, as shown in Exhibit A1 in the appendix. First, to achieve its goal of lower volatility, the S&P GIVI excludes from the underlying S&P Global BMI universe 30% of market cap with the highest volatility in each country. It then weights each of the remaining stocks by its intrinsic value. The intrinsic value of each stock is calculated using the residual income model, where intrinsic value is equal to the sum of the value of assets in place and the value of growth opportunities. The value of assets in place is defined as the stock’s current book value while its growth opportunity is derived from the discounted value of projected earnings, as provided by analysts’ consensus earnings. A detailed discussion of the S&P GIVI’s construction and choices of model parameters is beyond the scope of this paper.1 We will focus instead on the S&P GIVI’s performance and comparisons with other alternative index strategies. The rest of the paper is organized as follows: in section 2, we compare the performance of the S&P GIVI with that of existing market benchmarks over the period from January 2000 to February 2012, across nine regions. In section 3, we analyze the excess returns gained from the beta-capped market cap-weighted and pure intrinsic value-weighted versions of the S&P GIVI respectively. This analysis helps to shed light on whether both beta-capping and intrinsic value weighting systematically improved risk-adjusted performance, as well as which aspect of the index generates greater excess returns for the index in each region and country. In section 4, we compare the S&P GIVI to other alternative index strategies, with a focus on factor exposures and the practicalities of institutional investing. Such comparisons are helpful in understanding the S&P GIVI’s unique characteristics and potential applications. In section 5, we draw conclusions from all of these analyses. 2: Performance Comparisons with the S&P GIVI In this section, we compare how the S&P GIVI would have performed relative to the S&P Global BMI and MSCI Investible Market Indices (IMI) for nine major regions and countries during the period spanning 2000 to 2011. We studied the following markets: global, developed, emerging, U.S., Europe, UK, Japan, emerging Asia Pacific and Pan Asia ex-Australia, New Zealand and Japan, as shown in Exhibit 1.
1 For more information, please read the S&P GIVI methodology as well as the S&P GIVI Frequently Asked Questions (FAQ) document, which can be found at www.spindices.com. We also look forward to producing a companion piece to this paper in the near future, which will contain a more detailed discussion of the model parameters.

S&P DOW JONES INDICES | INTRODUCING GIVI: THE GLOBAL INTRINSIC VALUE INDEX May 2012
5 McGRAW-HILL
Exhibit 1: Historical Returns, Volatility and Maximum Drawdown of S&P GIVI, S&P Global BMI and MSCI IMI (2000 – 2011)
Annualized Returns Annualized Volatility
S&P Global
BMI S&P GIVI
MSCI IMI USD
Gross
S&P Global
BMI S&P GIVI
MSCI IMI USD
Gross Global 2.4% 6.9% 1.6% Global 17.7% 15.1% 17.7% Dev Mkt 2.0% 6.4% 1.2% Dev Mkt 17.3% 14.7% 17.2% Emg Mkt 7.9% 11.6% 7.4% Emg Mkt 24.5% 23.5% 24.7% U.S. 1.7% 6.3% 1.2% US 16.8% 13.8% 16.9% Europe 2.2% 5.7% 1.6% Europe 20.4% 18.4% 20.5% UK 2.4% 6.2% 1.9% UK 18.0% 16.4% 18.2% JP -2.8% 2.8% -3.4% JP 17.8% 15.1% 19.1% EM Asia Pacific 4.2% 8.0% 4.2% EM Asia Pacific 26.1% 25.1% 25.9% Pan Asia x JANZ 5.6% 9.6% 2.0% Pan Asia x JANZ 24.5% 23.1% 24.0%
Risk-Adjusted Returns Maximum Drawdown (12-Month Rolling)
S&P Global
BMI S&P GIVI
MSCI IMI USD
Gross
S&P Global
BMI S&P GIVI
MSCI IMI USD
Gross Global 0.13 0.45 0.09 Global -51.3% -46.2% -51.0% Dev Mkt 0.12 0.44 0.07 Dev Mkt -50.5% -44.9% -50.0% Emg Mkt 0.32 0.49 0.30 Emg Mkt -57.3% -56.3% -58.2% U.S. 0.10 0.45 0.07 US -47.1% -40.1% -46.7% Europe 0.11 0.31 0.08 Europe -55.5% -51.3% -55.6% UK 0.13 0.38 0.10 UK -53.0% -45.4% -53.5% JP -0.16 0.18 -0.18 JP -42.0% -35.0% -42.0% EM Asia Pacific 0.16 0.32 0.16 EM Asia Pacific -58.5% -52.7% -59.5% Pan Asia x JANZ 0.23 0.41 0.08 Pan Asia x JANZ -58.4% -53.5% -60.0%
Note: Annualized returns = (period ending index level / period beginning index level) ^ (12 / number of months in measured period) – 1. Annualized
volatility = standard deviation on monthly returns times square root of 12. Excess returns = difference in annualized returns. Risk-Adjusted returns =
annualized returns divided by annualized volatility.
Source: S&P Dow Jones Indices, MSCI. Calculations based on monthly total returns data from December 31, 1999 to December 31, 2011. Charts are
provided for illustrative purposes. This graph may reflect hypothetical historical performance. Please see the Performance Disclosure at the end of
this document for more information regarding the inherent limitations associated with back-tested performance.
The S&P GIVI achieved higher historical returns with lower risk than the S&P Global BMI and MSCI IMI across all nine regions over the last 12 years. The S&P GIVI also exhibited higher risk-adjusted returns and a smaller maximum historical drawdown than the other two benchmarks over the examined period. 2.1 Comparing the S&P GIVI with Existing Benchmarks Exhibits 2a and 2b show the historical performance of the S&P GIVI Global versus that of the S&P Global BMI and MSCI AC World IMI during the period spanning 2000 through 2011. Globally over the last 12 years, the S&P GIVI Global has generated significant annualized excess returns of 4.5% and 5.2% with lower volatility and achieved information ratios of 0.88 and 0.93 versus the S&P Global BMI and MSCI AC World IMI respectively.

S&P DOW JONES INDICES | INTRODUCING GIVI: THE GLOBAL INTRINSIC VALUE INDEX May 2012
6 McGRAW-HILL
Exhibit 2a: Historical Performance of S&P GIVI Global versus S&P Global BMI (2000 – 2011) Annualized Return Annualized Volatility S&P GIVI vs S&P BMI
Year S&P
Global BMI
S&P GIVI Global
S&P Global BMI
S&P GIVI Global Index
Annualized Excess Return
Tracking Error
Information Ratio
2000 -9.0% 5.6% 15.2% 12.8% 14.6% 11.0% 1.32 2001 -14.7% -3.6% 19.3% 13.3% 11.1% 8.4% 1.32 2002 -18.0% -8.7% 18.4% 15.3% 9.3% 6.5% 1.43 2003 37.1% 36.0% 12.0% 11.7% -1.2% 2.0% -0.58 2004 17.3% 22.6% 9.0% 7.9% 5.3% 2.1% 2.55 2005 12.6% 14.3% 9.0% 9.0% 1.8% 1.7% 1.06 2006 21.8% 24.3% 8.5% 8.1% 2.5% 1.6% 1.58 2007 11.9% 10.0% 10.0% 8.8% -1.9% 1.6% -1.22 2008 -42.4% -37.1% 25.9% 22.8% 5.3% 3.7% 1.43 2009 37.8% 32.3% 24.4% 21.4% -5.5% 3.8% -1.45 2010 15.1% 13.4% 20.6% 18.3% -1.7% 3.0% -0.57 2011 -7.7% -2.8% 18.5% 15.2% 4.9% 3.7% 1.31 1-yr -7.7% -2.8% 18.5% 15.2% 4.9% 3.7% 1.31 3-yr 13.5% 13.4% 21.3% 18.3% -0.2% 3.6% -0.04 5-yr -1.2% 0.2% 21.7% 18.8% 1.3% 3.4% 0.39
2000-05 2.4% 10.0% 14.9% 12.2% 7.6% 6.4% 1.19 2006-11 2.3% 3.8% 20.1% 17.6% 1.5% 3.2% 0.47 2000-11 2.4% 6.9% 17.7% 15.1% 4.5% 5.1% 0.88
Note: Annualized returns = (current year end value / previous year end value) ^ (1/12) -1. Annualized volatility = standard deviation on monthly returns
times square root of 12. Excess returns = difference in annualized returns. Risk-Adjusted returns = annualized returns divided by annualized volatility.
Tracking error = standard deviation on monthly relative returns times square root of 12. Information Ratio = Excess Return / Tracking Error.
Source: S&P Dow Jones Indices. Calculations based on monthly total returns data from December 31, 1999 to December 31, 2011. Charts are
provided for illustrative purposes. This graph may reflect hypothetical historical performance. Please see the Performance Disclosure at the end of
this document for more information regarding the inherent limitations associated with back-tested performance.

S&P DOW JONES INDICES | INTRODUCING GIVI: THE GLOBAL INTRINSIC VALUE INDEX May 2012
7 McGRAW-HILL
Exhibit 2b: Historical Performance of S&P GIVI Global versus MSCI AC World IMI (2000 – 2011) Annualized Return Annualized Volatility S&P GIVI vs MSCI IMI
Year
MSCI AC World
Index IMI USD
Gross
S&P GIVI Global
MSCI AC World
Index IMI USD Gross
S&P GIVI Global
Annualized Excess Return
Tracking Error
Information Ratio
2000 -15.3% 5.6% 15.7% 12.8% 20.9% 13.3% 1.58 2001 -15.4% -3.6% 19.4% 13.3% 11.8% 8.6% 1.37 2002 -17.2% -8.7% 18.7% 15.3% 8.5% 6.6% 1.29 2003 36.1% 36.0% 12.2% 11.7% -0.1% 2.2% -0.05 2004 16.9% 22.6% 8.8% 7.9% 5.6% 2.0% 2.85 2005 12.1% 14.3% 8.9% 9.0% 2.3% 1.8% 1.26 2006 21.5% 24.3% 8.3% 8.1% 2.8% 1.6% 1.75 2007 11.7% 10.0% 10.0% 8.8% -1.6% 1.6% -1.03 2008 -42.0% -37.1% 25.7% 22.8% 4.9% 3.5% 1.41 2009 37.2% 32.3% 24.2% 21.4% -4.9% 3.6% -1.36 2010 14.9% 13.4% 20.7% 18.3% -1.5% 3.0% -0.48 2011 -7.4% -2.8% 18.4% 15.2% 4.6% 3.6% 1.28 1-yr -7.4% -2.8% 18.4% 15.2% 4.6% 3.6% 1.28 3-yr 13.4% 13.4% 21.2% 18.3% 0.0% 3.5% -0.01 5-yr -1.1% 0.2% 21.5% 18.8% 1.3% 3.3% 0.39
2000-05 0.9% 10.0% 15.1% 12.2% 9.1% 7.2% 1.26 2006-11 2.3% 3.8% 20.0% 17.6% 1.5% 3.1% 0.49 2000-11 1.6% 6.9% 17.7% 15.1% 5.2% 5.6% 0.93
Note: Annualized returns = (current year end value / previous year end value) ^ (1/12) -1. Annualized volatility = standard deviation on monthly returns
times square root of 12. Excess returns = difference in annualized returns. Risk-Adjusted returns = annualized returns divided by annualized volatility.
Tracking error = standard deviation on monthly relative returns times square root of 12. Information Ratio = Excess Return / Tracking Error.
Source: S&P Dow Jones Indices, MSCI. Calculations based on monthly total returns data from December 31, 1999 to December 31, 2011. Charts are
provided for illustrative purposes. This graph may reflect hypothetical historical performance. Please see the Performance Disclosure at the end of
this document for more information regarding the inherent limitations associated with back-tested performance.
Exhibit 3 shows the cumulative historical performance of the S&P GIVI Global versus that of other existing benchmarks for global equity markets during the period spanning 2000 through 2011. The S&P GIVI Global gained cumulative returns of 122%, while the MSCI AC World IMI and S&P Global BMI generated cumulative returns of 21.3% and 32.4% respectively. Exhibit 3: Absolute Return of S&P GIVI Global, S&P Global BMI and MSCI AC World IMI (2000 – 2011)
Source: S&P Dow Jones Indices, MSCI. Data from December 31, 1999 to December 31, 2011. Charts are provided for illustrative purposes. This
graph may reflect hypothetical historical performance. Please see the Performance Disclosure at the end of this document for more information
regarding the inherent limitations associated with back-tested performance.

S&P DOW JONES INDICES | INTRODUCING GIVI: THE GLOBAL INTRINSIC VALUE INDEX May 2012
8 McGRAW-HILL
The S&P GIVI Global outperformed the MSCI AC World IMI and S&P Global BMI in eight out of the twelve years studied. Due in part to its lower-volatility design, the S&P GIVI Global outperformed every year during bear markets, with an average annual excess return of 10.1% and 9% relative to the MSCI AC World IMI and S&P Global BMI respectively. During bull market years, the S&P GIVI Global generated an average annual excess return of 0.4% and -0.1% versus the MSCI AC World IMI and S&P Global BMI respectively. Exhibit 4 shows performance in bullish and bearish years highlighted in blue and gray. Exhibit 4: Absolute and Relative Performance of the S&P GIVI Global versus S&P Global BMI and MSCI AC World IMI during Bullish and Bearish Years (2000 – 2011) Absolute Returns Excess Return
Year S&P Global BMI MSCI AC World Index IMI USD
Gross S&P GIVI
Global
S&P GIVI Global vs.
S&P Global BMI
S&P GIVI Global vs. MSCI IMI
2000 -9.0% -15.3% 5.6% 14.6% 20.9% 2001 -14.7% -15.4% -3.6% 11.1% 11.8% 2002 -18.0% -17.2% -8.7% 9.3% 8.5% 2003 37.1% 36.1% 36.0% -1.2% -0.1% 2004 17.3% 16.9% 22.6% 5.3% 5.6% 2005 12.6% 12.1% 14.3% 1.8% 2.3% 2006 21.8% 21.5% 24.3% 2.5% 2.8% 2007 11.9% 11.7% 10.0% -1.9% -1.6% 2008 -42.4% -42.0% -37.1% 5.3% 4.9% 2009 37.8% 37.2% 32.3% -5.5% -4.9% 2010 15.1% 14.9% 13.4% -1.7% -1.5% 2011 -7.7% -7.4% -2.8% 4.9% 4.6%
Avg of all years 5.1% 4.4% 8.8% 3.7% 4.4% Avg of bullish
years 21.9% 21.5% 21.8% -0.1% 0.4% Avg of bearish
years -18.4% -19.5% -9.3% 9.0% 10.1% Source: S&P Dow Jones Indices, MSCI. Data from December 31, 1999 to December 31, 2011. Charts are provided for illustrative purposes. This
graph may reflect hypothetical historical performance. Please see the Performance Disclosure at the end of this document for more information
regarding the inherent limitations associated with back-tested performance.
We also compared S&P GIVI Global performance in different market volatility conditions, as measured by the CBOE VIX®. We divided the last 12 years of VIX history into three equal tertiles. Periods when VIX falls into the top tertile range are defined as periods of high market volatility, periods when VIX falls into the bottom tertile range are defined as periods of low market volatility and the remaining periods are defined as periods of medium market volatility. Relative to the MSCI AC World IMI, the S&P GIVI Global outperformed during high and medium market volatility environments and only slightly underperformed in a low volatility environment, as shown in Exhibit 5.

S&P DOW JONES INDICES | INTRODUCING GIVI: THE GLOBAL INTRINSIC VALUE INDEX May 2012
9 McGRAW-HILL
Exhibit 5: Absolute and Relative Performance of S&P GIVI Global versus S&P Global BMI and MSCI AC World IMI during Different Market Volatility Conditions (2000 – 2011)
Annualized Returns Excess Returns
S&P Global BMI S&P GIVI Global MSCI AC World IMI S&P GIVI Global vs S&P Global BMI
S&P GIVI Global vs MSCI IMI
Period of High Market Volatility* -29.5% -21.6% -30.1% 7.8% 8.5%
Period of Medium Market Volatility* 15.1% 16.7% 14.0% 1.6% 2.7%
Period of Low Market Volatility* 40.5% 39.4% 40.0% -1.2% -0.6%
Source: S&P Dow Jones Indices, MSCI. Data from December 31, 1999 to December 31, 2011. Charts are provided for illustrative purposes. This
graph may reflect hypothetical historical performance. Please see the Performance Disclosure at the end of this document for more information
regarding the inherent limitations associated with back-tested performance.
2.2 The S&P GIVI’s Outperformance Across Regions During the examined period (2000-2011), the S&P GIVI generated significant excess returns compared to the MSCI IMI in all major markets including developed, emerging, U.S., Europe, UK, Japan, emerging Asia Pacific and Pan Asia ex-Japan, Australia and New Zealand. The S&P GIVI’s outperformance over the MSCI IMI is more significant in developed markets (5.2% p.a.) than in emerging markets (4.3% p.a.). Pan Asia ex-Japan, Australia and New Zealand achieved the highest excess returns of all the regions (7.6% p.a.), followed by Japan (6.1% p.a.), U.S. (5.1% p.a.), UK (4.4% p.a.), Europe (4.1% p.a.) and emerging Asia Pacific (3.8% p.a.). Exhibit 6 shows the excess returns in these regions. Exhibit 6: Historical Relative Return of S&P GIVI versus MSCI IMI (2000 – 2011)
Source: S&P Dow Jones Indices, MSCI. Data from December 31, 1999 to December 31, 2011. Charts are provided for illustrative purposes. This
graph may reflect hypothetical historical performance. Please see the Performance Disclosure at the end of this document for more information
regarding the inherent limitations associated with back-tested performance.
Given its lower volatility, the S&P GIVI provided much higher risk-adjusted returns across all regions compared to the MSCI IMI and S&P Global BMI. Compared to the MSCI IMI, the most significant improvements in risk-adjusted returns are found in the U.S., Japan and developed markets.

S&P DOW JONES INDICES | INTRODUCING GIVI: THE GLOBAL INTRINSIC VALUE INDEX May 2012
10 McGRAW-HILL
Exhibit 7: Risk-Adjusted Return of S&P GIVI versus MSCI IMI (2000-2011)
Return-to-Risk Ratio
S&P GIVI (a)
MSCI IMI USD
Gross (b) S&P BMI
(c) S&P GIVI less MSCI IMI (a-b)
S&P GIVI less S&P BMI (a-c)
Global 0.45 0.09 0.13 0.36 0.32 Dev Mkt 0.44 0.07 0.12 0.37 0.32 Emg Mkt 0.49 0.30 0.32 0.20 0.17 U.S. 0.45 0.07 0.10 0.38 0.35 Europe 0.31 0.08 0.11 0.23 0.20 UK 0.38 0.10 0.13 0.28 0.25 JP 0.18 -0.18 -0.16 0.36 0.34 EM Asia Pacific 0.32 0.16 0.16 0.16 0.16 Pan Asia x JANZ 0.41 0.08 0.23 0.33 0.18
Source: S&P Dow Jones Indices, MSCI. Calculations based on monthly data from December 31, 1999 to December 31, 2011. Charts are provided for
illustrative purposes. This graph may reflect hypothetical historical performance. Please see the Performance Disclosure at the end of this document
for more information regarding the inherent limitations associated with back-tested performance.
2.3 The S&P GIVI’s Outperformance in the U.S. The S&P GIVI U.S. shows significant outperformance over the S&P 500 in the U.S., with an annualized excess return of 5.7% and an information ratio of 0.92 during the period spanning 2000 through 2011, as shown in Exhibit 8a. As the S&P GIVI U.S. has lower annualized volatility, it declined no more than 30% when the S&P 500 and MSCI USA IMI lost 37% in 2008. Exhibit 8b shows the historical performance of the S&P GIVI U.S. versus that of the MSCI USA IMI. Comparisons to the S&P United States BMI are provided in the appendix, in Exhibit A3.

S&P DOW JONES INDICES | INTRODUCING GIVI: THE GLOBAL INTRINSIC VALUE INDEX May 2012
11 McGRAW-HILL
Exhibit 8a: Historical Performance of S&P GIVI U.S. versus S&P 500 (2000 – 2011)
Annualized Return Annualized Volatility S&P GIVI vs S&P 500
Year S&P 500 S&P GIVI
United States
S&P 500 S&P GIVI
United States
Annualized Excess Return
Tracking Error
Information Ratio
2000 -9.1% 15.7% 17.2% 16.6% 24.8% 13.0% 1.90 2001 -11.9% 2.8% 19.9% 12.3% 14.7% 10.2% 1.45 2002 -22.1% -12.7% 20.6% 15.5% 9.4% 8.9% 1.06 2003 28.7% 27.3% 11.4% 11.4% -1.4% 2.5% -0.56 2004 10.9% 17.0% 7.3% 6.8% 6.2% 2.5% 2.50 2005 4.9% 7.9% 7.9% 7.9% 3.0% 2.3% 1.31 2006 15.8% 18.2% 5.6% 5.4% 2.4% 2.5% 0.97 2007 5.5% 1.2% 9.7% 9.1% -4.2% 1.8% -2.40 2008 -37.0% -29.9% 21.0% 19.1% 7.1% 3.9% 1.80 2009 26.5% 21.0% 22.3% 19.8% -5.5% 4.5% -1.22 2010 15.1% 14.3% 19.3% 16.8% -0.8% 2.9% -0.27 2011 2.1% 7.6% 15.9% 13.4% 5.4% 3.0% 1.79 1-yr 2.1% 7.6% 15.9% 13.4% 5.4% 3.0% 1.79 3-yr 14.1% 14.2% 19.0% 16.4% 0.0% 3.6% 0.01 5-yr -0.2% 1.1% 18.9% 16.5% 1.3% 3.6% 0.37
2000-05 -1.1% 8.9% 15.2% 12.3% 10.0% 7.9% 1.26 2006-11 2.3% 3.8% 17.4% 15.3% 1.5% 3.5% 0.43 2000-11 0.6% 6.3% 16.3% 13.8% 5.7% 6.2% 0.92
Note: Annualized returns = (current year end value / previous year end value) ^ (1/12) -1. Annualized volatility = standard deviation on monthly returns
times square root of 12. Excess returns = difference in annualized returns. Risk-Adjusted returns = annualized returns divided by annualized volatility.
Tracking error = standard deviation on monthly relative returns times square root of 12. Information Ratio = Excess Return / Tracking Error.
Source: S&P Dow Jones Indices. Calculations based on monthly data from December 31, 1999 to December 31, 2011. Charts are provided for
illustrative purposes. This graph may reflect hypothetical historical performance. Please see the Performance Disclosure at the end of this document
for more information regarding the inherent limitations associated with back-tested performance.

S&P DOW JONES INDICES | INTRODUCING GIVI: THE GLOBAL INTRINSIC VALUE INDEX May 2012
12 McGRAW-HILL
Exhibit 8b: Historical Performance of S&P GIVI U.S. versus MSCI USA IMI (2000 – 2011) Annualized Return Annualized Volatility S&P GIVI vs MSCI IMI
Year MSCI USA IMI USD Gross
S&P GIVI United States
MSCI USA IMI USD Gross
S&P GIVI United States
Annualized Excess Return
Tracking Error
Information Ratio
2000 -9.8% 15.7% 18.3% 16.6% 25.5% 18.8% 1.35 2001 -11.0% 2.8% 21.3% 12.3% 13.8% 11.4% 1.22 2002 -21.6% -12.7% 19.9% 15.5% 8.9% 8.0% 1.12 2003 31.0% 27.3% 11.5% 11.4% -3.7% 2.1% -1.78 2004 12.3% 17.0% 8.1% 6.8% 4.7% 2.8% 1.68 2005 6.4% 7.9% 8.6% 7.9% 1.5% 2.1% 0.68 2006 15.7% 18.2% 6.4% 5.4% 2.5% 2.6% 0.95 2007 5.8% 1.2% 9.8% 9.1% -4.5% 2.0% -2.29 2008 -37.0% -29.9% 22.3% 19.1% 7.1% 4.8% 1.46 2009 28.7% 21.0% 22.5% 19.8% -7.7% 5.2% -1.49 2010 17.2% 14.3% 19.8% 16.8% -2.9% 3.6% -0.80 2011 1.2% 7.6% 17.0% 13.4% 6.3% 4.2% 1.52 1-yr 1.2% 7.6% 17.0% 13.4% 6.3% 4.2% 1.52 3-yr 15.1% 14.2% 19.6% 16.4% -1.0% 4.5% -0.22 5-yr 0.4% 1.1% 19.6% 16.5% 0.7% 4.4% 0.17
2000-05 -0.3% 8.9% 15.8% 12.3% 9.2% 9.7% 0.94 2006-11 2.8% 3.8% 18.1% 15.3% 1.0% 4.1% 0.24 2000-11 1.2% 6.3% 16.9% 13.8% 5.1% 7.5% 0.67
Note: Annualized returns = (current year end value / previous year end value) ^ (1/12) -1. Annualized volatility = standard deviation on monthly returns
times square root of 12. Excess returns = difference in annualized returns. Risk-Adjusted returns = annualized returns divided by annualized volatility.
Tracking error = standard deviation on monthly relative returns times square root of 12. Information Ratio = Excess Return / Tracking Error.
Source: S&P Dow Jones Indices, MSCI. Calculations based on monthly data from December 31, 1999 to December 31, 2011. Charts are provided for
illustrative purposes. This graph may reflect hypothetical historical performance. Please see the Performance Disclosure at the end of this document
for more information regarding the inherent limitations associated with back-tested performance.
2.4 S&P GIVI’s Outperformance in Japan As shown in Exhibits 9a and 9b, the S&P GIVI Japan had annualized excess returns of 6.1% relative to both the TOPIX and MSCI Japan IMI indices. The information ratio of the S&P GIVI Japan versus TOPIX is as high as 1.08, with a tracking error of 5.7%. Compared to the MSCI Japan IMI, the S&P GIVI Japan has an information ratio of 0.76 and a tracking error of 8.6%. Comparisons to the S&P Japan BMI are provided in the appendix, in Exhibit A4.

S&P DOW JONES INDICES | INTRODUCING GIVI: THE GLOBAL INTRINSIC VALUE INDEX May 2012
13 McGRAW-HILL
Exhibit 9a: Historical Performance of S&P GIVI Japan versus TOPIX (2000 – 2011) Annualized Return Annualized Volatility S&P GIVI vs TOPIX
Year TOPIX S&P GIVI Japan TOPIX S&P GIVI
Japan Annualized
Excess Return
Tracking Error
Information Ratio
2000 -32.7% -10.3% 22.4% 20.8% 22.4% 11.3% 1.99 2001 -29.3% -17.4% 16.3% 14.4% 11.9% 6.5% 1.84 2002 -8.9% -1.0% 19.2% 15.7% 7.9% 5.8% 1.35 2003 38.6% 35.1% 16.3% 13.9% -3.5% 5.1% -0.69 2004 16.4% 21.6% 20.2% 17.3% 5.2% 4.3% 1.19 2005 26.1% 24.8% 14.4% 11.7% -1.2% 3.5% -0.35 2006 2.1% 6.9% 9.9% 9.4% 4.8% 2.3% 2.11 2007 -5.2% -1.5% 7.8% 6.4% 3.7% 2.8% 1.35 2008 -26.8% -22.5% 22.4% 18.6% 4.4% 5.4% 0.81 2009 4.8% 4.2% 21.9% 19.1% -0.6% 4.7% -0.13 2010 15.9% 17.5% 13.9% 11.9% 1.6% 3.1% 0.53 2011 -12.5% -7.8% 14.0% 12.8% 4.7% 3.3% 1.44 1-yr -12.5% -7.8% 14.0% 12.8% 4.7% 3.3% 1.44 3-yr 2.0% 4.1% 16.9% 14.8% 2.1% 3.7% 0.56 5-yr -5.9% -2.9% 16.9% 14.6% 3.0% 3.9% 0.77
2000-05 -2.1% 7.0% 19.4% 16.2% 9.1% 7.0% 1.30 2006-11 -4.6% -1.3% 15.9% 13.8% 3.3% 3.7% 0.89 2000-11 -3.4% 2.8% 17.7% 15.1% 6.1% 5.7% 1.08
Note: Annualized returns = (current year end value / previous year end value) ^ (1/12) -1. Annualized volatility = standard deviation on monthly returns
times square root of 12. Excess returns = difference in annualized returns. Risk-Adjusted returns = annualized returns divided by annualized volatility.
Tracking error = standard deviation on monthly relative returns times square root of 12. Information Ratio = Excess Return / Tracking Error.
Source: S&P Dow Jones Indices, TSE. Calculations based on monthly data from December 31, 1999 to December 31, 2011. Charts are provided for
illustrative purposes. This graph may reflect hypothetical historical performance. Please see the Performance Disclosure at the end of this document
for more information regarding the inherent limitations associated with back-tested performance.

S&P DOW JONES INDICES | INTRODUCING GIVI: THE GLOBAL INTRINSIC VALUE INDEX May 2012
14 McGRAW-HILL
Exhibit 9b: Historical Performance of S&P GIVI Japan versus MSCI Japan IMI (2000 – 2011)
Annualized Return Annualized Volatility S&P GIVI vs MSCI IMI
Year MSCI
Japan IMI USD
Gross
S&P GIVI Japan
MSCI Japan IMI
USD Gross S&P GIVI
Japan Annualized
Excess Return
Tracking Error
Information Ratio
2000 -34.8% -10.3% 22.8% 20.8% 24.5% 12.9% 1.90 2001 -29.3% -17.4% 16.1% 14.4% 11.9% 6.6% 1.79 2002 -8.1% -1.0% 19.2% 15.7% 7.1% 5.8% 1.22 2003 37.9% 35.1% 16.4% 13.9% -2.8% 5.3% -0.52 2004 17.6% 21.6% 19.9% 17.3% 4.0% 4.0% 1.00 2005 27.2% 24.8% 14.6% 11.7% -2.3% 3.8% -0.61 2006 3.0% 6.9% 10.0% 9.4% 3.8% 2.3% 1.62 2007 -4.8% -1.5% 7.8% 6.4% 3.4% 2.8% 1.21 2008 -28.0% -22.5% 33.4% 18.6% 5.6% 22.5% 0.25 2009 6.3% 4.2% 22.0% 19.1% -2.1% 5.0% -0.42 2010 16.2% 17.5% 14.1% 11.9% 1.3% 3.3% 0.41 2011 -12.7% -7.8% 14.0% 12.8% 4.9% 3.4% 1.45 1-yr -12.7% -7.8% 14.0% 12.8% 4.9% 3.4% 1.45 3-yr 2.5% 4.1% 17.0% 14.8% 1.6% 4.0% 0.41 5-yr -5.9% -2.9% 20.1% 14.6% 3.0% 10.2% 0.29
2000-05 -2.2% 7.0% 19.5% 16.2% 9.3% 7.6% 1.22 2006-11 -4.5% -1.3% 18.7% 13.8% 3.1% 9.4% 0.33 2000-11 -3.4% 2.8% 19.1% 15.1% 6.1% 8.6% 0.71
Note: Annualized returns = (current year end value / previous year end value) ^ (1/12) -1. Annualized volatility = standard deviation on monthly returns
times square root of 12. Excess returns = difference in annualized returns. Risk-Adjusted returns = annualized returns divided by annualized volatility.
Tracking error = standard deviation on monthly relative returns times square root of 12. Information Ratio = Excess Return / Tracking Error.
Source: S&P Dow Jones Indices, MSCI. Calculations based on monthly data from December 31, 1999 to December 31, 2011. Charts are provided for
illustrative purposes. This graph may reflect hypothetical historical performance. Please see the Performance Disclosure at the end of this document
for more information regarding the inherent limitations associated with back-tested performance.
Performance comparisons of the S&P GIVI versus the S&P Global BMI and MSCI IMI for other regions including developed markets, emerging markets, Europe, UK, Pan Asia ex Japan, Australia and New Zealand, and emerging Asia Pacific are shown in Exhibits A5a through A10b in the appendix. 3: The Sources of the S&P GIVI’s Excess Returns In this section, we present the findings of our analysis to isolate the primary driver of the S&P GIVI’s excess returns in each region. To do this, we determined the excess returns that would be generated by two hypothetical versions of the index: a beta-capped market cap-weighted version that does not encompass pure intrinsic value weighting and a pure intrinsic value-weighted version that does not employ beta-capped market cap weighting. Analyzing these hypothetical indices allows us to isolate the effects of the beta-capping and intrinsic value-weighting features of the S&P GIVI for each region. After constructing two hypothetical versions of the S&P GIVI, we compared the performance of these two hypothetical indices for the major regions and found that all of them outperformed the S&P Global BMI over the last 12 years. In every region, besides Europe and the UK, the pure intrinsic value-weighted version of the S&P GIVI generated slightly better overall performance than the beta-capped market cap-weighted version. The annualized returns, annualized volatility, risk-adjusted returns and excess returns versus the S&P Global BMI of the two hypothetical versions of the S&P GIVI are provided for each region in Exhibit 10.

S&P DOW JONES INDICES | INTRODUCING GIVI: THE GLOBAL INTRINSIC VALUE INDEX May 2012
15 McGRAW-HILL
Exhibit 10: Annualized Returns, Volatility, Risk-Adjusted Returns and Excess Returns versus S&P Global BMI of the Beta-Capped Market Cap-Weighted Version and Pure Intrinsic Value-Weighted Version of S&P GIVI in Each Region (2000-2011)
Annualized Returns Annualized Volatility Risk-Adjusted Returns Excess Returns vs BMI
Beta Capped,
Mcap Wt
IV Wt only
Beta Capped, Mcap Wt
IV Wt only
Beta Capped, Mcap Wt
IV Wt only
Beta Capped, Mcap Wt
IV Wt only
Global 4.7% 5.4% 14.7% 17.6% 0.32 0.31 2.3% 3.0% Dev Mkt 4.4% 4.9% 14.2% 17.3% 0.31 0.28 2.4% 2.9% Emg Mkt 9.7% 10.7% 22.8% 25.0% 0.43 0.43 1.8% 2.8% U.S. 4.2% 4.9% 13.3% 16.5% 0.31 0.30 2.4% 3.2% Europe 4.4% 3.9% 17.7% 21.1% 0.25 0.18 2.2% 1.7% UK 5.1% 4.3% 15.6% 19.0% 0.33 0.22 2.7% 1.9% JP -0.2% 1.1% 15.2% 17.3% -0.01 0.06 2.6% 3.8% EM Asia Pacific 6.4% 6.9% 23.8% 26.7% 0.27 0.26 2.2% 2.7% Pan Asia x JANZ 7.5% 8.6% 22.0% 24.9% 0.34 0.35 1.9% 3.0%
Source: S&P Dow Jones Indices. Data from December 31, 1999 to December 31, 2011. Charts are provided for illustrative purposes. This graph may
reflect hypothetical historical performance. Please see the Performance Disclosure at the end of this document for more information regarding the
inherent limitations associated with back-tested performance.
We further analyzed the performance of the two hypothetical versions of the S&P GIVI Global on an annual basis from 2000 through 2011. The results are shown in Exhibit 11. We found the pure intrinsic value-weighted version exhibited better performance than the beta-capped market cap-weighted version in eight out of the twelve years studied. The pure intrinsic value-weighted version outperformed the beta-capped market cap-weighted version most during post-crisis recovery periods in the years 2003 and 2009, with excess returns of 9.7% p.a. and 12.7% p.a. respectively. Vice versa, the pure intrinsic value-weighted version underperformed the beta-capped market cap-weighted version significantly during post-crisis recovery periods in the years 2008 and 2011, with annualized underperformance of 6.2% and 6.4% respectively.

S&P DOW JONES INDICES | INTRODUCING GIVI: THE GLOBAL INTRINSIC VALUE INDEX May 2012
16 McGRAW-HILL
Exhibit 11: Annualized Returns, Volatility, Risk-Adjusted Returns and Excess Returns versus S&P Global BMI of the Beta-Capped Market Cap-Weighted version and Pure Intrinsic Value-Weighted Version of S&P Global GIVI in Each Year (2000-2011)
Annualized Return Annualized Volatility Risk-Adjusted Return Excess Returns vs S&P BMI
Excess Returns
Year
S&P GIVI
Global (MCap Wgt, Beta
Capped)
S&P GIVI
Global (IV Wgt only)
S&P Global
BMI
S&P GIVI
Global Index (MCap Wgt, Beta
Capped)
S&P GIVI
Global
Index (IV
Wgt only)
S&P Global
BMI
S&P GIVI
Global Index (MCap Wgt, Beta
Capped)
S&P GIVI
Global (IV Wgt only)
S&P Global
BMI
S&P GIVI Global (MCap
Wgt, Beta Capped)
S&P GIVI
Global (IV Wgt only)
IV Wgt only less
Mcap Wgt, Beta
Capped
2000 -2.6% 2.9% -9.0% 11.9% 13.6% 15.2% -0.22 0.21 -0.59 6.3% 11.9% 5.5%
2001 -7.9% -7.3% -14.7% 12.9% 16.4% 19.3% -0.61 -0.45 -0.76 6.8% 7.3% 0.5%
2002 -12.3% -12.5% -18.0% 14.5% 18.0% 18.4% -0.85 -0.69 -0.98 5.7% 5.6% -0.1%
2003 31.3% 41.0% 37.1% 11.1% 12.8% 12.0% 2.82 3.20 3.08 -5.8% 3.8% 9.7%
2004 19.3% 20.7% 17.3% 7.6% 8.9% 9.0% 2.55 2.34 1.93 2.0% 3.4% 1.4%
2005 13.0% 14.0% 12.6% 8.4% 9.3% 9.0% 1.55 1.50 1.39 0.5% 1.4% 1.0%
2006 22.9% 23.5% 21.8% 7.6% 8.7% 8.5% 3.02 2.70 2.56 1.2% 1.7% 0.6%
2007 10.8% 10.6% 11.9% 9.0% 9.8% 10.0% 1.20 1.08 1.20 -1.1% -1.3% -0.2%
2008 -36.6% -42.8% -42.4% 22.1% 26.5% 25.9% -1.65 -1.62 -1.64 5.8% -0.4% -6.2%
2009 30.1% 42.8% 37.8% 20.6% 26.2% 24.4% 1.46 1.63 1.55 -7.7% 5.1% 12.7%
2010 13.9% 14.3% 15.1% 18.4% 20.6% 20.6% 0.76 0.69 0.73 -1.2% -0.8% 0.3%
2011 -2.5% -8.9% -7.7% 15.3% 18.6% 18.5% -0.16 -0.48 -0.42 5.3% -1.2% -6.4% 2000-11 4.7% 5.4% 2.4% 14.7% 17.6% 17.7% 0.32 0.31 0.13 2.3% 3.0% 0.7%
Source: S&P Dow Jones Indices. Data from December 31, 1999 to December 31, 2011. Charts are provided for illustrative purposes. This graph may
reflect hypothetical historical performance. Please see the Performance Disclosure at the end of this document for more information regarding the
inherent limitations associated with back-tested performance.
4: The S&P GIVI Compared to Other Alternative Beta Strategies In recent years, there has been a proliferation of alternative index strategies, particularly in the equity investing space. Although all alternative index strategies aim to achieve better risk-adjusted performance than market cap-weighted indices, they are by no means created equal. In fact, they often differ significantly in terms of their portfolio construction processes, underlying risk drivers, and investment applications. Therefore, to better understand the unique characteristics and potential applications of GIVI, it is essential to contrast it with other alternative index strategies. There have been various attempts to categorize and compare the range of alternative equity beta strategies. Chow, Hsu, Kalesnik and Little (2011) surveyed various “heuristic-based” and “optimization-based” weighting strategies, and found that most strategies outperform market cap-weighted indices largely due to their value and small-cap factor exposures. Kang (2012) reviewed various low-volatility, diversification and value-based strategies, finding that their most systematic factor drivers are distinct. Melas, Briand and Urwin (2011) characterized all “risk-based” and “return-based” strategies as special cases of mean-variance portfolio construction, subject to various assumptions about expected risk and return. Low-volatility, diversification, and fundamental-based value strategies (see Exhibit 12) have all gained traction in the investment community in recent years. Low-volatility and diversification strategies are both risk-based strategies that aim to achieve more desirable risk characteristics than market cap-weighted indices. While low-volatility strategies reduce portfolio volatility by lowering systematic risk, diversification strategies such as equal-weight and equal-risk contribution reduce portfolio concentration by reducing stock-specific risks. However, by focusing solely on risk, neither low-volatility nor diversification strategies explicitly take into account company fundamentals in the portfolio construction process. In contrast,

S&P DOW JONES INDICES | INTRODUCING GIVI: THE GLOBAL INTRINSIC VALUE INDEX May 2012
17 McGRAW-HILL
fundamental-based strategies, such as fundamental indices and value-weighted indices, systematically tilt toward value through stock weighting based on fundamental accounting measures. Exhibit 12: Examples of Other Alternative Beta Strategies
Alternative Index Strategy Example Economic Representation
Active Risk
Investment Capacity
Transaction Cost
Low-Volatility Strategies Reduce systematic risk
Minimum Variance Less Representative
Relatively High
Relatively Low
Relatively High Non-Optimized Low-
Volatility
Diversification Strategies Reduce idiosyncratic risk
Equal-Weighted Less Representative Moderate Relatively
Low Relatively High Equal Risk Contribution
Fundamentally Weighted Value Strategies Capture value factor premium
Fundamental Index Broadly Representative Moderate Relatively
High Moderate Value-Weighted
Source: FTSE, MSCI, S&P Dow Jones Indices. Implementation cost is generally a function of portfolio turnover, liquidity, trading cost and investment
capacity.
For institutional investors who may consider adding alternative index strategies to their strategic equity allocation, the evaluation criteria may go well beyond risk and return characteristics. For example, some institutional investors may prefer alternative index strategies with broad market representation, high investment capacity and low implementation cost. Risk-centric low-volatility and diversification strategies tend to be less representative of the overall economy than traditional market cap-weighted indices. For instance, a minimum-variance or low-volatility portfolio contains only a small subset of companies and can have significant sector biases, while an equal-weight portfolio allocates the same capital to all companies regardless of their economic size. In contrast, fundamental-based index strategies are broadly representative of the overall economy. It is well accepted that market cap-weighted indices have a greater investment capacity than all other forms of indexing. In addition, they enjoy the lowest implementation cost, due to low portfolio turnover, high liquidity and low trading costs. As fundamental-based weighting schemes tend to be more similar to market-cap weighting than risk-based weighting schemes, fundamental-based strategies generally have a higher investment capacity and lower implementation cost than risk-based strategies. The intrinsic value strategy uniquely combines the important features of the fundamental-based and low-volatility strategies. Its intrinsic value weighting addresses the concern about market cap-weighted indices over-weighting overvalued stocks and under-weighting undervalued stocks. The intrinsic value weighting strategy has also consistently added value across regions, as demonstrated in the previous section. Such a fundamental-based approach also means that it has broad economic representation, high investment capacity and moderate implementation cost. In addition, by excluding many of the high-risk stocks, it leverages the extensive empirical evidence that high-beta, high-volatility stocks deliver lower risk-adjusted performance than low-beta, low-volatility stocks, potentially due to investors’ behavioral bias. As illustrated earlier, this low-volatility tilt has consistently reduced risk and improved risk-adjusted performance across regions. There is another important feature that differentiates the intrinsic value indices from the existing fundamentally weighted indices. Fundamentally weighted indices use historical accounting measures, such as sales and book value, to measure the economic size of companies. This implies that such an approach may systematically under-weight companies whose economic size cannot be measured using only historical accounting measures, such as sales and book value. By incorporating the present value of growth opportunities into the intrinsic value measure, intrinsic value indices use a more forward-looking measure of economic size. As noted earlier, the intrinsic value estimates may be noisy, but the S&P GIVI does not rely on the premise that intrinsic value estimates

S&P DOW JONES INDICES | INTRODUCING GIVI: THE GLOBAL INTRINSIC VALUE INDEX May 2012
18 McGRAW-HILL
capture the “true value” of individual stocks. Instead, it leverages intrinsic value estimates to derive a weighting scheme that corrects for the potential biases inherent to market cap and fundamental weighting. Exhibit 13: Fundamentally Weighted Indices versus Intrinsic Value Indices
Fundamentally Weighted Indices S&P Global Intrinsic Value Index
(GIVI) FTSE RAFI Fundamental
Index MSCI Value Weighted
Index
Stock Selection The companies with the largest fundamental accounting values from the whole stock universe
All constituents of the relevant MSCI parent index
A lower volatility subset of the all cap universe, where the most risky stocks (30% of market cap in each country, measured by beta) are removed
Weighting Sales, Cash Flow, Book Value, and Dividends
Sales, Cash Flow, Book Value, and Earnings
Intrinsic Value = Book Value + Present Value of Growth Opportunities (Residual Income Model)
Source: FTSE, MSCI, S&P Dow Jones Indices.
Exhibit 14 compares the sector allocation of the S&P GIVI U.S. with that of a market cap-weighted index (S&P U.S. BMI), and that of a book-value-weighted portfolio. It shows that the S&P GIVI has broadly diversified sector exposures. One notable observation is that it over-weights the information technology sector relative to the market cap-weighted index, which stands in stark contrast with the book-value-weighted portfolio that significantly under-weight the information technology sector. This finding indicates that the S&P GIVI may have more exposure to growth industries by virtue of incorporating the growth opportunities into the intrinsic value measure. In comparison, fundamentally weighted indices have more exposure to traditional value by virtue of using fundamental accounting measures. Another observation is that, as of March 2012, the S&P GIVI U.S. significantly under-weights the financials sector compared to the market cap-weighted index. This finding stands in contrast with fundamentally weighted indices, which are substantially over-weight financials. The S&P GIVI’s current under-weighting of financials can be attributed to both its intrinsic value weighting scheme and low-volatility tilt.

S&P DOW JONES INDICES | INTRODUCING GIVI: THE GLOBAL INTRINSIC VALUE INDEX May 2012
19 McGRAW-HILL
Exhibit 14: Sector Allocation of S&P GIVI U.S. vs. Market Cap-Weighting and Book Value-Weighting
Source: S&P Dow Jones Indices. Data as of March 2012. The market cap-weighted portfolio is represented by S&P U.S. BMI, and the book value-
weighted portfolio is a hypothetical U.S. portfolio weighted by the book value of individual stocks. Charts are provided for illustrative purposes.
Exhibit 15 presents the historical risk and return profile of selected alternative beta strategies applied to U.S. equities. All alternative index strategies significantly outperformed the S&P 500, with the S&P GIVI strategy generating the highest return over the examined period. Notably, only the minimum-variance and GIVI strategies reduced portfolio volatility. Overall, the GIVI strategy delivered the highest Sharpe Ratio and Information Ratio. Exhibit 15: Alternative Beta Strategies (U.S. Equities): Historical Risk and Return Profile
Alternative Index Strategy Total Return Volatility Sharpe
Ratio Active Return
Active Risk
Information Ratio
S&P 500 0.6% 16.3% -0.10 Minimum Variance 3.9% 12.4% 0.13 3.3% 6.8% 0.49
Equal-Weighted 6.0% 19.1% 0.20 5.4% 6.1% 0.89
Fundamental Index 5.5% 17.9% 0.18 5.0% 6.3% 0.79
Value-Weighted 2.4% 17.4% 0.01 1.9% 4.5% 0.42
S&P GIVI 6.3% 13.8% 0.29 5.7% 6.2% 0.92
Source: S&P Dow Jones Indices, MSCI, FTSE. Data from December 31, 1999 to December 31, 2011. The Minimum Variance Strategy is represented
by MSCI USA Minimum Variance Index; the Equal Weight Strategy is represented by S&P 500 Equal Weight Index; the RAFI Fundamental Index is
represented by FTSE RAFI US 1000 Index; the MSCI Value Weighted is represented by MSCI USA Value Weighted Index; and the S&P GIVI is
represented by S&P GIVI U.S. Index. This graph may reflect hypothetical historical performance. Please see the Performance Disclosure at the end of
this document for more information regarding the inherent limitations associated with back-tested performance. Charts are provided for illustrative
purposes. Past performance is not a guarantee of future results.
It is well documented by both academics and practitioners that equity portfolio returns are driven not just by the overall market factor, but also by other common risk factors, such as value, small-cap, momentum and volatility factors. As alternative index strategies often have systematic exposures to some of these factors, it is helpful to examine and compare different alternative index strategies through the lens of common risk factors. Using a five-factor model of market, value, small-cap, momentum and volatility, Exhibit 16 provides insights into the risk factors that drive the performance of different alternative index strategies. The minimum-variance and GIVI strategies have market betas of 0.88 and 0.93 respectively, both of which are

S&P DOW JONES INDICES | INTRODUCING GIVI: THE GLOBAL INTRINSIC VALUE INDEX May 2012
20 McGRAW-HILL
statistically different from 1 (the beta of the market). They also both have a statistically significant negative exposure to the volatility factor. Indeed, it is the lower market beta and low-volatility tilts that enable minimum-variance and GIVI strategies to reduce systematic risk and portfolio volatility. The equal-weight strategy has a small-cap exposure as it systematically over-weights small-cap stocks. It also demonstrates a value bias during the examined period, but we find that this is not systematic as its value bias may not exist in other periods. Exhibit 16: Alternative Beta Strategies (U.S. Equities): Five-Factor Model Risk Analysis
Annual Alpha
Market Beta Small-Cap Value Momentum Volatility R Square
Minimum Variance 1.3% 0.88 0.07 0.04 0.04 -0.21 0.93 Statistical Significance ** * * ** Equal-Weighted 2.4% 1.01 0.20 0.34 0.05 0.01 0.96 Statistical Significance * ** ** * Fundamental Index 1.3% 0.98 0.10 0.42 0.07 -0.05 0.97 Statistical Significance ** ** ** Value-Weighted 0.0% 0.99 0.02 0.29 0.04 -0.03 0.99 Statistical Significance ** ** S&P GIVI 2.0% 0.93 0.02 0.20 0.09 -0.19 0.96 Statistical Significance * ** ** ** **
** Denotes statistical significance at the 1% level and * denotes statistical significance at the 5% level
Source: S&P Dow Jones Indices, MSCI, FTSE. Data from December 31, 1999 to December 31, 2011. The Minimum Variance Strategy is represented
by MSCI USA Minimum Variance Index; the Equal Weight Strategy is represented by S&P 500 Equal Weight Index; the RAFI Fundamental Index is
represented by FTSE RAFI US 1000 Index; the MSCI Value Weighted is represented by MSCI USA Value Weighted Index; and the S&P GIVI is
represented by S&P GIVI U.S. Index. This graph may reflect hypothetical historical performance. Please see the Performance Disclosure at the end of
this document for more information regarding the inherent limitations associated with back-tested performance. Charts are provided for illustrative
purposes.
Not surprisingly, as shown in Exhibit 16, the RAFI Fundamental Index, MSCI Value Weighted and S&P GIVI index strategies all have sizable and statistically significant exposure to the value factor. While the Fundamental Index and Value Weighted Index both weight stocks by fundamental accounting measures, the Fundamental Index produces a stronger value tilt than the Value Weighted Index, as it applies an additional stock screening based on fundamental measures (see Exhibit 13). Notably, the S&P GIVI has a smaller value tilt than the two fundamentally weighted indices. As noted earlier, the S&P GIVI captures not only the traditional value factor, but also potential growth opportunities. Another observation is that the Fundamental Index has a statistically significant small-cap tilt, while the Value Weighted and S&P GIVI indices do not.2 The small-cap tilt of the Fundamental Index may also be attributed to its additional stock screening. Exhibit 16 also shows that the R-squared of the factor regression is very close to 1 for all alternative index strategies. This strongly indicates that the examined alternative index strategies are primarily driven by the well-known common equity risk factors (market, small-cap, value, momentum and volatility). We summarize the most systematic factor tilts of different alternative index strategies in Exhibit 17.
2 Note that to control for size bias, we use Russell 1000 as the market reference for the FTSE RAFI US 1000 Index, MSCI USA as the market reference for MSCI USA Value Weighted Index, and S&P US BMI as the market portfolio for the S&P GIVI U.S.. Although the S&P GIVI U.S. includes small-cap stocks, it does not have a statistically significant small-cap tilt relative to the underlying S&P U.S. BMI (an all-cap index).

S&P DOW JONES INDICES | INTRODUCING GIVI: THE GLOBAL INTRINSIC VALUE INDEX May 2012
21 McGRAW-HILL
Exhibit 17: The Most Systematic Factor Tilts of Alternative Beta Strategies Alternative Index Strategy Value Tilt Small-Cap Tilt Low-Volatility Tilt
Minimum Variance ●
Non-Optimized Low-Volatility ●
Equal-Weighted ● Equal Risk Contribution ● RAFI Fundamental Index ● ● MSCI Value-Weighted ● S&P GIVI ● ●
Source: S&P Dow Jones Indices. Charts are provided for illustrative purposes.
Exhibit 18 expands the comparison of the GIVI strategy with other alternative index strategies to global developed markets. As we observed in U.S. equities, the GIVI strategy tends to reduce risk and deliver better risk-adjusted performance than other alternative index strategies, as measured by both Sharpe Ratio and Information Ratio. We show further analysis for Europe, Japan and emerging markets in the appendix in Exhibit A11. Exhibit 18: Alternative Beta Strategies (Global Developed Markets): Historical Risk and Return Profile
Alternative Index Strategy Total Return Volatility Sharpe
Ratio Active Return
Active Risk
Information Ratio
MSCI World 0.7% 16.9% -0.09 Minimum Variance 5.3% 11.8% 0.26 4.5% 7.8% 0.58
Equal-Weighted 5.5% 18.4% 0.17 4.7% 4.8% 0.99 Fundamental Index 4.5% 18.1% 0.12 3.7% 5.3% 0.71
Value-Weighted 4.0% 18.0% 0.10 3.3% 3.9% 0.84 S&P GIVI 6.4% 14.7% 0.28 5.7% 5.1% 1.12
Source: S&P Dow Jones Indices. Charts are provided for illustrative purposes.
In summary, as illustrated in Exhibit 19 below, the S&P GIVI uses a unique alternative index strategy that combines the important features of fundamental-based and low-volatility strategies. Its intrinsic value weighting not only captures the value premium, but also enables more exposure to growth opportunities than traditional fundamentally weighted indices. It also retains the important characteristics of a fundamental-based index strategy, such as broad market representation, high investment capacity and moderate implementation cost. These characteristics suggest that it may be an efficient tool for capturing the equity risk premium, while at the same time accessing the value and low-volatility factor premia.

S&P DOW JONES INDICES | INTRODUCING GIVI: THE GLOBAL INTRINSIC VALUE INDEX May 2012
22 McGRAW-HILL
Exhibit 19: Main Characteristics of the S&P GIVI Strategy
Source: S&P Dow Jones Indices. Charts are provided for illustrative purposes. 5. Conclusion As Keynes once remarked, “When the facts change, I change my mind.” In the dynamic markets we live in, it is worthwhile to periodically check the facts against the established orthodoxy and respond accordingly. The value and low-volatility anomalies are well-documented and persistent deviations from currently dominant investment theories. The S&P GIVI is designed to systematically incorporate these anomalies into a simple, investable index. The index’s methodology is fully transparent and its coverage of the global equity market is extensive. We hope the S&P GIVI can provide a way for academics and practitioners to further study systematic market anomalies and that the index can serve as the basis for cost-efficient products that capture the opportunities for extra returns often neglected by other indices.

S&P DOW JONES INDICES | INTRODUCING GIVI: THE GLOBAL INTRINSIC VALUE INDEX May 2012
23 McGRAW-HILL
APPENDIX Exhibit A1: Construction of the S&P GIVI Portfolio Source: S&P Indices. Charts are provided for illustrative purposes. Source: S&P Dow Jones Indices. Charts are provided for illustrative purposes.
Exhibit A2: Annual Outperformance of S&P GIVI versus S&P Global BMI and MSCI IMI (2000–2011)
Source: S&P Dow Jones Indices, MSCI. Data from December 31, 1999 to December 31, 2011. Charts are provided for illustrative purposes. This
graph may reflect hypothetical historical performance. Please see the Performance Disclosure at the end of this document for more information
regarding the inherent limitations associated with back-tested performance.

S&P DOW JONES INDICES | INTRODUCING GIVI: THE GLOBAL INTRINSIC VALUE INDEX May 2012
24 McGRAW-HILL
Exhibit A3: Historical Performance of S&P GIVI U.S. versus S&P U.S. BMI Annualized Return Annualized Volatility S&P GIVI vs S&P BMI
S&P United
States BMI
S&P GIVI United States Index
S&P United States BMI
S&P GIVI United
States Index
Annualized Excess Return
Tracking Error
Information Ratio
2000 -4.8% 15.7% 17.4% 16.6% 20.5% 16.0% 1.28 2001 -11.2% 2.8% 20.7% 12.3% 14.1% 10.8% 1.31 2002 -21.4% -12.7% 19.5% 15.5% 8.6% 7.5% 1.15 2003 31.9% 27.3% 11.2% 11.4% -4.6% 2.1% -2.18 2004 12.5% 17.0% 8.3% 6.8% 4.5% 2.9% 1.53 2005 6.6% 7.9% 8.6% 7.9% 1.3% 2.0% 0.63 2006 15.5% 18.2% 6.5% 5.4% 2.7% 2.6% 1.03 2007 5.8% 1.2% 9.8% 9.1% -4.5% 2.0% -2.31 2008 -37.4% -29.9% 22.5% 19.1% 7.4% 5.0% 1.49 2009 28.8% 21.0% 22.8% 19.8% -7.8% 5.3% -1.46 2010 17.4% 14.3% 19.7% 16.8% -3.1% 3.5% -0.90 2011 1.1% 7.6% 17.1% 13.4% 6.5% 4.3% 1.52 1-yr 1.1% 7.6% 17.1% 13.4% 6.5% 4.3% 1.52 3-yr 15.2% 14.2% 19.7% 16.4% -1.0% 4.6% -0.23 5-yr 0.3% 1.1% 19.7% 16.5% 0.8% 4.5% 0.18
2000-05 0.8% 8.9% 15.4% 12.3% 8.1% 8.6% 0.94 2006-11 2.6% 3.8% 18.2% 15.3% 1.1% 4.2% 0.26 2000-11 1.7% 6.3% 16.8% 13.8% 4.6% 6.8% 0.67
Source: S&P Dow Jones Indices. Calculations based on monthly data from December 31, 1999 to December 31, 2011. Charts are provided for
illustrative purposes. This graph may reflect hypothetical historical performance. Please see the Performance Disclosure at the end of this document
for more information regarding the inherent limitations associated with back-tested performance.
Exhibit A4: Historical Performance of S&P GIVI Japan versus S&P Japan BMI
Annualized Return Annualized Volatility S&P GIVI vs S&P BMI
S&P Japan
BMI
S&P GIVI Japan Index
S&P Japan BMI
S&P GIVI Japan Index
Annualized Excess Return
Tracking Error
Information Ratio
2000 -29.3% -10.3% 22.6% 20.8% 19.0% 9.6% 1.99 2001 -28.5% -17.4% 16.3% 14.4% 11.1% 5.9% 1.90 2002 -8.7% -1.0% 19.0% 15.7% 7.6% 5.2% 1.47 2003 38.6% 35.1% 16.7% 13.9% -3.5% 5.5% -0.63 2004 17.0% 21.6% 20.0% 17.3% 4.6% 4.3% 1.09 2005 28.0% 24.8% 14.9% 11.7% -3.1% 4.1% -0.76 2006 1.9% 6.9% 10.1% 9.4% 4.9% 2.6% 1.89 2007 -5.3% -1.5% 7.9% 6.4% 3.9% 2.9% 1.36 2008 -27.8% -22.5% 22.7% 18.6% 5.3% 5.5% 0.97 2009 5.7% 4.2% 22.0% 19.1% -1.5% 4.9% -0.30 2010 16.1% 17.5% 14.0% 11.9% 1.4% 3.1% 0.44 2011 -12.6% -7.8% 14.0% 12.8% 4.8% 3.2% 1.49 1-yr -12.6% -7.8% 14.0% 12.8% 4.8% 3.2% 1.49 3-yr 2.4% 4.1% 17.0% 14.8% 1.8% 3.8% 0.46 5-yr -6.0% -2.9% 17.1% 14.6% 3.1% 4.0% 0.77
2000-05 -0.7% 7.0% 19.4% 16.2% 7.8% 6.4% 1.21 2006-11 -4.7% -1.3% 16.1% 13.8% 3.4% 3.8% 0.89 2000-11 -2.8% 2.8% 17.8% 15.1% 5.5% 5.3% 1.04
Source: S&P Dow Jones Indices. Calculations based on monthly data from December 31, 1999 to December 31, 2011. Charts are provided for
illustrative purposes. This graph may reflect hypothetical historical performance. Please see the Performance Disclosure at the end of this document
for more information regarding the inherent limitations associated with back-tested performance.
Exhibits A5a and A5b show the historical performance of the S&P GIVI Developed Market versus the S&P Developed BMI and MSCI World IMI Index during the period spanning 2000 through 2011. The S&P GIVI Developed Market had annualized excess returns of 4.4% and an information ratio of 0.83 versus the S&P Developed BMI. The S&P GIVI Developed Markets Index outperformed the MSCI World IMI by

S&P DOW JONES INDICES | INTRODUCING GIVI: THE GLOBAL INTRINSIC VALUE INDEX May 2012
25 McGRAW-HILL
5.2% annually with an information ratio of 0.89. Tracking errors versus the S&P Developed BMI and MSCI World IMI Index are 5.3% and 5.8% respectively. Exhibit A5a: Historical Performance of S&P GIVI Developed Market versus S&P Developed BMI (2000 – 2011)
Annualized Return Annualized Volatility S&P GIVI vs S&P BMI
S&P Dev Mkt BMI
S&P GIVI Dev Mkt
Index S&P Dev Mkt BMI
S&P GIVI Dev Mkt
Index
Annualized Excess Return
Tracking Error
Information Ratio
2000 -8.0% 7.8% 15.3% 13.3% 15.9% 11.6% 1.37 2001 -15.1% -4.4% 19.1% 12.8% 10.7% 8.8% 1.22 2002 -18.3% -9.2% 18.4% 15.2% 9.1% 6.7% 1.36 2003 36.3% 34.4% 12.1% 11.8% -1.9% 2.0% -0.96 2004 16.9% 22.0% 8.8% 7.7% 5.1% 2.1% 2.37 2005 11.7% 13.5% 8.6% 8.4% 1.8% 1.7% 1.07 2006 20.6% 22.9% 7.9% 7.4% 2.3% 1.6% 1.39 2007 9.4% 7.5% 9.6% 8.6% -1.9% 1.5% -1.26 2008 -41.1% -35.5% 24.9% 21.7% 5.6% 3.9% 1.42 2009 33.3% 27.6% 24.2% 21.1% -5.7% 4.2% -1.37 2010 14.5% 12.3% 20.7% 18.3% -2.1% 3.1% -0.68 2011 -5.8% -0.9% 18.1% 14.7% 4.9% 3.9% 1.26 1-yr -5.8% -0.9% 18.1% 14.7% 4.9% 3.9% 1.26 3-yr 12.8% 12.4% 21.0% 18.0% -0.4% 3.8% -0.11 5-yr -1.5% -0.3% 21.1% 18.2% 1.2% 3.6% 0.34
2000-05 2.2% 9.7% 14.8% 12.0% 7.6% 6.7% 1.13 2006-11 1.9% 3.2% 19.6% 17.0% 1.4% 3.4% 0.40 2000-11 2.0% 6.4% 17.3% 14.7% 4.4% 5.3% 0.83
Source: S&P Dow Jones Indices. Calculations based on monthly data from December 31, 1999 to December 31, 2011. Charts are provided for
illustrative purposes. This graph may reflect hypothetical historical performance. Please see the Performance Disclosure at the end of this document
for more information regarding the inherent limitations associated with back-tested performance.

S&P DOW JONES INDICES | INTRODUCING GIVI: THE GLOBAL INTRINSIC VALUE INDEX May 2012
26 McGRAW-HILL
Exhibit A5b: Historical Performance of S&P GIVI Developed Market versus MSCI World IMI (2000 – 2011)
Annualized Return Annualized Volatility S&P GIVI vs MSCI IMI
MSCI The World
Index IMI USD
Gross
S&P GIVI Dev Mkt
Index
MSCI The World Index
IMI USD Gross
S&P GIVI Dev Mkt
Index
Annualized Excess Return
Tracking Error
Information Ratio
2000 -13.9% 7.8% 15.8% 13.3% 21.7% 13.9% 1.56 2001 -16.1% -4.4% 19.0% 12.8% 11.8% 8.9% 1.33 2002 -17.9% -9.2% 18.7% 15.2% 8.7% 6.9% 1.27 2003 35.4% 34.4% 12.2% 11.8% -0.9% 2.0% -0.46 2004 16.4% 22.0% 8.6% 7.7% 5.5% 2.0% 2.77 2005 10.8% 13.5% 8.4% 8.4% 2.7% 1.8% 1.50 2006 20.6% 22.9% 7.6% 7.4% 2.3% 1.6% 1.40 2007 9.0% 7.5% 9.5% 8.6% -1.5% 1.5% -1.02 2008 -40.5% -35.5% 24.4% 21.7% 5.0% 3.6% 1.39 2009 32.4% 27.6% 23.7% 21.1% -4.8% 3.8% -1.26 2010 14.1% 12.3% 20.7% 18.3% -1.8% 3.2% -0.55 2011 -5.5% -0.9% 17.9% 14.7% 4.6% 3.6% 1.28 1-yr -5.5% -0.9% 17.9% 14.7% 4.6% 3.6% 1.28 3-yr 12.6% 12.4% 20.7% 18.0% -0.2% 3.6% -0.05 5-yr -1.5% -0.3% 20.8% 18.2% 1.2% 3.4% 0.36
2000-05 0.6% 9.7% 15.0% 12.0% 9.1% 7.5% 1.22 2006-11 1.9% 3.2% 19.3% 17.0% 1.4% 3.1% 0.44 2000-11 1.2% 6.4% 17.2% 14.7% 5.2% 5.8% 0.89
Source: S&P Dow Jones Indices, MSCI. Calculations based on monthly data from December 31, 1999 to December 31, 2011. Charts are provided for
illustrative purposes. This graph may reflect hypothetical historical performance. Please see the Performance Disclosure at the end of this document
for more information regarding the inherent limitations associated with back-tested performance.
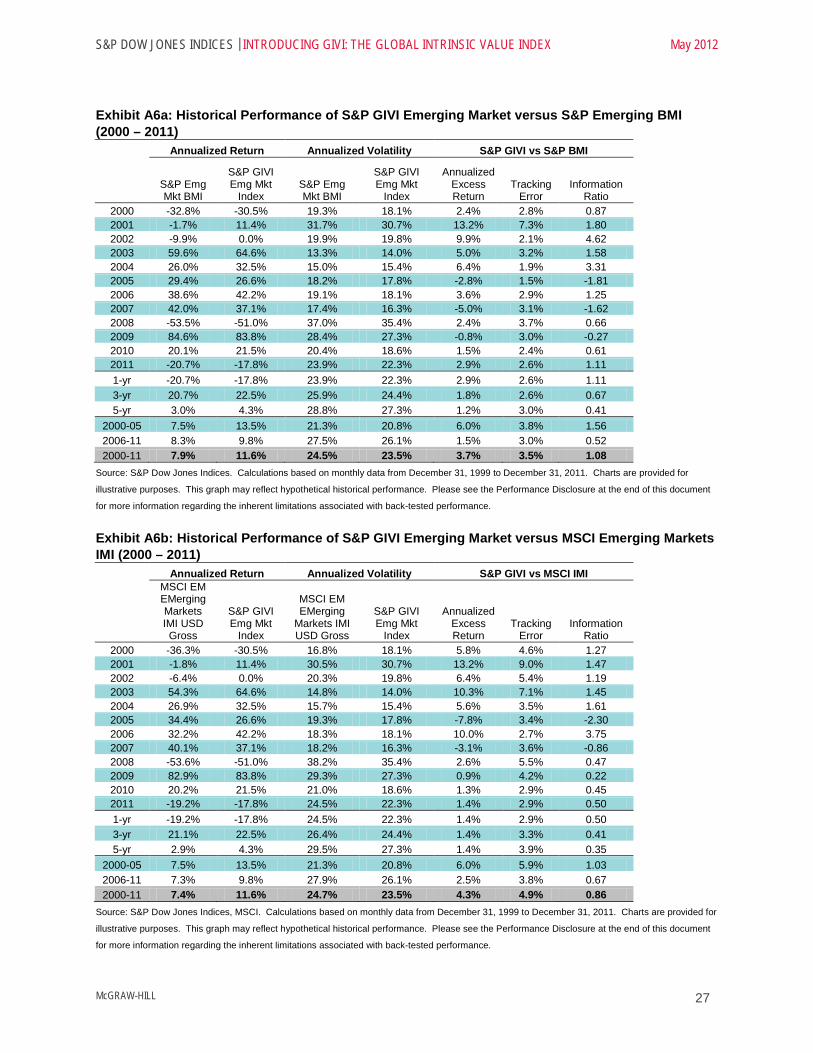
The S&P GIVI Emerging Market outperformed the S&P Emerging BMI and MSCI Emerging Markets IMI by 3.7% p.a. and 4.3% p.a. respectively. The S&P GIVI Emerging Market had a high information ratio of 1.08 and a low tracking error of 3.5% versus the S&P Emerging BMI, as shown in Exhibit A6a. Compared to the MSCI Emerging Markets IMI, the S&P GIVI Emerging Market had an information ratio of 0.86 and a tracking error 4.9%, as shown in Exhibit A6b.
S&P DOW JONES INDICES | INTRODUCING GIVI: THE GLOBAL INTRINSIC VALUE INDEX May 2012
27 McGRAW-HILL
Exhibit A6a: Historical Performance of S&P GIVI Emerging Market versus S&P Emerging BMI (2000 – 2011)
Annualized Return Annualized Volatility S&P GIVI vs S&P BMI
S&P Emg Mkt BMI
S&P GIVI Emg Mkt
Index S&P Emg Mkt BMI
S&P GIVI Emg Mkt
Index
Annualized Excess Return
Tracking Error
Information Ratio
2000 -32.8% -30.5% 19.3% 18.1% 2.4% 2.8% 0.87 2001 -1.7% 11.4% 31.7% 30.7% 13.2% 7.3% 1.80 2002 -9.9% 0.0% 19.9% 19.8% 9.9% 2.1% 4.62 2003 59.6% 64.6% 13.3% 14.0% 5.0% 3.2% 1.58 2004 26.0% 32.5% 15.0% 15.4% 6.4% 1.9% 3.31 2005 29.4% 26.6% 18.2% 17.8% -2.8% 1.5% -1.81 2006 38.6% 42.2% 19.1% 18.1% 3.6% 2.9% 1.25 2007 42.0% 37.1% 17.4% 16.3% -5.0% 3.1% -1.62 2008 -53.5% -51.0% 37.0% 35.4% 2.4% 3.7% 0.66 2009 84.6% 83.8% 28.4% 27.3% -0.8% 3.0% -0.27 2010 20.1% 21.5% 20.4% 18.6% 1.5% 2.4% 0.61 2011 -20.7% -17.8% 23.9% 22.3% 2.9% 2.6% 1.11 1-yr -20.7% -17.8% 23.9% 22.3% 2.9% 2.6% 1.11 3-yr 20.7% 22.5% 25.9% 24.4% 1.8% 2.6% 0.67 5-yr 3.0% 4.3% 28.8% 27.3% 1.2% 3.0% 0.41
2000-05 7.5% 13.5% 21.3% 20.8% 6.0% 3.8% 1.56 2006-11 8.3% 9.8% 27.5% 26.1% 1.5% 3.0% 0.52 2000-11 7.9% 11.6% 24.5% 23.5% 3.7% 3.5% 1.08
Source: S&P Dow Jones Indices. Calculations based on monthly data from December 31, 1999 to December 31, 2011. Charts are provided for
illustrative purposes. This graph may reflect hypothetical historical performance. Please see the Performance Disclosure at the end of this document
for more information regarding the inherent limitations associated with back-tested performance.
Exhibit A6b: Historical Performance of S&P GIVI Emerging Market versus MSCI Emerging Markets IMI (2000 – 2011)
Annualized Return Annualized Volatility S&P GIVI vs MSCI IMI
MSCI EM EMerging Markets IMI USD Gross
S&P GIVI Emg Mkt
Index
MSCI EM EMerging
Markets IMI USD Gross
S&P GIVI Emg Mkt
Index
Annualized Excess Return
Tracking Error
Information Ratio
2000 -36.3% -30.5% 16.8% 18.1% 5.8% 4.6% 1.27 2001 -1.8% 11.4% 30.5% 30.7% 13.2% 9.0% 1.47 2002 -6.4% 0.0% 20.3% 19.8% 6.4% 5.4% 1.19 2003 54.3% 64.6% 14.8% 14.0% 10.3% 7.1% 1.45 2004 26.9% 32.5% 15.7% 15.4% 5.6% 3.5% 1.61 2005 34.4% 26.6% 19.3% 17.8% -7.8% 3.4% -2.30 2006 32.2% 42.2% 18.3% 18.1% 10.0% 2.7% 3.75 2007 40.1% 37.1% 18.2% 16.3% -3.1% 3.6% -0.86 2008 -53.6% -51.0% 38.2% 35.4% 2.6% 5.5% 0.47 2009 82.9% 83.8% 29.3% 27.3% 0.9% 4.2% 0.22 2010 20.2% 21.5% 21.0% 18.6% 1.3% 2.9% 0.45 2011 -19.2% -17.8% 24.5% 22.3% 1.4% 2.9% 0.50 1-yr -19.2% -17.8% 24.5% 22.3% 1.4% 2.9% 0.50 3-yr 21.1% 22.5% 26.4% 24.4% 1.4% 3.3% 0.41 5-yr 2.9% 4.3% 29.5% 27.3% 1.4% 3.9% 0.35
2000-05 7.5% 13.5% 21.3% 20.8% 6.0% 5.9% 1.03 2006-11 7.3% 9.8% 27.9% 26.1% 2.5% 3.8% 0.67 2000-11 7.4% 11.6% 24.7% 23.5% 4.3% 4.9% 0.86
Source: S&P Dow Jones Indices, MSCI. Calculations based on monthly data from December 31, 1999 to December 31, 2011. Charts are provided for
illustrative purposes. This graph may reflect hypothetical historical performance. Please see the Performance Disclosure at the end of this document
for more information regarding the inherent limitations associated with back-tested performance.

S&P DOW JONES INDICES | INTRODUCING GIVI: THE GLOBAL INTRINSIC VALUE INDEX May 2012
28 McGRAW-HILL
The S&P GIVI Europe consistently outperformed the S&P Europe BMI and MSCI Europe IMI over the last 12 years for the European region, with excess returns of 3.4% p.a. and 4.1% p.a., and information ratios of 0.83 and 0.88 respectively. As shown in Exhibits A7a and A7b, the S&P GIVI Europe only underperformed the S&P Europe BMI and MSCI Europe IMI by more than 1% p.a. in one year (2009). Exhibit A7a: Historical Performance of S&P GIVI Europe versus S&P Europe BMI (2000 – 2011)
Annualized Return Annualized Volatility S&P GIVI vs S&P BMI
S&P Europe
BMI
S&P GIVI Europe Index
S&P Europe BMI
S&P GIVI Europe Index
Annualized Excess Return
Tracking Error
Information Ratio
2000 -7.0% 1.1% 14.4% 14.3% 8.2% 7.7% 1.05 2001 -19.3% -12.0% 18.7% 15.6% 7.3% 6.6% 1.10 2002 -16.6% -9.0% 22.1% 19.3% 7.6% 6.3% 1.22 2003 41.3% 42.8% 17.9% 16.4% 1.4% 2.8% 0.51 2004 22.8% 27.1% 10.6% 9.8% 4.3% 1.4% 2.96 2005 11.1% 12.3% 9.5% 10.0% 1.2% 1.3% 0.97 2006 36.5% 37.0% 9.1% 9.1% 0.5% 1.2% 0.38 2007 13.5% 13.4% 11.1% 10.8% -0.1% 1.2% -0.07 2008 -46.6% -42.6% 28.7% 25.9% 4.0% 3.6% 1.12 2009 38.7% 33.6% 27.8% 24.1% -5.2% 4.8% -1.08 2010 6.2% 5.2% 26.7% 24.9% -1.0% 2.7% -0.37 2011 -11.5% -6.4% 23.4% 21.2% 5.1% 2.5% 2.08 1-yr -11.5% -6.4% 23.4% 21.2% 5.1% 2.5% 2.08 3-yr 9.2% 9.6% 25.9% 23.2% 0.3% 3.6% 0.09 5-yr -4.6% -3.1% 25.3% 22.8% 1.6% 3.3% 0.47
2000-05 3.2% 8.7% 16.7% 15.0% 5.5% 5.0% 1.11 2006-11 1.3% 2.7% 23.6% 21.4% 1.4% 3.0% 0.47 2000-11 2.2% 5.7% 20.4% 18.4% 3.4% 4.2% 0.83
Source: S&P Dow Jones Indices. Calculations based on monthly data from December 31, 1999 to December 31, 2011. Charts are provided for
illustrative purposes. This graph may reflect hypothetical historical performance. Please see the Performance Disclosure at the end of this document
for more information regarding the inherent limitations associated with back-tested performance. Exhibit A7b: Historical Performance of S&P GIVI Europe versus MSCI Europe IMI (2000 – 2011)
Annualized Return Annualized Volatility S&P GIVI vs MSCI IMI
MSCI Europe IMI
USD Gross
S&P GIVI Europe Index
MSCI Europe IMI USD Gross
S&P GIVI Europe Index
Annualized Excess Return
Tracking Error
Information Ratio
2000 -11.2% 1.1% 15.0% 14.3% 12.3% 9.7% 1.27 2001 -20.4% -12.0% 19.4% 15.6% 8.4% 7.2% 1.17 2002 -16.4% -9.0% 22.1% 19.3% 7.5% 6.3% 1.18 2003 40.4% 42.8% 18.0% 16.4% 2.3% 3.1% 0.76 2004 22.2% 27.1% 10.6% 9.8% 4.9% 1.5% 3.26 2005 10.8% 12.3% 9.4% 10.0% 1.5% 1.3% 1.14 2006 35.9% 37.0% 9.0% 9.1% 1.1% 1.2% 0.94 2007 13.6% 13.4% 11.1% 10.8% -0.2% 1.3% -0.13 2008 -46.8% -42.6% 28.6% 25.9% 4.2% 3.6% 1.17 2009 39.1% 33.6% 27.9% 24.1% -5.5% 4.9% -1.12 2010 6.2% 5.2% 26.8% 24.9% -0.9% 2.8% -0.33 2011 -11.5% -6.4% 23.4% 21.2% 5.1% 2.4% 2.10 1-yr -11.5% -6.4% 23.4% 21.2% 5.1% 2.4% 2.10 3-yr 9.3% 9.6% 26.0% 23.2% 0.2% 3.7% 0.07 5-yr -4.6% -3.1% 25.3% 22.8% 1.6% 3.4% 0.47
2000-05 2.0% 8.7% 16.9% 15.0% 6.7% 5.7% 1.19 2006-11 1.2% 2.7% 23.6% 21.4% 1.5% 3.1% 0.49 2000-11 1.6% 5.7% 20.5% 18.4% 4.1% 4.6% 0.88
Source: S&P Dow Jones Indices, MSCI. Calculations based on monthly data from December 31, 1999 to December 31, 2011. Charts are provided for
illustrative purposes. This graph may reflect hypothetical historical performance. Please see the Performance Disclosure at the end of this document
for more information regarding the inherent limitations associated with back-tested performance.

S&P DOW JONES INDICES | INTRODUCING GIVI: THE GLOBAL INTRINSIC VALUE INDEX May 2012
29 McGRAW-HILL
We compared the performance of the S&P GIVI UK to that of the FTSE 100 and MSCI United Kingdom IMI Index, as shown in Exhibits A8a and A8b. The S&P GIVI UK had annualized excess returns of 5% and an information ratio of 0.86 versus the FTSE 100. The S&P GIVI UK outperformed the MSCI United Kingdom IMI by 4.4% annually with an information ratio of 0.73. Exhibit A8a: Historical Performance of S&P GIVI UK versus FTSE 100 (2000 – 2011)
Annualized Return Annualized Volatility S&P GIVI vs FTSE 100
FTSE 100
S&P GIVI United
Kingdom Index FTSE 100
S&P GIVI United
Kingdom Index
Annualized Excess Return
Tracking Error
Information Ratio
2000 -14.9% 0.5% 17.1% 19.6% 15.4% 12.3% 1.26 2001 -16.3% -4.6% 14.3% 12.6% 11.7% 7.6% 1.53 2002 -13.9% -6.6% 17.1% 14.4% 7.3% 7.3% 0.99 2003 31.1% 37.9% 16.8% 15.8% 6.8% 3.4% 1.98 2004 19.3% 26.6% 9.1% 9.4% 7.3% 2.5% 2.88 2005 8.0% 11.2% 8.3% 9.0% 3.2% 2.5% 1.25 2006 30.4% 30.9% 8.9% 8.6% 0.5% 2.3% 0.21 2007 9.2% 1.0% 11.4% 12.2% -8.2% 3.9% -2.10 2008 -48.2% -40.9% 23.6% 19.6% 7.4% 6.5% 1.14 2009 43.0% 36.3% 22.7% 20.3% -6.7% 4.5% -1.48 2010 9.2% 7.4% 23.4% 21.7% -1.8% 3.6% -0.49 2011 -2.9% 4.0% 20.3% 18.4% 6.9% 3.2% 2.18 1-yr -2.9% 4.0% 20.3% 18.4% 6.9% 3.2% 2.18 3-yr 14.9% 15.1% 22.1% 20.0% 0.2% 4.0% 0.04 5-yr -3.0% -1.9% 22.3% 19.8% 1.2% 4.8% 0.24
2000-05 0.6% 9.6% 14.7% 14.1% 9.1% 6.8% 1.33 2006-11 1.9% 3.0% 20.8% 18.6% 1.1% 4.5% 0.24 2000-11 1.2% 6.2% 18.0% 16.4% 5.0% 5.9% 0.86
Source: S&P Dow Jones Indices, FTSE. Calculations based on monthly data from December 31, 1999 to December 31, 2011. Charts are provided for
illustrative purposes. This graph may reflect hypothetical historical performance. Please see the Performance Disclosure at the end of this document
for more information regarding the inherent limitations associated with back-tested performance.

S&P DOW JONES INDICES | INTRODUCING GIVI: THE GLOBAL INTRINSIC VALUE INDEX May 2012
30 McGRAW-HILL
Exhibit A8b: Historical Performance of S&P GIVI UK versus MSCI United Kingdom IMI (2000 – 2011)
Annualized Return Annualized Volatility S&P GIVI vs MSCI IMI
MSCI United
Kingdom IMI USD Gross
S&P GIVI United
Kingdom Index
MSCI United
Kingdom IMI USD Gross
S&P GIVI United
Kingdom Index
Annualized Excess Return
Tracking Error
Information Ratio
2000 -12.5% 0.5% 15.9% 19.6% 13.0% 13.6% 0.96 2001 -15.7% -4.6% 15.3% 12.6% 11.1% 7.0% 1.57 2002 -14.4% -6.6% 17.2% 14.4% 7.8% 6.9% 1.12 2003 34.0% 37.9% 16.9% 15.8% 3.9% 2.9% 1.35 2004 21.0% 26.6% 9.2% 9.4% 5.6% 2.4% 2.30 2005 8.8% 11.2% 8.2% 9.0% 2.4% 2.0% 1.17 2006 32.1% 30.9% 8.8% 8.6% -1.2% 2.2% -0.54 2007 7.2% 1.0% 11.8% 12.2% -6.2% 3.0% -2.06 2008 -49.1% -40.9% 24.1% 19.6% 8.2% 7.4% 1.11 2009 45.8% 36.3% 22.9% 20.3% -9.5% 5.1% -1.84 2010 10.7% 7.4% 23.5% 21.7% -3.3% 3.2% -1.02 2011 -3.7% 4.0% 20.4% 18.4% 7.7% 3.2% 2.42 1-yr -3.7% 4.0% 20.4% 18.4% 7.7% 3.2% 2.42 3-yr 15.8% 15.1% 22.3% 20.0% -0.8% 4.2% -0.19 5-yr -3.2% -1.9% 22.6% 19.8% 1.3% 5.1% 0.26
2000-05 1.8% 9.6% 14.7% 14.1% 7.8% 7.0% 1.13 2006-11 1.9% 3.0% 21.1% 18.6% 1.0% 4.7% 0.22 2000-11 1.9% 6.2% 18.2% 16.4% 4.4% 6.0% 0.73
Source: S&P Dow Jones Indices, MSCI. Calculations based on monthly data from December 31, 1999 to December 31, 2011. Charts are provided for
illustrative purposes. This graph may reflect hypothetical historical performance. Please see the Performance Disclosure at the end of this document
for more information regarding the inherent limitations associated with back-tested performance.
Exhibit A8c: Historical Performance of S&P GIVI UK versus S&P UK BMI Annualized Return Annualized Volatility S&P GIVI vs S&P BMI
S&P United
Kingdom BMI
S&P GIVI United
Kingdom Index
S&P United Kingdom
BMI
S&P GIVI United
Kingdom Index
Annualized Excess Return
Tracking Error
Information Ratio
2000 -10.9% 0.5% 16.5% 19.6% 11.4% 11.8% 0.97 2001 -14.0% -4.6% 14.3% 12.6% 9.4% 6.3% 1.49 2002 -14.2% -6.6% 16.9% 14.4% 7.5% 6.7% 1.12 2003 34.2% 37.9% 16.8% 15.8% 3.7% 2.8% 1.33 2004 21.3% 26.6% 9.2% 9.4% 5.3% 2.4% 2.16 2005 9.1% 11.2% 8.3% 9.0% 2.1% 2.0% 1.05 2006 32.8% 30.9% 8.9% 8.6% -1.9% 2.3% -0.81 2007 7.0% 1.0% 11.7% 12.2% -6.0% 3.0% -2.01 2008 -48.7% -40.9% 23.8% 19.6% 7.8% 7.2% 1.09 2009 45.5% 36.3% 22.7% 20.3% -9.2% 4.9% -1.86 2010 10.9% 7.4% 23.5% 21.7% -3.5% 3.1% -1.12 2011 -3.4% 4.0% 20.3% 18.4% 7.3% 3.1% 2.38 1-yr -3.4% 4.0% 20.3% 18.4% 7.3% 3.1% 2.38 3-yr 16.0% 15.1% 22.2% 20.0% -0.9% 4.1% -0.22 5-yr -3.1% -1.9% 22.5% 19.8% 1.2% 5.0% 0.24
2000-05 2.6% 9.6% 14.5% 14.1% 7.0% 6.2% 1.13 2006-11 2.2% 3.0% 21.0% 18.6% 0.8% 4.6% 0.17 2000-11 2.4% 6.2% 18.0% 16.4% 3.9% 5.5% 0.70
Source: S&P Dow Jones Indices. Calculations based on monthly data from December 31, 1999 to December 31, 2011. Charts are provided for
illustrative purposes. This graph may reflect hypothetical historical performance. Please see the Performance Disclosure at the end of this document
for more information regarding the inherent limitations associated with back-tested performance.

S&P DOW JONES INDICES | INTRODUCING GIVI: THE GLOBAL INTRINSIC VALUE INDEX May 2012
31 McGRAW-HILL
Exhibits A9a and A9b show the historical performance of the S&P GIVI Pan Asia Ex Japan, Australia and New Zealand versus the S&P Pan Asia Ex Japan, Australia and New Zealand BMI and MSCI AC Asia ex Japan IMI. In comparison to the MSCI AC Asia ex Japan IMI, the S&P GIVI Pan Asia Ex Japan, Australia and New Zealand exhibited the best outperformance of all the studied regions. It had high annualized excess returns (7.6%) and a high information ratio (1.59) with a low tracking error (4.8%). Annually, the S&P GIVI Pan Asia Ex Japan, Australia and New Zealand underperformed the MSCI AC Asia ex Japan IMI only in the years 2005 and 2007, and by less than 2%. Exhibit A9a: Historical Performance of S&P GIVI Pan Asia Ex Japan, Australia and New Zealand versus S&P Pan Asia Ex Japan, Australia and New Zealand BMI (2000 – 2011)
Annualized Return Annualized Volatility S&P GIVI vs S&P BMI
S&P Pan Asia x
JANZ BMI
S&P GIVI Pan Asia x
JANZ Index
S&P Pan Asia x JANZ
BMI
S&P GIVI Pan Asia x JANZ Index
Annualized Excess Return
Tracking Error
Information Ratio
2000 -35.5% -34.2% 19.1% 17.1% 1.3% 5.2% 0.25 2001 1.2% 12.6% 32.1% 31.9% 11.4% 8.7% 1.31 2002 -11.2% -1.8% 18.9% 17.6% 9.4% 4.5% 2.11 2003 46.1% 50.4% 17.9% 18.0% 4.3% 3.7% 1.16 2004 17.4% 23.8% 15.3% 15.5% 6.4% 1.7% 3.78 2005 23.3% 20.2% 16.8% 15.6% -3.1% 2.4% -1.29 2006 33.9% 35.9% 14.1% 13.4% 2.0% 2.3% 0.85 2007 41.2% 36.7% 19.5% 17.6% -4.5% 3.6% -1.25 2008 -53.1% -48.3% 36.5% 33.7% 4.9% 5.6% 0.87 2009 78.1% 81.0% 30.6% 29.4% 2.9% 1.6% 1.83 2010 21.9% 24.1% 19.6% 17.5% 2.2% 2.4% 0.91 2011 -18.0% -14.8% 24.8% 22.3% 3.3% 3.1% 1.06 1-yr -18.0% -14.8% 24.8% 22.3% 3.3% 3.1% 1.06 3-yr 21.2% 24.2% 26.4% 24.7% 3.0% 2.4% 1.26 5-yr 3.3% 6.3% 29.2% 27.1% 2.9% 3.6% 0.82
2000-05 3.4% 8.5% 21.4% 20.8% 5.0% 4.9% 1.02 2006-11 7.9% 10.7% 27.3% 25.3% 2.8% 3.4% 0.83 2000-11 5.6% 9.6% 24.5% 23.1% 3.9% 4.2% 0.93
Source: S&P Dow Jones Indices. Calculations based on monthly data from December 31, 1999 to December 31, 2011. Charts are provided for
illustrative purposes. This graph may reflect hypothetical historical performance. Please see the Performance Disclosure at the end of this document
for more information regarding the inherent limitations associated with back-tested performance.
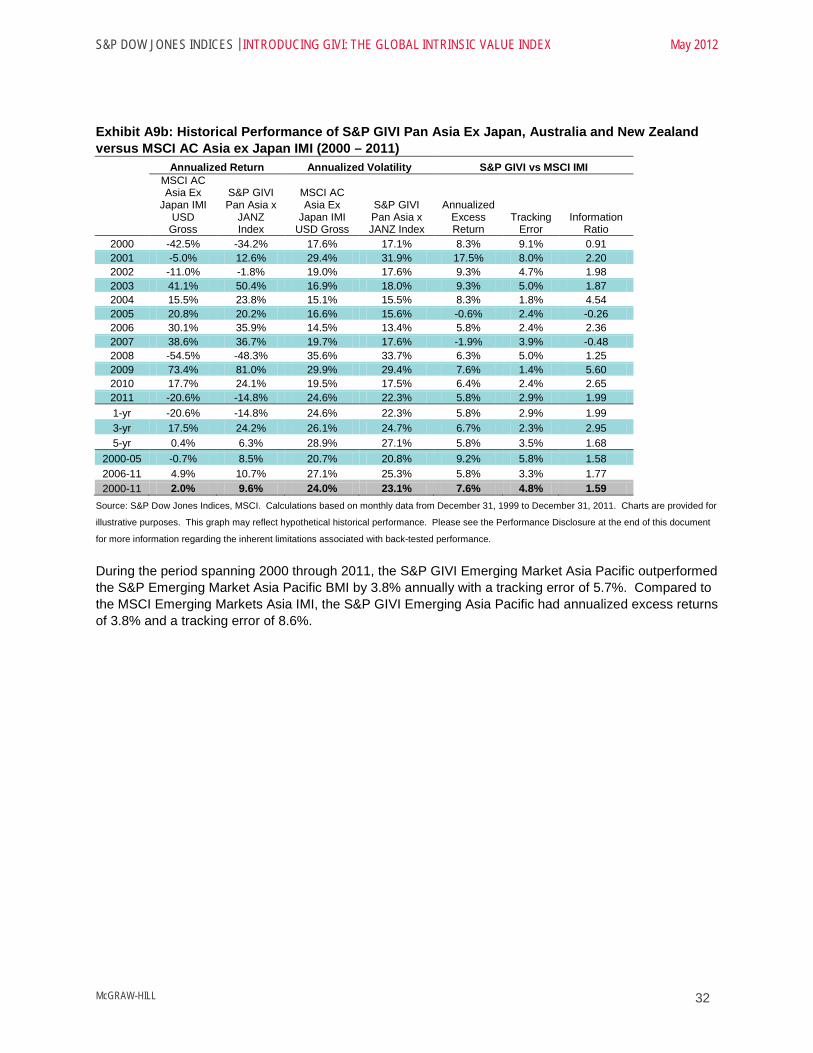
S&P DOW JONES INDICES | INTRODUCING GIVI: THE GLOBAL INTRINSIC VALUE INDEX May 2012
32 McGRAW-HILL
Exhibit A9b: Historical Performance of S&P GIVI Pan Asia Ex Japan, Australia and New Zealand versus MSCI AC Asia ex Japan IMI (2000 – 2011)
Annualized Return Annualized Volatility S&P GIVI vs MSCI IMI
MSCI AC Asia Ex
Japan IMI USD
Gross
S&P GIVI Pan Asia x
JANZ Index
MSCI AC Asia Ex
Japan IMI USD Gross
S&P GIVI Pan Asia x JANZ Index
Annualized Excess Return
Tracking Error
Information Ratio
2000 -42.5% -34.2% 17.6% 17.1% 8.3% 9.1% 0.91 2001 -5.0% 12.6% 29.4% 31.9% 17.5% 8.0% 2.20 2002 -11.0% -1.8% 19.0% 17.6% 9.3% 4.7% 1.98 2003 41.1% 50.4% 16.9% 18.0% 9.3% 5.0% 1.87 2004 15.5% 23.8% 15.1% 15.5% 8.3% 1.8% 4.54 2005 20.8% 20.2% 16.6% 15.6% -0.6% 2.4% -0.26 2006 30.1% 35.9% 14.5% 13.4% 5.8% 2.4% 2.36 2007 38.6% 36.7% 19.7% 17.6% -1.9% 3.9% -0.48 2008 -54.5% -48.3% 35.6% 33.7% 6.3% 5.0% 1.25 2009 73.4% 81.0% 29.9% 29.4% 7.6% 1.4% 5.60 2010 17.7% 24.1% 19.5% 17.5% 6.4% 2.4% 2.65 2011 -20.6% -14.8% 24.6% 22.3% 5.8% 2.9% 1.99 1-yr -20.6% -14.8% 24.6% 22.3% 5.8% 2.9% 1.99 3-yr 17.5% 24.2% 26.1% 24.7% 6.7% 2.3% 2.95 5-yr 0.4% 6.3% 28.9% 27.1% 5.8% 3.5% 1.68
2000-05 -0.7% 8.5% 20.7% 20.8% 9.2% 5.8% 1.58 2006-11 4.9% 10.7% 27.1% 25.3% 5.8% 3.3% 1.77 2000-11 2.0% 9.6% 24.0% 23.1% 7.6% 4.8% 1.59
Source: S&P Dow Jones Indices, MSCI. Calculations based on monthly data from December 31, 1999 to December 31, 2011. Charts are provided for
illustrative purposes. This graph may reflect hypothetical historical performance. Please see the Performance Disclosure at the end of this document
for more information regarding the inherent limitations associated with back-tested performance.
During the period spanning 2000 through 2011, the S&P GIVI Emerging Market Asia Pacific outperformed the S&P Emerging Market Asia Pacific BMI by 3.8% annually with a tracking error of 5.7%. Compared to the MSCI Emerging Markets Asia IMI, the S&P GIVI Emerging Asia Pacific had annualized excess returns of 3.8% and a tracking error of 8.6%.

S&P DOW JONES INDICES | INTRODUCING GIVI: THE GLOBAL INTRINSIC VALUE INDEX May 2012
33 McGRAW-HILL
Exhibit A10a: Historical Performance of S&P GIVI Emerging Market Asia Pacific versus S&P Emerging Market Asia Pacific BMI (2000 – 2011) Annualized Return Annualized Volatility S&P GIVI vs S&P BMI
S&P EM Asia
Pacific BMI
S&P GIVI EM Asia Pacific Index
S&P EM Asia Pacific
BMI
S&P GIVI EM Asia Pacific Index
Annualized Excess Return
Tracking Error
Information Ratio
2000 -47.6% -46.5% 23.4% 22.1% 1.1% 6.1% 0.18 2001 10.3% 21.5% 38.3% 38.5% 11.2% 13.0% 0.87 2002 -13.8% 3.6% 18.6% 18.3% 17.4% 4.1% 4.30 2003 53.7% 55.8% 21.4% 23.5% 2.1% 4.8% 0.44 2004 12.4% 17.8% 15.2% 16.3% 5.4% 3.2% 1.67 2005 12.1% 6.6% 16.9% 15.9% -5.5% 2.6% -2.08 2006 43.1% 43.2% 15.4% 14.7% 0.2% 4.2% 0.05 2007 46.3% 37.0% 21.3% 19.9% -9.2% 4.1% -2.27 2008 -52.9% -46.8% 37.1% 34.6% 6.0% 7.2% 0.84 2009 81.5% 81.5% 29.8% 27.9% 0.0% 3.3% 0.00 2010 19.7% 22.5% 18.8% 16.9% 2.8% 2.6% 1.07 2011 -20.6% -17.9% 23.6% 21.3% 2.8% 3.5% 0.79 1-yr -20.6% -17.9% 23.6% 21.3% 2.8% 3.5% 0.79 3-yr 19.9% 22.2% 25.9% 24.0% 2.3% 3.1% 0.75 5-yr 3.5% 5.9% 29.3% 27.0% 2.4% 4.6% 0.52
2000-05 -0.6% 4.7% 24.6% 24.8% 5.3% 6.7% 0.79 2006-11 9.3% 11.4% 27.6% 25.5% 2.1% 4.5% 0.47 2000-11 4.2% 8.0% 26.1% 25.1% 3.8% 5.7% 0.66
Source: S&P Dow Jones Indices. Calculations based on monthly data from December 31, 1999 to December 31, 2011. Charts are provided for
illustrative purposes. This graph may reflect hypothetical historical performance. Please see the Performance Disclosure at the end of this document
for more information regarding the inherent limitations associated with back-tested performance.
Exhibit A10b: Historical Performance of S&P GIVI Emerging Market Asia Pacific versus MSCI Emerging Markets Asia IMI (2000 – 2011)
Annualized Return Annualized Volatility S&P GIVI vs MSCI IMI
MSCI EM Asia IMI
USD Gross
S&P GIVI EM Asia Pacific Index
MSCI EM Asia IMI
USD Gross
S&P GIVI EM Asia Pacific Index
Annualized Excess Return
Tracking Error
Information Ratio
2000 -49.8% -46.5% 18.9% 22.1% 3.3% 10.7% 0.31 2001 3.9% 21.5% 33.7% 38.5% 17.6% 14.8% 1.19 2002 -7.3% 3.6% 20.7% 18.3% 11.0% 10.4% 1.06 2003 46.8% 55.8% 19.2% 23.5% 9.0% 13.7% 0.66 2004 16.5% 17.8% 16.4% 16.3% 1.3% 4.8% 0.27 2005 28.7% 6.6% 18.9% 15.9% -22.1% 6.0% -3.71 2006 32.3% 43.2% 15.3% 14.7% 11.0% 4.1% 2.67 2007 43.3% 37.0% 21.0% 19.9% -6.3% 4.4% -1.43 2008 -53.5% -46.8% 39.4% 34.6% 6.7% 8.9% 0.75 2009 79.4% 81.5% 30.7% 27.9% 2.1% 6.3% 0.34 2010 19.9% 22.5% 19.9% 16.9% 2.7% 3.6% 0.74 2011 -18.6% -17.9% 24.6% 21.3% 0.8% 4.7% 0.16 1-yr -18.6% -17.9% 24.6% 21.3% 0.8% 4.7% 0.16 3-yr 20.5% 22.2% 26.6% 24.0% 1.7% 4.9% 0.36 5-yr 3.1% 5.9% 30.2% 27.0% 2.8% 5.9% 0.47
2000-05 1.0% 4.7% 23.4% 24.8% 3.7% 10.9% 0.34 2006-11 7.5% 11.4% 28.3% 25.5% 3.9% 5.6% 0.69 2000-11 4.2% 8.0% 25.9% 25.1% 3.8% 8.6% 0.44
Source: S&P Dow Jones Indices, MSCI. Calculations based on monthly data from December 31, 1999 to December 31, 2011. Charts are provided for
illustrative purposes. This graph may reflect hypothetical historical performance. Please see the Performance Disclosure at the end of this document
for more information regarding the inherent limitations associated with back-tested performance.

S&P DOW JONES INDICES | INTRODUCING GIVI: THE GLOBAL INTRINSIC VALUE INDEX May 2012
34 McGRAW-HILL
Exhibit A11: Alternative Beta Strategies (Europe, Japan, Emerging Markets): Historical Risk and Return Profile
Alternative Index Strategy Total Return Volatility Sharpe
Ratio Active Return
Active Risk
Information Ratio
MSCI Europe 4.9% 20.9% 0.13 Minimum Variance 9.0% 16.5% 0.41 4.1% 6.7% 0.61
Equal Weight 6.8% 23.6% 0.19 1.9% 4.8% 0.40
Fundamental Index 6.6% 23.3% 0.19 1.7% 4.7% 0.37
Value Weighted 4.7% 23.3% 0.10 -0.2% 3.6% -0.06
Intrinsic Value 8.1% 19.0% 0.31 3.2% 3.4% 0.94
MSCI Japan 3.1% 17.2% 0.05 Minimum Variance 5.4% 13.6% 0.23 2.3% 7.0% 0.33
Equal Weight 6.2% 17.9% 0.22 3.1% 4.2% 0.74
Fundamental Index 5.7% 17.6% 0.20 2.6% 3.1% 0.86
Value Weighted 5.9% 17.7% 0.20 2.8% 2.3% 1.19
Intrinsic Value 6.5% 14.4% 0.29 3.4% 4.8% 0.69
MSCI Emerging Markets 14.2% 24.3% 0.49 Minimum Variance 18.2% 19.3% 0.83 4.0% 6.4% 0.63
Equal Weight 16.3% 24.6% 0.57 2.1% 5.0% 0.42
Fundamental Index 20.8% 24.8% 0.75 6.6% 4.3% 1.52
Value Weighted 17.9% 25.2% 0.62 3.7% 3.0% 1.24
Intrinsic Value 17.1% 22.9% 0.65 2.9% 4.4% 0.65 Source: S&P Dow Jones Indices. Data from December 31, 2001 to December 31, 2011. Charts are provided for illustrative purposes.

S&P DOW JONES INDICES | INTRODUCING GIVI: THE GLOBAL INTRINSIC VALUE INDEX May 2012
35 McGRAW-HILL
REFERENCES Arnott, R., J. Hsu and P. Moore, 2005. Fundamental Indexation, Financial Analysts Journal, vol. 61, no. 2, March/April: 83-99. Baker, Bradley, and Wurgler. 2011. “Benchmarks as limits to arbitrage: Understanding the low Volatility anomaly.” Financial Analysts Journal (January / February): 40-54. Dimitris Melas, Remy Briand, and Roger Urwin, 2011, “Harvesting Risk Premia with Strategy Indices”, MSCI Research Insight. Fama, Eugene (1970). "Efficient Capital Markets: A Review of Theory and Empirical Work". Journal of Finance 25 (2): 383–417 Frazzini, Andrea and Lasse H. Pedersen. 2010. Betting against beta. Working paper. Stern School of Business, New York University. Haugen, R., and N. Baker. “The Efficient Market Inefficiency of Capitalization-Weighted Stock Portfolios.” The Journal of Portfolio Management, Vol. 17, No. 3 (1991) 35-40. Kang, Xiaowei, 2012. “Evaluating Alternative Beta Strategies.” Journal of Indexes Europe, March/April 2012. Mehrling, Perry. “Fischer Black and the Revolutionary Idea of Finance.” Wiley Finance Books, 2005 Markowitz, H. “Portfolio Selection.” Journal of Finance, Vol. 7, No. 1 (1952) 77–91. Pinto, J., Henry, E., Robinson, T., and Stowe, J. “Equity Asset Valuation.” CFA Investment Series Books, 2010. Sharpe, W. F. “Capital Asset Prices: A Theory of Market Equilibrium under conditions of Risk.” Journal of Finance, Vol. 19, No. 3 (1964) 425-442. Tzee-man Chow, Jason Hsu, Vitali Kalesnik, and Bryce Little, 2011, “A Survey of Alternative Equity Index Strategies”, Financial Analyst Journal, Vol. 67, No. 5
S&P DOW JONES INDICES | INTRODUCING GIVI: THE GLOBAL INTRINSIC VALUE INDEX May 2012
36 McGRAW-HILL
S&P DOW JONES INDICES INDEX RESEARCH & DESIGN CONTACT INFORMATION
Global Head Frank Luo +1 212-438-5057 [email protected] New York Berlinda Liu +1 212-438-7834 berlinda_liu@ spdji.com Aye Soe +1 212-438-1677 aye_soe@ spdji.com Peter Tsui +1 212-438-1493 peter_tsui@ spdji.com Beijing Liyu Zeng +86 10-6569-2947 liyu_zeng@ spdji.com Hong Kong Priscilla Luk +852 2532-8050 priscilla_luk@ spdji.com London
Xiaowei Kang +44 207-176-8443 xiaowei_kang@ spdji.com Daniel Ung +44 207-176-8340 daniel_ung@ spdji.com Sydney Simon Karaban + 61 2 9255 9847 simon_karaban@ spdji.com
Introducing a new way to explore indices www.spindices.com

S&P DOW JONES INDICES | INTRODUCING GIVI: THE GLOBAL INTRINSIC VALUE INDEX May 2012
37 McGRAW-HILL
PERFORMANCE DISCLOSURE The inception date of the S&P GIVI was March 19, 2012, at the market close. All information presented prior to the index inception date is back-tested. Back-tested performance is not actual performance, but is hypothetical. The back-test calculations are based on the same methodology that was in effect when the index was officially launched. Complete index methodology details are available at www.spindices.com. Past performance of the Index is not an indication of future results. Prospective application of the methodology used to construct the Index may not result in performance commensurate with the back-test returns shown. The back-test period does not necessarily correspond to the entire available history of the Index. Please refer to the methodology paper for the Index, available at www.spdji.com or www.spindices.com for more details about the index, including the manner in which it is rebalanced, the timing of such rebalancing, criteria for additions and deletions, as well as all index calculations. It is not possible to invest directly in an Index. Another limitation of back-tested hypothetical information is that generally the back-tested calculation is prepared with the benefit of hindsight. Back-tested data reflect the application of the index methodology and selection of index constituents in hindsight. No hypothetical record can completely account for the impact of financial risk in actual trading. For example, there are numerous factors related to the equities (or fixed income, or commodities) markets in general which cannot be, and have not been accounted for in the preparation of the index information set forth, all of which can affect actual performance. The Index returns shown do not represent the results of actual trading of investible assets/securities. S&P Dow Jones Indices LLC maintains the Index and calculates the Index levels and performance shown or discussed, but does not manage actual assets. Index returns do not reflect payment of any sales charges or fees an investor may pay to purchase the securities underlying the Index or investment funds that are intended to track the performance of the Index. The imposition of these fees and charges would cause actual and back-tested performance of the securities/fund to be lower than the Index performance shown. As a simple example, if an index returned 10% on a US $100,000 investment for a 12-month period (or US$ 10,000) and an actual asset-based fee of 1.5% was imposed at the end of the period on the investment plus accrued interest (or US$ 1,650), the net return would be 8.35% (or US$ 8,350) for the year. Over 3 years, an annual 1.5% fee taken at year end with an assumed 10% return per year would result in a cumulative gross return of 33.10%, a total fee of US$ 5,375, and a cumulative net return of 27.2% (or US$ 27,200). DISCLAIMER

S&P DOW JONES INDICES | INTRODUCING GIVI: THE GLOBAL INTRINSIC VALUE INDEX May 2012
38 McGRAW-HILL
Copyright © 2012 by S&P Dow Jones Indices LLC, a subsidiary of The McGraw-Hill Companies, Inc., and/or its affiliates. All rights reserved. Standard & Poor’s, S&P, and S&P 500 are registered trademarks of Standard & Poor’s Financial Services LLC (“S&P”), a subsidiary of The McGraw-Hill Companies, Inc. Dow Jones is a registered trademark of Dow Jones Trademark Holdings LLC (“Dow Jones”). Trademarks have been licensed to S&P Dow Jones Indices LLC. Redistribution, reproduction and/or photocopying in whole or in part are prohibited without written permission. This document does not constitute an offer of services in jurisdictions where S&P Dow Jones Indices LLC, Dow Jones, S&P or their respective affiliates (collectively “S&P Dow Jones Indices”) do not have the necessary licenses. All information provided by S&P Dow Jones Indices is impersonal and not tailored to the needs of any person, entity or group of persons. S&P Dow Jones Indices receives compensation in connection with licensing its indices to third parties. Past performance of an index is not a guarantee of future results. It is not possible to invest directly in an index. Exposure to an asset class represented by an index is available through investable instruments based on that index. S&P Dow Jones Indices does not sponsor, endorse, sell, promote or manage any investment fund or other investment vehicle that is offered by third parties and that seeks to provide an investment return based on the performance of any index. S&P Dow Jones Indices makes no assurance that investment products based on the index will accurately track index performance or provide positive investment returns. S&P Dow Jones Indices LLC is not an investment advisor, and S&P Dow Jones Indices makes no representation regarding the advisability of investing in any such investment fund or other investment vehicle. A decision to invest in any such investment fund or other investment vehicle should not be made in reliance on any of the statements set forth in this document. Prospective investors are advised to make an investment in any such fund or other vehicle only after carefully considering the risks associated with investing in such funds, as detailed in an offering memorandum or similar document that is prepared by or on behalf of the issuer of the investment fund or other vehicle. Inclusion of a security within an index is not a recommendation by S&P Dow Jones Indices to buy, sell, or hold such security, nor is it considered to be investment advice. These materials have been prepared solely for informational purposes based upon information generally available to the public from sources believed to be reliable. No content contained in these materials (including index data, ratings, credit-related analyses and data, model, software or other application or output therefrom) or any part thereof (Content) may be modified, reverse-engineered, reproduced or distributed in any form by any means, or stored in a database or retrieval system, without the prior written permission of S&P Dow Jones Indices. The Content shall not be used for any unlawful or unauthorized purposes. S&P Dow Jones Indices and its third-party data providers and licensors (collectively “S&P Dow Jones Indices Parties”) do not guarantee the accuracy, completeness, timeliness or availability of the Content. S&P Dow Jones Indices Parties are not responsible for any errors or omissions, regardless of the cause, for the results obtained from the use of the Content. THE CONTENT IS PROVIDED ON AN “AS IS” BASIS. S&P DOW JONES INDICES PARTIES DISCLAIM ANY AND ALL EXPRESS OR IMPLIED WARRANTIES, INCLUDING, BUT NOT LIMITED TO, ANY WARRANTIES OF MERCHANTABILITY OR FITNESS FOR A PARTICULAR PURPOSE OR USE, FREEDOM FROM BUGS, SOFTWARE ERRORS OR DEFECTS, THAT THE CONTENT’S FUNCTIONING WILL BE UNINTERRUPTED OR THAT THE CONTENT WILL OPERATE WITH ANY SOFTWARE OR HARDWARE CONFIGURATION. In no event shall S&P Dow Jones Indices Parties be liable to any party for any direct, indirect, incidental, exemplary, compensatory, punitive, special or consequential damages, costs, expenses, legal fees, or losses (including, without limitation, lost income or lost profits and opportunity costs) in connection with any use of the Content even if advised of the possibility of such damages. S&P Dow Jones Indices keeps certain activities of its business units separate from each other in order to preserve the independence and objectivity of their respective activities. As a result, certain business units of S&P Dow Jones Indices may have information that is not available to other business units. S&P Dow Jones Indices has established policies and procedures to maintain the confidentiality of certain non-public information received in connection with each analytical process. In addition, S&P Dow Jones Indices provides a wide range of services to, or relating to, many organizations, including issuers of securities, investment advisers, broker-dealers, investment banks, other financial institutions and financial intermediaries, and accordingly may receive fees or other economic benefits from those organizations, including organizations whose securities or services they may recommend, rate, include in model portfolios, evaluate or otherwise address.