Embed Size (px)
Citation preview


Introduction
In 2021, the world continues to cope with the pandemic and strive for economic recovery. With a 3.7%
decline in global income last year, family remittances have proved a lifeline to millions of families.
In 2020, these remittances provided an important sustenance for over 150 million households in the
developing world.
In Latin America and the Caribbean (LAC), remittances received by more than 30 million households,
amounted to over $114 billion, growing 6% despite the pandemic and the economic recession.
The trend in family remittances reflected three critical dynamics.
First, the money reflects migrant workers balancing unemployment, family obligations, and applying the
lessons of the global 2009 recession. Beyond resilience, migrants have endured health and economic hardship
while maintaining a positive outlook toward their families back home.
Second, these flows were, in many countries, the single positive macroeconomic indicator of 2020,
contrasting greatly with the historic 74% plummet in the tourism sector and 3.5% drop in global GDP.1
Third, the circumstances prompted migrants to accelerate the use of digital financial services to send and
receive money.
As a result, remittances became an invaluable input for economic stability and an entry point to further
financial inclusion and the digital economy.
During such a monumental economic transition, tying remittances to economic opportunities is urgent, as
this can deepen prosperity and provide a basis for asset building in of the ensuing recovery. Leveraging these
flows for growth takes on greater relevance in countries most affected by the pandemic, which are already
economically fragile. The countries sending the most migrants are also weaker and more affected by the
downturn.
1 The IMF’s World Economic Outlook Growth Projections, January 2021. The global growth contraction for 2020 is
estimated at -3.5 percent with advanced economies, including the United States, Germany, France, Italy, Spain, Japan,
the UK, and Canada, contracting by 4.9%. Emerging markets and developing economies, such as China, India, Russia,
Brazil, Mexico, Saudi Arabia, Nigeria, and South Africa, averaged a 2.4% fall. China appears to be the only major
economy to have grown in 2020.

I. The global flow of remittances
Against the backdrop of a severe global economic downturn with trade and tourism showing declines above
10%, global remittance flows decreased 6%. This decline resulted in part from the economic performance of
the different countries. The outflows in turn resulted in disparate effects in developing countries. For
example, some nationalities of migrants working in the United Arab Emirates (UAE) sent more money,
whereas others sent less. Similarly, growth was uneven: Mexico saw an increase of 10% and El Salvador
increased 4%. These variations are related to various characteristics, such as occupations, years working
abroad, or even legal status. Table 1 illustrates these distinctions.
Developing countries, especially those lacking diversified economies, often rely on the tourism sector and exports in trade for GDP growth (see Table 1). With restricted travel and decrease in demand for certain goods, many countries’ economies were shaken. The Dominican Republic (DR), for instance, heavily depends on tourism. Despite an 11% drop in exports and a 65% plummet in tourism, the DR nonetheless increased remittances from abroad by 14%. Likewise, the Philippines tourism industry and exports plunged 74% and 19% respectively, yet still managed to increase remittance by 1%. This pattern indicates that remittances exhibited a countercyclical pattern. As economies weakened, remittances tended to rise. This is not always the case, however. India’s tourism and exports decreased by 49% and 15% respectively, also also suffering a 9% fall in remittances. Part of the explanation lies in the sending country economic bloc. As the pandemic and economic recessions impacted regions differently, so too did remittance patterns vary from country to country. Migrants working abroad in the Gulf Country Council (GCC) (Saudi Arabia, Kuwait, UAE, Bahrain, and Oman) for example, faced the economic fallout from the pandemic, an oil price shock, and heavy reliance on the hydrocarbon sector. Remittance flowing from the GCC decreased by 9%, nearly $12 billion, from 2019 figures. Migrants from India, Bangladesh, Pakistan, Indonesia, and Egypt predominantly work in GCC countries, illustrating both similar and dissimilar qualities. Remittances to India dropped by 9% but rose to Bangladesh by a notable 16%. Money sent to Pakistan increased 13% year-on-year (yoy), while decreasing to Indonesia by 12%. Though these countries all rely on remittances from the GCC, they signify incongruent growth. Length of time of migratory tide in that country, legal status, occupations, and the share of migration account for variations in growth. Migrants residing in the United States and Canada (6% yoy increase of outbound remittances), Australia and New Zealand (20%), South Africa (20%), Hong Kong or China (5%), and Japan (5%) fared far better than those in the EU (-12% yoy growth), GCC (-9%), Russia and Kazakhstan (-12%), and other parts of the world (-30%). Remittances sent to Asia in turn decreased by 6%, to Africa by 9%, to Europe by 10%, and to the Middle East and Near East Caucasus by 11%. In contrast, remittances flowing to LAC increased by 6%. Much of this has to do with the resilience of migrants living in the United States, owed to hard lessons learned from the 2009 global recession (see section II).

Table 1: Remittances to main receiving developing countries Subregion Country
Main Corridor Sending Country
Remit. Rec. 2006 (,000,000)
Remit. Rec. 2015 (,000,000)
Remit. Rec. 2019 (,000,000)
2020 (est) Growth
Remit as % GDP 2019
Exports est growth
Tourism est growth
Southern Asia Nepal 1453 6730 8128 -1% 27 -72% Latin America and Caribbean Honduras USA 2337 3666 5401 4% 22 1% -68% Latin America and Caribbean El Salvador 3483 4285 5656 4% 21 -14% -63% Latin America and Caribbean Guatemala USA 3700 6573 10656 7% 14 -1% -75%
Near East/Middle East Lebanon 5202 7481 7467 14 -68%
Near East/Middle East Jordan 2794 5348 4510 10 6% -72% Non-EU Receiving Ukraine 3102 5845 15918 10 5% -78% Northern Africa Egypt UAE 5330 18325 26791 9 -1% -67%
South-Eastern Asia Philippines USA 15496 29799 35167 1% 9 -19% -74% Latin America and Caribbean
Dominican R. USA 3054 5196 7421 14% 8 -11%
Southern Asia Pakistan Saudi Arabia 5121 19306 22322 13% 8 -6% -11%
Southern Asia Sri Lanka 2167 7000 6747 8 17% -70%
Southern Asia Bangladesh Saudi Arabia 5428 15388 18362 16% 6 -15% -43%
Northern Africa Morocco France 5451 6904 6735 -10% 6 -9% -58%
South-Eastern Asia Vietnam USA 3800 13200 17000 -5% 6 5% -58%
Sub-Saharan Africa Ghana UK 105 4982 3521 5 -7% -69%
Sub-Saharan Africa Nigeria USA 16932 21060 23800 5 -82%
Southern Asia India USA or SA 28334 68910 83132 -9% 3 -15% -49% Latin America and Caribbean Mexico USA 26543 26164 38629 10% 3 -13% -56% Latin America and Caribbean Colombia USA 3899 4680 6770 1% 2 -23% -67%
South-Eastern Asia Indonesia 5722 9659 11666 -12% 1 -75%
EU Receiving Poland UK 8486 6783 697 1 South-Eastern Asia Thailand 1333 5895 7077 1 -70%
Eastern Asia China USA 4319 44445 18294 0 4% -56% World World $216,398 $ 432,115 $ 653,323 -4% -7% -74% Share of top 24 countries relative global flows 76% 80% 61%
Source: Central banks of each country. The Case of Migrants in the United States In spite of lockdowns and closure of many businesses, many migrant workers either maintained their jobs as essential workers, drew from their savings, or found another means to continue sending money back. Job losses for migrants in the United States fluctuated throughout 2020. The first quarter, at the beginning of the pandemic, saw job losses at 7%, followed by 20% in Q2, 20% in Q3, and 7% by Q4. US Bureau of Labor Statistics data suggested that by the end of 2020, LAC migrant labor force in the United States would have 6.7% minimum threshold unemployed (1.5 million + workers). Analyzing the unemployment rates among immigrants over 16 years old compared with US-born workers in the beginning of the pandemic illustrates the disproportionate impact of economic stress of migrant workers. The transportation and utilities sector saw the greatest disparity in unemployment between immigrants and US-born workers with foreign-born workers experiencing a 20.8% unemployment rate and US-born counterparts having a 10.2% unemployment rate. Other sectors that hit immigrant populations harder than US workers include agriculture (11.6% v 5.5%), wholesale trade (12.5% v 8.8%), leisure and hospitality (39.1% v 37.6%), personal services (26% v 21.1%), retail and trade (19.8% v 17.9%), construction (16.8% v
15.1%), education and social assistance services (15.7% v 14.3%), professional and business services (10.5% v 9.4%), financial activities (6% v 5.3%).2 Table 2: Unemployment Rates among Immigrants and US-born adults over 16 years old (April 2020)
Immigrants US-born
Leisure and hospitality 39.10% 37.60%
Personal and other services 26% 21.10%
Transportation and utilities 20.80% 10.20%
Retail trade 19.80% 17.90%
Construction 16.80% 15.10%
Education and social assistance services 15.70% 14.30%
Manufacturing 13% 13.10%
Wholesale trade 12.50% 8.80%
Information 11.70% 12.10%
Agriculture 11.60% 5.50%
Professional and business services 10.50% 9.40%
Health services 8.10% 8.10%
Mining, quarrying, oil and gas extraction 7.90% 10.20%
Financial activities 6% 5.30%
Public administration 3.80% 4.80%
Source: US Bureau of Labor Statistics, May 2020. Interestingly, healthcare services is the only sector experiencing equal unemployment between US-born and immigrant workers at 8.1%. The only sectors with higher unemployment among US-born rather than immigrant workers were manufacturing (13% of immigrants and 13.1% of US-born workers), information (11.7% v 12.1%), public administration (3.8% v 4.8%V), and mining, quarrying, and oil and gas extraction (7.9% v 10.2%). When synthesized with data on migrant occupations in the United States, this pictures gains focus. The most common sector for Central Americans in the US, for example, is construction and extraction, representing 16.44% of migrant workers. A 16.8% unemployment rate within the most popular sector for Central American workers rings alarm bells for those who follow remittance patterns. With so many out of work, remittance will surely decrease. The reality, of course, is much more complex. Not only are global remittance patterns a countercyclical phenomenon, but migrants who have lived through the aftermath of the 2009 global recession in the United States have learned hard lessons about economic shock. Having experienced the economic contraction of the 2010s, Central American migrants in the United States increased personal savings from $4,000 in 2009 to $6,000 in 2020. We estimate that among unemployed migrants, more than two thirds continued to send money home by dipping into this increased savings. In the 2009 recession, by contrast, only 25% of the unemployed had enough savings to be able to use for remittances. Though the pandemic initiated a domino effect of economic impacts from the macro to micro experiences, job losses have remained relatively low in comparison to the 2009 recession in the United States, allowing migrant workers to continue earning a living while sending money to families.
2 Non-farm payroll employment, BLS Economic News releases for each month. Bls.gov.

Table 3: Migrant Occupations in the US Mexico South
and East Asia
Europe & Canada
Carib. Cen. Am.
South Am.
Middle East
Sub-Sah. Africa
Other
Management and business 5.68 16.53 20.02 8.64 5.93 12.91 16.15 10.79 20.92
Office and administrative support
6.59 9.02 10.01 11.03 7.60 10.80 9.22 9.31 11.20
Education, arts, and media 2.61 6.97 10.37 4.89 2.64 7.34 9.83 5.77 9.41
Installation, repair, and production
14.89 7.63 6.61 9.07 12.29 7.76 5.83 7.40 8.26
Sales 5.98 9.51 8.91 8.27 6.16 10.04 14.18 8.09 8.23 Healthcare 2.34 10.59 8.63 13.57 3.32 6.21 8.64 18.07 7.66 Science and engineering 1.23 16.00 9.63 2.72 1.48 4.79 10.22 6.07 7.13
Other services 4.07 7.03 5.51 8.30 4.17 6.15 5.39 8.79 5.59 Transportation and material moving
9.40 3.96 4.84 10.40 9.49 6.82 8.24 11.22 5.59
Food preparation and serving
10.32 6.37 4.00 5.69 9.69 6.40 5.05 4.09 4.79
Building and grounds cleaning and maintenance
13.14 2.34 3.35 7.71 16.84 9.69 1.85 4.24 4.65
Legal, community, and social services
0.76 1.52 2.47 2.17 1.23 2.00 1.73 2.89 2.57
Construction and extraction
16.20 1.26 4.75 5.70 16.44 7.87 1.99 1.55 2.50
Farming, fishing, and forestry
5.83 0.25 0.24 0.39 1.65 0.26 <0.05 0.25 0.90
Unemployed 0.89 0.87 0.55 1.30 1.01 0.83 1.61 1.39 0.50
Military 0.06 0.13 0.12 0.16 0.06 0.13 <0.05 0.11 0.10 Source: US Bureau of the Census, 2018.

II. Flows to Latin America and the Caribbean
Latin American and Caribbean countries for the most part experienced a positve growth in transfers
amounting to over $114 billion. These flows demonstrate a countercyclical behavior, meaning they grew
during a recessionary period when trade fell over 10% and tourism over 50%. While some countries saw
more increases than others, with the exception of Venezuela and Peru, the trend was largely upward or flat.
Countries whose flows are largely coming from the United States, and with nationalities with more than 20
years of migration trajectory, were mostly positive. Moreover, in the context of closed borders and limited
travel, the outflows to the region were shaped predominantly by increases in the amount sent.
Table 4: Family Remittances to Latin America and the Caribbean 2020
Indicators Migrant Senders
Remittances Sent in 2019
Remittances 2020
Rem. Growth
From USA US Outbound US Transfers
Trade Growth
Tourism Growth
GDP Growth
Bolivia 597,183 $1,318,217,186 $1,064,019,188 -19%
35% $388,032,609.30 209,014 -31% -71% -8%
Brazil 1,186,831 $3,213,621,676 $3,312,521,520 3%
35% $1,214,748,993.50 415,390 -7% -50% -5%
Colombia 1,950,942 $6,733,169,230 $6,902,909,725 3%
45% $3,060,696,225.15 877,923 -23% -67% -7%
Costa Rica 125,000 $518,197,025 $504,966,667 -3%
65% $328,770,000.00 81,250 1% -58% -4%
Dom. Rep 1,059,894 $7,087,045,534 $8,219,262,926 16%
65% $5,255,714,306.05 688,931 -11% -65% -6%
Ecuador 804,906 $3,234,648,753 $3,346,959,875 3%
45% $1,440,730,187.10 362,207 -12% -70% -9%
El Salvador 1,088,503 $5,650,270,000
$5,918,610,000 5% 90% $5,307,119,190.00 979,652 -14% -63%
-9%
Guatemala 1,500,000 $10,508,307,400 $11,340,115,500 8%
90% $10,082,032,263.90 1,350,000 -1% -75% -3%
Haiti 1,078,263 $3,346,270,000 $3,814,747,800 14%
76% $2,899,208,328.00 819,479 -8%
Honduras 755,556 $5,384,500,000 $5,619,130,932 4%
80% $4,492,064,800.00 680,000 1% -68% -3%
Jamaica 913,896 $2,276,443,206 $2,949,423,952 30%
65% $1,634,233,339.70 594,032 -25% -70% -9%
Mexico 7,399,547 $36,438,758,100 $40,606,602,521 11%
90% $36,310,973,676.30 6,659,592 -13% -56% -9%
Nicaragua 750,000 $1,682,400,000 $1,851,400,000 10%
60% $1,097,100,000.00 450,000 6% -53% -4%
Paraguay 697,310 $568,430,000 $486,429,157 -14.4%
35% $171,097,430.00 244,058 -12% -55% -2%
Peru 1,028,786 $3,325,921,219 $2,869,798,740 -14%
25% $734,411,849.00 257,196 -24% -74% -13%
Venezuela 2,835,000 $3,115,900,211 $2,492,720,169 -20%
20% $498,544,033.80 567,000 -58% -30%
Other 3,223,649 $12,572,232,972 $12,823,677,631 2% 30% $3,847,103,289.30 967,094
Source: Central Bank of each country. Some countries include estimates for November and December 2020.
As the table above shows, significant differentiation exists among the various LAC countries receiving remittances. Honduras, for example, receives around 80% of its remittances from the United States and experienced a 4% yoy increase of remittances, while Guatemala receives 90% from the US and saw a 7% yoy increase of remittances. Migrants in the United States may be at an economic advantage compared to those living in less developed countries. Another explanatory variable for Guatemala’s three-point lead over Honduras in terms of remittance growth in 2020 could be linked to length the amount of time a migrant community has lived abroad. Honduran migrants have lived in the United States for an average of 9.6 years in comparison to Guatemalans’ 12.7 years. Those additional 3.1 years can equate to planting more roots, earning more money, and increasing savings.

Table 5: Latin American Migrants Years Living Abroad 2018
Guatemala 12.7
El Salvador 19.4
Honduras 9.6
Nicaragua 16.5
Mexico 20.6
Ecuador 16.9
Dominican Republic 19.4
Colombia 17.6
Source: Orozco, Manuel. “On the Cusp of Change: Migrants’ use of the internet for remittance transfers,” Inter-American Dialogue.
Technology at play through digital transfers
Using online transfers, such as mobile or web-based vehicles, facilitated the urgency among migrants to remit
to their relatives. Part of the increases in flows relate to shifts in the use of online money transfers during the
COVID-19 crisis. Most online remittance service providers reported growth in their transactions of over
100%. The market share of digital or online remittance companies increased from 21% to 36% in terms of
originating transactions during this period. Digital transfers to Mexico increased to over 40%. One significant
feature of online companies is that typically migrants send a higher amount online than with other service
providers.3
Table 6: Outbound Transfers from the U.S. to Latin America and the Caribbean by Number of Transactions US-LAC Market share February March April May June-October
Offline 64-75%75%-64% 16,672,500 8,336,250 11,670,750 12,254,288 14,000,000
Online outbound 25-36% 4,500,000 6,000,000 7,200,000 7,560,000 7,900,000
Transactions (migrants perform 1.36 transactions per month)
21,172,500 14,336,250 18,870,750 19,814,288 21,900,000
Source: calculations made by the author using money transfer company data.
Sending money to Mexico
The 10% in volume growth in Mexico, as reported by the Central Bank, appears astronomically high insofar
as it reflects an increase at a time where most countries experienced negative growth. The reasons for the
increase are twofold. Mexican migrants sent money increased by 8%, increasing the number of people-to-
person transactions from to 8.3 million (up from 7.6). Unlike other nationalities, a smaller share (60%-70%)
of Mexican migrants have traditionally remitted; however, as they have stayed longer, the number of remitters
increased, showing progressive growth since 2005. The COVID-19 crisis heighted the number to reach over
80% of all Mexican migrants in the United States.
3 Orozco, Manuel. Remittances to Latin America and the Caribbean 2018. Washington, DC 2019. And Orozco, Manuel. The Remittance Marketplace in 2019: The Growing Role of Digital Payments, 2020.

Second, there is a slight increase of 5% in the average remitted from $320 to $340.4 Furthermore, other cross
border migrant workers who stayed on the US side performed cash transfers to their families instead of
returning with money themselves. This was due to pandemic-induced travel restrictions, closed borders, and
the transmissibility of the COVID-19 virus.
Sending money to Central America
Central American countries experienced significant increases in money sent by migrants from the region. The
pandemic arrived in the middle of political crises in all five countries and across varying responses to the
contagion by governments. Moreover, nearing the end of 2020, the hurricanes that touched land in this
region created an additional magnifying impact into difficult conditions. Migrants in the United States
experienced trying times during the first half when economic activity closed partly because their occupations
were some of the most affected (restaurants, domestic work, and the like).
Despite this situation, with job losses fluctuating between 6 and 20% throughout the year, and the lessons
learned from the 2009 global recession, Central Americans abroad were able to send extra money back home.
The figure below shows how quarterly increases in remittances for each country correlated to quarterly
increases in the average amount remitted. In Honduras, the increase in remittances sent by each migrant was
higher than the volume growth. This is explained by the fact that there were many households that stopped
receiving remittances,; however, those that did continue sent much higher amounts, hence compensating for
the total aggregate volume. According to a survey conducted by Creative, 17% of recipients did not receive
remittances. However, all others received the same or more than the year before.
Table 7: Remittances to Central America, growth 2019-2020 Growth in average remitted Volume growth
El Salvador 5% 5%
Guatemala 6% 7%
Honduras 11% 4%
Nicaragua 11% 9%
Source: Central Bank and money transfer company data for average remitted.
4 Bank of Mexico, https://www.banxico.org.mx/SieInternet/consultarDirectorioInternetAction.do?accion=consultarCuadro&idCuadro=CE81&locale=es
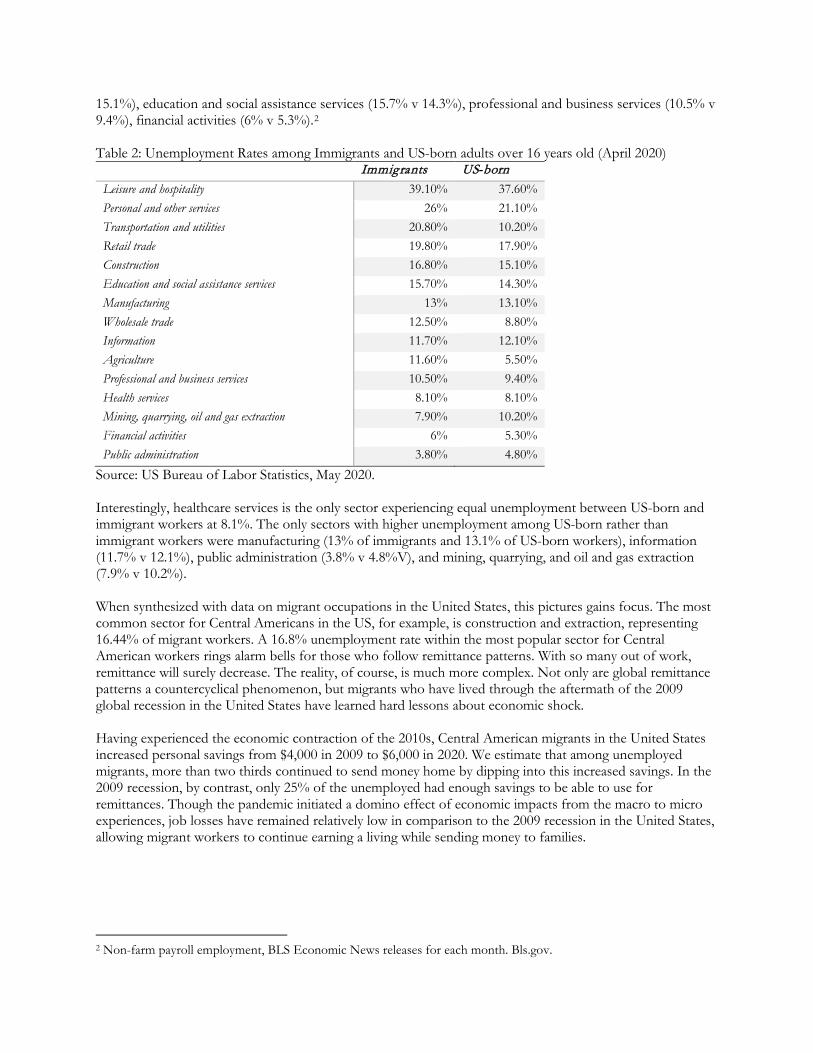
The flow of money to Nicaragua is considerable in the context of the political and economic crises. For this
country, remittances have been the single most important positive macroeconomic indicator. Remittances
shifted from 9% of GDP in 2017 to 16% in 2020. A lot of these flows are informed by factors related to
economic and political instability.
The political crisis forced thousands of people to move abroad. In a December 2019 survey, 9% of
Nicaraguan households said they had a relative leave the country since the ongoing political crisis began in
April 2018. This amounts to 140,000 people.5 Six months later in June 2020, 13% said a relative had left since
that political crisis. Most of these individuals fled to Costa Rica, Spain, and the United States. In turn, many
have sent money to their relatives upon arrival.
The outflow of migrants has translated into money sent and magnified the country’s only positive
macroeconomic indicator as the economy has continued to decline. The graph below demonstrates the
variations in the amounts sent and effect on the country’s inflow’s growth.
5 Orozco, Manuel. Based on survey with 1,010 individuals conducted by Borge y Asociados, December 2019.
0
100
200
300
400
500
600
0 500 1000 1500 2000 2500 3000 3500
Ave
rage
rem
itte
d p
er q
uar
ter
by
mig
ran
t
Remittances Quarterly FLow (US$,000,000)
Figure 1: Quarterly Flows and Average Amount Remitted to Central America
Nicaragua
El Salvador Honduras
Guatemala

Source: Central Bank of Nicaragua.
Continued Economic Crisis in Venezuela, dependence on remittances
Historically, remittances to Venezuela have not played a significant role in the balance of payments. This is partially due to the relative political and economic stability of Venezuela in the latter part of the 20th century. Until the 1990s, Venezuela was an exception to the rule of fragility and chaos throughout Latin America. A host country for migrants from around the world, notably including Colombian refugees and migrants fleeing armed conflict, the Venezuelan economy was thriving on oil revenue and experiencing free and fair elections on a regular basis. With the collapse of the Venezuelan economy and the deepening of the political crisis, migration reached at least 5 million in 2020. The need for foreign currency and drastic decline in oil revenue, and economic productivity generally, has transformed Venezuela into a hybrid dollarized economy. Family remittances sent from abroad, amid the humanitarian and economic crises, are more important than ever. Despite the pandemic, people attempted to continue to send money in lower volumes, sustaining a few families. For example, 74% of the nearly 2 million Venezuelan migrants living in Colombia send money to their families, though largely informally. The lack of prevailing payment systems and regular access to a trusted money carrier often results in “in-kind materials” being far more practical than sending money. For the cash-strapped Venezuelan economy, small amounts of money that are sent from family abroad is a survival mechanism. The flow of remittances is now perhaps the single most important commodity in Venezuela, stemming primarily from Colombia, Chile, Costa Rica, Panama, Spain, and the United States. The use of formal money transfer systems, when authorized, is prohibitively expensive, leading many Venezuelan migrants to opt for informal transfers or “in-kind” goods. A survey of Venezuelan migrants conducted by the Center for Migration and Economic Stabilization of Creative in Colombia in November 20206 showed that the most common methods for sending money indicated were via digital remittance service providers and physical banks. While the study showed that many were sending less money than in previous years, those who continued sending have contributed to their families in Venezuela.
6 Orozco, Manuel. Venezuelan Immigration Trends, Challenges, and Possibilities for Integration, Nov. 2020, Creative Associates International.
-30%
-20%
-10%
0%
10%
20%
30%
16%19%
-9%
-15%
24%
-9%
-28%
-9%
Figure 2: 2020 growth of remittances to Nicaragua from remittance sending country

Table 8: Remittances to Venezuela Venezuelan migrants 70% send 20-25% of their income, US$ Households
receiving in 2019
2018 2019 2020 2018 2019 2020
COSTA RICA 36,000 39,600 40,788 27,216,000 29,937,600.00 23,126,796.00 24,948
PANAMA 79990 87,989 90,629 75,590,550 83,149,605.00 64,233,069.86 55,433 BRAZIL 50,000 212,400 218,772 47,250,000 200,718,000.00 155,054,655.00 133,812 CHILE 84,586 371,200 382,336 79,933,770 350,784,000.00 270,980,640.00 233,856 COLOMBIA 870,000 1,400,000 1,800,000 249,933,600 402,192,000.00 431,412,480.00 882,000 ECUADOR 200,000 330,400 340,312 50,400,000 83,260,800.00 64,318,968.00 208,152 UNITED STATES 433,630 446,639 460,038 819,560,700 844,147,521.00 869,471,946.63 281,383
PERU 700,000 860,900 886,727 286,650,000 352,538,550.00 290,491,765.20 542,367 SPAIN 202,859 270000 278,100 306,722,808 408,240,000.00 336,389,760.00 170,100 REST OF COUNTRIES 579,424 480,872 495,298 547,555,680 454,424,134.50 374,445,486.83 302,949
WORLD 3,000,000 4,500,000 4,993,000 2,490,813,108 3,209,392,211 2,879,925,568 2,835,000
Source: Orozco, Manuel with Kathryn Klaas. Money Transfers to Venezuela, Remittance Flows Amidst Evolving
Foreign Exchange, 2020. Venezuelan Immigration Trends, Challenges, and Possibilities for Integration, Nov. 2020
Remittance Lifelines to Haiti
Migration from Haiti is primarily driven by dramatic state failure and strong transnational ties. Though many formerly enslaved and free individuals fled the island during the Haitian Revolution from 1791-1804, it wasn’t until the middle of the 20th century that out-migration became a prominent feature of Haitian society. With diaspora communities spread across Europe, Latin America, and North America, the most significant presence in terms of remittances is in the United States where more than half of Haitian migrants live and work. Haitian workers in the United States serve as a lifeline for the Caribbean nation in assistance for recovery from natural disasters, supporting community education and helping to alleviate extreme poverty. Accounting for more than 36% of Haiti’s GDP in 2019, global remittances make Haiti one of the most remittance-dependent countries in the world. The last three years have seen a steady increase in money sent from abroad. In 2018, $3.1 billion flowed into Haiti; in 2019, $3.3 billion; and in 2020, despite the pandemic and global economic constriction, a record $3.8 billion.

Table 9: Growth of remittances from sending countries, January 2019 - August 2020 USA Chile France Canada Dominican
Republic Growth 26.58% -20.73% -0.06% -5.27% 8.33%
Source: Central Bank of Haiti This was a 14% increase from the previous year, with a crucial 84% of the money originating in the United States, up from 76% the year before). Behind the United States, Chile, France, Canada, and the Dominican Republic were major contributors to the 14% total yoy growth in 2020. From the beginning of 2019 through August 1, 2020, the share of total remittances originating in the United States rose by 26.58%. Table 10: 2020 Global Remittances to Haiti
Remittance originating country USA Chile France Canada Dominican Republic
% of total remittances 84% 5% 3% 4% 3%
Source: Central Bank of Haiti The only other major contributing country to increase its total share of money sent to Haiti in this time period was neighboring Dominican Republic, increasing by 8.33%. Meanwhile, money sent from Chile decreased by 20.73%, from France by .06%, and Canada by 5.27%. These data point to the economic resilience of migrants living in the United States, as well as the harsh impact of the year on migrants in Europe, Canada, and Chile.

III. Remittances, Countries Fragility, and Future Migration
The significance of migrant economic engagement, such as remitting, stems from the determinants of
migration itself. Migrants send remittances to countries that are structurally vulnerable, many of which are
economically and politically fragile states. This fragile status is main reason migrants leave in the first place.
The table below illuminates an invaluable point: Countries that score poorly in several indicators tend to be
the remittance-dependent (or migrant-sending) countries (meaning remittance account for over 5% of GDP).
Table 11: Income dependence on remittances and key country indicators 2018
Income dependence on remittances across 100 countries
<1% Between 1-5%
>5%
Global Health Indexa 51.2 41 38.2 Population ages 65 and above (% of total population) b 11.53 9.76 7.03
Democracy Index c 6.59 5.59 5.06 Tourism % of total exports b 12.73 18.17 25.78
Personal remittances, received (% of GDP) b 0.32 2.62 11.61
Economic Complexity Index d 0.32 0.04 -0.31 Government measures addressing COVID-19 121 102 79 Per Capita GDP b 28,959 11,005 3,221
Share of rural areas b 28.82 46.13 49.57
Share of migrants to pop. b 6% 10% 16% Social Progress Index 59.94 49.66 48.43
Govt. Expenditure b 17% 17% 13% Source: data compiled by the author. a. Global Health Security Index 2019, Economist Intelligence Unit; b. World Bank Development
Indicators; c. Democracy Index, Economist Intelligence Unit; d. The Atlas of Economic Complexity.
Countries that are more migrant- and remittance-dependent exhibit:
• less competitive capacity in the global economy
• more rural presence
• less democratic tendencies
• lower growth & higher inflation
• very informal economies
• lower healthcare capacity
These conditions are aggravated during the pandemic and can lead to further migration. Therefore,
remittances have played a crucial rule during this critical time because they either continue to flow and grow
or were less affected by the global downturn.
At the same time, the severity of this crisis generated by the COVID-19 pandemic raises the specter of an
outpour of migrants worldwide, as it is assumed that economic crises lead to migration. News of families and
individuals migrating are already appearing around the world.
Given the complexities shaping the world circa 2019, with the added pandemic, the prospects of international
migration are likely to be large. More than half of developing countries have experienced large migration rates
resulting from a mixed set of factors, most of which are related to country-differentiated crises, such as
earthquakes, civil wars, foreign intervention, military coups, financial crises, among others.

Moreover, global patterns, such as the 2009 economic recession or the early 2000 democratic transitions,
have perhaps triggered existing conditions prone for people to emigrate. Trends in migration statistically
correlate with key economic, social, and economic indicators.
Specifically analyzing migration, economic, political, and social data for the 2000 to 2019 period, shows that:
• Countries with higher migration growth are among the most fragile, have low income, and represent over
14 million migrants. In 2019, 21 million migrants came from 9 fragile countries.
• Economic growth, particularly negative per capita economic growth, is a common denominator of
migration. Five years after the global recession, migration growth between 2010-2015 was 4%.
• Accompanied with growth, migration is more pronounced in countries with average incomes below
US$6,000, where 60% of migrants come from.
• Migration growth post-COVID-19 may result in a combination of patterns similar to the 2015 and 2019
periods, such as:
o Negative economic growth in 2020, a less competitive region, accompanied with more political
difficulties moving forward will increase human mobility.
o Its pattern may point to an increase in migration higher than 4% from 2019 as experienced in the
post-global recession period.
The COVID-19 pandemic has affected many developing countries in their economies and society, possibly
impacting international migration differently and more strongly than the previous 20 years. Before the
pandemic, there were already events in several places with increasing social protests, particularly after 2015.
Between 2000 and 2019, the average number of protests worldwide almost tripled from 16 to more than 50.
Moreover, political conditions in many countries were deteriorating, and while economic growth had
improved after 2015, the extent of economic competitiveness has remained low among developing countries,
with average economic competitivity in 2019 similar to that in 2013.
More importantly, developing countries in the 2010-2015 period following the Great Recession of 2009 did
not exhibit negative per capita growth. But with systemic -4% economic growth in 2020 and a slow recovery
into 2021, conditions are worse than in 2009. For reference, in 2009, per capita growth in developing
countries was + 2%.7
The problems now, therefore, are more pronounced in 2019 and 2020 than previous periods in terms of the
intensity of conditions, some of which may lead to further migration. Using 2019 international migration
distribution against several social and economic indicators shows again that declines in economic
competitiveness,8 projected economic impacts in 2020, and an increase in social protests may lead to a similar
increase in migration above percentages from previous years.
The significance of widespread social protests in 2019 stymied by the pandemic in 2020, combined with the
international recession in 2020, should not be underestimated. Of all indicators, the most powerful is the
decline in economic growth as it is projected to affect 80% of all countries, rich and poor. A 1% decline in
growth will yield a 4% increase in migration.
Nicaraguan migration may be an illustration of these numbers. As described earlier, the deteriorating political
and economic conditions in Nicaragua have prompted many people to consider migrating. In December
2019, 19% of people expressed that they or a relative had an intention to migrate. The pandemic added
another complication to the economic and political situation, and in June 2020, the number of people saying
7 IMF. World Economic Outlook, October 2020: A Long and Difficult Ascent. October 2020 8 As measured through the index of economic complexity.
they had a relative planning to migrate was 35%. By January 2021, with a negative growth of -4% for a third
consecutive year, the number of people wanting to migrate increased to 60%.9 One indicator reflecting this
situation is also the number of Nicaraguans apprehended in 2019, just over 14,000 with 4,000 of them
applying for asylum. In prior years, the number of apprehensions of Nicaraguans was under 4,000 people
with less than 300 asylum applications.
The prospect of outmigration above historic numbers occurs at a time where the contagion has affected
migrants in the host countries. Although migrants continued sending money in 2020, the possibility of
remitting at similar levels in 2021 may depend on the pace of the economic recovery in the migrant host
countries.
Because most migrant workers come from developing countries in which the average family earns less than
$6,000, a deterioration will cause greater structural constraints, including strong dependence on few external
factors, high levels of informal economies coexisting with rural areas, and less democratic societies.
Remittances as Part of Economic Stabilization Initiatives as Migration and Crisis Prevention and Mitigation
The context shaping future migration is a drastic one. As in previous scenarios, countries experiencing
complex, severe problems are more likely to produce migration. Because the impact of the pandemic in
externally dependent and highly informal economies has been more severe,10 it is important to introduce a
systemic economic stabilization approach that (a) taps into all economic sectors beyond economic enclaves
(such as tourism or agriculture); (b) targets people at risk of migrating—that is, those largely based in less
economically competitive sectors and places affected by threats to human security, such as gang presence or
operation of narco-trafficking; and (c) leverages on remittance recipient savings. The blueprint for action of
the Remittance Community Taskforce offers important insight as to specific paths to follow to strengthen the
remittance and finance ecosystem.11 It will contribute to a broader economic stabilization strategy.
Entrepreneurship modernization is necessary to help societies adapt to the changing dynamics in the post-
pandemic period, which have deepened the emphasis of working in the knowledge and digital economy.
Helping these businesses to adapt to the new post-COVID-19 globalized world is essential as it helps
maximize the economic recovery from the pandemic and evolve into a more competitive environment. One
area of attention is integrating businesses further into the digital economy (i.e., production factors through
activities that are primarily subordinated by digital performances (internet-based data storing and processing)
across all economic sectors and intermediaries (such as money, information, or connectivity)). Skills training
and technical and financial support should be aligned to strengthen workers and businesses in the digital and
knowledge economies, ensuring that microenterprises are accessing digital:
• Financial services (POST use, banking access, clients with digital wallets)
• Management operations and activities (manage purchase orders online, home delivery of merchandise through online orders)
• Manufacturing (use of accessible and available technology to maximize productivity, including 3D printing)
• Identification to enhance labor and business connectivity and networking capacity
9 Survey, June 2020, Inter-American Dialogue. CID-Gallup Poll, January 2021. 10 Orozco, Manuel. About the economic impact of the COVID-19 crisis on the region. August 2020. Creative Associates. 11 https://143163-1013359-1-raikfcquaxqncofqfm.stackpathdns.com/wp-content/uploads/2020/12/Blueprint-for-
Action_FINAL.pdf

These efforts can be leveraged with remittances by focusing on financial inclusion vehicles and instruments
that formalize savings from remittances and mobilize them into credit for these particular sectors. Effective
systems that motivate migrants to invest in their home countries leveraged with investment catalyzers through
financial institutions can help mitigate and address the structural constraints of several economies.
The shifts in remittance trends offer opportunities to bolster the flow as a means to prevent further
deterioration and leverage the flows looking to the future. The flows will have a lesser effect on growth
decline in most countries. A remittance-related focus should look at least three issues:
a) money management tools for financial resilience
b) differentiated approaches to main social sectors, including remittance recipient, women head of
households, students, and entrepreneurs
c) financial access in the digital economy
Remittance recipients typically have a comparatively strong purchasing power. With financial advice,
recipients can learn to stretch the durability of their income using economic resilience tools, budget re-
evaluation, savings administration, and the use of mobile wallets as efficient budgeting vehicles.
The differentiated approach to women-headed households, which typically represents half of all recipient
households, is particularly important because they tend to face uncertainty of the durability of their income,
further economic losses, and diminished social capital. Financial tools that can help smooth some of their
economic obligations, while exploring alternative modes of income-generating activity.
Because 60% or more of the labor force in the region is informal (and at least two in every ten people are
entrepreneurs, the majority of whom are also informal entrepreneurs, vendors, and traders for both the
formal and informal sectors), providing these sectors with tools to integrate their business into the digital
economy is essential.12 The importance of the digital economy rests on that its functioning increases
productivity, maximizes reach, economies of scale as well as reduces transaction costs.13
12 The digital economy is the integration of production factors through activities that are primarily subordinated by digital performances (internet-based data storing and processing) across all economic sectors and intermediaries (such as money, information, or connectivity). For a discussion, see, Tim Jordan, The Digital Economy, Polity Press2020. 13 See for example, the World Development Report 2016: Digital Dividends and Digital Economies at Global Margins (International Development Research Centre) 2019.

Annex
12951447 1414
1492
13131210
16651730
2205
27222821 2761
23892491
3180 3132
1163
13451452 1425
1190 1207
15491668
384 413 431 455 425 436 482 500
119 130 135 135 104 119 138 1440
500
1000
1500
2000
2500
3000
3500
Q12019 Q22019 Q32019 Q42010 Q12020 Q22020 Q32020 Q42020
Family Remittances to Central America
El Salvador Guatemala
Honduras Nicaragua
Costa Rica