Embed Size (px)
Citation preview
1
© 2
014
Bak
er H
ughe
s In
corp
orat
ed. A
ll R
ight
s R
eser
ved.
© 2014 BAKER HUGHES INCORPORATED. ALL RIGHTS RESERVED. TERMS AND CONDITIONS OF USE: BY ACCEPTING THIS DOCUMENT, THE RECIPIENT AGREES THAT THE DOCUMENT TOGETHER WITH ALL INFORMATION INCLUDED THEREIN IS THE
CONFIDENTIAL AND PROPRIETARY PROPERTY OF BAKER HUGHES INCORPORATED AND INCLUDES VALUABLE TRADE SECRETS AND/OR PROPRIETARY INF ORMATION OF BAKER HUGHES (COLLECTIVELY " INFORMATION"). BAKER HUGHES RETAINS ALL RIGHTS
UNDER COPYRIGHT LAWS AND TRADE SECRET LAWS OF THE UNITED STATES OF AMERICA AND OTHER COUNTRIES. THE RECIPIENT FURTHER AGREES TH AT THE DOCUMENT MAY NOT BE DISTRIBUTED, TRANSMITTED, COPIED OR REPRODUCED IN WHOLE OR
IN PART BY ANY MEANS, ELECTRONIC, MECHANICAL, OR OTHERWISE, WITHOUT THE EXPRESS PRIOR WRITTEN CONSENT OF BAKER HUGHES, AND MA Y NOT BE USED DIRECTLY OR INDIRECTLY IN ANY WAY DETRIMENTAL TO BAKER HUGHES’ INTEREST.
Introduction of Gravel Pack with Inflow Control
Completion in Brazil
6th European Sand Management Forum
Abrahão Jardim / Alberto Costa / Tobias Rocha / Hang Nguyen / Peter Kidd – Baker Hughes
Daniela Leite / Arcindo Santos – Statoil Brasil
2
© 2
014
Bak
er H
ughe
s In
corp
orat
ed. A
ll R
ight
s R
eser
ved.
Agenda
▪ Objectives
▪ Reservoir Information
▪ Conventional Gravel Pack ICD Gravel Pack – Well Design
▪ Challenges
▪ Case History #1
▪ Case History # 2
▪ Conclusions
3
© 2
014
Bak
er H
ughe
s In
corp
orat
ed. A
ll R
ight
s R
eser
ved.
Objectives
▪ Provide sand control
▪ Provide uniform inflow along long horizontal well
▪ Provide additional oil production compared with standard screens
4
© 2
014
Bak
er H
ughe
s In
corp
orat
ed. A
ll R
ight
s R
eser
ved.
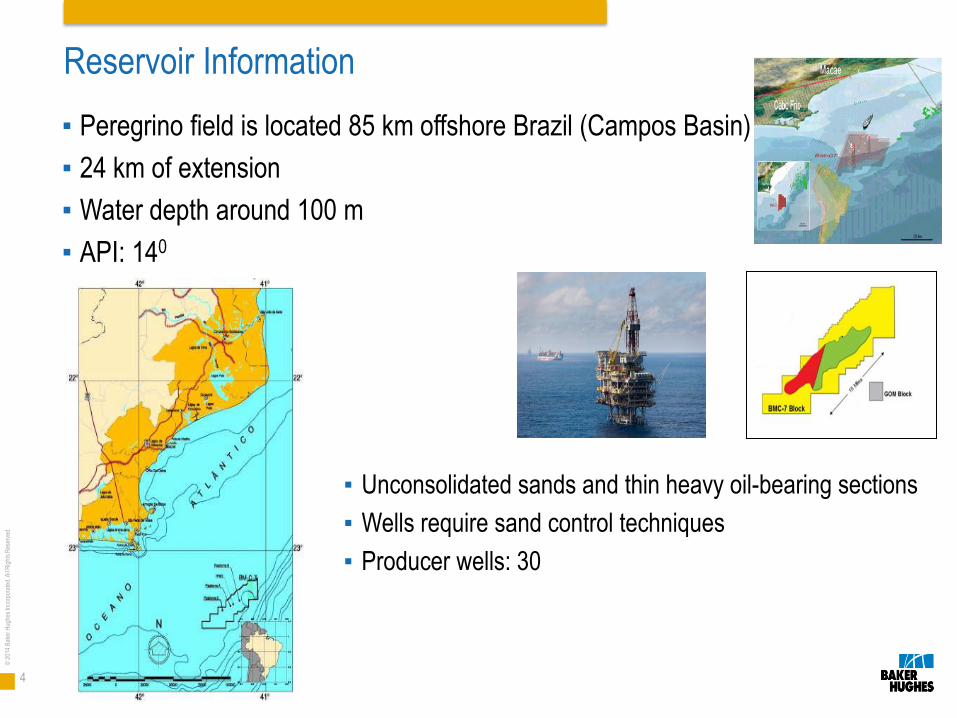
Reservoir Information
▪ Peregrino field is located 85 km offshore Brazil (Campos Basin)
▪ 24 km of extension
▪ Water depth around 100 m
▪ API: 140
▪ Unconsolidated sands and thin heavy oil-bearing sections
▪ Wells require sand control techniques
▪ Producer wells: 30
5
© 2
014
Bak
er H
ughe
s In
corp
orat
ed. A
ll R
ight
s R
eser
ved.
Reservoir Simulation Studies
▪ Evaluate the well completion effect on the reservoir behavior of horizontal well in
Peregrino field, considering:
– OHGP with Standard Screen vs. OHGP with ICD screen completion
– Water injection effect
– Determine ICD type and rating, joint quantity and optimum flow resistance rating
– Determine additional pressure drop requirements with ICD completion
– Estimate the oil and water cumulative production with and without ICD Technology
– Estimate the oil and water influx (bpd/ft) behavior

6
© 2
014
Bak
er H
ughe
s In
corp
orat
ed. A
ll R
ight
s R
eser
ved.
Reservoir Simulation Observations
▪ ICD completions add value in the long term when it is compared with standard
completion.
▪ ICD completion promote an evenly fluid influx along the horizontal section and delay
in the water breakthrough
▪ It is recommendable to install sliding sleeve (mechanical water shut off) in order to
control the water production (after 5 years); reservoir simulations (based on ICD with
6.4FRR flow resistance rating) show that water will come mainly from reservoir
areas with less flow resistance in the porous media (more permeability)
7
© 2
014
Bak
er H
ughe
s In
corp
orat
ed. A
ll R
ight
s R
eser
ved.
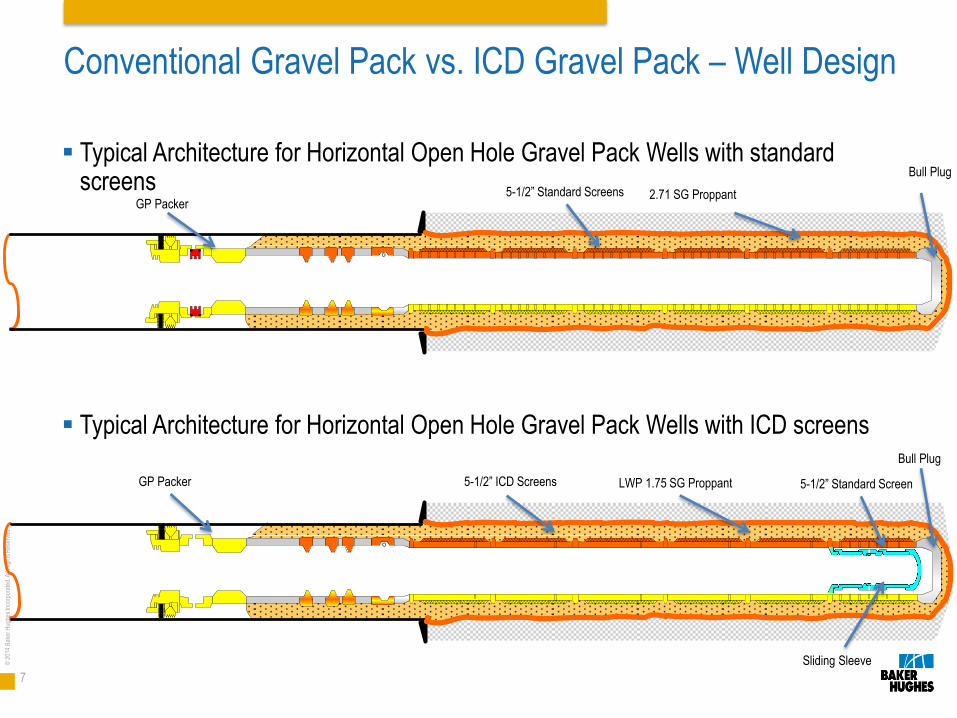
Conventional Gravel Pack vs. ICD Gravel Pack – Well Design
Typical Architecture for Horizontal Open Hole Gravel Pack Wells with standard screens
Typical Architecture for Horizontal Open Hole Gravel Pack Wells with ICD screens
GP Packer 5-1/2” Standard Screens
Bull Plug
2.71 SG Proppant
GP Packer 5-1/2” ICD Screens 5-1/2” Standard Screen
Bull Plug
LWP 1.75 SG Proppant
Sliding Sleeve
8
© 2
014
Bak
er H
ughe
s In
corp
orat
ed. A
ll R
ight
s R
eser
ved.
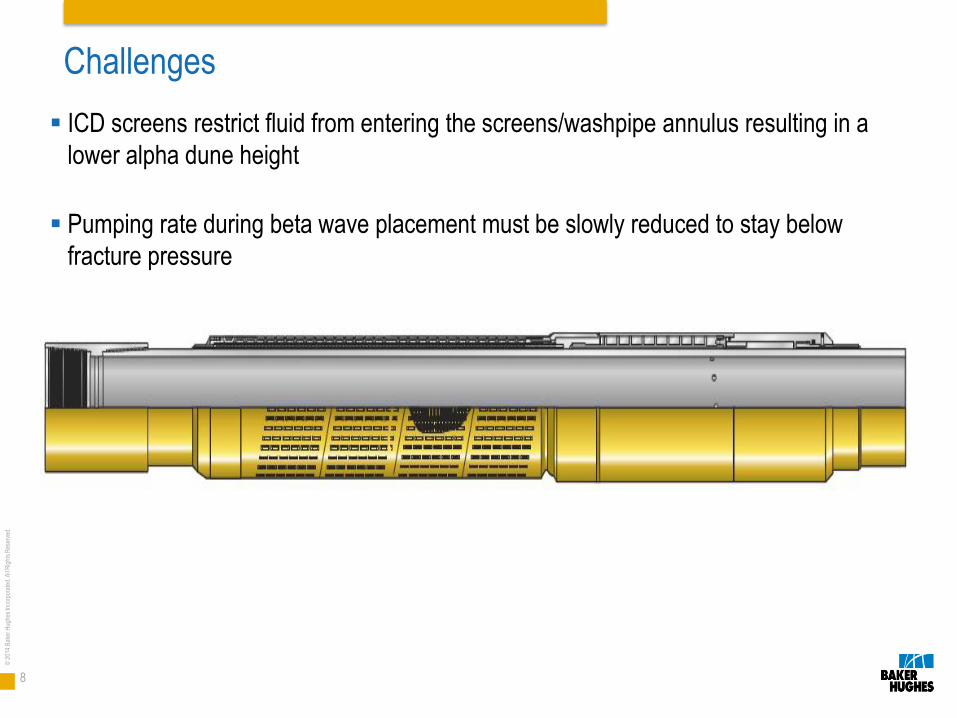
Challenges
ICD screens restrict fluid from entering the screens/washpipe annulus resulting in a
lower alpha dune height
Pumping rate during beta wave placement must be slowly reduced to stay below
fracture pressure
9
© 2
014
Bak
er H
ughe
s In
corp
orat
ed. A
ll R
ight
s R
eser
ved.
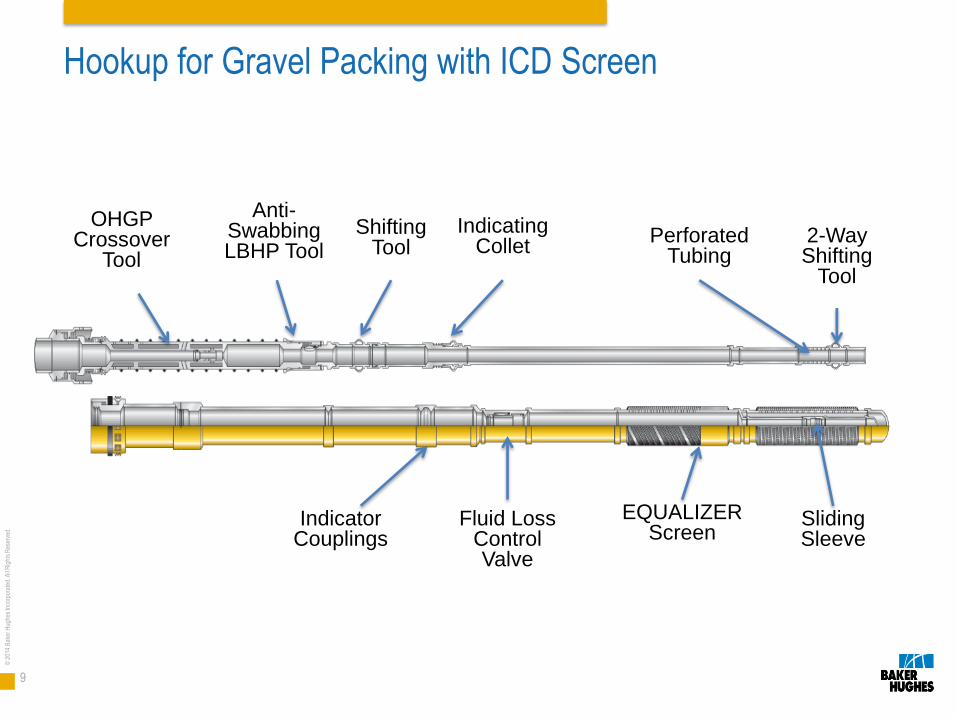
Hookup for Gravel Packing with ICD Screen
OHGP Crossover
Tool
Anti-Swabbing LBHP Tool
Shifting Tool
Indicating Collet
Indicator Couplings
Fluid Loss Control Valve
EQUALIZER Screen
Sliding Sleeve
2-Way Shifting
Tool
Perforated Tubing
10
© 2
014
Bak
er H
ughe
s In
corp
orat
ed. A
ll R
ight
s R
eser
ved.
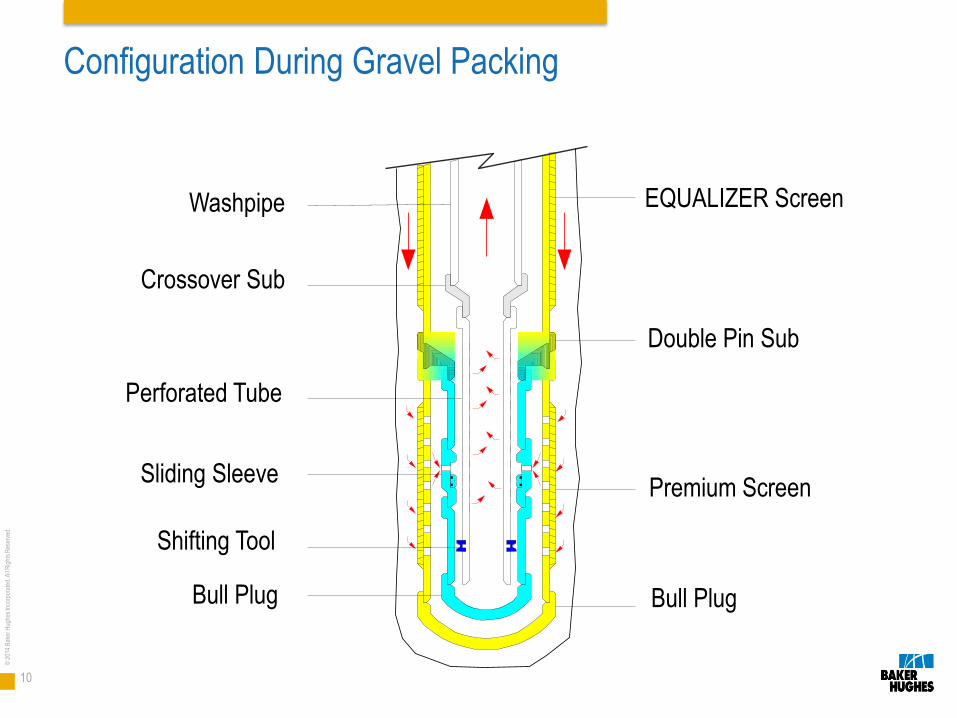
Configuration During Gravel Packing
EQUALIZER Screen
Double Pin Sub
Premium Screen
Bull Plug
Washpipe
Crossover Sub
Sliding Sleeve
Bull Plug
Perforated Tube
Shifting Tool
11
© 2
014
Bak
er H
ughe
s In
corp
orat
ed. A
ll R
ight
s R
eser
ved.
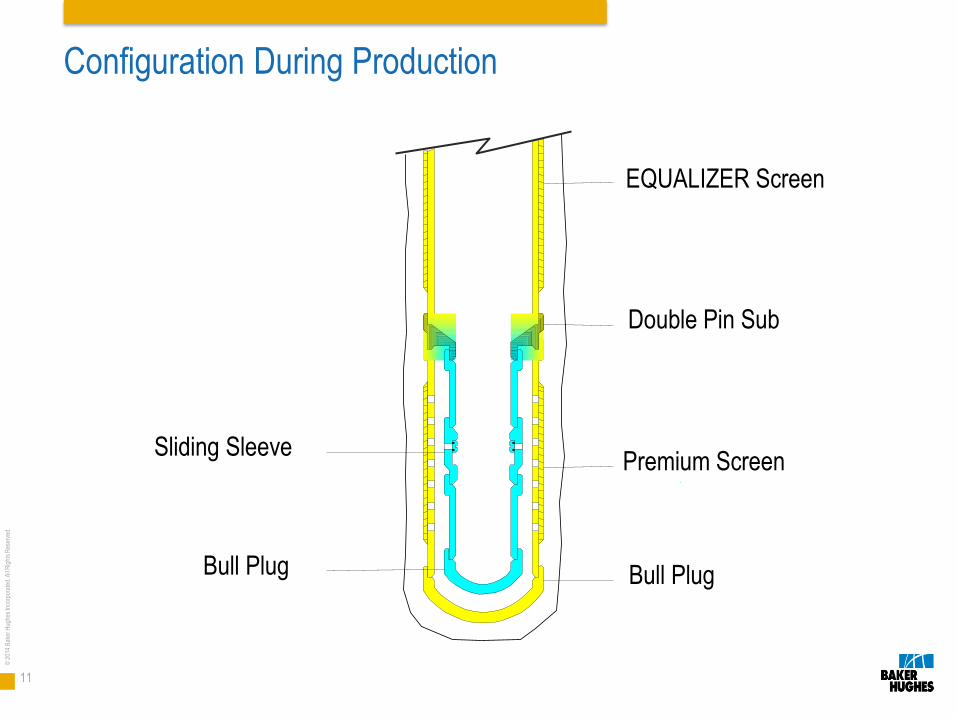
Configuration During Production
EQUALIZER Screen
Double Pin Sub
Premium Screen
Bull Plug Bull Plug
Sliding Sleeve
12
© 2
014
Bak
er H
ughe
s In
corp
orat
ed. A
ll R
ight
s R
eser
ved.
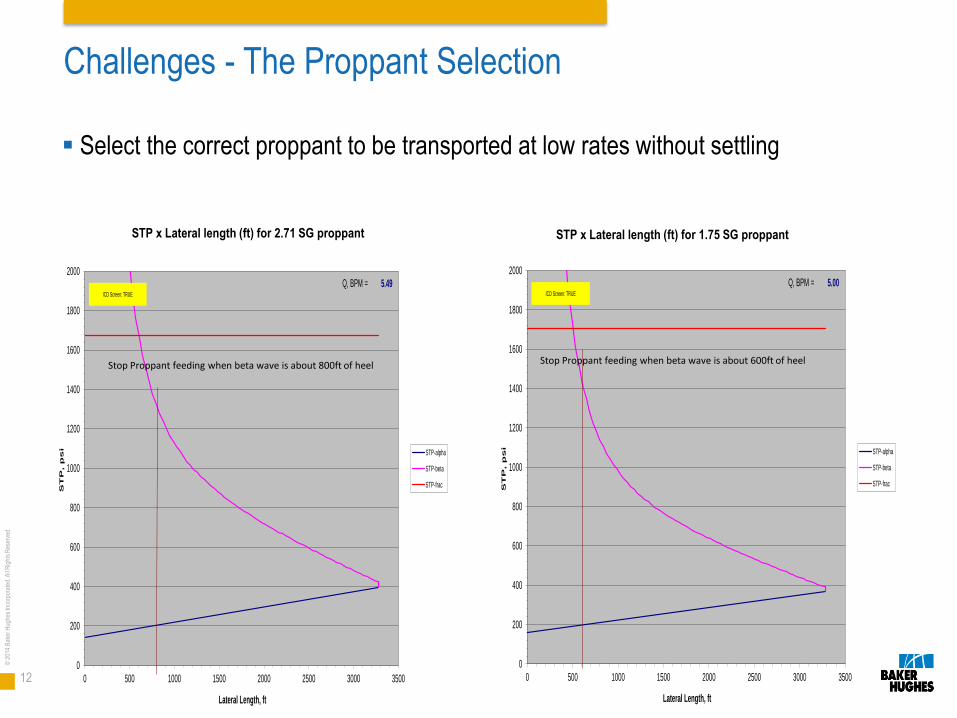
Challenges - The Proppant Selection
Select the correct proppant to be transported at low rates without settling
0
200
400
600
800
1000
1200
1400
1600
1800
2000
0 500 1000 1500 2000 2500 3000 3500
ST
P, p
si
Lateral Length, ft
STP vs. Lateral Length
STP-alpha
STP-beta
STP-frac
Statoil Brazil, Well B-24 (EQ Select 6.4 FRR, 16/20 Carbolite, 5500 psi FP)
ICD Screen: TRUE
Q, BPM = 5.49
Ver 06-12-2012
Stop Proppant feeding when beta wave is about 800ft of heel
0
200
400
600
800
1000
1200
1400
1600
1800
2000
0 500 1000 1500 2000 2500 3000 3500
ST
P, p
si
Lateral Length, ft
STP vs. Lateral Length
STP-alpha
STP-beta
STP-frac
Statoil Brazil, Well B-24 (EQ Select 6.4 FRR, 20/40 LiteProp175, 5500 psi FP)
ICD Screen: TRUE
Q, BPM = 5.00
Ver 06-12-2012
Stop Proppant feeding when beta wave is about 600ft of heel
STP x Lateral length (ft) for 2.71 SG proppant
STP x Lateral length (ft) for 1.75 SG proppant
13
© 2
014
Bak
er H
ughe
s In
corp
orat
ed. A
ll R
ight
s R
eser
ved.
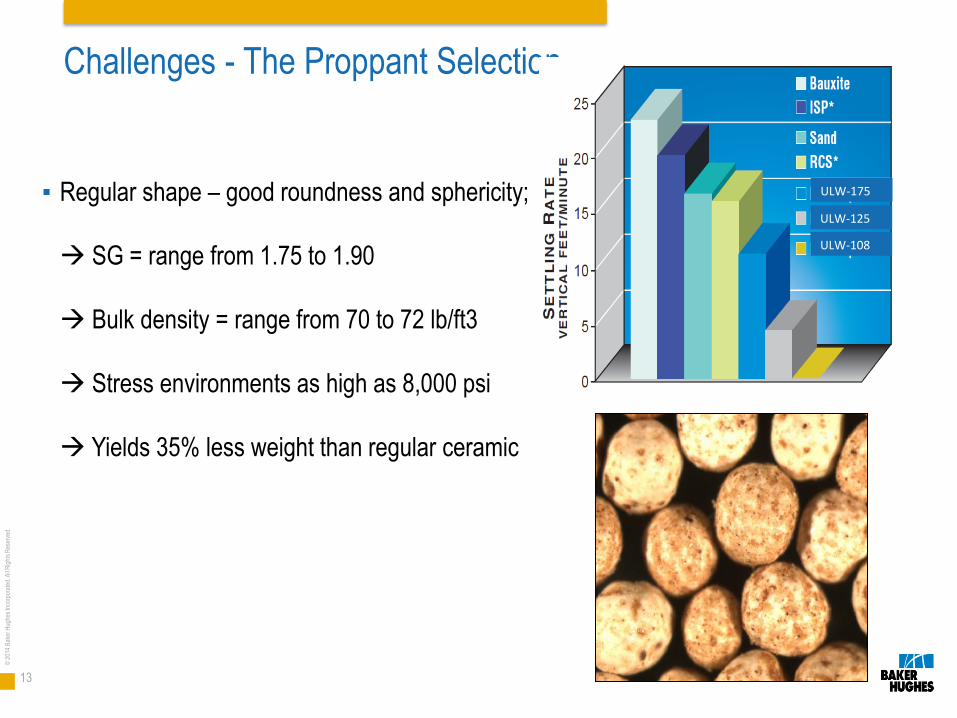
Challenges - The Proppant Selection
▪ Regular shape – good roundness and sphericity;
SG = range from 1.75 to 1.90
Bulk density = range from 70 to 72 lb/ft3
Stress environments as high as 8,000 psi
Yields 35% less weight than regular ceramic
ULW-175
ULW-125
ULW-108
14
© 2
014
Bak
er H
ughe
s In
corp
orat
ed. A
ll R
ight
s R
eser
ved.
Challenges – The Simulation
0.50
0.55
0.60
0.65
0.70
0.75
0.80
0.85
0.90
0.95
0
500
1000
1500
2000
2500
3000
3500
4000
4500
0.0 2.0 4.0 6.0 8.0 10.0 12.0
Du
ne
Heig
ht/
Ho
le D
iam
ete
r R
ati
o
Pu
mp
Pre
ss
ure,
ps
i
Pump Rate, BPM
Horizontal Gravel Packing Design Criteria
Ppump-alpha at bottom Ppump-beta at TOS Ppump-Frac Dune/Hole Ratio
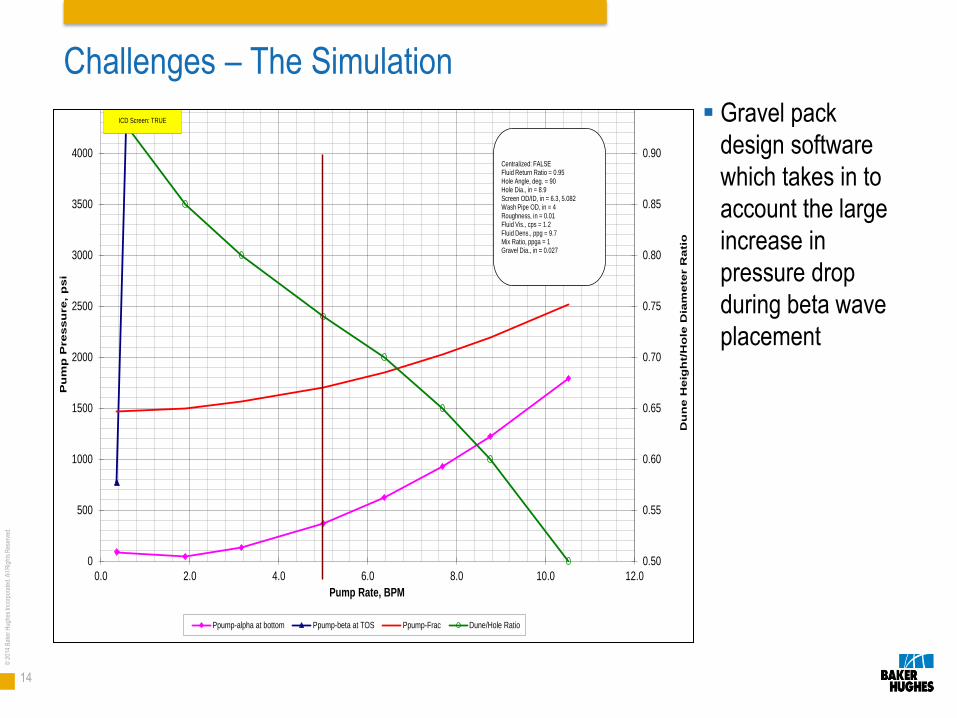
Centralized: FALSEFluid Return Ratio = 0.95Hole Angle, deg. = 90Hole Dia., in = 8.9Screen OD/ID, in = 6.3, 5.082Wash Pipe OD, in = 4Roughness, in = 0.01Fluid Vis., cps = 1.2Fluid Dens., ppg = 9.7Mix Ratio, ppga = 1Gravel Dia., in = 0.027
Ver 06-12-2012
ICD Screen: TRUE
Statoil Brazil, Well B-24 (EQ Select 6.4 FRR, 20/40 LiteProp175, 5500 psi FP)
Gravel pack
design software
which takes in to
account the large
increase in
pressure drop
during beta wave
placement
15
© 2
014
Bak
er H
ughe
s In
corp
orat
ed. A
ll R
ight
s R
eser
ved.
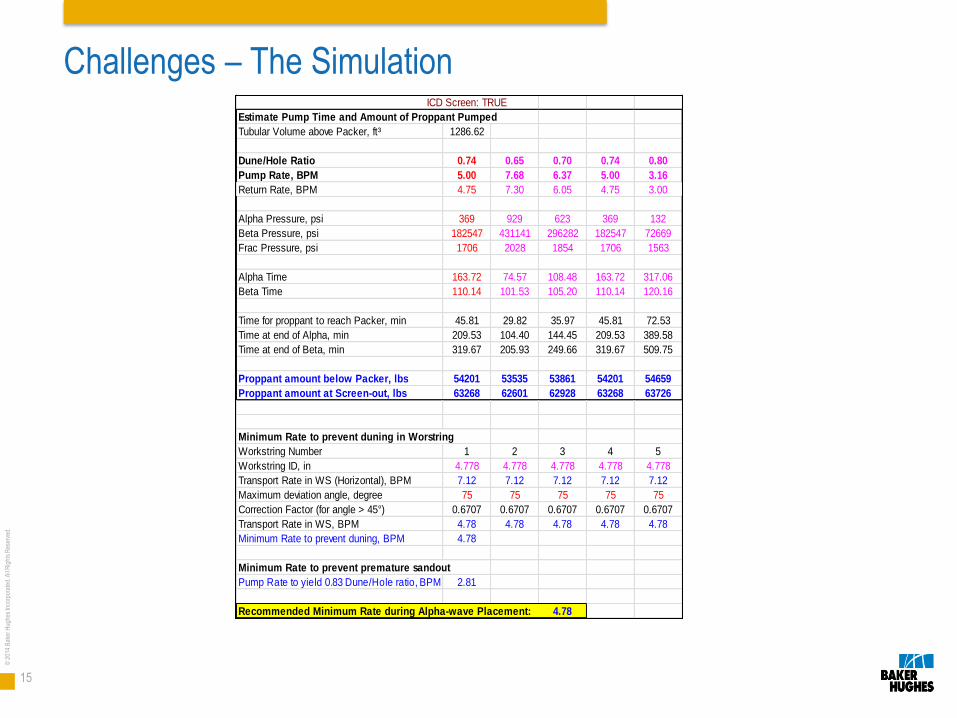
Challenges – The Simulation Open Hole Horizontal Gravel Packing
Statoil Brazil, Well B-24 (EQ Select 6.4 FRR, 20/40 LiteProp175, 5500 psi FP)
ICD Screen: TRUE
Estimate Pump Time and Amount of Proppant Pumped
Tubular Volume above Packer, ft³ 1286.62
Dune/Hole Ratio 0.74 0.65 0.70 0.74 0.80
Pump Rate, BPM 5.00 7.68 6.37 5.00 3.16
Return Rate, BPM 4.75 7.30 6.05 4.75 3.00
Alpha Pressure, psi 369 929 623 369 132
Beta Pressure, psi 182547 431141 296282 182547 72669
Frac Pressure, psi 1706 2028 1854 1706 1563
Alpha Time 163.72 74.57 108.48 163.72 317.06
Beta Time 110.14 101.53 105.20 110.14 120.16
Time for proppant to reach Packer, min 45.81 29.82 35.97 45.81 72.53
Time at end of Alpha, min 209.53 104.40 144.45 209.53 389.58
Time at end of Beta, min 319.67 205.93 249.66 319.67 509.75
Proppant amount below Packer, lbs 54201 53535 53861 54201 54659
Proppant amount at Screen-out, lbs 63268 62601 62928 63268 63726
Minimum Rate to prevent duning in Worstring
Workstring Number 1 2 3 4 5
Workstring ID, in 4.778 4.778 4.778 4.778 4.778
Transport Rate in WS (Horizontal), BPM 7.12 7.12 7.12 7.12 7.12
Maximum deviation angle, degree 75 75 75 75 75
Correction Factor (for angle > 45°) 0.6707 0.6707 0.6707 0.6707 0.6707
Transport Rate in WS, BPM 4.78 4.78 4.78 4.78 4.78
Minimum Rate to prevent duning, BPM 4.78
Minimum Rate to prevent premature sandout
Pump Rate to yield 0.83 Dune/Hole ratio, BPM 2.81
Recommended Minimum Rate during Alpha-wave Placement: 4.78
16
© 2
014
Bak
er H
ughe
s In
corp
orat
ed. A
ll R
ight
s R
eser
ved.
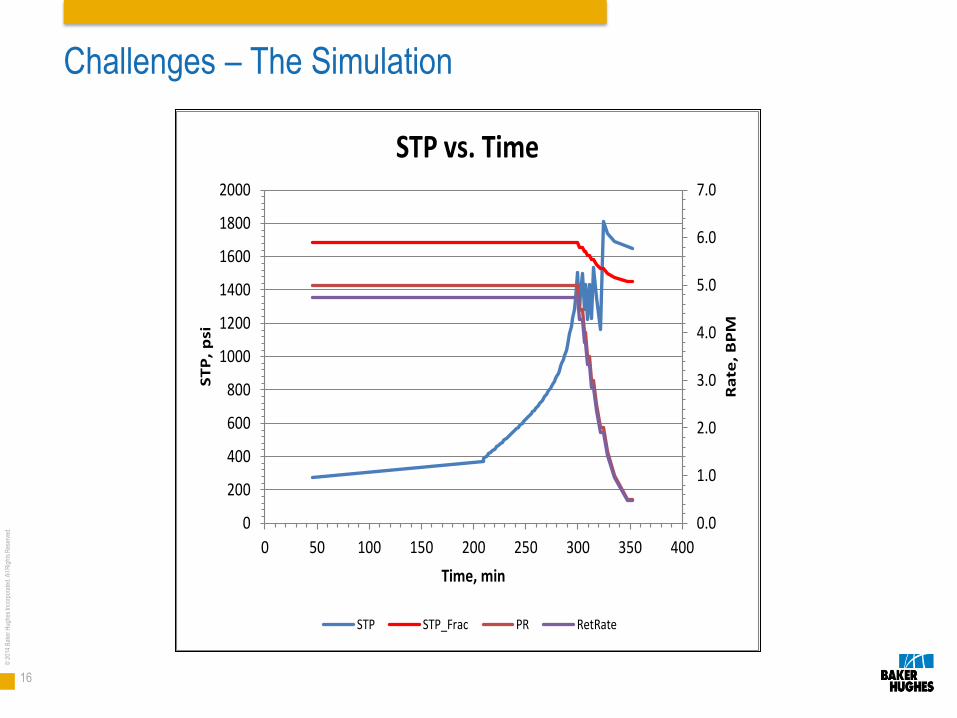
Challenges – The Simulation
0.0
1.0
2.0
3.0
4.0
5.0
6.0
7.0
0
200
400
600
800
1000
1200
1400
1600
1800
2000
0 50 100 150 200 250 300 350 400
Ra
te,
BP
M
ST
P,
psi
Time, min
STP vs. Time
STP STP_Frac PR RetRate
17
© 2
014
Bak
er H
ughe
s In
corp
orat
ed. A
ll R
ight
s R
eser
ved.
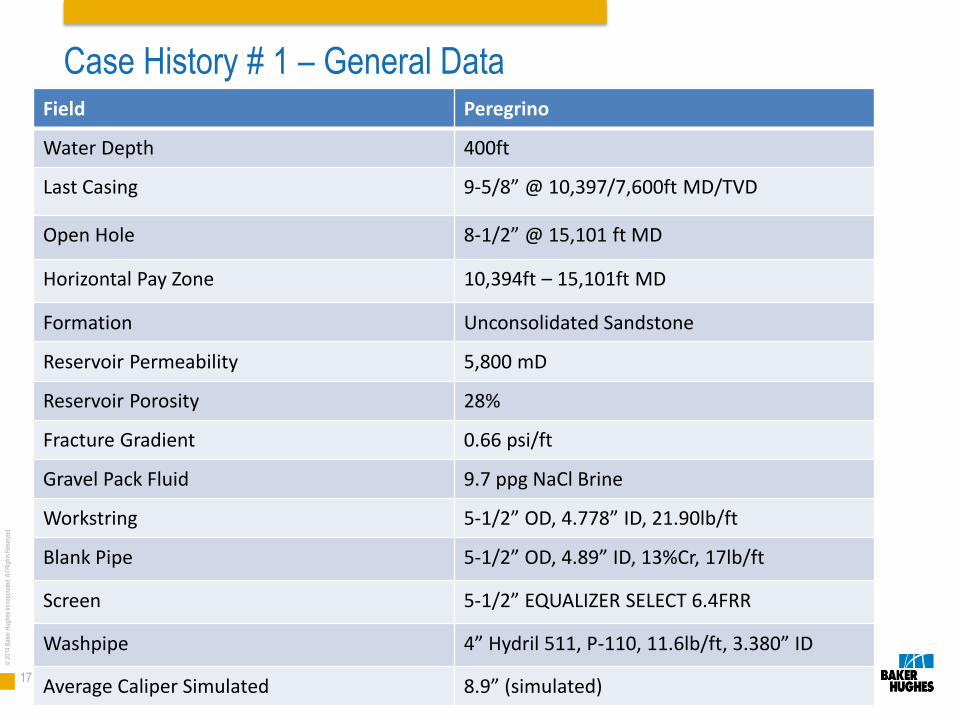
Case History # 1 – General Data Field Peregrino
Water Depth 400ft
Last Casing 9-5/8” @ 10,397/7,600ft MD/TVD
Open Hole 8-1/2” @ 15,101 ft MD
Horizontal Pay Zone 10,394ft – 15,101ft MD
Formation Unconsolidated Sandstone
Reservoir Permeability 5,800 mD
Reservoir Porosity 28%
Fracture Gradient 0.66 psi/ft
Gravel Pack Fluid 9.7 ppg NaCl Brine
Workstring 5-1/2” OD, 4.778” ID, 21.90lb/ft
Blank Pipe 5-1/2” OD, 4.89” ID, 13%Cr, 17lb/ft
Screen 5-1/2” EQUALIZER SELECT 6.4FRR
Washpipe 4” Hydril 511, P-110, 11.6lb/ft, 3.380” ID
Average Caliper Simulated 8.9” (simulated)
18
© 2
014
Bak
er H
ughe
s In
corp
orat
ed. A
ll R
ight
s R
eser
ved.
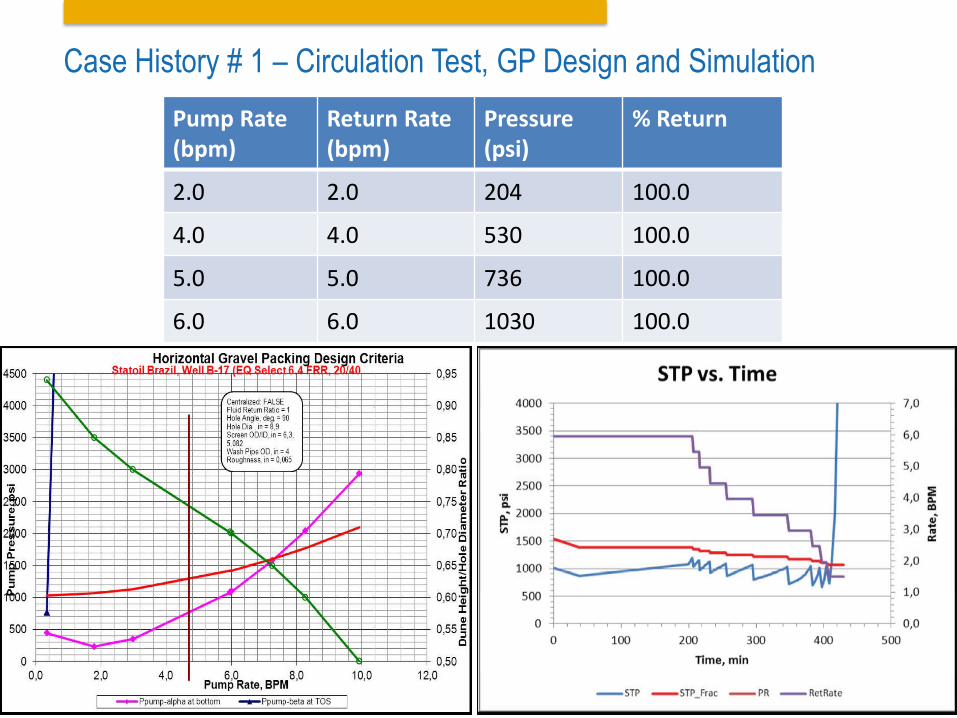
Case History # 1 – Circulation Test, GP Design and Simulation
Pump Rate (bpm)
Return Rate (bpm)
Pressure (psi)
% Return
2.0 2.0 204 100.0
4.0 4.0 530 100.0
5.0 5.0 736 100.0
6.0 6.0 1030 100.0

19
© 2
014
Bak
er H
ughe
s In
corp
orat
ed. A
ll R
ight
s R
eser
ved.
Case History # 1 – Gravel Pack Pumping Job Parameters
20
© 2
014
Bak
er H
ughe
s In
corp
orat
ed. A
ll R
ight
s R
eser
ved.
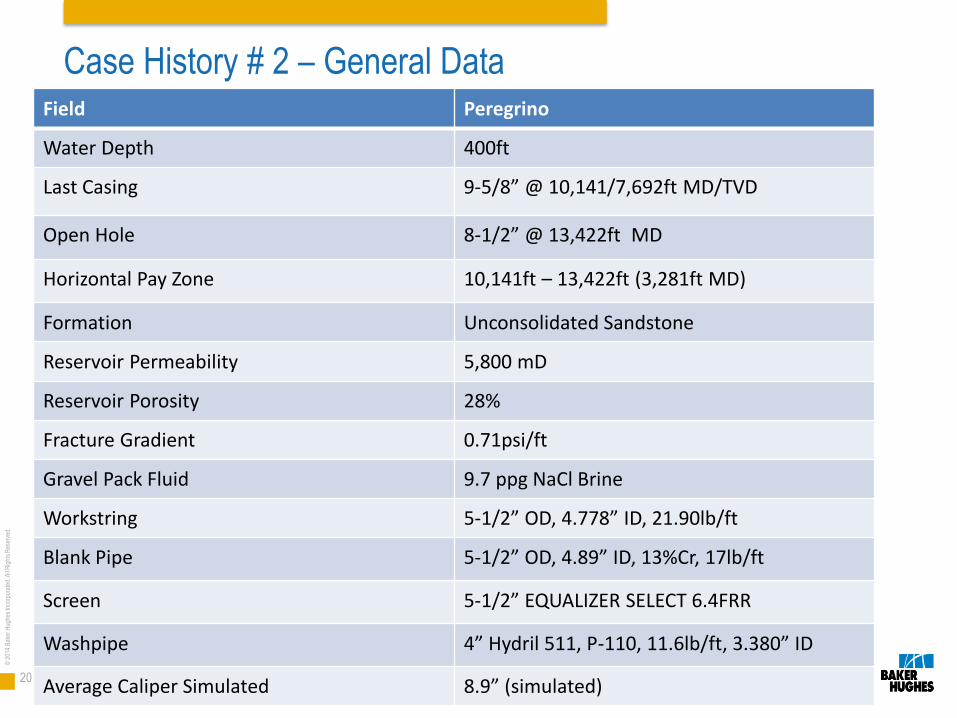
Case History # 2 – General Data Field Peregrino
Water Depth 400ft
Last Casing 9-5/8” @ 10,141/7,692ft MD/TVD
Open Hole 8-1/2” @ 13,422ft MD
Horizontal Pay Zone 10,141ft – 13,422ft (3,281ft MD)
Formation Unconsolidated Sandstone
Reservoir Permeability 5,800 mD
Reservoir Porosity 28%
Fracture Gradient 0.71psi/ft
Gravel Pack Fluid 9.7 ppg NaCl Brine
Workstring 5-1/2” OD, 4.778” ID, 21.90lb/ft
Blank Pipe 5-1/2” OD, 4.89” ID, 13%Cr, 17lb/ft
Screen 5-1/2” EQUALIZER SELECT 6.4FRR
Washpipe 4” Hydril 511, P-110, 11.6lb/ft, 3.380” ID
Average Caliper Simulated 8.9” (simulated)
21
© 2
014
Bak
er H
ughe
s In
corp
orat
ed. A
ll R
ight
s R
eser
ved.
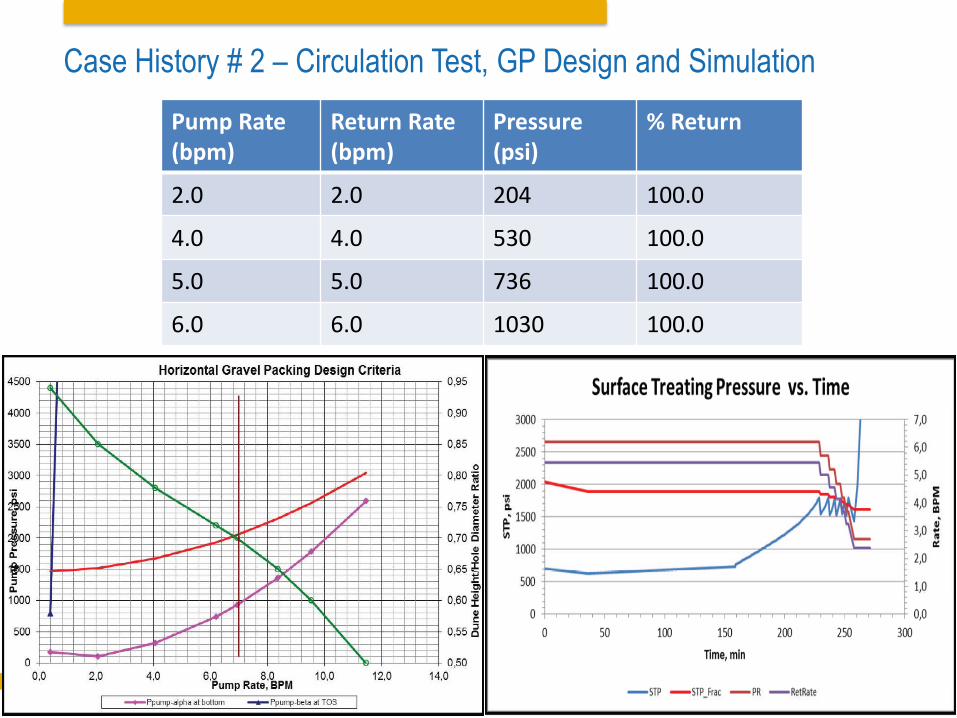
Case History # 2 – Circulation Test, GP Design and Simulation
Pump Rate (bpm)
Return Rate (bpm)
Pressure (psi)
% Return
2.0 2.0 204 100.0
4.0 4.0 530 100.0
5.0 5.0 736 100.0
6.0 6.0 1030 100.0
22
© 2
014
Bak
er H
ughe
s In
corp
orat
ed. A
ll R
ight
s R
eser
ved.
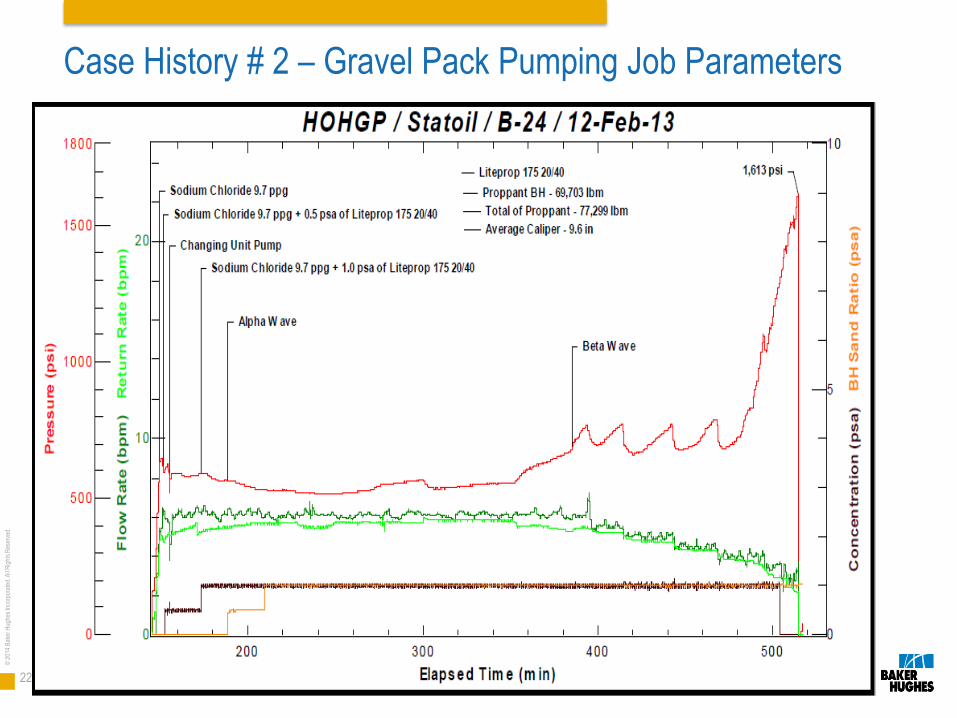
Case History # 2 – Gravel Pack Pumping Job Parameters
23
© 2
014
Bak
er H
ughe
s In
corp
orat
ed. A
ll R
ight
s R
eser
ved.
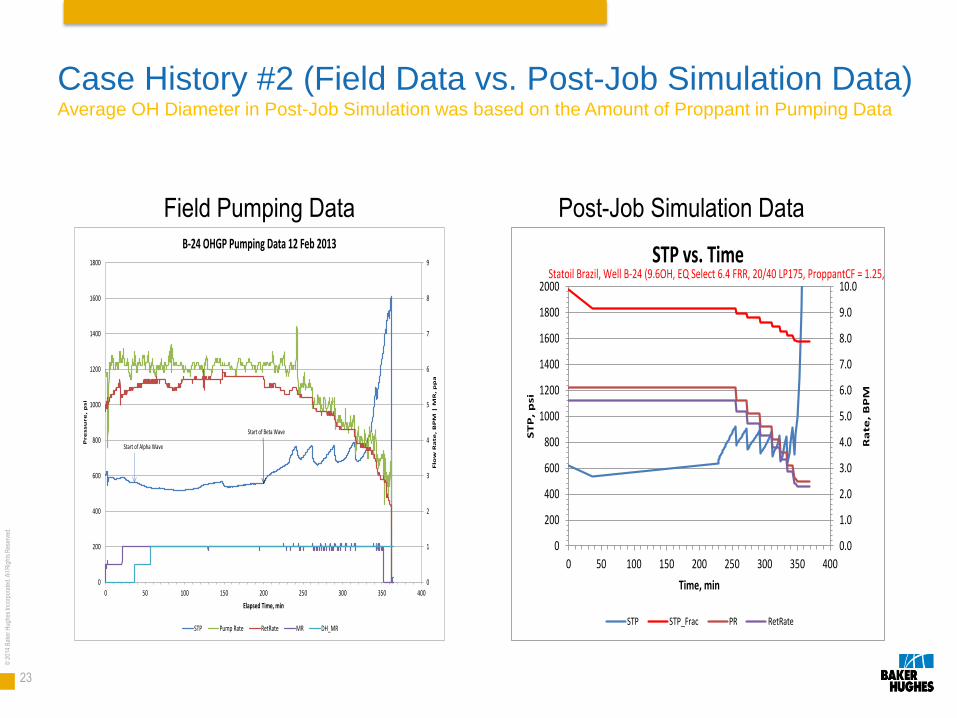
Case History #2 (Field Data vs. Post-Job Simulation Data) Average OH Diameter in Post-Job Simulation was based on the Amount of Proppant in Pumping Data
Field Pumping Data Post-Job Simulation Data
0
1
2
3
4
5
6
7
8
9
0
200
400
600
800
1000
1200
1400
1600
1800
0 50 100 150 200 250 300 350 400
Flo
w R
ate
, B
PM
| M
R,
pp
a
Pre
ssu
re
, p
si
Elapsed Time, min
B-24 OHGP Pumping Data 12 Feb 2013
STP Pump Rate RetRate MR DH_MR
Start of Beta Wave
Start of Alpha Wave
0.0
1.0
2.0
3.0
4.0
5.0
6.0
7.0
8.0
9.0
10.0
0
200
400
600
800
1000
1200
1400
1600
1800
2000
0 50 100 150 200 250 300 350 400
Ra
te,
BP
M
ST
P,
psi
Time, min
STP vs. Time
STP STP_Frac PR RetRate
Statoil Brazil, Well B-24 (9.6OH, EQ Select 6.4 FRR, 20/40 LP175, ProppantCF = 1.25, FG=0.715)
24
© 2
014
Bak
er H
ughe
s In
corp
orat
ed. A
ll R
ight
s R
eser
ved.
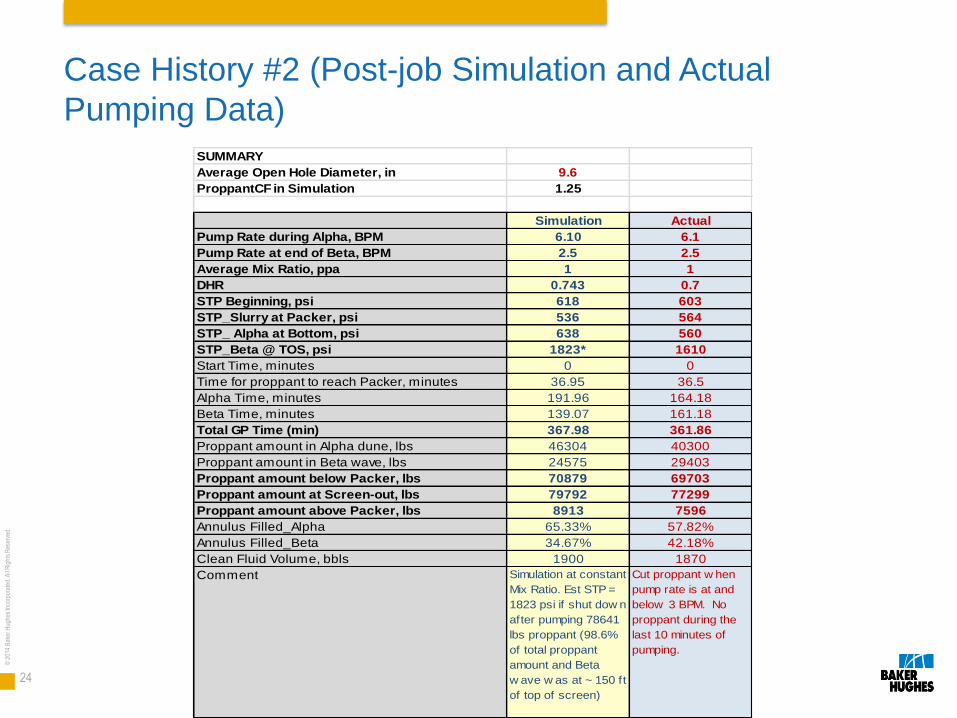
Case History #2 (Post-job Simulation and Actual
Pumping Data)
SUMMARY
Average Open Hole Diameter, in 9.6
ProppantCF in Simulation 1.25
Simulation Actual
Pump Rate during Alpha, BPM 6.10 6.1
Pump Rate at end of Beta, BPM 2.5 2.5
Average Mix Ratio, ppa 1 1
DHR 0.743 0.7
STP Beginning, psi 618 603
STP_Slurry at Packer, psi 536 564
STP_ Alpha at Bottom, psi 638 560
STP_Beta @ TOS, psi 1823* 1610
Start Time, minutes 0 0
Time for proppant to reach Packer, minutes 36.95 36.5
Alpha Time, minutes 191.96 164.18
Beta Time, minutes 139.07 161.18
Total GP Time (min) 367.98 361.86
Proppant amount in Alpha dune, lbs 46304 40300
Proppant amount in Beta wave, lbs 24575 29403
Proppant amount below Packer, lbs 70879 69703
Proppant amount at Screen-out, lbs 79792 77299
Proppant amount above Packer, lbs 8913 7596
Annulus Filled_Alpha 65.33% 57.82%
Annulus Filled_Beta 34.67% 42.18%
Clean Fluid Volume, bbls 1900 1870
Comment Simulation at constant
Mix Ratio. Est STP =
1823 psi if shut dow n
after pumping 78641
lbs proppant (98.6%
of total proppant
amount and Beta
w ave w as at ~ 150 ft
of top of screen)
Cut proppant w hen
pump rate is at and
below 3 BPM. No
proppant during the
last 10 minutes of
pumping.
25
© 2
014
Bak
er H
ughe
s In
corp
orat
ed. A
ll R
ight
s R
eser
ved.
Conclusion
▪ Peregrino Field – unconsolidated sandstone reservoir demanding sand
control techniques
▪ Two GP jobs successful performed using ICD completion – pioneer
introduction of this technology in offshore Brazil
Typical completion architecture include ICD screens and a single joint of
standard premium screen at the toe enabling fluid return
▪ Special strategy to address the challenges: special software to job design,
Lightweight proppant and experience of GOM operations

26
© 2
014
Bak
er H
ughe
s In
corp
orat
ed. A
ll R
ight
s R
eser
ved.
Thank you Very Much!
Questions?
Don’t forget Techno Day 3rd April, AECC, Aberdeen