Embed Size (px)
Citation preview

Introduction to MRI
Welcome to the exciting world of MRI! This is a tutorial that will cover the basic aspects of MRI.
Copyright © 1994-1998 Ray Ballinger, All Rights Reserved. Send questions and comments to Ray Ballinger at mridoc@ ufl.eduURL: http://ballingerr.xray.ufl.edu/mritutor/index.html
PDF Version Conversion done by Markus Busoldof "The International NMR Resource site"URL: http://www.nmr.de
Last Modified: September 22, 1998
Basics of MRI Instrumentation Image Characteristics Artifacts Pulse sequences Safety Contrast Agents MR Angiography MR Spectroscopy Special Topics Glossary References
Basics of MRI
The following topics will be discussed:
Magnetism Resonance and RF Relaxation References
Magnetism
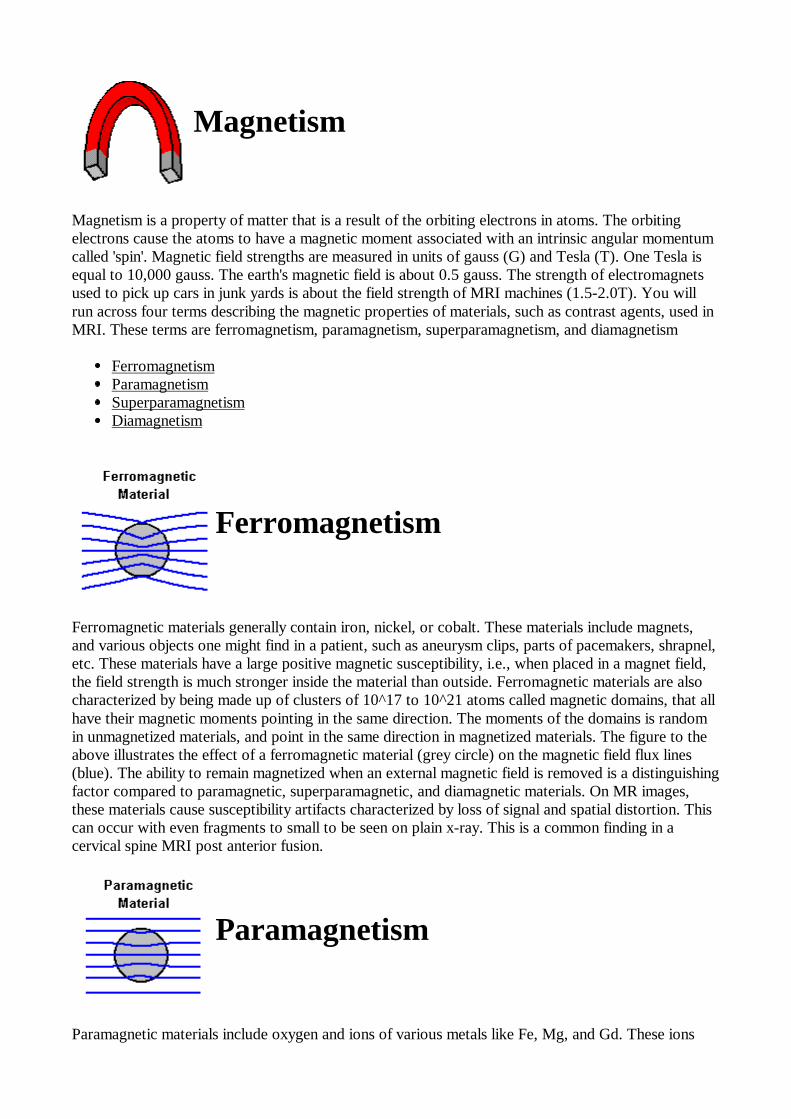
Magnetism is a property of matter that is a result of the orbiting electrons in atoms. The orbitingelectrons cause the atoms to have a magnetic moment associated with an intrinsic angular momentumcalled 'spin'. Magnetic field strengths are measured in units of gauss (G) and Tesla (T). One Tesla isequal to 10,000 gauss. The earth's magnetic field is about 0.5 gauss. The strength of electromagnetsused to pick up cars in junk yards is about the field strength of MRI machines (1.5-2.0T). You willrun across four terms describing the magnetic properties of materials, such as contrast agents, used inMRI. These terms are ferromagnetism, paramagnetism, superparamagnetism, and diamagnetism
Ferromagnetism Paramagnetism Superparamagnetism Diamagnetism
Ferromagnetism
Ferromagnetic materials generally contain iron, nickel, or cobalt. These materials include magnets,and various objects one might find in a patient, such as aneurysm clips, parts of pacemakers, shrapnel,etc. These materials have a large positive magnetic susceptibility, i.e., when placed in a magnet field,the field strength is much stronger inside the material than outside. Ferromagnetic materials are alsocharacterized by being made up of clusters of 10^17 to 10^21 atoms called magnetic domains, that allhave their magnetic moments pointing in the same direction. The moments of the domains is randomin unmagnetized materials, and point in the same direction in magnetized materials. The figure to theabove illustrates the effect of a ferromagnetic material (grey circle) on the magnetic field flux lines(blue). The ability to remain magnetized when an external magnetic field is removed is a distinguishingfactor compared to paramagnetic, superparamagnetic, and diamagnetic materials. On MR images,these materials cause susceptibility artifacts characterized by loss of signal and spatial distortion. Thiscan occur with even fragments to small to be seen on plain x-ray. This is a common finding in acervical spine MRI post anterior fusion.
Paramagnetism
Paramagnetic materials include oxygen and ions of various metals like Fe, Mg, and Gd. These ions

have unpaired electrons, resulting in a positive magnetic susceptibility. The magnitude of thissusceptibility is less than one one-thousands of that of ferromagnetic materials. The effect on MRI isincrease in the T1 and T2 relaxation rates (decrease in the T1 and T2 times). The figure aboveillustrates the effect of a paramagnetic material (grey circle) on the magnetic field flux lines (blue). Gdis used as a in MR contrast agents. At the proper concentration, Gd contrast agents cause preferentialT1 relaxation enhancement, causing increase in signal on T1-weighted images. At high concentrations,as is sometimes seen in the urinary bladder, loss of signal is seen instead, a result of the T2 relaxationeffects dominating.
Superparamagnetism
Superparamagnetic materials consist of individual domains of elements that have ferromagneticproperties in bulk. Their magnetic susceptibility is between that of ferromagnetic and paramagneticmaterials. The figure to the left illustrates the effect of a superparamagnetic material (grey circle) onthe magnetic field flux lines (blue). Examples of a superparamagnetic materials include iron containingcontrast agents for bowel, liver, and lymph node imaging.
Diamagnetism
Diamagnetic materials have no intrinsic atomic magnetic moment, but when placed in a magnetic fieldweakly repel the field, resulting in a small negative magnetic susceptibility. Materials like water,copper, nitrogen, barium sulfate, and most tissues are diamagnetic.The figure above illustrates theeffect of a diamagnetic material (grey circle) on the magnetic field flux lines (blue). The weak negativemagnetic susceptibility contributes to the loss of signal seen in bowel on MRI after administration ofbarium sulfate suspensions.
Resonance and RF
Protons in a magnetic field have a microscopic magnetization and act like tiny toy tops that wobble asthey spin.The rate of the wobbling or precession is the resonance or Larmor frequency. In themagnetic field of an MRI scanner at room temperature, there is approximately the same number ofproton nuclei aligned with the main magnetic field Bo as counter aligned. The aligned position isslightly favored, as the nucleus is at a lower energy in this position. For every one-million nuclei, thereis about one extra aligned with the Bo field as opposed to the field. This results in a net ormacroscopic magnetization pointing in the direction of the main magnetic field. Exposure of individualnuclei to RF radiation (B1 field) at the Larmor frequency causes nuclei in the lower energy state to

jump into the higher energy state.
On a macroscopic level, exposure of an object or person to RF radiation at the Larmor frequency,causes the net magnetization to spiral away from the Bo field. In the rotating frame of reference, thenet magnetization vector rotate from a longitudinal position a distance proportional to the time lengthof the RF pulse. After a certain length of time, the net magnetization vector rotates 90 degrees andlies in the transverse or x-y plane. It is in this position that the net magnetization can be detected onMRI. The angle that the net magnetization vector rotates is commonly called the 'flip' or 'tip' angle. Atangles greater than or less than 90 degrees there will still be a small component of the magnetizationthat will be in the x-y plane, and therefore be detected.
Relaxation T1 Relaxation
The return of excited nuclei from the high energy state to the low energy or ground state is associatedwith loss of energy to the surrounding nuclei. Nuclear magnetic resonance was originally use toexamine solids in the form of lattices, hence the name "spin-lattice" relaxation. Macroscopically, T1relaxation is characterized by the longitudinal return of the net magnetization to its ground state ofmaximum length in the direction of the main magnetic field. The rate of return is an exponentialprocess as is shown in the following figure.
The T1 relaxation time is the time for the magnetization to return to 63% of its original length. Aftertwo T1 times, the magnetization is at 86% of its original length. Three T1 times gives 95%. Spins areconsidered completely relaxed after 3-5 T1 times. Another term that you may hear is the T1 relaxationrate. This is merely the reciprocal of the T1 time( 1/T1). T1 relaxation is fastest when the motion ofthe nucleus (rotations and translations or "tumbling rate") matches that of the Larmor frequency. As aresult, T1 relaxation is dependent on the main magnetic field strength that specifies the Larmorfrequency. Higher magnetic fields are associated with longer T1 times.
T2 Relaxation
Microscopically, T2 relaxation or spin-spin relaxation occurs when spins in the high and low energystate exchange energy but do not loose energy to the surrounding lattice. This results macroscopicallyin loss of the transverse magnetization. In pure water, The T2 and T1 times are approximately the

same, 2-3 seconds. In biological materials, the T2 time is considerably shorter than the T1 time. ForCSF, T1=1.9 seconds and T2=0.25 seconds. For brain white matter, T1=0.5 seconds and T2=0.07seconds (70 msec). T2 relaxation occurs exponentially like T1 relaxation with 63% of the transversemagnetization gone after one T2 period as shown in the graph.
T2* Relaxation
T2* relaxation is the loss of signal seen with dephasing of individual magnetizations. It ischaracterized macroscopically by loss of transverse magnetization at a rate greater than T2. It iscaused by magnetic field inhomogeneity an occurs in all magnets. The relationship between T2 andT2* can be illustrated by the multiecho spin echo sequence shown in the diagram below. The 180degree RF pulses used to generate the echo are rephasing the spins that have undergone T2* decay.The gradual decline in signal from subsequent echos reflects T2 decay (See Figure). Unlike spin echosequences, gradient echo sequences do not refocus T2* decay. Therefore, gradient echo sequencesare more susceptible to ferromagnetic foreign bodies that distort the main magnetic field homogeneity.
Instrumentation
This section will cover the following topics:
Magnets RF and Gradient Coils Electronics and Data Processing References
RF and Gradient Coils
I have grouped these two topics together, although they serve different purposes.
RF Coils
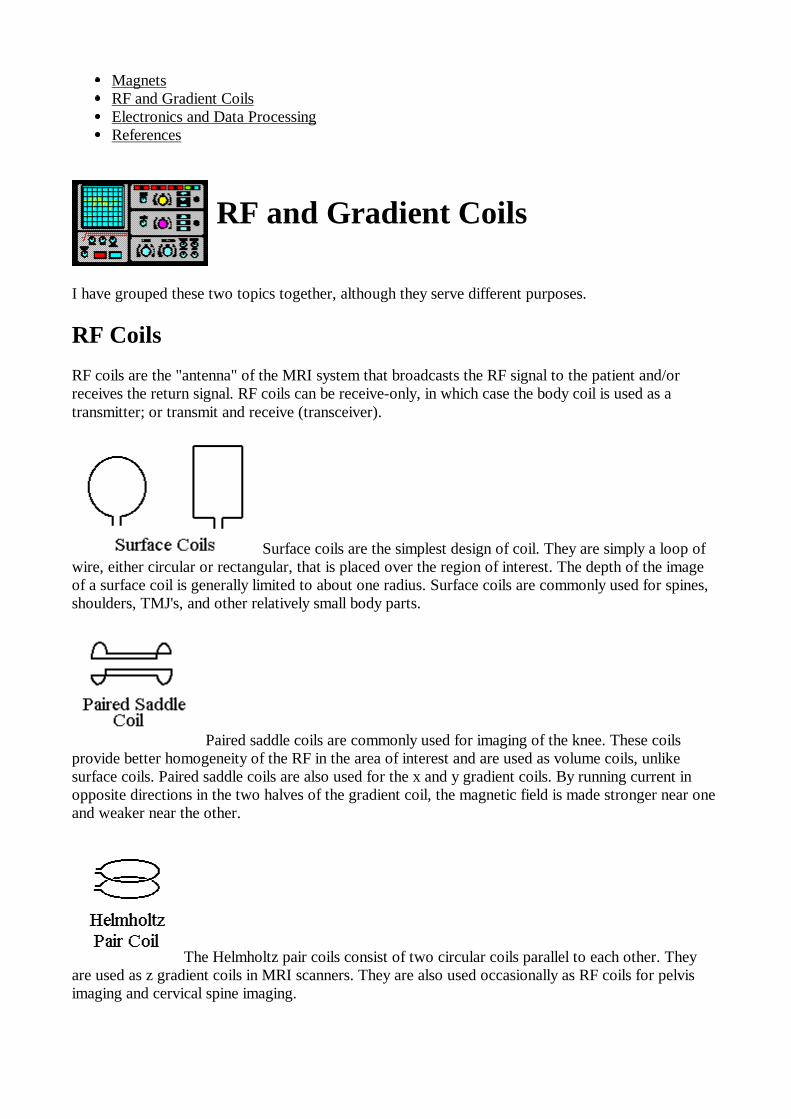
RF coils are the "antenna" of the MRI system that broadcasts the RF signal to the patient and/orreceives the return signal. RF coils can be receive-only, in which case the body coil is used as atransmitter; or transmit and receive (transceiver).
Surface coils are the simplest design of coil. They are simply a loop ofwire, either circular or rectangular, that is placed over the region of interest. The depth of the imageof a surface coil is generally limited to about one radius. Surface coils are commonly used for spines,shoulders, TMJ's, and other relatively small body parts.
Paired saddle coils are commonly used for imaging of the knee. These coilsprovide better homogeneity of the RF in the area of interest and are used as volume coils, unlikesurface coils. Paired saddle coils are also used for the x and y gradient coils. By running current inopposite directions in the two halves of the gradient coil, the magnetic field is made stronger near oneand weaker near the other.
The Helmholtz pair coils consist of two circular coils parallel to each other. Theyare used as z gradient coils in MRI scanners. They are also used occasionally as RF coils for pelvisimaging and cervical spine imaging.
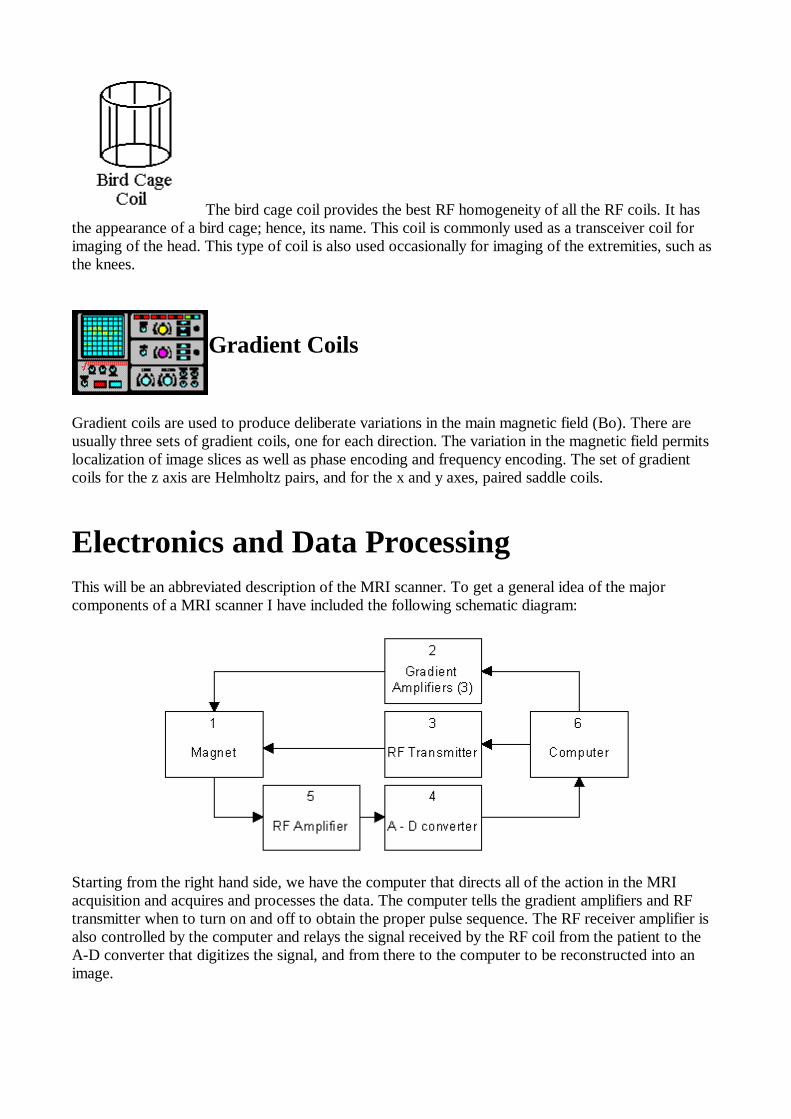
The bird cage coil provides the best RF homogeneity of all the RF coils. It hasthe appearance of a bird cage; hence, its name. This coil is commonly used as a transceiver coil forimaging of the head. This type of coil is also used occasionally for imaging of the extremities, such asthe knees.
Gradient Coils
Gradient coils are used to produce deliberate variations in the main magnetic field (Bo). There areusually three sets of gradient coils, one for each direction. The variation in the magnetic field permitslocalization of image slices as well as phase encoding and frequency encoding. The set of gradientcoils for the z axis are Helmholtz pairs, and for the x and y axes, paired saddle coils.
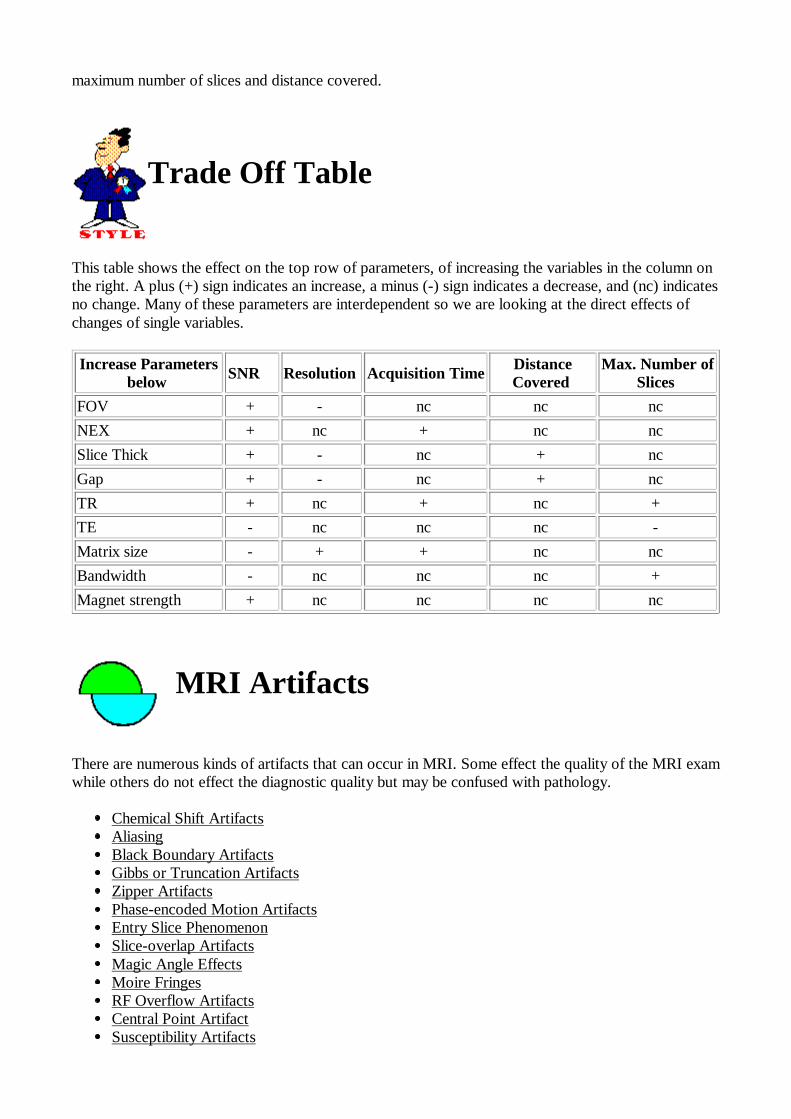
Electronics and Data Processing This will be an abbreviated description of the MRI scanner. To get a general idea of the majorcomponents of a MRI scanner I have included the following schematic diagram:
Starting from the right hand side, we have the computer that directs all of the action in the MRIacquisition and acquires and processes the data. The computer tells the gradient amplifiers and RFtransmitter when to turn on and off to obtain the proper pulse sequence. The RF receiver amplifier isalso controlled by the computer and relays the signal received by the RF coil from the patient to theA-D converter that digitizes the signal, and from there to the computer to be reconstructed into animage.

Image Characteristics
Unlike CT where the image appearance is related primarily to the electron density of the material, MRimages depend on many variables including proton density, T1 and T2 relaxation effects, flow effects,diffusion effects, and susceptibility effects. Image quality is generally described in terms of SNR,spacial resolution and contrast. There is interdependence of of the SNR, resolution, and time ofacquisition.
SNR Resolution Time Relaxation Effects Trade Offs References
SNR
The SNR (signal-to-noise ratio) is a term heard commonly in MRI circles. The SNR determines howgrainy the image appears, the more grainy, the less the SNR. The SNR is measured frequently bycalculating the difference in signal intensity between the area of interest and the background (usuallychosen from the air surrounding the object). In air, any signal present should be noise. The differencebetween the signal and the background noise is divided by the standard deviation of the signal fromthe background-- an indication of the variability of the background noise. SNR is proportional to thevolume of the voxel and to the square root of the number or averages and phase steps (assumingconstant sized voxels). Since averaging and increasing the phase steps takes time, SNR is relatedclosely to the acquisition time. Decreasing the FOV, increasing the phase or frequency steps (withconstant FOV), and decreasing the slice thickness will decrease the SNR. Likewise, increasing theFOV, decreasing the matrix size, and increasing the slice thickness with improve the SNR.You might ask now why I said in the first line above that increasing the phase steps would increasethe SNR and in the next breath, that increasing the phase steps would decrease the SNR. In theformer case, the voxel size remains constant therefore the FOV would have to have increased. In thelatter case, the FOV is kept constant so the voxel size would have to decrease. The increase in phasesteps will improve the SNR by the square root of the number of phase steps, but the decrease involume reduces the SNR more quickly.

Resolution
Spatial resolution determines how "sharp" the image looks. Low resolution will give either fuzzyedges, or a pixelly appearance to the image. Spatial resolution is defined by the size of the imagingvoxels. Since voxels are three dimensional rectangular solids, the resolution is frequently different inthe three different directions. The size of the voxel and therefore the resolution depends on matrixsize, the field-of-view (FOV), and the slice thickness. The matrix size is the number of frequencyencoding steps, in one direction; and the number of phase encoding steps, in the other direction of theimage plane. Assuming everything else is constant, increasing the number of frequency encodings orthe number of phase steps results in improved resolution. The frequency encoding depends of howrapidly the FID signal is sampled by the scanner. Increasing the sampling rate results in no timepenalty. Increasing the number of phase steps increases the time of the acquisition proportionately.This is why you may see images that have fewer phase encodings than frequency encodings, e.g.,128x256 or 192x256.The FOV is the total area that the matrix of phase and frequency encoding cover. Dividing the FOVby the matrix size gives you the voxel size; hence, increasing the FOV in either direction increases thesize of the voxels and decreases the resolution. Decreasing the FOV improves the resolution.The depth of the voxel is determined by the slice thickness. This is almost always the largestdimension of the voxel. Therefore, the resolution perpendicular to the image plane is the poorest.
Time
The time of acquisition for a conventional spin echo or gradient echo sequence is the product of therepetition time, phase encoding steps, and number of averages (TR x phase steps x NEX). Forexample, with a one second TR, 128 phase steps, and two averages we would get an acquisition timeof about 1 x 128 x 2= 256 seconds or 4 minutes and 16 seconds. The actual time will be slightlylonger. Fast spin echo and fast gradient echo sequences perform more than one phase encoding stepper repetition time, resulting in reduce acquisition time. This is discussed further elsewhere.
Relaxation Effects
T1 and T2 relaxation rates effect the SNR in an image. Improvement in the SNR is seen when the TRis increased up to about 3-5 T1 times. Changing the TR time will also effect the T1 weighting of theimage and the acquisition time. T1 weighting occurs in a short TR spin echo sequence because ofincomplete recovery of longitudinal magnetization. The effect of TR on SNR can be showngraphically by a T1 relaxation curve as illustrated in the exponential growth curve below:

As the TR is increased to several times the T1, the longitudinal magnetization has time to recoverwith resulting improvement in SNR.Decrease in SNR is seen with an increase the TE secondary to T2 effects in spin echo sequences, andT2* effects in gradient echo sequences. The exponential decay curve below illustrates the lose ofsignal with time.
In spite of the decrease in SNR, we deliberately increase the TE to improve the T2 weighting(contrast) of an image. Ideally, we would want a long TR of several T1 times to minimize the T1effects in a T2 weighted sequence.
Trade Offs
As you may have gathered from reading up to this point, the SNR, resolution, and acquisition time,are all interrelated. Changing one effects the others. One job of yours as a radiologist may be todecide what factors are more important for an examination of a particular body part or patient. Whenlooking at the pituitary or cranial nerves, for example, you may want to sacrifice some SNR or longeracquisition time for improved spatial resolution. On the other hand, in a claustrophobic of patient inpain who may be moving around, you may sacrifice both resolution and SNR for the shortest possibleexamination time. A table is available to summarize the trade offs between SNR, resolution, time,
maximum number of slices and distance covered.
Trade Off Table
This table shows the effect on the top row of parameters, of increasing the variables in the column onthe right. A plus (+) sign indicates an increase, a minus (-) sign indicates a decrease, and (nc) indicatesno change. Many of these parameters are interdependent so we are looking at the direct effects ofchanges of single variables.
Increase Parametersbelow SNR � Resolution Acquisition Time Distance
Covered Max. Number of
Slices FOV + - nc nc nc NEX + nc + nc nc Slice Thick + - nc + nc Gap + - nc + nc TR + nc + nc + TE - nc nc nc - Matrix size - + + nc nc Bandwidth - nc nc nc + Magnet strength + nc nc nc nc
MRI Artifacts
There are numerous kinds of artifacts that can occur in MRI. Some effect the quality of the MRI examwhile others do not effect the diagnostic quality but may be confused with pathology.
Chemical Shift Artifacts Aliasing Black Boundary Artifacts Gibbs or Truncation Artifacts Zipper Artifacts Phase-encoded Motion Artifacts Entry Slice Phenomenon Slice-overlap Artifacts Magic Angle Effects Moire Fringes RF Overflow Artifacts Central Point Artifact Susceptibility Artifacts
Zero-fill Artifact (Zebra Artifact) References
Chemical Shift Artifacts
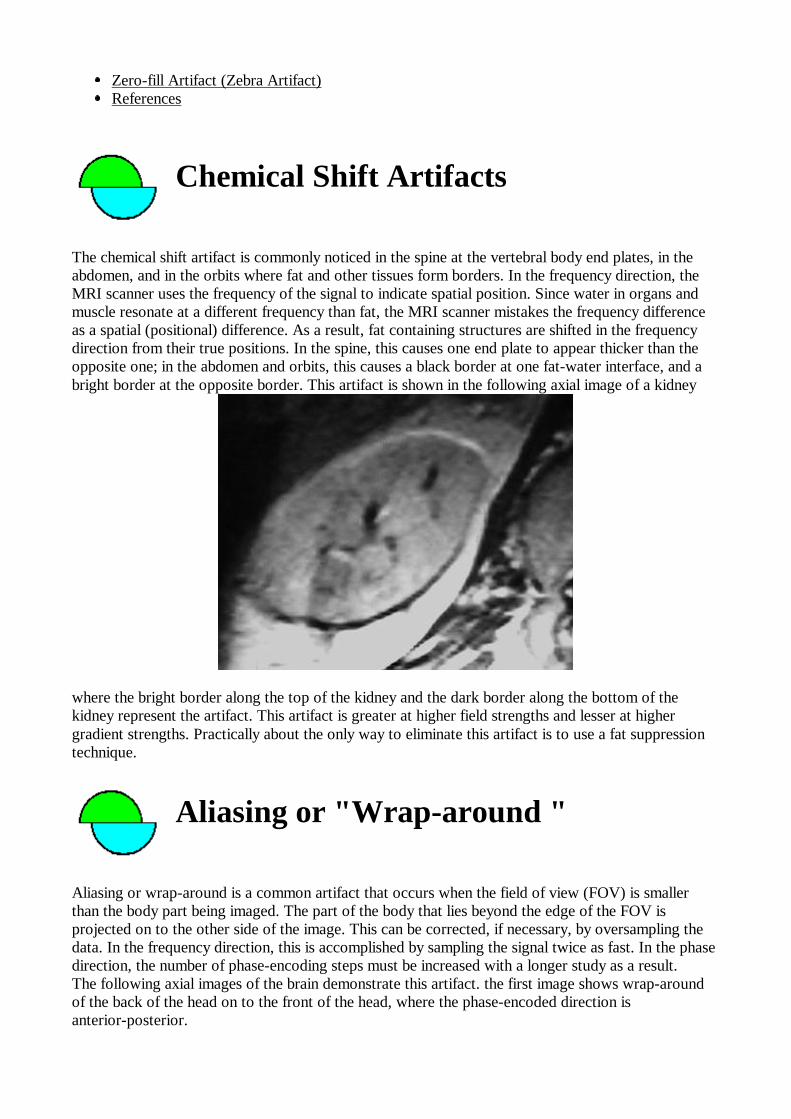
The chemical shift artifact is commonly noticed in the spine at the vertebral body end plates, in theabdomen, and in the orbits where fat and other tissues form borders. In the frequency direction, theMRI scanner uses the frequency of the signal to indicate spatial position. Since water in organs andmuscle resonate at a different frequency than fat, the MRI scanner mistakes the frequency differenceas a spatial (positional) difference. As a result, fat containing structures are shifted in the frequencydirection from their true positions. In the spine, this causes one end plate to appear thicker than theopposite one; in the abdomen and orbits, this causes a black border at one fat-water interface, and abright border at the opposite border. This artifact is shown in the following axial image of a kidney
where the bright border along the top of the kidney and the dark border along the bottom of thekidney represent the artifact. This artifact is greater at higher field strengths and lesser at highergradient strengths. Practically about the only way to eliminate this artifact is to use a fat suppressiontechnique.
Aliasing or "Wrap-around "
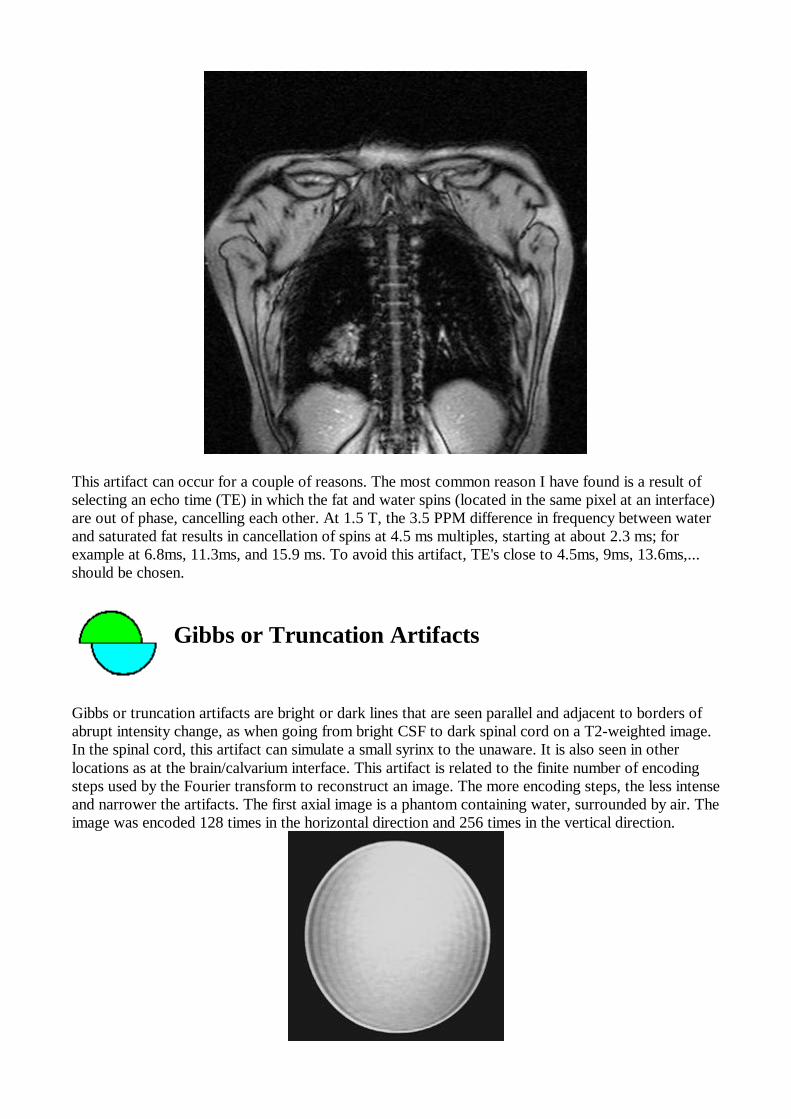
Aliasing or wrap-around is a common artifact that occurs when the field of view (FOV) is smallerthan the body part being imaged. The part of the body that lies beyond the edge of the FOV isprojected on to the other side of the image. This can be corrected, if necessary, by oversampling thedata. In the frequency direction, this is accomplished by sampling the signal twice as fast. In the phasedirection, the number of phase-encoding steps must be increased with a longer study as a result.The following axial images of the brain demonstrate this artifact. the first image shows wrap-aroundof the back of the head on to the front of the head, where the phase-encoded direction isanterior-posterior.

The second image has the phase and frequency directions reversed resulting in absence of the aliasingartifact.
Oversampling was used in the frequency direction to eliminate the aliasing.
Black Boundary Artifact
The Black Boundary Artifact is an artificially created black line located at fat-water interfaces such asmuscle-fat interfaces. This results in a sharp delineation of the muscle-fat boundary that is sometimesvisually appealing but not an anatomical structure. The following is a coronal image through the upperbody with an echo time of 7ms. A black line is seen surrounding the muscles of the shoulder girdle aswell as around the liver.
This artifact can occur for a couple of reasons. The most common reason I have found is a result ofselecting an echo time (TE) in which the fat and water spins (located in the same pixel at an interface)are out of phase, cancelling each other. At 1.5 T, the 3.5 PPM difference in frequency between waterand saturated fat results in cancellation of spins at 4.5 ms multiples, starting at about 2.3 ms; forexample at 6.8ms, 11.3ms, and 15.9 ms. To avoid this artifact, TE's close to 4.5ms, 9ms, 13.6ms,...should be chosen.
Gibbs or Truncation Artifacts
Gibbs or truncation artifacts are bright or dark lines that are seen parallel and adjacent to borders ofabrupt intensity change, as when going from bright CSF to dark spinal cord on a T2-weighted image.In the spinal cord, this artifact can simulate a small syrinx to the unaware. It is also seen in otherlocations as at the brain/calvarium interface. This artifact is related to the finite number of encodingsteps used by the Fourier transform to reconstruct an image. The more encoding steps, the less intenseand narrower the artifacts. The first axial image is a phantom containing water, surrounded by air. Theimage was encoded 128 times in the horizontal direction and 256 times in the vertical direction.
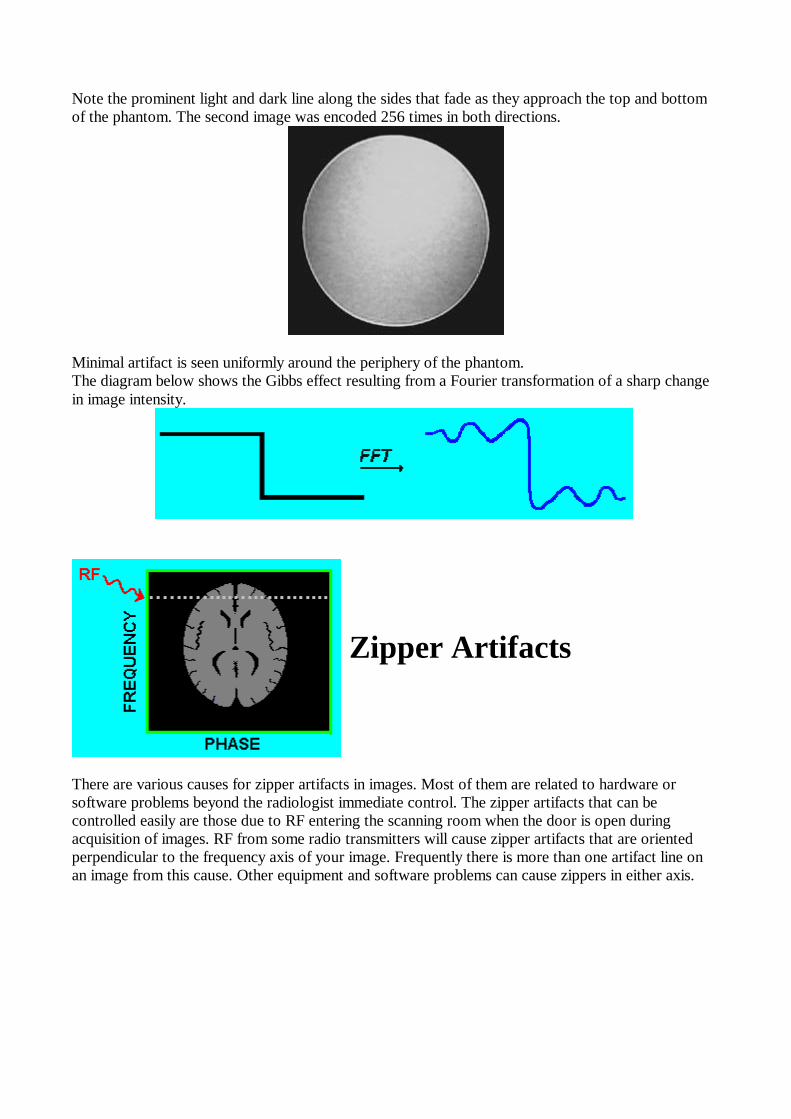
Note the prominent light and dark line along the sides that fade as they approach the top and bottomof the phantom. The second image was encoded 256 times in both directions.
Minimal artifact is seen uniformly around the periphery of the phantom.The diagram below shows the Gibbs effect resulting from a Fourier transformation of a sharp changein image intensity.
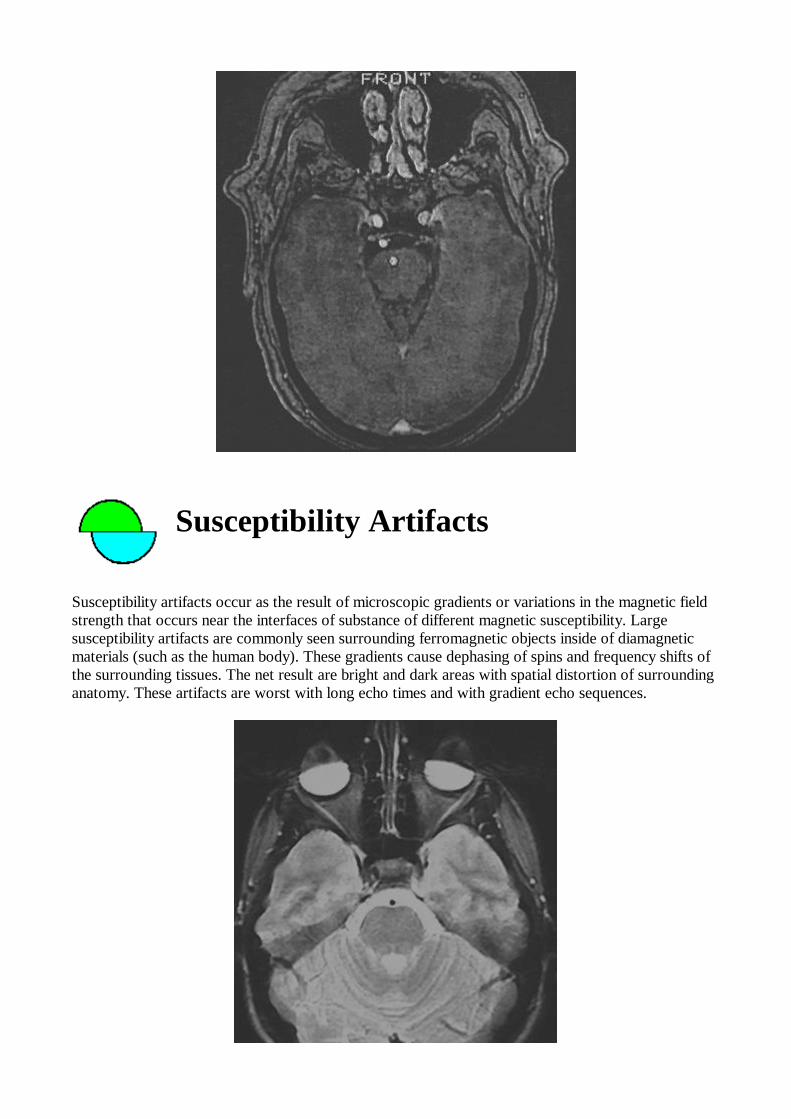
Zipper Artifacts
There are various causes for zipper artifacts in images. Most of them are related to hardware orsoftware problems beyond the radiologist immediate control. The zipper artifacts that can becontrolled easily are those due to RF entering the scanning room when the door is open duringacquisition of images. RF from some radio transmitters will cause zipper artifacts that are orientedperpendicular to the frequency axis of your image. Frequently there is more than one artifact line onan image from this cause. Other equipment and software problems can cause zippers in either axis.

This is an axial MRI of the head in a patient. The scanner room door was left open during theacquisition causing the zipper artifacts shown.
Phase-encoded Motion Artifacts
Phase-encoded motion artifacts appear as bright noise or repeating densities oriented in the phasedirection, occurring as the results of motion during acquisition of a sequence. These artifacts may beseen from arterial pulsations, swallowing, breathing, peristalsis, and physical movement of a patient.They can be distinguished from Gibbs or truncation artifacts because they extend across the entireFOV, unlike truncation artifacts that diminish quickly away from the boundary causing them.Phase-encoded artifacts can be reduced by various techniques depending on their cause and location.Arterial pulsation artifacts can be reduced by spatial presaturation pulses prior to entry of the vesselinto the slices. Spatial presaturation can also reduce some swallowing and breathing artifacts. Surfacecoil localization can reduce artifacts generated at a distance from the area of interest. Pulse sequencescan be shortened, and respiratory and/or cardiac or peripheral gaiting techniques may also help. Thefollowing axial image of the head shows a phase-encoded motion artifact running transversely acrossthe back of the head (posterior fossa) as a result of venous flow in the transverse sinuses.

Entry Slice Phenomenon
Entry slice phenomenon occurs when unsaturated spins in blood first enter into a slice or slices. It ischaracterized by bright signal in a blood vessel (artery or vein) at the first slice that the vessel enters.Usually the signal is seen on more than one slice, fading with distance. This artifact has been confusedwith thrombosis with disastrous results. The characteristic location and if necessary, the use ofgradient echo flow techniques can be used to differentiate entry slice artifacts from occlusions.
Slice-overlap Artifacts
The slice-overlap artifact is a name I've given to the loss of signal seen in an image from a multi-angle,multi-slice acquisition, as is obtained commonly in the lumbar spine. If the slices obtained at differentdisk spaces are not parallel, then the slices may overlap. If two levels are done at the same time, e.g.,L4-5 and L5-S1, then the level acquired second will include spins that have already been saturated.This causes a band of signal loss crossing horizontally in your image, usually worst posteriorly.Thedark horizontal bands in the bottom of the following axial image through the lumbar spinedemonstrates this artifact.

As long as the saturated area stays posterior to the spinal canal it causes no harm.
Magic Angle Effects
Magic angle effects are seen most frequently in tendons and ligaments that are oriented at about a 55degree angle to the main magnetic field. Signal from water molecules associates with the tendoncollagen fibers is not normally seen because of dipolar interactions that result in very short T2 Times.At an angle of about 55 degrees to the main magnetic field, the dipolar interactions become zero,resulting in an increase of the T2 Times about 100 fold. This results in signal being visible in tedonswith ordinary pulse sequences. A bright signal from this artifact is commonly seen in the rotator cuffand occasionally in the patellar tendon and elsewhere. The following image shows increase signal inthe distal patellar tendon from this magic angle effect.

Moire Fringes
Moire fringes are an interference pattern most commonly seen when doing gradient echo images withthe body coil as shown in the figure.
Because of lack of perfect homogeneity of the main magnetic field from one side of the body to theother, aliasing of one side of the body to the other results in superimposition of signals of differentphases that alternatively add and cancel. This causes the banding appearance and is similar to theeffect of looking though two screen windows.

RF Overflow Artifacts
RF overflow artifacts cause a nonuniform, washed-out appearance to an image as shown in thefollowing axial image of a head.
This artifact occurs when the signal received by the scanner from the patient is too intense to beaccurately digitized by the analog-to-digital converter. Autoprescanning usually adjusts the receivergain to prevent this from occurring but if the artifact still occurs, the receiver gain can be decreasedmanually.
Central Point Artifact
The central point artifact is a focal dot of increased signal in the center of an image. It is caused by aconstant offset of the DC voltage in the receiver. After fourier transformation, this constant offsetgives the bright dot in the center of the image as shown in the diagram below.
The following axial MRI image of the head shows a central point artifact projecting in the pons(bright dot in the middle of the image).
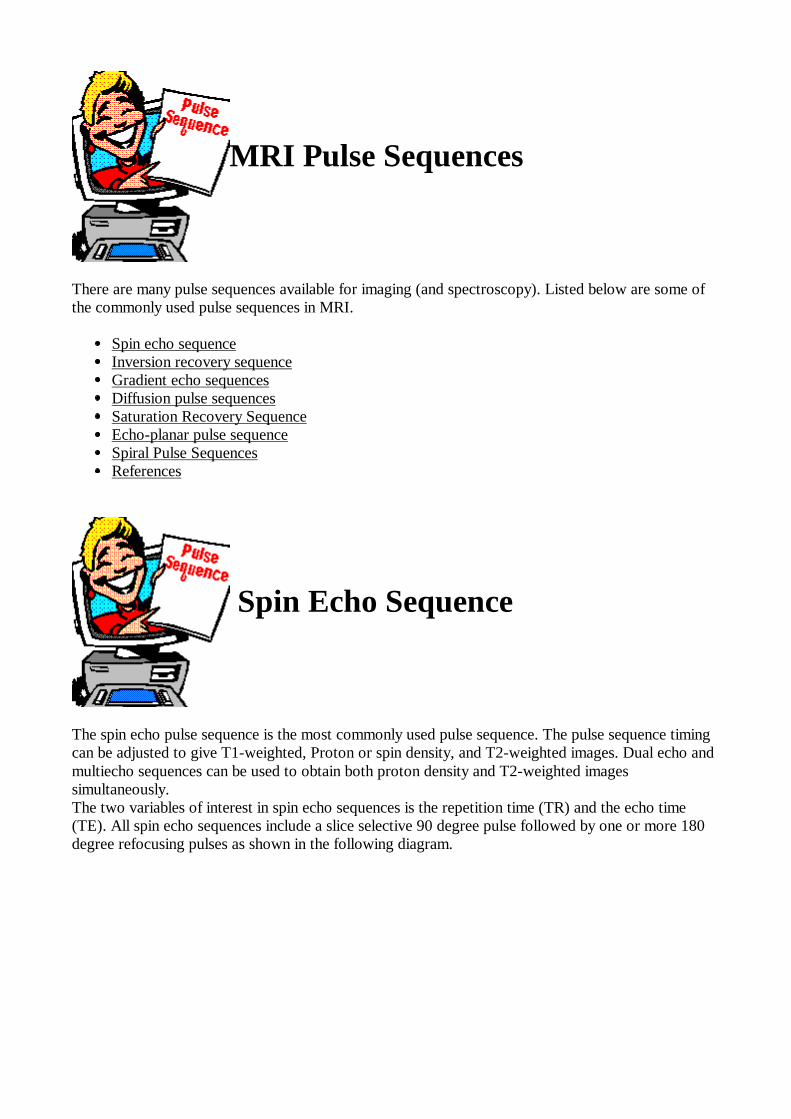
Susceptibility Artifacts
Susceptibility artifacts occur as the result of microscopic gradients or variations in the magnetic fieldstrength that occurs near the interfaces of substance of different magnetic susceptibility. Largesusceptibility artifacts are commonly seen surrounding ferromagnetic objects inside of diamagneticmaterials (such as the human body). These gradients cause dephasing of spins and frequency shifts ofthe surrounding tissues. The net result are bright and dark areas with spatial distortion of surroundinganatomy. These artifacts are worst with long echo times and with gradient echo sequences.

This is an axial MRI of the head in a patient with mascara on her eyelids. Susceptibility artifacts fromthe mascara obscure the front half of the globes.
Zero-Fill Artifacts
Occasionally, data in the K-space array will be missing or will be set to zero by the scanner as shownin the figure below.
The abrupt change from signal to no signal at all results in artifacts in the images such as zebra stripesand other anomalies. The following coronal image of the shoulder shows an example of a zero-fillartifact.
MRI Pulse Sequences
There are many pulse sequences available for imaging (and spectroscopy). Listed below are some ofthe commonly used pulse sequences in MRI.
Spin echo sequence Inversion recovery sequence Gradient echo sequences Diffusion pulse sequences Saturation Recovery Sequence Echo-planar pulse sequence Spiral Pulse Sequences References
Spin Echo Sequence
The spin echo pulse sequence is the most commonly used pulse sequence. The pulse sequence timingcan be adjusted to give T1-weighted, Proton or spin density, and T2-weighted images. Dual echo andmultiecho sequences can be used to obtain both proton density and T2-weighted imagessimultaneously.The two variables of interest in spin echo sequences is the repetition time (TR) and the echo time(TE). All spin echo sequences include a slice selective 90 degree pulse followed by one or more 180degree refocusing pulses as shown in the following diagram.

Dual echo spin echo sequence
In this diagram, RF is the radio frequency pulse, a slice selective 90 degree pulse followed by two 180degree refocusing pulses. GS, GP, and GF are the slice selective, phase encoding, and frequencyencoding gradients, respectively. "Echo" represents the signal received from the slice of interest in thebody. A short TR an short TE will give a T1-weighted image, a long TR and short TE (first echo) willgive a proton density image, and a long TR and long TE (second echo) will give a T2-weightedimage.An example of the changes in the net magnetization vector for a spin echo sequence with one echo isshown below. After 1/2 of the TE time, dephasing of individual spins in the volume occurs asrepresented by the black and red arrows. The 180 degree RF pulse flips these spins to the oppositeside in the x-y plane so that after another 1/2 TE, they refocus and are detected.
Inversion Recovery Sequence
Inversion recovery pulse sequences are used to give heavy T1-weighting. In addition, the STIR (short

TI inversion recovery) sequence can be used for fat suppression, where a relatively short inversiontime is used to null the fat signal while maintaining water and soft tissue signal. The basic part of aninversion recovery sequence is a 180 degree RF pulse that inverts the magnetization followed by a 90degree RF pulse that brings the residual longitudinal magnetization into the x-y or transverse planewhere it can be detected by an RF coil. In imaging, the signal is usually refocused with a 180 degreepulse as in a spin echo sequence.The time between the initial 180 degree pulse and the 90 degreepulse is the inversion time (TI). A diagram of the sequence is shown below.
Inversion recovery sequence
With a TI of about 140 ms on a 1.5 T MRI machine, the fat signal is nulled while the water protonsignal is still present. This occurs because the T1 of fat is significantly smaller than the T1 of water.The diagram below shows the magnetization of water (black arrow) and fat (red arrow) during theSTIR sequence used for fat suppression. One drawback of this sequence is the partial loss of protonsignal during the TI time. Also the TR time must be longer than that of a spin echo sequence forrecovery of longitudinal magnetization.

Gradient Echo Sequences
The gradient echo sequences show a wide range of variations compared to the spin echo and inversionrecovery sequences. Not only is the basic sequence varied by adding dephasing or rephasing gradientsat the end of the sequence, but there is a significant extra variable to specify in addition to things likethe TR and TE. This variable is the flip or tip angle of the spins. The flip angle is usually at or close to90 degrees for a spin echo sequence but commonly varies over a range of about 10 to 80 degrees withgradient echo sequences. For the basic gradient echo sequence FLASH, illustrated below, the largertip angles give more T1 weighting to the image and the smaller tip angle give more T2 or actually T2*weighting to the images.
Basic gradient echo sequence (FLASH)
Images from other gradient echo sequences such as GRASS and FISP have less intuitive tissuecontrast characteristics than FLASH. The FLASH and SPGR sequences show better tissue contrastbetween white matter and grey matter in the brain and spinal cord than GRASS or FISP and arepreferred when the time of acquisition does not have to be very short. GRASS and FISP maintainbetter SNR than FLASH at short TR times and are therefore preferred with breath-holdingtechniques, for example.A vector magnetization diagram of the gradient echo sequence is shown below. Note that the spinsare refocused by reversing the direction of the spins rather than flipping them over to the other side ofthe x-y plane as occurs with the spin echo sequence. Gradient refocusing of the spins takesconsiderably less time than 180 degree RF pulse refocusing. One big disadvantage of gradient echosequences is the loss of signal from static magnetic field inhomogeneity. This occurs to a lesser degreewith spin echo sequences (and for a different reason). Magnetic susceptibility artifacts are thereforemore pronounced on gradient echo sequences that on spin echo sequences.

Diffusion Pulse Sequences
Various pulse sequences may be modified to enhance signal loss resulting from water molecules thatshow significant diffusion vs those with more restricted diffusion. Certain pathology shows restrictionof diffusion, such as cytotoxic edema and demyelinization. With a diffusion-weighted pulse sequence,these abnormalities can be made more obvious. Depending on the particular gradient/gradients used,anisotropic diffusion can be detected, as occurs normally in white matter tracts. The picture below is aspin echo sequence with diffusion gradients added. The gradient coil used to produce the diffusionneed not be a separate gradient or gradients from those used for spatial encoding. The degree ofdiffusion weighting is dependent primarily on the area under the diffusion gradients and on the intervalbetween the gradients. Other factors include the effect of the spatial localization gradients and the sizeof the voxels.

Saturation Recovery Sequence
The saturation recovery (SR) sequences are rarely used for imaging now. Their primary use at thistime is as a technique to measure T1 times more quickly than an inversion recovery pulse sequence.Saturation recovery sequences consist of multiple 90 degree RF pulses at relatively short repetitiontimes (TR). An example of a SR sequence is shown below. Residual longitudinal magnetization afterthe first 90 degree RF pulse is dephased by a spoiling gradient (in this case with the slice selectgradient). Longitudinal magnetization that develops during the TR period after the dephasing gradientis rotated into the transverse plane by another 90 degree pulse. A gradient echo is acquiredimmediately after this. The signal will reflect T1 differences in tissues because of different amounts oflongitudinal recovery during the TR period.
Echoplanar Pulse Sequences
Echoplanar imaging is a gradient echo technique related to fast gradient echo imaging. Instead of oneto 16 phase steps per acquisition TR, the entire set of 64 or 128 phase steps is acquired during oneacquisition TR. This is accomplished by rapidly reversing the readout or frequency- encodinggradient. This switching or reversal may also be done in a sinusoidal fashion. Echoplanar sequencesmay use entirely gradient echos or may combine a spin echo with the train of gradient echos asillustrated in the diagram below. Echoplanar images may be acquired in less that 1/10th of a secondand therefore may be useful in cardiac imaging and other rapidly changing processes.

Spiral Pulse Sequences
Spiral scanning in MRI is unlike spiral scanning in CT where the x-ray tube is continuously rotatingand data is continuously being acquired. In MRI the word "spiral" refers to the pattern of samplingk-space. In conventional imaging sequences including spin echo and gradient echo and in fast imagingsequences, a line or multiple lines of k-space in the frequency direction are acquired consecutively. Inspiral scanning, k-space is acquired in a spiral trajectory. The entire k-space can be acquired during asingle acquisition, or interleaved using more than one acquisition. This sequence allows faster imageacquisition than the fast echo sequences but is slower than the echoplanar imaging. Spiral scanningtends to have fewer artifacts than echoplanar imaging since adjacent points in k-space are acquired inclose temporal proximity. The figures below shows how the acquisition of data in k-space is donewith conventional sequences and with spiral scanning.
Safety
Safety can be divided up into four areas:
Main Magnetic Field Varying Magnetic (Gradient) Fields Radio Frequency References
Main Magnetic Field and Safety
The main magnetic field of a 1.5 T magnet is about 30,000 times the strength of the earth's magneticfield. It is strong enough to pull fork-lift tines off of machinery, pull heavy-duty floor buffers and mopbuckets into the bore of the magnet, pull stretchers across the room and turn oxygen bottles intoflying projectiles. Deaths have occurred from trauma as a result of these effects. Smaller objects suchas pagers, bobby pins and pens have been known to be pulled off the person carrying them.The strong field also effects common devices such as pacemakers and watches. The magnetic reedswitch in modern pacemakers is disturbed by strong magnetic fields resulting in possible deleteriouseffects to the patient with one implanted. Mechanic watches will "freeze up" in a strong field,sometimes permanently.Many intracranial aneurysm clips are ferromagnetic and as a result experience a torque or twisting in amagnetic field. Not everyone with an aneurysm clip experiences a fatal hemorrhage when placed in amagnet, but several cases have been reported. Some types of heart valves (e.g., Star-Edwards) are torqued in a magnetic field: however, this torqueis less than the stresses that occur normally as a result of blood flow. Therefore heart valves are nowconsidered not to be an absolute contraindication for MRI.More of an annoyance than a safety problem is the ability of the magnetic field of a MRI machine toerase the information contained on the magnetic strip on ATM and credit cards. This may occur ashort distance inside of the scanner room of a MRI machine.Some metallic objects that are usually safe near an MRI machine are gold jewelry and eyeglass frames.
Varying Magnetic (Gradient) Fields
Varying magnetic fields are necessary in order to obtain images from MRI scanners. Changingmagnetic field induce electrical currents in conductors ( this is how an electrical generator works). Inpatients with metal in their body, the potential exists for electrical currents being induced in the metalwith subsequent heating. This may occur with metal foreign bodies or some surgical implants. It doesnot universally occur and some patients with hip prostheses, for example, may be scanned without

harm. Very rapidly changing magnetic fields as may be achieved with echo planar imaging can cause nervestimulation. This stimulation can effect motor nerves with resulting muscle contraction as well as theretina with resulting flickering lights called "magnetophosphenes".
Radio Frequency
The radio frequency power that is capable of being produced matches that of many small radiostations (15-20 kW). As a result there is the presence of heating effects from the RF. In most pulsesequences, the heating is insignificant and does not exceed the FDA guidelines. New pulse sequencessuch as for echo planar imaging and some spectroscopy localization techniques are capable ofexceeding the FDA guidelines. Monitoring of the power deposition in patients is a requirement forFDA approval of clinical MRI scanners.Potential for electrical shock exists with RF coils so proper grounding and insulation of coils isnecessary. Any damage to coils or their cables needs prompt attention. Also looping of the cable to acoil can result in burns to patients that come into contact with them. It is best to avoid all contact withthe RF coil cables.
MRI Contrast Agents
Although MRI was initially hoped to provide a means of making definitive diagnoses noninvasively,we have found that the addition of contrast agents in many cases improves our sensitivity and/orspecificity. Paul Lauterbur and his associated were the first to demonstrate the feasibility of usingparamagnetic contrast agents to improve tissue discrimination in MRI. I have somewhat arbitrarilygrouped this topic into the subjects listed below. If you would like to review the differences betweendiamagnetic, paramagnetic, superparamagnetic, and ferromagnetic; look over the magnetism section.
Gastrointestinal contrast agents Intravenous contrast agents Intravascular (blood pool) contrast agents Tumor-specific agents Hepatobiliary contrast agents Reticuloendothelial Contrast Agents References
Gastrointestinal MRI Contrast

Agents Acceptance of the us of MR in abdominal imaging has been limited in part by difficulty indistinguishing bowel from intraabdominal masses and normal organs. The use of enteric contrastagents can in this problem. There is currently one agent that has FDA approval for this use, aperfluorochemical (see below). Barium and solutions of ferric ammonium citrate (Geritol) have beenused but are not specifically approved for this use. GI contrast agents can be divided into positiveagents (appearing bright on MRI) or negative agents (appearing dark on MRI).
Positive Contrast Agents Negative Contrast Agents Positive vs Negative GI Contrast Agents
Positive Contrast Agents
Positive GI contrast agents can be divided into three categories: Paragmagnetic agents (e.g.,Gd-DTPA solutions), short T1-relaxation agents (e.g., mineral oil), and combinations of these.
Paramagnetic Agents
Proposed paramagnetic, positive GI contrast agents include ferric chloride, ferric ammoniumcitrate, and gadolinium-DTPA (with and without mannitol). Paramagnetic materials cause bothT1 and T2 shortening. At low concentrations used for bowel opacification, the T1 shorteningdominates the signal intensity. This results in high intensity on T1-weighted, T2-weighted andgradient echo images. At high concentrations, T2 shortening causes decreased signal in all butvery short echo sequences. This resembles the effect seen with superparamagnetic iron oxide(see Negative GI Contrast Agents). At intermediate concentrations, a mixture of T1 and T2shortening results in increased signal on T1-weighted images and decreased signal onT2-weighted images. Ferric ammonium citrate and Gd-DTPA with mannitol are safe andeffective in humans, but both have minor side effects. Ferric iron can cause teeth staining,gastric irritation, nausea, diarrhea, and constipation. Mannitol can nausea, vomiting, anddiarrhea. Gd-DTPA without mannitol is well tolerated but usually fails in opacify the entiresmall bowel. It also needs to be buffered when used orally since this chelate is not very stable atthe low pH found in the stomach.
Short T1-relaxation Agents
Short T1 relaxation time GI contrast agents include mineral oil, oil emulsions, and sucrosepolyester. In these materials, protons contained in -CH2- groups relax at a faster rate than thosein water resulting in a short T1 time. This gives a bright signal in the bowel on T1-weightedsequences. Of these materials only oil emulsions have been used successfully in humans. Theseare palatable and produce homogeneous opacification of the stomach and small bowel, but areabsorbed in the distal small bowel and fail to fill the colon. This is circumvented by using acontrast enema when the colon must be better visualized. A novel approach to retrogradeopacification of the colon has been shown in rats with a nonabsorbable fat substitute, sucrosepolyester but no human trials for this use have been done.

Combination Contrast Agents
Combinations of oil emulsion and paramagnetic substances may be used as bowel contrastagents. These include an emulsion containing corn oil and ferric ammonium citrate, and anemusion containing baby formula with ferrous sulfate. These are palatable mixtures thatdistribute uniformly in the bowel, however signal is lost in the distal small bowel in adults,because of absorption of both the oil and the iron. Unlike in adults, the faster transit through thesmall bowel in infants delivers bright contrast to the colon. The advantage of this combinationover oil emulsions alone is the enhancement of signal on T1-weighted and especiallyT2-weighted images.
Negative GI Contrast Agents
Negative GI contrast materials can be divided into three categories: diamagnetic agents,superparamagnetic agents, and perfluorochemicals.
Diamagnetic Contrast Agents
Two diamagnetic agents have been tested for use as a negative GI contrast agent. The first wasa combination of clay minerals found in a popular antidiarrheal medication, Kaopectate. Thismixture of kaolin and bentonite is thought to facilitate the relaxation rate of protons in watermolecules. The water molecules next to the surface of the clay are continually exchangingposition with molecules away from the surface resulting in phase dispersion that also causesloss of signal. When used in volunteers, this mixture causes loss of signal in the stomach andduodenum resulting in improved visualization of the pancreas. Distribution in the small bowel isreported to be nonuniform.The second diamagnetic contrast agent causing loss of signal in the bowel is barium sulfatesuspension. The decrease in signal seen is a result of two processes: 1) replacement of waterprotons by barium; and 2) magnetic susceptibility effects around the barium particals. Testing ofa conventional barium sulfate suspension (60% wt/wt) in volunteers and patients givesencouraging results. Our in vitro and volunteer studies at higher concentrations of bariumsulfate show that the 170% to 220% wt/vl suspensions give greater loss of signal than theoriginal barium tested. The loss of signal from barium sulfate suspensions does not match thatseen with superparamagnetic iron oxide described below, however barium suspensions arecurrently readily available and probably will be much less expensive.
Superparamagnetic Contrast Agents
There are several preparations of superparamagnetic agents can be used as oral MRI contrastagents. These include magnetite albumin microspheres, oral magnetic particles (Nycomed A/S,Oslo, Norway), and superparamagnetic iron oxide (AMI121, Advanced Magnetics, Cambridge,Mass.). These three contain small iron oxide crystals approximately 250 to 350 angstroms indiameter and are mixtures of Fe2O3 and Fe3O4. The small size of the crystals contributes totheir large magnetic moment without significant residual magnetization after removal from themagnetic field, i.e., they are superparamagnetic, not ferromagnetic. These crystals areembedded in an inert material, albumin matrix in the first case, a monodispersed polymer in thesecond, and an inert silicon polymer in the third. The inert materials reduce absorption andtherefore, toxicity from the iron. They also help to suspend the particles in solution.

Marked loss of signal in the stomach and small bowel results in excellent visualization of thepancreas, anterior renal margins and para-aortic regions. Decrease in the phase encodedartifacts from respiratory and peristaltic motion of the stomach and small bowel are noted. Atcertain concentrations and volumes, metallic artifacts are seen in the distal small bowel andcolon on delayed imaging. These may be related to settling and concentration of the particles.Optimization of the dose of contrast agent and addition of more suspending agents mayovercome this problem. Agents such as cellulose or polyethylene glycol may be added toenhance relaxation and thereby allow reduction in the concentration of iron oxide needed. Thismay reduce the artifacts.
Perfluorochemicals
Diamagnetic and paramagnetic effects are not the only mechanisms for reducing signal in thebowel. The absence of mobile protons will give this effect as seen with barium sulfatesuspended in D2O, carbon dioxide, and perfluorochemicals. CO2 from effervescent granules ismoderately well tolerated by patients but shows inhomogeneous distribution in the small bowel,and requires the use of glucagon to decrease peristalsis.Perfluorochemicals are organic compounds in which the protons are replaced by fluorine. Thisresults in an absence of signal in the bowel. Perfluoroctylbromide(PFOB)(C8F17Br) is the onlyperfluorochemical that has been investigated for oral use in humans to date. It is commerciallyavailable now as perflubron (Imagent GI, Alliance), but at high cost ($200 per 200cc bottle).Potential advantages are a rapid transit through the small bowel because of its low surfacetension, the lack of taste or odor making it palatable, and the absence of any known side effects.PFOB is immiscible as are all perfluorochemicals that are in their pure or "neat" state. This maybe an advantage because PFOB cannot be diluted by bowel contents, however, miscible agentsthat mix with fluid in the bowel may give more uniform filling of the GI tract. EmulsifyingPFOB, as is done for intravascular use of perfluorochemicals, may overcome this potentialproblem.
Positive vs Negative GI Contrast Agents
The question of which type of contrast enhancement of the bowel is the best, positive ornegative, is sill debated. We may find a positive or negative oral contrast agent better dependingon the specific organ or disease suspected and the pulse sequence used.Two disadvantages of positive oral contrast agents are ghosting artifacts because of respiratoryand peristaltic motion, and loss of signal from dilution with secretions and retained fluid in thebowel. One method of reducing ghosting artifacts is to use a pharmaceutical, such as glucagonor scopolamine, to reduce bowel motion. This increases the invasiveness of the procedure.Other methods include the use of breath holding pulse sequences and first order flowcompensation. Further refinements of pulse techniques probably will make breath holdingsequences more popular for abdominal MRI. This will decrease artifacts from both peristalsisand breathing.Dilution of positive contrast agents occurs in the upper GI tract if they are miscible with waterbecause of gastrointestinal secretions. This allows for the use of a small dose, but will causeloss of signal intensity as the concentration decreases. Immiscible positive agents using oils,especially nonabsorbable ones, will not experience the loss of signal with dilution. They willprobably require a larger volume to replace any residual bowel contents. Another disadvantage of a positive oral contrast agent is the possibility of residual material inthe bowel simulating a mass when surrounded by bright signal. The opposite is also true. A

bright mass (such as a lipoma) might be obscured by the contrast agent.An advantage of positive oral contrast agents is the availability of several of these materials atthis time. These include ferric ammonium citrate, pediatric formula, and homemade oilemulsions. Positive agents are also inexpensive (except for gadolinium solutions) and are safe touse.Disadvantages of negative oral contrast materials include their high cost and lack of generalavailability (except for CO2 and barium), and limited evaluations of safety on large number ofpatients. The expense may decrease with greater use of these contrast materials and withcompetition between manufacturers.Metallic artifacts are seen when iron oxide concentrations,ideal for spin echo sequences, are used with gradient echo sequences. This is because gradientecho sequences have greater sensitivity to magnetic field inhomogeneity. Also there were somemetallic artifacts seen in the colon on delayed (24 hour) imaging with the iron oxidepreparations that probably can be eliminated as discussed above.Lack of a fat plane between the negative contrast filled bowel and low signal intensity organsmay make it difficult to distinguish normal contours. An example of this is the plane betweenthe stomach and the pancreas on T2-weighted sequences. The majority of pathology appearsbright on T2-weighted sequences and should be seen, however.Advantages of negative oral contrast materials are several. The lack of signal in the bowelremoves a source of ghosting artifacts from spin echo sequences that may be present withpositive agents. The loss of signal is fairly independent of concentration of superparamagneticiron oxide suspensions on spin echo sequences so that dilution should not be a problem. Theperfluorochemicals are immiscible with water and will not encounter dilution problems either.
Intravenous Contrast Agents
Intravenous contrast agents include chelates of paramagnetic ions, both ionic and nonionic. Theparticulates, sequestered in the liver, spleen, and lymph nodes, the intravascular agents,confined to the blood pool, and tumor specific agents will be discusses separately.
Chelates
Paramagnetic metal ions suitable as MR contrast agents are all potentially toxic when injectedIV at or near doses needed for clinical imaging. With chelation of these ions, acute toxicity isreduced and elimination rate is increased thereby reducing the chance of long term toxicity.
Ionics
Chelates of paramagnetic ions with EDTA were first used however Gd-EDTA was toxic inanimals. Chelates with a higher stability constant have since been used successfully. Gd-DTPAGd-DTPA was the first intravenous MR contrast agent to be approved for human use(Magnevist, Berlex Labs). Gd has a large magnetic moment, exceeded only by Dysprosium(III)and Holmium(III), explaining its paramagnetic properties at low concentrations. This largemagnetic moment is related to its seven unpaired orbital electrons. Gd-DTPA has similarpharmacokinetics as iodinated contrast agents. It is distributed in the intravascular andextracellular fluid spaces, does not cross an intact blood-brain-barrier, and is excreted rapidly byglomerular filtration.
Nonionics

The development of nonionic contrast agents for MRI has paralleled that for iodinated contrastmaterials. Ionic chelates are also hyperosmolar and some of their side effects may be attributedto this property.GadodiamideGadodiamide (Omniscan, Winthrop Pharm.) is a nonionic complex with two-fifths of theosmolality of Gd-DTPA. It has a median lethal dose of 34 mmol/kg resulting in a safety ratio of2-3 times that of Gd-DOTA, and 3-4 times that of Gd-DTPA. No abnormal serum bilirubinlevels occur, however elevated serum iron levels occurred with an incidence of 8.2% in onestudy of 73 patients.The efficacy of this contrast is similar to that of Gd-DTPA.GadoteridolGadoteridol (Prohance, Squibb) is the third intravenous contrast agent on the market. It is alow osmolar, nonionic contrast as is Gadodiamide.Indications for use and efficacy are similar tothe other agents.
Intravenous Contrast Agent Safety
The most commonly reported reactions associated with the injection of Gd-DTPA are:headache (6.5%), injection site coldness (3.6%), injection site pain or burning (2.5%), andnausea (1.9%). Recent adverse rates for Gd-DTPA are lower than this and comparable to thoseof Gadodiamide and Gadoteridol (1.4%-3% for headache, nausea, and dizziness; <1% for theothers). The safety factor or ratio (ratio of the LD50 to the imaging dose) may be used toassess the relative acute toxicity of contrast agents. The elimination half-life for the Gd containgcontrast agents range from 1.25-1.6 hours.Gadolinium containing contrast agents usually has no effect on blood chemistries andhematologic studies except transient elevation of serum iron and bilirubin levels. Theseelevations peaked at 4 to 6 hours post injection and returned to baseline values in 24 to 48hours. The mechanism of these elevations is uncertain but may be related to mild hemolysis. A10%-11% increase in the activated partial thromboplastin time and thrombin time occurs invitro with inhibition of platelet aggregation. The platelet aggregation inhibition is less than thatseen with iodinated ionic contrast material and no bleeding problems are reported clinically. Deoxygenated sickle erythrocytes align perpendicular to a magnetic field in in vitro studiesraising the possibility of occlusive complications in patients with sickle cell anemia. No clinicalreports of this potential problem are available. Transient and mild drop blood pressure is reported in both animals and humans. A study of1,068 patients reports hypotension in 0.3% of the subjects and other symptoms such as syncopeprobably associated with hypotension in 0.8%.33 Most of these symptoms occur 25-85 minutesafter the injection.Reports of several episodes of severe anaphylactoid reactions after IV injection of Gd- DTPAare published. The frequency of these reactions is about 1 in 100,000 doses. Potential riskfactors may include a history of asthma and significant reaction to previously administerediodinated contrast material. It is suggested that the threshold for injecting Gd be raised, in thosepatients, based on an individual risk/benefit ratio. Prophylactic pharmacotherapy withantihistamines and corticosteriods, such as Greenbergers protocol, is suggested for high riskpatients prior to contrast injections.
Intravascular (blood pool) Contrast Agents
Intravascular contrast agents normally remain confined to the intravascular space, compared toGd-DTPA which distributes throughout the extracellular fluid space. This is a result ofintravascular agents having a molecular weight of approximately 70,000 and above, comparedto a molecular weight of 590 for Gd-DTPA. There are several advantages of intravascularagents. They can assess perfusion in areas of ischemia and provide information about capillarypermeability in areas of reperfusion. They can show the extent of tumor neovascularity andassociated permeability changes. Finally, they are useful in studies requiring prolonged imaging.Three types of intravascular contrast agents will be described: Gd-DTPA labeled albumin,Gd-DTPA labeled dextran, and chromium-labeled red blood cells.
Gd-Labeled Albumin Gd-Labeled Dextran Chromium-Labeled Red Blood Cells
Gd-Labeled Albumin
Gd-DTPA is covalently bonded to albumin in ratios from 16:1 to 31:1 providing excellentenhancement of liver, spleen, myocardium, brain, and slow moving blood of rats and rabbits.The albumin has a molecular weight of about 92,000 and a biological half-life of 88 minutes.The dose of Gd-DTPA required when bound to albumin is 0.062 mmol/kg compared to usualdoses of the chelate alone of 0.1-0.2 mmol/kg. No adverse reactions are reported, but in vivoretention of the gadolinium for several weeks in liver and bone raises concerns of long termtoxicity.
Gd-Labeled Dextran
Dextran is a polysaccharide consisting of a polymer of glucose molecules with a molecularweight between 75,000-100,000. Dextran has a high level of safety and is broken down morerapidly than albumin. Approximately 15 Gd-DTPA molecules are attached to each dextranmolecule with an easily hydrolyzable bond. It is hoped that this will reduce the long term in vivoretention seen with Gd-labeled albumin. The trade off is a shorter biological half-life of 43minutes. In a rat model, satisfactory enhancement of liver, spleen, kidneys, myocardium, andbrain is seen for up to 1 hour. The dose of dextran Gd-DTPA in these studies was 0.01-0.05mmol/kg. Elimination and toxicity studies are underway.
Chromium-Labeled Red Blood Cells
The use of 51Cr-labeled RBC's in nuclear medicine suggested the use of paramagneticCr(III)-labeled RBC's as an intravascular contrast agent for MRI. In dogs, significantenhancement of the liver and spleen is noted with minimal enhancement of the kidneys. Theblood volume to be replaced with labeled RBC's in these studies corresponding to about oneunit in humans. The survival half-life of labeled cells is 4.7 days compared to 16.6 days forunlabeled cells. Free Cr may contribute to the enhanced relaxation rates of the liver and spleen.Short term toxicity appears to be low, but further studies are necessary.
Tumor-specific Agents
Tumor specific agents are pharmaceuticals that are targeted to tumors, either specifically ornonspecifically. Monoclonal antibodies are targeted to specific tumors such as adenocarcinomaof the colon. Metalloporphyrins exhibit affinity for many tumor types including carcinoma,sarcoma, neuroblastoma, melanoma and lymphoma.
Monoclonal Antibodies Metalloporphyrins Nitroxides Ferrioxamine
Monoclonal Antibodies
Monoclonal antibodies (McAb) are used successfully in nuclear medicine for localization oftumors but an initial attempt at extending this use to MRI with paramagnetic (Gd3+) labeledantibodies was unsuccessful because of the estimated 800-fold lesser sensitivity of MRI. Thisproblem can be addressed in several ways: 1) increasing the number of paramagnetic ionsattached to the McAb; 2) attaching several paramagnetic ions to a macromolecule that in turn isattached to a McAb; 3) using more antibodies or those with an affinity to many antigenic sitesper cell or both; and 4) using a superparamagnetic particle attached to the McAb. Implantedhuman colon carcinoma tumors in mice have been successfully imaged by using monoclonalantibodies with a large number of Gd-DTPA molecules attached.
Additional studies report the use of very small magnetite particles coated with McAb. Themagnetite cores are 10-20 nm in diameter with a total particle diameter of 20-32 nm. Themagnetic moment of these superparamagnetic particles is about 1000 times that of comparableparamagnetic particles. This allows the use of 1-10 nmol concentrations of the McAb coatedmagnetite particles. Mixed success has been obtained in rodents with implanted neuroblastomaand human colon carcinoma.
Metalloporphyrins
The metalloporphyrin most commonly used as a MRI contrast agent is Mn(III)TPPS4(manganese(III) tetra-[4- sulfanatophenyl] porphyrin) because of its low toxicity (compared toFe(III)TPPS4 for example). A safety ratio of about 6:1 is estimated in mice. This materialappears to work best with tumors that are isointense to surrounding structures on T1-weightedsequences. Incidentally, the fluorescent and tumor localizing characteristics of porphyrinderivatives have been exploited in phototherapy of tumors.
Nitroxides
Nitroxide stable free radicals or nitroxyl spin labels as they may be called, are chemically stableorganic compounds that have an unpaired electron that results in paramagnetic properties. Theygenerally consist of a six- member ring piperidine derivative or a five-member ring pyrroxamidederivative. The pharmacokinetics of nitroxides are similar to iodinated contrast agents and Gd-DTPA. They do not cross an intact blood brain barrier and undergo glomerular filtration as adominant route of elimination. Their ease of conjugation to various biomolecules makes themattractive for targeting to various organ systems. Nitroxides are chemically stable and showlimited in vivo metabolism. Their relaxation effects in vivo can be eliminated almostimmediately by IV injection of sodium ascorbate, a strong reducing agent. This will allow anunenhanced MR study to be performed immediately after a contrast enhanced study, if thecontrast study is not satisfactory alone.
The early ionic derivatives of piperidine have a 38 minute half-life and a safety ratio of between8:1 and 100:1. Nonionic pyrrolidine derivatives are formulated with a longer half-life of 45-50minute in dogs, estimated to be about 2 hours in humans. The LD50 in mice of this nonionicformulation is about 25 mmol/kg, making it twice as safe as earlier ionic piperidinylpreparations. Mutation and toxicity studies show no evidence of genetic or other cellulardamage in mammalian cell preparations.
Larger molecular weight nitroxides exhibit increased relaxation rates as do paramagnetic ionsattached to macromolecules. This phenomenon occurs when attaching five-membered nitroxiderings to fatty acids. The fatty acids attach to human serum albumin, either in vitro or in vivo,resulting in a significant increase in relaxation rate. Safety studies and clinical trials need to beperformed before nitroxides will be available for use.
Ferrioxamine

Ferrioxamine methanesulfonate is a paramagnetic contrast agent that has undergone phase I andphase II clinical trials for use as an IV and retrograde contrast agent for the kidneys, ureters andbladder. It is more stable than Gd-DTPA, though its relaxivity is somewhat less, as expectedfrom it having 5 unpaired electrons, vs 7 unpaired electrons for Gd-DTPA. 80% is eliminatedby renal excretion and 20% by hepatic excretion. Ferrioxamine undergoes renal excretion byglomerular filtration but is actively reabsorbed in the tubules. This results in a longer plasmahalf-life than Gd-DTPA (128 min. vs 20 min. in rats).
In clinical imaging the long plasma half-life allows enhancement of the kidneys for 60 minuteswith little change in intensity. Significant improvement in detectability of lesions in the kidneysis demonstrated over unenhanced controls. Side effects include epigastric distress and transientburning at the injection site. Increase in serum iron levels and a transient elevation of serumliver enzymes (SGOT/SGPT) have been reported.
Hepatobiliary Contrast Agents
Hepatobiliary contrast agents are desirable for several reasons: to detect mass lesions such asmetastases within the liver; to evaluate functional status of the liver in diffuse hepatocellulardiseases such as cirrhosis; and to obtain high resolution images of the gallbladder and biliarytree.
Three advantages of a hepatobiliary contrast agent over a particulate agent targeted for Kupffercells exist. First of all, there are many more hepatocytes than Kupffer cells (78% vs. 2% byvolume) in the liver, improving uptake efficiency of contrast material. Second, the biliary ductsare opacified by excreted contrast material, eliminating confusion of normal bile ducts fromfocal abnormalities as may occur with particulate agent contrast materials. Third, the contrastagent is rapidly excreted from the body reducing potential toxicity. In contrast, materialsphagocytized by the reticuloendothelial system (including Kupffer cells) remain in the body fora long period of time.
The uptake and excretion of contrast material allows visual assessment of basic hepatocytefunction. The biliary opacification will allow functional information to be obtained as withradionuclide hepatobiliary studies but with significantly higher spatial resolution.
Manganese Chloride Chelates
Manganese Chloride
Manganese chloride (MnCl2) is a prototype hepatobiliary contrast agent. IV and oraladministration in animals results in a rapid decrease in the T1 relaxation time of the liver,spleen, kidneys, heart, and bile causing a bright signal on T1-weighted images. In its ionic state,Mn+2, it is relatively toxic. In imaging doses of 0.2 mmol/kg, it caused severe hypotension andventricular fibrillation in dogs. Cerebral damage results from chronic manganese toxicity. Mn
can be used in the form of a chelate with diminished toxicity for hepatobiliary imaging inhumans.
Hepatobiliary Chelates
Chelates used as hepatobiliary contrast agents consist of a paramagnetic ion bound to anorganic ligand, forming a complex that shows affinity for hepatocytes. This type of complex isdesirable to increase uptake of the contrast agent by the hepatocytes and to reduce toxicity ofthe paramagnetic metal ion as is done with gadolinium. Possible chelates for hepatobiliaryimaging include Fe-EHPG and derivatives, Gd-HIDA, Cr-HIDA, B-19036, and Mn-DPDP.
Fe-EHPG (Iron(III) ethylenebis-(2-hydroxyphenylglycine)) is a structural analog of theradionuclide 99mTc- iminodiacetate (Tc-IDA) used for hepatobiliary imaging in nuclearmedicine. Fe-EHPG is a very stable complex over a large pH range making it likely to benontoxic. Fe-EHPG has been shown to improve visualization of small and medium-sized,blood-borne liver metastases in mice. To my knowledge no clinical studies with this materialhave been performed.
Chromium diethyl HIDA meglumine (Cr-HIDA) is another analog of a hepatobiliaryradiopharmaceutical that has been tested in rats and rabbits. Excretion was 45%-77% after onehour. The dose required to give significant increased signal in the liver (0.25 mmol/kg) resultsin a safety ratio in mice of 6:1, compared to 100:1 for Gadolinium-DTPA. This low ratio forCr-HIDA precludes clinical use.
An octadentate chelate of gadolinium coded B-19036 (Bracco Industria Chimica S.p.A., Milan,Italy) may be used as a hepatobiliary contrast agent. It is a highly stable complex with an LD50in mice comparable to Gd-DTPA. It has yet to be tested in humans.
Manganese(II)-dipyridoxal diphosphate (Mn-DPDP) is a manganese chelate derived fromvitamin B6, pyridoxal-5- phosphate. It shows efficacy in detecting small liver metastases inrabbits and has undergone phase I clinical trials showing it to be safe and effective in enhancingthe signal intensity of the liver. It has a safety ratio of 200:1 in rats which is somewhat betterthan that for Gd-DTPA. Unlike Fe-EHPG and its derivatives whose uptake by hepatocytesdepend on their lipophilic attraction to the cell membrane, Mn-DPDP is recognized by a vitaminB6 transport system in the cell membrane.
Reticuloendothelial Contrast Agents
The use of reticuloendothelial agents will be discussed in terms of liver and spleen imaging andlymph node imaging.
Liver and Spleen Imaging Lymph Node Imaging

Liver and Spleen Imaging
The use of Gd-DTPA with routine imaging sequences of the liver is unsatisfactory. Particulatecontrast agents targeted to the reticuloendothelial system (RES) of the liver and spleen, achievethe goals of improved detection and localization in the liver. This is analogous to the use of99mTc-sulfur colloid in nuclear liver scans.
Two major cell types can be targeted for hepatic imaging. Hepatocytes comprise about 78% ofthe liver by volume, and Kupffer cells of the reticuloendothelial system comprise about 2% byvolume. Originally, particulate contrast agents were targeted for the RES but recentlyultra-small particles have been used that bind to a specific receptor site on the hepatocyte cellmembrane.
Gadolinium Oxide Superparamagnetic Iron Oxide Liposomes
Gadolinium Oxide
Gadolinium oxide is a the prototype particulate contrast agent. This material accumulates in theliver and spleen of rabbits in both Kupffer cells and in the sinusoidal vascular spaces andeffectively increases T1 and T2 relaxation as desired. The safety ratio (LD50/Imaging dose) isonly about 7:1 raising concerns of acute and chronic toxicity. It is therefore precluded fromclinical use.
Superparamagnetic Iron Oxide
As with its use as an oral contrast agent, superparamagnetic iron oxide (SPIO) causes markedshortening T2 relaxation time resulting in a loss of signal in the liver and spleen with allcommonly used pulse sequences. The most common form of iron oxide used is magnetite,which is a mixture of Fe2O3 and FeO. A mixture using Fe3O4 instead of FeO may also be used.Three mechanisms have been postulated to explain the relaxation enhancement of SPIO.
SPIO particles for parenteral use are coated with various substances to facilitate uptake by thereticuloendothelial system. These coatings have included albumin, a hydrophilic polymer,starch, and dextran.
The following problems that can arise with detecting small lesions in the liver using SPIO: 1)Small lesions may be indistinguishable from the flow void in small blood vessels seen incross-section; 2) Aortic pulsation artifacts are more noticeable; and 3) the one hour delaybetween injection and imaging make it impractical to decide at the last minute to give contrast.
Liposomes
A liposome is a spherical vesical consisting of one or more bilayer phospholipid membranes orlamella. Liposomes for hepatic imaging range in size from about 20 nm to 400 nm diameter.
Reasons to use liposomes as a carrier for paramagnetic contrast materials include: 1) changingthe interaction between water molecules and the contrast agent; 2) changing the rate of removalof the contrast agent from the blood pool; and 3) targeting specific organ systems, e.g., liver,spleen, and bone marrow. Paramagnetic materials can be incorporated into either the aqueousinner chamber or the bilayer membrane. Encapsulation of superparamagnetic iron oxideparticles into liposomes (Ferrosomes) has been reported. Both Gd-DTPA and MnCl2 can beencapsulated into the aqueous inner chamber of liposomes.
Liposomes are taken up only by the Kupffer cells. Once in the Kupffer cells, Mn+2 orGd-DTPA is slowly released and diffuses into adjacent hepatocytes, resulting in enhancement ofnormal liver but not malignancies.
Stable nitroxide free radicals have been attached to phospatidylcholine, a common constituentof liposome lamellae. They may also be attached to derivatives of the fatty acid, stearic acid, ashave the DTPA chelates of Mn and Gd. This results in a lipophilic side chain that allowsincorporation into the liposome membrane.
Lymph Node Imaging
Two clinical problems common to CT and MR imaging are: 1) distinguishing unenlargedmetastatic lymph nodes from normal lymph nodes; and 2) differentiating enlarged metastaticnodes from benign hyperplastic nodes. Differentiation of metastases from fibrosis, lipomatosisand cysts is possible with resected lymph nodes in a 4.7T magnet using voxels of size 0.1 by 0.1by 1.0 mm; however, gradient strength and switching capabilities are not adequate in clinicalimagers to obtain the necessary spacial resolution. This inadequacy of clinical imagers iscircumvented by the use of USPIO.
USPIO particles with a mean diameter of 80 nm may be injected into the interstitium of the footpad of rats. After a suitable delay, marked loss of signal of normal lymph nodes is seen.Metastatic nodes show less uptake resulting in less decrease in signal, allowing differentiation ofnormal-sized, metastatic nodes from uninvolved, normal nodes. From experience withconventional lymphangiography, this route of injection is unlikely to opacify all the abdominallymph nodes.
USPIO particles, with a median diameter less than 10 nm, will localize in lymph nodesfollowing an IV injection. This material does not undergo uptake by the RE system as rapidly aslarger particles, resulting in a longer plasma half-life in rats (81 minutes, vs 6 minutes). Thisfactor and its small size allow transcapillary passage either into the interstitium and then to thelymph nodes or directly into the lymph nodes. In the rat model, IV injection of USPIO allowsdifferentiation of normal lymph nodes from normal size metastatic nodes based on differences insignal characteristics. MR microscopy of excised lymph nodes, performed at 9.4T shows theUSPIO to be associated with macrophages in the medullary sinuses.
MR Angiography

Time-of-flight angiography and phase-contrast angiography are the two common MRangiography techniques. Flow related enhancement is the basis of time-of-flight angiography.
Flow-related Enhancement Time-of-flight MR angiography Phase contrast MR angiography
Flow-related Enhancement
Flow-related enhancement is an enhancement of flowing blood seen on gradient echo pulsesequences as well as in entry slices of multslice spin echo sequences. This enhancement is aresult of inflow of unsaturated (completely relaxed) spins into a slice plane or imaging volumebetween RF excitations. Stationary spins within the imaging volume will undergo incompleteT1 relaxation between RF excitations resulting in less signal following the next RF pulse whencompared to inflowing, completely relaxed spins in flowing blood. The distance that theunsaturated blood can extend into an imaging volume and therefore the degree of enhancementis proportional to the TR and the velocity of the blood. The use of gradient motion nulling(flow compensation) improves the flow-related enhancement in gradient echo sequences.
Time-of-Flight MR Angiography
Time-of-flight (TOF) angiography is based on the phenomenon of flow-related enhancement ofspins entering into an imaging slice. As a result of being unsaturated, these spins give moresignal that surrounding stationary spins. With 2-D TOF, multiple thin imaging slices areacquired with a flow-compensated gradient-echo sequence. These images can be combined byusing a technique of reconstruction such as maximum intensity projection (MIP), to obtain a3-D image of the vessels analogous to conventional angiography.
With 3-D TOF, a volume of images is obtained simultaneously by phase-encoding in theslice-select direction. An angiographic appearance can be generated using MIP, as is done with2-D TOF. Several 3-D TOF volumes can be combined to visualize longer segments of vessels.3-D TOF angiography will allow greater spatial resolution in the slice-select direction than 2-DTOF; however, with thick volumes and slow flowing blood, loss of signal is seen with the 3-DTOF method.

Phase-contrast MR Angiography
Spins that are moving in the same direction as a magnetic field gradient develop a phase shiftthat is proportional to the velocity of the spins. This is the basis of phase-contrast angiography.In the simplest phase-contrast pulse sequence, bipolar gradients (two gradients with equalmagnitude but opposite direction) are used to encode the velocity of the spins. Stationary spinsundergo no net change in phase after the two gradients are applied. Moving spins willexperience a different magnitude of the second gradient compared to the first, because of itsdifferent spatial position. This results in a net phase shift. This information can be used directlyto determine the velocity of the spins. Alternatively, the image can be subtracted from oneacquired without the velocity encoding gradients to obtain an angiogram.
MR Spectroscopy
Magnetic resonance spectroscopy (MRS) of intact biological tissues was first reported by twogroups: Moon and Richards using P-31 MRS to examine intact red blood cells in 1973, andHoult et al. using P-31 MRS to examine excised leg muscle from the rat in 1974. Since thenMRS has been applied to almost every organ of the body including brain, heart, liver, kidney,prostate, and extremities. MRS is useful for looking at disorders of metabolism, tumors andcertain inflammatory and ischemic diseases. Most of the work with in vivo MRS in humans hasbeen in the brain. Abnormalities have been seen, sometimes with earlier detection than for anyother diagnostic procedure short of biopsy, in primary brain tumors, infections such as AIDS,demyelinating disorders such as multiple sclerosis, epilepsy, and stroke.Spectroscopic changes are documented in a variety of enzyme deficiencies, mitochondrialabnormalities, dystrophies, inflammatory myopathies, and thyroid disease. In muscle thesediseases include phosphofructokinase deficiency, amyloglucosidase deficiency, Duchennemuscular dystrophy, Becker muscular dystrophy, dermatomyositis, polymyositis, inclusion bodymyositis, hypothyroidism, and congestive heart failure.
How does MRS work?
Magnetic resonance spectroscopy (MRS) is performed with a variety of pulse sequences. Thesimplest sequence consists of a 90 degree RF pulse without any gradients with reception of thesignal by the RF coil immediately after the single RF pulse. Many sequences used for imagingcan be used for spectroscopy also (such as the spin echo sequence). The important differencebetween an imaging sequence and a spectroscopy sequence is that for spectroscopy, a read outgradient is not used during the time the RF coil is receiving the signal from the person or objectbeing examined. Instead of using the frequency information (provided by the read out orfrequency gradient) to provide spatial or positional information, the frequency information isused to identify different chemical compounds. This is possible because the electron cloudsurrounding different chemical compounds shields the resonant atoms of spectroscopic interestto varying degrees depending on the specific compound and the specific position in thecompound. This electron shielding causes the observed resonance frequency of the atoms to

slightly different and therefore identifiable with MRS.
Special Topics
Recent developments in MRI that should have significant contributions to MRI include thefollowing:
Magnetization Transfer Contrast Functional MRI
Magnetization Transfer
Contrast Magnetization transfer techniques use an off resonance RF pulse to saturate protons inmacromolecules and water molecules that are bound to macromolecules and are normally notvisible due to their very short T2* relaxation times (See Figure). During the pulse sequence, thesaturated protons may enter the free pool of protons, primarily water, or may transfer theirmagnetization to free water protons. The effect of this is to cause a decrease in the MR visiblesignal in areas of macromolecules effected by magnetization transfer. This provides anadditional source of tissue contrast for imaging, particularly of the brain. One use ofmagnetization transfer is to reduce the signal from brain tissue during MR angiography, therebyimproving vessel delineation. Areas of demyelinaton on T2-weighted images and areas onenhancement with gadolinium contrast agents on T1-weighted images way be more visible withmagnetization transfer techniques.
Functional MRI
Functional MRI (FMRI) is a technique that has recently been introduced to obtain functionalinformation from the central nervous system. FMRI detects subtle increases in blood flowassociated with activation of parts of the brain. FMRI may be useful for preoperativeneurosurgical planning, epilepsy evaluation, and "mapping" of the brain.

How does FMRI work?
Activation of an area of the brain causes an increase in blood flow to that area that is greaterthan that needed to keep up with the oxygen demands of the tissues. This results in a netincrease in intravascular oxyhemogobin and a decrease in deoxyhemoglobin. Deoxyhemoglobinis paramagnetic, resulting in shorting of the T2* of the brain and decrease in signal. Lessdeoxyhemoglobin as a result of increase in blood flow results in an overall increase in signal.Sophisticated image processing techniques are used to obtain images of these flow changes.The increase in signal detected ranges from 1-5% on a 1.5T MR system.
Glossary This is a list of some of the commonly used terms in MRI.
A-E F-J K-O P-T U-Z
A-E
Adiabatic RF Pulses
Adiabatic pulses are special RF pulses used when the RF field is inhomogeneous, as one mightsee with using a surface coil rather than a volume coil for excitation of spins. The flip anglesproduced with conventional RF pulses are sensitive to the B1 or RF field homogeneity. The flipangles produced with adiabatic pulses are relatively insensitive. These special pulses areproduced by sweeping the frequency of an irradiating RF pulse through the Larmor frequency.Conventional pulses use a constant frequency pulse at the Larmor frequency. The disadvantageof adiabatic pulses are that they are more difficult to produce and they take more time toproduce the desired flip angle.
Annotation
The description of the imaging factors used during an imaging acquisition, commonly printedaround the border of MR images. These factors may include repetition time, echo time, numberof averages, field of view, acquisition matrix size, and slice thickness.
Array processor
An array processor is a common accessory to the computer system of an MRI machine. Itfunctions to speed up numeric calculations, such as the Fourier transformation used toreconstruct images and spectra.
B1
B1 is the symbol used to represent the radio frequency field of the MRI system. The B1 field isproduced by the RF coil at the Larmor frequency.

Bloch equations
The bloch equations are used in the classical physics description of the behavior of themacroscopic magnetization vectors.
Bo
Bo (B zero) is the symbol used to represent the constant (main) magnetic field of the MRIsystem. It is usually expressed in units of Tesla (10,000 gauss or about 20,000 times themagnetic field of the earth).
Dewar
An insulated container for holding liquified gases, i.e., cryogens. May also be called a cryostat.
Didjeridoo
A musical instrument invented by the aborigines of Australia. It is constructed from a hollowedout log and makes a single tone.
F-J
FID
Free induction decay. This is the sinusoidal signal generated by spins in the x-y plane thatdecays exponentially with time.
Faraday Shield
An electrical conductor such as a copper mesh or an aluminum sheet that is used to block outelectric fields. Most MRI rooms are surrounded by a Faraday shield to keep radio waves fromcoming into the room, and MR radio waves from leaving the room.
Fourier Transform (FT)
A mathematical procedure used in MR that converts a time-domain signal into a frequency- orspatial-domain signal or image. It is analogous to the way that our ear distinguishes or separatesout separate sounds or frequencies from noise we hear. Our eyes do not work this way. If wesee a mixture of blue and yellow we see the color green, not the original blue and yellow.
Gradient Amplifier
A gradient amplifier supplies power to a set of gradient coils, providing the variation inmagnetic field strength required to obtain images and perform localization. MRI systemstherefore require three gradient amplifiers, one for each set of gradient coils: x, y, and z.Gradient amplifier may use large amount of power and frequently require cooling with chilledwater or forced air flow.
K-O
K-space
K-space is an imaginary space whose coordinates are in terms of phase and frequency for

conventional imaging and in terms of phase in 2 or 3 dimensions for 2-D and 3-D chemical shiftimaging. The K-space matrix is to obtain the familiar spatial dimensions.
Larmor frequency
The Larmor frequency is the frequency or rate of precession of the nuclear magnetic moment(spins) and is proportional to the magnetic field strength as shown in the Larmor equation: f=-gBo/2pi where f is the Larmor frequency in Hertz, g is the gyromagnetic ratio of the nucleus,and Bo is the magnetic field strength.
P-T
Phantom
A phantom is an object of known size and composition (such as a bottle of saline) that is usedto test the functioning of an MRI machine.
Pixel
An abbreviation for "picture element"; the rectangles or squares that make up a digital image inMRI, CT, digital fluoroscopy and radiography.
Quench
Unexpected loss of superconductivity in a superconducting magnet that causes heating and veryrapid vaporization of the cryogens such as liquid helium. This can cause damage to the magnetand can force the atmosphere out of the scanner room potentially causing anoxic conditions.
RF Transmitter
The RF transmitter in an MRI scanner is a mini radio station that include an amplifier andtuning circuits that supply radio frequency power to the RF coil inside the magnet. RFtransmitters in whole body imagers are commonly rated at about 20kW; comparable in powerto an actual radio station.
Spin density
The density of resonating spins, e.g. protons, in a region of interest. "Proton density" spin echoimages come close to imaging the spin density.
Superconductor
A substance, usually a metal alloy, whose electrical resistance abruptly drops to zero at lowtemperatures. MRI magnets commonly use titanium-niobium wires imbedded in a larger copperwire that is cooled with liquid helium to about 4 degrees absolute. The copper acts to conductaway heat in case a occurs and also acts as an insulator at superconducting temperatures.
U-Z
Unicorn
A mythical creature that looks like a horse with a single horn on it's forehead.

Vector
A vector is a quantity having both magnitude and direction, that is frequently represented withan arrow.
Voxel
An abbreviation for volume element; a three dimensional rectangular solid contributing signal tothe intensity of a in an image.
References These references are not intended to be an exhaustive list but to give a few commonly availabletexts and articles that cover the subjects. The areas that each reference cover are included inparentheses after the reference.
Magnetic Resonance Imaging by Stark and Bradley, second edition (Artifacts, Basics,Contrast Agents, Instrumentation, Pulse Sequences, Spectroscopy). Magnetic resonance imaging artifacts: Mechanism and clinical significance by Pusey et al.RadioGraphics, September, 1986 (Artifacts). Clinical Magnetic Resonance Imaging and Spectroscopy by Andrew et al. (Basics,Spectroscopy). The Essential Physics of Medical Imaging by Bushberg et al. (Basics). Christensen's Physics of Diagnostic Radiology, fourth edition (Basics). Abdominal Magnetic Resonance Imaging by Ros and Bidgood (Contrast Agents,Instrumentation and RF Coils). Fast-Scan Magnetic Resonance Principles and Applications by Felix Wehrli (PulseSequences). Safety Considerations in MR Imaging by Kanal et al. Radiology 176:593-606, 1990(Safety). Dynamic magnetic resonance imaging of human brain activity during primary sensorystimulation by Kwong et al. Proc. Natl. Acad. Sci. USA, June 1992 (Functional BrainImaging). Questions and Answers in Magnetic Resonance Imaging by Elster (Artifacts, Basics,Magnetization Transfer, Safety).
Copyright © 1994-1998 Ray Ballinger, All Rights Reserved. Send questions and comments to Ray Ballinger at mridoc@ ufl.eduURL: http://ballingerr.xray.ufl.edu/mritutor/index.htmlLast Modified: September 22, 1998