Embed Size (px)
Citation preview
Introduction to CSAC EIAIntroduction to CSAC EIAIntroduction to CSAC EIAIntroduction to CSAC EIAEIAHealth & EIA Dental ProgramEIAHealth & EIA Dental Program
Joint Labor Management Benefits CommitteeJoint Labor Management Benefits Committee
Tom Sher, First Vice President - Alliant Insurance ServicesCatharine Mauldin, Employee Benefits Manager – CSAC EIA
October 20, 2011
Copyright © 2011 Alliant Insurance Services, Inc. Confidential; not for distribution 1

CSAC-EIA EIAHealth & EIA DentalTable of Contents
Section 1: EIAHealth OverviewSection 2: EIAHealth Benefits AdministrationSection 3: EIAHealth Plan Design and FlexibilitySection 4: CSAC-EIA - Alliant’s RoleSection 5: EIAHealth Program Advantages for Sonoma CountySection 6: EIAHealth Rating MethodologySection 6: EIAHealth Rating MethodologySection 7: Sonoma County - Demographic AnalysisSection 8: EIAHealth Implementation TimelineSection 9: CSAC-EIA Dental Program OverviewgSection 10: Sonoma County – Dental Plan OverviewSection 11: Delta Dental PPO + PremierSection 12: CSAC-EIA Dental Financial Analysis
Exhibit A: EIAHealth Renewal Rating Methodology
Copyright © 2011 Alliant Insurance Services, Inc. Confidential; not for distribution 2

Section 1: CSAC-EIA EIAHealthOverview
EIAHealth is a Joint Purchasing Program that offers:Savings from self-insurance and wholesale insurance purchasingGuaranteed monthly rates based on shared risk approachy ppGovernance by public employers
EIAHealth has been offered to Counties, Cities and Special Districts since 2003
EIAHealth is one of the largest pooled purchasing alternatives to CalPERS
Membership has grown to over 18 000 employees in 2011Membership has grown to over 18,000 employees in 2011
EIAHealth is a “Good-Risk Pool” Only groups that meet established underwriting requirements are quotedy g p g q q
Combined risk pool of over 80,000 employeesCSAC-EIA EIAHealth pools risk by contract with SISC (Self Insured Schools of California)
Copyright © 2011 Alliant Insurance Services, Inc. Confidential; not for distribution 3
p y ( )CSAC-EIA and SISC cover over 380 employers in 40 CountiesSecond largest purchasing coalition in the state after CalPERS

Section 1: CSAC-EIA EIAHealthEIAHealth Member List
EIAHealth Members Member Since Number of Employees/Retirees(estimated)
Merced County 7/1/2003 3,000Tehama County 7/1/2003 700Calaveras County 1/1/2004 360City of Visalia 1/1/2005 760City of Merced 10/1/2005 700City of Santa Rosa 7/1/2006 490Small Group Programs * 8/1/2006 1,650City of Redding 5/1/2007 1,080City of Irvine 1/1/2008 700City of Yuba City 1/1/2008 200Santa Barbara County 1/1/2010 4,700City of Huntington Beach 1/1/2010 460City of Oceanside 1/1/2010 650Superior Court Santa Barbara 1/1/2010 300Lake County 1/1/2011 800Superior Court Riverside 1/1/2011 350pCity of Chico 2/1/2011 460El Dorado County 7/1/2011 900Turlock Irrigation District 1/1/2012 500Total 18,760
* Small Group Programs includes:County of SierraCounty of SierraGolden State Risk Management Authority (GSRMA)Special District Risk Management Authority (SDRMA)Otay Water DistrictShasta Superior CourtStanislaus Superior CourtCity of AtascaderoPlacer Superior Court
Copyright © 2011 Alliant Insurance Services, Inc. Confidential; not for distribution 4
pEl Dorado Superior Court
City of Oroville
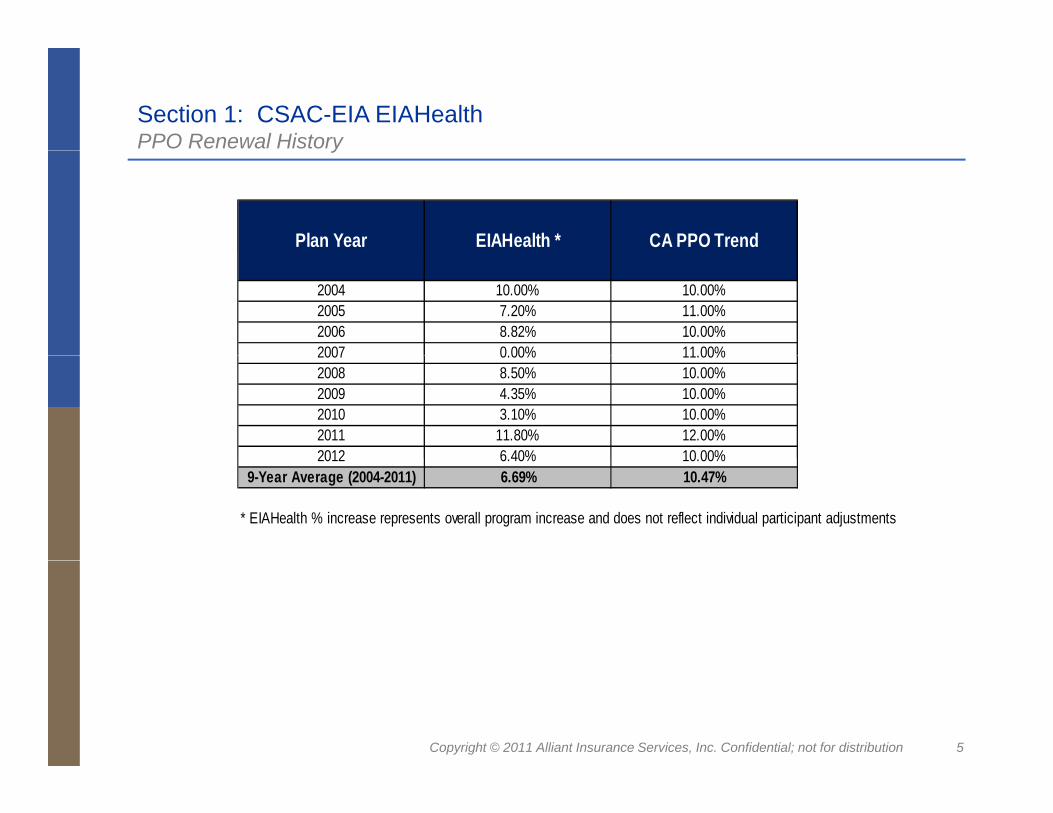
Section 1: CSAC-EIA EIAHealthPPO Renewal Historyy
Plan Year EIAHealth * CA PPO Trend
2004 10.00% 10.00%2005 7.20% 11.00%2006 8.82% 10.00%2007 0 00% 11 00%2007 0.00% 11.00%2008 8.50% 10.00%2009 4.35% 10.00%2010 3.10% 10.00%2011 11.80% 12.00%2012 6 40% 10 00%2012 6.40% 10.00%
9-Year Average (2004-2011) 6.69% 10.47%
* EIAHealth % increase represents overall program increase and does not reflect individual participant adjustments
Copyright © 2011 Alliant Insurance Services, Inc. Confidential; not for distribution 5
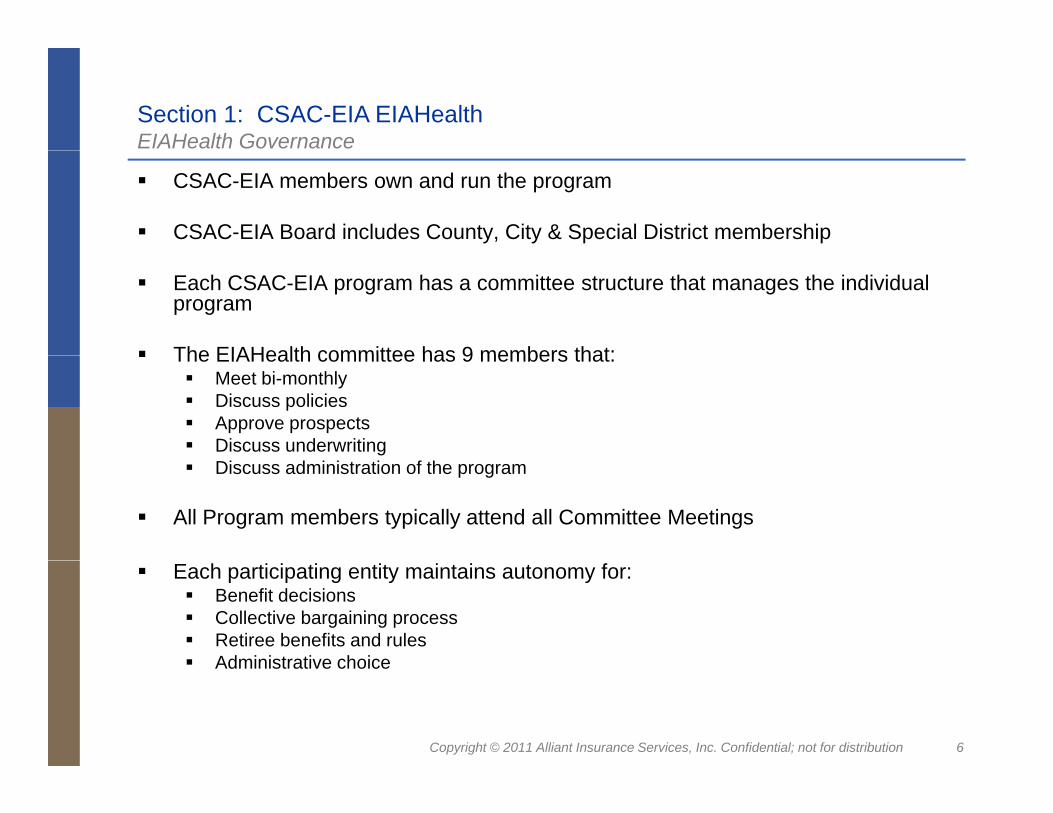
Section 1: CSAC-EIA EIAHealthEIAHealth Governance
CSAC-EIA members own and run the program
CSAC-EIA Board includes County, City & Special District membership
Each CSAC-EIA program has a committee structure that manages the individual program
The EIAHealth committee has 9 members that:The EIAHealth committee has 9 members that:Meet bi-monthlyDiscuss policiesApprove prospectsDiscuss underwriting Discuss administration of the program
All Program members typically attend all Committee Meetings
Each participating entity maintains autonomy for:Benefit decisionsCollective bargaining processRetiree benefits and rulesAdministrative choice
Copyright © 2011 Alliant Insurance Services, Inc. Confidential; not for distribution 6
Administrative choice
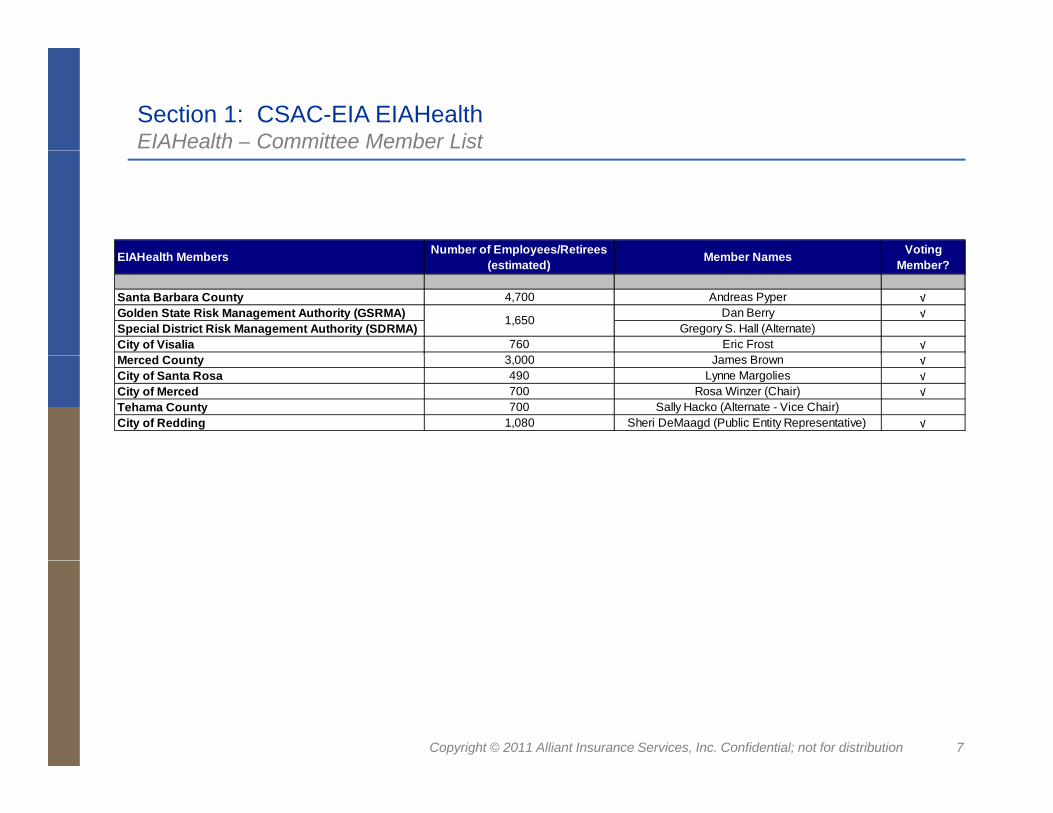
Section 1: CSAC-EIA EIAHealthEIAHealth – Committee Member List
EIAH lth M b Number of Employees/Retirees M b N VotingEIAHealth Members Number of Employees/Retirees(estimated) Member Names Voting
Member?
Santa Barbara County 4,700 Andreas Pyper √Golden State Risk Management Authority (GSRMA) Dan Berry √Special District Risk Management Authority (SDRMA) Gregory S. Hall (Alternate)City of Visalia 760 Eric Frost √
C 3 000 J B
1,650
Merced County 3,000 James Brown √City of Santa Rosa 490 Lynne Margolies √City of Merced 700 Rosa Winzer (Chair) √Tehama County 700 Sally Hacko (Alternate - Vice Chair)City of Redding 1,080 Sheri DeMaagd (Public Entity Representative) √
Copyright © 2011 Alliant Insurance Services, Inc. Confidential; not for distribution 7

Section 2: CSAC-EIA EIAHealthBenefits Administration
The EIAHealth Program fully-funded rates include full benefits administration including:
Eligibility MaintenanceC lid t d BilliConsolidated BillingRetiree Billing & AdministrationCOBRA AdministrationFlexible Spending Account Administration
Copyright © 2011 Alliant Insurance Services, Inc. Confidential; not for distribution 8
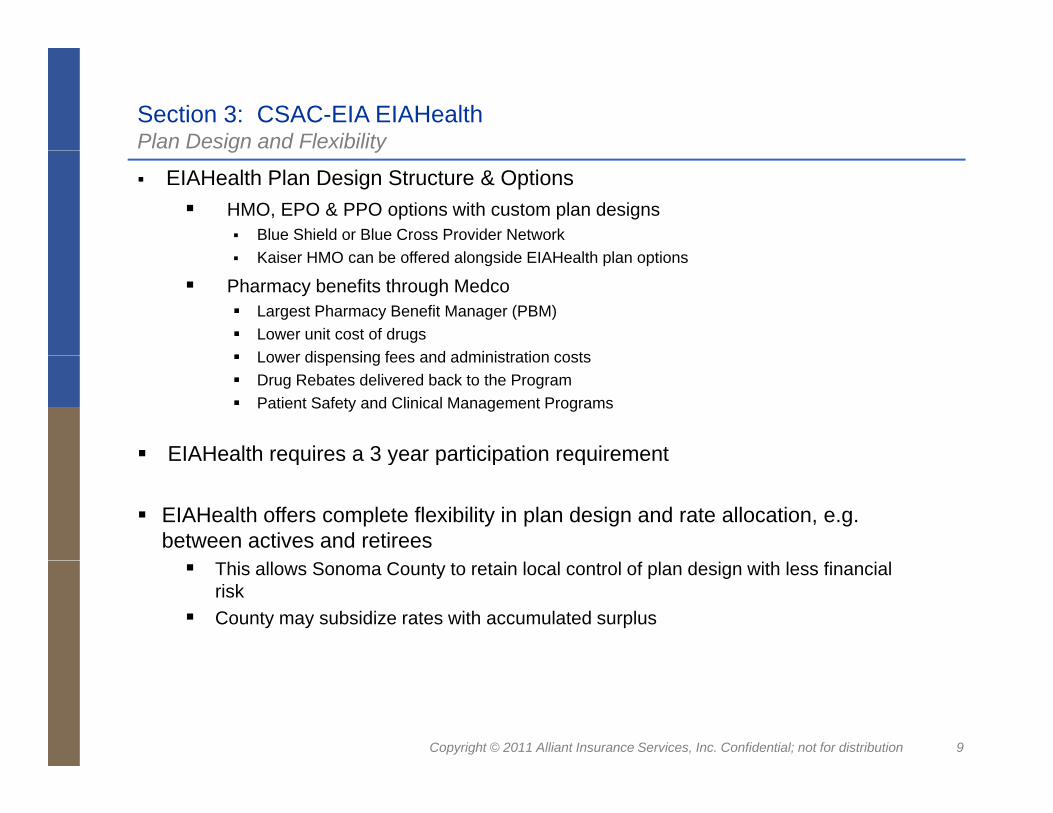
Section 3: CSAC-EIA EIAHealthPlan Design and Flexibility
EIAHealth Plan Design Structure & OptionsHMO, EPO & PPO options with custom plan designs
Blue Shield or Blue Cross Provider NetworkK i HMO b ff d l id EIAH lth l ti
g y
Kaiser HMO can be offered alongside EIAHealth plan options
Pharmacy benefits through MedcoLargest Pharmacy Benefit Manager (PBM)Lower unit cost of drugs Lower dispensing fees and administration costsLower dispensing fees and administration costsDrug Rebates delivered back to the ProgramPatient Safety and Clinical Management Programs
EIAHealth requires a 3 year participation requirementEIAHealth requires a 3 year participation requirement
EIAHealth offers complete flexibility in plan design and rate allocation, e.g. between actives and retirees
This allows Sonoma County to retain local control of plan design with less financial riskCounty may subsidize rates with accumulated surplus
Copyright © 2011 Alliant Insurance Services, Inc. Confidential; not for distribution 9
Section 4: CSAC-EIA EIAHealthWhat is Alliant’s Role in the EIAHealth Program?What is Alliant s Role in the EIAHealth Program?Alliant Insurance Services Role:
31 year consulting relationship with EIA
Scope of work includes:
Create, build and negotiate wholesale insurance programs available to all participating
members
Provide advice, service and recommendations to participating employers
Underwriting
Marketing supportMarketing support
Support EIA committee meetings
Provide implementation, vendor management and service support
Alliant receives revenue from EIA for Underwriting and Program Management services
Copyright © 2011 Alliant Insurance Services, Inc. Confidential; not for distribution 10

Section 5: CSAC-EIA EIAHealthEIA Health – Program Advantages – Sonoma County
In EIAHealth the County will pay fully-insured equivalent ratesEliminates the need for an Incurred-But-Not-Reported (IBNR) claims reserve
After claims run-out, the balance of IBNR reserves become available
g g y
IBNR is included in the EIAHealth fully-insured equivalent rates, so the County no longer has to budget, maintain or report on IBNR
Eliminates requirement for a separate stop loss insurance contractWith EIAHealth Stop Loss is included in the fully insured equivalent ratesWith EIAHealth, Stop Loss is included in the fully insured equivalent rates
Large claims are pooled with 80,000 members
Billing & Eligibility Administration Included in the EIAHealth ratesThe County can choose to have all lines of coverage included in the Benefits Administration platform
COBRA/FSA Administration Included in the County’s EIAHealth ratesThe County can choose to have COBRA Administration included for all other lines of coverage
Copyright © 2011 Alliant Insurance Services, Inc. Confidential; not for distribution 11
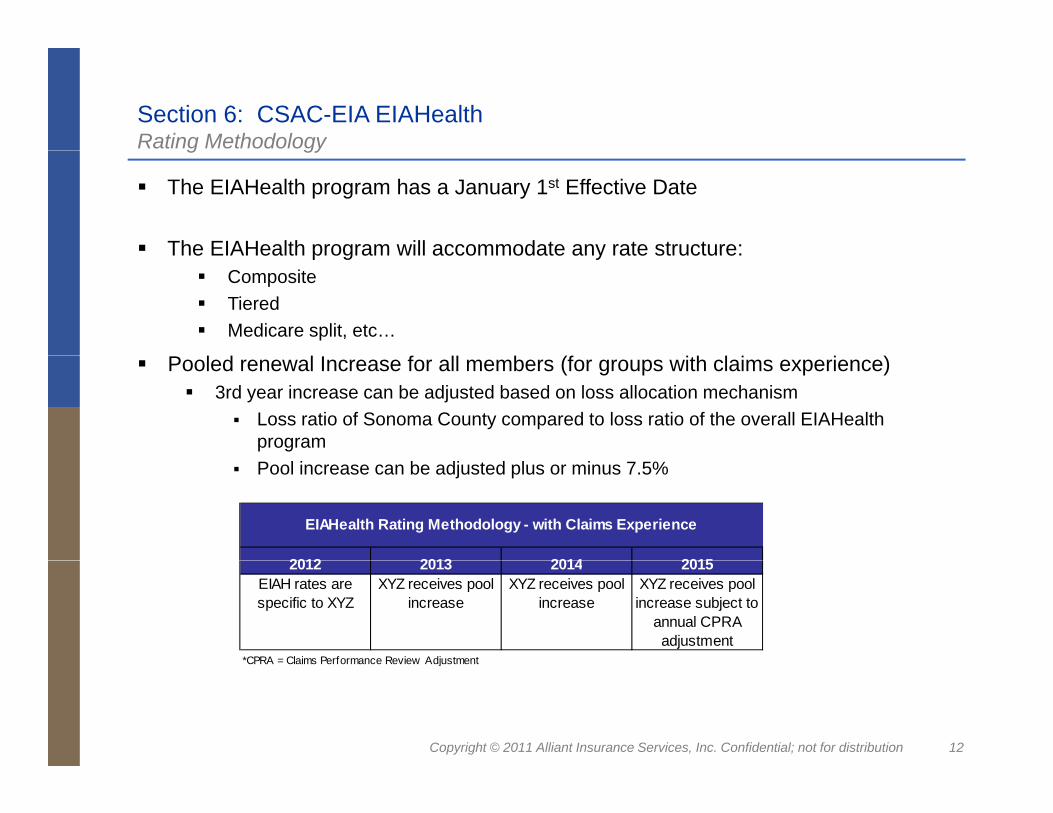
Section 6: CSAC-EIA EIAHealthRating Methodology
The EIAHealth program has a January 1st Effective Date
The EIAHealth program will accommodate any rate structure:
g gy
The EIAHealth program will accommodate any rate structure:CompositeTieredMedicare split, etc…
Pooled renewal Increase for all members (for groups with claims experience)3rd year increase can be adjusted based on loss allocation mechanism
Loss ratio of Sonoma County compared to loss ratio of the overall EIAHealth programPool increase can be adjusted plus or minus 7.5%
2012 2013 2014 2015
EIAHealth Rating Methodology - with Claims Experience
2012 2013 2014 2015EIAH rates are specific to XYZ
XYZ receives pool increase
XYZ receives pool increase
XYZ receives pool increase subject to
annual CPRA adjustment
*CPRA = Claims Performance Review Adjustment
Copyright © 2011 Alliant Insurance Services, Inc. Confidential; not for distribution 12
CPRA Claims Performance Review Adjustment

Section 7: Sonoma CountyPlan Enrollment Distribution
Demographics By Plan
Plan ActiveRetirees under 65
Retirees Over 65 Retirees Gender
enrolled enrolled enrolled % of enrolled Average Age Contract Size Under 65 M FCounty Plan ‐ PPO 347 559 975 1881 32.1% 66 1.37 30% 42% 58%
AARP 0 2 77 79 1 3% 71 1 40 3% 37% 63%
Enrollment by Plan
Total Enrolled in each plan
AARP 0 2 77 79 1.3% 71 1.40 3% 37% 63%County Plan ‐ EPO 66 50 8 124 2.1% 55 1.90 40% 48% 52%County Plan ‐HDHP 1 0 0 1 0.0% 50 1.00 0% 0% 100%
KAISER 2594 617 4 3215 54.9% 48 1.99 19% 45% 55%Kaiser Medicare 0 70 483 553 9.4% 70 1.42 13% 44% 56%
Total: 3008 1298 1547 5853 All plans: 1.73 22%
Retirees Retirees overEnrolled: Active
Retirees under 65
Retirees over 65
% 51% 22% 26%
Gender
ActiveRetirees under 65
Retirees Over 65 Total Waived Average Age
Retirees Under 65 M F
Total Waived ‐ Analysis
g gWaived 316 0 0 316 47 0% 33% 67%
Total Enrolled:Total Waivers:
Total Group Si e/Total Eligible
Group as a whole
3166169
5853
Group Totals
Total Group Size/Total Eligible:Current Participation %: 95%
6169
Copyright © 2011 Alliant Insurance Services, Inc. Confidential; not for distribution 13
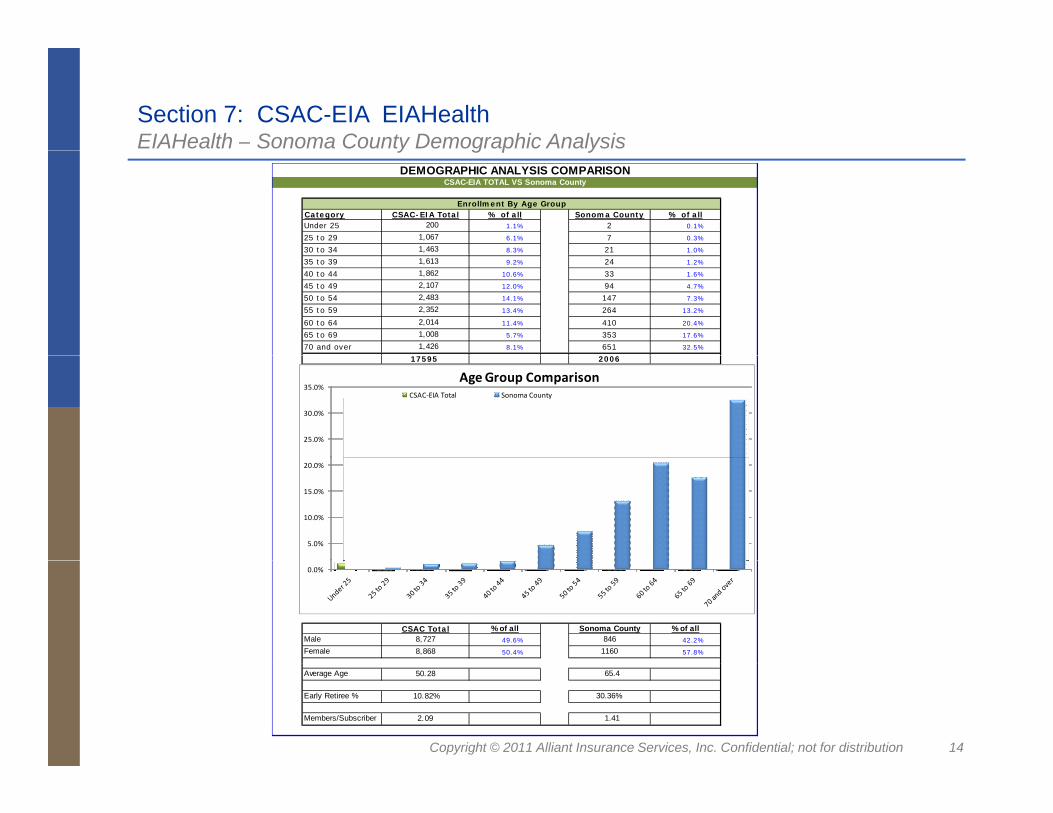
Section 7: CSAC-EIA EIAHealthEIAHealth – Sonoma County Demographic Analysis y g p y
DEMOGRAPHIC ANALYSIS COMPARISONCSAC-EIA TOTAL VS Sonoma County
Enrollment By Age GroupCategory CSAC-EIA Total % of all Sonoma County % of all
25 Under 25 200 1.1% 2 0.1%
25 25 to 29 1,067 6.1% 7 0.3%
30 30 to 34 1,463 8.3% 21 1.0%,
35 35 to 39 1,613 9.2% 24 1.2%
40 40 to 44 1,862 10.6% 33 1.6%
45 45 to 49 2,107 12.0% 94 4.7%
50 50 to 54 2,483 14.1% 147 7.3%
55 55 to 59 2,352 13.4% 264 13.2%
60 60 to 64 2,014 11.4% 410 20.4%
65 65 to 69 1,008 5.7% 353 17.6%
70 70 and over 1,426 8.1% 651 32.5%
17595 2006
25.0%
30.0%
35.0%Age Group Comparison
CSAC‐EIA Total Sonoma County
5.0%
10.0%
15.0%
20.0%
CSAC Total % of all Sonoma County % of allMale 8,727 49.6% 846 42.2%
Female 8,868 50.4% 1160 57.8%
0.0%
Copyright © 2011 Alliant Insurance Services, Inc. Confidential; not for distribution 14
Average Age 50.28 65.4
Early Retiree % 10.82% 30.36%
Members/Subscriber 2.09 1.41
Section 7: CSAC-EIA EIAHealthQuote Caveats – Sonoma Countyy
Final acceptance of Sonoma County into the EIAHealth Program is subject to approval by the EIAHealth Program Committee
Most recent possible claims and enrollment data will be requiredp qThe Committee will review enrollment for all County plans including Kaiser prior to final rate setting
Firm rates ill be pro ided in 2012 pon Committee appro alFirm rates will be provided in 2012 upon Committee approval
Copyright © 2011 Alliant Insurance Services, Inc. Confidential; not for distribution 15

Section 7: CSAC-EIA EIAHealthKaiser vs. County Plan
Enrollment By Age GroupCategory Kaiser Population % of all County_Plans % of allUnder 25 14 0.4% 2 0.1%
25 to 29 156 4.1% 7 0.3%
30 to 34 309 8.2% 21 1.0%
35 to 39 319 8.5% 24 1.2%
40 to 44 425 11.3% 33 1.6%40 to 44 11.3% 33 1.6%
45 to 49 465 12.3% 94 4.7%
50 to 54 498 13.2% 147 7.3%
55 to 59 561 14.9% 264 13.2%
60 to 64 494 13.1% 410 20.4%
65 to 69 261 6.9% 353 17.6%
70 and over 266 7.1% 651 32.5%
3768 2006
25.0%
30.0%
35.0%Age Group Comparison
Kaiser Population County_Plans
5.0%
10.0%
15.0%
20.0%
Kaiser Total % of all County_Plans % of allMale 1,705 45.2% 846 42.2%
Female 2,063 54 8% 1160 57 8%
0.0%
Copyright © 2011 Alliant Insurance Services, Inc. Confidential; not for distribution 1616
Female 2,063 54.8% 1160 57.8%
Average Age 51.1 65.4
Early Retiree % 18.23% 30.36%
Members/Subscriber 1.90 1.41

Section 7: Possible Evolution of Plan Costs: 2011-2012
PEPY
Copyright © 2011 Alliant Insurance Services, Inc. Confidential; not for distribution 1717
Section 8: CSAC-EIA EIAHealthEIAHealth – Implementation Timeline – Sonoma County p y
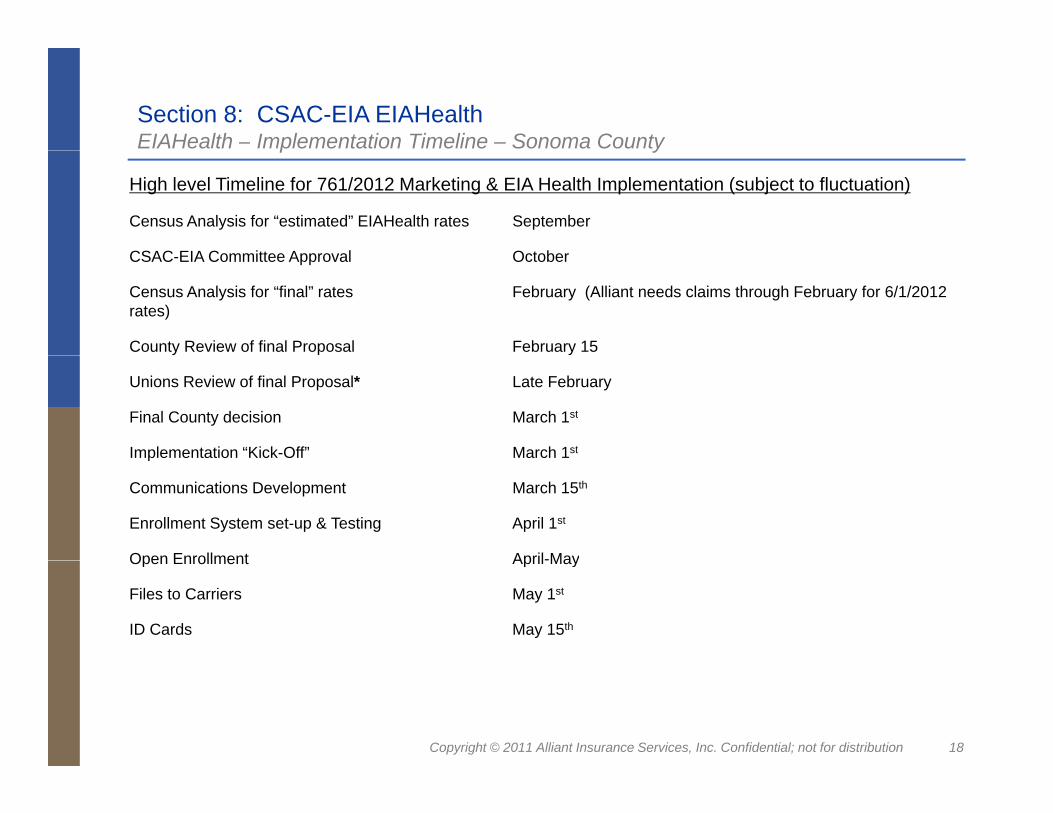
High level Timeline for 761/2012 Marketing & EIA Health Implementation (subject to fluctuation)
Census Analysis for “estimated” EIAHealth rates September
CSAC EIA C itt A l O t bCSAC-EIA Committee Approval October
Census Analysis for “final” rates February (Alliant needs claims through February for 6/1/2012 rates)
County Review of final Proposal February 15
Unions Review of final Proposal* Late February
Final County decision March 1st
Implementation “Kick-Off” March 1stp e e a o c O a c
Communications Development March 15th
Enrollment System set-up & Testing April 1st
Open Enrollment April-MayOpen Enrollment April-May
Files to Carriers May 1st
ID Cards May 15th
Copyright © 2011 Alliant Insurance Services, Inc. Confidential; not for distribution 18

Section 9: CSAC-EIA Dental Program Overview
Currently, the County is fully insured with Delta Dental
The County’s Dental benefit for Active Employees is the Delta Dental PremierThe County s Dental benefit for Active Employees is the Delta Dental Premier Plan
The County’s Dental benefit for Retirees is the Straight PPO Plan with Delta Dental
Alliant was tasked with obtaining a CSAC-EIA Delta Dental quote for the County for the 2012 plan yearfor the 2012 plan year
CSAC-EIA provides Delta’s lowest administrative feesOver 100 public agencies participate representing over 60,000 public agency employeesSonoma County employees and retirees have the flexibility to visit any licensed dentistSonoma County employees and retirees have the flexibility to visit any licensed dentist
A Delta Dental PPO dentistA Delta Dental Premier dentistA dentist who does not participate with Delta Dental
Copyright © 2011 Alliant Insurance Services, Inc. Confidential; not for distribution 1919
Section 9: CSAC-EIA Dental Program Overview
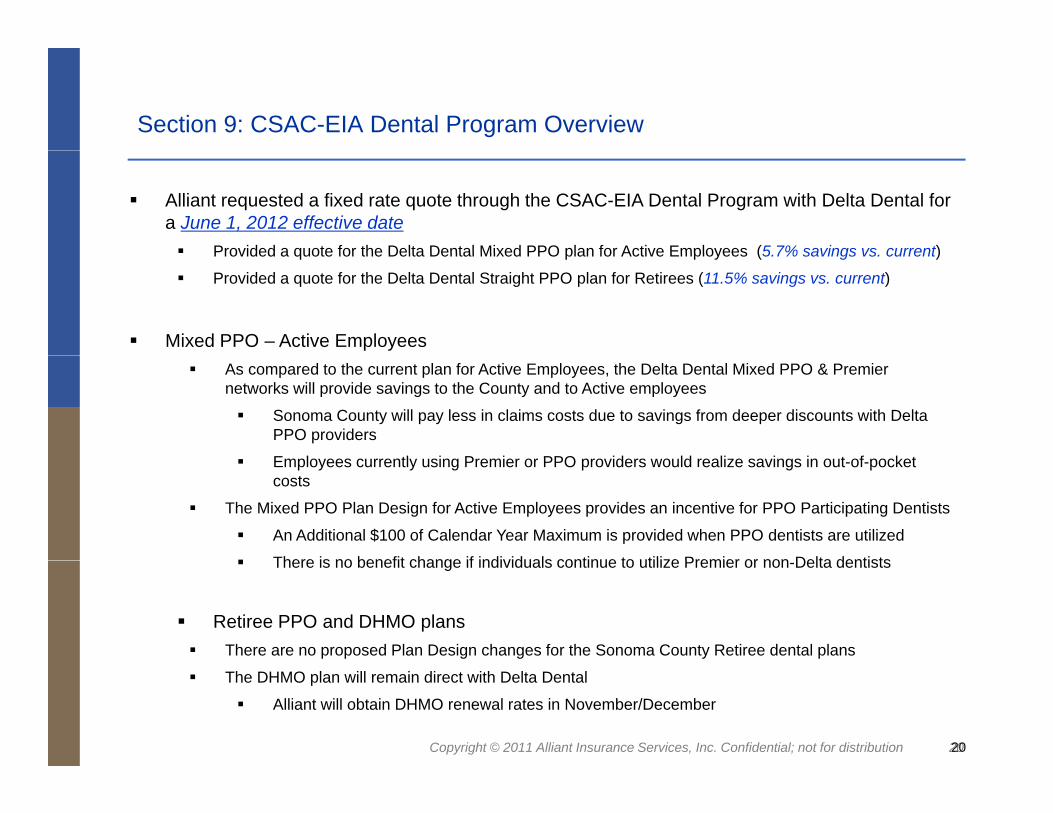
Alliant requested a fixed rate quote through the CSAC-EIA Dental Program with Delta Dental for a June 1, 2012 effective date
Provided a quote for the Delta Dental Mixed PPO plan for Active Employees (5 7% savings vs current)Provided a quote for the Delta Dental Mixed PPO plan for Active Employees (5.7% savings vs. current)
Provided a quote for the Delta Dental Straight PPO plan for Retirees (11.5% savings vs. current)
Mixed PPO – Active EmployeesAs compared to the current plan for Active Employees, the Delta Dental Mixed PPO & Premier networks will provide savings to the County and to Active employees
Sonoma County will pay less in claims costs due to savings from deeper discounts with Delta PPO providers
E l tl i P i PPO id ld li i i t f k tEmployees currently using Premier or PPO providers would realize savings in out-of-pocket costs
The Mixed PPO Plan Design for Active Employees provides an incentive for PPO Participating Dentists
An Additional $100 of Calendar Year Maximum is provided when PPO dentists are utilized
There is no benefit change if individuals continue to utilize Premier or non Delta dentistsThere is no benefit change if individuals continue to utilize Premier or non-Delta dentists
Retiree PPO and DHMO plansThere are no proposed Plan Design changes for the Sonoma County Retiree dental plans
Copyright © 2011 Alliant Insurance Services, Inc. Confidential; not for distribution 20
The DHMO plan will remain direct with Delta Dental
Alliant will obtain DHMO renewal rates in November/December
20

Section 10: Sonoma County Plan DesignsDelta Dental Premier- Actives
Dental Benefits Delta Dental Premier
Actives - Division 1124
Current
Renews June 2012Calendar Year Maximum $3,000Calendar Year Deductible NoneIndividual (Waived for Preventive)Diagnostic and Preventive 80%Oral Exam X-RaysTeeth Cleaning Basic ServicesAmalgam/Composite FillingsSealants
80%
Periodontics (Gum disease)Endodontics (Root Canal)Extractions & Other Oral SurgreyMajor ServicesCrown RepairRestorative - Inlays and Crowns
80%
Restorative Inlays and CrownsComplex Oral SurgeryProsthodonticsAll Prosthodontic (including Implants)OrthodonticsAdult and Child(ren) 50%O h C l d Y M i $3 000
80%
Copyright © 2011 Alliant Insurance Services, Inc. Confidential; not for distribution 2121
Ortho Calendar Year Maximum $3,000

Section 10: Sonoma County Plan DesignsDelta Dental Straight PPO- Retirees
Dental Benefits Delta Dental Straight PPO
Retirees Renews June 2012
Current
Renews June 2012PPO Premier / Non-Delta
Calendar Year Maximum $1,000 $1,000Calendar Year Deductible $50Individual (Waived for Preventive)Di ti d P ti 100% 100%Diagnostic and Preventive 100% 100%Oral Exam X-RaysTeeth Cleaning Basic Services 80% 80%Amalgam/Composite FillingsSealantsPeriodontics (Gum disease)Endodontics (Root Canal)Extractions & Other Oral SurgreyMajor Services 50% 50%Crown RepairpRestorative - Inlays and CrownsComplex Oral SurgeryProsthodonticsAll Prosthodontic (including Implants) 50% 50%OrthodonticsAdult and Child(ren) N/A
Copyright © 2011 Alliant Insurance Services, Inc. Confidential; not for distribution 2222
* Out of network benefits payment based on Delta Dental’s PPO regionalized fee allowance.
Adult and Child(ren) N/A

Section 10: Sonoma County Plan DesignsDelta Dental DHMO- Retirees
Current
Dental Benefits Delta Dental DHMO
RetireesRenews June 2012Renews June 2012
Deductible $0Diagnostic and Preventive 100%Oral Exam X-RaysyTeeth Cleaning Basic Services 100%Amalgam/Composite FillingsSealantsPeriodontics (Gum disease)Endodontics (Root Canal)( )Extractions & Other Oral SurgreyMajor Services $0 - $90Crown RepairRestorative - Inlays and CrownsComplex Oral SurgeryProsthodonticsAll Prosthodontic (including Implants) $10 - $175Orthodontics*Child $1,600Adult $1,800
Copyright © 2011 Alliant Insurance Services, Inc. Confidential; not for distribution 2323
*For 24-month treatment, plan pays 100% thereafter. $75/month member copay for treatment after 24 months.
Section 11: Delta Dental PPO Plus Premier OverviewSonoma County Current PPO Utilization- ACTIVES
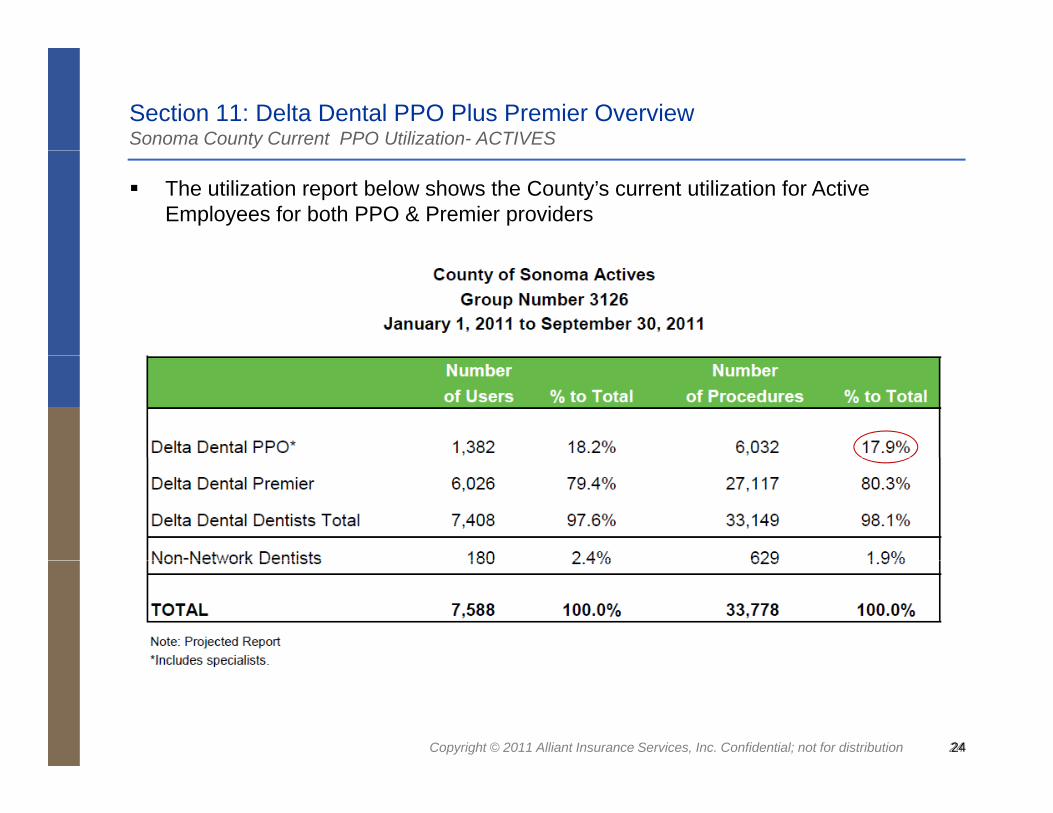
The utilization report below shows the County’s current utilization for Active Employees for both PPO & Premier providers
Copyright © 2011 Alliant Insurance Services, Inc. Confidential; not for distribution 2424

Section 11: Delta Dental PPO Plus Premier OverviewSonoma County Current PPO Utilization- RETIREES
The utilization report below shows the County’s current utilization for Retirees for both PPO & Premier providers
Copyright © 2011 Alliant Insurance Services, Inc. Confidential; not for distribution 2525

Section 11: Delta Dental PPO Plus Premier OverviewSonoma County PPO Utilization
The summary below is based on actual provider counts in Sonoma CountyOut of 496 Unique Dentists in the County:
187 (38%) i th D lt D t l PPO N t k187 (38%) are in the Delta Dental PPO Network428 (86%) are in the Delta Dental Premier Network (also includes PPO Dentists)
241 (49%) are Premier Only (428 minus 187)68 (14%) are not in the Delta Dental Network
Access Unique Unique Access Unique Unique Access Unique Unique
Results for Sonoma County, CA
Delta DentalNPF Total Delta Dental Premier® Delta Dental PPO
ccessPoints
U queDentists
U queFacilities
ccessPoints %
U queDentists %
U queFacilities %
ccessPoints %
U queDentists %
U queFacilities %
Endodontists 29 24 20 27 93.10% 22 91.67% 19 95.00% 27 93.10% 22 91.67% 19 95.00%
General Dentists 386 358 241 323 83.68% 301 84.08% 210 87.14% 98 25.39% 91 25.42% 49 20.33%
Oral Surgeons 42 37 19 41 97.62% 36 97.30% 19 100.00% 41 97.62% 36 97.30% 19 100.00%
Orthodontists 41 31 25 39 95.12% 29 93.55% 25 100.00% 10 24.39% 10 32.26% 4 16.00%
Pediatric Dentists 21 17 14 16 76.19% 12 70.59% 13 92.86% 3 14.29% 2 11.76% 3 21.43%
Specialty
Periodontists 34 28 24 34 100.00% 28 100.00% 24 100.00% 34 100.00% 28 100.00% 24 100.00%
Prosthodontists 3 3 3 2 66.67% 2 66.67% 2 66.67% 0 0% 0 0% 0 0%
Total 556 496 306 482 86.69% 428 86.29% 276 90.20% 213 38.31% 187 37.70% 96 31.37%Unique dentists and unique facilities totals DO NOT reflect the sum of the counts by specialty. If a dentist or facility has more than one specialty, the dentist or facility will only be counted once.
Copyright © 2011 Alliant Insurance Services, Inc. Confidential; not for distribution 2626
Section 11: Delta Dental PPO Plus Premier OverviewStraight vs. Mixed PPO
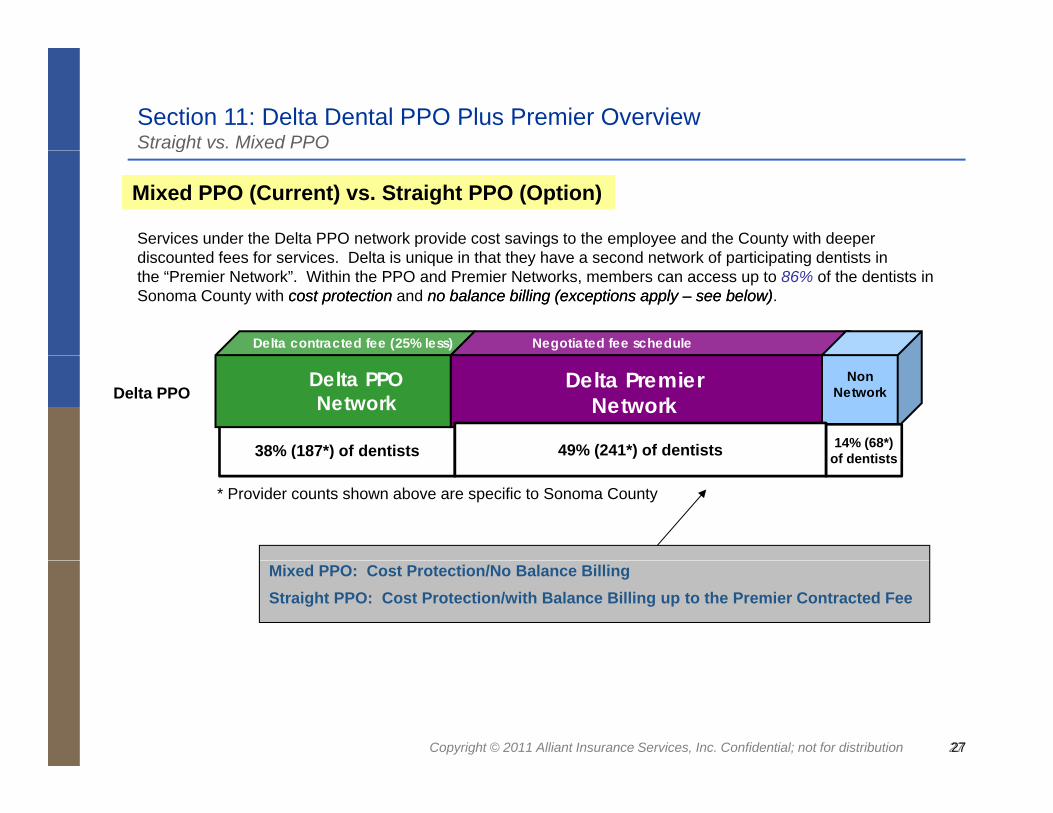
Services under the Delta PPO network provide cost savings to the employee and the County with deeperdi t d f f i D lt i i i th t th h d t k f ti i ti d ti t i
Mixed PPO (Current) vs. Straight PPO (Option)
g
Delta contracted fee (25% less) Negotiated fee schedule
discounted fees for services. Delta is unique in that they have a second network of participating dentists inthe “Premier Network”. Within the PPO and Premier Networks, members can access up to 86% of the dentists in Sonoma County with cost protectioncost protection and no balance billing (exceptions apply no balance billing (exceptions apply –– see below)see below).
38% (187*) of dentists
Delta PPO Network
Delta Premier Network
Non NetworkDelta PPO
14% (68*)of dentists49% (241*) of dentists( )
* Provider counts shown above are specific to Sonoma County
of dentists( )
Mixed PPO: Cost Protection/No Balance BillingStraight PPO: Cost Protection/with Balance Billing up to the Premier Contracted Fee
Copyright © 2011 Alliant Insurance Services, Inc. Confidential; not for distribution 2727

Section 12: Dental Financial Summary CSAC-EIA Fixed Rate Dental PPO Proposal
SONOMA COUNTY DENTAL PLANSEffective Date: 6/1/2012
C t P dACTIVES- COMPOSITE Current-Delta Premier
Proposed-Mixed PPO
Renews June 2012
Division 1124 $136.01 $128.27Monthly Premium (Estimated) $441,352 $416,231A l P i (E ti t d) $5 296 229 $4 994 777Annual Premium (Estimated) $5,296,229 $4,994,777
Percentage Change -5.7%
RETIREES Current-Delta Straight PPO
Proposed- Match Current
Renews June 2012
Single $38.94 $34.47Tw o Party $74.39 $65.85
Family $123.45 $109.28Total/Composite $55.82 $49.41
Monthly Premium $34,384 $30,437
Annual Premium $412,608 $365,241
Percentage Change -11.5%
ALL COMBINED
Monthly $475,736 $446,668Annual $5,708,838 $5,360,019
Copyright © 2011 Alliant Insurance Services, Inc. Confidential; not for distribution 2828
*Rates include Alliant Program Management Fee of $0.75 PEPM and PBIA Eligibility Fee of $0.45 PEPM
$ , , $ , ,Percentage Change -6.1%

Section 12: Dental Financial Summary Active Mixed PPO – Fixed Rate Proposed Plan Designs
Effective Date: June 1, 2012
Dental Benefits Delta Dental Premier CSAC-EIA Delta Dental Mixed PPO
Current Proposed
Dental Benefits Mixed PPOActives - Division 1124 Actives - Division 1124
Renews June 2012 PPO Premier / Non-Delta
Calendar Year Maximum $3,000 $3,100 $3,000Calendar Year Deductible None NoneIndividual (Waived for Preventive) (Waived for Preventive)( ) ( )Diagnostic and Preventive 80% 80%Oral Exam X-RaysTeeth Cleaning Basic Services 80% 80%Amalgam/Composite FillingsS
80%
80%
SealantsPeriodontics (Gum disease)Endodontics (Root Canal)Extractions & Other Oral SurgreyMajor Services 80% 80%Crown RepairRestorative - Inlays and Crowns
80%
Restorative - Inlays and CrownsComplex Oral SurgeryProsthodonticsAll Prosthodontic (including Implants) 80% 80%OrthodonticsAdult and Child(ren) 50% 50%Ortho Calendar Year Maximum $3,000 $3,000
80%
Copyright © 2011 Alliant Insurance Services, Inc. Confidential; not for distribution 2929
$ , $ ,
Note: This summary is for informational purpose only. It does not amend, extend, or alter the current policy in any way. In the event information in this summary differs from the Plan Document, the Plan Document will prevail.

Section 12: Dental Financial Summary Retiree Straight PPO – Fixed Rate Proposed Plan Designs
Effective Date: June 1, 2012
Dental BenefitsDelta Dental Straight PPO
CSAC-EIA Delta DentalStraight PPO
Current Proposed
Dental Benefits Straight PPO Straight PPORetirees Retirees
Renews June 2012PPO Premier / Non-Delta PPO Premier / Non-Delta
Calendar Year Maximum $1,000 $1,000 $1,000 $1,000Calendar Year Deductible $50 $50Individual (Waived for Preventive) (Waived for Preventive)Diagnostic and Preventive 100% 100% 100% 100%Oral Exam X-RaysTeeth Cleaning Basic Services 80% 80% 80% 80%A l /C it FilliAmalgam/Composite FillingsSealantsPeriodontics (Gum disease)Endodontics (Root Canal)Extractions & Other Oral SurgreyMajor Services 50% 50% 50% 50%Crown RepairCrown RepairRestorative - Inlays and CrownsComplex Oral SurgeryProsthodonticsAll Prosthodontic (including Implants) 50% 50% 50% 50%OrthodonticsAdult and Child(ren) N/A N/A
Copyright © 2011 Alliant Insurance Services, Inc. Confidential; not for distribution 3030* Out of network benefits payment based on Delta Dental’s PPO regionalized fee allowance.
Note: This summary is for informational purpose only. It does not amend, extend, or alter the current policy in any way. In the event information in this summary differs from the Plan Document, the Plan Document will prevail.

Section 12: Dental Financial Summary Retiree DHMO – Fixed Rate Proposed Plan Designs
Effective Date: June 1, 2012
Current Proposed
Dental Benefits Delta Dental DHMO CSAC-EIA Delta Dental DHMO
Retirees RetireesRenews June 2012
Deductible $0 $0Diagnostic and Preventive 100% 100%Oral ExamOral Exam X-RaysTeeth Cleaning Basic Services 100% 100%Amalgam/Composite FillingsSealantsPeriodontics (Gum disease)( )Endodontics (Root Canal)Extractions & Other Oral SurgreyMajor Services $0 - $90 $0 - $90Crown RepairRestorative - Inlays and CrownsComplex Oral SurgeryP th d tiProsthodonticsAll Prosthodontic (including Implants) $10 - $175 $10 - $175Orthodontics*Child $1,600 $1,600Adult $1,800 $1,800
Copyright © 2011 Alliant Insurance Services, Inc. Confidential; not for distribution 3131
Note: This summary is for informational purpose only. It does not amend, extend, or alter the current policy in any way. In the event information in this summary differs from the Plan Document, the Plan Document will prevail.
*For 24-month treatment, plan pays 100% thereafter. $75/month member copay for treatment after 24 months.

Public Entity Benefits Group100 Pine Street, 11th FloorS F i CA 94111San Francisco, CA 94111
Copyright © 2011 Alliant Insurance Services, Inc. Confidential; not for distribution 32

Exhibit A: EIA Health Renewal Methodology
Overview
St 1Step 1:Calculate Renewal for Entire Pool: Pool Average Renewal
Step 2:Evaluate Claims vs. Premiums for Each Group Within PProgram
Step 3:Step 3:Adjust Each Group’s Renewal from Pool Average Renewal based on Step 2 Results
Copyright © 2011 Alliant Insurance Services, Inc. Confidential; not for distribution 33

Exhibit A: EIA Health Renewal Methodology
Step 1
Calculate the renewal for all members of the pool: the Pool Average Renewal
Group A Group B Group C Group D Group E TOTAL
Calculate the renewal for all members of the pool: the Pool Average Renewal
p p p p p
Projected Claims $500 $450 $800 $900 $650
Projected Fixed Costs $55 $55 $55 $55 $55j
Total Projected Cost $555 $505 $855 $955 $705
Current Premium $480 $490 $765 $825 $700
Renewal Change % 15.6% 3.1% 11.8% 15.8% 0.7% 8.9%
Copyright © 2011 Alliant Insurance Services, Inc. Confidential; not for distribution 34

Exhibit A: EIA Health Renewal Methodology
Step 2
Evaluate Claims vs. Premium for each group within Pool
Group A Group B Group C Group D Group E TOTAL
Average Loss Ratio 98% 88% 94% 97% 85% 92%Average Loss Ratio 98% 88% 94% 97% 85% 92%
Variance from Pool Total Loss Ratio +6% -4% +2% +5% -7%
Tolerable Loss Ratio Variance ±8% ±2% ±4% ±6% ±8%
• Large claims are removed from loss ratio calculation for each member based on a group specific ‘pooling point’.
• Loss ratio calculation uses up to three years of historical experience for statistical smoothing purposes.
• Tolerable Loss Ratio Variance is based on group size:
Copyright © 2011 Alliant Insurance Services, Inc. Confidential; not for distribution 35
g p• smaller groups have a greater tolerable variance, • larger groups have a lower tolerable variance.
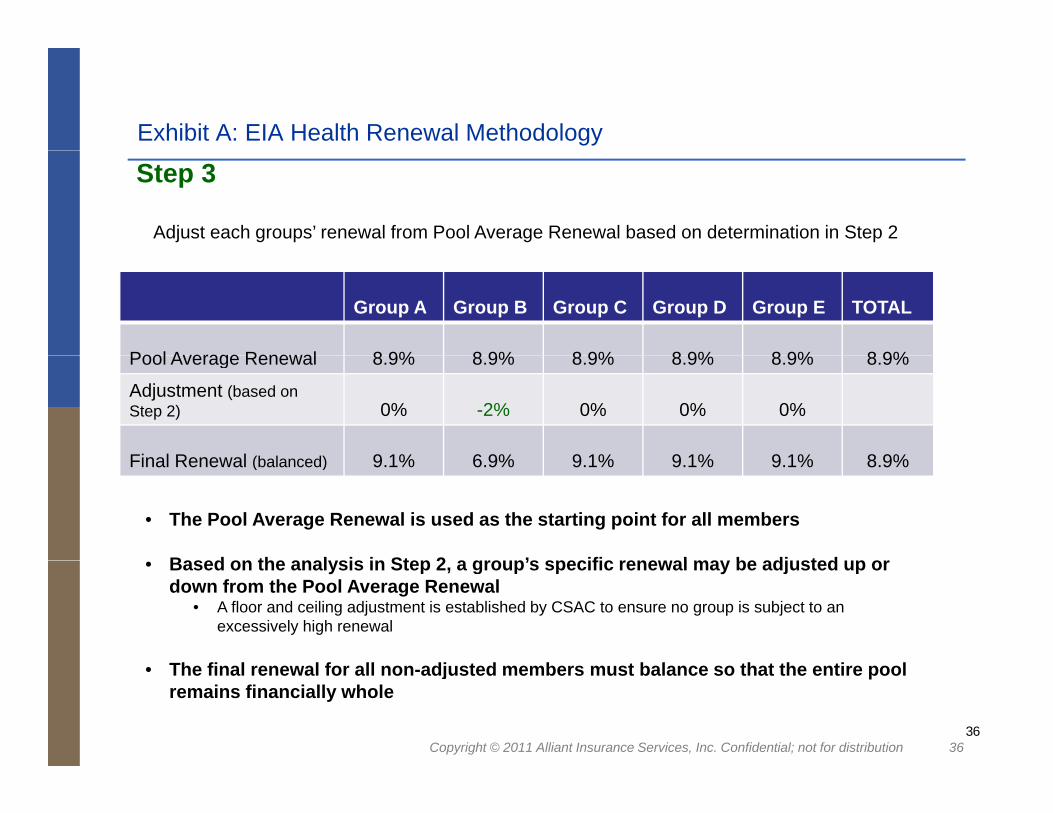
Exhibit A: EIA Health Renewal Methodology
Step 3
Adjust each groups’ renewal from Pool Average Renewal based on determination in Step 2
Group A Group B Group C Group D Group E TOTAL
Pool Average Renewal 8 9% 8 9% 8 9% 8 9% 8 9% 8 9%Pool Average Renewal 8.9% 8.9% 8.9% 8.9% 8.9% 8.9%
Adjustment (based on Step 2) 0% -2% 0% 0% 0%
Final Renewal (b l d) 9 1% 6 9% 9 1% 9 1% 9 1% 8 9%Final Renewal (balanced) 9.1% 6.9% 9.1% 9.1% 9.1% 8.9%
• The Pool Average Renewal is used as the starting point for all members
Based on the anal sis in Step 2 a gro p’s specific rene al ma be adj sted p or• Based on the analysis in Step 2, a group’s specific renewal may be adjusted up or down from the Pool Average Renewal
• A floor and ceiling adjustment is established by CSAC to ensure no group is subject to an excessively high renewal
Th fi l l f ll dj t d b t b l th t th ti l
Copyright © 2011 Alliant Insurance Services, Inc. Confidential; not for distribution 3636
• The final renewal for all non-adjusted members must balance so that the entire pool remains financially whole