Embed Size (px)
DESCRIPTION
Introduction to Data Manipulation, Analysis, and Visualization with R. Patrick Grof -Tisza. Introduction. Who and why? Disclaimer. Objectives Become familiar with the R environment Syntax Self directed learning Build function library. Workshop Series Outline. Workshop 1. Workshop 2. - PowerPoint PPT Presentation
Citation preview
Introduction to Data Manipulation, Analysis, and Visualization with R
Patrick Grof-Tisza
Introduction
• Who and why?• Disclaimer
• Objectives – Become familiar with the
R environment– Syntax – Self directed learning– Build function library
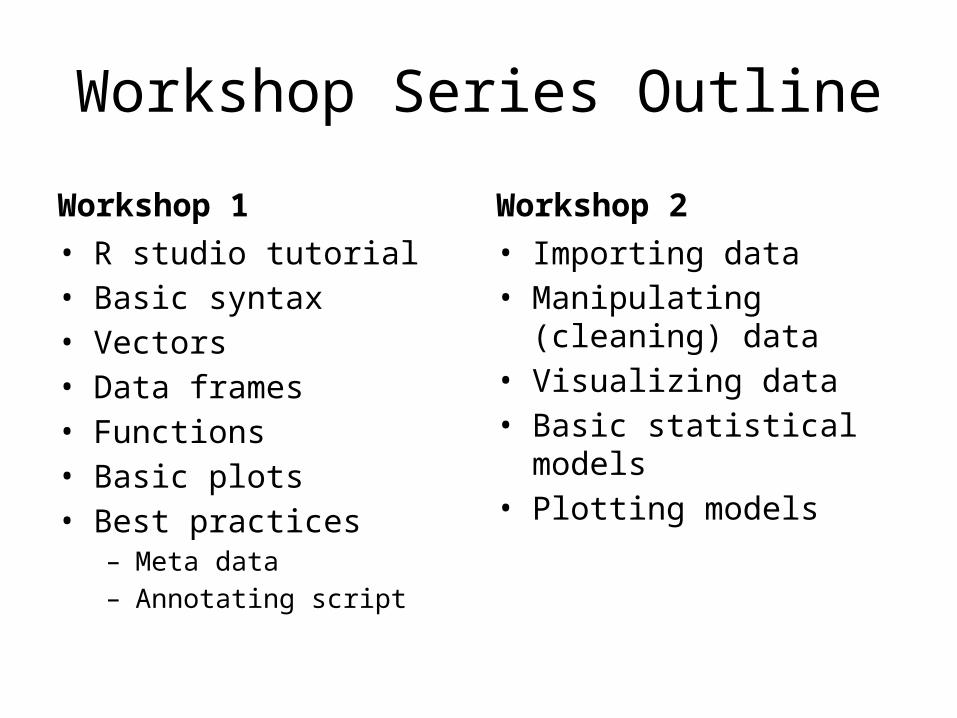
Workshop Series Outline
Workshop 1• R studio tutorial• Basic syntax• Vectors• Data frames• Functions • Basic plots• Best practices
– Meta data– Annotating script
Workshop 2• Importing data• Manipulating (cleaning)
data • Visualizing data• Basic statistical models• Plotting models
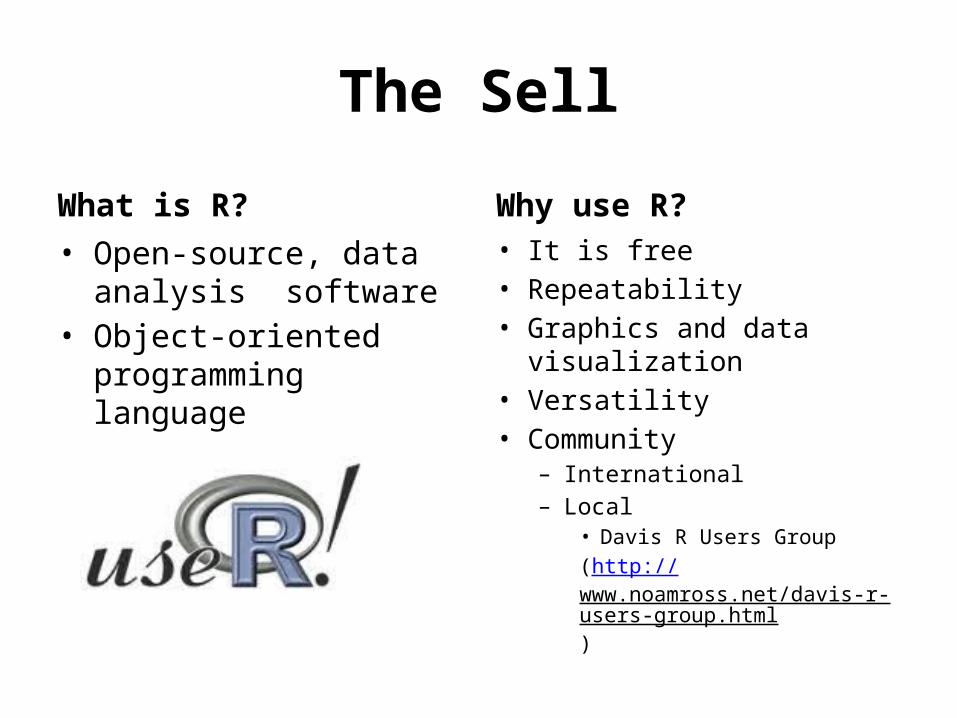
The Sell
What is R?• Open-source, data analysis
software• Object-oriented
programming language
Why use R?• It is free• Repeatability• Graphics and data visualization• Versatility • Community
– International– Local
• Davis R Users Group(http://www.noamross.net/davis-r-users-group.html)

The Sell
What is R?• Open-source data analysis
software• Object-oriented
programming language
Why use R?• It is free• Repeatability• Graphics and data visualization• Versatility • Community
– International– Local
• Davis R Users Group(http://www.noamross.net/davis-r-users-group.html)
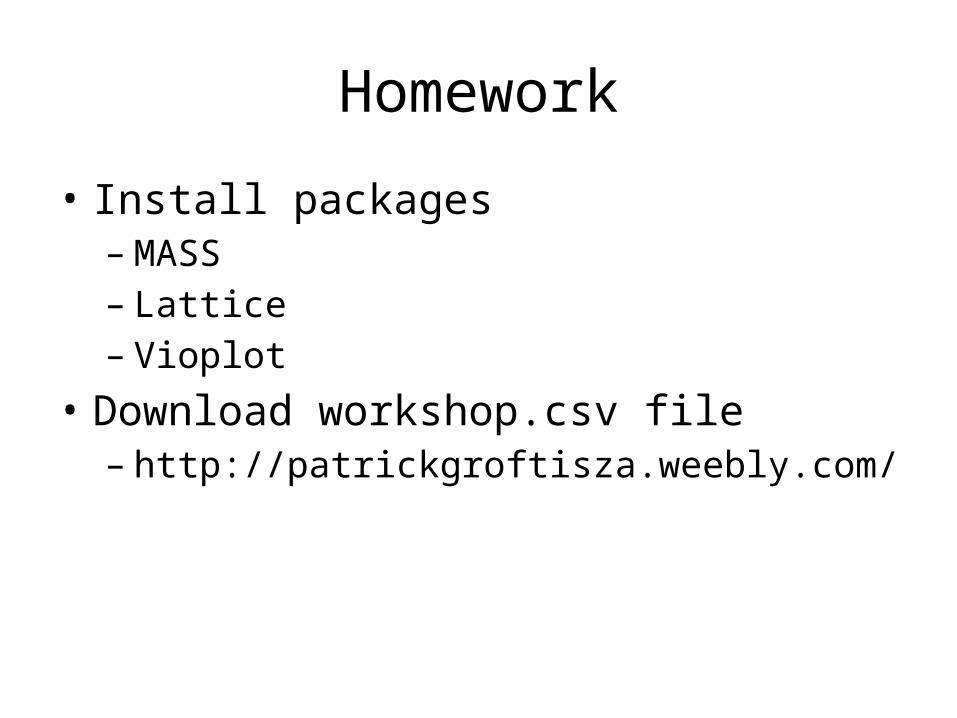
Homework
• Install packages– MASS– Lattice– Vioplot
• Download workshop.csv file– http://patrickgroftisza.weebly.com/
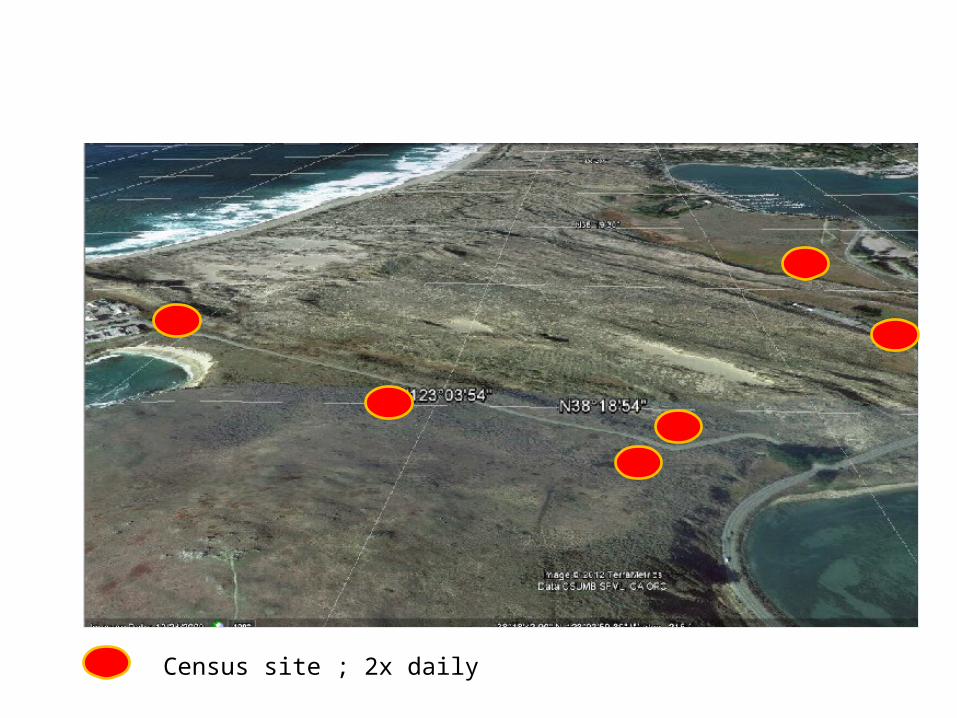
Census site ; 2x daily