Embed Size (px)
Citation preview

Introduction to Engineering Systems, ESD.00
System Dynamics - I
Lecture 2
Dr. Afreen Siddiqi
• “You cannot meddle with one part of a complex system fromthe outside without the almost certain risk of setting offthe outside without the almost certain risk of setting off disastrous events that you hadn’t counted on in other, remote parts. If you want to fix something you are first obliged to understand… the whole system… Intervening is a way of causing trouble.”*
*Lewis Thomas (biologist and essayist) quoted in Business Dynamics J Sterman 2000Lewis Thomas (biologist and essayist), quoted in Business Dynamics, J. Sterman, 2000

Systems ThinkingSystems Thinking
• Our world is complex and its elements are inter‐related.
• We need to understand that “we can’t do just one thing” – things are interconnected and our actions have numerous effects that we often do not antiticiipatte or realilize.
• Many times our policies and efforts aimed towards some objective fail to produce the desired outcomes rather we often make matters worse the desired outcomes, rather we often make matters worse
– For instance:
• Systems Thinking involves holistic consideration of our actions – it is needed to deal with the complexity of our world

What is System Dynamics?What is System Dynamics?
• System Dynamics is a method that helps us learn and understand complex systems
• It is fundamentally interdisciplinary and brings together tools and theories from a wide variety of traditional disciplines.
• At its core, its foundations are on nonlinear dynamics and mathematical feedback control theory, and it draws from economics, social psychology and other sciences.
• We use system dynamics to construct models of socio‐technical systems, and use computer simulation to determine how these systems may behave in the real‐worldworld
Law of Unintended ConsequencesLaw of Unintended Consequences• Murphy’s Law
• “Counter Intuitive Behavior of Social Systems”
• Unexpected dynamics often lead to ‘policy resistance, i.e. the tendency f i i b d l d dil d d f d b h ffor interventions to be delayed, diluted, or defeated by the response of the system to the intervention itself’
• Our actions to solve some problem tend to make the problem worse or create new problems in its place (can you think of examples?)

Causes of Policy Resistance: The Serial View The Serial View
EEventt-orientedd view of th f the worldld i t i
Ref: Figure 1-3, J. Sterman, Business Dynamics: Systems Thinking and Modeling for a complex world McGraw Hill 2000Thinking and Modeling for a complex world, McGraw Hill, 2000
We typically tend to think of things as chains of cause and effect and often ignore the time delays between them often ignore the time delays between them
Problem
Goals
Situation
Decision Results
Image by MIT OpenCourseWare.
000
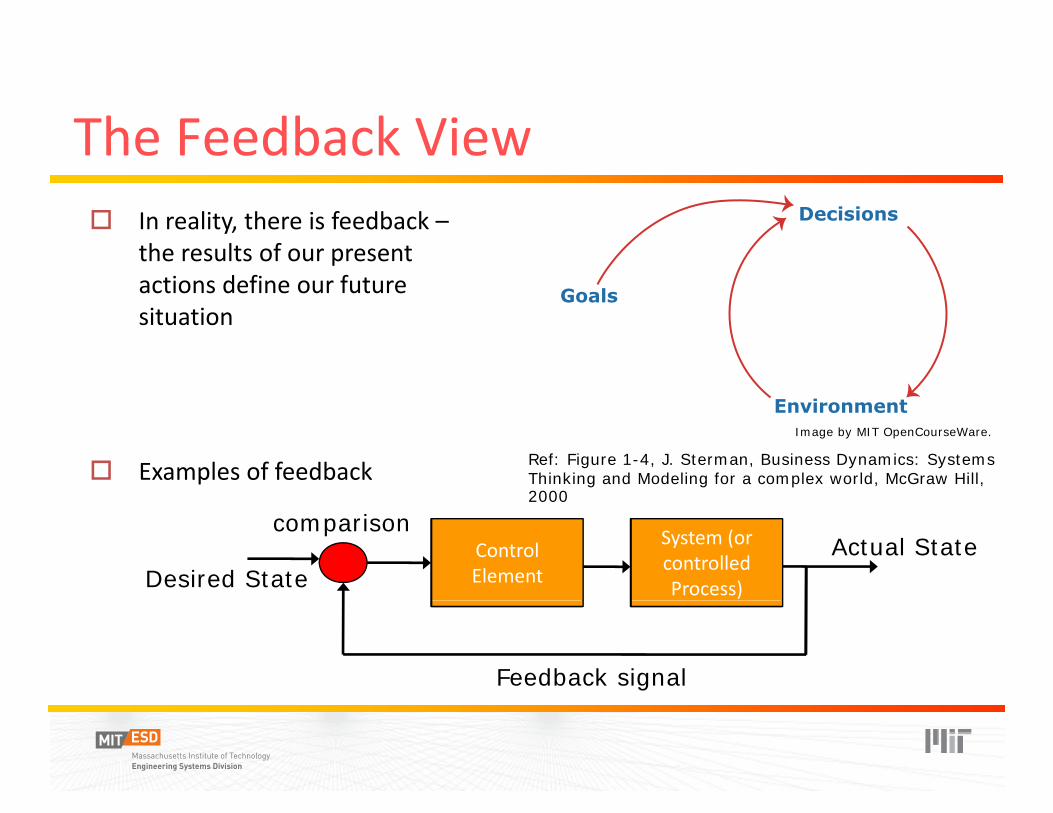
The Feedback ViewThe Feedback View� In reality, there is feedback –
the results of our presentthe results of our present actions define our future situation
� Examples of feedback Thinking and Modeling for a complex world, McGraw Hill, 2000
Feedback signal
Ref: Figure 1-4, J. Sterman, Business Dynamics: Systems
System (or controlled Process)
Control Element
comparison
Desired State Actual State
Decisions
Environment
Goals
Image by MIT OpenCourseWare.
ControlElement
System (orcontrolledProcess)
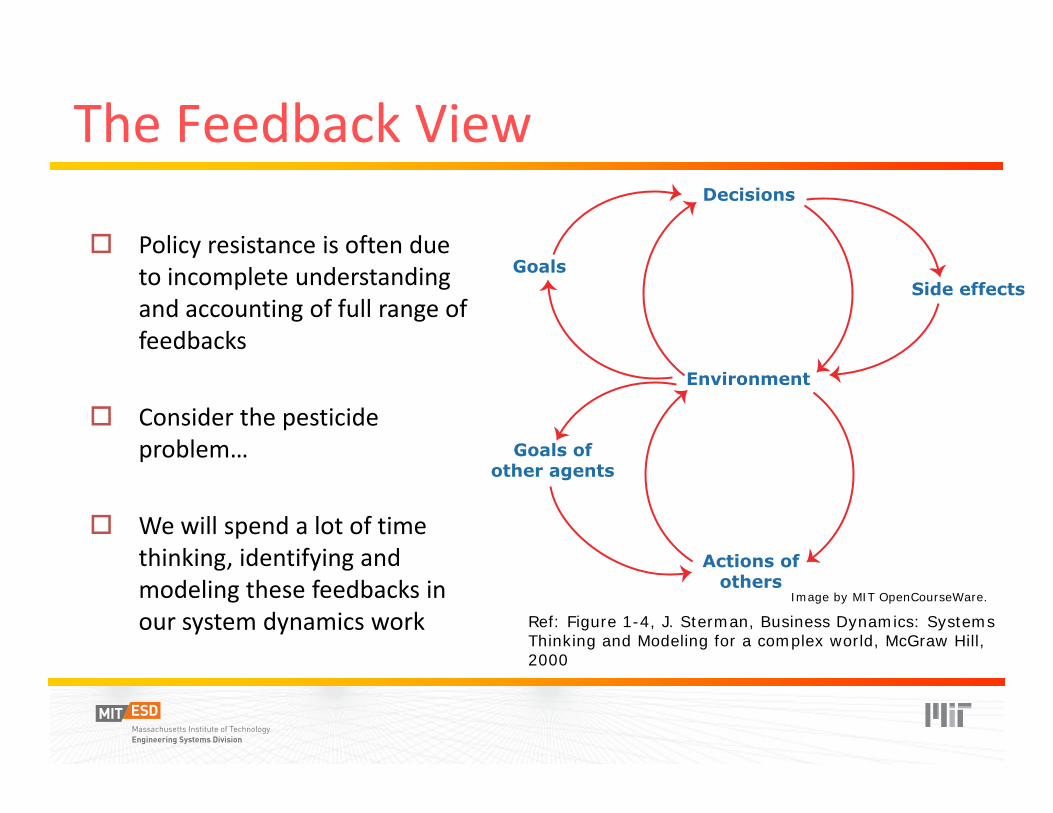
The Feedback ViewThe Feedback View
� Policy resistance is often due olicy resistance is often due� Pto incomplete understanding and accounting of full range of feedbacks
� Consider the pesticide pproblem…
� We will spend a lot of time thinking identifying andthinking, identifying and modeling these feedbacks in
Ref: Figure 1-4, J. Sterman, Business Dynamics: Systems Thinking and Modeling for a complex world, McGraw Hill,
our system dynamics work 2000
Decisions
Side effects
Environment
Goals
Goals ofother agents
Actions ofothers
Image by MIT OpenCourseWare.
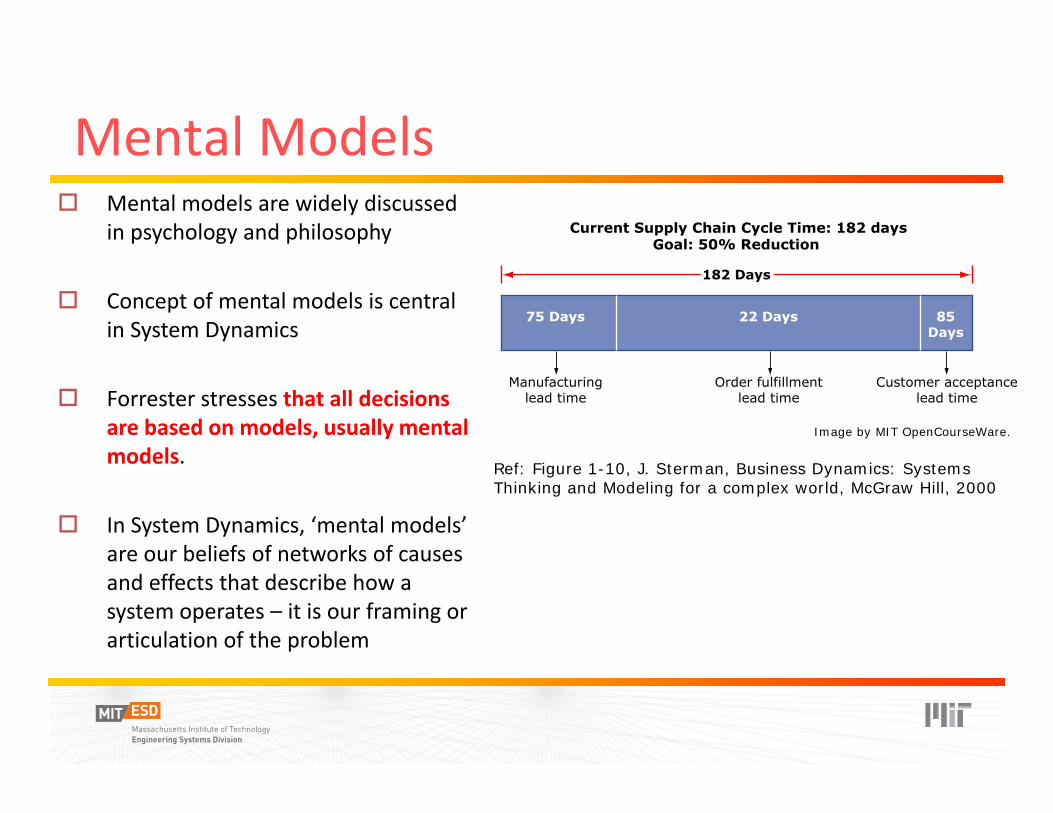
Mental ModelsMental Models� Mental models are widely discussed
in psychology and philosophy
� Concept of mental models is central in System Dynamics
� Forrester stresses that all decisions are based on models, usually mental modelsmodels. Ref: Figure 1-10, J. Sterman, Business Dynamics: Systems
Thinking and Modeling for a complex world, McGraw Hill, 2000
� In System Dynamics, ‘mental models’ are our beliefs of networks of causes are our beliefs of networks of causes and effects that describe how a system operates – it is our framing or articulation of the problem
75 Days 22 Days 85Days
182 Days
Manufacturinglead time
Order fulfillmentlead time
Customer acceptancelead time
Current Supply Chain Cycle Time: 182 daysGoal: 50% Reduction
Image by MIT OpenCourseWare.

Double‐Loop LearningDouble Loop Learning
� Syystems Thinkingg comes with replacing a narrow, static, short‐run view with a broad, dynamic and long‐term view of our systems and policies
Ref: Figure 1-11, J. Sterman, Business Dynamics: Systems Thinking and Modeling for a complex world, McGraw Hill, 2000
Real world
Informationfeedback
Mental modelsof real world
Strategy, structure,decision rules
Decisions
Image by MIT OpenCourseWare.
Bounded RationalityBounded Rationality
“The capacity of the human mind for formulating and solvingcomplex problems is very small compared to the size of theproblem whose solution is required for objectively rationalproblem whose solution is required for objectively rationalbehavior in the real world or even for a reasonable approximation to such objective reality”. (Herbert Simon,1957)

SimulationSimulation
• Creating and simulating a model lets you make your mental model explicit, and then helps you see how your defined system structure will behave in time.
• Formalizing qualitative models and testing via simulation often leads to radical changes in the way we understand reality.
• Discrepancies between formal and mental models stimulate improvements in both, including changes in basic assumptions, time horizon and dyynamic hypothesis.yp
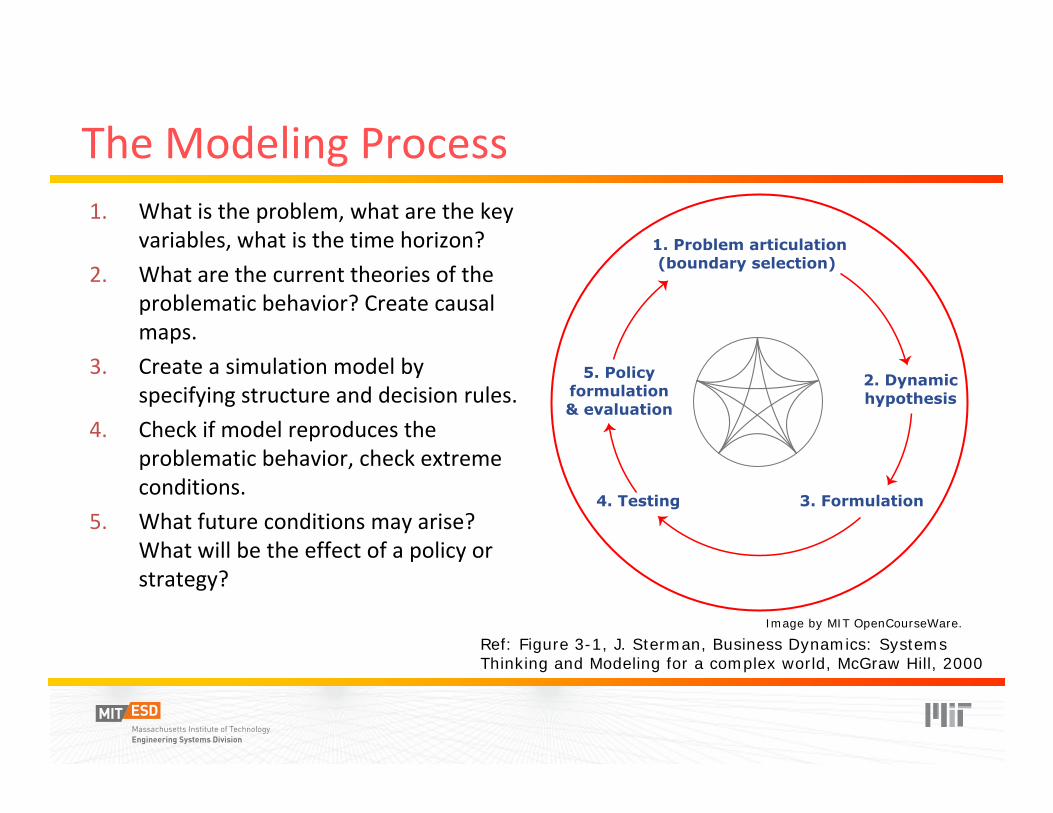
The Modeling ProcessThe Modeling Process1. What is the problem, what are the key
variables, what is the time horizon?
2. What are the current theories of the problematic behavior? Create causal maps.
3. Create a simulation model by specifying structure and decision rules.
4. Check if model reproduces the problematic behavior check extreme problematic behavior, check extremeconditions.
5. What future conditions may arise? What will be the effect of a ppolicyy or strategy?
Ref: Figure 3-1, J. Sterman, Business Dynamics: Systems Thinking and Modeling for a complex world, McGraw Hill, 2000
1. Problem articulation(boundary selection)
2. Dynamichypothesis
3. Formulation4. Testing
5. Policyformulation& evaluation
Image by MIT OpenCourseWare.

Formulating a HypothesisFormulating a Hypothesis• “A dynamic hypothesis is a working theory of how the problem arose”
• System dynamics seeks endogenous explanations for phenomena. An endoggenous theoryy g generates the dyynamics of the syystem througgh the interaction of variables and agents represented in the model.
• Create a model boundary chart a list of endogenous exogenous andCreate a model boundary chart, a list of endogenous, exogenous, and excluded variables that define the scope of the model
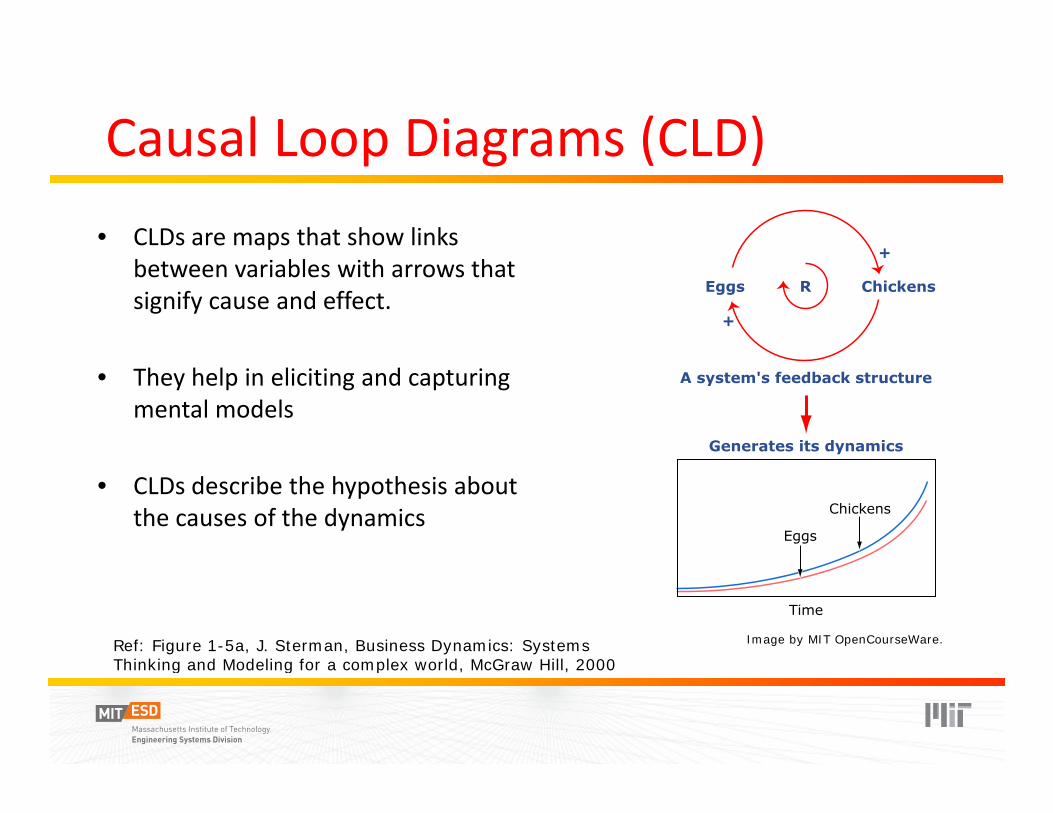
Causal Loop Diagrams (CLD)Causal Loop Diagrams (CLD)• CLDs are maps that show links
between variables with arrows that signify cause and effect.
• They help in eliciting and capturing mental models
• CLDs describe the hypothesis about the causes of the dynamics
Ref: Figure 1-5a, J. Sterman, Business Dynamics: Systems Thinking and Modeling for a complex world McGraw Hill 2000Thinking and Modeling for a complex world, McGraw Hill, 2000
Eggs Chickens
A system's feedback structure
R
Time
Chickens
Eggs
Generates its dynamics
+
+
Image by MIT OpenCourseWare.

Ref: Figgure 5-1,, J. Sterman,, Business D yynamics: SyystemsDiagram Notations Diagram Notations Thinking and Modeling for a complex world, McGraw Hill, 2000
� Variables are: Birth rate, population, death rate, fractional birth rate, average lifetime
� Variables are connected byy ‘causal links’ (arrows) with assigned polarities
� Polarities indicate how the independent variable affects the dependent variable
� Loop identifiers indicate direction of circulation and type (balancing or reinforcing)g)
Birth rate Population Death rate
Average lifetimeFractionalbirth rate
Key
Link polarity
Causal link
Populationvariable
Birth ratevariable
Loop identifier: Positive (reinforcing) loop
Loop identifier: Negative (balancing) loop
R
R
B
B
+
-
or
or
+ -
+ ++
+
-
Image by MIT OpenCourseWare.
X Y+
YX-
+
SalesProduct quality+
ResultsEffort+
PopulationBirths-
SalesProduct price-
ResultsFrustration
-
PopulationDeaths
Y = (X+....)ds+Ytt
t
00
∫
Y = (-X+....)ds+Ytt
t
00
∫
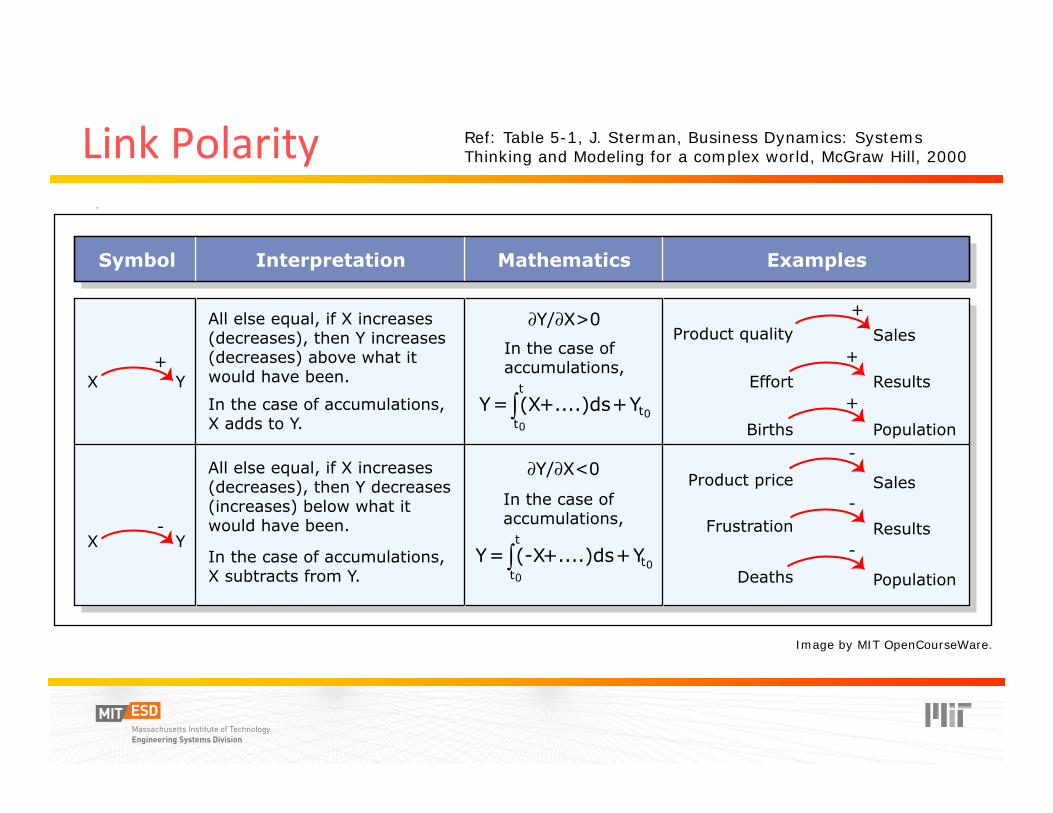
Symbol Interpretation Mathematics Examples
All else equal, if X increases(decreases), then Y decreases(increases) below what itwould have been.
In the case of accumulations,X subtracts from Y.
All else equal, if X increases(decreases), then Y increases(decreases) above what itwould have been.
In the case of accumulations,X adds to Y.
∂Y/∂X>0
∂Y/∂X<0
In the case ofaccumulations,
In the case ofaccumulations,
Link Polarity Link Polarity Ref: Table 5-1, J. Sterman, Business Dynamics: Systems Thinking and Modeling for a complex world, McGraw Hill, 2000
Image by MIT OpenCourseWare.
Causation and CorrelationCausation and Correlation
� Causal diagrams must include only genuine causal relationships
� Correlations represent past behavior, not underlying system structure
� Serious policy errors/judgments can result from erroneous assumptions of causalitlity
Loop PolarityLoop Polarity
� Trace the effect of a change around the loop.
� If feedback effect reinforces the original change, it is a positive (reinforcing) loop(reinforcing) loop.
� If feedback effect opposes the ori iiginall chhange, it i it is a negatitive (balancing) loop
Clarity in PolarityClarity in Polarity
� Links must have unambiguous pol ilarity
� If it is unclear which polarity to assign, it is likely there are multiple pathways between the two variables under consideration. Elaborate those th til bi it i l ft pathways until no ambiguity is left.
Clarity in LogicClarity in Logic
�� M d l b l i hModels become complex with too much detail
� Too little detail can make model confusing
� Add enough structure so that it is easy to grasp the logic
Goals of Negative LoopsGoals of Negative Loops� Negative feedback loops have
goals (desired states)ls (desir sta s)goa ed te
� These loops function by comparing actual state with desired state andactual state with desired state and making adjustments in response to discrepancy
� Make the goals explicit
� Knowing the goals helps in � thinking how the goals are formed, how they may change over time.
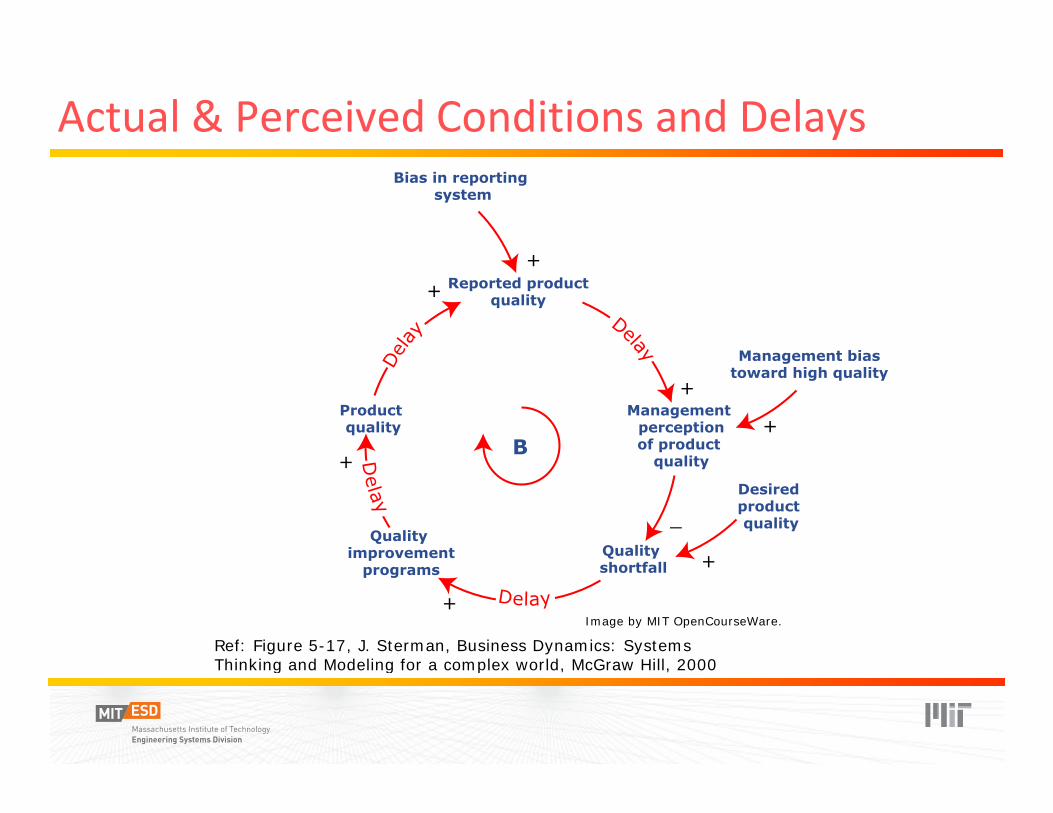
Actual & Perceived Conditions and DelaysActual & Perceived Conditions and Delays
Ref: Figure 5-17, J. Sterman, Business Dynamics: Systems Thinking and Modeling for a complex world McGraw Hill 2000Thinking and Modeling for a complex world, McGraw Hill, 2000
Reported productquality
Bias in reporting system
Management perceptionof product
quality
Quality shortfall
Quality improvement
programs
Product quality
Desired product quality
Management biastoward high quality
B
Delay
Delay
Delay
Delay
+
+
+
+
+
+
+
_
Image by MIT OpenCourseWare.

Case Study:Managing Your WorkloadManaging Your Workload
� Issue/case
� need t d to balance course l d/ load/work andd personall lif life� b l k
� Two possible strategies
� Key variables � Assignment rate [tasks/wk]�� Work completion rate [tasks/wk]Work completion rate [tasks/wk] � Assignment backlog [tasks] � Grades [ 0‐100] � W kWorkweekk [ h [ hours//wk]� k]
� Energy level [ 0‐100, 100: fully rested, 0: comatose]
Creating a Reference ModeCreating a Reference Mode
� State Time Horizon
�� U l h f l it Use several graphs for clarity
� Plot variables with same units on same axis for easy comparison
� Quantitative data not necessary, make estimates of the behavior – don’t omit variables simply because no numerical information is available
� There should be a basis in the data for each reference mode
� Details matter! � Graphs should be consistent with any stock and flow relationships
CLDsCLDs� Assignment backlog
decreases with work completion rate and increases with the assiignment rate.
� Work pressure increases workweek, but if pressure is too high, you’ll devote l ff t t thless effort to the assignments to get work done quickly by cutting cornerscutting corners

MIT OpenCourseWare http://ocw.mit.edu
ESD.00 Introduction to Engineering SystemsSpring 2011
For information about citing these materials or our Terms of Use, visit: http://ocw.mit.edu/terms.


![ESD.36J System & Project Managementdspace.mit.edu/bitstream/handle/1721.1/80702/esd...Title: Microsoft PowerPoint - ESD.36_L17_SD_PM [Read-Only] Author: cc_adutta Created Date: 2/15/2005](https://img.pdfslide.net/doc/110x75/60ea3de37f5bd72551695bc9/esd36j-system-project-title-microsoft-powerpoint-esd36l17sdpm.jpg)