Embed Size (px)
Citation preview
Introduction to Primary Production, Introduction to Primary Production, Respiration and Nutrient CyclingRespiration and Nutrient Cycling –Cont. –Cont.
1) REVIEW
1) Why we care?A) Coupling of atmosphere and ocean
2) Ocean carbonate system & importance to chemistryin the of sea water
3) Processes in controlling distribution of oxygen & dioxide in the ocean.
4) Ocean circulation and oxygen, carbon dioxide and nutrients
Oscar Schofield ([email protected])
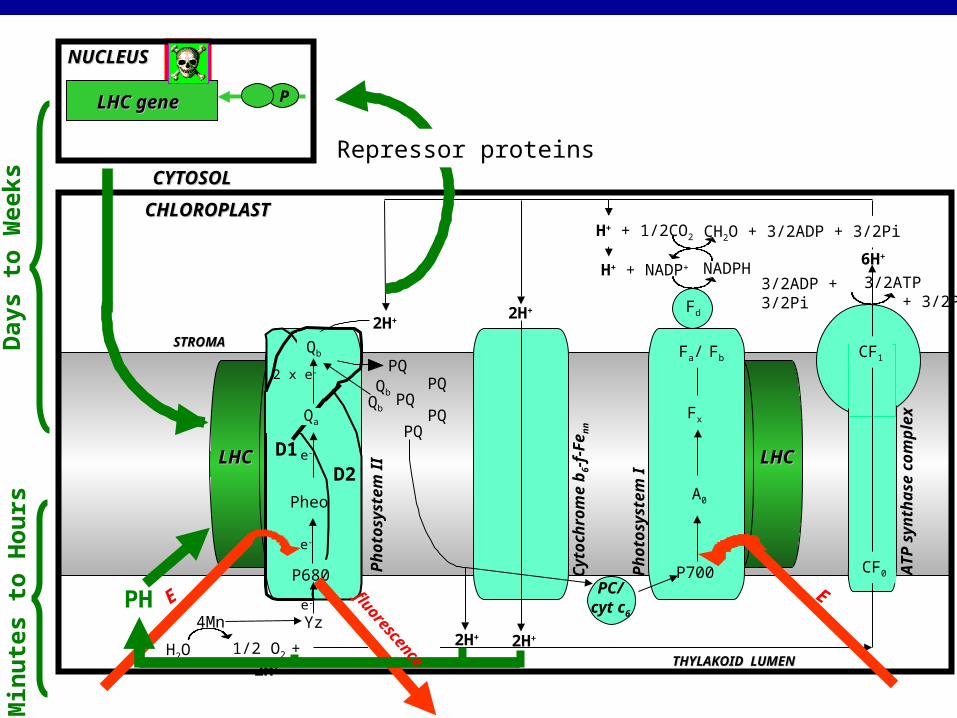
THYLAKOID THYLAKOID MEMBRANEMEMBRANE
STROMASTROMA
CYTOSOLCYTOSOL
LHCLHC LHCLHC
1/2 O2 + 2H+H2O
4Mn Yze-
2H+
PQ
PQPQ
PQPQ
Qb
Qb
Cyt
och
rom
e b 6-
f-F
e nn
2H+
2H+2H+
PC/cyt c6
Ph
otos
yste
m I
CHLOROPLASTCHLOROPLAST
P700
A0
Fx
Fa/ Fb
Fd
AT
P s
ynth
ase
com
plex
CF0
CF1
3/2ADP + 3/2Pi 3/2ATP + 3/2Pi
NADPHH+ + NADP+6H+
1/2CH2O + 3/2ADP + 3/2PiH+ + 1/2CO2
THYLAKOID LUMENTHYLAKOID LUMEN
EP680
Pheo
e-
e-
Ph
otos
yste
m I
ID2D1
E
Qa
Qb
2 x e-
PH
Min
ute
s to
Hou
rs
NUCLEUSNUCLEUS
PLHC geneLHC gene
Repressor proteins
Day
s to
Wee
ks
fluorescence
light intensitylight intensity
oxyg
en
evolu
tion
oxyg
en
evolu
tion
0
0.5
1.5
2.5
3.5
0 50 100 150 200 250 3000
0.02
0.04
0.06
0.08
qu
an
tum
yie
ld o
f oxyg
en
evolu
tion
qu
an
tum
yie
ld o
f oxyg
en
evolu
tion
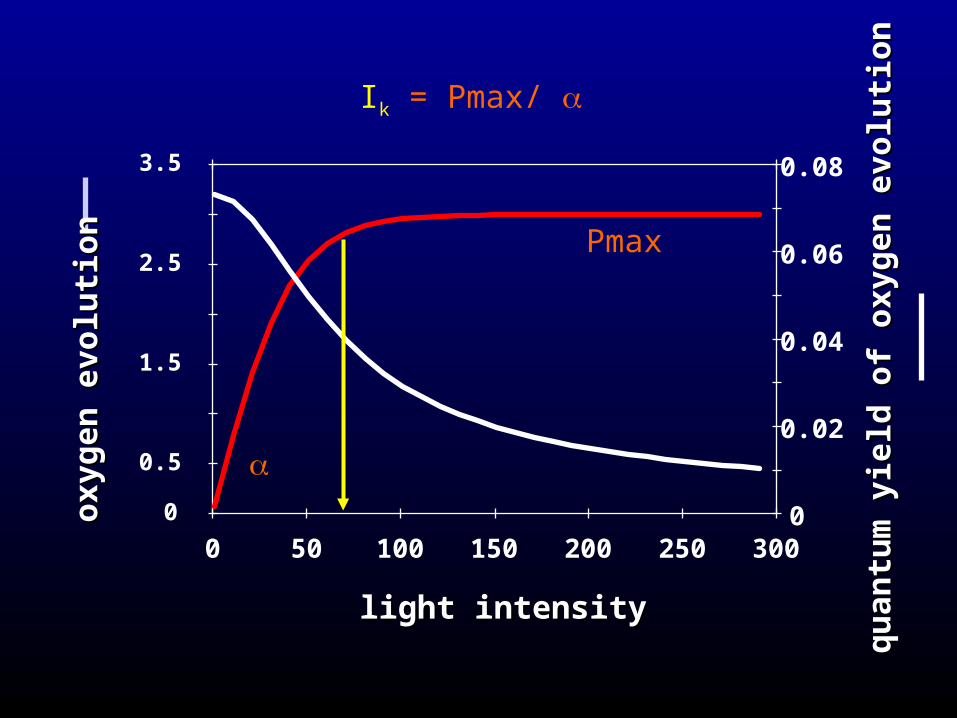
Pmax
Ik = Pmax/
OKAY:
Ocean Photosynthesis occurs
Why do you care?
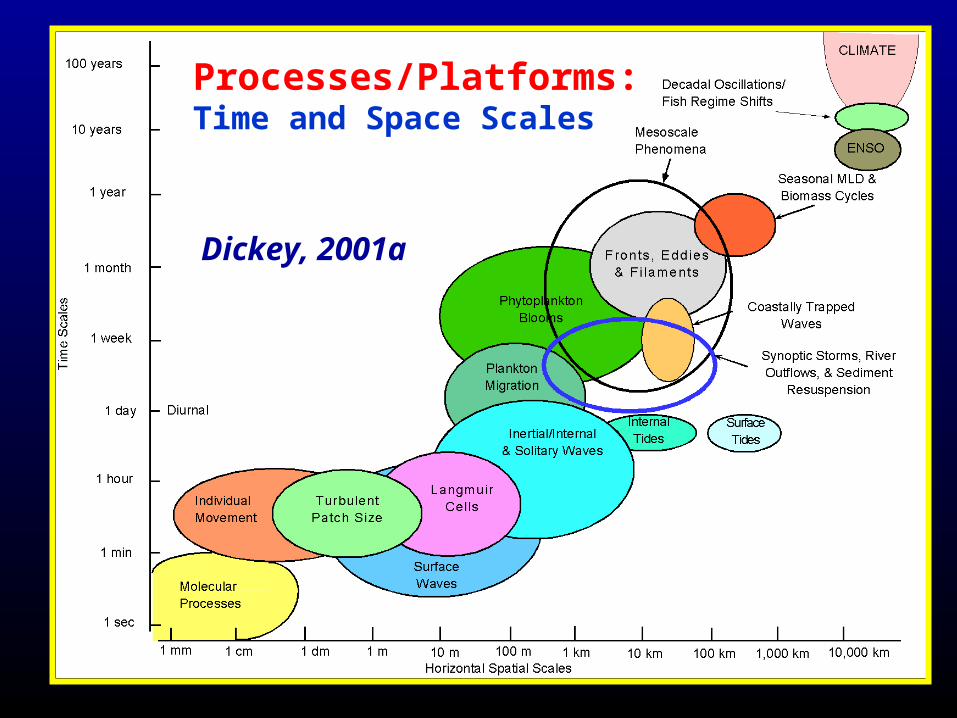
t Processes/Platforms:Time and Space Scales
Dickey, 2001a
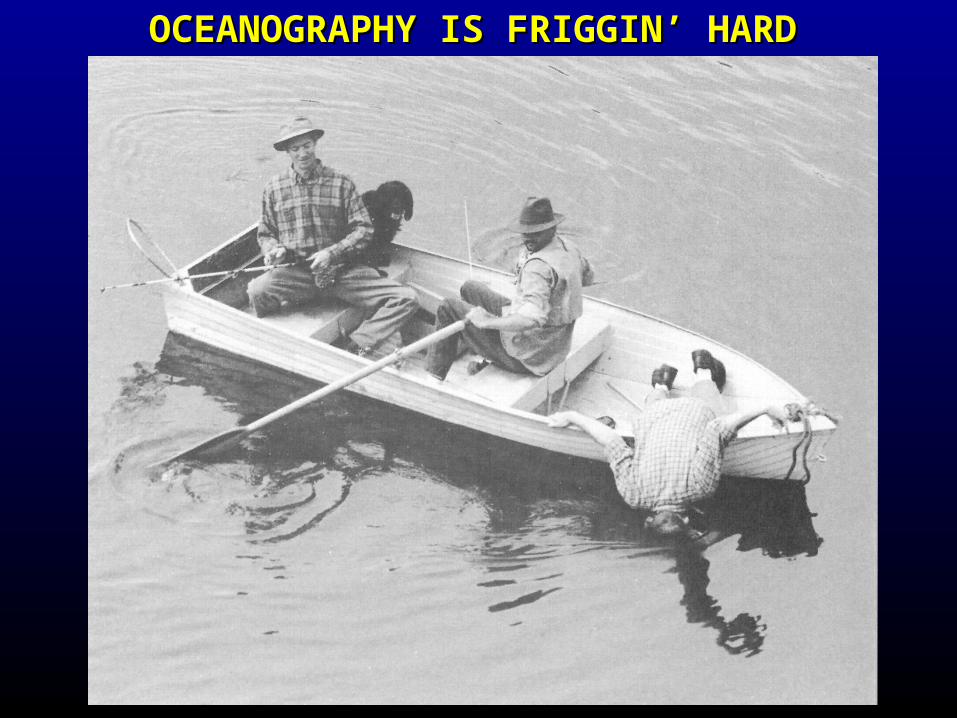
OCEANOGRAPHY IS FRIGGIN’ HARDOCEANOGRAPHY IS FRIGGIN’ HARD
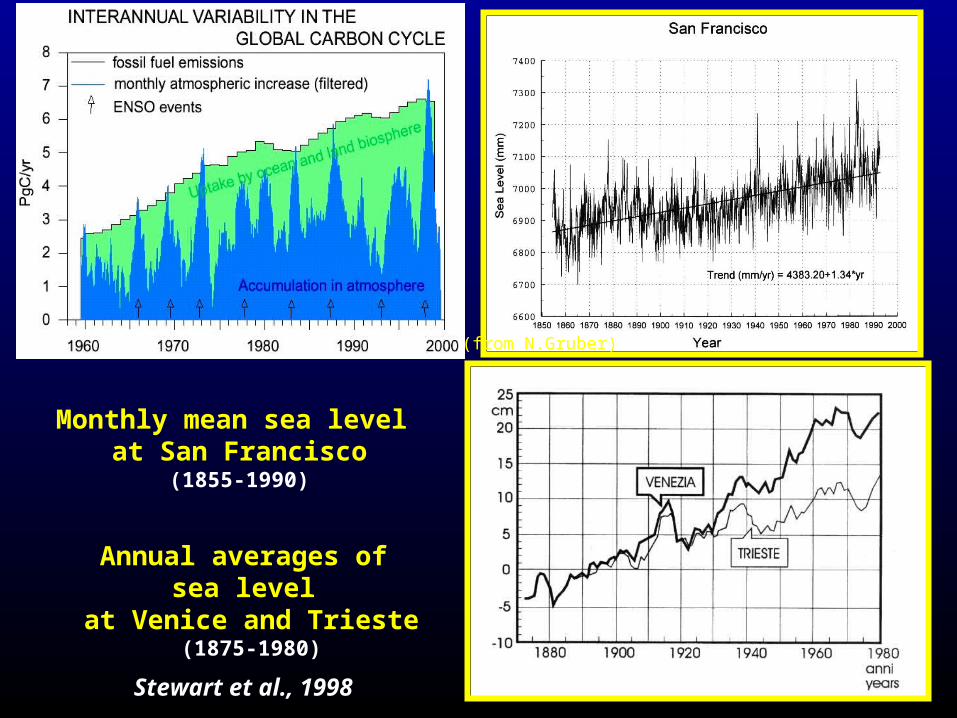
Stewart et al., 1998
Monthly mean sea level at San Francisco
(1855-1990)
Annual averages of sea level
at Venice and Trieste(1875-1980)
(from N.Gruber)
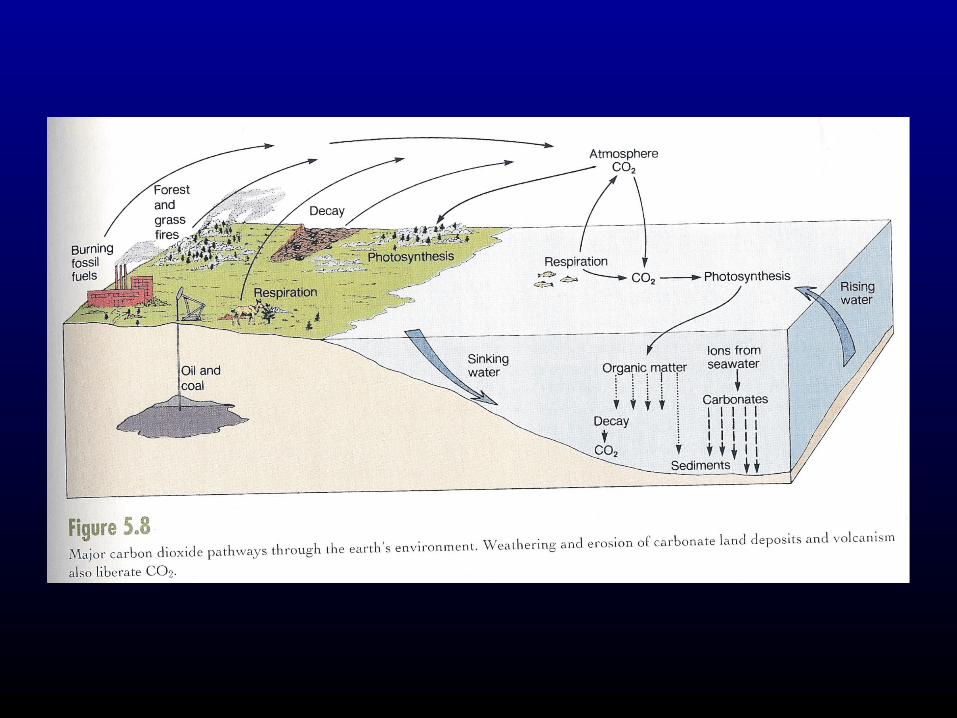

Respiration
Photosynthesis
CO2
O2
CO2
O2
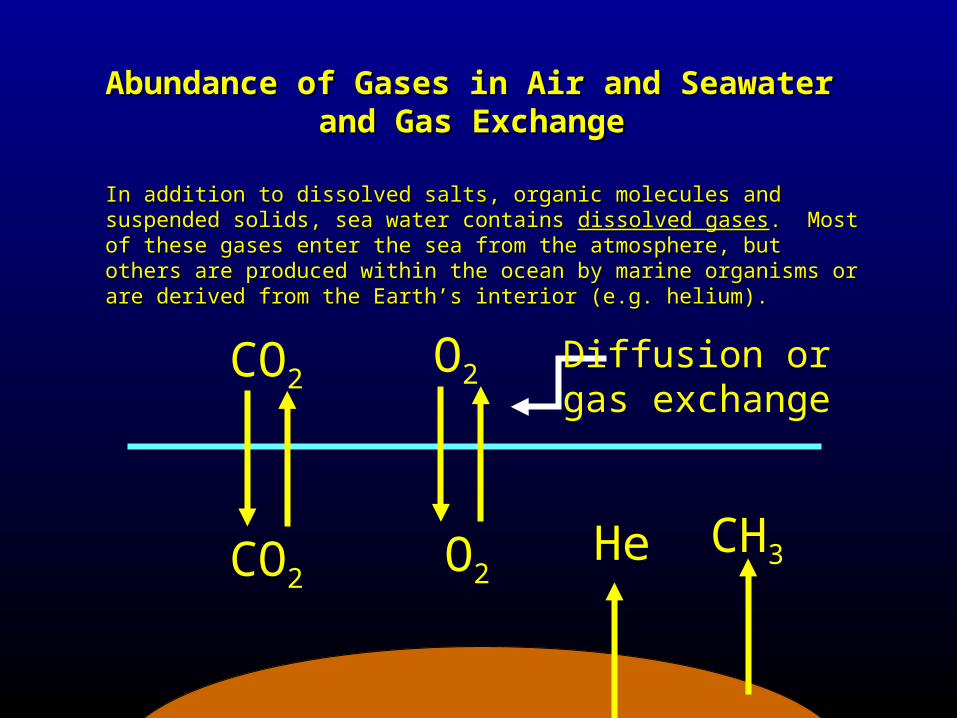
Abundance of Gases in Air and Seawater Abundance of Gases in Air and Seawater and Gas Exchangeand Gas Exchange
In addition to dissolved salts, organic molecules and suspended solids, sea In addition to dissolved salts, organic molecules and suspended solids, sea water contains water contains dissolved gasesdissolved gases. Most of these gases enter the sea from the . Most of these gases enter the sea from the atmosphere, but others are produced within the ocean by marine organisms or atmosphere, but others are produced within the ocean by marine organisms or are derived from the Earth’s interior (e.g. helium).are derived from the Earth’s interior (e.g. helium).
CO2
CO2
O2
O2
CH3He
Diffusion or gas exchange
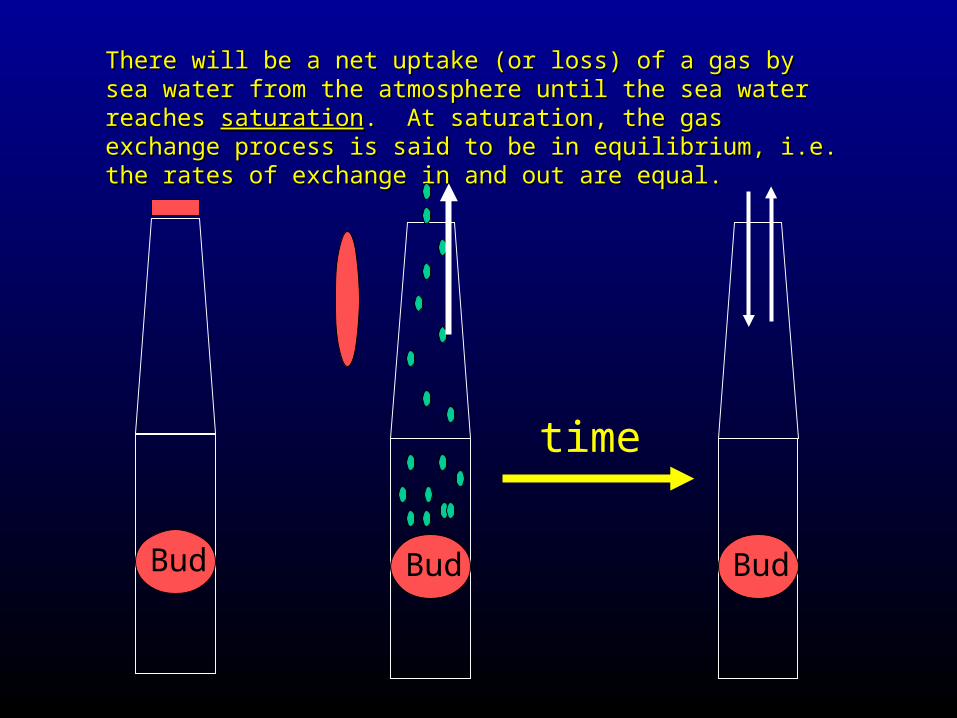
There will be a net uptake (or loss) of a gas by sea water from the There will be a net uptake (or loss) of a gas by sea water from the atmosphere until the sea water reaches atmosphere until the sea water reaches saturationsaturation. At saturation, the . At saturation, the gas exchange process is said to be in equilibrium, i.e. the rates of gas exchange process is said to be in equilibrium, i.e. the rates of exchange in and out are equal.exchange in and out are equal.
Bud Bud
time
Bud
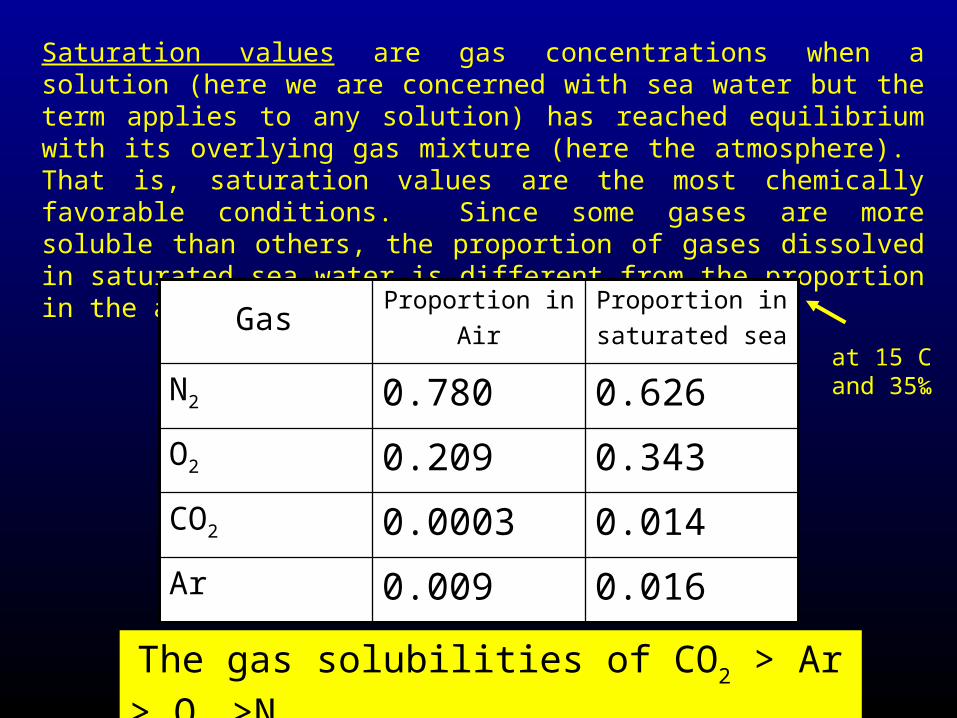
Saturation values are gas concentrations when a solution (here we are concerned with sea water but the term applies to any solution) has reached equilibrium with its overlying gas mixture (here the atmosphere). That is, saturation values are the most chemically favorable conditions. Since some gases are more soluble than others, the proportion of gases dissolved in saturated sea water is different from the proportion in the atmosphere.
0.016 0.009 Ar
0.014 0.0003 CO2
0.343 0.209 O2
0.626 0.780 N2
Proportion in
saturated sea
Proportion in
AirGas
at 15 C and 35‰
The gas solubilities of CO2 > Ar > O2 >N2
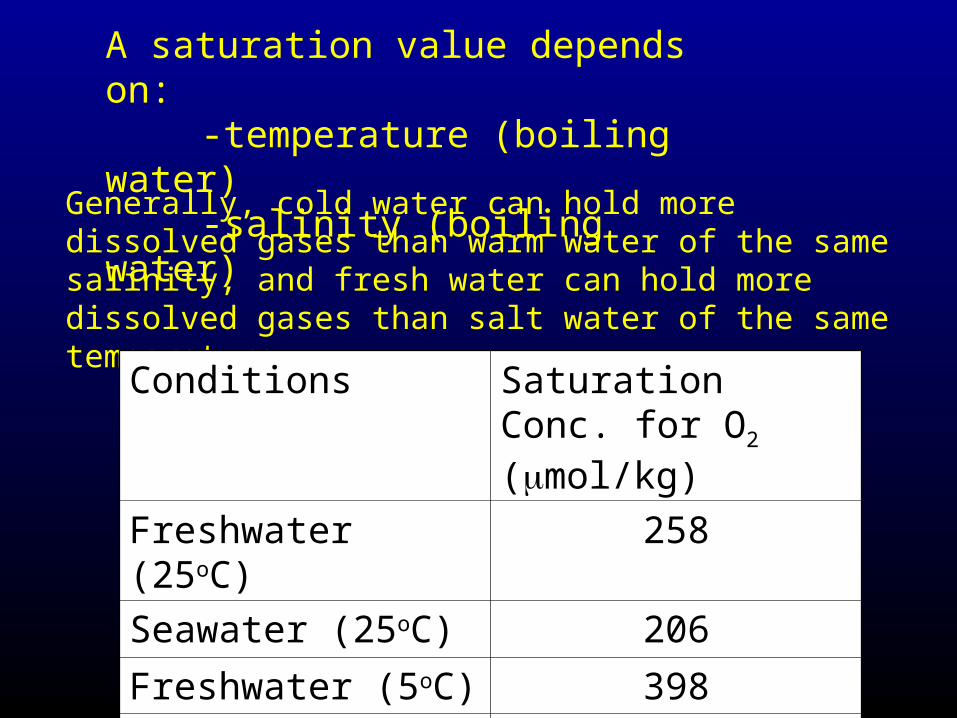
A saturation value depends on:-temperature (boiling water)-salinity (boiling water)
Generally, cold water can hold more dissolved gases than warm water of the same salinity, and fresh water can hold more dissolved gases than salt water of the same temperature.
Conditions Saturation Conc. for O2 (mol/kg)
Freshwater (25oC) 258
Seawater (25oC) 206
Freshwater (5oC) 398
Seawater (5oC) 308
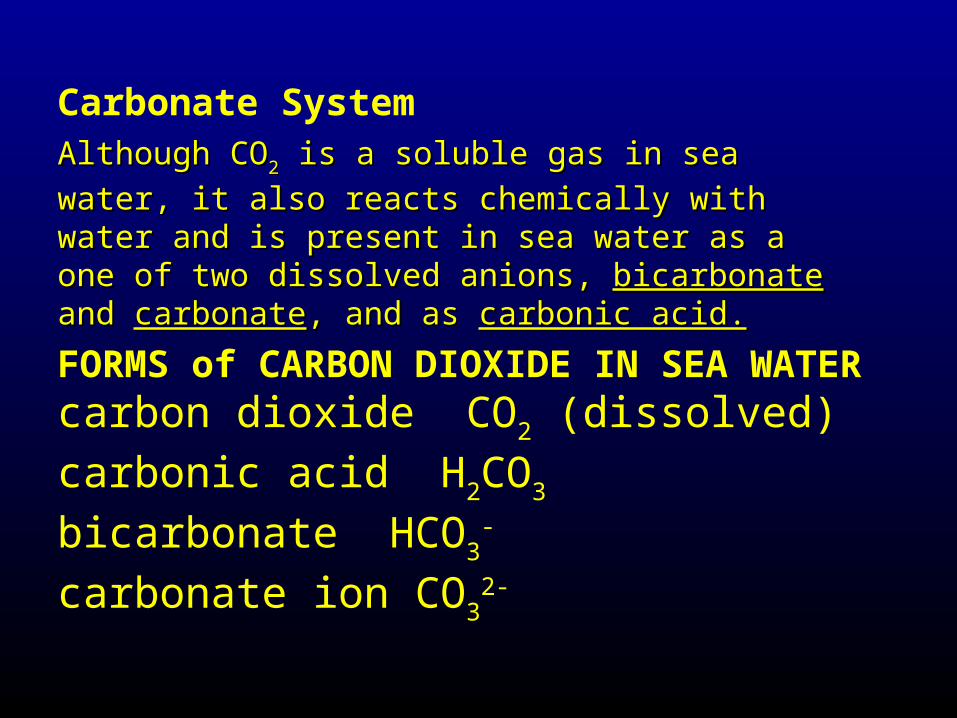
Carbonate System
Although COAlthough CO22 is a soluble gas in sea water, it also is a soluble gas in sea water, it also
reacts chemically with waterreacts chemically with water and is present in sea water and is present in sea water as a one of two dissolved anions, as a one of two dissolved anions, bicarbonatebicarbonate and and carbonatecarbonate, and as , and as carbonic acid.carbonic acid.
FORMS of CARBON DIOXIDE IN SEA WATERcarbon dioxide CO2 (dissolved)
carbonic acid H2CO3
bicarbonate HCO3-
carbonate ion CO32-
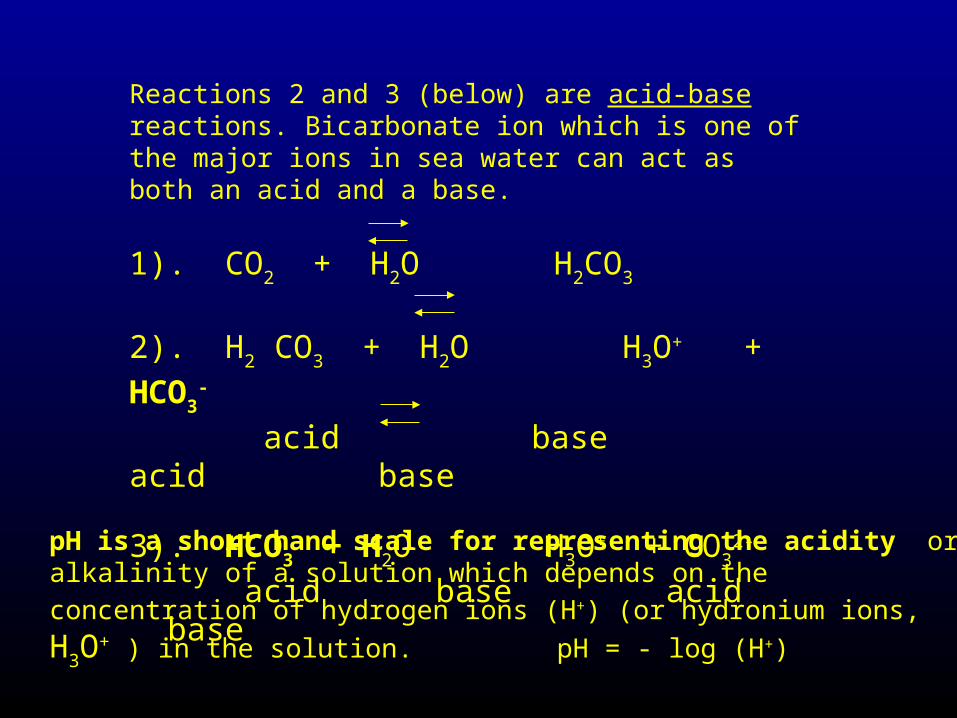
Reactions 2 and 3 (below) are acid-base reactions. Bicarbonate ion which is one of the major ions in sea water can act as both an acid and a base.
1). CO2 + H2O H2CO3
2). H2 CO3 + H2O H3O
+ + HCO3-
acid base acid base
3). HCO3- + H2O H3O
+ + CO32-
acid base acid base
pH is a short hand scale for representing the acidity or alkalinity of a solution which depends on the concentration of hydrogen ions (H+) (or
hydronium ions, H3O+ ) in the solution. pH = - log (H+)
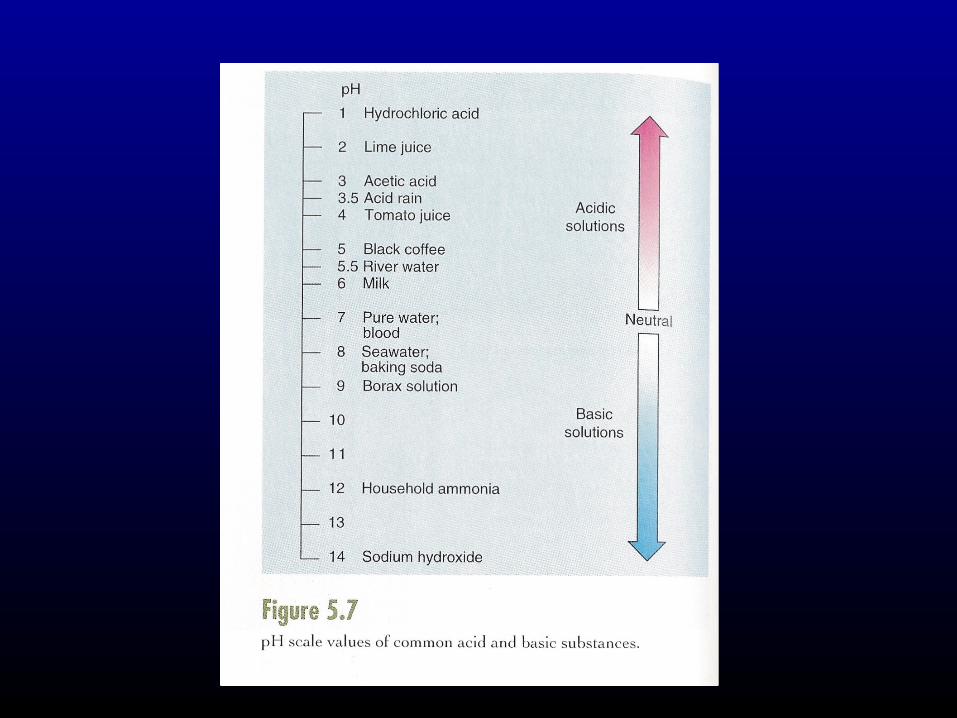
The carbonate system is largely responsible for maintaining seawater pH close to a value of 8. i.e., slightly alkaline. This is largely because in the ocean, sea water is also in contact with sediments that contain carbonate minerals the most important of which is calcite (CaCO3).
If excess acid is added to the deep ocean (say for example via hydrothermal vent emissions) the acid is neutralized by reacting with carbonate ions in solution, and these are replaced by dissolution of carbonates in the sediments. If excess base is added more carbonate minerals precipitate and and are removed to the sediments.
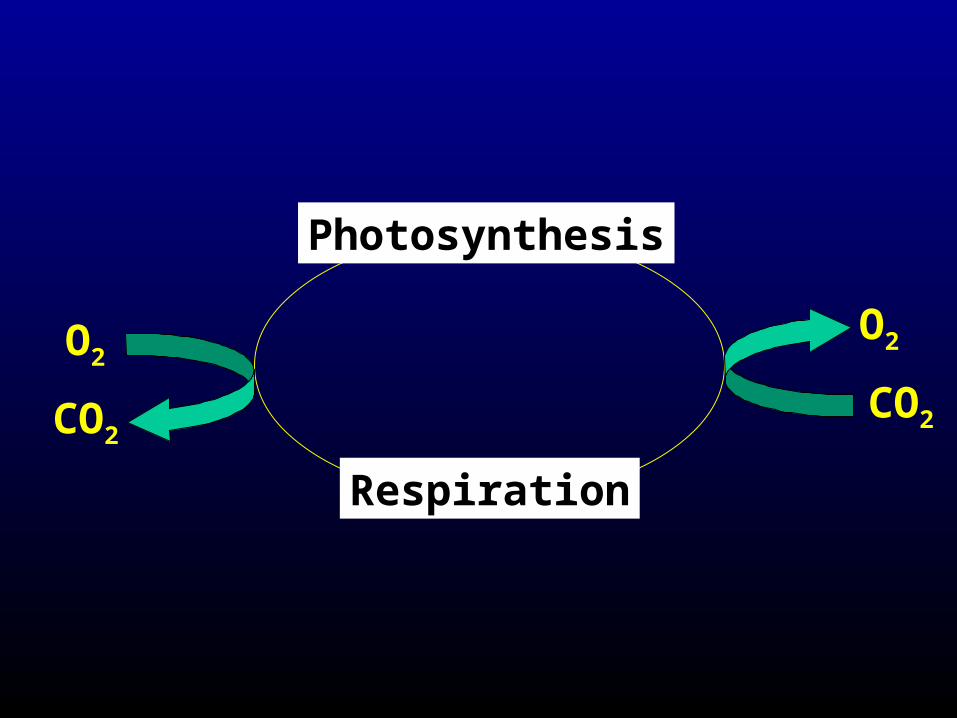
Respiration
Photosynthesis
CO2
O2
CO2
O2
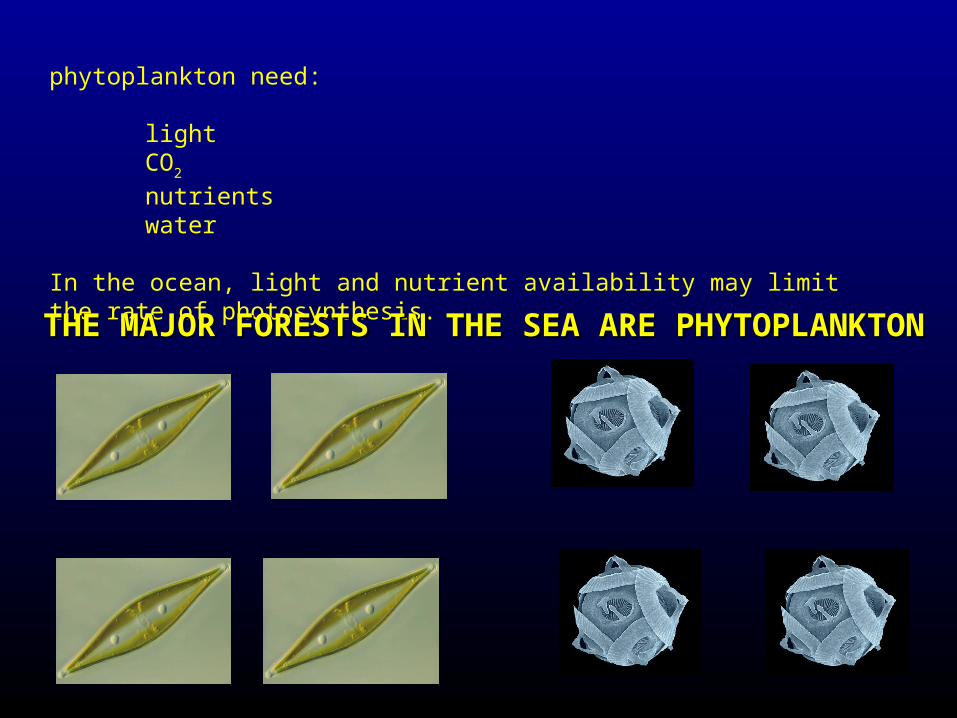
phytoplankton need:
lightCO2
nutrientswater
In the ocean, light and nutrient availability may limit the rate of photosynthesis.
THE MAJOR FORESTS IN THE SEA ARE PHYTOPLANKTONTHE MAJOR FORESTS IN THE SEA ARE PHYTOPLANKTON
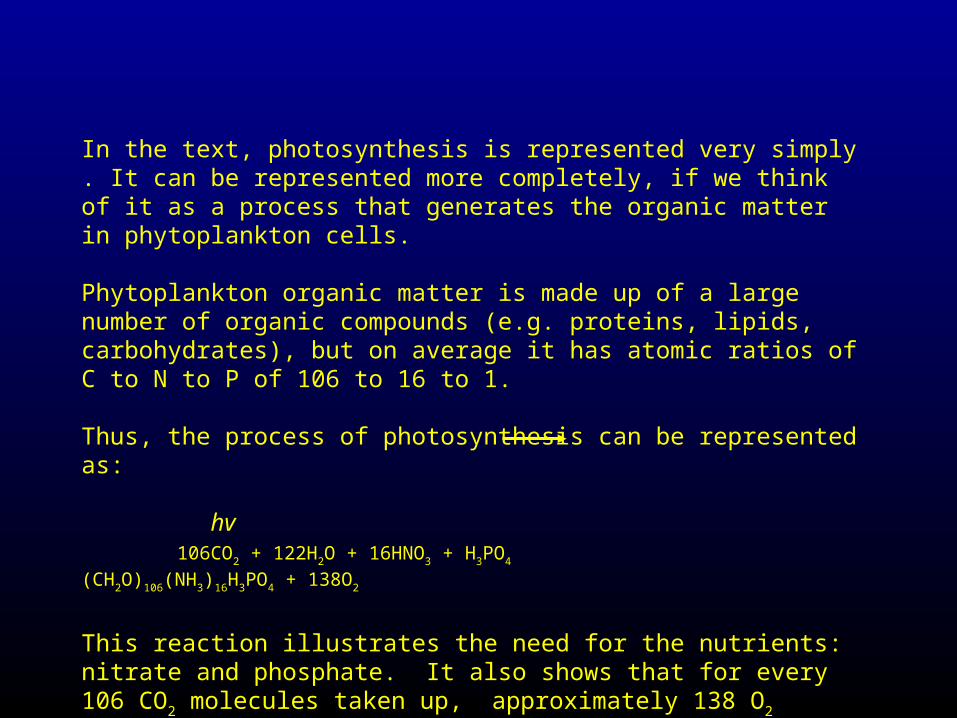
In the text, photosynthesis is represented very simply . It can be represented more completely, if we think of it as a process that generates the organic matter in phytoplankton cells. Phytoplankton organic matter is made up of a large number of organic compounds (e.g. proteins, lipids, carbohydrates), but on average it has atomic ratios of C to N to P of 106 to 16 to 1. Thus, the process of photosynthesis can be represented as: hv
106CO2 + 122H2O + 16HNO3 + H3PO4 (CH2O)106(NH3)16H3PO4 + 138O2
This reaction illustrates the need for the nutrients: nitrate and phosphate. It also shows that for every 106 CO2 molecules taken up, approximately
138 O2 molecules are liberated.
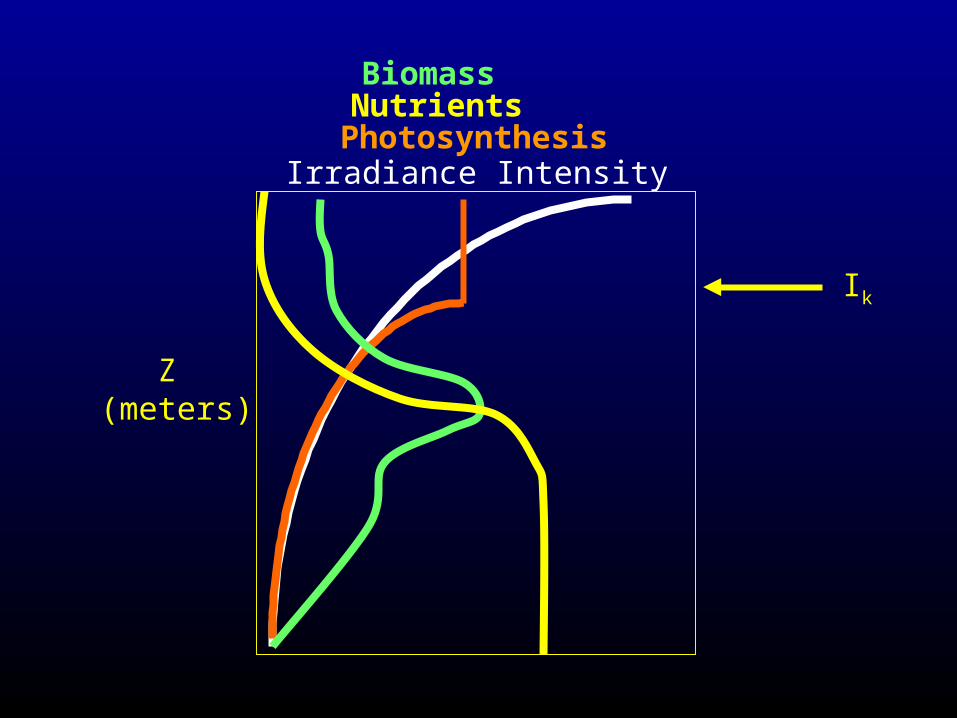
Irradiance Intensity
Z (meters)
Ik
Photosynthesis
BiomassNutrients
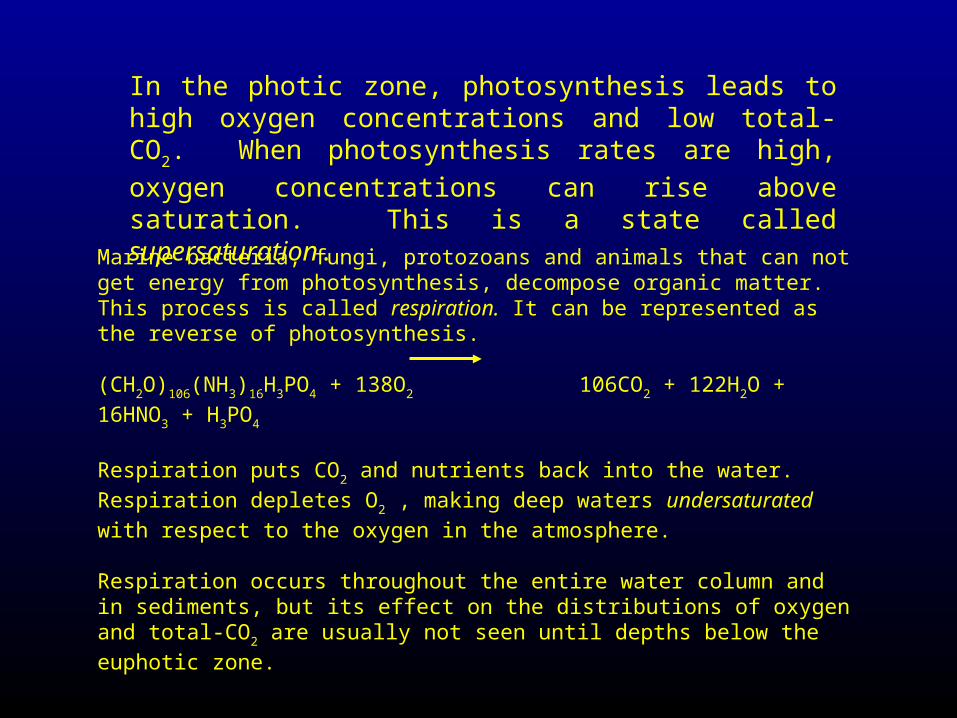
In the photic zone, photosynthesis leads to high oxygen concentrations and low total-CO2. When photosynthesis
rates are high, oxygen concentrations can rise above saturation. This is a state called supersaturation.
Marine bacteria, fungi, protozoans and animals that can not get energy from photosynthesis, decompose organic matter. This process is called respiration. It can be represented as the reverse of photosynthesis. (CH2O)106(NH3)16H3PO4 + 138O2 106CO2 + 122H2O + 16HNO3 + H3PO4
Respiration puts CO2 and nutrients back into the water. Respiration depletes
O2 , making deep waters undersaturated with respect to the oxygen in the
atmosphere. Respiration occurs throughout the entire water column and in sediments, but its effect on the distributions of oxygen and total-CO2 are usually not seen until
depths below the euphotic zone.
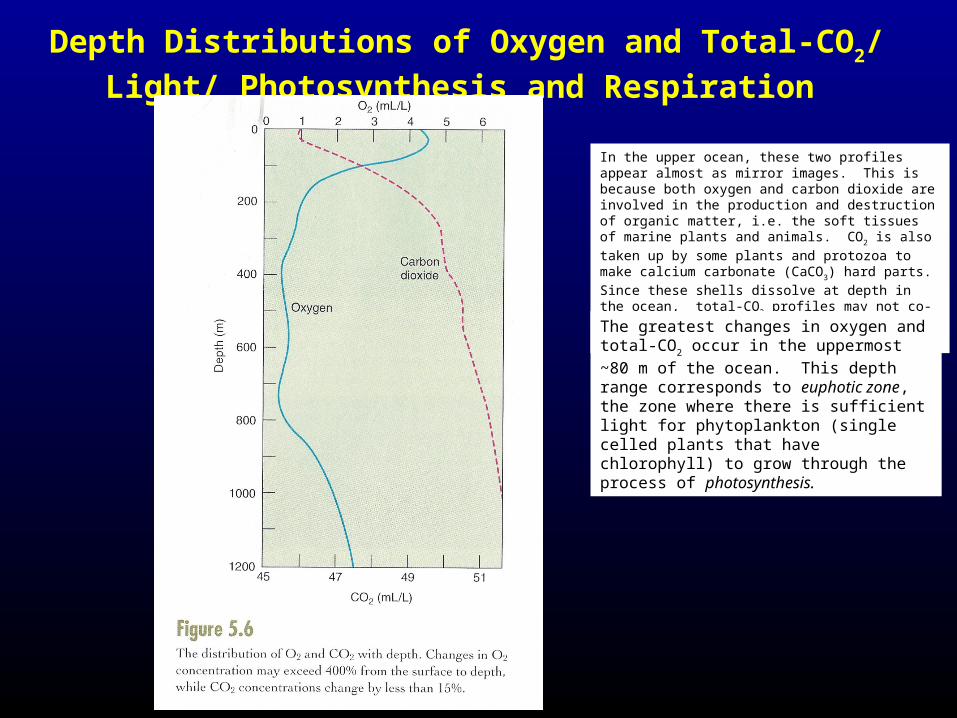
Depth Distributions of Oxygen and Total-CO2/ Light/
Photosynthesis and Respiration
In the upper ocean, these two profiles appear almost as mirror images. This is because both oxygen and carbon dioxide are involved in the production and destruction of organic matter, i.e. the soft tissues of marine plants and animals. CO2 is also taken up by some plants and
protozoa to make calcium carbonate (CaCO3) hard parts.
Since these shells dissolve at depth in the ocean, total-CO2 profiles may not co-vary as closely with oxygen
profiles at depth.
The greatest changes in oxygen and total-CO2
occur in the uppermost ~80 m of the ocean. This depth range corresponds to euphotic zone, the zone where there is sufficient light for phytoplankton (single celled plants that have chlorophyll) to grow through the process of photosynthesis.
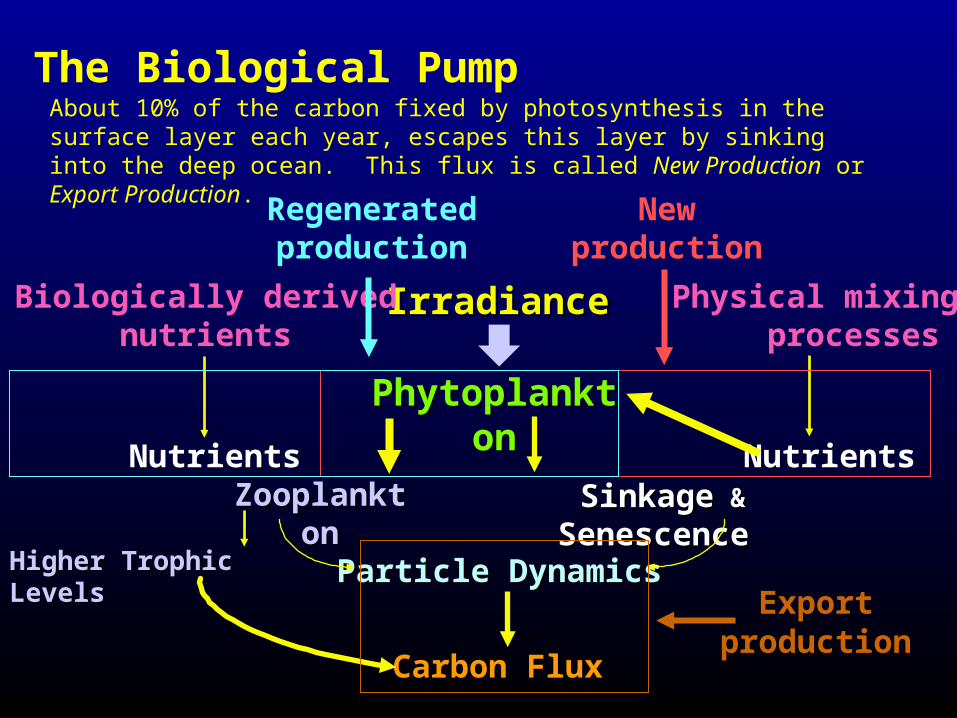
The Biological Pump About 10% of the carbon fixed by photosynthesis in the surface layer each year, escapes this layer by sinking into the deep ocean. This flux is called New Production or Export Production.
Physical mixing processes
Nutrients
IrradianceIrradiance
PhytoplanktonPhytoplankton
SinkageSinkage & & SenescenceSenescence
Particle DynamicsParticle Dynamics
Carbon FluxCarbon Flux
ZooplanktonZooplankton
Higher Trophic LevelsHigher Trophic Levels
Nutrients
Biologically derivednutrients
Newproduction
Regeneratedproduction
Exportproduction
The biological pump is an important mechanism for
removing fossil fuel CO2 from the
atmosphere into the ocean because
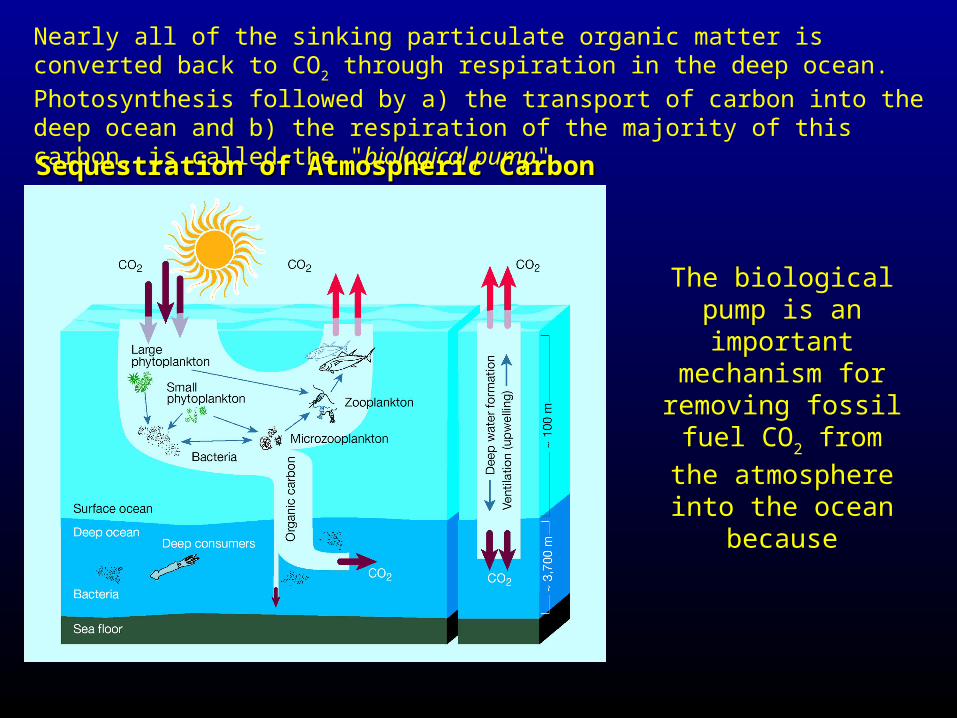
Sequestration of Atmospheric CarbonSequestration of Atmospheric Carbon
Nearly all of the sinking particulate organic matter is converted back to CO2 through
respiration in the deep ocean. Photosynthesis followed by a) the transport of carbon into the deep ocean and b) the respiration of the majority of this carbon, is called the "biological pump".
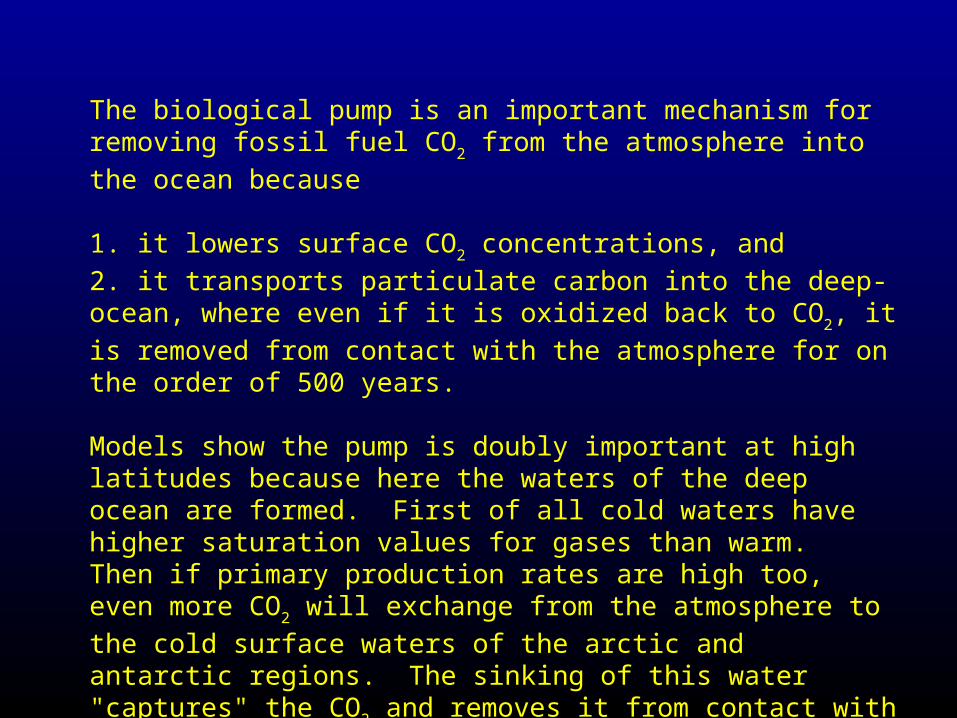
The biological pump is an important mechanism for removing fossil fuel CO2 from the atmosphere into the ocean because
1. it lowers surface CO2 concentrations, and
2. it transports particulate carbon into the deep-ocean, where even if it is oxidized back to CO2, it is removed from contact with the
atmosphere for on the order of 500 years. Models show the pump is doubly important at high latitudes because here the waters of the deep ocean are formed. First of all cold waters have higher saturation values for gases than warm. Then if primary production rates are high too, even more CO2 will exchange
from the atmosphere to the cold surface waters of the arctic and antarctic regions. The sinking of this water "captures" the CO2 and
removes it from contact with the atmosphere.
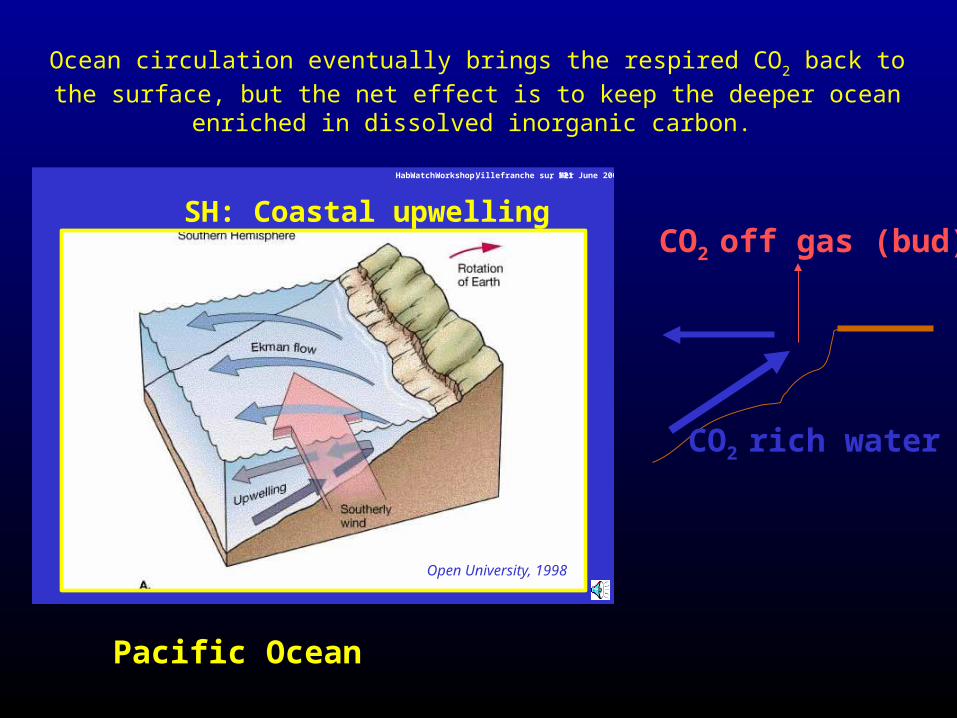
Ocean circulation eventually brings the respired CO2 back to the surface, but the
net effect is to keep the deeper ocean enriched in dissolved inorganic carbon.
HabWatch Workshop, Villefranche sur Mer, 11-21 June 2003
SH: Coastal upwelling
Open University, 1998
Pacific Ocean
CO2 rich water
CO2 off gas (bud)
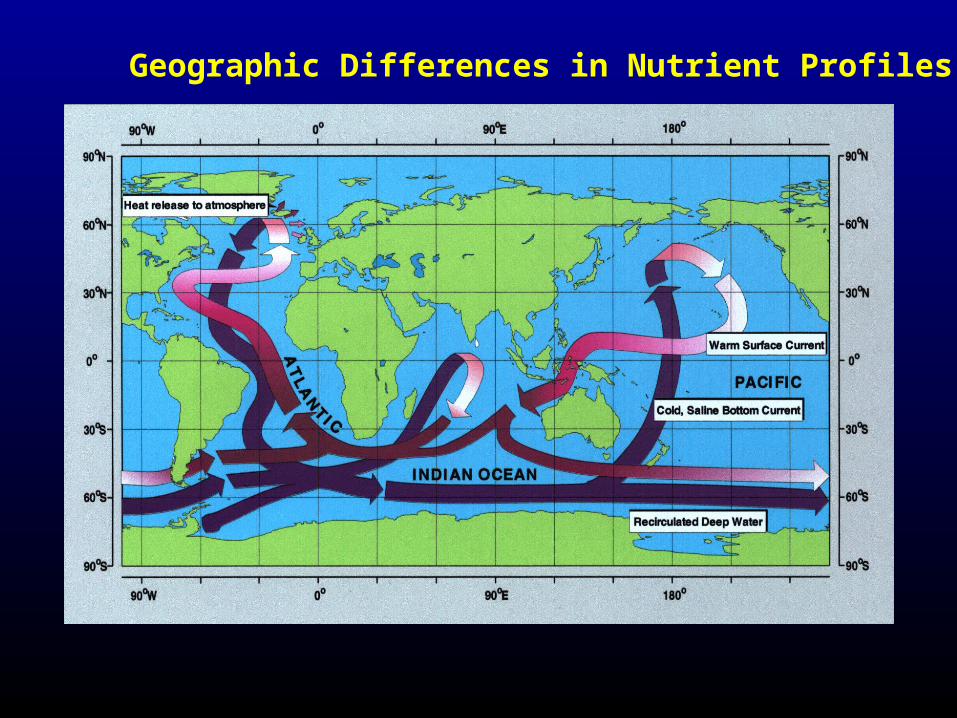
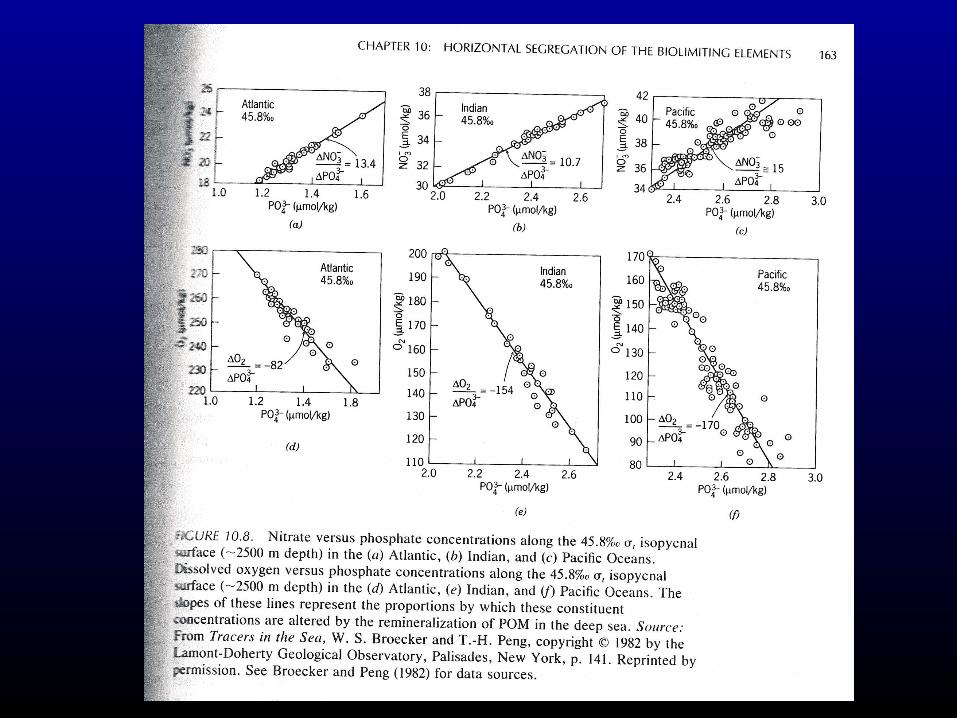
Geographic Differences in Nutrient Profiles
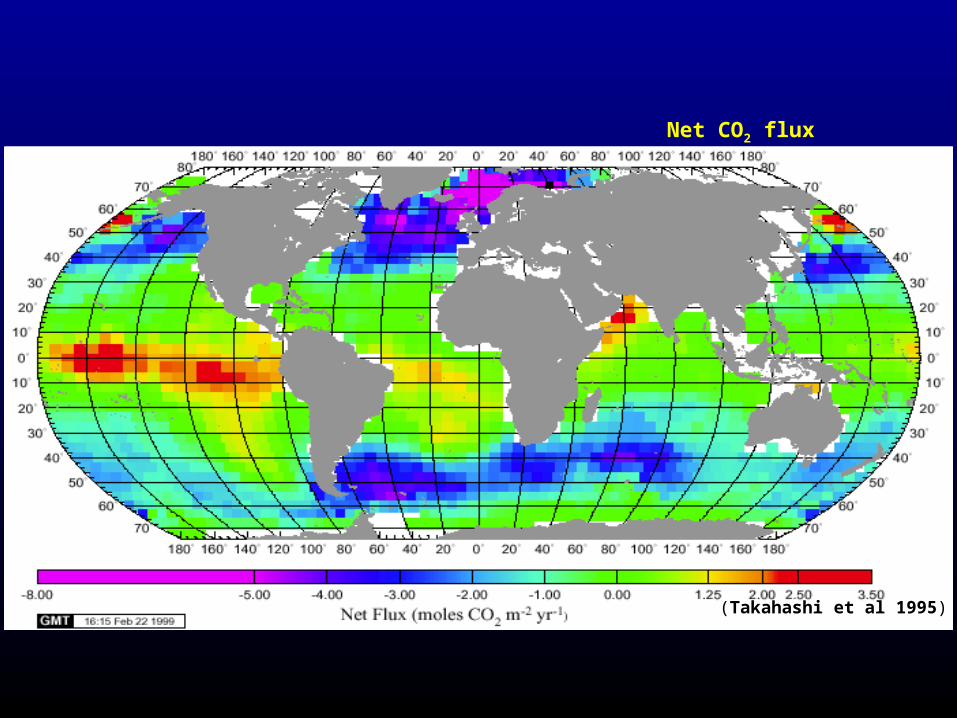
(Takahashi et al 1995)
Net CO2 flux
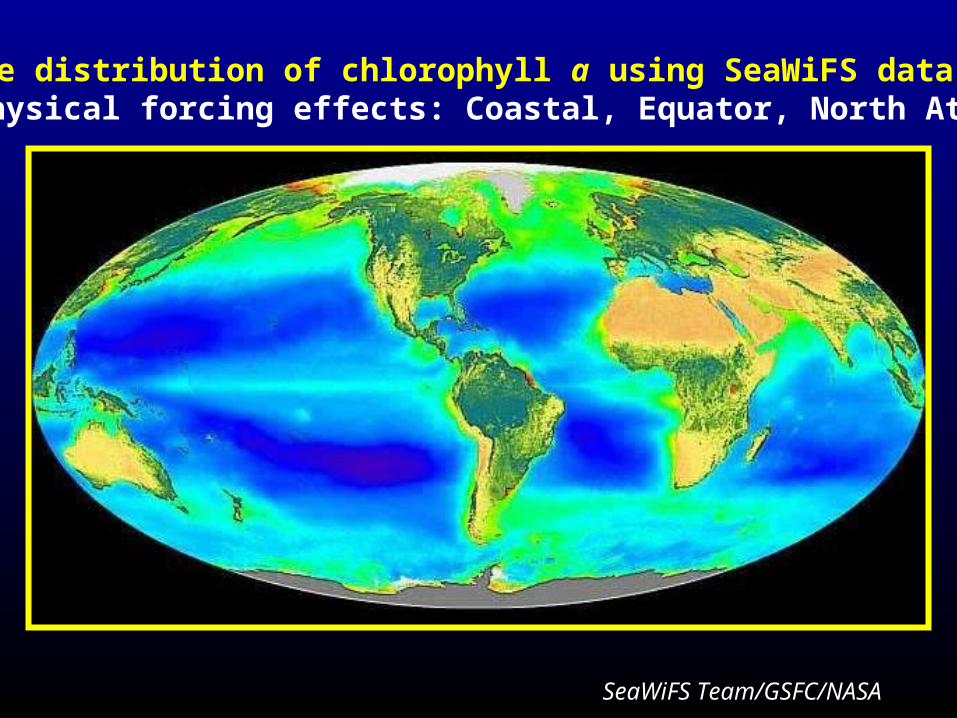
SeaWiFS Team/GSFC/NASA
Surface distribution of chlorophyll a using SeaWiFS data sets:Note physical forcing effects: Coastal, Equator, North Atlantic
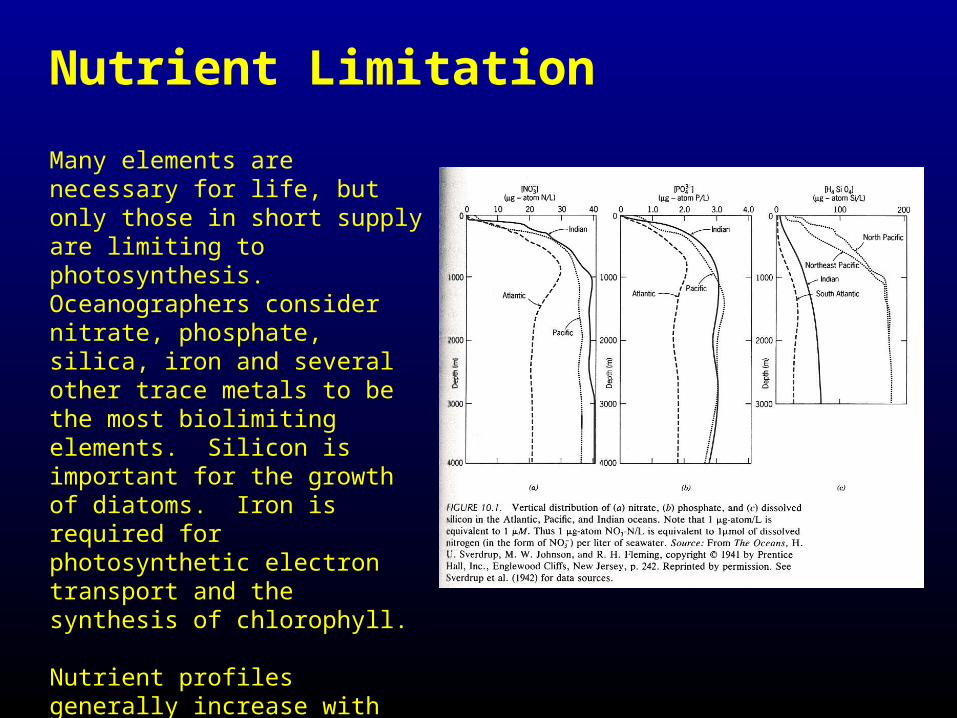
Nutrient Limitation
Many elements are necessary for life, but only those in short supply are limiting to photosynthesis. Oceanographers consider nitrate, phosphate, silica, iron and several other trace metals to be the most biolimiting elements. Silicon is important for the growth of diatoms. Iron is required for photosynthetic electron transport and the synthesis of chlorophyll. Nutrient profiles generally increase with depth. Concentrations may be below detection in surface waters, especially in the open ocean.
Nutrient sources to surface waters are:rivers and land runoffupwellingatmosphere
The most productive regions of the oceans are the coastal regions because this is where upwelling is strongest and where river and land runoff meet the sea. Here nutrients result in high productivity rates, which in turn result large fisheries.
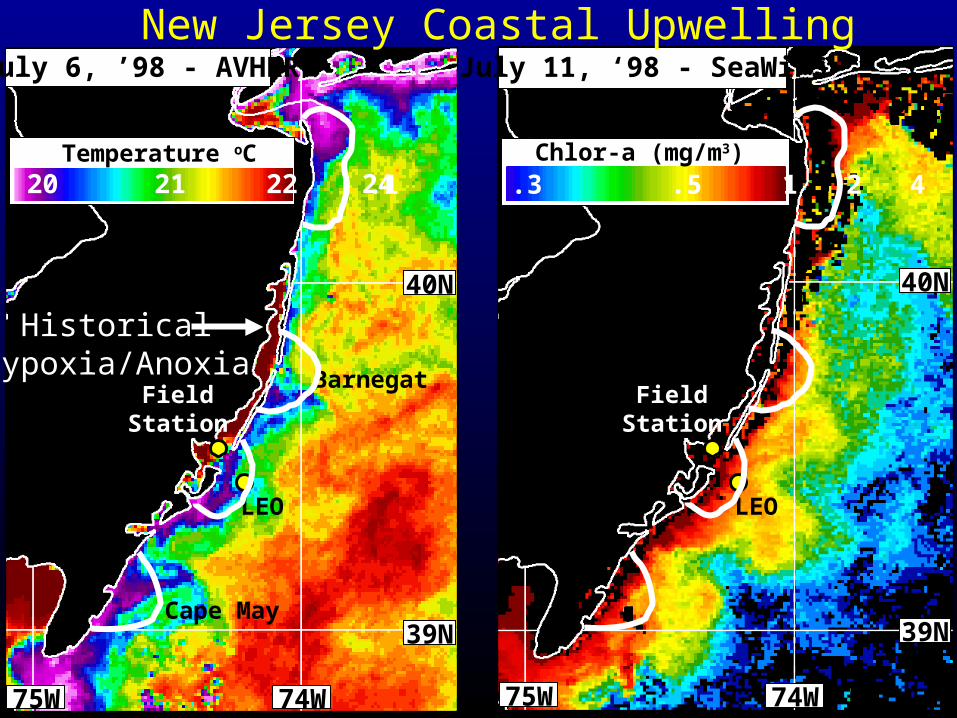
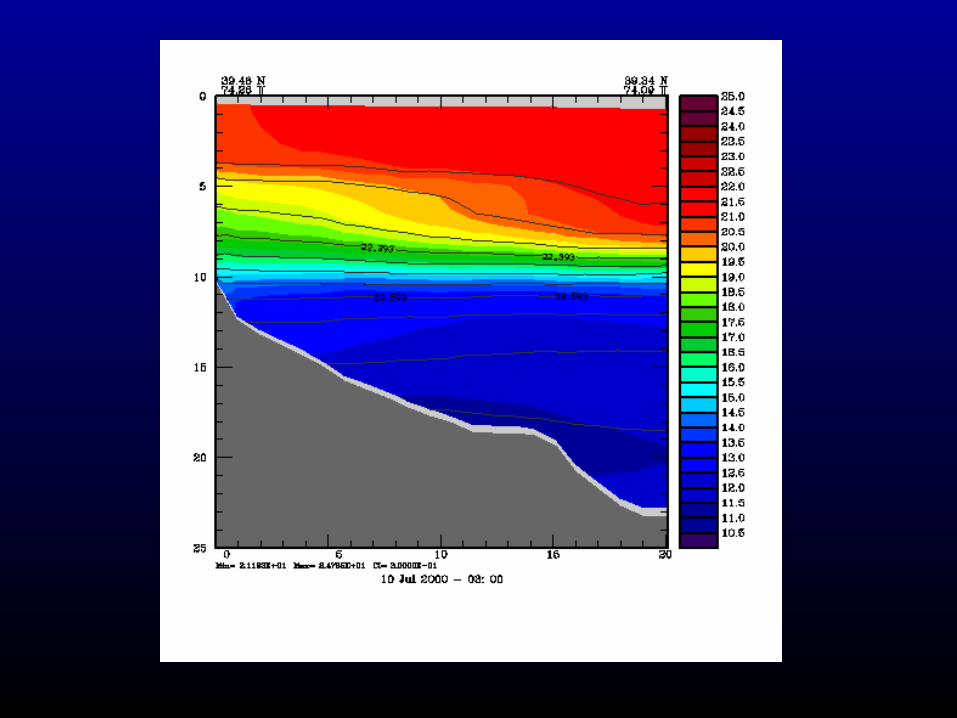
40N
74W75W
39N
Temperature oC19 20 21 22 24
July 6, ’98 - AVHRR
FieldStation
LEO
40N
74W75W
39N
FieldStation
Chlor-a (mg/m3)
.1 .3 .5 1 2 4
July 11, ‘98 - SeaWiFS
LEO
Barnegat
Cape May
New Jersey Coastal Upwelling
HistoricalHypoxia/Anoxia

Geographic Differences in Nutrient Profiles