Embed Size (px)
Citation preview

1 / 24

introduction to profilingNode.js applicationsPatrick Mueller @pmuellr, muellerware.org senior node engineer at NodeSource
http://pmuellr.github.io/slides/2015/12-profiling-node-intro http://pmuellr.github.io/slides/2015/12-profiling-node-intro/slides.pdf http://pmuellr.github.io/slides/ (all of Patrick's slides)
2 / 24
what kind of profiling?
performance with V8's CPU profiler
memory with V8's heap snapshots
profiling Node.js applications
3 / 24
profiling performance
profiling Node.js applications
4 / 24

what does V8's CPU profiler do?
trigger profiler on / off
when on, at regular intervals, V8 will
capture current stack trace, with time stamp,
and source file / line numbers
when turned off, profiler will aggregate the
information, and produce a JSON data
structure for analysis tools
profiling performance profiling Node.js applications
5 / 24
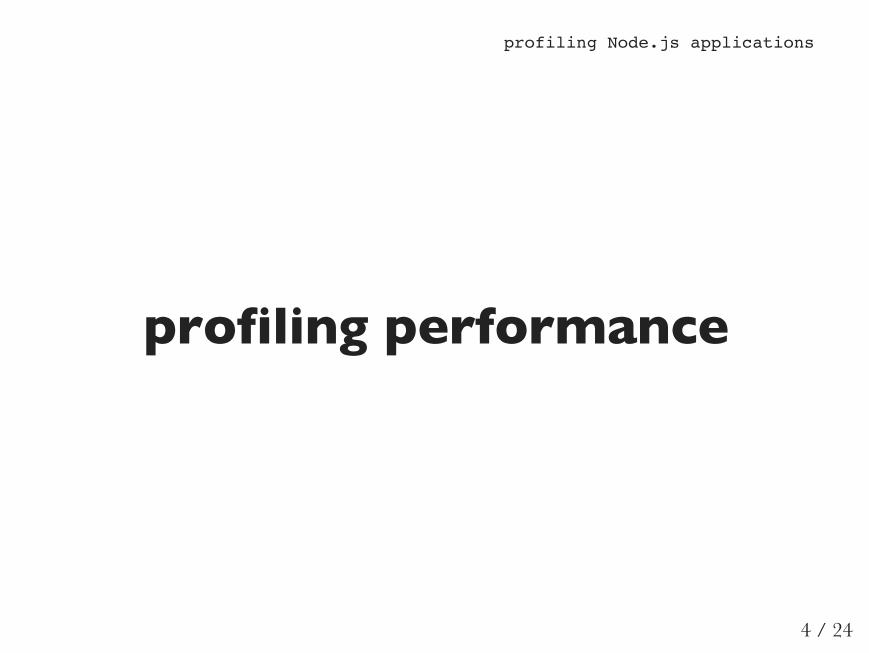
understanding CPU profiling
intro: Google Developers: Speed UpJavaScript Execution
provides times spent executing functions:
self time - time to run the function, notincluding any functions that it called
total time - time to run the function,including any functions that it called
profiling performance profiling Node.js applications
6 / 24
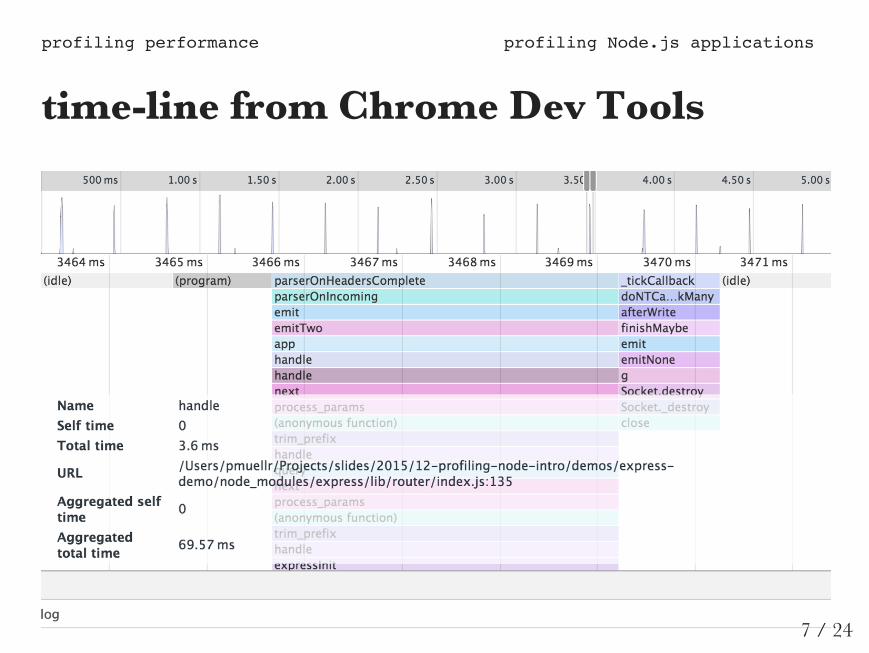
time-line from Chrome Dev Toolsprofiling performance profiling Node.js applications
7 / 24
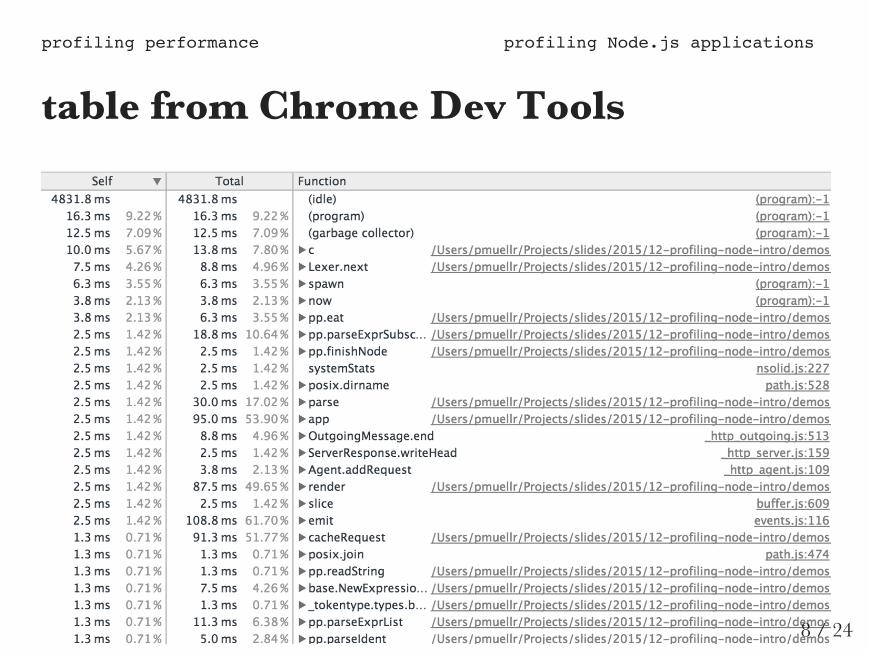
table from Chrome Dev Toolsprofiling performance profiling Node.js applications
8 / 24
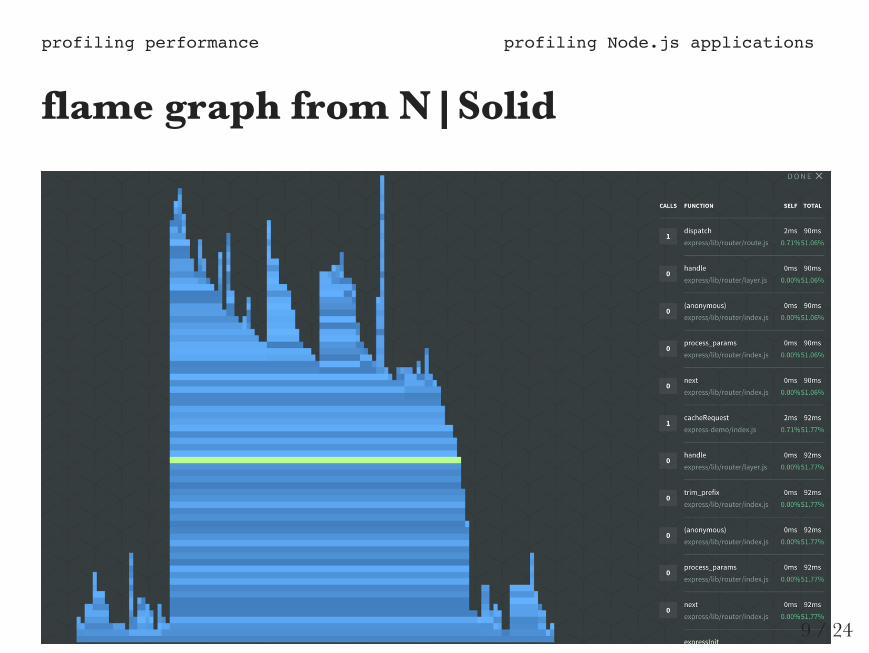
flame graph from N|Solidprofiling performance profiling Node.js applications
9 / 24
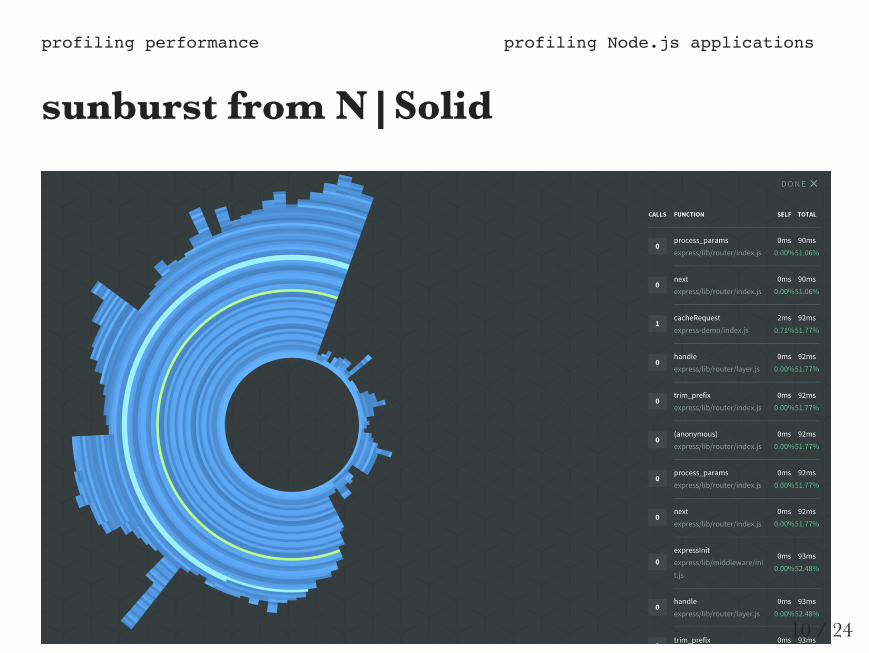
sunburst from N|Solidprofiling performance profiling Node.js applications
10 / 24
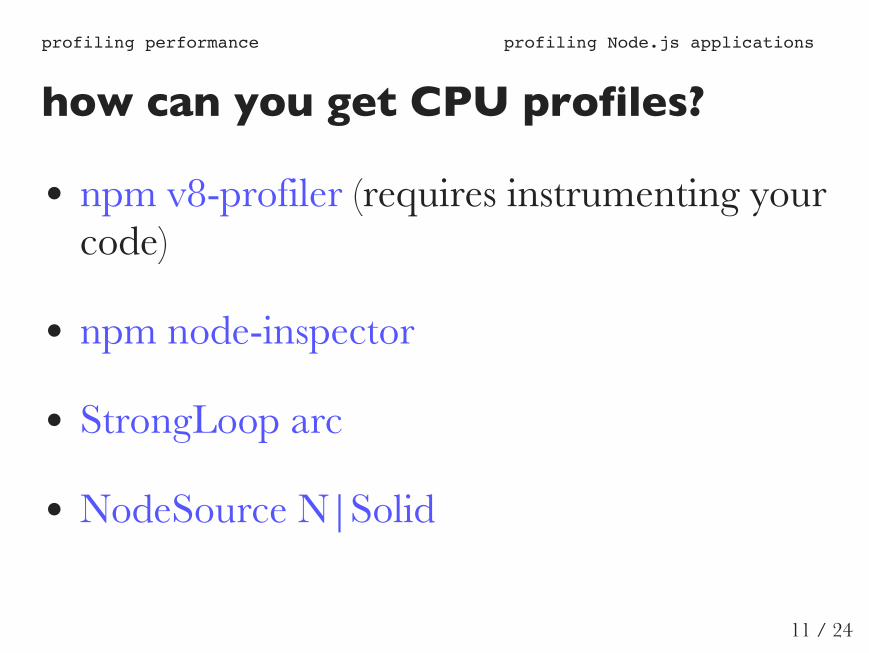
how can you get CPU profiles?
npm v8-profiler (requires instrumenting yourcode)
npm node-inspector
StrongLoop arc
NodeSource N|Solid
profiling performance profiling Node.js applications
11 / 24
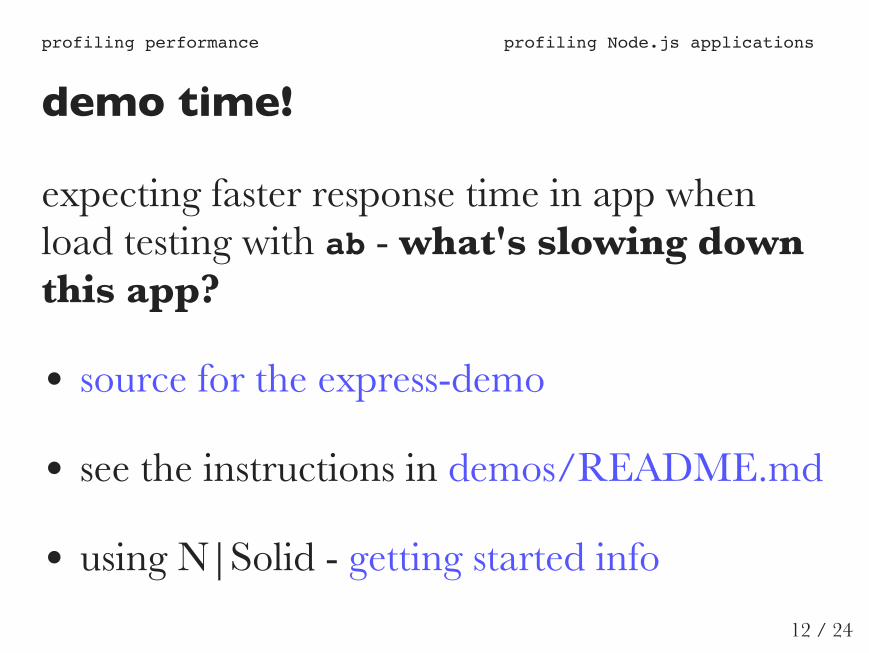
demo time!
expecting faster response time in app whenload testing with ab - what's slowing downthis app?
source for the express-demo
see the instructions in demos/README.md
using N|Solid - getting started info
profiling performance profiling Node.js applications
12 / 24

profiling memory
profiling Node.js applications
13 / 24
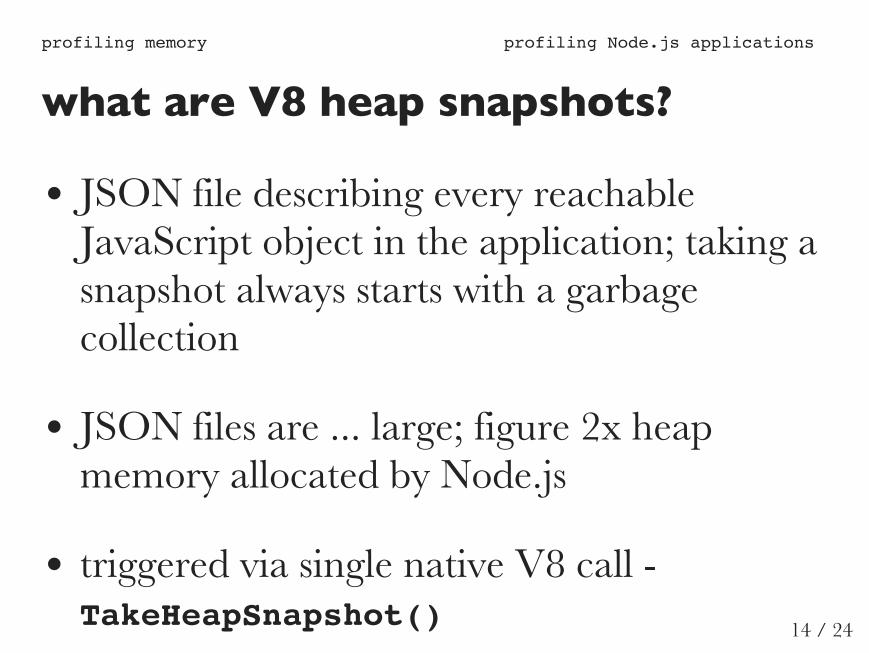
what are V8 heap snapshots?
JSON file describing every reachable
JavaScript object in the application; taking a
snapshot always starts with a garbage
collection
JSON files are ... large; figure 2x heap
memory allocated by Node.js
triggered via single native V8 call -
TakeHeapSnapshot()
profiling memory profiling Node.js applications
14 / 24
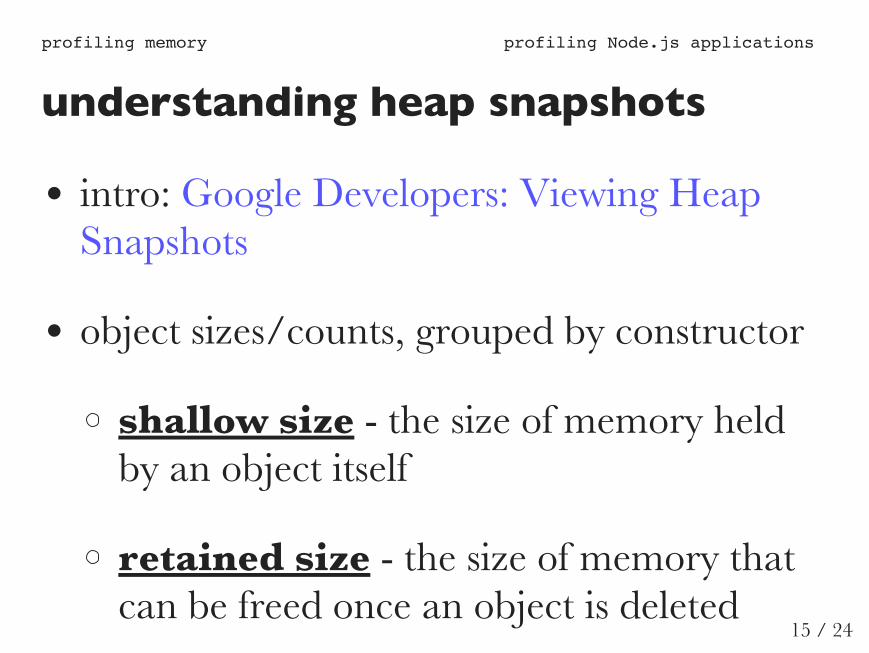
understanding heap snapshots
intro: Google Developers: Viewing Heap
Snapshots
object sizes/counts, grouped by constructor
shallow size - the size of memory held
by an object itself
retained size - the size of memory that
can be freed once an object is deleted
profiling memory profiling Node.js applications
15 / 24
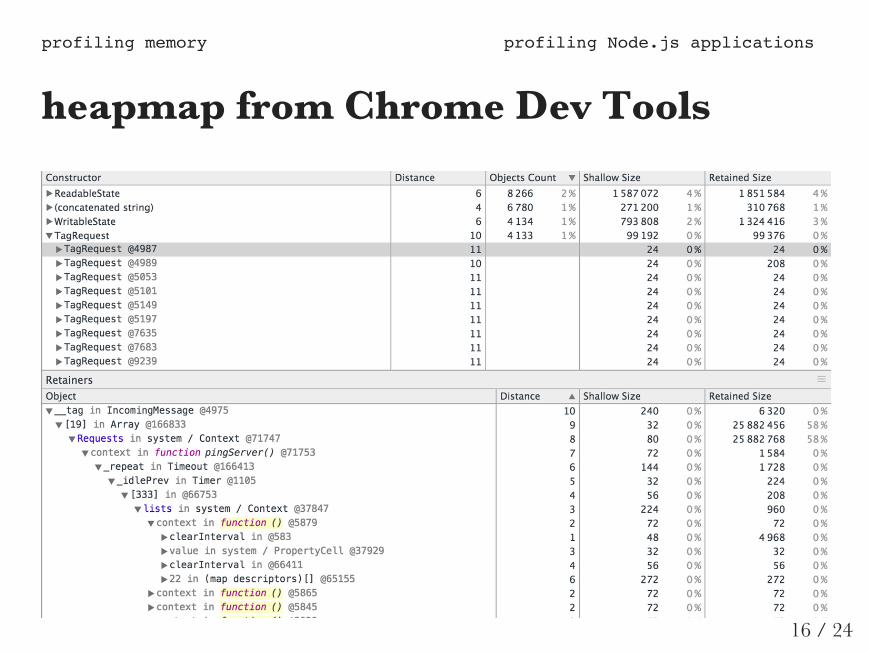
heapmap from Chrome Dev Toolsprofiling memory profiling Node.js applications
16 / 24
what kind of output can you get?
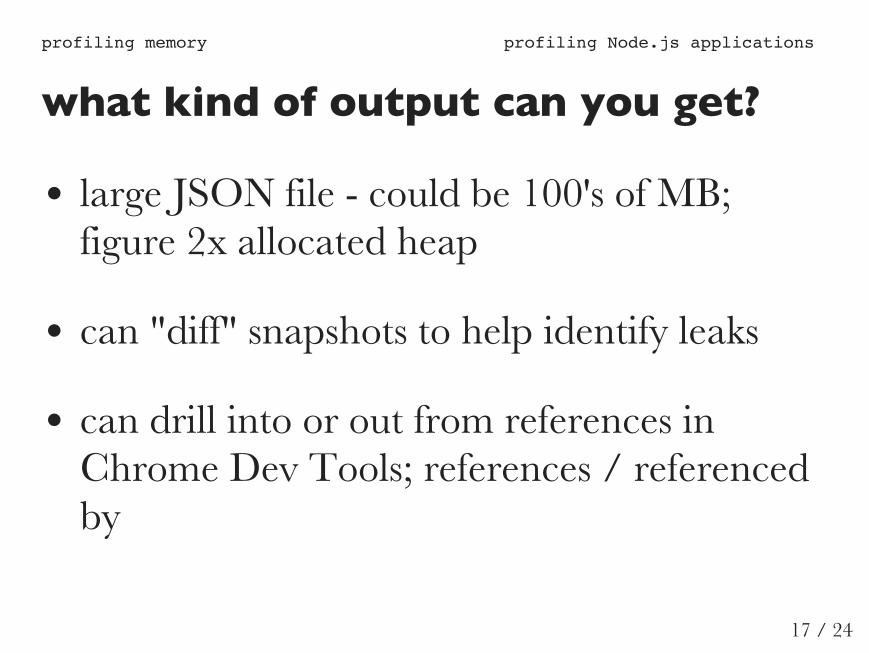
large JSON file - could be 100's of MB;
figure 2x allocated heap
can "diff" snapshots to help identify leaks
can drill into or out from references in
Chrome Dev Tools; references / referenced
by
profiling memory profiling Node.js applications
17 / 24
how can you get heap snapshots?
npm v8-profiler (requires instrumenting yourcode)
npm node-inspector
StrongLoop arc
NodeSource N|Solid
profiling memory profiling Node.js applications
18 / 24
demo time!
this app seems to be leaking memory - whatobjects are leaking?
source for the express-demo
see the instructions in demos/README.md
using N|Solid - getting started info
profiling memory profiling Node.js applications
19 / 24
profiling tips
profiling Node.js applications
20 / 24
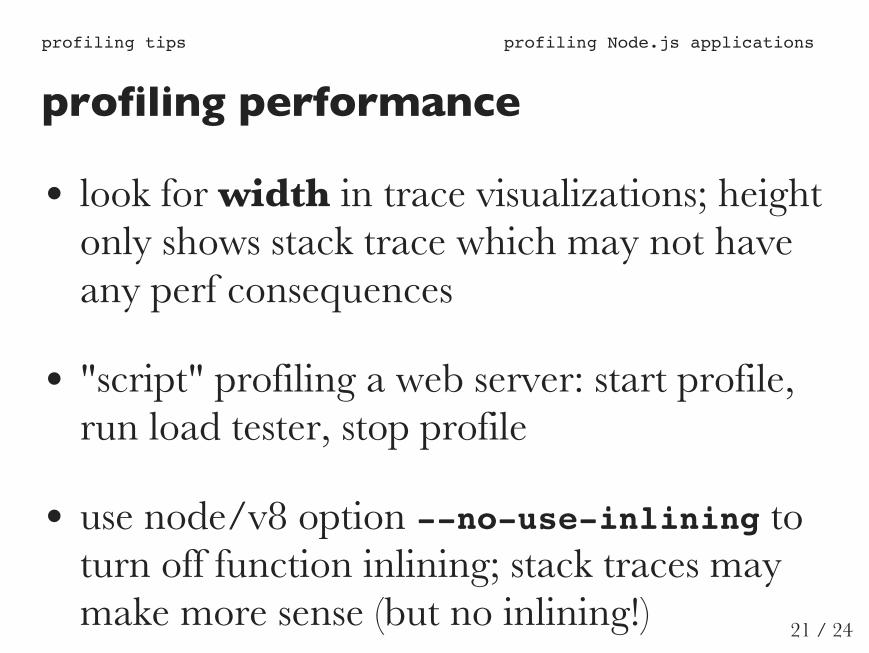
profiling performance
look for width in trace visualizations; heightonly shows stack trace which may not haveany perf consequences
"script" profiling a web server: start profile,run load tester, stop profile
use node/v8 option --no-use-inlining toturn off function inlining; stack traces maymake more sense (but no inlining!)
profiling tips profiling Node.js applications
21 / 24
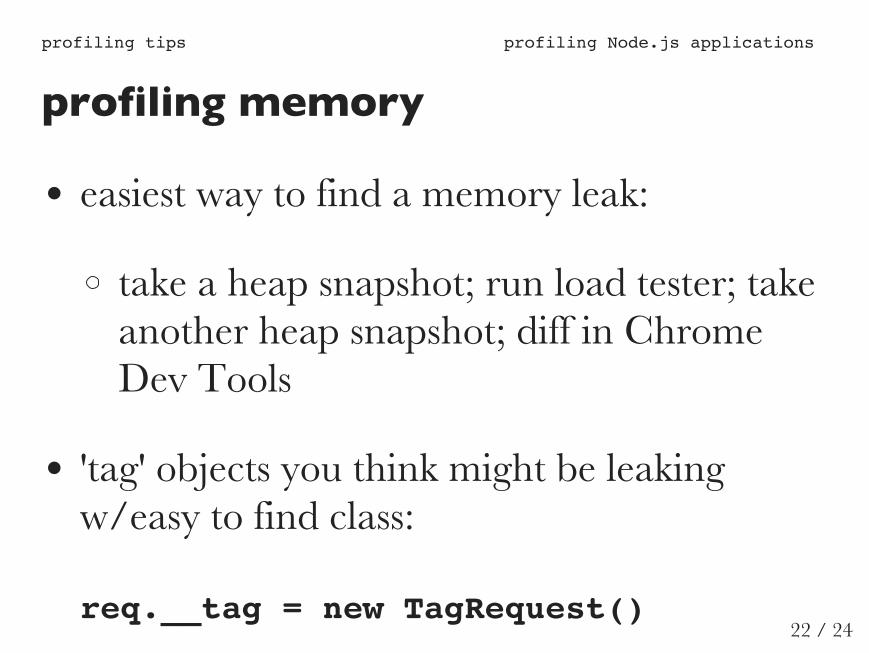
profiling memory
easiest way to find a memory leak:
take a heap snapshot; run load tester; takeanother heap snapshot; diff in ChromeDev Tools
'tag' objects you think might be leakingw/easy to find class:
req.__tag = new TagRequest()
profiling tips profiling Node.js applications
22 / 24

fin
profiling Node.js applications
23 / 24

profiling Node.js applications
24 / 24