Embed Size (px)
Citation preview

Introduction to Relative Positional Tolerance
Computing with Trimble Access and Trimble Business
Center Software
1
Course Objectives
YOUR PROFESSIONAL GRADE PARTNER2
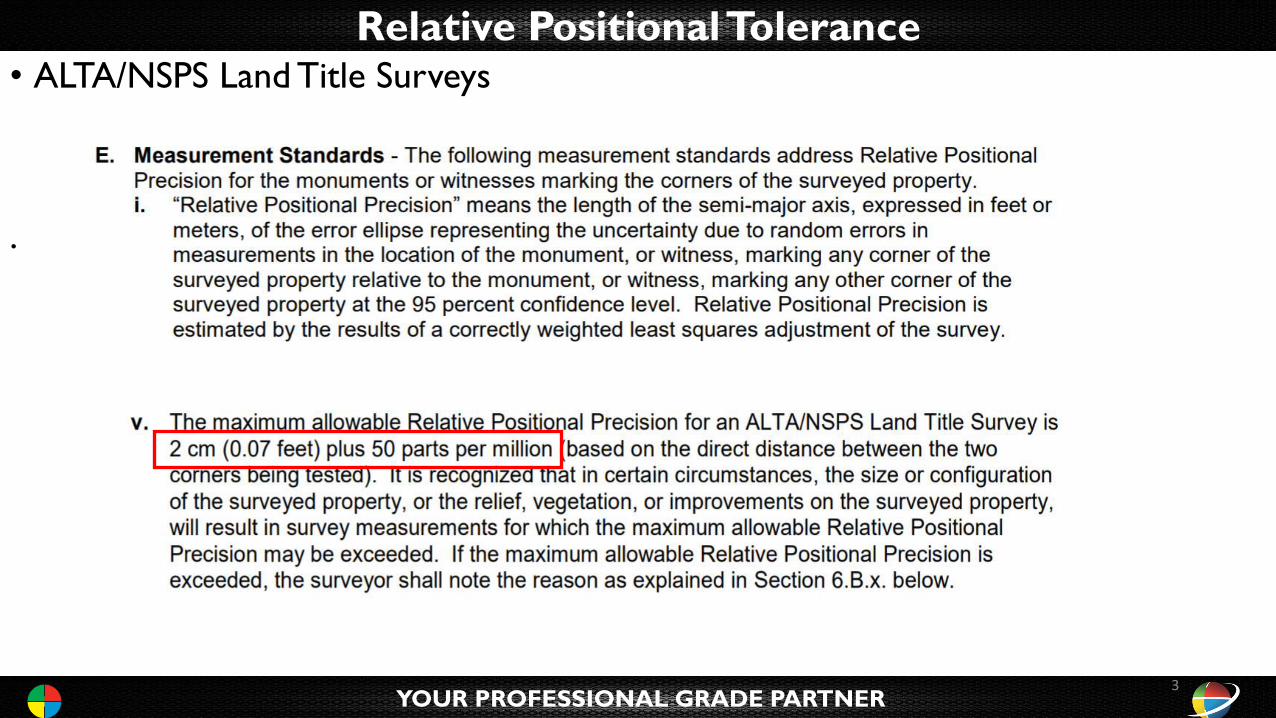
Relative Positional Tolerance• ALTA/NSPS Land Title Surveys
.
YOUR PROFESSIONAL GRADE PARTNER3
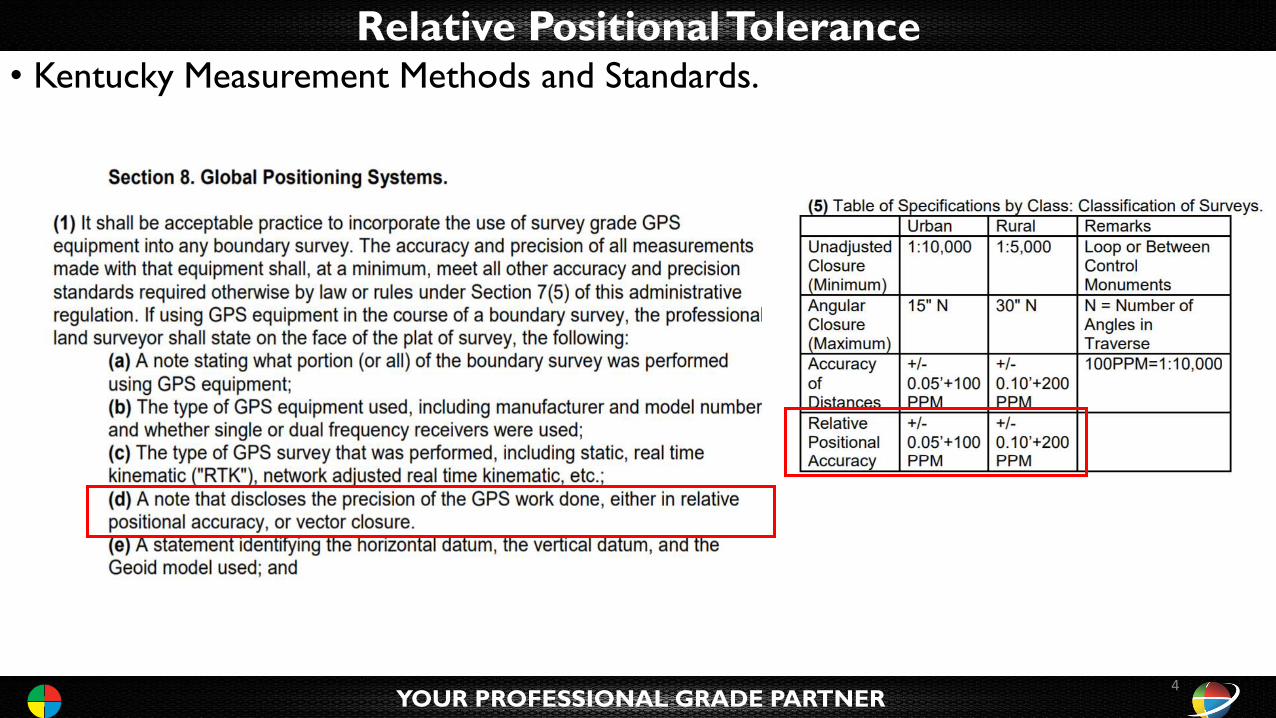
Relative Positional Tolerance• Kentucky Measurement Methods and Standards.
YOUR PROFESSIONAL GRADE PARTNER4
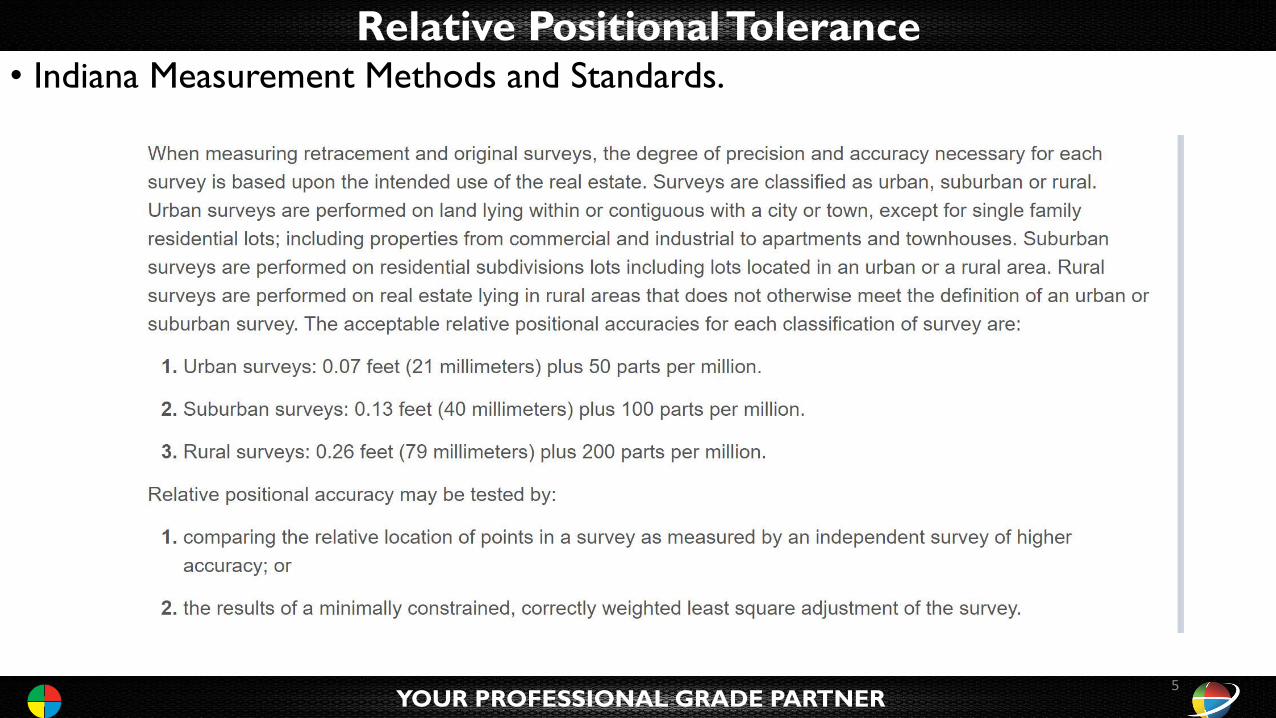
Relative Positional Tolerance• Indiana Measurement Methods and Standards.
YOUR PROFESSIONAL GRADE PARTNER5
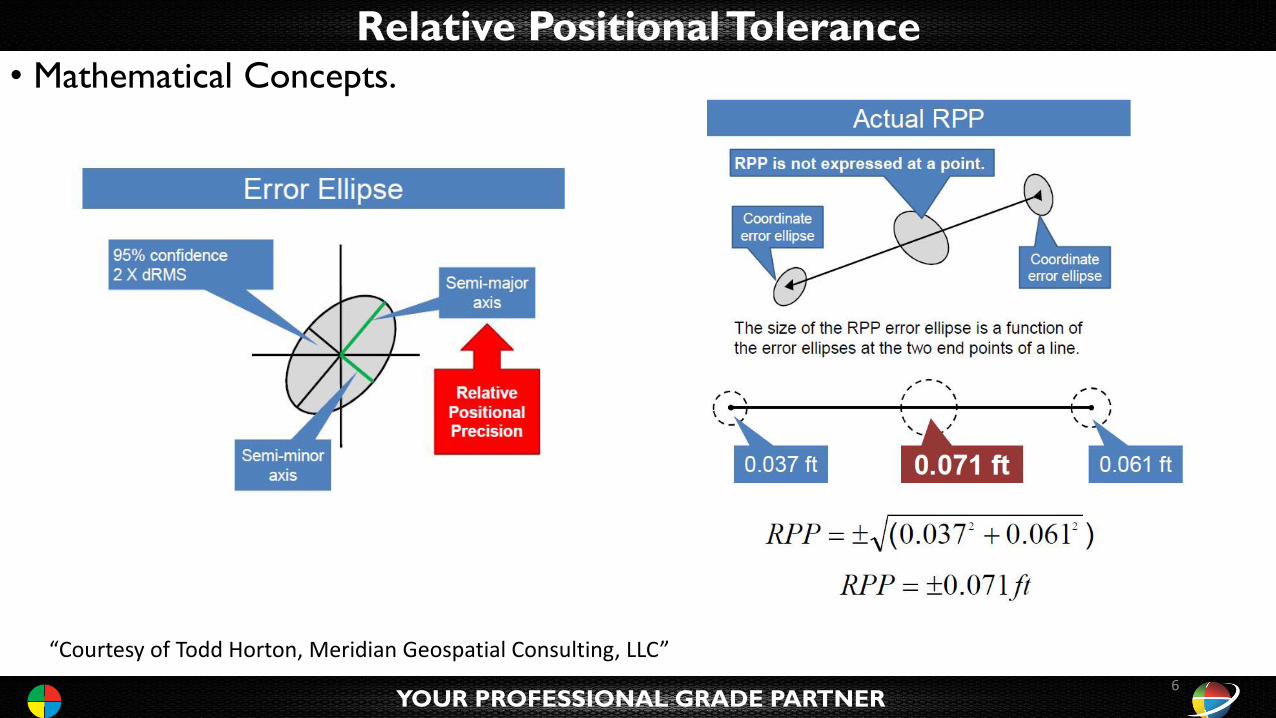
Relative Positional Tolerance• Mathematical Concepts.
YOUR PROFESSIONAL GRADE PARTNER
“Courtesy of Todd Horton, Meridian Geospatial Consulting, LLC”
6
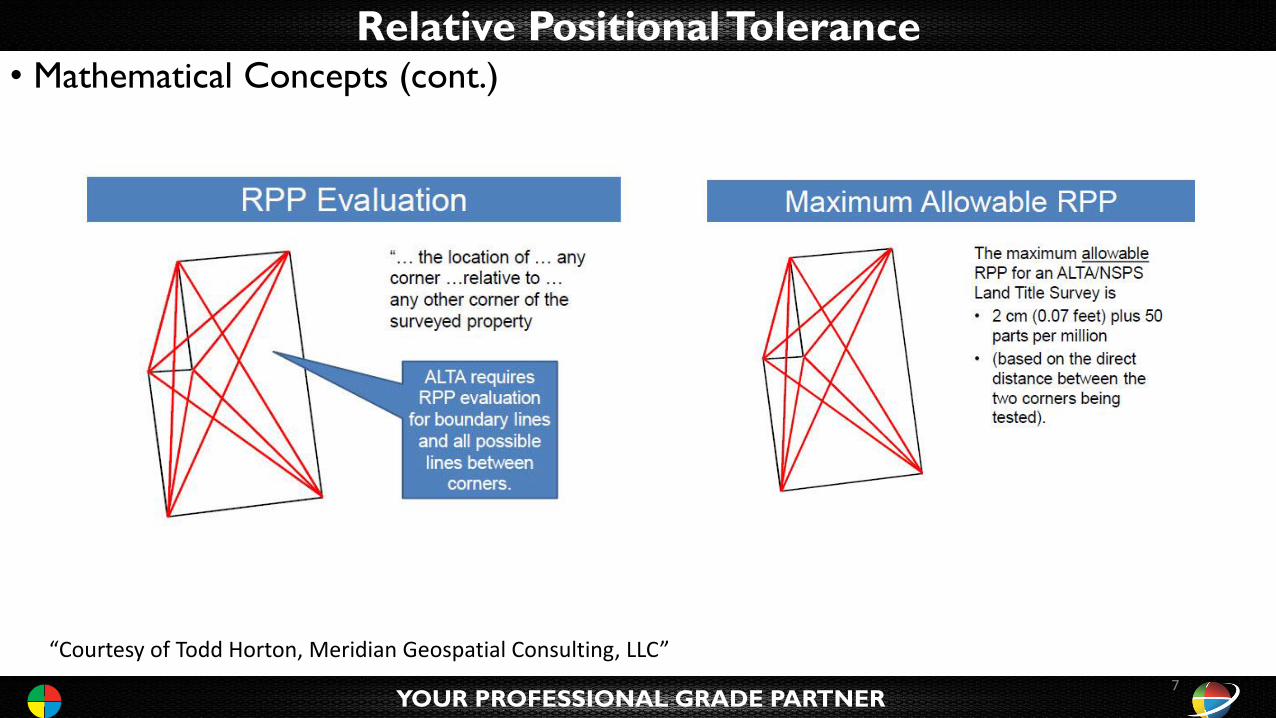
Relative Positional Tolerance• Mathematical Concepts (cont.)
YOUR PROFESSIONAL GRADE PARTNER
“Courtesy of Todd Horton, Meridian Geospatial Consulting, LLC”
7
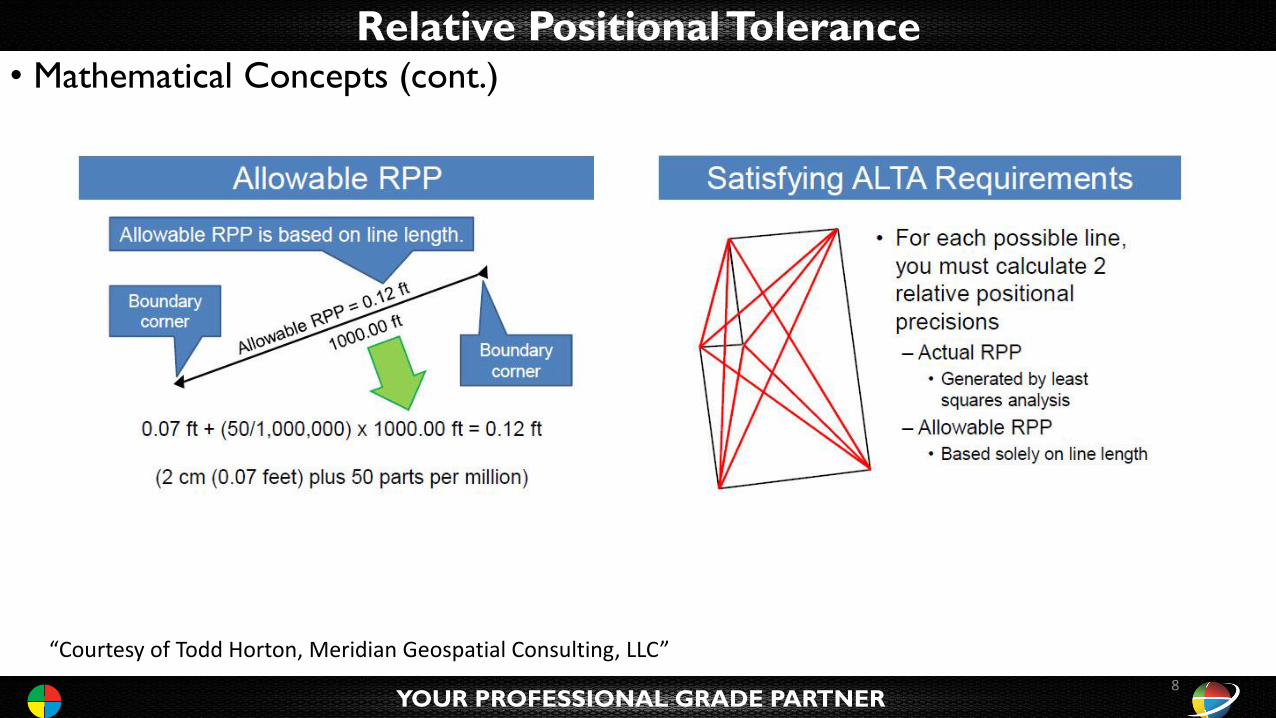
Relative Positional Tolerance• Mathematical Concepts (cont.)
YOUR PROFESSIONAL GRADE PARTNER
“Courtesy of Todd Horton, Meridian Geospatial Consulting, LLC”
8
Mathematical Concepts
YOUR PROFESSIONAL GRADE PARTNER
Errors in Measurements
• Mistakes (blunders)• Must be removed before adjustment
• Systematic Errors• Tend to accumulate, effects can be reduced with proper techniques
• Random Errors• Follow laws of probability, can never be completely removed, revealed through
repeated measurement
9
Mathematical Concepts
YOUR PROFESSIONAL GRADE PARTNER
Standard Error (sigma, s)
• an estimate of the average uncertainty of a set of measurements
• also called standard deviation
• 68.3% of an infinite number of independent observations will fall within +/- 1 s from the mean
• 95% of an infinite number of independent observations will fall within +/- 1.96 s from the mean
10
Mathematical Concepts
YOUR PROFESSIONAL GRADE PARTNER
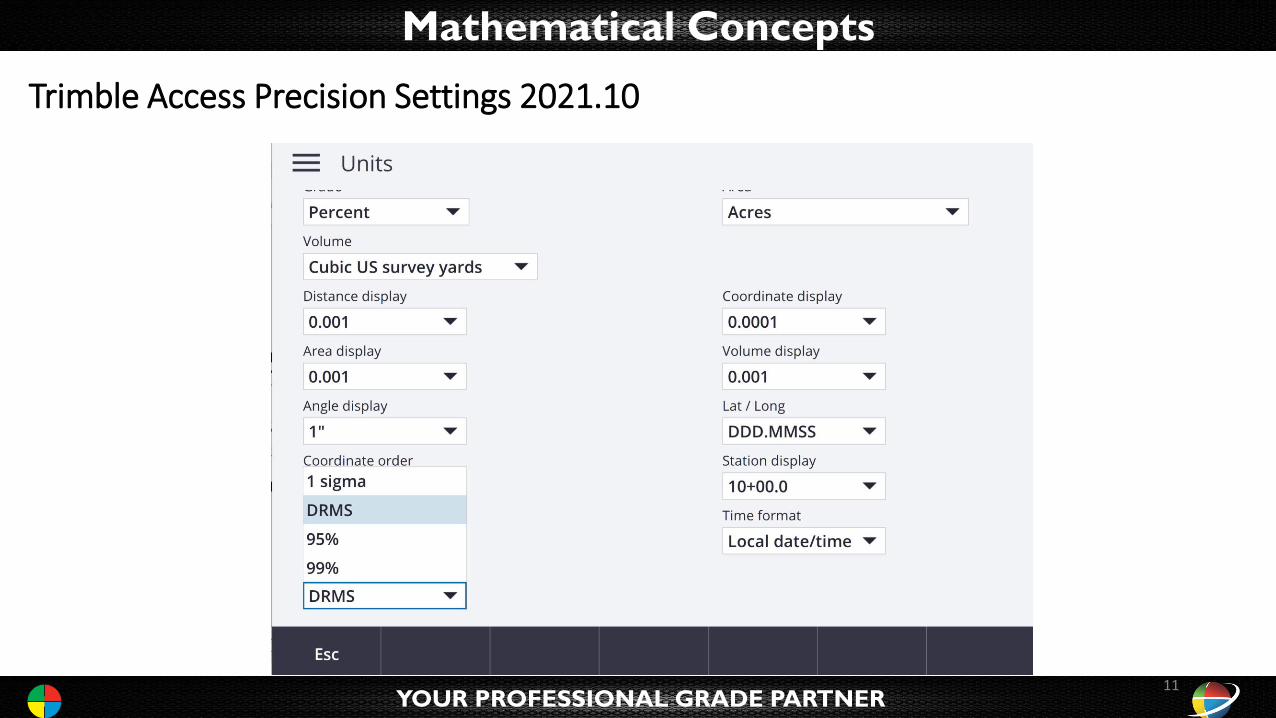
Trimble Access Precision Settings 2021.10
11
Mathematical Concepts
YOUR PROFESSIONAL GRADE PARTNER
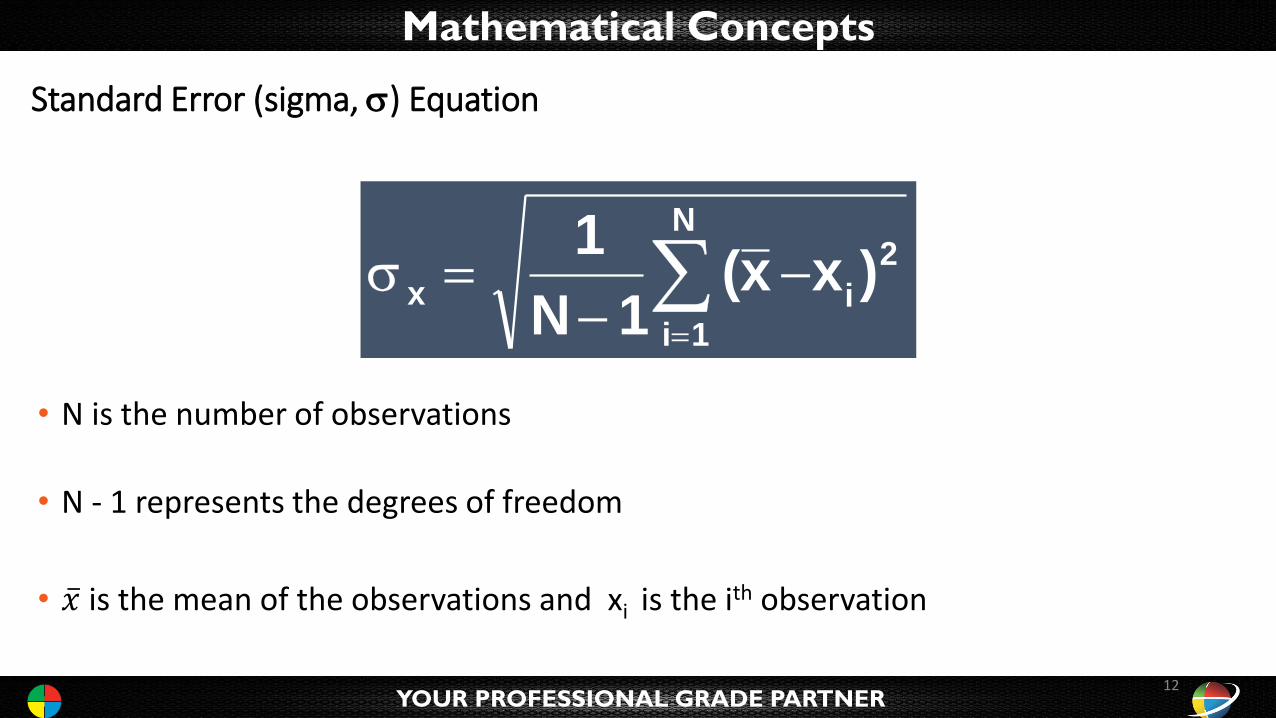
Standard Error (sigma, s) Equation
s x
i 1
N
i
21
N 1(x x )=
−−
=
• N is the number of observations
• N - 1 represents the degrees of freedom
• ҧ𝑥 is the mean of the observations and xi is the ith observation
12
Mathematical Concepts
YOUR PROFESSIONAL GRADE PARTNER
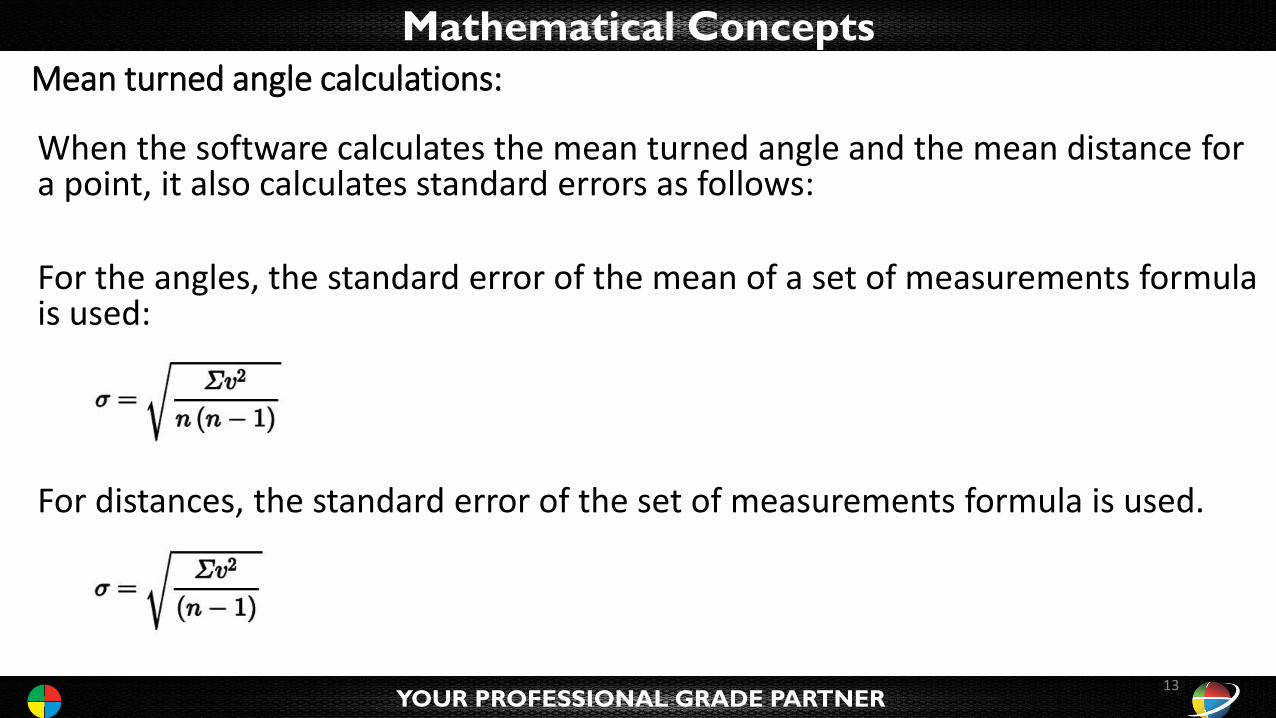
Mean turned angle calculations:
When the software calculates the mean turned angle and the mean distance for a point, it also calculates standard errors as follows:
For the angles, the standard error of the mean of a set of measurements formula is used:
For distances, the standard error of the set of measurements formula is used.
13
Mathematical Concepts
YOUR PROFESSIONAL GRADE PARTNER
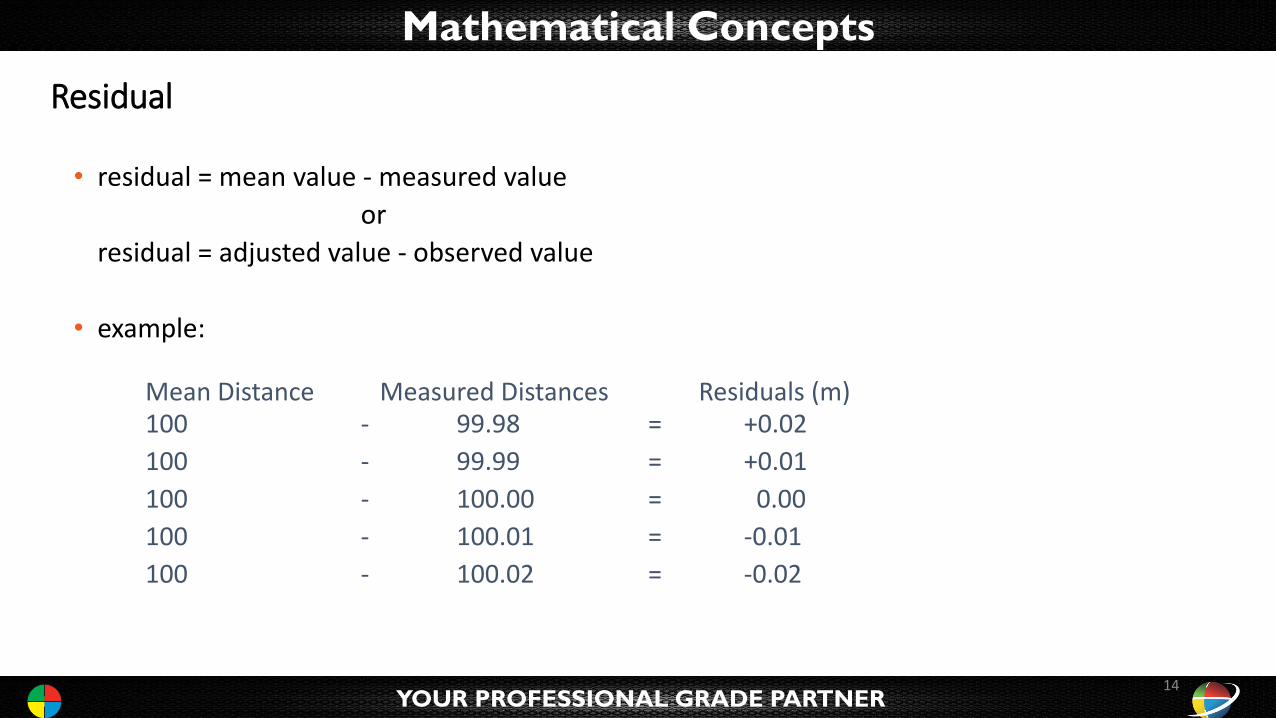
Residual
• residual = mean value - measured value
or
residual = adjusted value - observed value
• example:
Mean Distance Measured Distances Residuals (m)100 - 99.98 = +0.02
100 - 99.99 = +0.01
100 - 100.00 = 0.00
100 - 100.01 = -0.01
100 - 100.02 = -0.02
14
Mathematical Concepts
YOUR PROFESSIONAL GRADE PARTNER
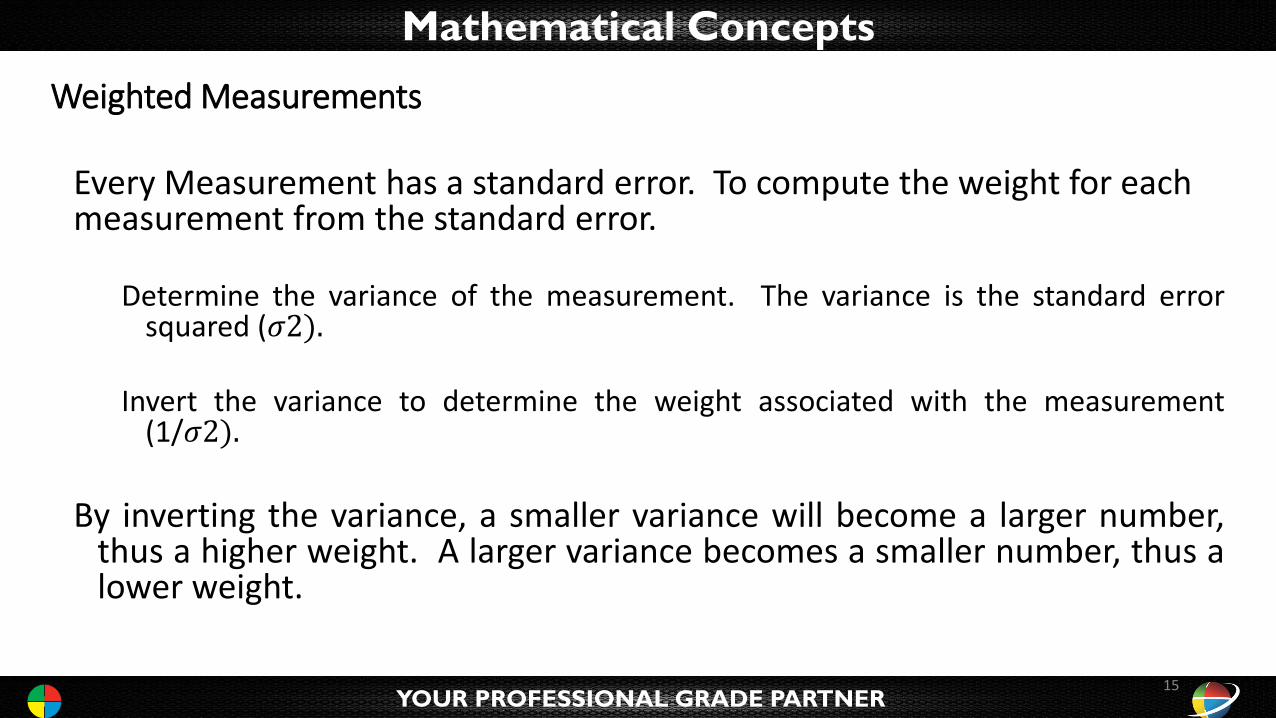
Weighted Measurements
Every Measurement has a standard error. To compute the weight for each measurement from the standard error.
Determine the variance of the measurement. The variance is the standard errorsquared (𝜎2).
Invert the variance to determine the weight associated with the measurement(1/𝜎2).
By inverting the variance, a smaller variance will become a larger number,thus a higher weight. A larger variance becomes a smaller number, thus alower weight.
15
Mathematical Concepts
YOUR PROFESSIONAL GRADE PARTNER
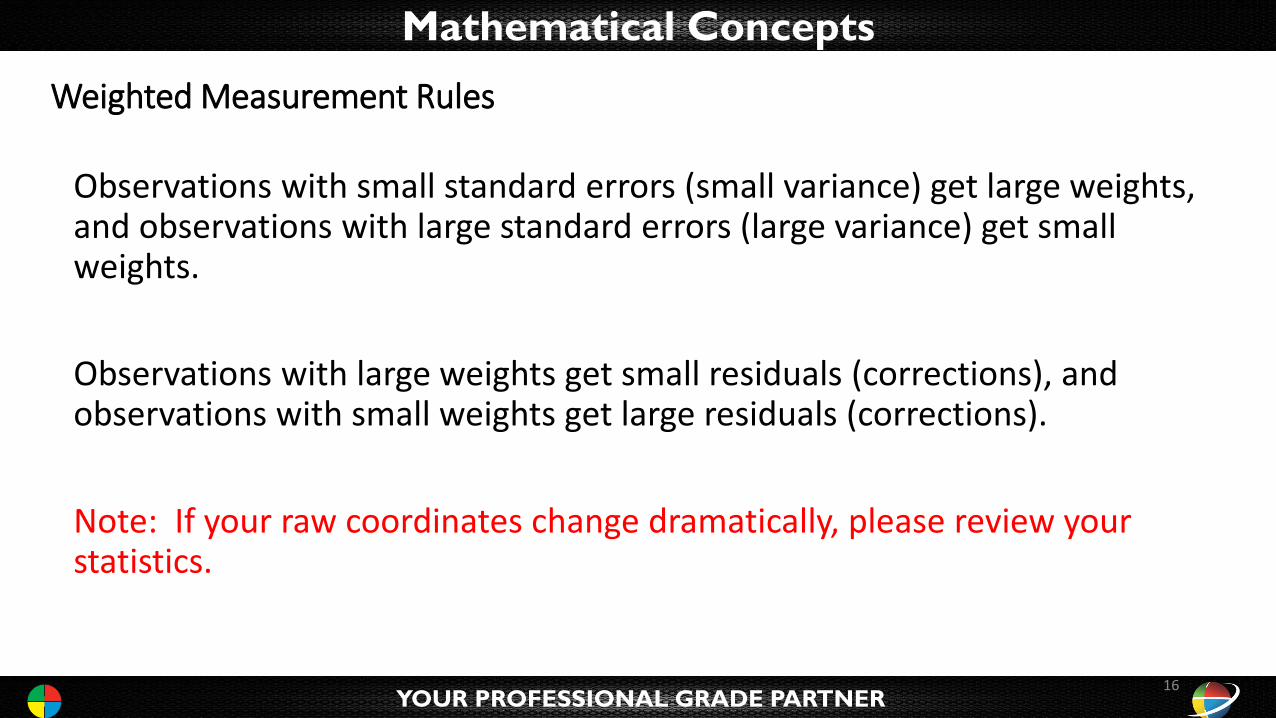
Weighted Measurement Rules
Observations with small standard errors (small variance) get large weights, and observations with large standard errors (large variance) get small weights.
Observations with large weights get small residuals (corrections), and observations with small weights get large residuals (corrections).
Note: If your raw coordinates change dramatically, please review your statistics.
16
Mathematical Concepts
YOUR PROFESSIONAL GRADE PARTNER
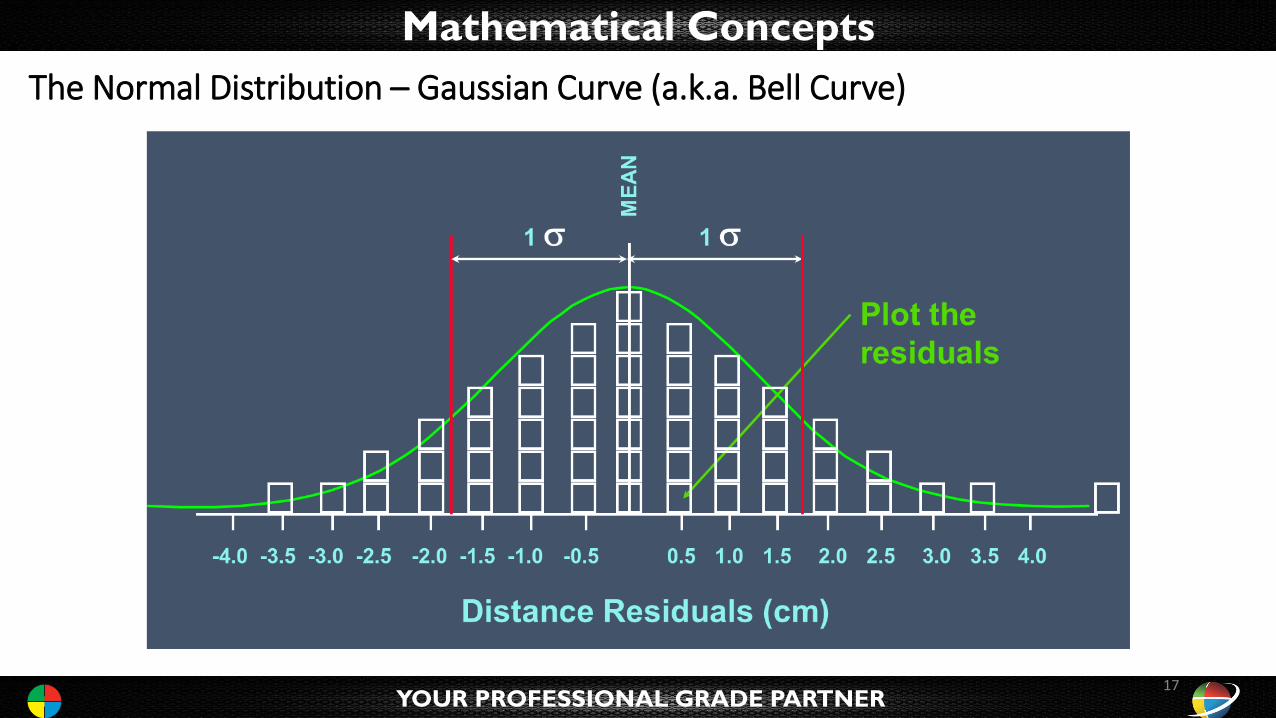
The Normal Distribution – Gaussian Curve (a.k.a. Bell Curve)
17
Mathematical Concepts
YOUR PROFESSIONAL GRADE PARTNER
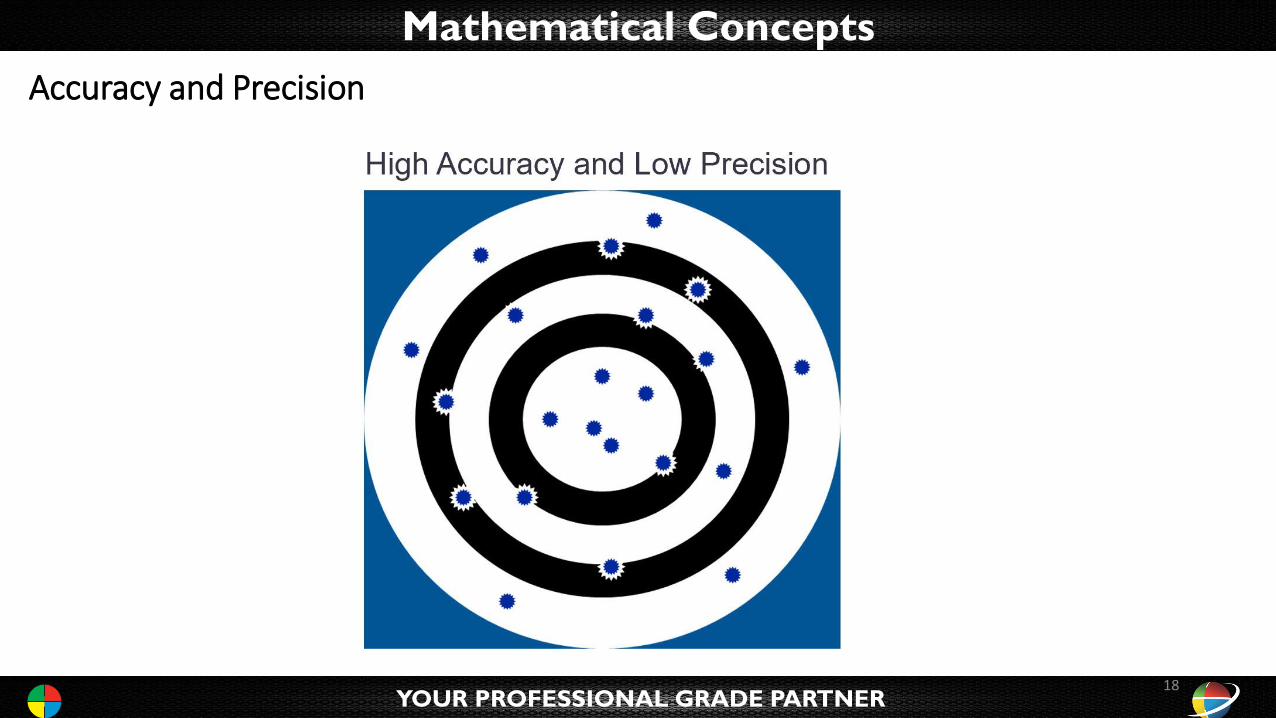
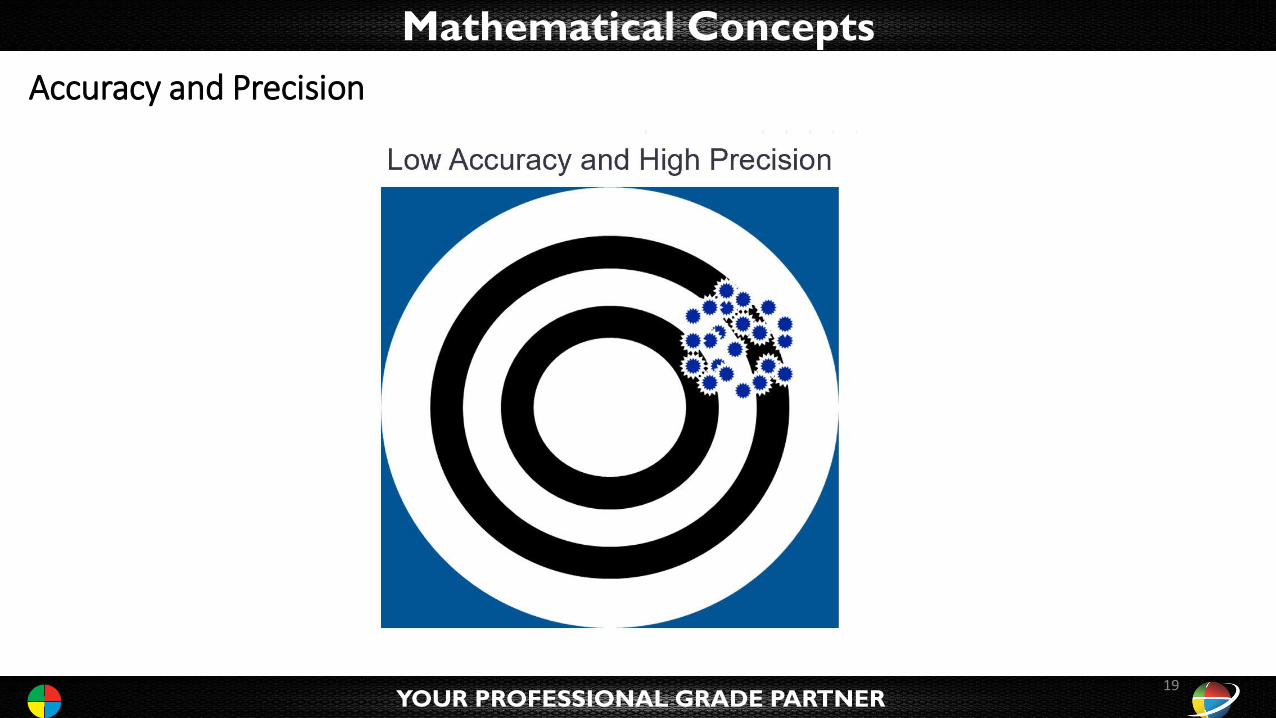
Accuracy and Precision
18
Mathematical Concepts
YOUR PROFESSIONAL GRADE PARTNER
Accuracy and Precision
19
Mathematical Concepts
YOUR PROFESSIONAL GRADE PARTNER
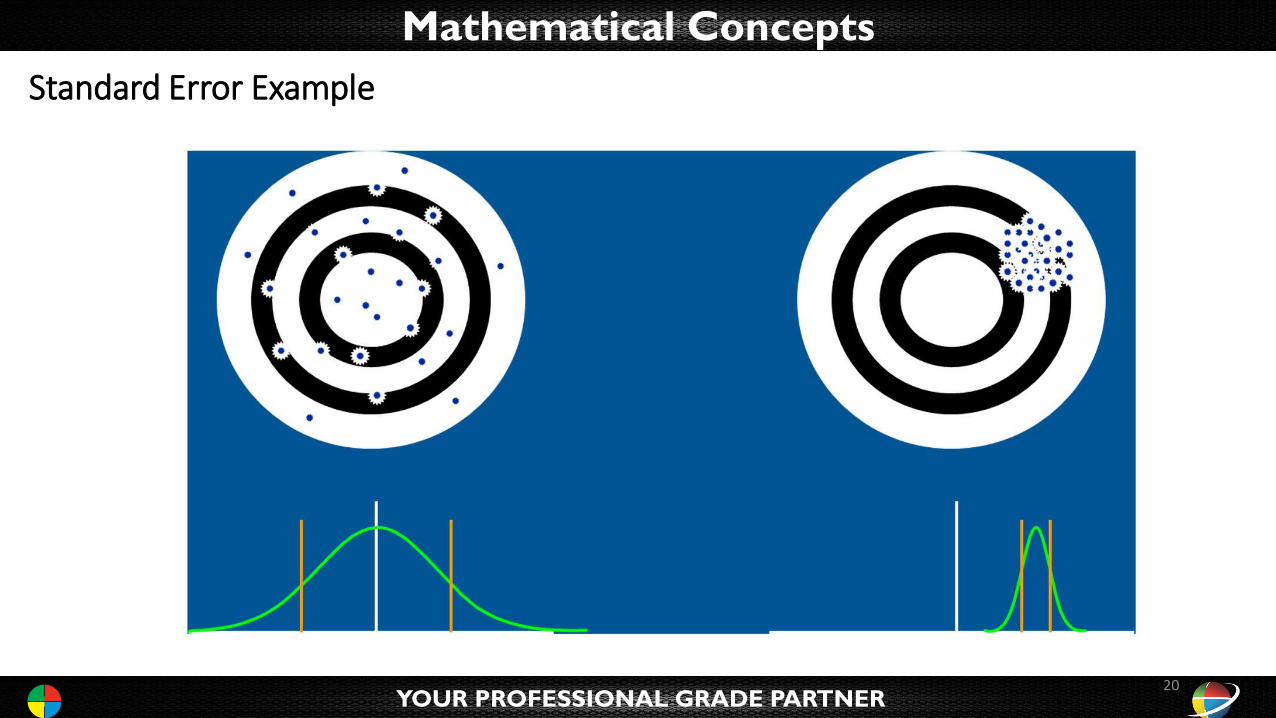
Standard Error Example
20
Mathematical Concepts
YOUR PROFESSIONAL GRADE PARTNER
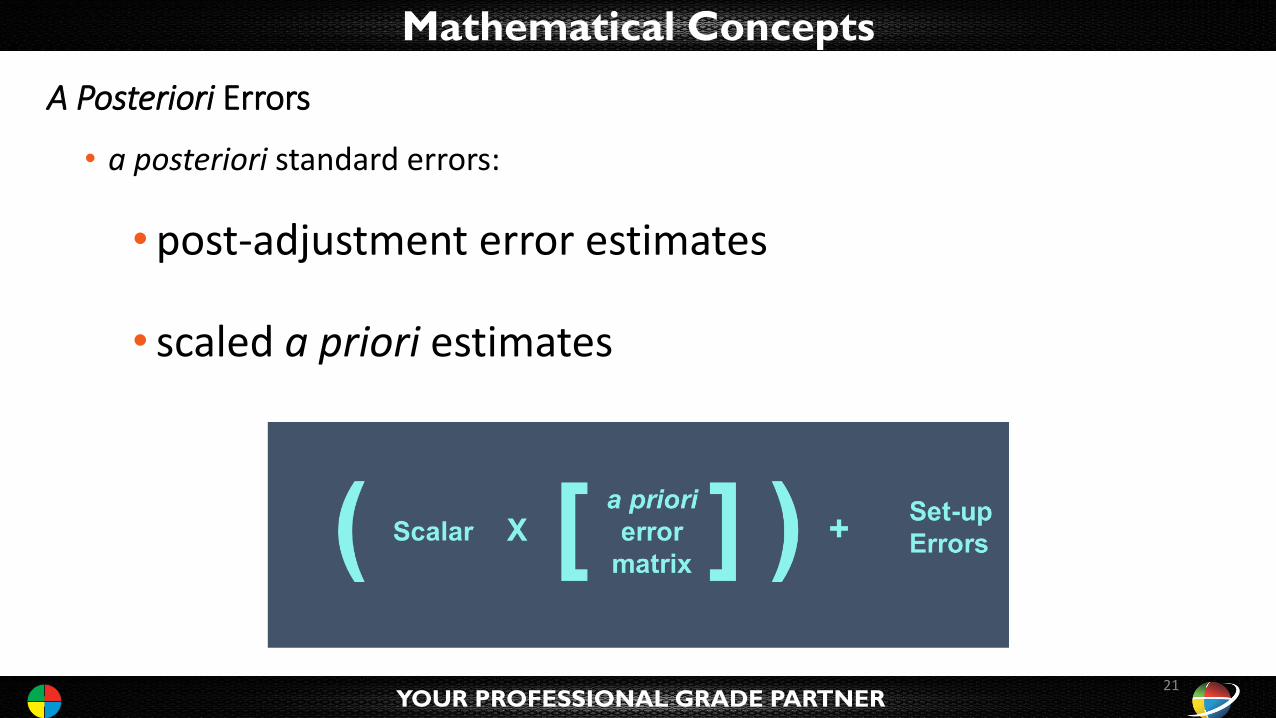
A Posteriori Errors
• a posteriori standard errors:
• post-adjustment error estimates
• scaled a priori estimates
21
Mathematical Concepts
YOUR PROFESSIONAL GRADE PARTNER
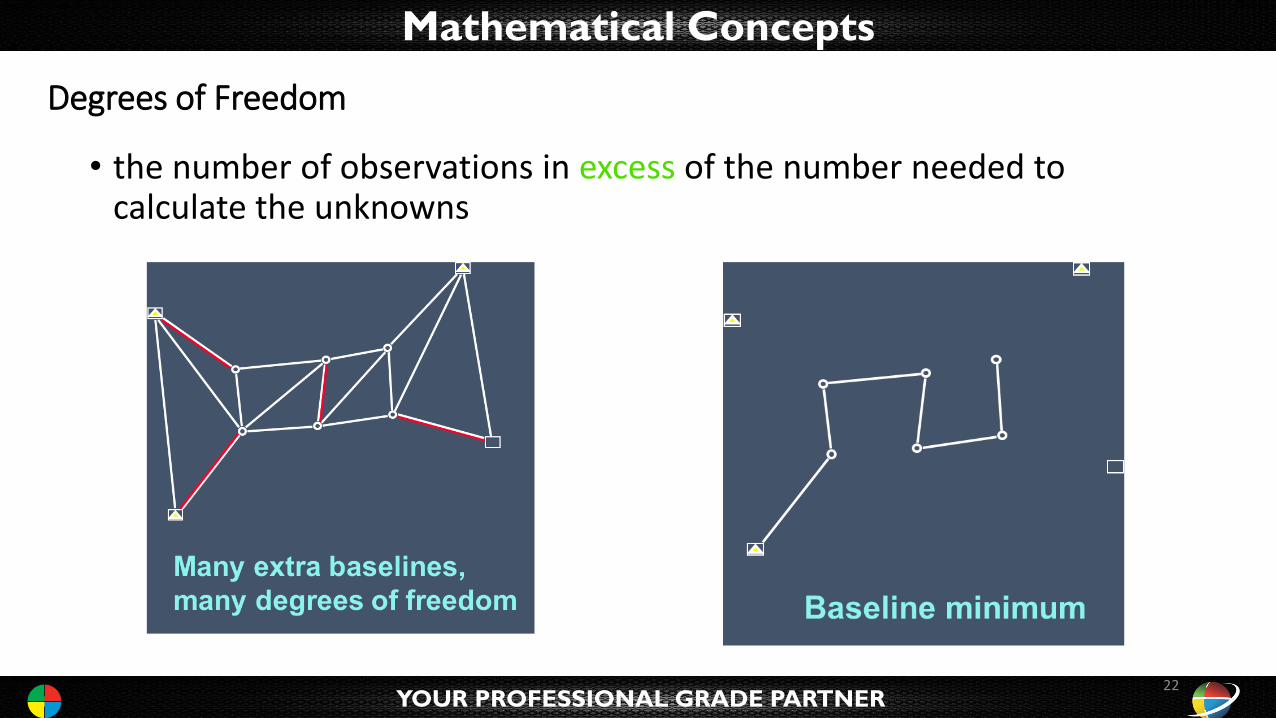
Degrees of Freedom
• the number of observations in excess of the number needed to calculate the unknowns
22
Mathematical Concepts
YOUR PROFESSIONAL GRADE PARTNER
Independent and Dependent Baselines
• the total number of baselines that can be observed during a session is equal to n(n-1)/2, where n equals the number of receivers used during the session.
• For example, if four receivers were used in a session, six baselines can be observed (4 times 3, divided by 2)
• The number of independent baselines for a given session is equal to n-1.
• Three of the baselines are considered dependent and should be run again.
• It is the responsibility of the surveyor to determine which three are considered dependent.
23
Mathematical Concepts
YOUR PROFESSIONAL GRADE PARTNER
Reference Factor
24
Mathematical Concepts
YOUR PROFESSIONAL GRADE PARTNER
Chi Squared Test (c2)
• a test to determine whether the computed reference factor for an adjustment is a valid statistic
• adjustment typically fails the Chi Squared test until the Reference Factor approaches 1.00
• the test uses: the observation error estimates, the network’s degrees of freedom, and a predefined confidence limit (95% for Trimble Business Center)
25
Mathematical Concepts
YOUR PROFESSIONAL GRADE PARTNER
Standardized Residual
• effectively removes the units from the residuals
• makes all residuals in a network comparable
• residual of an observation divided by the post-adjustment (a posteriori) standard error of that residual.
26
Mathematical Concepts
YOUR PROFESSIONAL GRADE PARTNER
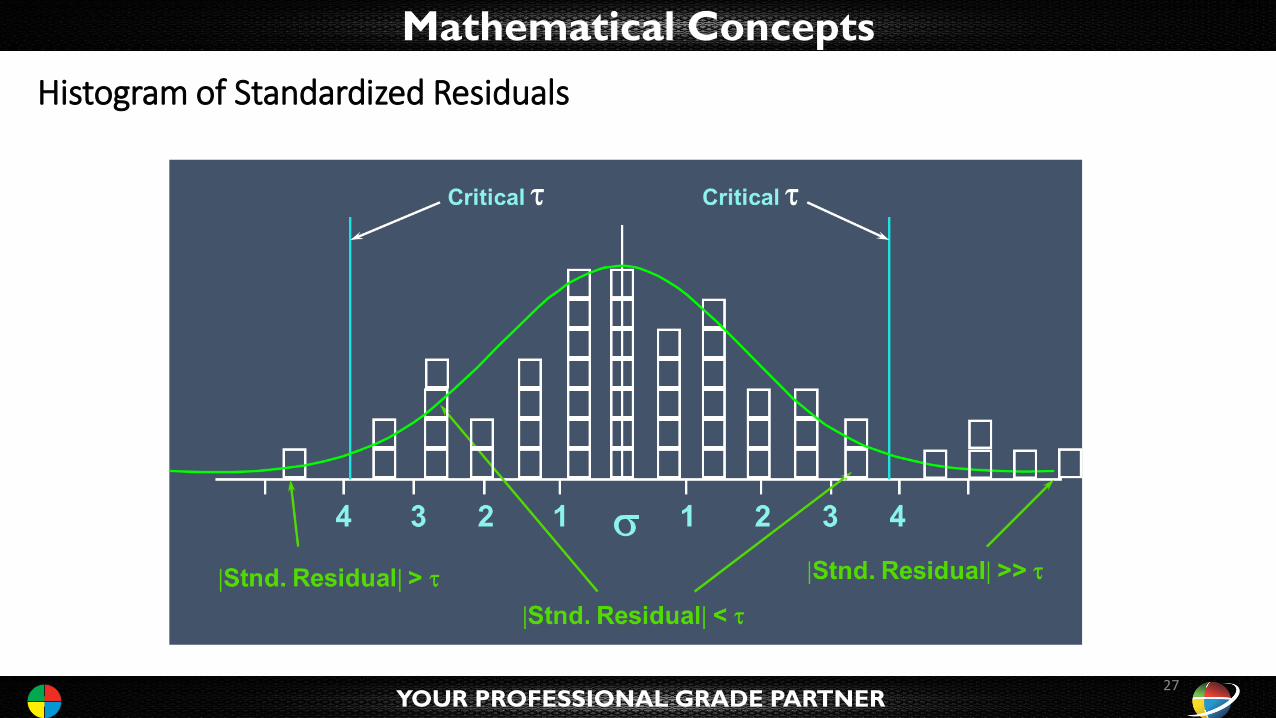
Histogram of Standardized Residuals
27
Mathematical Concepts
YOUR PROFESSIONAL GRADE PARTNER
Tau (t) Criterion
• a test on the distribution of standardized residuals
• standardized residuals falling outside t limits are called outliers
• outliers are candidates for rejection
28
Mathematical Concepts
YOUR PROFESSIONAL GRADE PARTNER
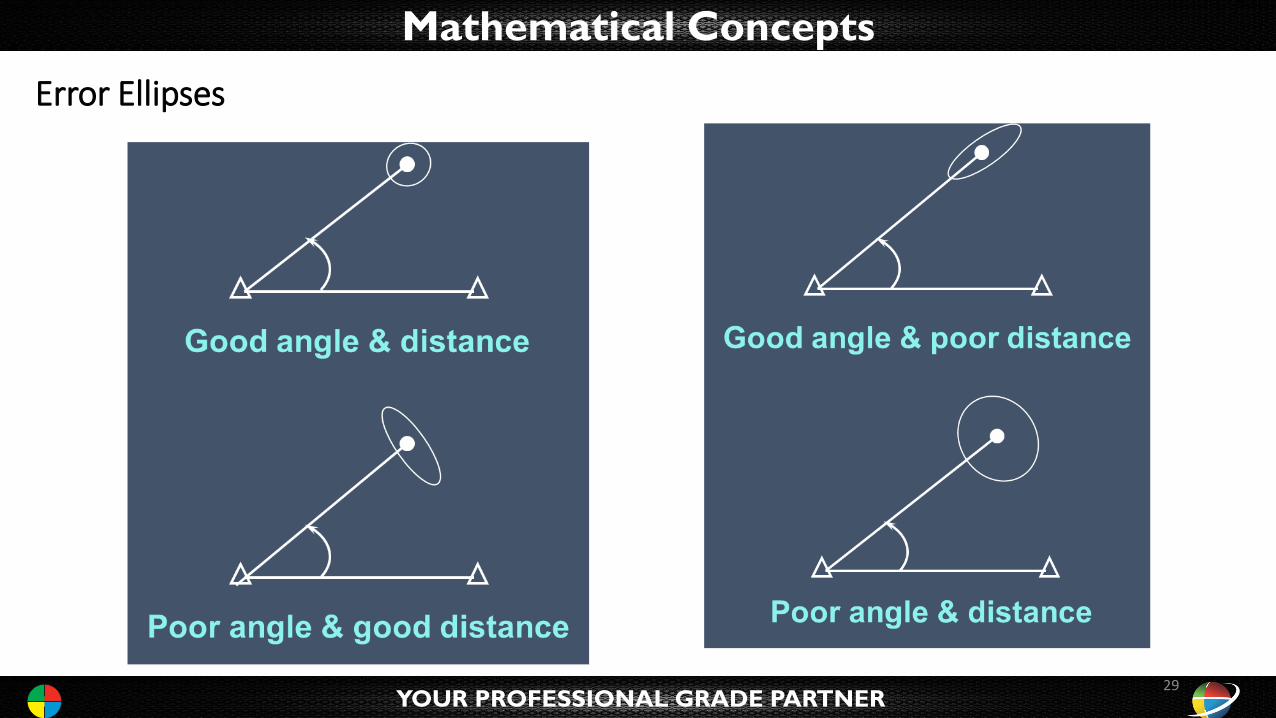
Error Ellipses
29
Mathematical Concepts
YOUR PROFESSIONAL GRADE PARTNER
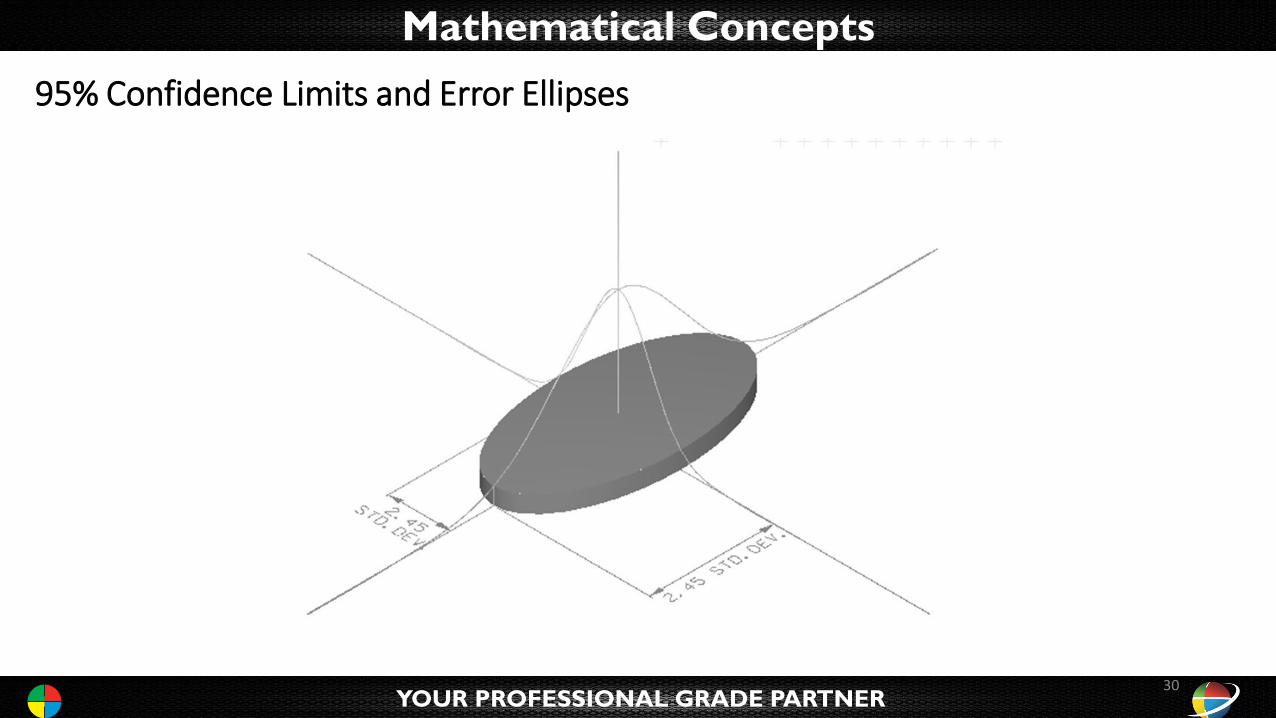
95% Confidence Limits and Error Ellipses
30
Mathematical Concepts
YOUR PROFESSIONAL GRADE PARTNER
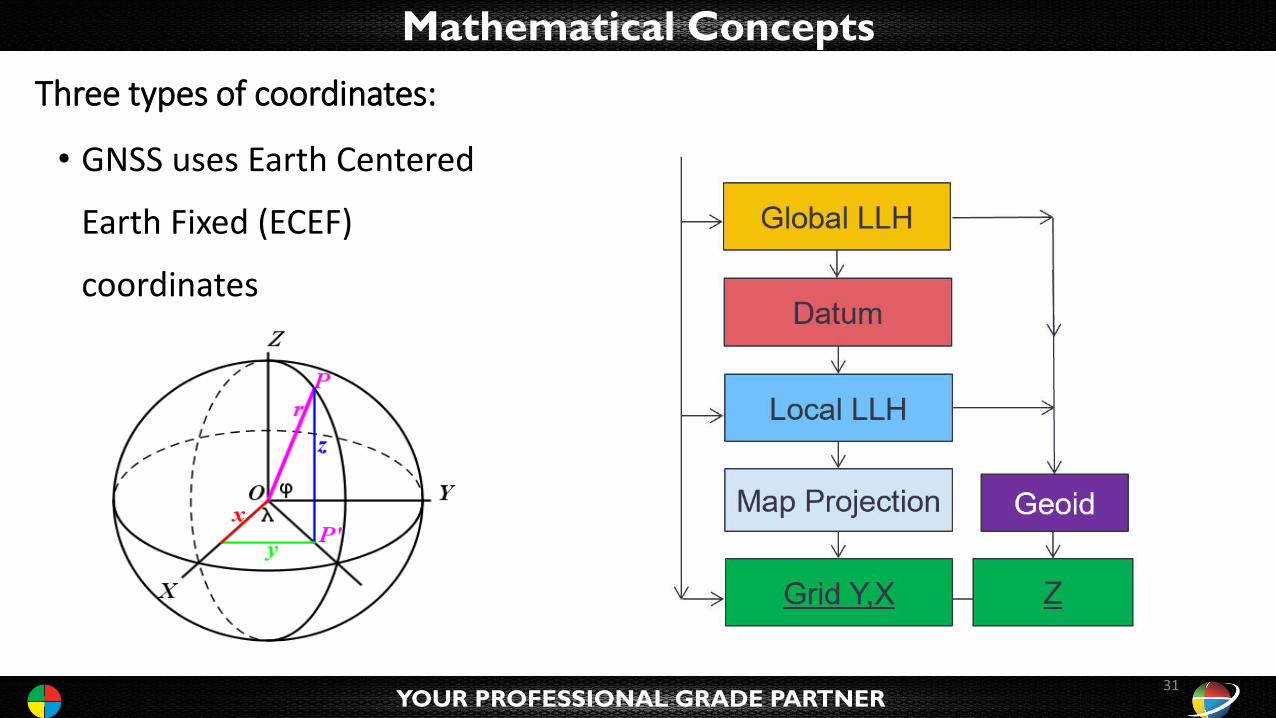
Three types of coordinates:
• GNSS uses Earth Centered
Earth Fixed (ECEF)
coordinates
31
Mathematical Concepts
YOUR PROFESSIONAL GRADE PARTNER
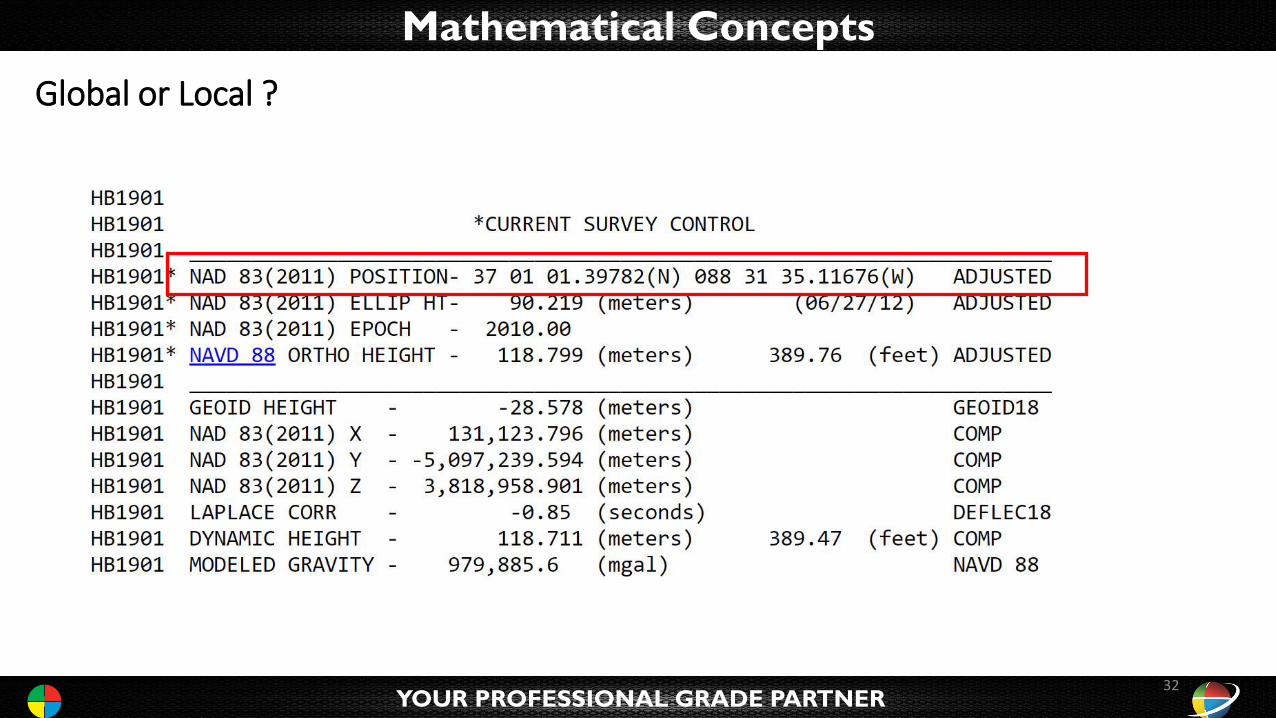
Global or Local ?
32
Mathematical Concepts
YOUR PROFESSIONAL GRADE PARTNER
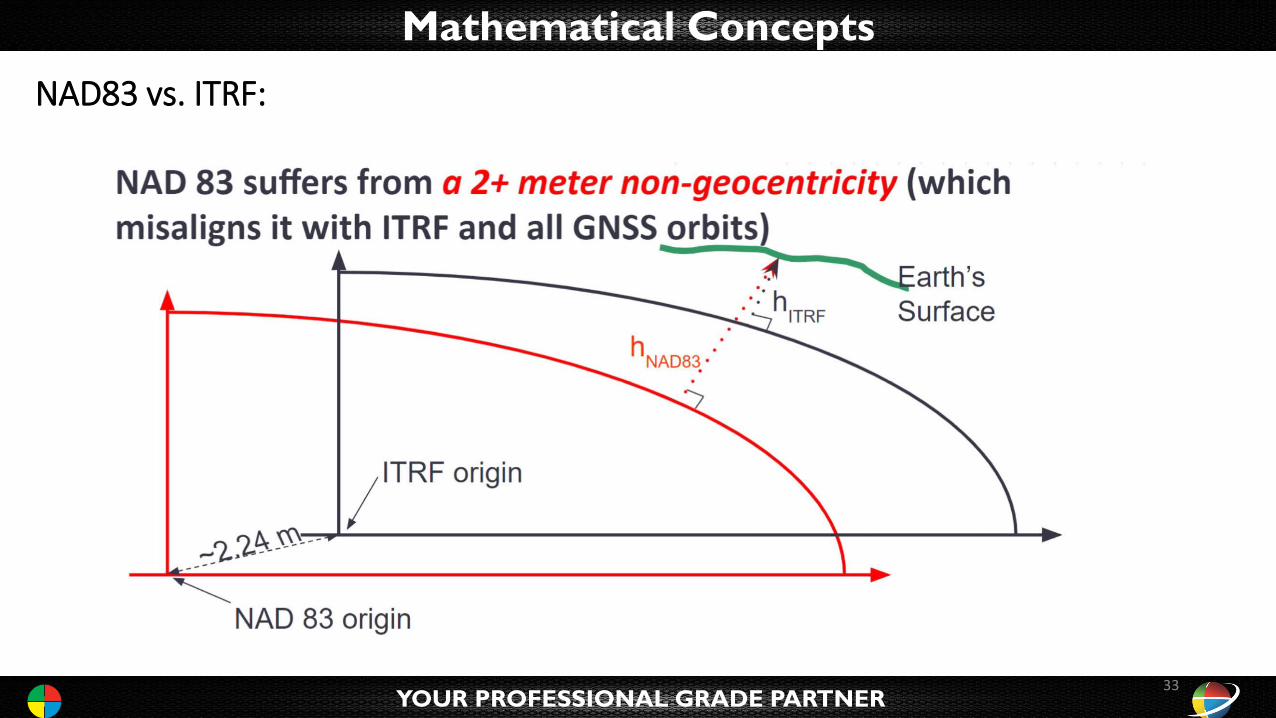
NAD83 vs. ITRF:
33
Network Adjustment RTN Data• Real Time Network Example.
YOUR PROFESSIONAL GRADE PARTNER
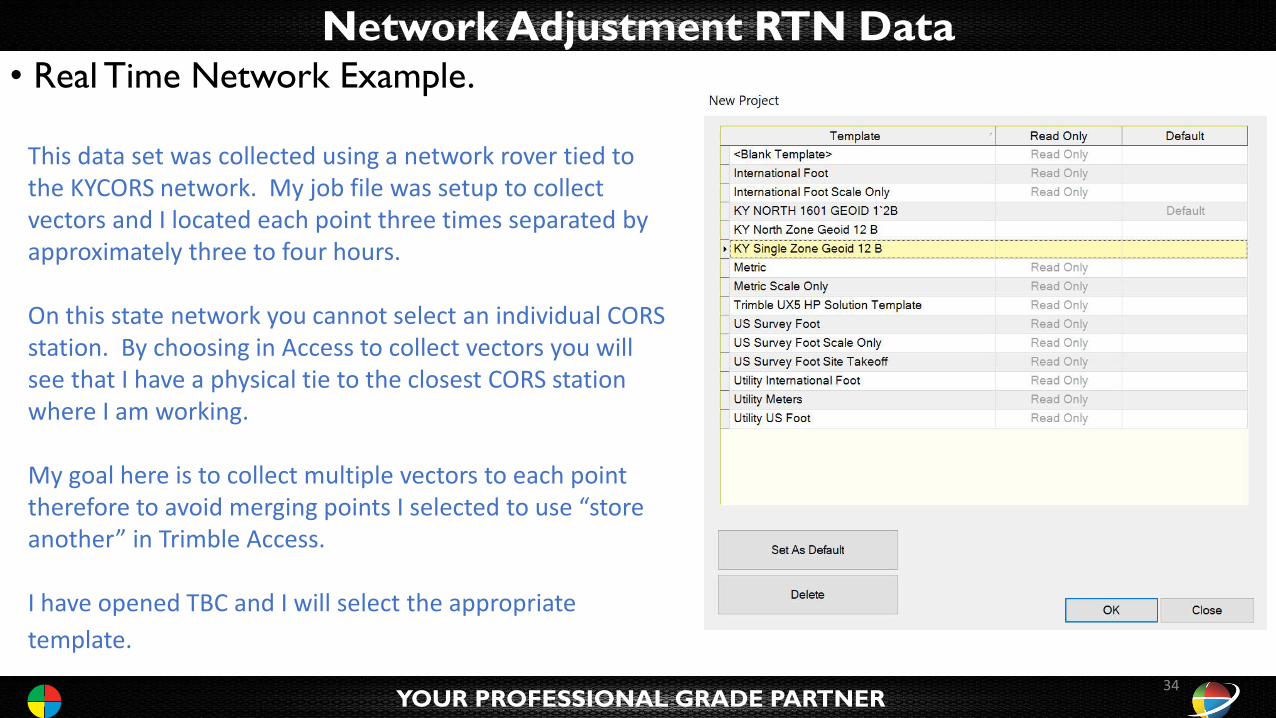
This data set was collected using a network rover tied to the KYCORS network. My job file was setup to collect vectors and I located each point three times separated by approximately three to four hours.
On this state network you cannot select an individual CORS station. By choosing in Access to collect vectors you will see that I have a physical tie to the closest CORS station where I am working.
My goal here is to collect multiple vectors to each point therefore to avoid merging points I selected to use “store another” in Trimble Access.
I have opened TBC and I will select the appropriate
template.
34
Network Adjustment RTN Data• Real Time Network Example.
YOUR PROFESSIONAL GRADE PARTNER
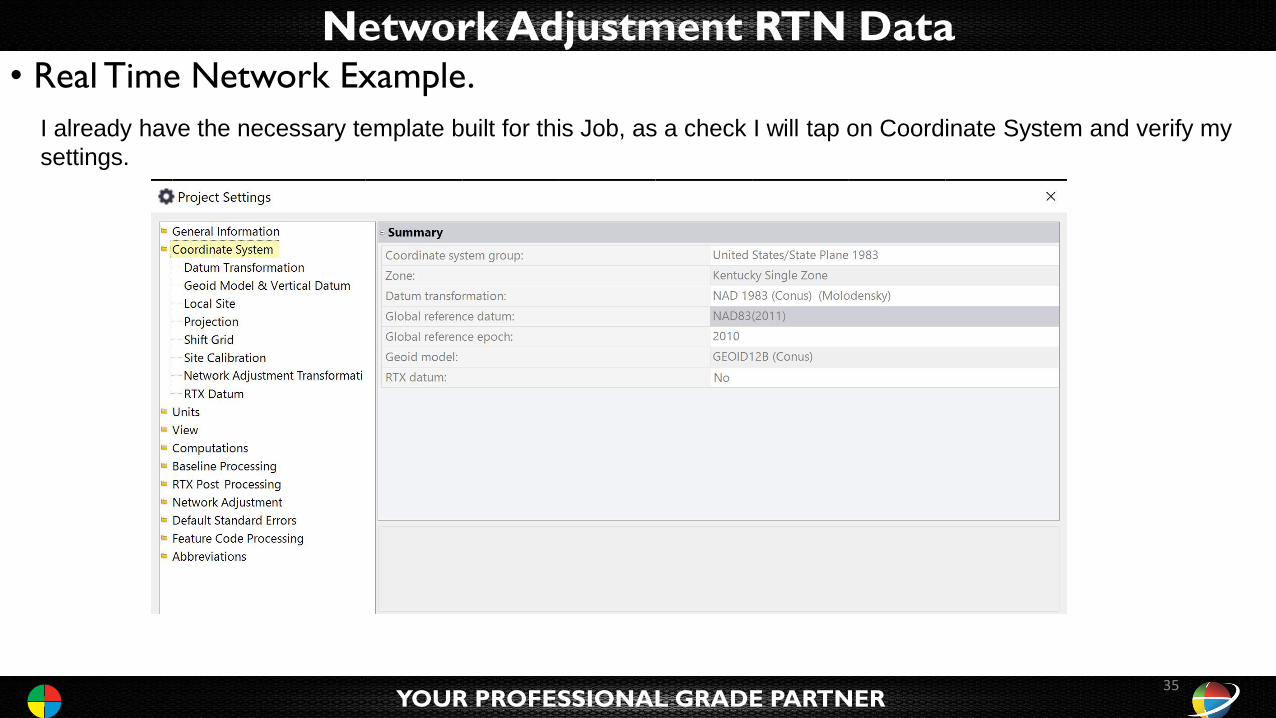
I already have the necessary template built for this Job, as a check I will tap on Coordinate System and verify my
settings.
35
Network Adjustment RTN Data• Real Time Network Example.
YOUR PROFESSIONAL GRADE PARTNER
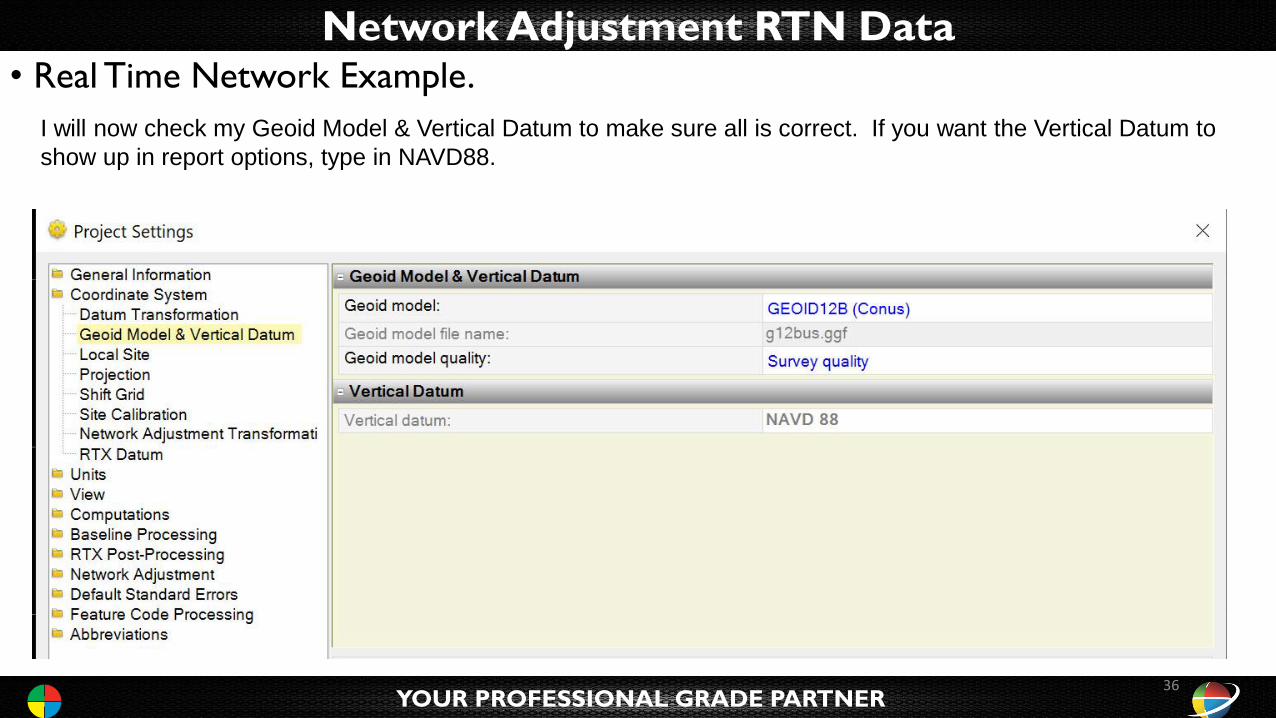
I will now check my Geoid Model & Vertical Datum to make sure all is correct. If you want the Vertical Datum to
show up in report options, type in NAVD88.
36
Network Adjustment RTN Data• Real Time Network Example.
YOUR PROFESSIONAL GRADE PARTNER
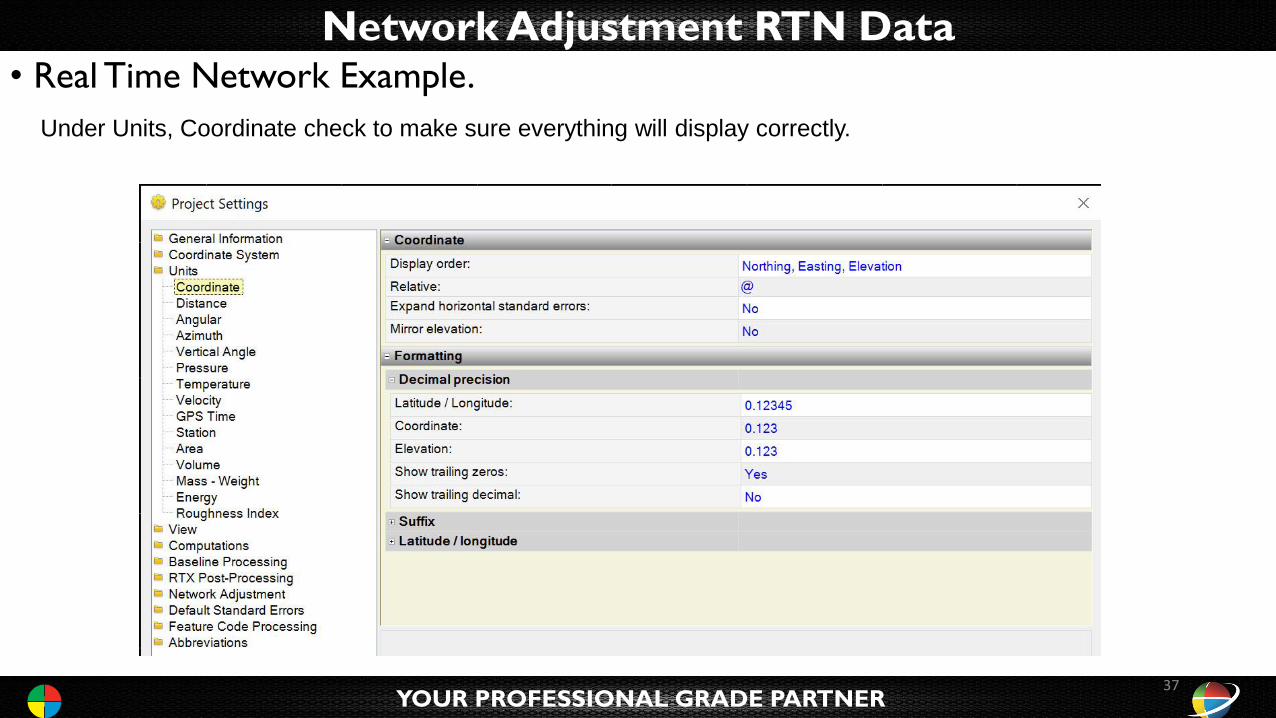
Under Units, Coordinate check to make sure everything will display correctly.
37
Network Adjustment RTN Data• Real Time Network Example.
YOUR PROFESSIONAL GRADE PARTNER
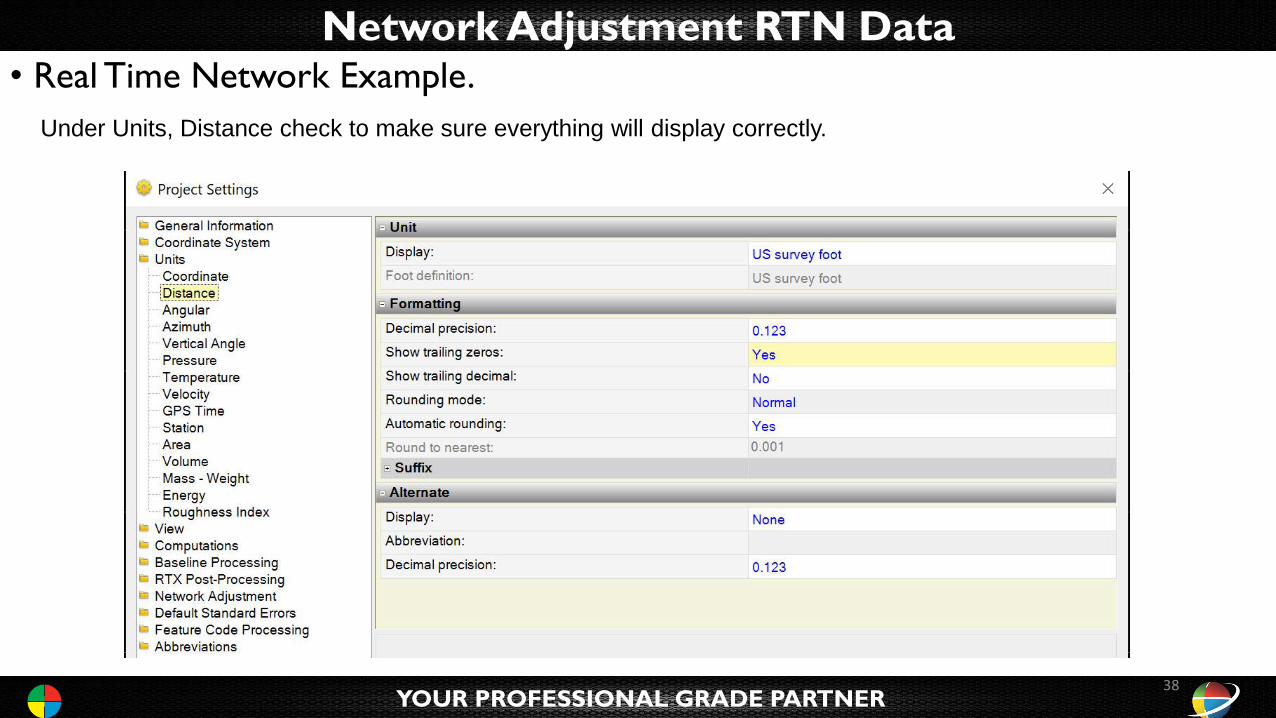
Under Units, Distance check to make sure everything will display correctly.
38
Network Adjustment RTN Data• Real Time Network Example.
YOUR PROFESSIONAL GRADE PARTNER
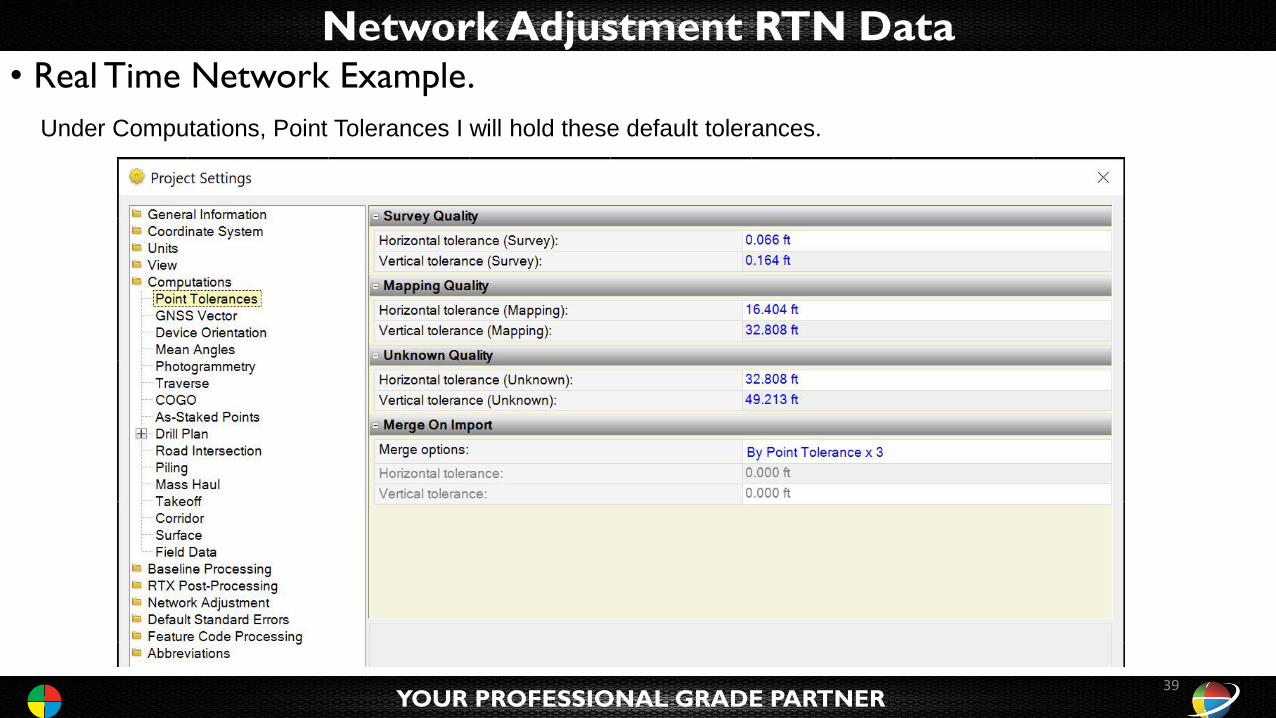
Under Computations, Point Tolerances I will hold these default tolerances.
39
Network Adjustment RTN Data• Real Time Network Example.
YOUR PROFESSIONAL GRADE PARTNER
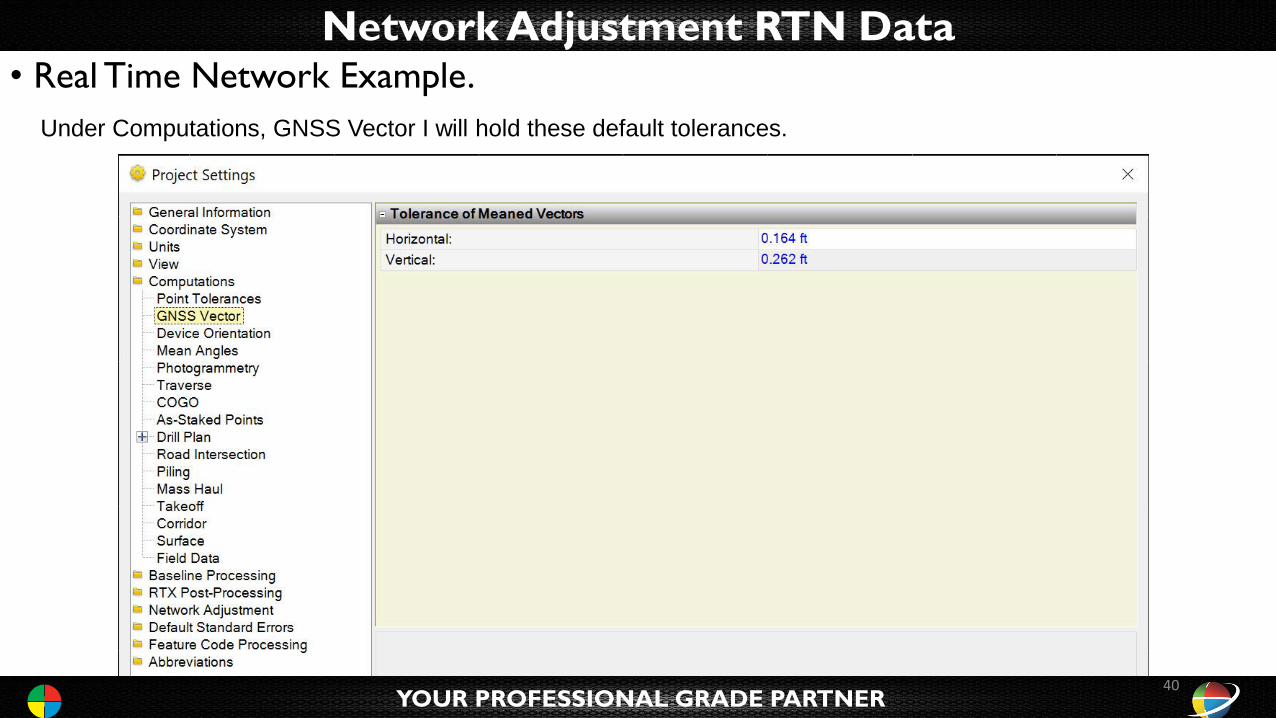
Under Computations, GNSS Vector I will hold these default tolerances.
40
Network Adjustment RTN Data• Real Time Network Example.
YOUR PROFESSIONAL GRADE PARTNER
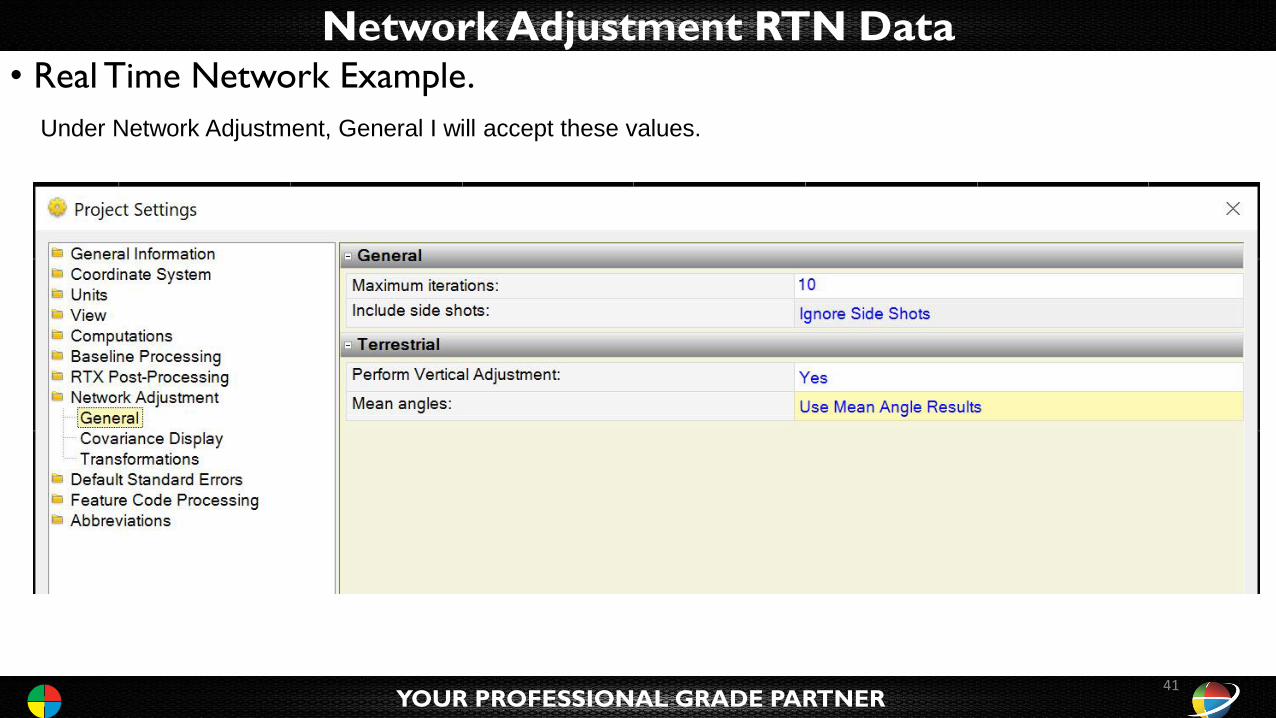
Under Network Adjustment, General I will accept these values.
41
Network Adjustment RTN Data• Real Time Network Example.
YOUR PROFESSIONAL GRADE PARTNER
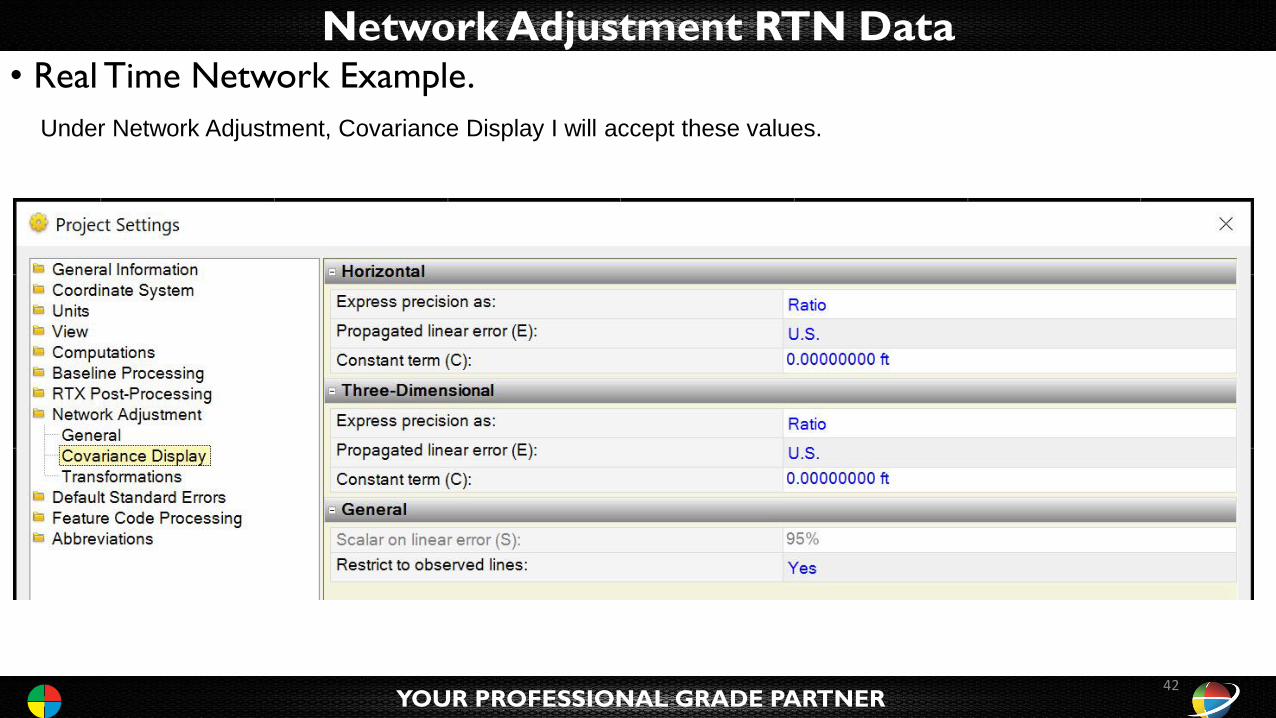
Under Network Adjustment, Covariance Display I will accept these values.
42
Network Adjustment RTN Data• Real Time Network Example.
YOUR PROFESSIONAL GRADE PARTNER
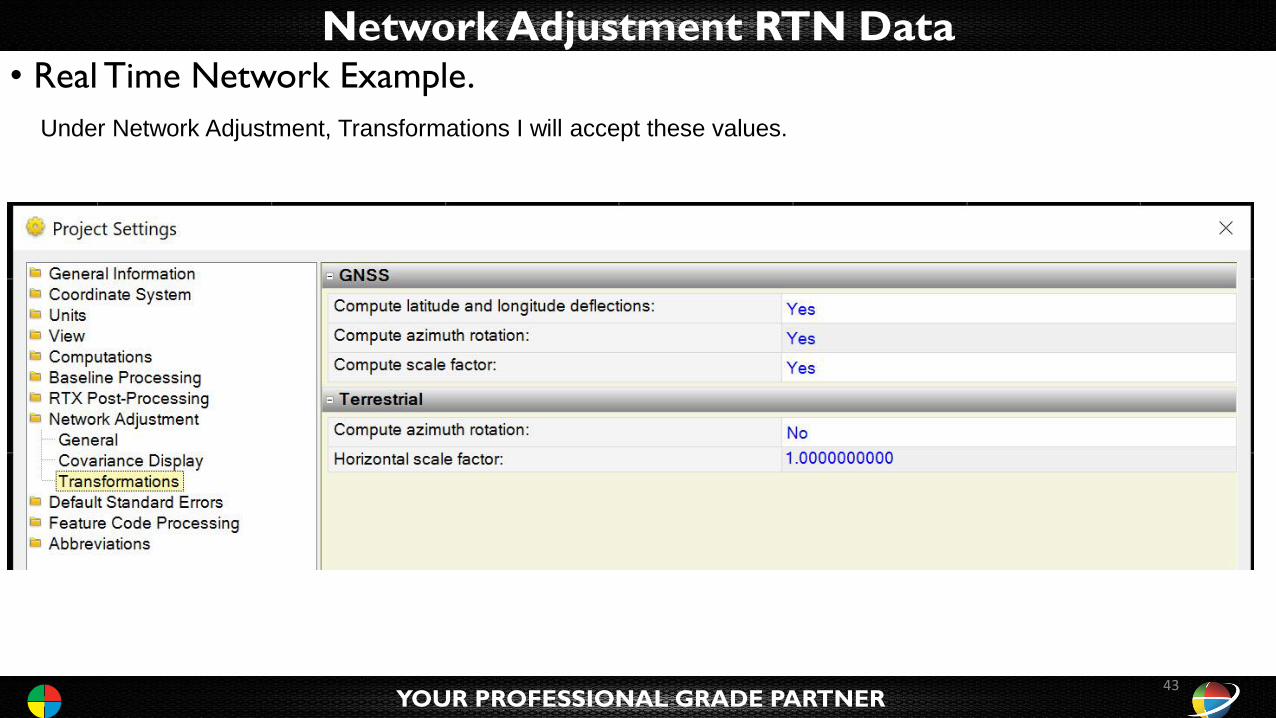
Under Network Adjustment, Transformations I will accept these values.
43
Network Adjustment RTN Data• Real Time Network Example.
YOUR PROFESSIONAL GRADE PARTNER
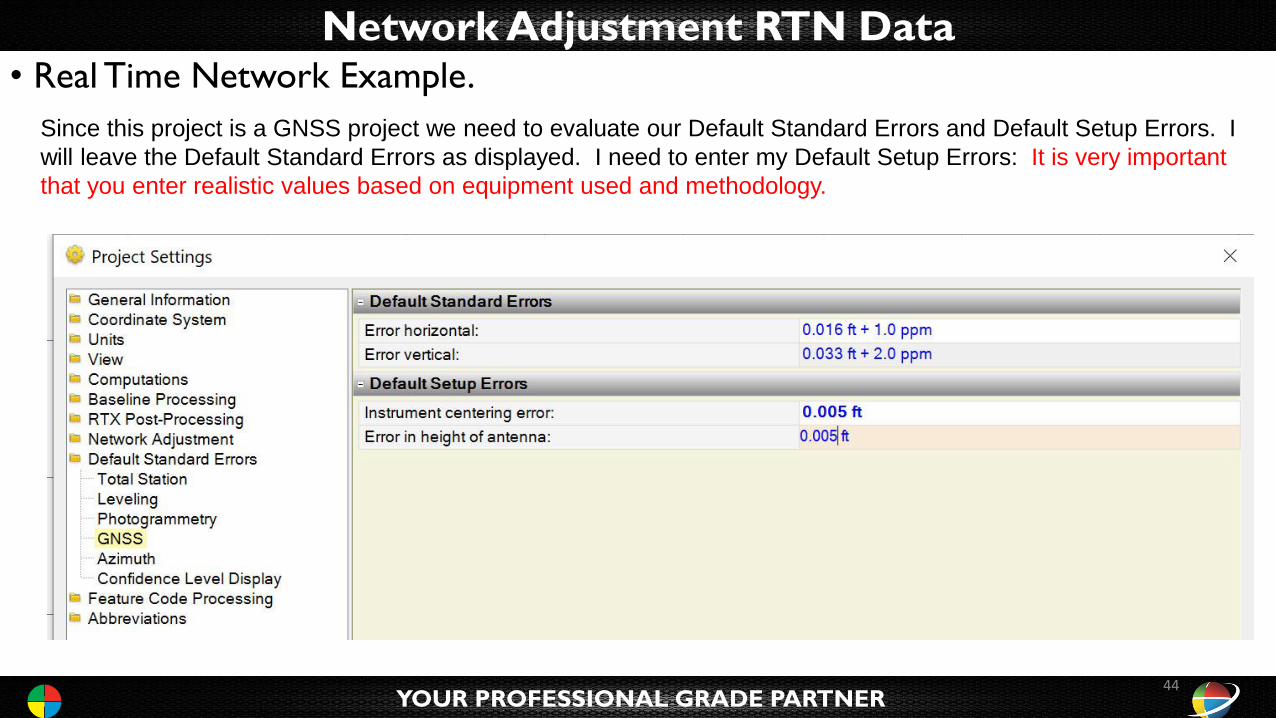
Since this project is a GNSS project we need to evaluate our Default Standard Errors and Default Setup Errors. I
will leave the Default Standard Errors as displayed. I need to enter my Default Setup Errors: It is very important
that you enter realistic values based on equipment used and methodology.
44
Network Adjustment RTN Data• Real Time Network Example.
YOUR PROFESSIONAL GRADE PARTNER
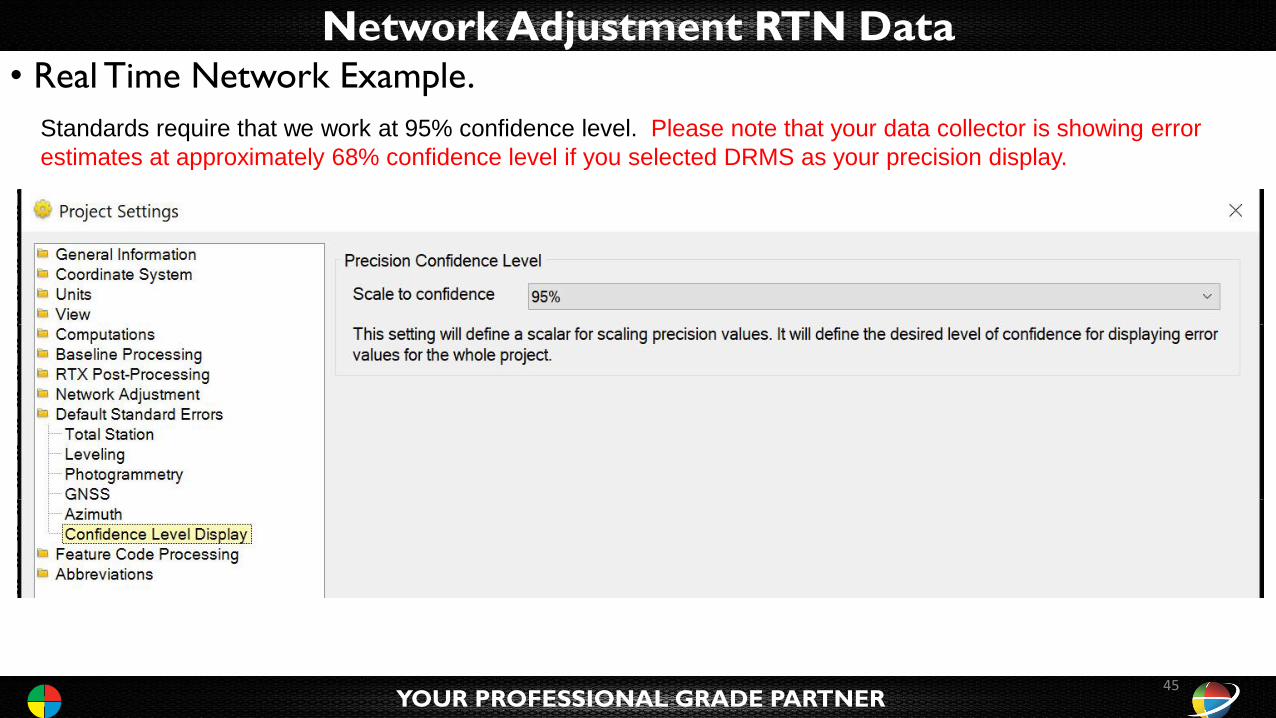
Standards require that we work at 95% confidence level. Please note that your data collector is showing error
estimates at approximately 68% confidence level if you selected DRMS as your precision display.
45
Network Adjustment RTN Data• Real Time Network Example.
YOUR PROFESSIONAL GRADE PARTNER
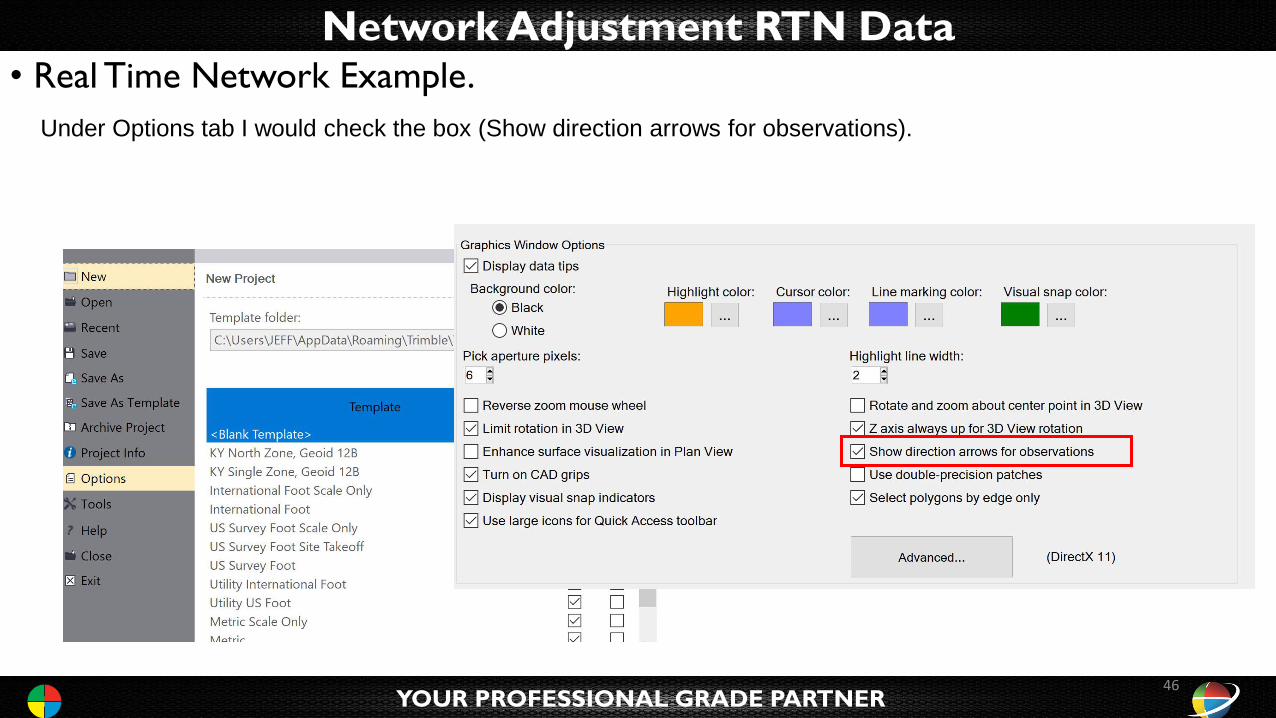
Under Options tab I would check the box (Show direction arrows for observations).
46
Network Adjustment RTN Data• Real Time Network Example.
YOUR PROFESSIONAL GRADE PARTNER
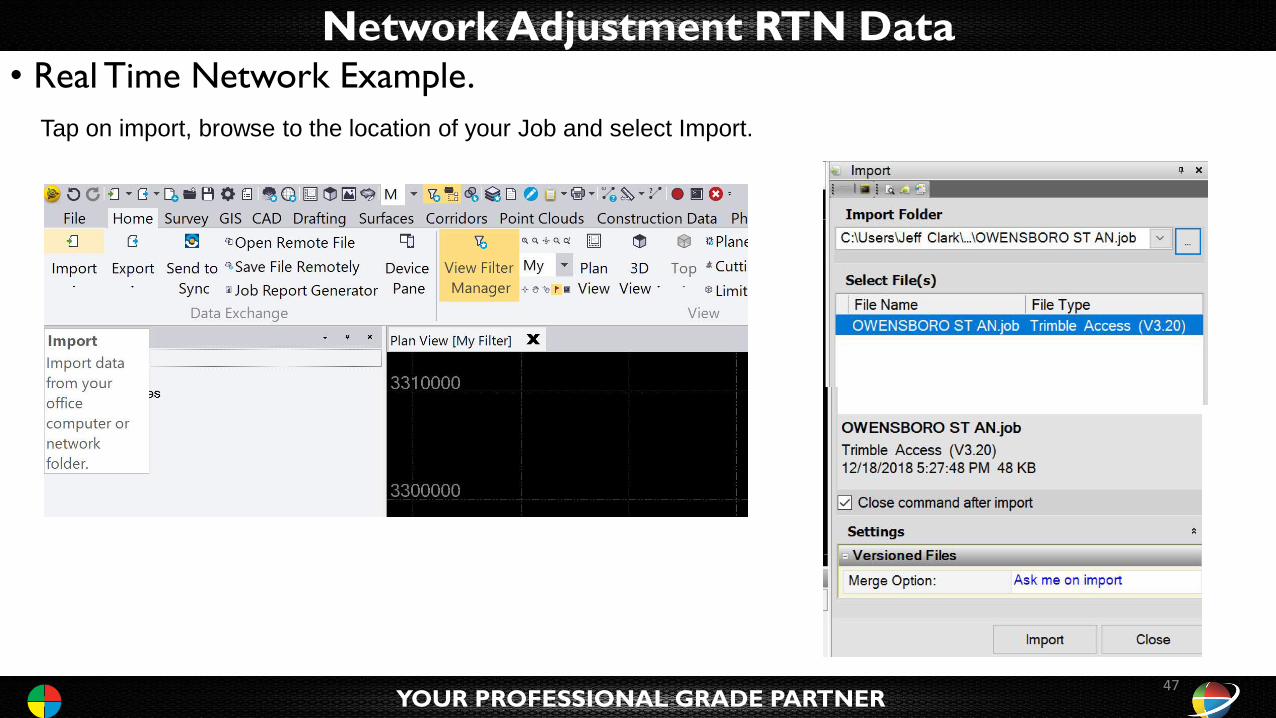
Tap on import, browse to the location of your Job and select Import.
47
Network Adjustment RTN Data• Real Time Network Example.
YOUR PROFESSIONAL GRADE PARTNER
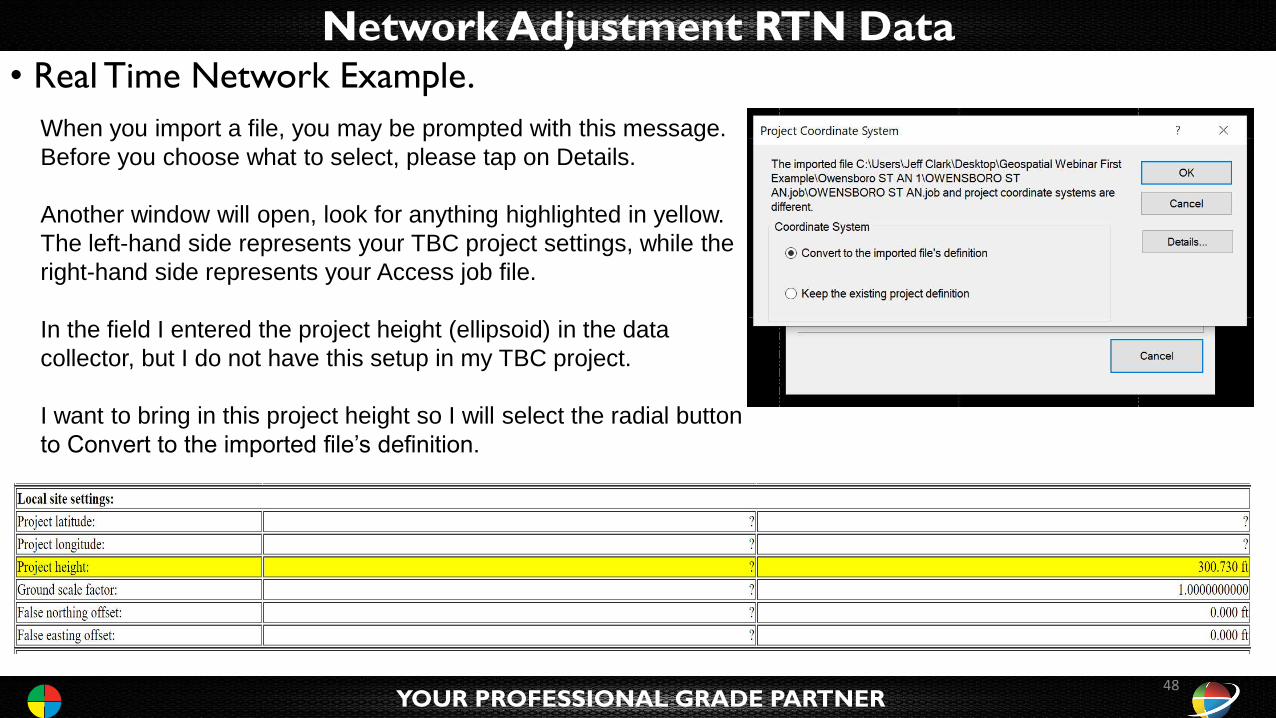
When you import a file, you may be prompted with this message.
Before you choose what to select, please tap on Details.
Another window will open, look for anything highlighted in yellow.
The left-hand side represents your TBC project settings, while the
right-hand side represents your Access job file.
In the field I entered the project height (ellipsoid) in the data
collector, but I do not have this setup in my TBC project.
I want to bring in this project height so I will select the radial button
to Convert to the imported file’s definition.
48
Network Adjustment RTN Data• Real Time Network Example.
YOUR PROFESSIONAL GRADE PARTNER
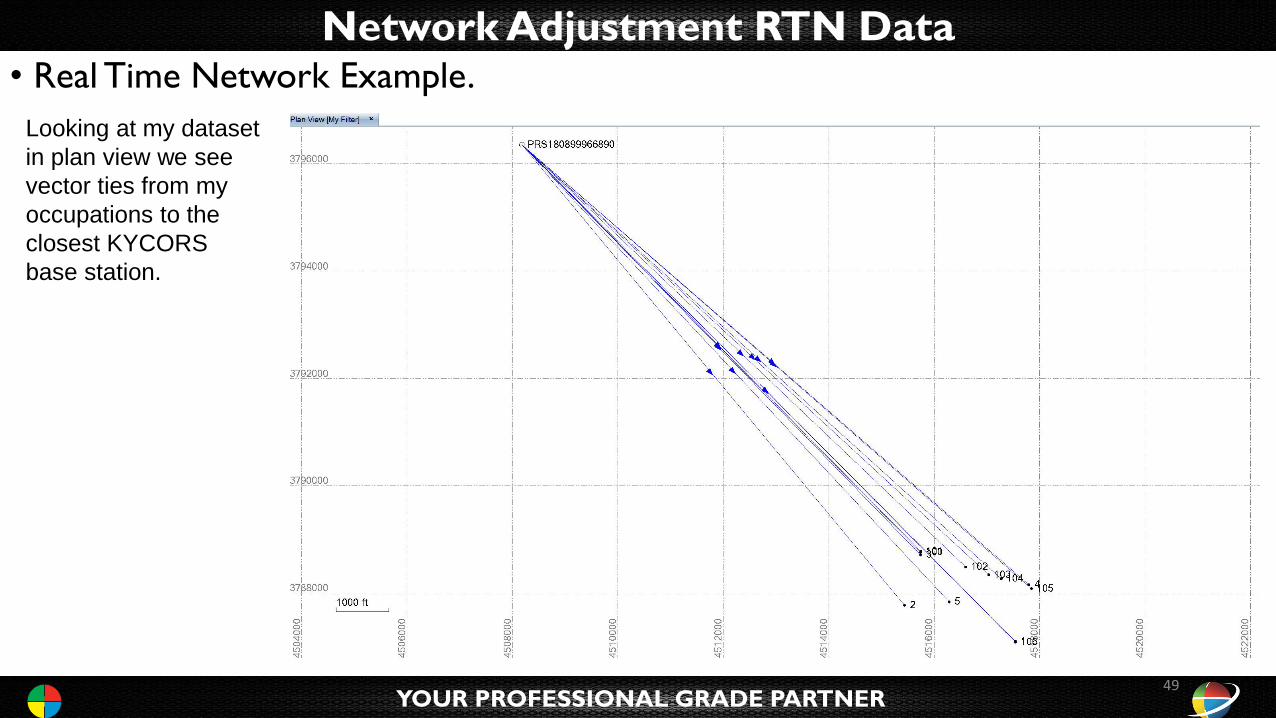
Looking at my dataset
in plan view we see
vector ties from my
occupations to the
closest KYCORS
base station.
49
Network Adjustment RTN Data• Real Time Network Example.
YOUR PROFESSIONAL GRADE PARTNER
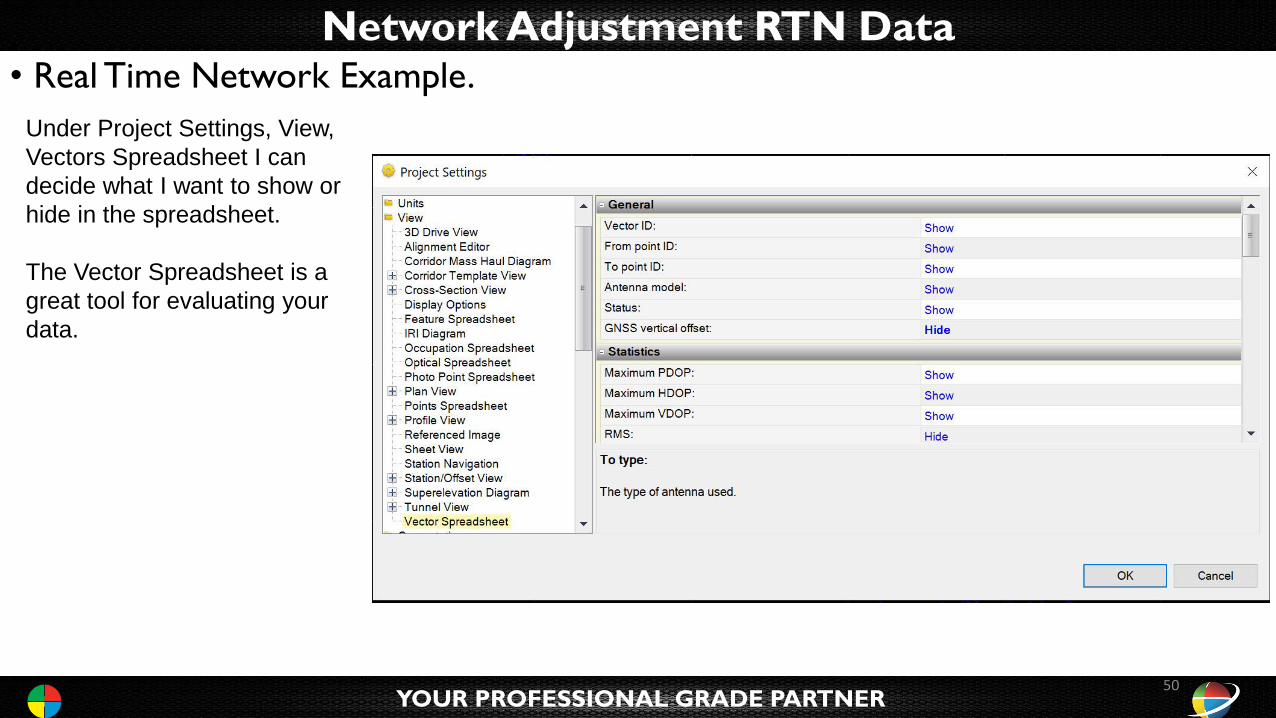
Under Project Settings, View,
Vectors Spreadsheet I can
decide what I want to show or
hide in the spreadsheet.
The Vector Spreadsheet is a
great tool for evaluating your
data.
50
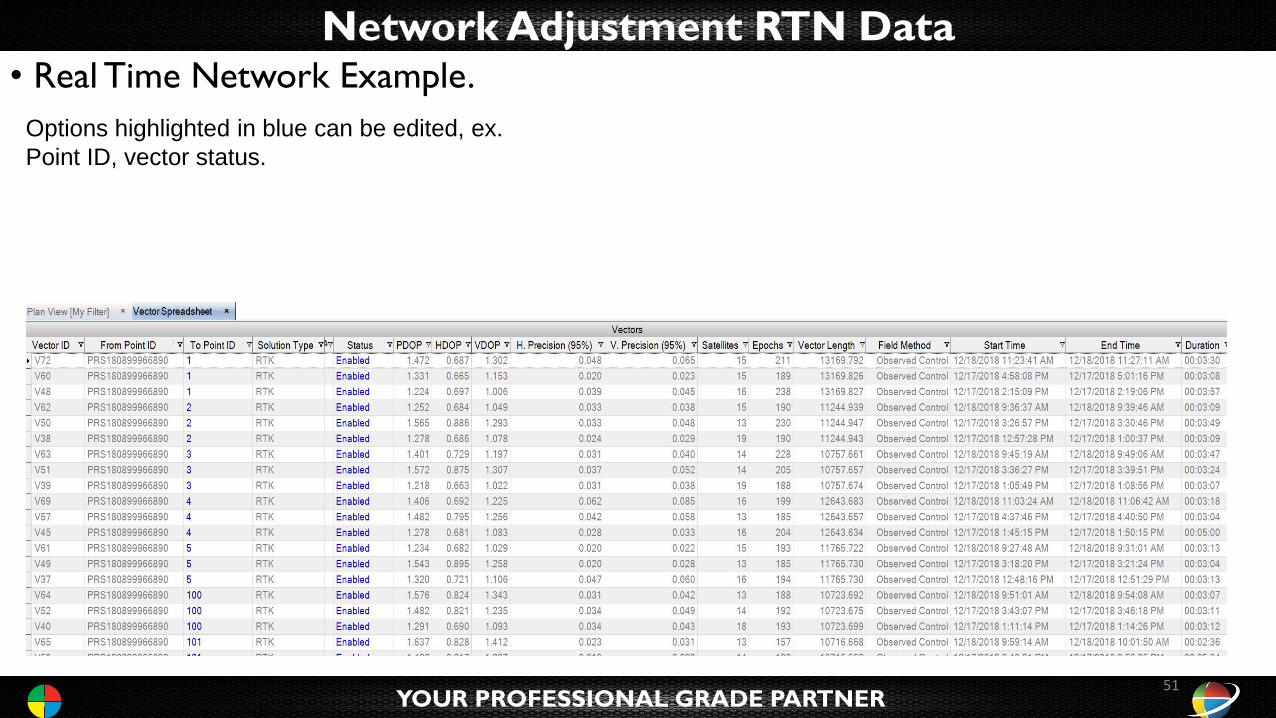
Network Adjustment RTN Data• Real Time Network Example.
YOUR PROFESSIONAL GRADE PARTNER
Options highlighted in blue can be edited, ex.
Point ID, vector status.
51
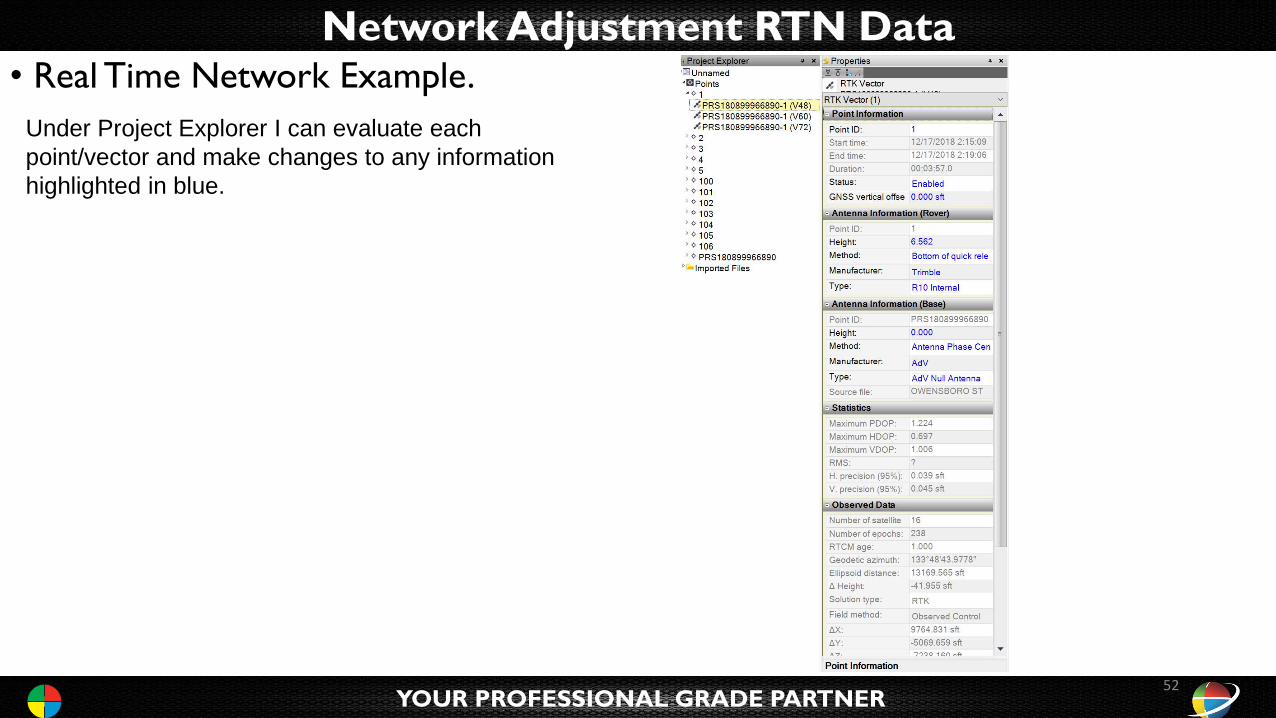
Network Adjustment RTN Data• Real Time Network Example.
YOUR PROFESSIONAL GRADE PARTNER
Under Project Explorer I can evaluate each
point/vector and make changes to any information
highlighted in blue.
52
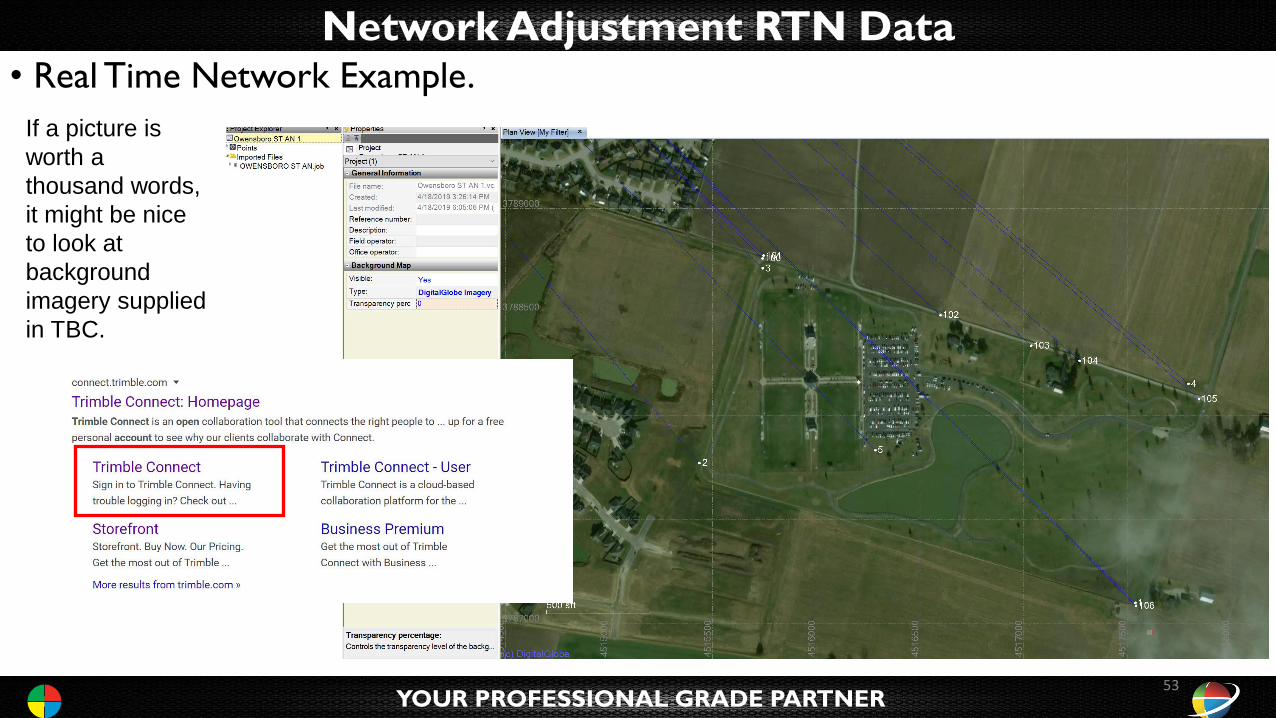
Network Adjustment RTN Data• Real Time Network Example.
YOUR PROFESSIONAL GRADE PARTNER
If a picture is
worth a
thousand words,
it might be nice
to look at
background
imagery supplied
in TBC.
53
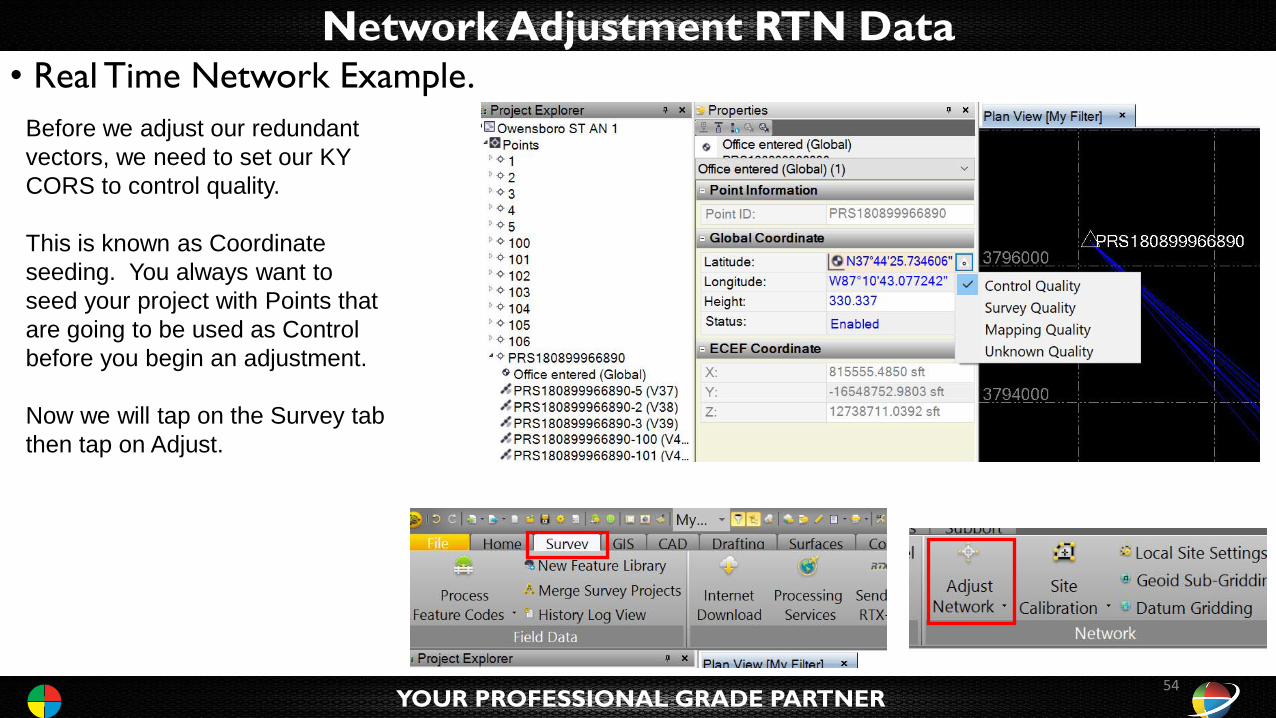
Network Adjustment RTN Data• Real Time Network Example.
YOUR PROFESSIONAL GRADE PARTNER
Before we adjust our redundant
vectors, we need to set our KY
CORS to control quality.
This is known as Coordinate
seeding. You always want to
seed your project with Points that
are going to be used as Control
before you begin an adjustment.
Now we will tap on the Survey tab
then tap on Adjust.
54
Network Adjustment RTN Data• Real Time Network Example.
YOUR PROFESSIONAL GRADE PARTNER
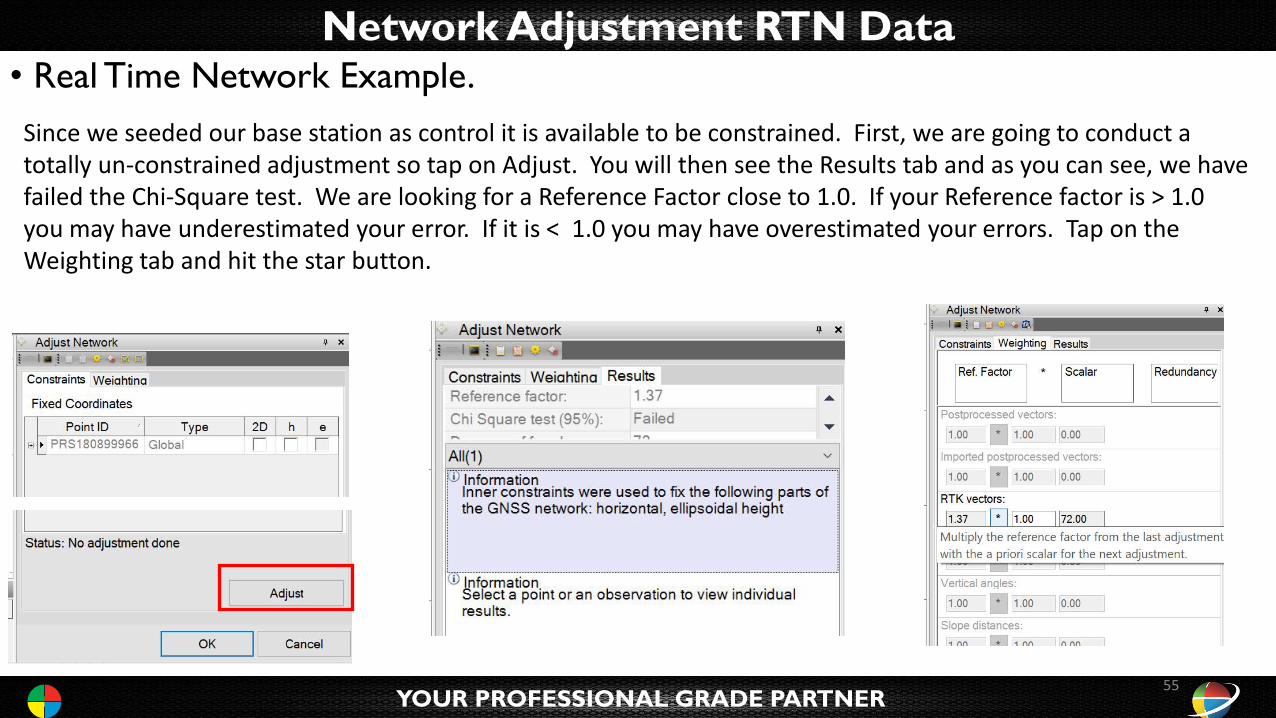
Since we seeded our base station as control it is available to be constrained. First, we are going to conduct a totally un-constrained adjustment so tap on Adjust. You will then see the Results tab and as you can see, we have failed the Chi-Square test. We are looking for a Reference Factor close to 1.0. If your Reference factor is > 1.0 you may have underestimated your error. If it is < 1.0 you may have overestimated your errors. Tap on the Weighting tab and hit the star button.
55
Network Adjustment RTN Data• Real Time Network Example.
YOUR PROFESSIONAL GRADE PARTNER
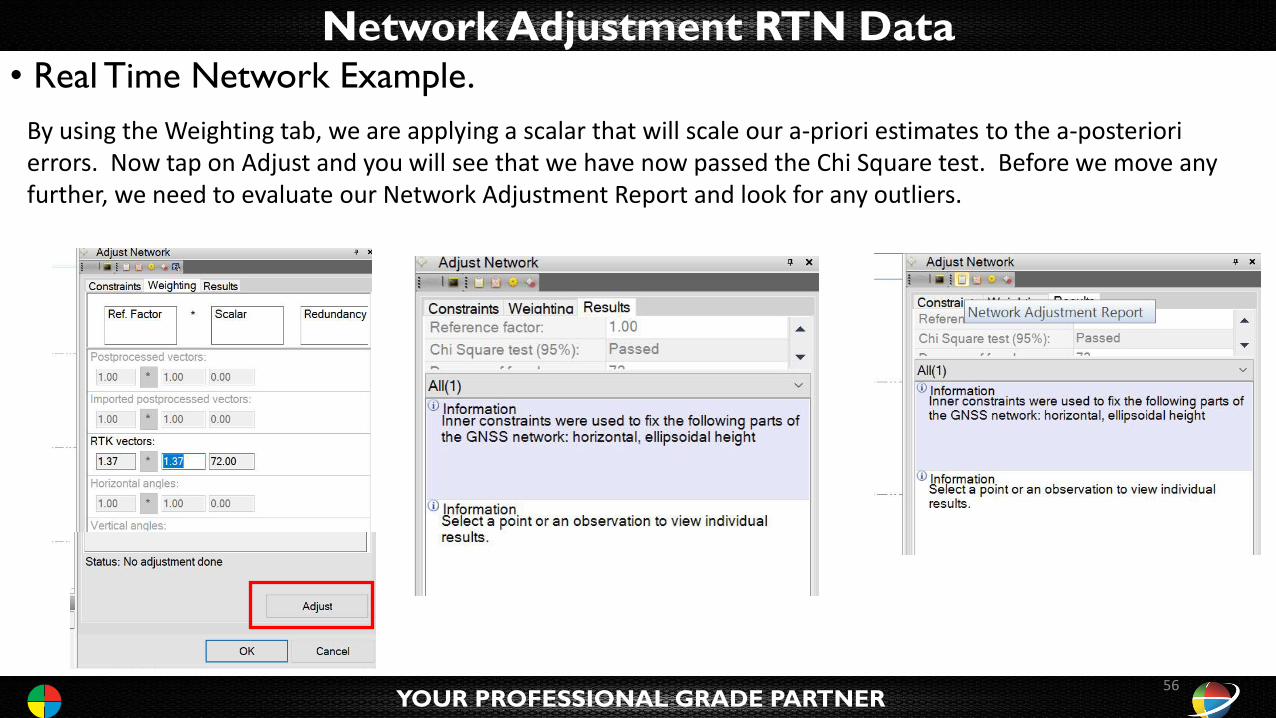
By using the Weighting tab, we are applying a scalar that will scale our a-priori estimates to the a-posteriori errors. Now tap on Adjust and you will see that we have now passed the Chi Square test. Before we move any further, we need to evaluate our Network Adjustment Report and look for any outliers.
56
Network Adjustment RTN Data• Real Time Network Example.
YOUR PROFESSIONAL GRADE PARTNER
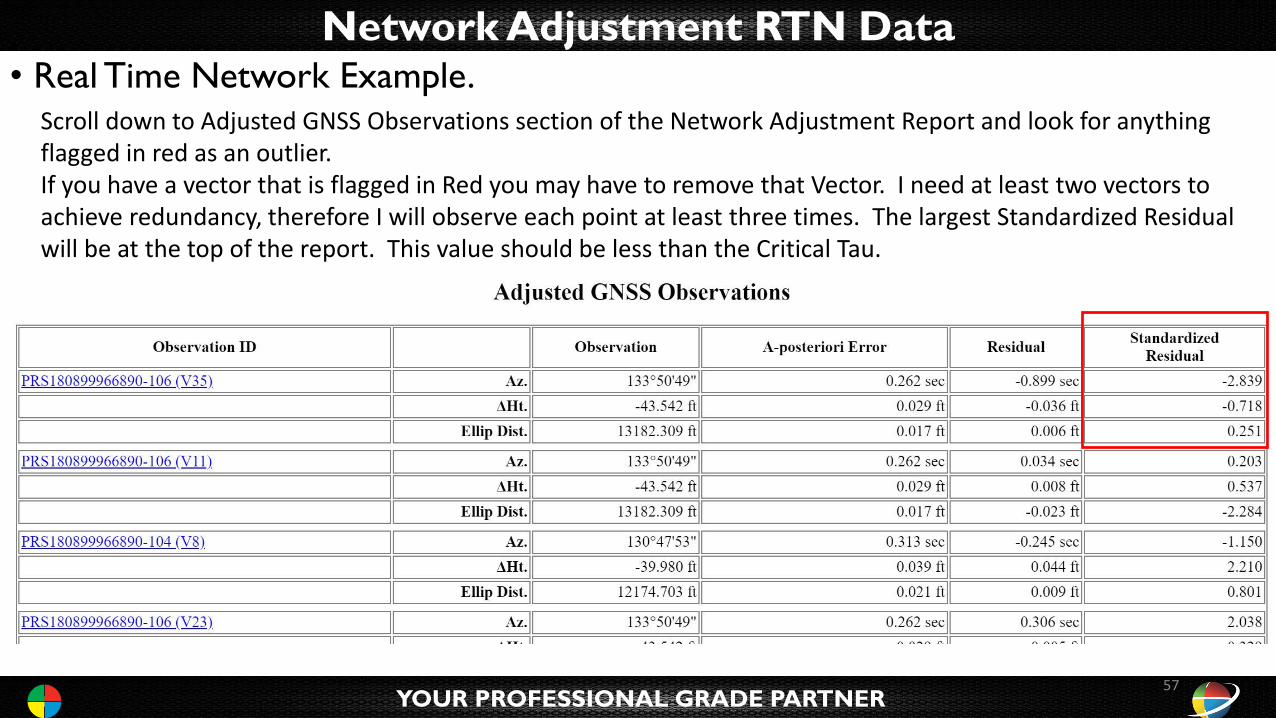
Scroll down to Adjusted GNSS Observations section of the Network Adjustment Report and look for anything flagged in red as an outlier.If you have a vector that is flagged in Red you may have to remove that Vector. I need at least two vectors to achieve redundancy, therefore I will observe each point at least three times. The largest Standardized Residual will be at the top of the report. This value should be less than the Critical Tau.
57
Network Adjustment RTN Data• Real Time Network Example.
YOUR PROFESSIONAL GRADE PARTNER
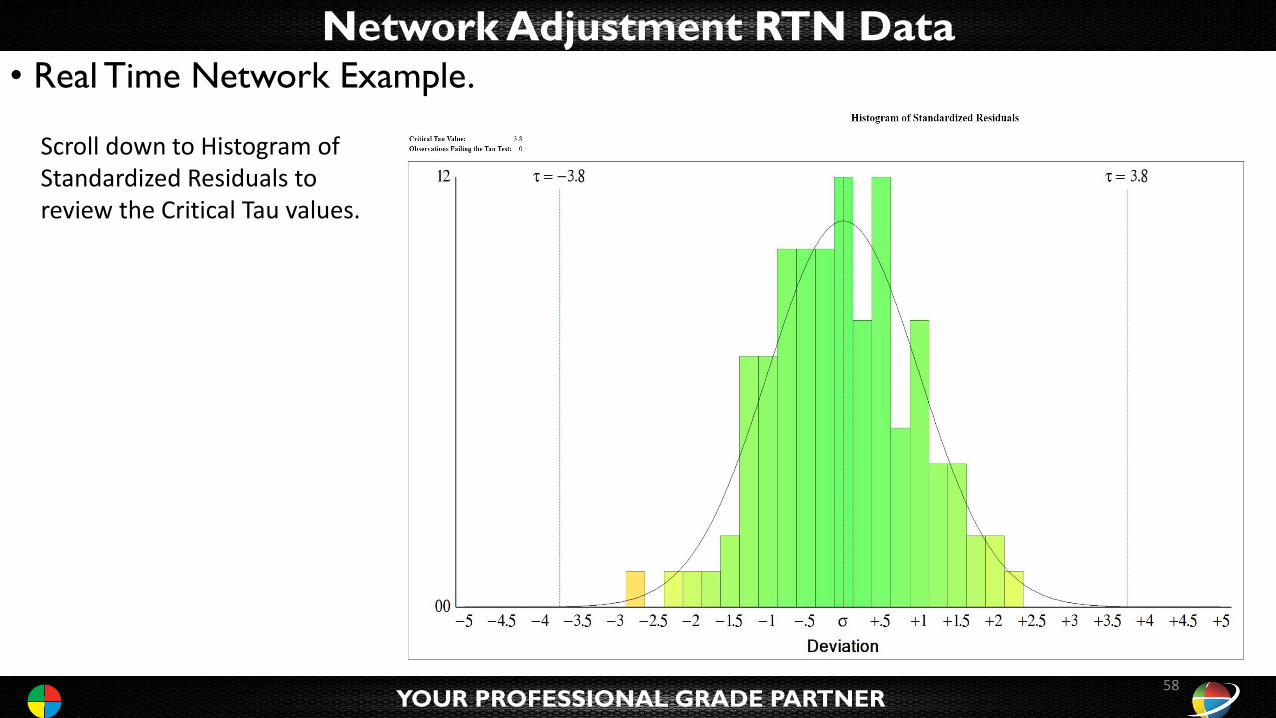
Scroll down to Histogram of Standardized Residuals to review the Critical Tau values.
58
Network Adjustment RTN Data• Real Time Network Example.
YOUR PROFESSIONAL GRADE PARTNER
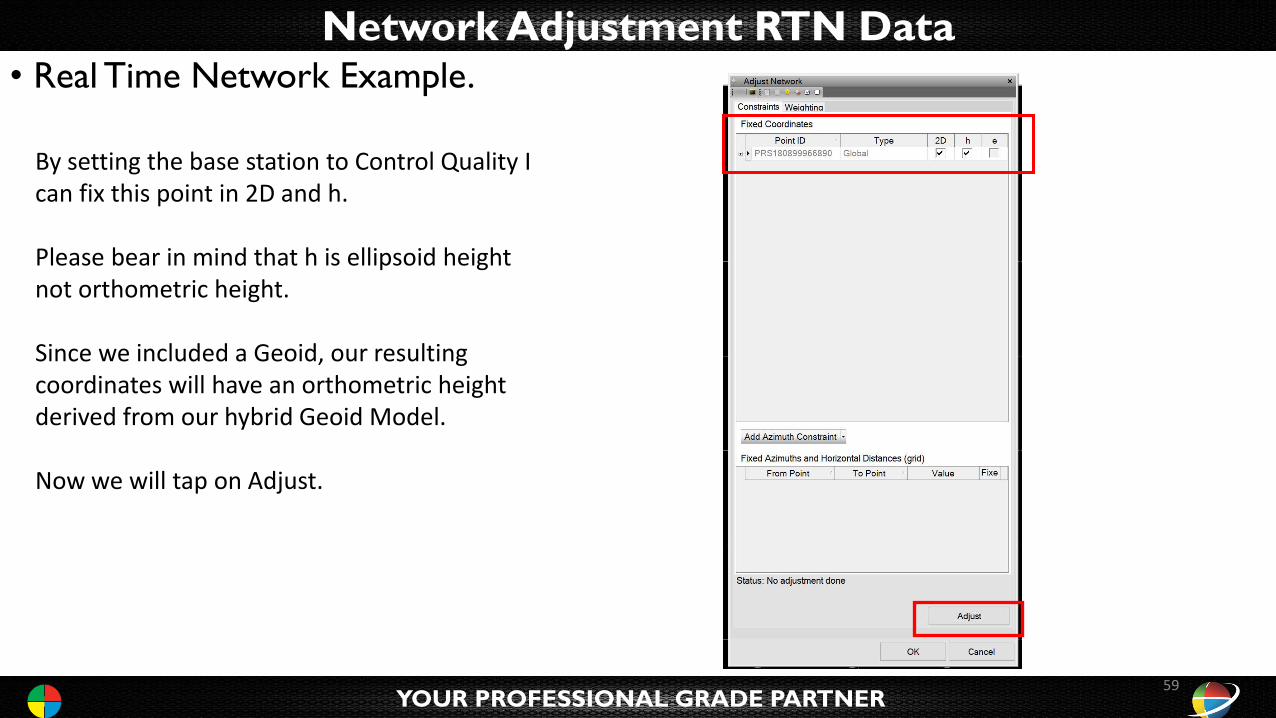
By setting the base station to Control Quality I can fix this point in 2D and h.
Please bear in mind that h is ellipsoid height not orthometric height.
Since we included a Geoid, our resulting coordinates will have an orthometric height derived from our hybrid Geoid Model.
Now we will tap on Adjust.
59
Network Adjustment RTN Data• Real Time Network Example.
YOUR PROFESSIONAL GRADE PARTNER
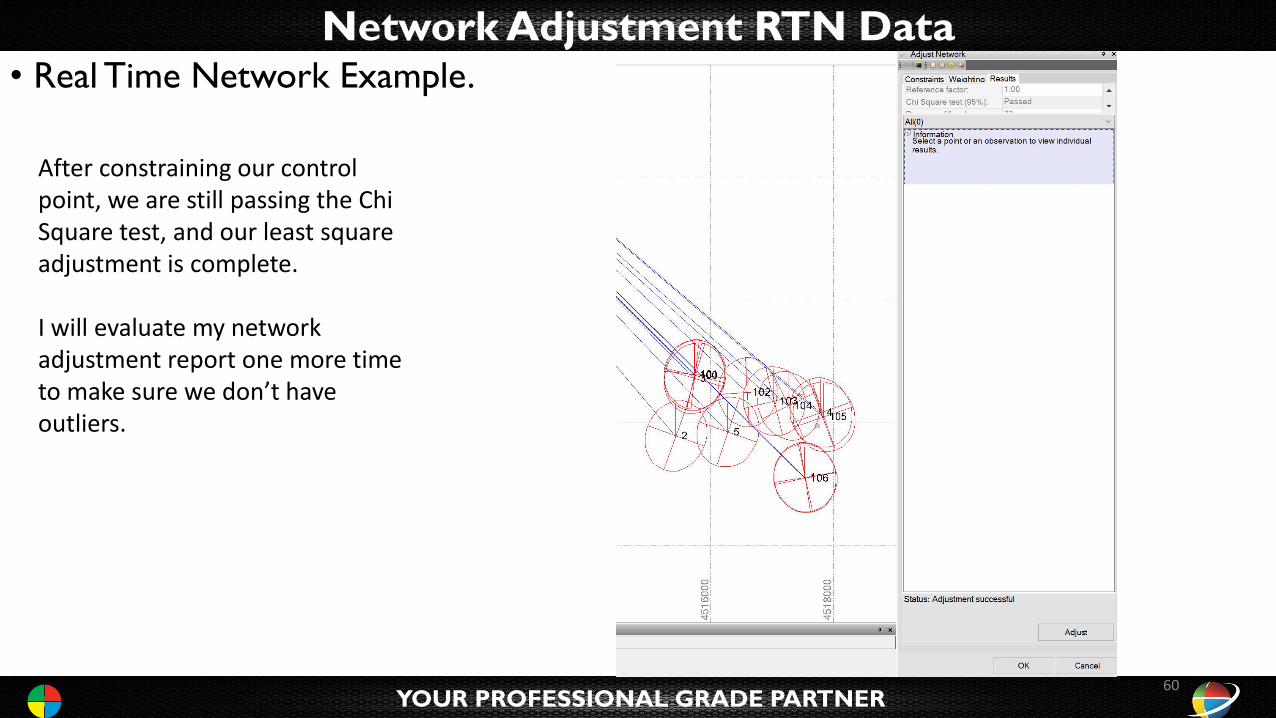
After constraining our control point, we are still passing the Chi Square test, and our least square adjustment is complete.
I will evaluate my network adjustment report one more time to make sure we don’t have outliers.
60
Network Adjustment RTN Data• Real Time Network Example.
YOUR PROFESSIONAL GRADE PARTNER
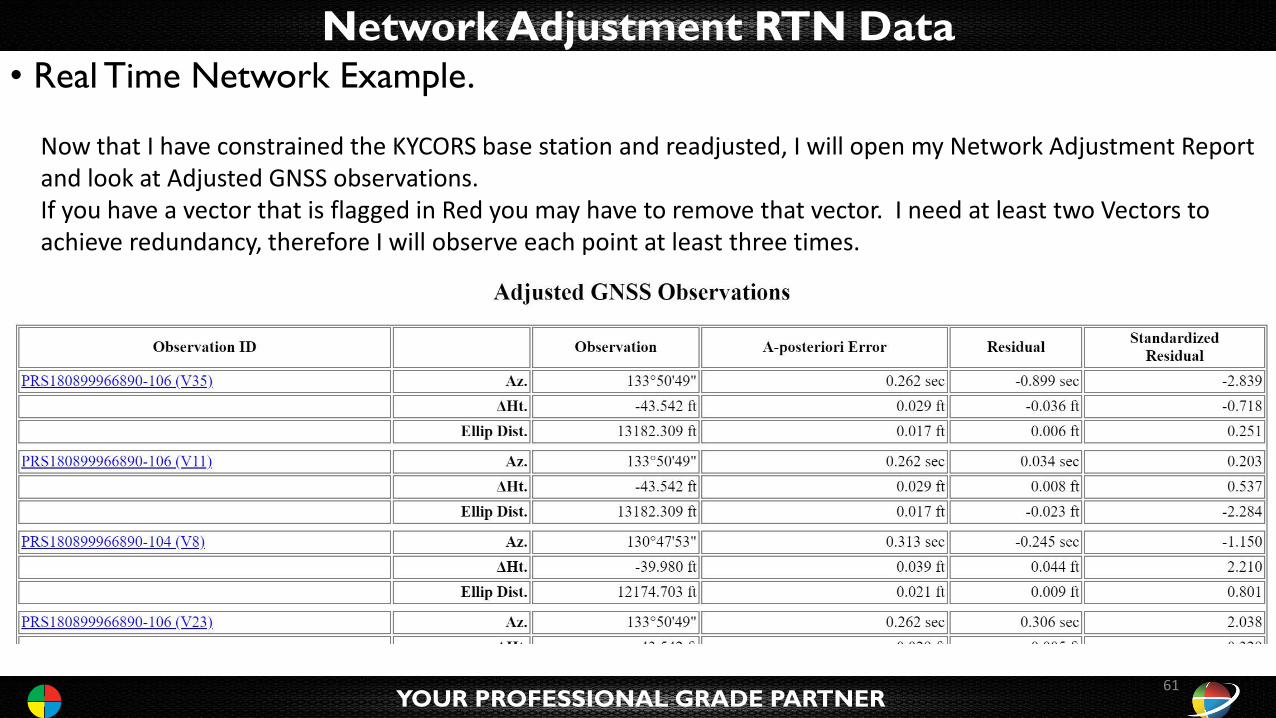
Now that I have constrained the KYCORS base station and readjusted, I will open my Network Adjustment Report and look at Adjusted GNSS observations.If you have a vector that is flagged in Red you may have to remove that vector. I need at least two Vectors to achieve redundancy, therefore I will observe each point at least three times.
61
Network Adjustment RTN Data• Real Time Network Example.
YOUR PROFESSIONAL GRADE PARTNER
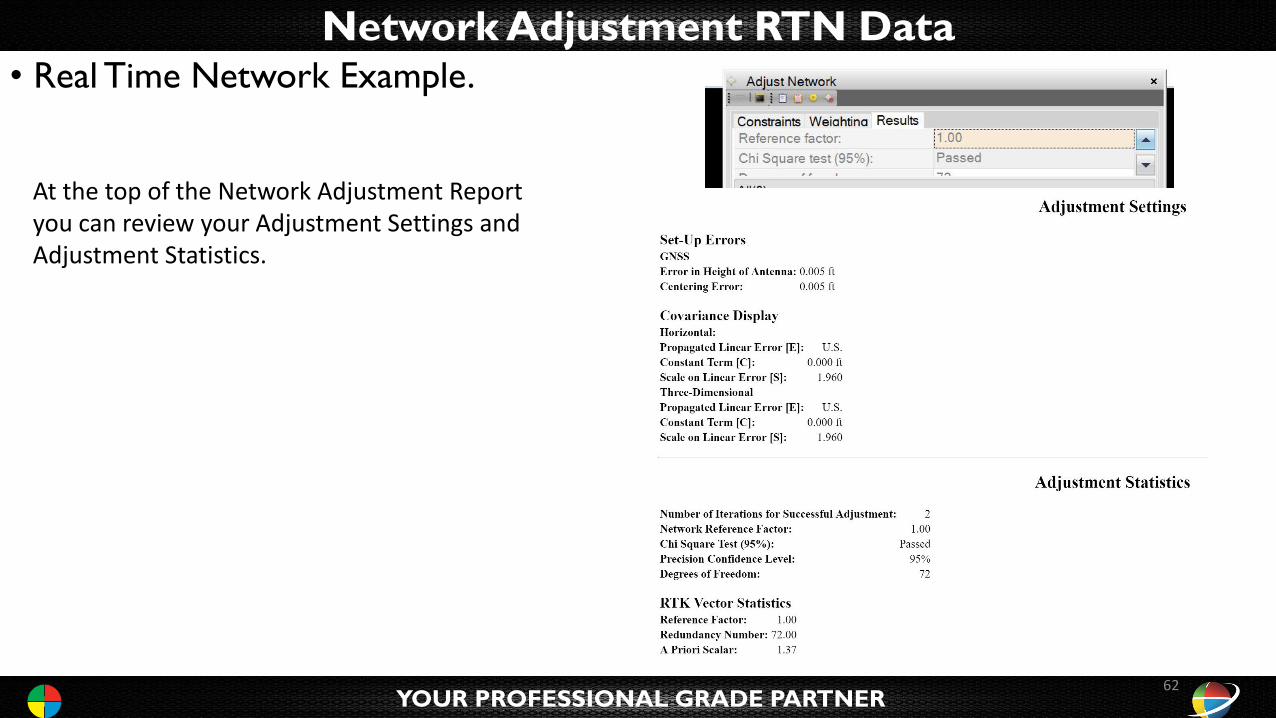
At the top of the Network Adjustment Report you can review your Adjustment Settings and Adjustment Statistics.
62
Network Adjustment RTN Data• Real Time Network Example.
YOUR PROFESSIONAL GRADE PARTNER
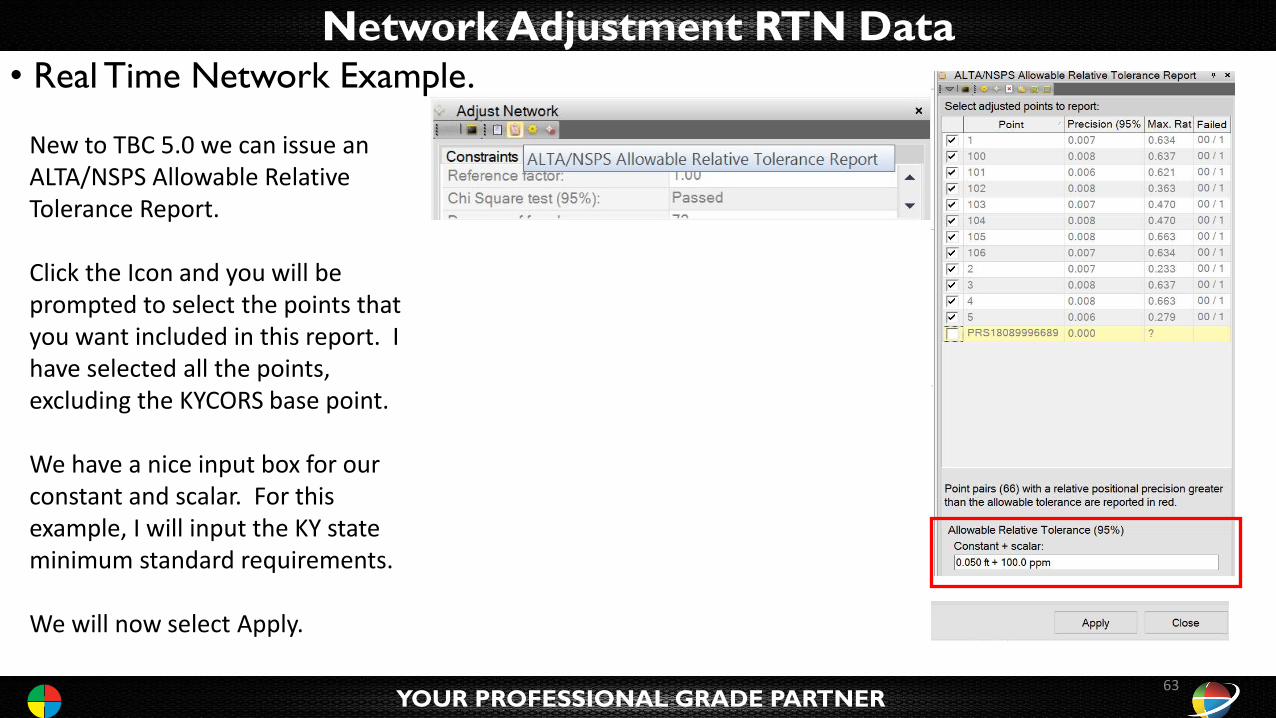
New to TBC 5.0 we can issue an ALTA/NSPS Allowable Relative Tolerance Report.
Click the Icon and you will be prompted to select the points that you want included in this report. I have selected all the points, excluding the KYCORS base point.
We have a nice input box for our constant and scalar. For this example, I will input the KY state minimum standard requirements.
We will now select Apply.
63
Network Adjustment RTN Data• Real Time Network Example.
YOUR PROFESSIONAL GRADE PARTNER
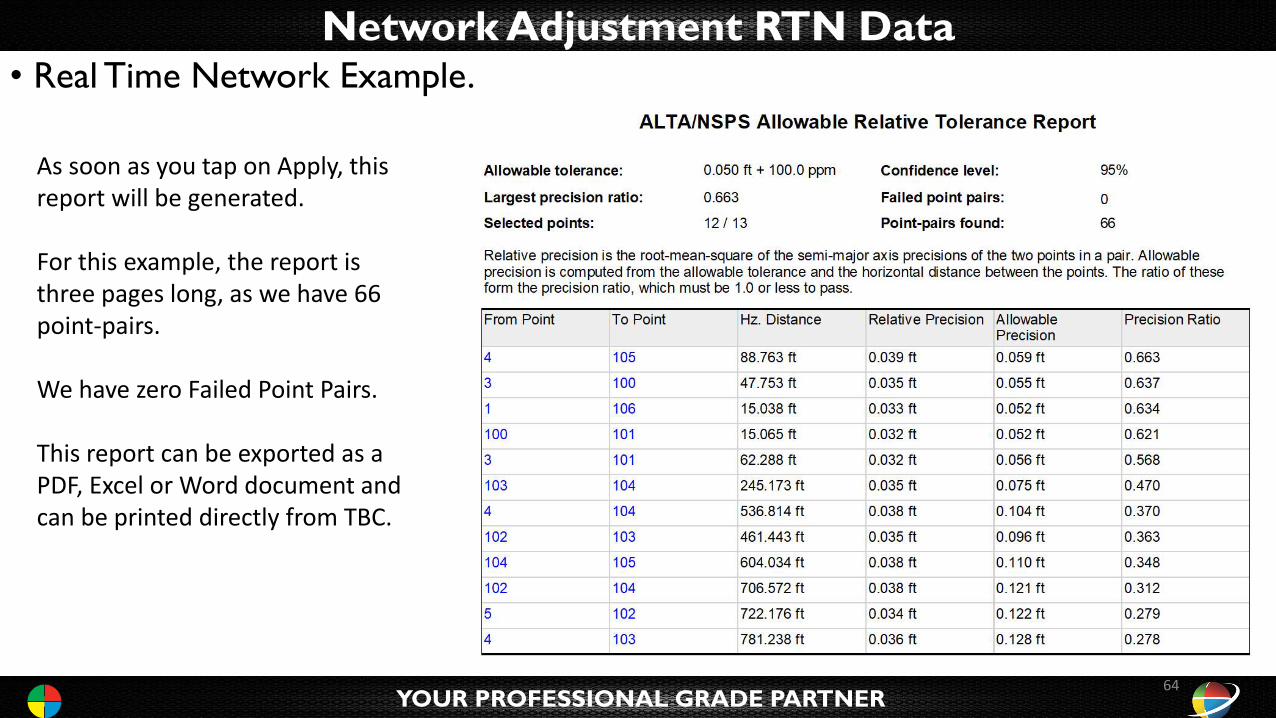
As soon as you tap on Apply, this report will be generated.
For this example, the report is three pages long, as we have 66 point-pairs.
We have zero Failed Point Pairs.
This report can be exported as a PDF, Excel or Word document and can be printed directly from TBC.
64
Network Adjustment RTN Data• Real Time Network Example.
YOUR PROFESSIONAL GRADE PARTNER
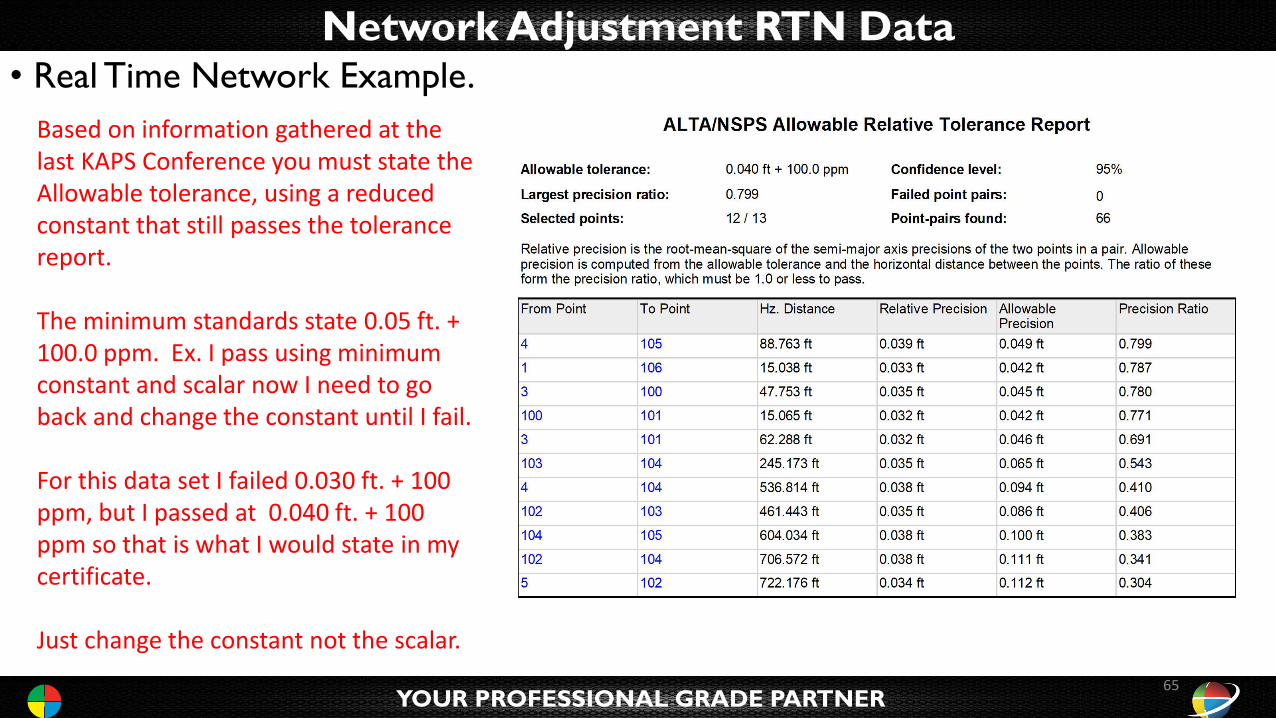
Based on information gathered at the last KAPS Conference you must state the Allowable tolerance, using a reduced constant that still passes the tolerance report.
The minimum standards state 0.05 ft. + 100.0 ppm. Ex. I pass using minimum constant and scalar now I need to go back and change the constant until I fail.
For this data set I failed 0.030 ft. + 100 ppm, but I passed at 0.040 ft. + 100 ppm so that is what I would state in my certificate.
Just change the constant not the scalar.
65

Have a Great Day
YOUR PROFESSIONAL GRADE PARTNER
Questions:
Jeff Clark, PLS, RLSPrecision Products270-559-9097 (cell)[email protected]
66