Embed Size (px)
Citation preview
UNCLASSIFIED//FOUO
UNCLASSIFIED//FOUO
Part ILTC Renee Cole, PhD, RDN, LDN
Introduction toStatistical Principles

UNCLASSIFIED//FOUO
UNCLASSIFIED//FOUO
April [email protected]; 508‐233‐5808 2 of 37
Purpose
The goal of this training session is to gain (or refresh) basic knowledge of statistical principles.
Why do we care?
• Identify statistical tests needed to: – Effectively answer your research question– Assess data collected – Improve ability to critically appraise the quality of evidence-
based literature
Note: Sessions present common statistical methods used. It is not meant to be all inclusive.
UNCLASSIFIED//FOUO
UNCLASSIFIED//FOUO
April [email protected]; 508‐233‐5808 3 of 37
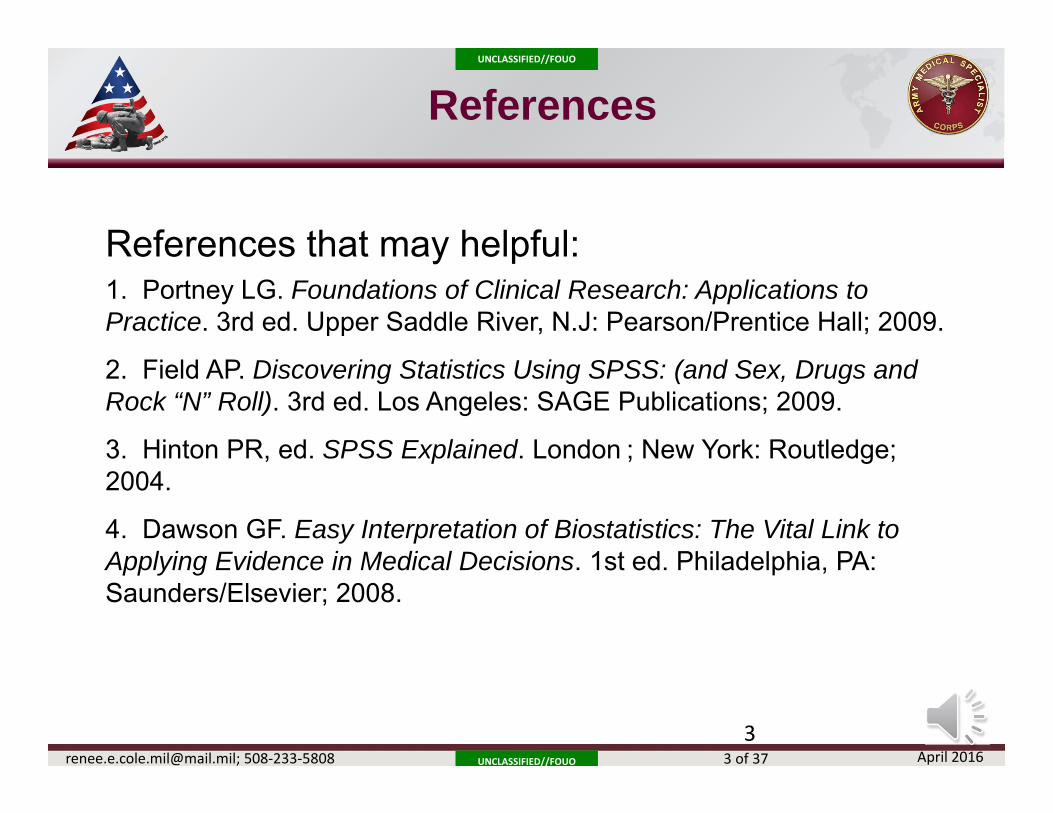
References
References that may helpful:1. Portney LG. Foundations of Clinical Research: Applications to Practice. 3rd ed. Upper Saddle River, N.J: Pearson/Prentice Hall; 2009.
2. Field AP. Discovering Statistics Using SPSS: (and Sex, Drugs and Rock “N” Roll). 3rd ed. Los Angeles: SAGE Publications; 2009.
3. Hinton PR, ed. SPSS Explained. London ; New York: Routledge; 2004.
4. Dawson GF. Easy Interpretation of Biostatistics: The Vital Link to Applying Evidence in Medical Decisions. 1st ed. Philadelphia, PA: Saunders/Elsevier; 2008.
3
UNCLASSIFIED//FOUO
UNCLASSIFIED//FOUO
April [email protected]; 508‐233‐5808 4 of 37
Acknowledgements
• Dr. Steven Allison, PT, retired Air Force Colonel• Dr. John Childs, PT, Air Force Lt Col• Dr. Shane Koppenhaver, PT, Army LTC
Some slide materials were extracted from their presentations for use in this 3-Part series
4
UNCLASSIFIED//FOUO
UNCLASSIFIED//FOUO
April [email protected]; 508‐233‐5808 5 of 37
Objectives
• Describe variable scales of measurements
• Describe the principles involved in statistical inference & hypothesis testing
• Determine the appropriate statistical tests:– Descriptive analysis
– Correlation analysis
– T-tests analysis
– ANOVA & Repeated Measures models
UNCLASSIFIED//FOUO
UNCLASSIFIED//FOUO
April [email protected]; 508‐233‐5808 6 of 37
1st and Foremost…
• Methods & statistical test must be able to address the research question
• The type of statistical methods will depend upon:• Research design• Variables (independent vs. dependent)• Scales of measurement• Normality & homogeneity of data
• Always compute descriptive statistics to paint the picture of your sample population / setting
UNCLASSIFIED//FOUO
UNCLASSIFIED//FOUO
April [email protected]; 508‐233‐5808 7 of 37
Classifications of Statistics
• Descriptive – What are the characteristics of?• Comparative – What’s the difference between?• Correlation – What’s the relationship (association) between?• Regression – What predicts?• Reliability – How reproducible are scores, a technique or
device?
• Parametric (inferential) - With underlying assumptions• Nonparametric – Does not meet assumptions
• Univariate – Using a single dependent variable• Multivariate – Simultaneous use of multiple dependent variables
UNCLASSIFIED//FOUO
UNCLASSIFIED//FOUO
April [email protected]; 508‐233‐5808 8 of 37
Making Choices
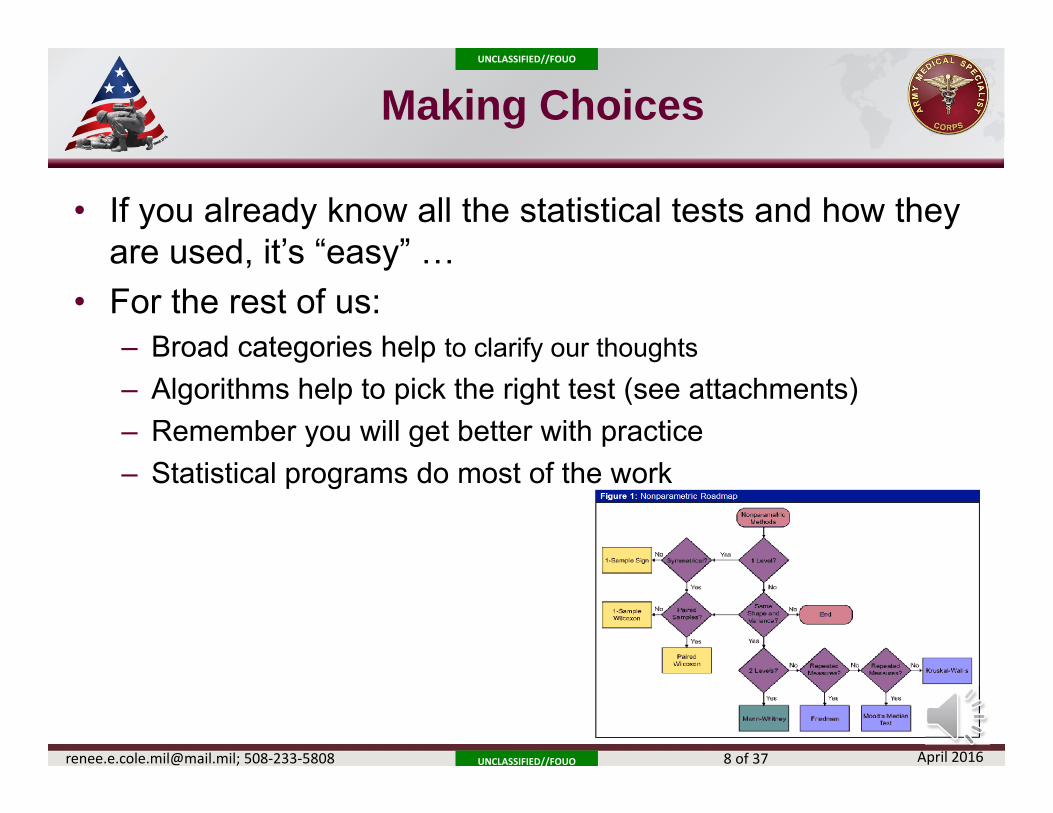
• If you already know all the statistical tests and how they are used, it’s “easy” …
• For the rest of us:– Broad categories help to clarify our thoughts– Algorithms help to pick the right test (see attachments)– Remember you will get better with practice– Statistical programs do most of the work
UNCLASSIFIED//FOUO
UNCLASSIFIED//FOUO
April [email protected]; 508‐233‐5808 9 of 37
Variable Scales of Measurement
• Nominal ("naming" ) variables
• Ordinal ("ordered") variables
• Interval (equal intervals) variables
• Ratio (equal intervals, true zero) variables
UNCLASSIFIED//FOUO
UNCLASSIFIED//FOUO
April [email protected]; 508‐233‐5808 10 of 37
Variable Scale of Measurement
Why Bother Identifying the Variable Scale of Measurement?
• Required to choose the right statistical test • Helps to determine if parametric or non-
parametric version of statistical test
UNCLASSIFIED//FOUO
UNCLASSIFIED//FOUO
April [email protected]; 508‐233‐5808 11 of 37
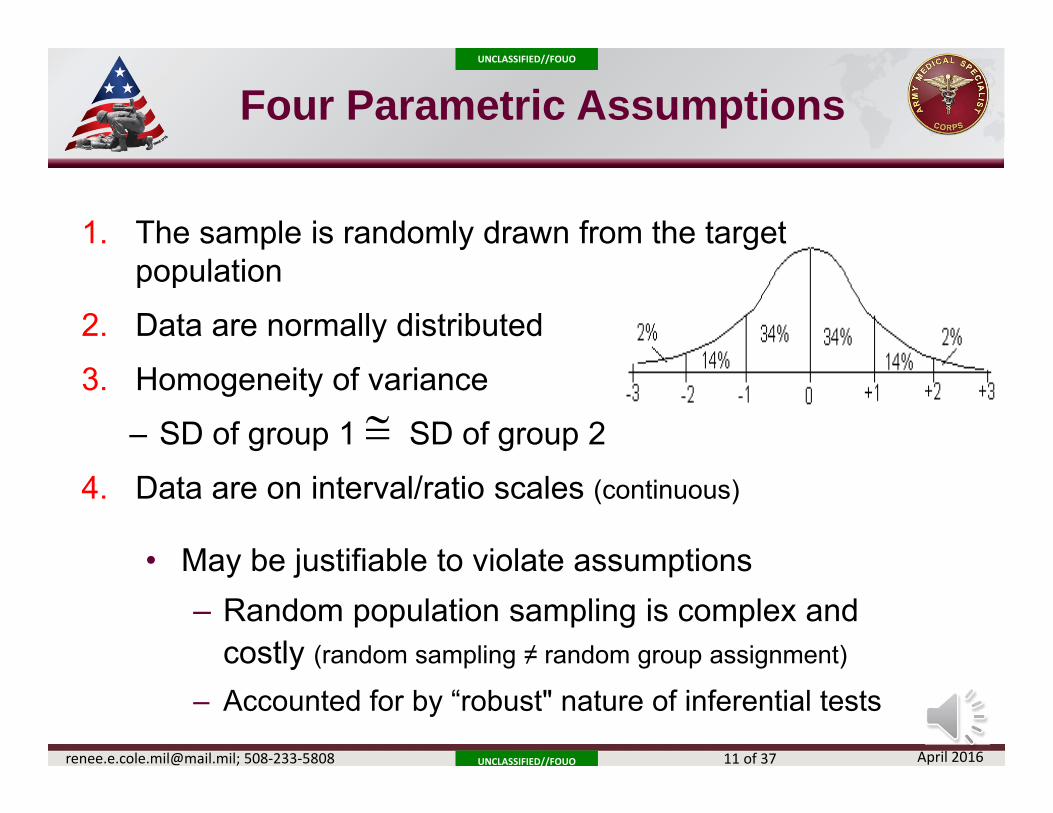
Four Parametric Assumptions
1. The sample is randomly drawn from the target population
2. Data are normally distributed
3. Homogeneity of variance
– SD of group 1 SD of group 2
4. Data are on interval/ratio scales (continuous)
• May be justifiable to violate assumptions– Random population sampling is complex and
costly (random sampling ≠ random group assignment)
– Accounted for by “robust" nature of inferential tests
UNCLASSIFIED//FOUO
UNCLASSIFIED//FOUO
April [email protected]; 508‐233‐5808 12 of 37
Nominal Variables
• Dichotomous or categorical
• Discrete and mutually exclusive categories
• To analyze must assign a # for each category / response for identification only (dummy coding)
• Examples: – Sex (1=Male, 2=Female) or Deployed (1=Yes, 2=No)
– Race (1=Caucasian, 2=Black/AA, 3=Asian, etc.)
– Medical Condition (1=DM2, 2=HTN, 3=CVD, etc.)
• Math: descriptive counts only (frequencies or percent)
• No quantitative value – Mean value will not make sense (i.e. Sex mean value = 1.3)
– Frequency (n= 200 Men); percent (70% men)
UNCLASSIFIED//FOUO
UNCLASSIFIED//FOUO
April [email protected]; 508‐233‐5808 13 of 37
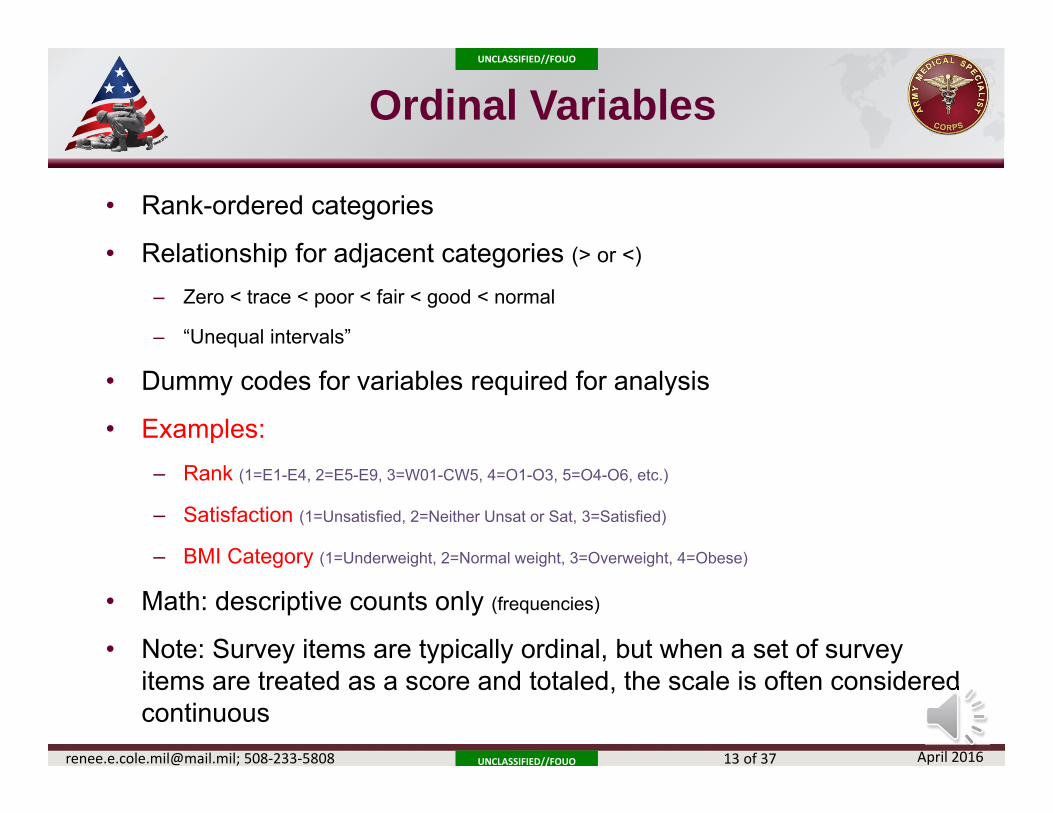
Ordinal Variables
• Rank-ordered categories
• Relationship for adjacent categories (> or <)
– Zero < trace < poor < fair < good < normal
– “Unequal intervals”
• Dummy codes for variables required for analysis
• Examples: – Rank (1=E1-E4, 2=E5-E9, 3=W01-CW5, 4=O1-O3, 5=O4-O6, etc.)
– Satisfaction (1=Unsatisfied, 2=Neither Unsat or Sat, 3=Satisfied)
– BMI Category (1=Underweight, 2=Normal weight, 3=Overweight, 4=Obese)
• Math: descriptive counts only (frequencies)
• Note: Survey items are typically ordinal, but when a set of survey items are treated as a score and totaled, the scale is often considered continuous
UNCLASSIFIED//FOUO
UNCLASSIFIED//FOUO
April [email protected]; 508‐233‐5808 14 of 37
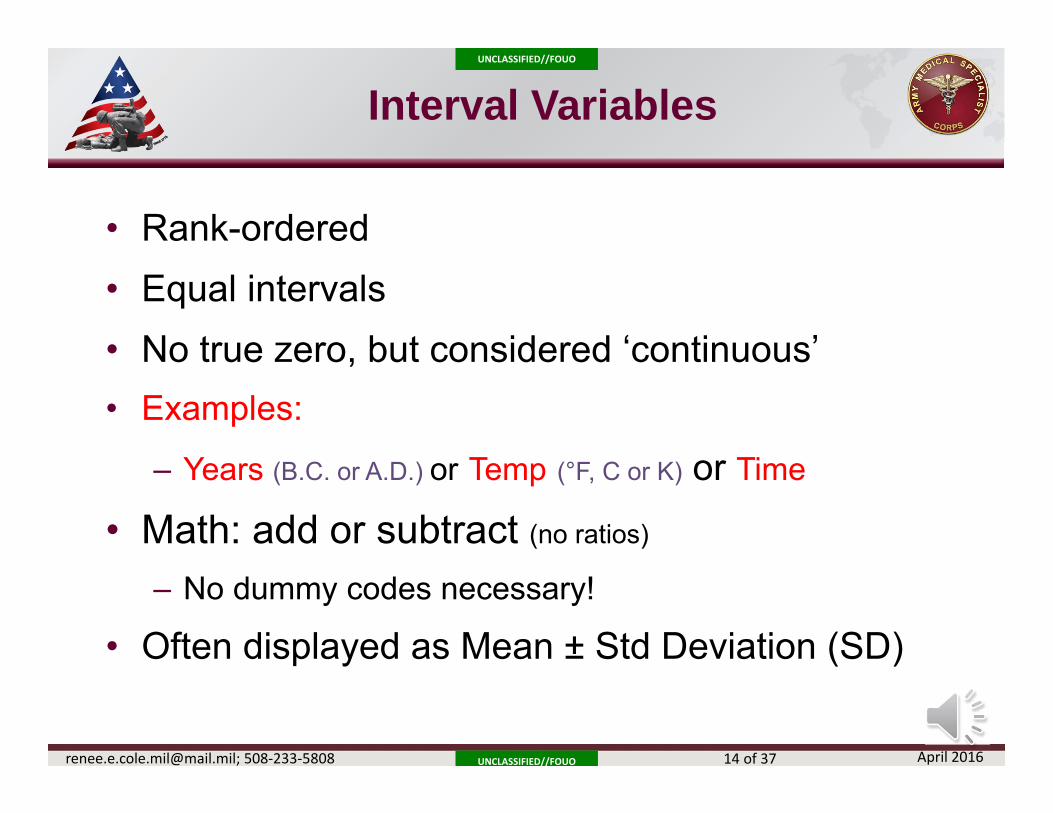
Interval Variables
• Rank-ordered• Equal intervals• No true zero, but considered ‘continuous’• Examples:
– Years (B.C. or A.D.) or Temp (°F, C or K) or Time
• Math: add or subtract (no ratios)
– No dummy codes necessary!
• Often displayed as Mean ± Std Deviation (SD)
UNCLASSIFIED//FOUO
UNCLASSIFIED//FOUO
April [email protected]; 508‐233‐5808 15 of 37
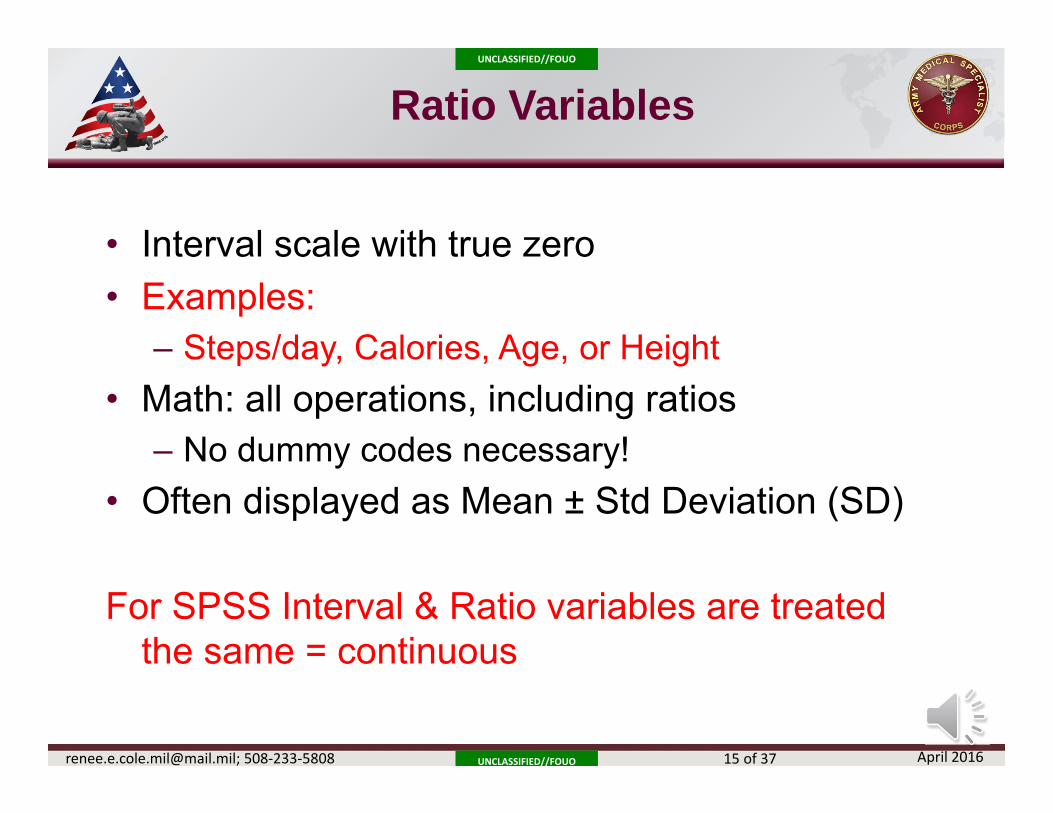
Ratio Variables
• Interval scale with true zero• Examples:
– Steps/day, Calories, Age, or Height • Math: all operations, including ratios
– No dummy codes necessary!• Often displayed as Mean ± Std Deviation (SD)
For SPSS Interval & Ratio variables are treated the same = continuous

UNCLASSIFIED//FOUO
UNCLASSIFIED//FOUO
April [email protected]; 508‐233‐5808 16 of 37
Let’s Practice…
How can you manipulate these variables to change the scale?
• Education• Calories• Passed a Test• Behavioral Risk Score• Military Rank• Weight Status• Age
Can convert from continuous to nominal or ordinal, but cannot go in the opposite direction
Education Possibilities• Continuous
– Total # of years of education
• Ordinal– 1= High School Diploma– 2= Associates Degree– 3= Bachelor’s Degree– 4= Masters / Grad Degree
• Nominal– 1= Received BS diploma– 2= Did Not receive BS diploma
UNCLASSIFIED//FOUO
UNCLASSIFIED//FOUO
April [email protected]; 508‐233‐5808 17 of 37
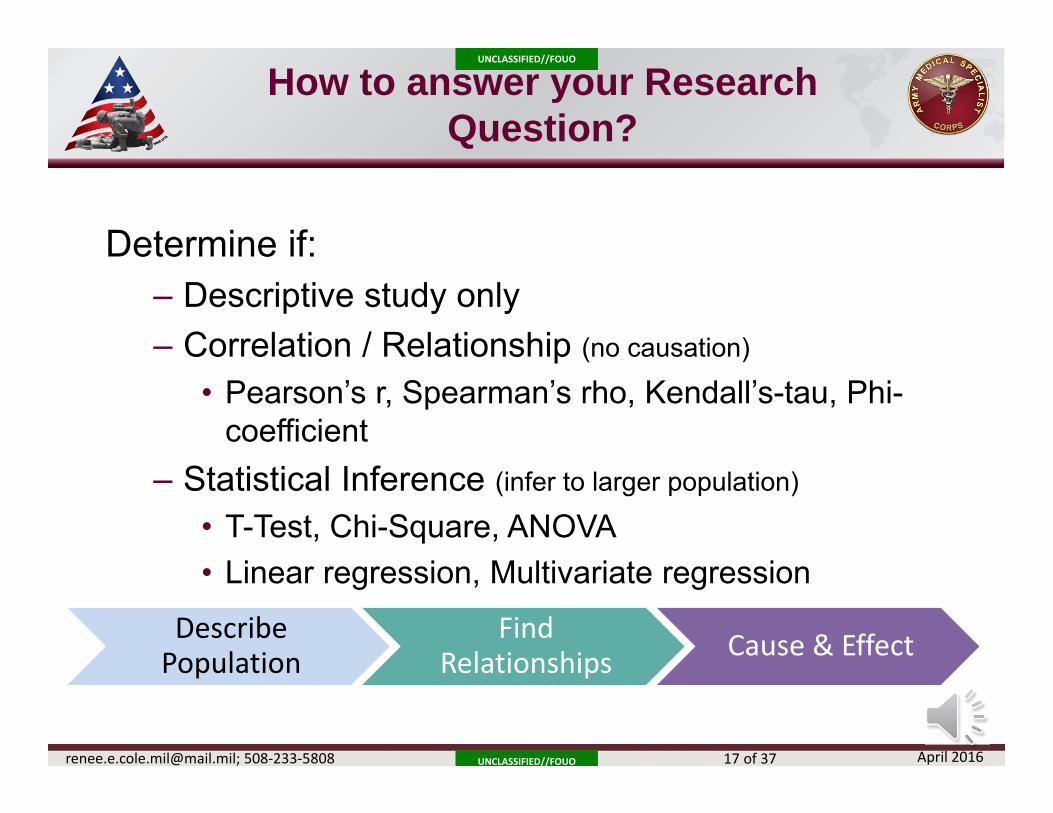
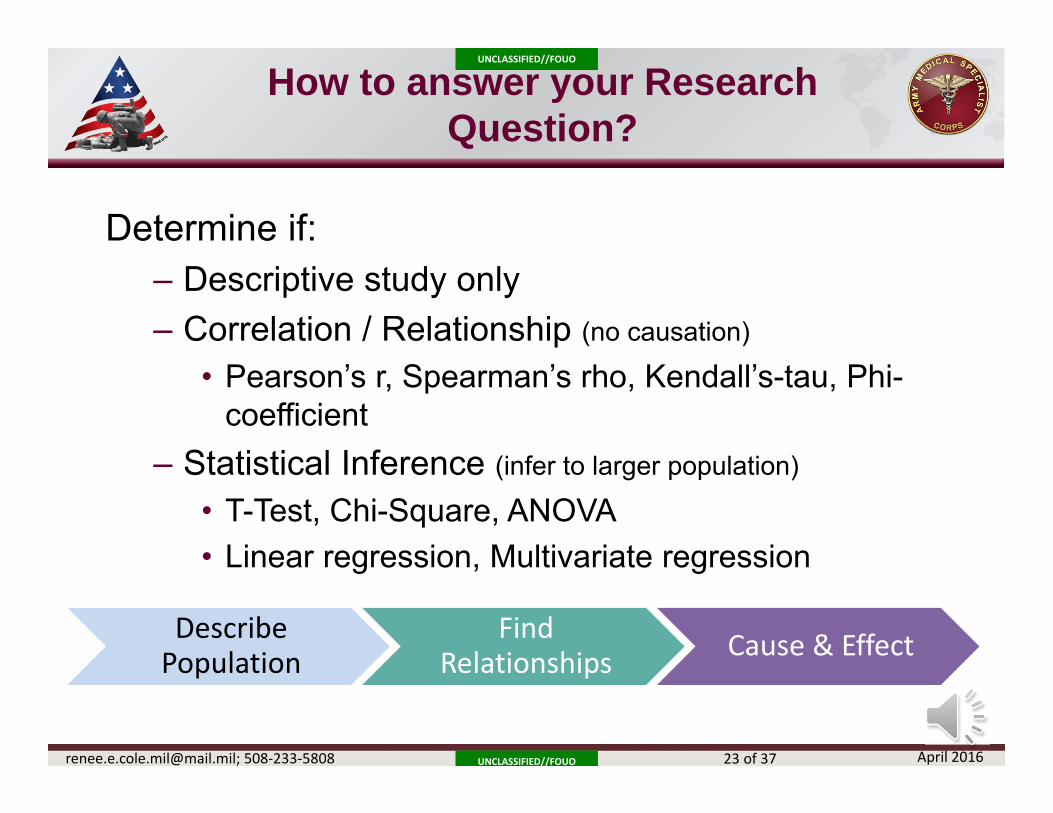
How to answer your Research Question?
Determine if:– Descriptive study only– Correlation / Relationship (no causation)
• Pearson’s r, Spearman’s rho, Kendall’s-tau, Phi-coefficient
– Statistical Inference (infer to larger population)
• T-Test, Chi-Square, ANOVA• Linear regression, Multivariate regression
Describe Population
Find Relationships Cause & Effect
UNCLASSIFIED//FOUO
UNCLASSIFIED//FOUO
April [email protected]; 508‐233‐5808 18 of 37
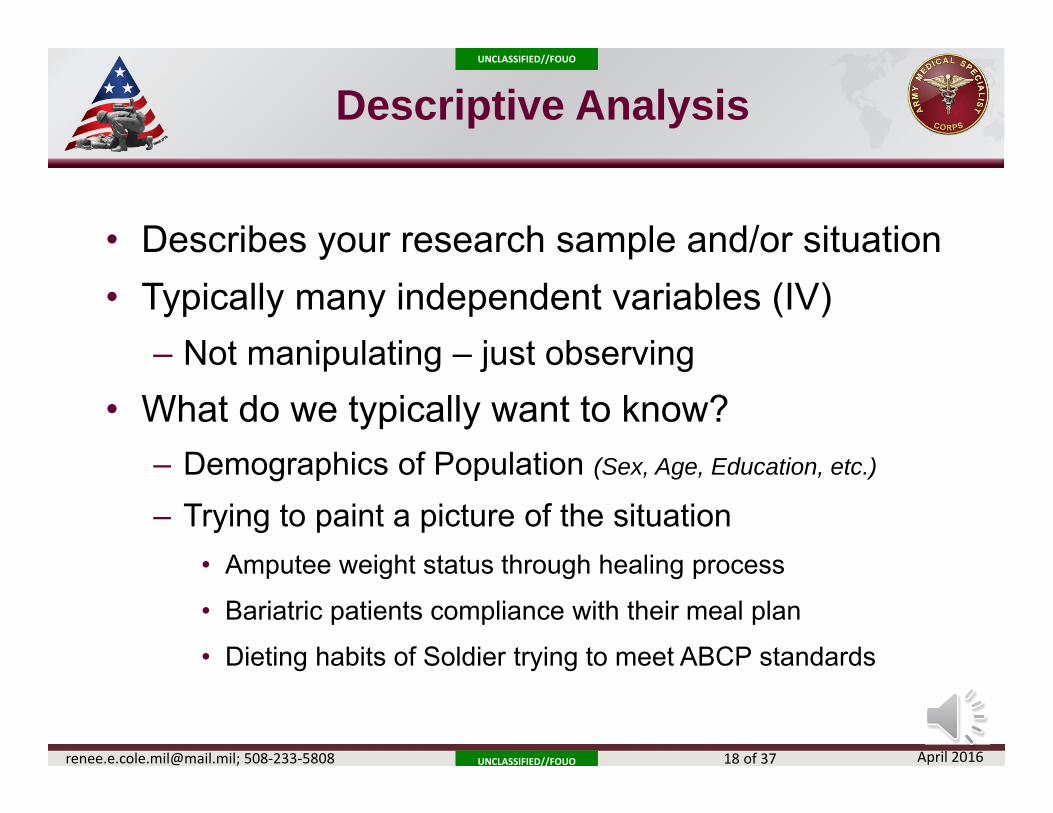
Descriptive Analysis
• Describes your research sample and/or situation• Typically many independent variables (IV)
– Not manipulating – just observing• What do we typically want to know?
– Demographics of Population (Sex, Age, Education, etc.)
– Trying to paint a picture of the situation• Amputee weight status through healing process
• Bariatric patients compliance with their meal plan
• Dieting habits of Soldier trying to meet ABCP standards
UNCLASSIFIED//FOUO
UNCLASSIFIED//FOUO
April [email protected]; 508‐233‐5808 19 of 37
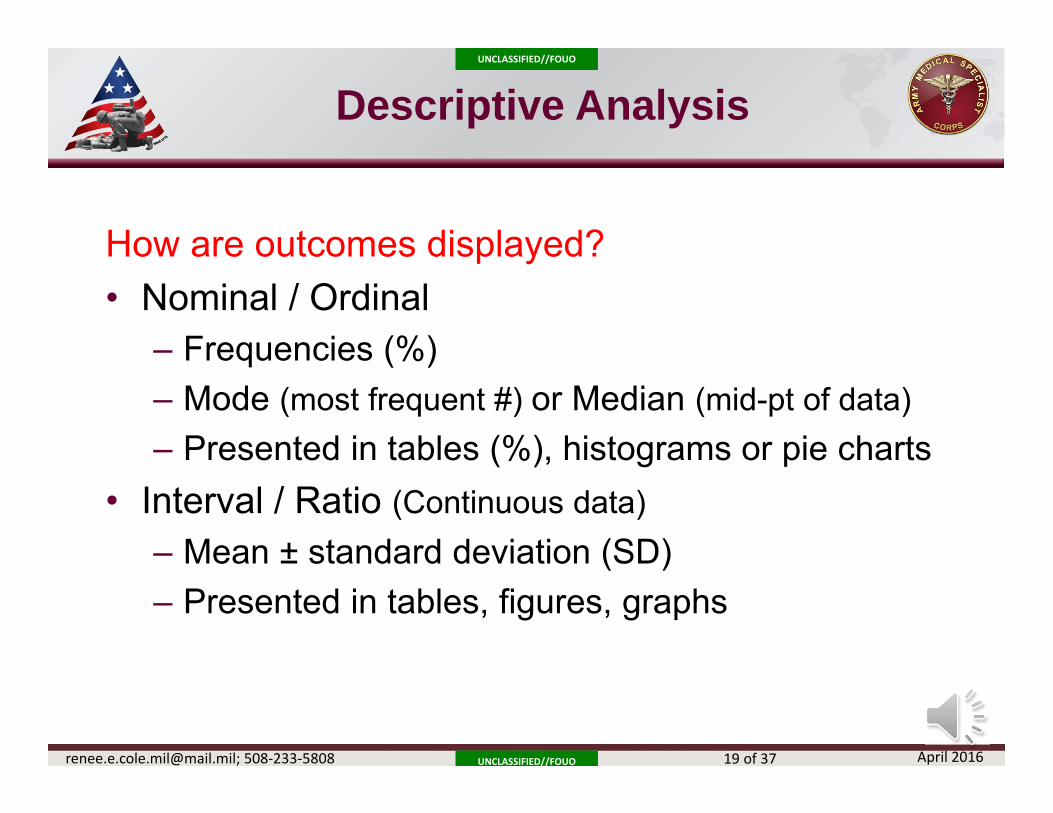
Descriptive Analysis
How are outcomes displayed?• Nominal / Ordinal
– Frequencies (%)– Mode (most frequent #) or Median (mid-pt of data)– Presented in tables (%), histograms or pie charts
• Interval / Ratio (Continuous data)– Mean ± standard deviation (SD)– Presented in tables, figures, graphs
UNCLASSIFIED//FOUO
UNCLASSIFIED//FOUO
April [email protected]; 508‐233‐5808 20 of 37
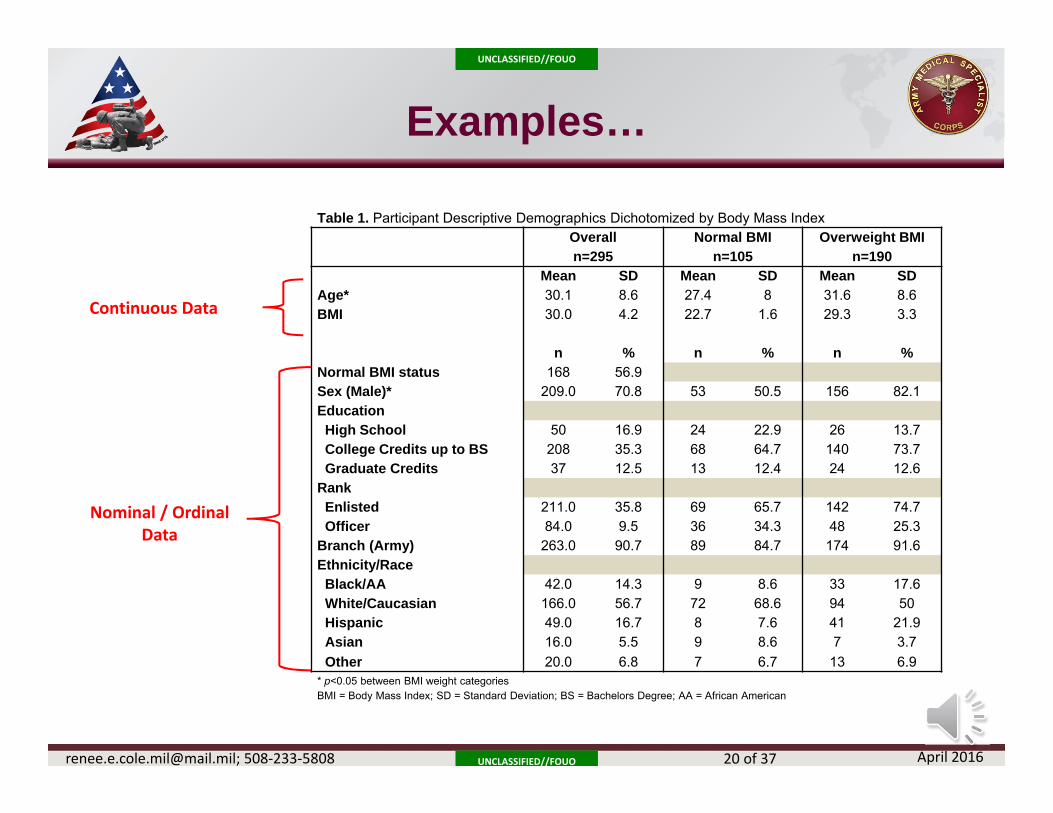
Examples…
Table 1. Participant Descriptive Demographics Dichotomized by Body Mass IndexOveralln=295
Normal BMIn=105
Overweight BMIn=190
Mean SD Mean SD Mean SDAge* 30.1 8.6 27.4 8 31.6 8.6BMI 30.0 4.2 22.7 1.6 29.3 3.3
n % n % n %Normal BMI status 168 56.9Sex (Male)* 209.0 70.8 53 50.5 156 82.1EducationHigh School 50 16.9 24 22.9 26 13.7College Credits up to BS 208 35.3 68 64.7 140 73.7Graduate Credits 37 12.5 13 12.4 24 12.6
RankEnlisted 211.0 35.8 69 65.7 142 74.7Officer 84.0 9.5 36 34.3 48 25.3
Branch (Army) 263.0 90.7 89 84.7 174 91.6Ethnicity/RaceBlack/AA 42.0 14.3 9 8.6 33 17.6White/Caucasian 166.0 56.7 72 68.6 94 50Hispanic 49.0 16.7 8 7.6 41 21.9Asian 16.0 5.5 9 8.6 7 3.7Other 20.0 6.8 7 6.7 13 6.9
* p<0.05 between BMI weight categoriesBMI = Body Mass Index; SD = Standard Deviation; BS = Bachelors Degree; AA = African American
Continuous Data
Nominal / Ordinal Data

UNCLASSIFIED//FOUO
UNCLASSIFIED//FOUO
April [email protected]; 508‐233‐5808 21 of 37
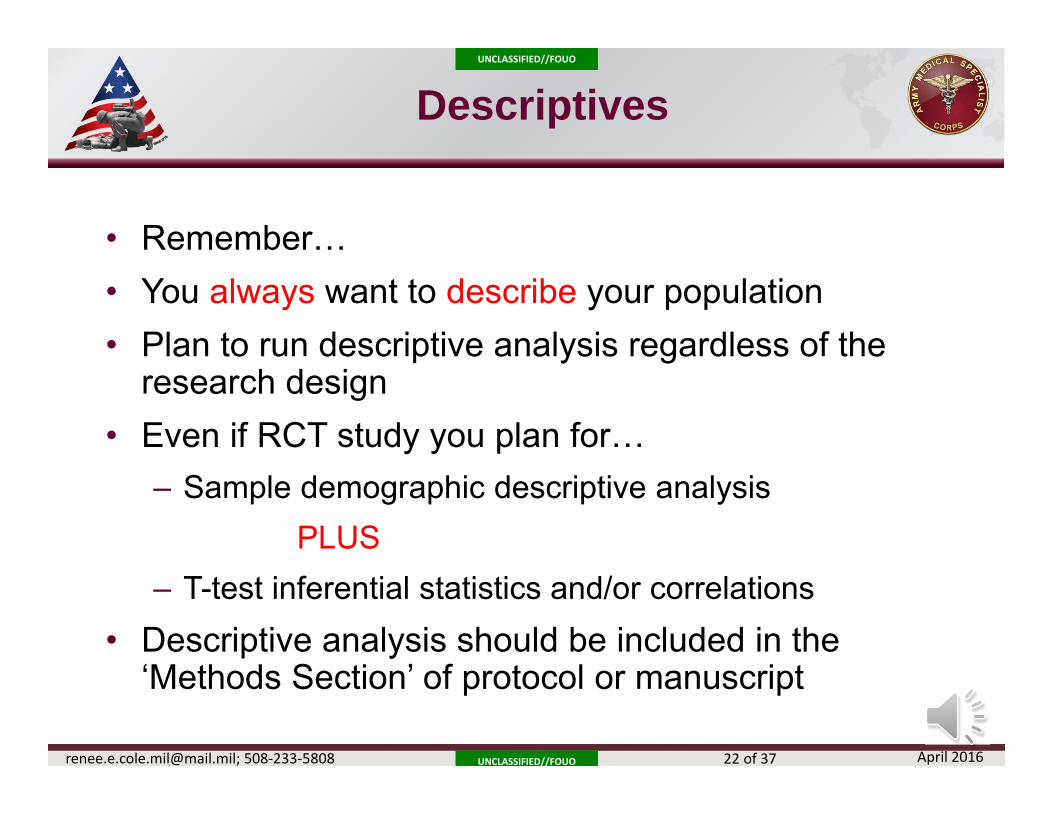
29%
34%
37%
Age
12‐13 yrs 14‐15 yrs 16‐18 yr
Examples…
29.1%
4.8%66.1%
55.9
40.7
70.4
51.7
39
60.4
50.3
37.7
63.357.7
44.1
70.2
0
10
20
30
40
50
60
70
80
Env/Social Emotional Physical
Normal Overweight Male Female
Age of Subjects with Back Pain (n=77)Num
ber o
f Sub
jects
UNCLASSIFIED//FOUO
UNCLASSIFIED//FOUO
April [email protected]; 508‐233‐5808 22 of 37
Descriptives
• Remember…• You always want to describe your population• Plan to run descriptive analysis regardless of the
research design• Even if RCT study you plan for…
– Sample demographic descriptive analysisPLUS
– T-test inferential statistics and/or correlations• Descriptive analysis should be included in the
‘Methods Section’ of protocol or manuscript
UNCLASSIFIED//FOUO
UNCLASSIFIED//FOUO
April [email protected]; 508‐233‐5808 23 of 37
How to answer your Research Question?
Determine if:– Descriptive study only– Correlation / Relationship (no causation)
• Pearson’s r, Spearman’s rho, Kendall’s-tau, Phi-coefficient
– Statistical Inference (infer to larger population)
• T-Test, Chi-Square, ANOVA• Linear regression, Multivariate regression
Describe Population
Find Relationships Cause & Effect

UNCLASSIFIED//FOUO
UNCLASSIFIED//FOUO
April [email protected]; 508‐233‐5808 24 of 37
Correlation Coefficients
• Assessing a relationship between variables• Do they vary together?• How strongly are they associated?• What is the nature of the relationship?
• Correlation vs. Causation • Not the same• Both may be caused by another factor• Causation statements come from inferential
statistics (t-test, chi-square, analysis of variance, etc.)

UNCLASSIFIED//FOUO
UNCLASSIFIED//FOUO
April [email protected]; 508‐233‐5808 25 of 37
Correlation Coefficients
• Vary between zero and ± 1.00• Closer to |1.00|, higher strength of relationship• Sign indicates direction
• + increase together• - as one the other
• Tighter grouping means higher coefficient
• Visualize with scatterplotsPortney & Watkins (2009) p. 524
UNCLASSIFIED//FOUO
UNCLASSIFIED//FOUO
April [email protected]; 508‐233‐5808 26 of 37
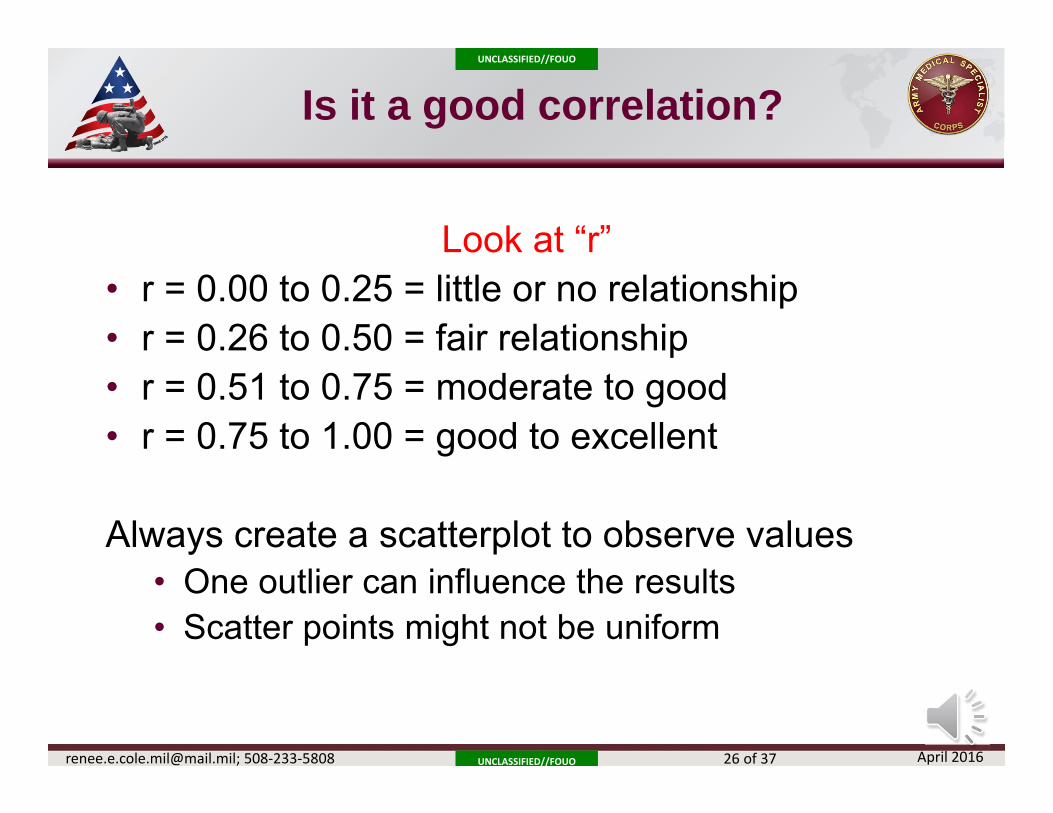
Is it a good correlation?
Look at “r”• r = 0.00 to 0.25 = little or no relationship• r = 0.26 to 0.50 = fair relationship• r = 0.51 to 0.75 = moderate to good• r = 0.75 to 1.00 = good to excellent
Always create a scatterplot to observe values• One outlier can influence the results• Scatter points might not be uniform
UNCLASSIFIED//FOUO
UNCLASSIFIED//FOUO
April [email protected]; 508‐233‐5808 27 of 37
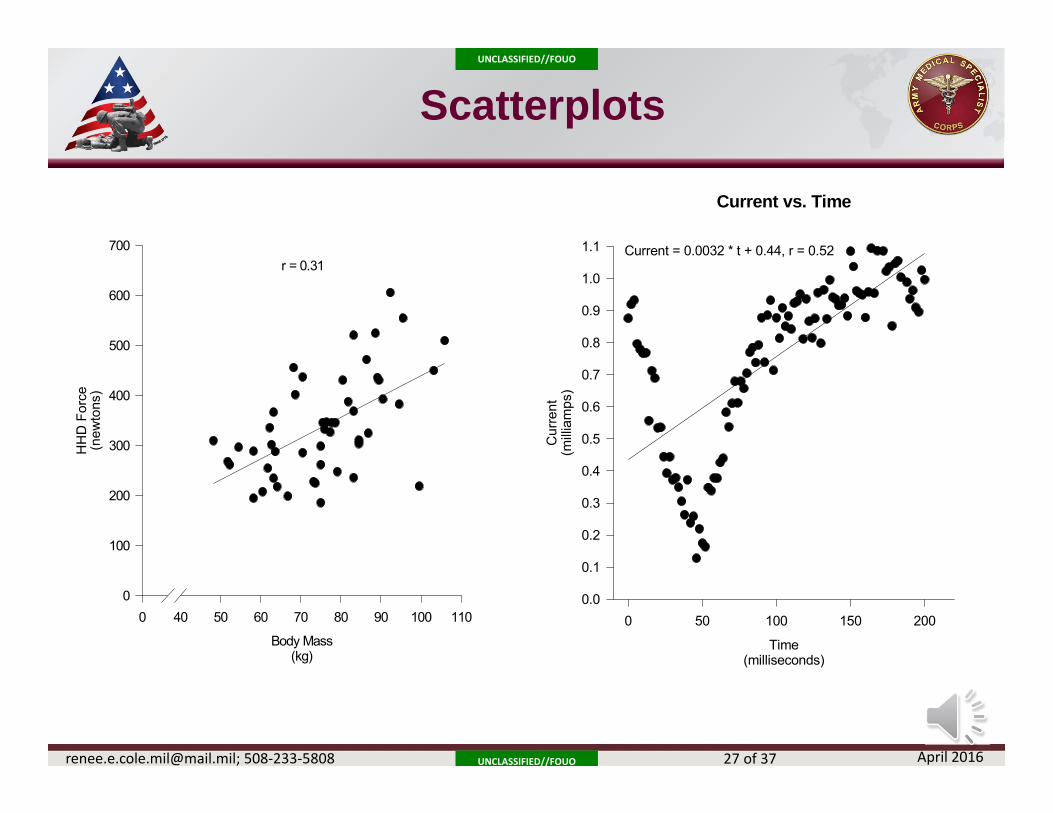
Scatterplots
Current vs. Time
Time(milliseconds)
0 50 100 150 200
Cur
rent
(mill
iam
ps)
0.0
0.1
0.2
0.3
0.4
0.5
0.6
0.7
0.8
0.9
1.0
1.1 Current = 0.0032 * t + 0.44, r = 0.52
Body Mass(kg)
0 40 50 60 70 80 90 100 110
HH
D F
orce
(new
tons
)
0
100
200
300
400
500
600
700r = 0.31
UNCLASSIFIED//FOUO
UNCLASSIFIED//FOUO
April [email protected]; 508‐233‐5808 28 of 37
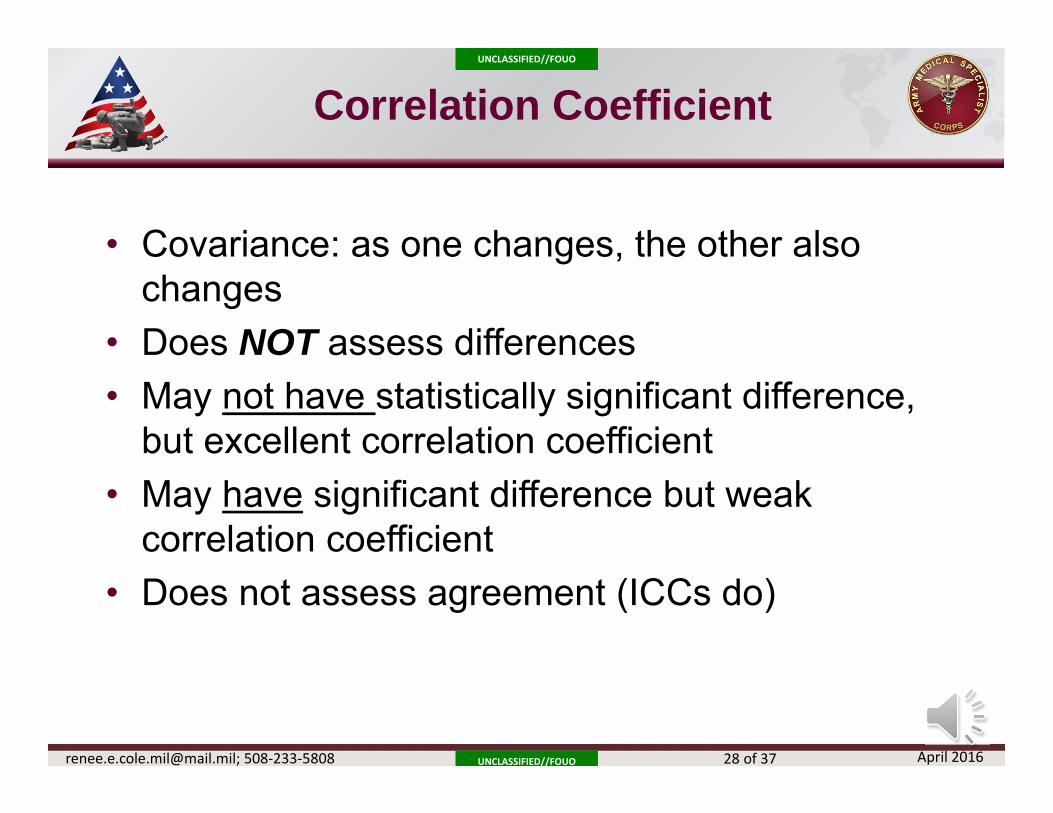
Correlation Coefficient
• Covariance: as one changes, the other also changes
• Does NOT assess differences• May not have statistically significant difference,
but excellent correlation coefficient• May have significant difference but weak
correlation coefficient• Does not assess agreement (ICCs do)
UNCLASSIFIED//FOUO
UNCLASSIFIED//FOUO
April [email protected]; 508‐233‐5808 29 of 37
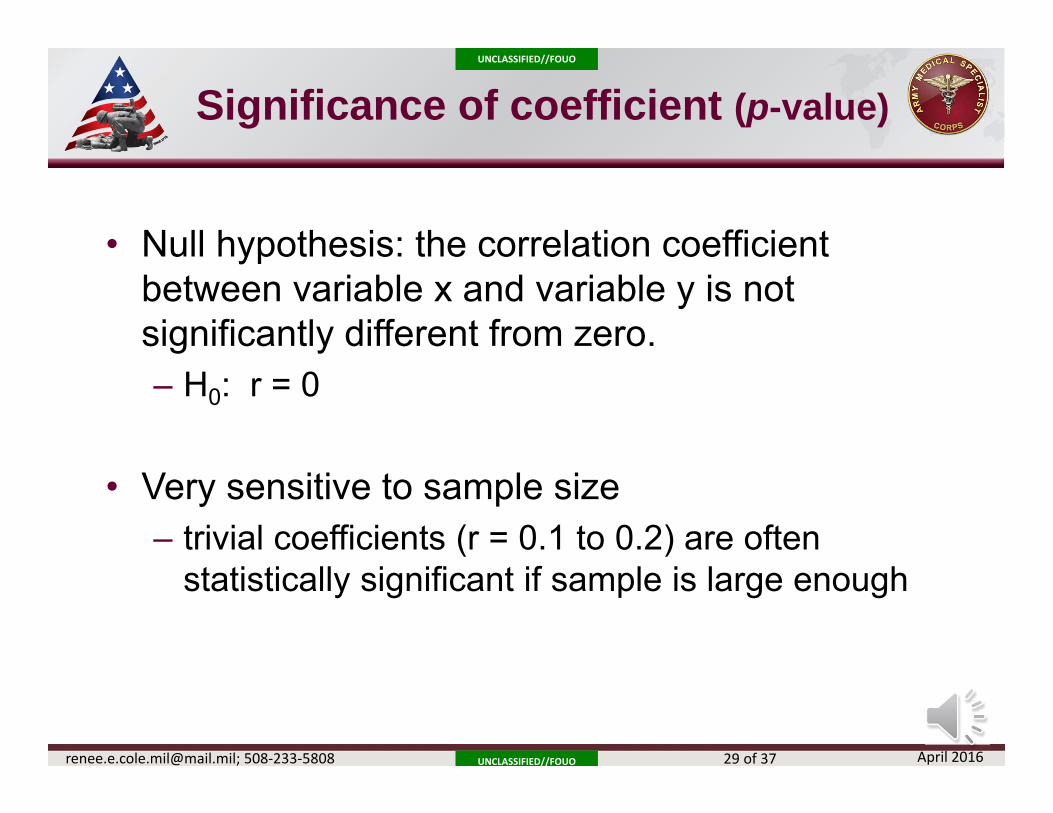
Significance of coefficient (p-value)
• Null hypothesis: the correlation coefficient between variable x and variable y is not significantly different from zero.– H0: r = 0
• Very sensitive to sample size– trivial coefficients (r = 0.1 to 0.2) are often
statistically significant if sample is large enough
UNCLASSIFIED//FOUO
UNCLASSIFIED//FOUO
April [email protected]; 508‐233‐5808 30 of 37
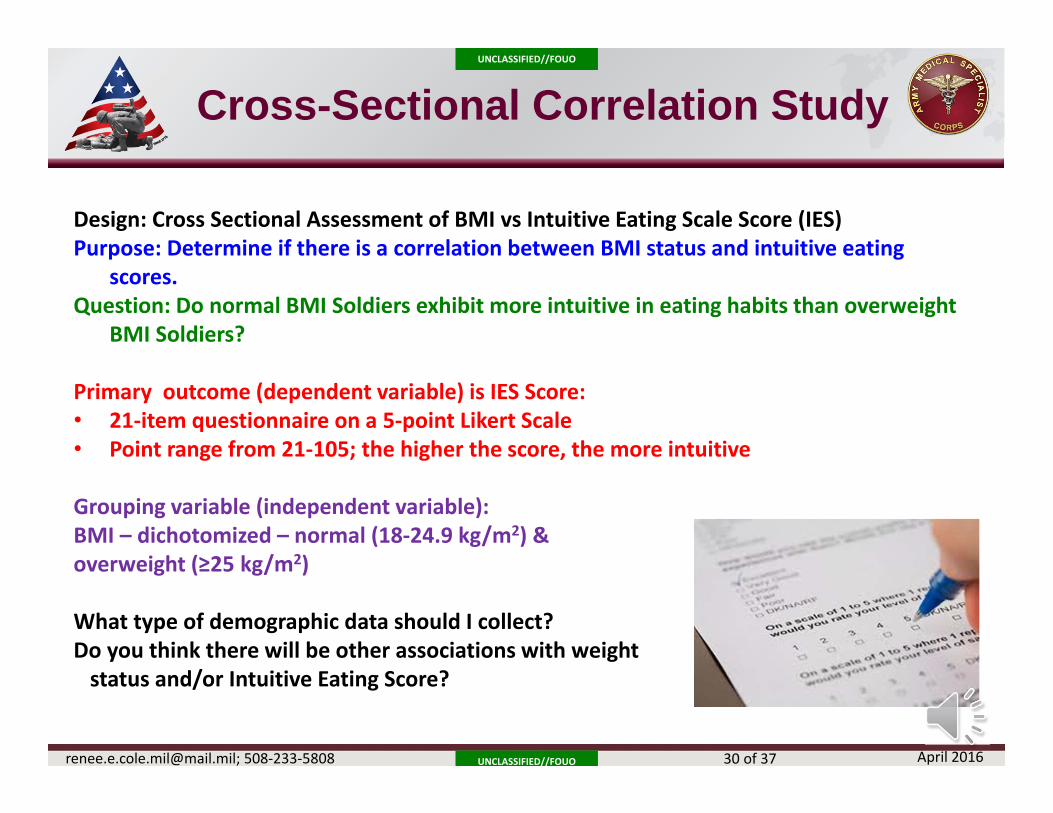
Design: Cross Sectional Assessment of BMI vs Intuitive Eating Scale Score (IES)Purpose: Determine if there is a correlation between BMI status and intuitive eating
scores. Question: Do normal BMI Soldiers exhibit more intuitive in eating habits than overweight
BMI Soldiers?
Primary outcome (dependent variable) is IES Score:• 21‐item questionnaire on a 5‐point Likert Scale • Point range from 21‐105; the higher the score, the more intuitive
Grouping variable (independent variable):BMI – dichotomized – normal (18‐24.9 kg/m2) & overweight (≥25 kg/m2)
What type of demographic data should I collect?Do you think there will be other associations with weight status and/or Intuitive Eating Score?
Cross-Sectional Correlation Study
UNCLASSIFIED//FOUO
UNCLASSIFIED//FOUO
April [email protected]; 508‐233‐5808 31 of 37
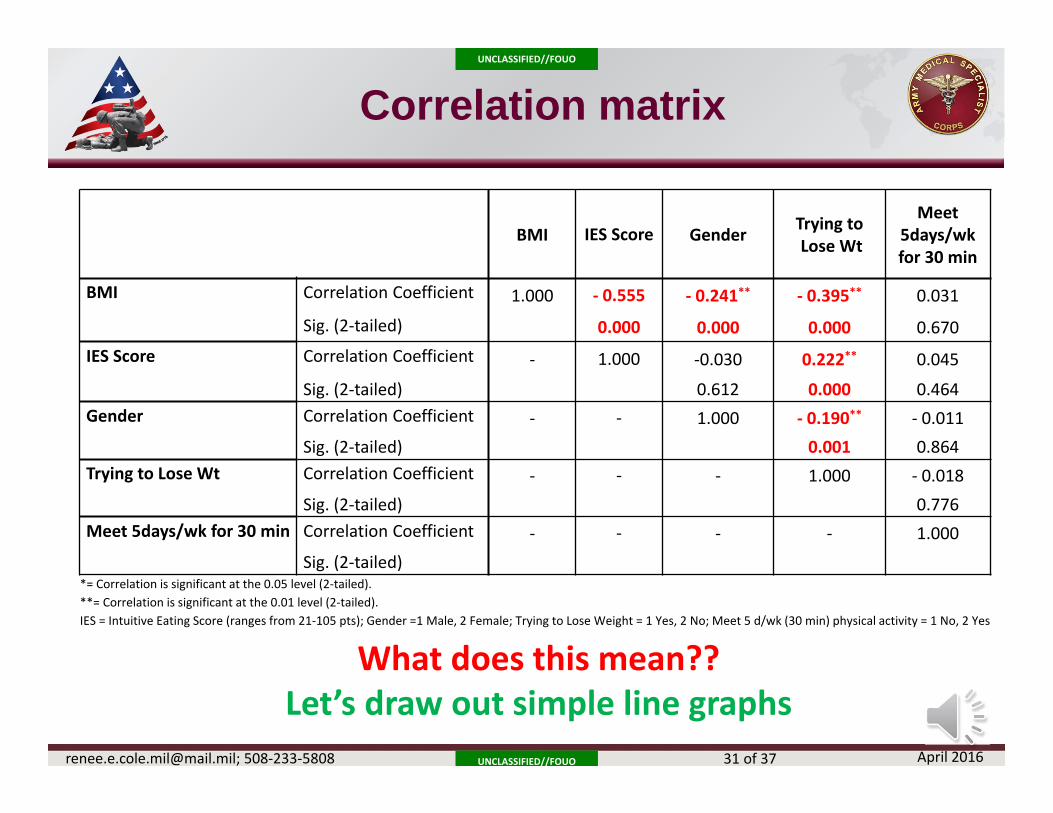
Correlation matrix
BMI IES Score Gender Trying toLose Wt
Meet 5days/wk for 30 min
BMI Correlation Coefficient 1.000 ‐ 0.555 ‐ 0.241** ‐ 0.395** 0.031
Sig. (2‐tailed) 0.000 0.000 0.000 0.670IES Score Correlation Coefficient ‐ 1.000 ‐0.030 0.222** 0.045
Sig. (2‐tailed) 0.612 0.000 0.464Gender Correlation Coefficient ‐ ‐ 1.000 ‐ 0.190** ‐ 0.011
Sig. (2‐tailed) 0.001 0.864Trying to Lose Wt Correlation Coefficient ‐ ‐ ‐ 1.000 ‐ 0.018
Sig. (2‐tailed) 0.776Meet 5days/wk for 30 min Correlation Coefficient ‐ ‐ ‐ ‐ 1.000
Sig. (2‐tailed)*= Correlation is significant at the 0.05 level (2‐tailed). **= Correlation is significant at the 0.01 level (2‐tailed). IES = Intuitive Eating Score (ranges from 21‐105 pts); Gender =1 Male, 2 Female; Trying to Lose Weight = 1 Yes, 2 No; Meet 5 d/wk (30 min) physical activity = 1 No, 2 Yes
What does this mean??Let’s draw out simple line graphs
UNCLASSIFIED//FOUO
UNCLASSIFIED//FOUO
April [email protected]; 508‐233‐5808 32 of 37
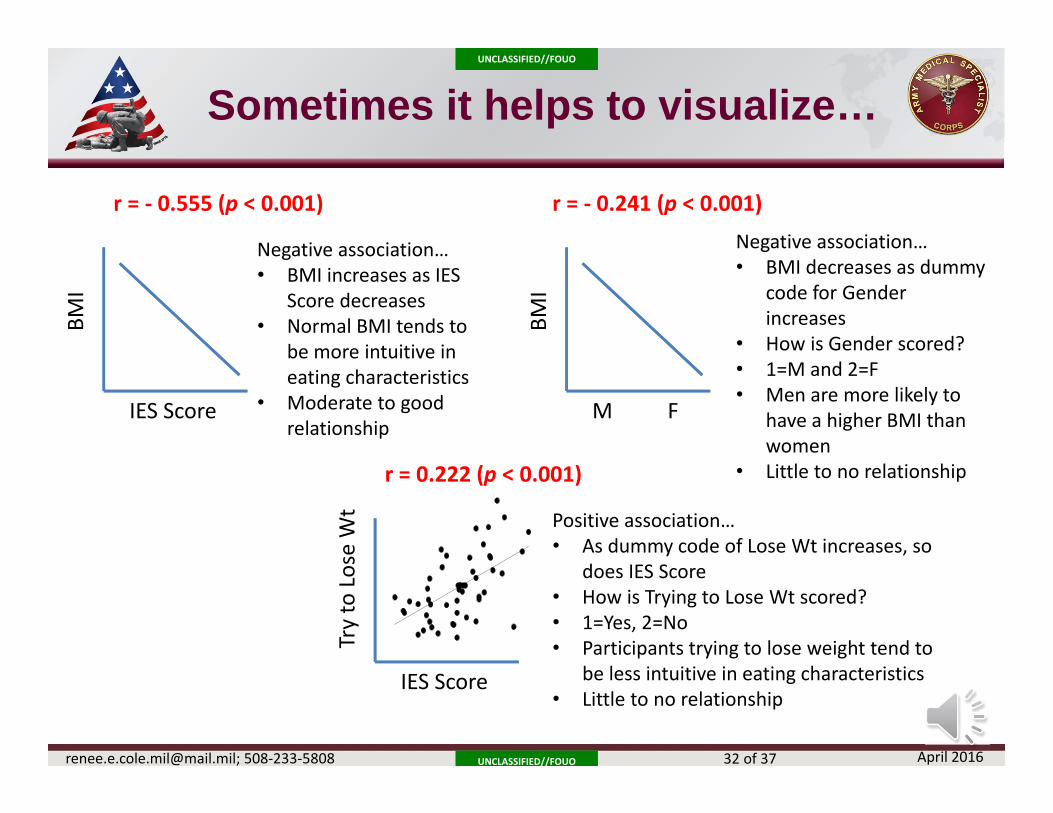
Sometimes it helps to visualize…
r = ‐ 0.241 (p < 0.001)
M F
BMI
Negative association…• BMI decreases as dummy
code for Gender increases
• How is Gender scored?• 1=M and 2=F• Men are more likely to
have a higher BMI than women
• Little to no relationship
r = ‐ 0.555 (p < 0.001)
IES Score
BMI
Negative association…• BMI increases as IES
Score decreases• Normal BMI tends to
be more intuitive in eating characteristics
• Moderate to good relationship
r = 0.222 (p < 0.001)
IES Score
Try to Lose Wt Positive association…
• As dummy code of Lose Wt increases, so does IES Score
• How is Trying to Lose Wt scored?• 1=Yes, 2=No• Participants trying to lose weight tend to
be less intuitive in eating characteristics• Little to no relationship
UNCLASSIFIED//FOUO
UNCLASSIFIED//FOUO
April [email protected]; 508‐233‐5808 33 of 37
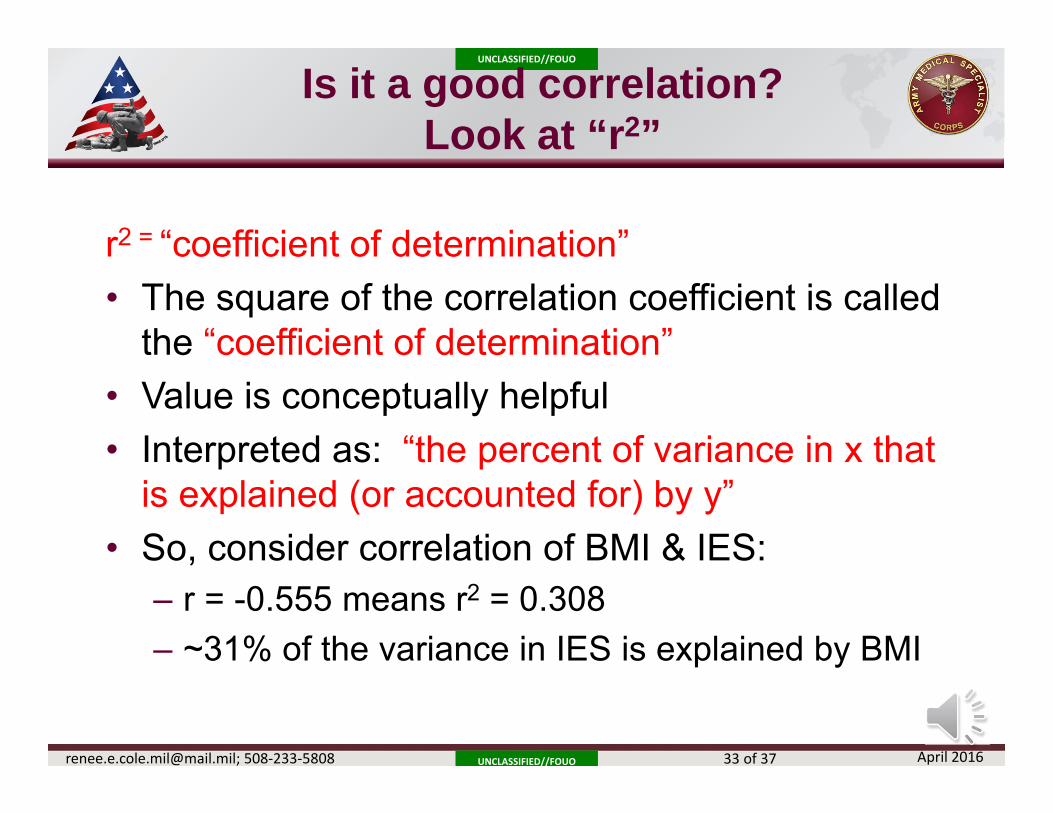
Is it a good correlation? Look at “r2”
r2 = “coefficient of determination”• The square of the correlation coefficient is called
the “coefficient of determination”• Value is conceptually helpful• Interpreted as: “the percent of variance in x that
is explained (or accounted for) by y”• So, consider correlation of BMI & IES:
– r = -0.555 means r2 = 0.308– ~31% of the variance in IES is explained by BMI
UNCLASSIFIED//FOUO
UNCLASSIFIED//FOUO
April [email protected]; 508‐233‐5808 34 of 37
Correlation Coefficients
• If correlation analysis is used, it should be noted in the ‘methods section’ of protocol or manuscript
• Typically note the type of correlational analysis, which is based upon scale of measurement
• Statistical programs do not always use same theoretical nomenclature as a text book
UNCLASSIFIED//FOUO
UNCLASSIFIED//FOUO
April [email protected]; 508‐233‐5808 35 of 37
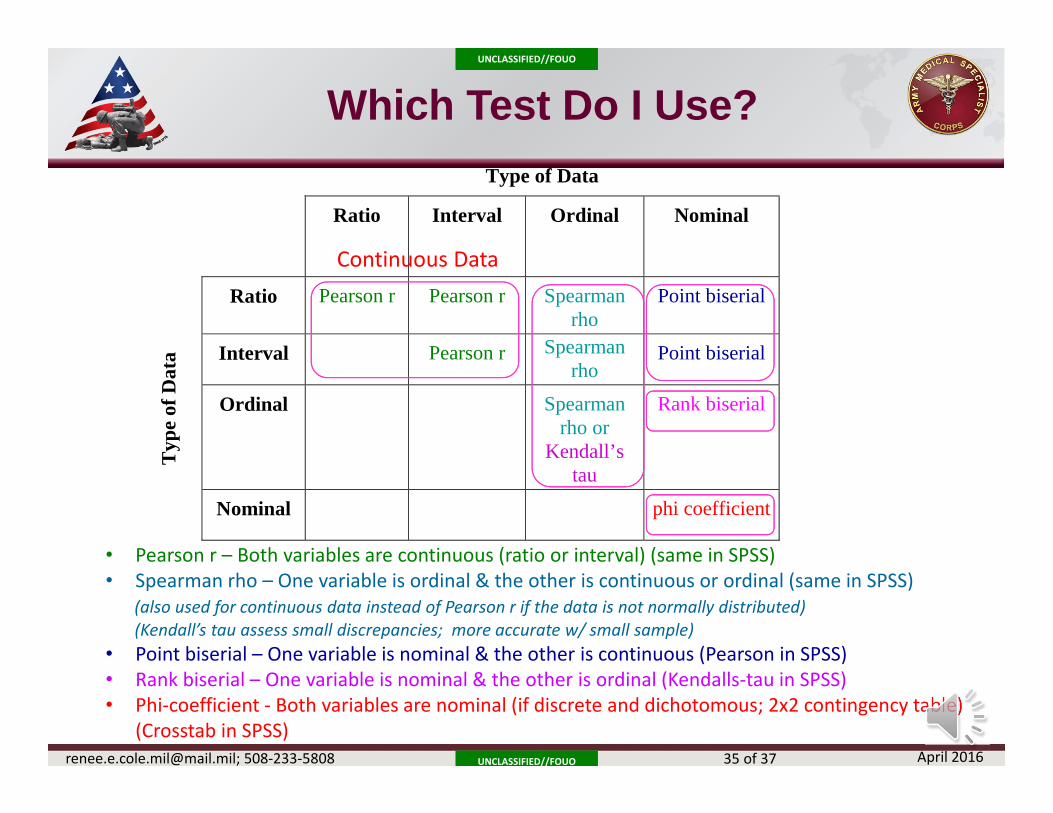
Which Test Do I Use?
Type of Data
Ratio Interval Ordinal
Nominal
T
ype
of D
ata
Ratio
Pearson r Pearson r Spearman
rho
Point biserial
Interval
Pearson r Spearman
rho
Point biserial
Ordinal
Spearman
rho or Kendall’s
tau
Rank biserial
Nominal
phi coefficient
• Pearson r – Both variables are continuous (ratio or interval) (same in SPSS)• Spearman rho – One variable is ordinal & the other is continuous or ordinal (same in SPSS)
(also used for continuous data instead of Pearson r if the data is not normally distributed)(Kendall’s tau assess small discrepancies; more accurate w/ small sample)
• Point biserial – One variable is nominal & the other is continuous (Pearson in SPSS)• Rank biserial – One variable is nominal & the other is ordinal (Kendalls‐tau in SPSS)• Phi‐coefficient ‐ Both variables are nominal (if discrete and dichotomous; 2x2 contingency table)
(Crosstab in SPSS)
Continuous Data

UNCLASSIFIED//FOUO
UNCLASSIFIED//FOUO
April [email protected]; 508‐233‐5808 36 of 37
How to answer your Research Question?
Determine if:– Descriptive study only– Correlation / Relationship (no causation)
• Pearson’s r, Spearman’s rho, Kendall’s-tau, Phi-coefficient
– Statistical Inference (infer to larger population)• T-Test, Chi-Square, ANOVA• Prediction, Linear regression, multivariate regression
Describe Population
Find Relationships Cause & Effect
UNCLASSIFIED//FOUO
UNCLASSIFIED//FOUO
April [email protected]; 508‐233‐5808 37 of 37
To Be Continued…
Continue on with Part 2Inferential Statistics


![Revised Breakout LTC Thomas Stocks 315.pptx [Read-Only] · UNCLASSIFIED//FOUO UNCLASSIFIED//FOUO 3-4 April 2018 Thomas W Stocks RS3 Contract Branch Chief ACC-APG RS3 Contract Armed](https://img.pdfslide.net/doc/110x75/5ae804317f8b9a8704902a23/revised-breakout-ltc-thomas-stocks-315pptx-read-only-unclassifiedfouo-3-4-april.jpg)