Embed Size (px)
Citation preview
Rev.Phil.Psych. (2015) 6:1–25DOI 10.1007/s13164-014-0210-7
Introduction: Varieties of Iconicity
Valeria Giardino · Gabriel Greenberg
Published online: 15 November 2014© Springer Science+Business Media Dordrecht 2014
This introduction aims to familiarize readers with basic dimensions of variationamong pictorial and diagrammatic representations, as we understand them, in orderto serve as a backdrop to the articles in this volume. Instead of trying to canvas thevast range of representational kinds, we focus on a few important axes of difference,and a small handful of illustrative examples. We begin in Section 1 with background:the distinction between pictures and diagrams, the concept of systems of represen-tation, and that of the properties of usage associated with signs. In Section 2 weillustrate these ideas with a case study of diagrammatic representation: the evolu-tion from Euler diagrams to Venn diagrams. Section 3 is correspondingly devotedto pictorial representation, illustrated by the comparison between parallel and linearperspective drawing. We conclude with open questions, and then briefly summarizethe articles to follow.
1 Types of Iconicity
As early as 1868, Charles S. Peirce distinguished between at least two basic kindsof sign: symbols and icons.1 As we shall understand these categories, SYMBOLIC
1We use Peirce’s taxonomy as the point of departure for our own, but we don’t aspire to exegetical accu-racy. In fact, Peirce famously distinguished up to three kinds of sign, including not only symbols andicons, but also indices. To simplify our presentation, we will only discuss the first two. Moreover, in 1868,Peirce used the term “likeness” instead of “icon”, but later changed his terminology.
V. Giardino (�)Institut Jean Nicod (CNRS - EHESS - ENS), Departement d’Etudes Cognitives, Ecole NormaleSuperieure - PSL Research University, Paris, Francee-mail: [email protected]
G. GreenbergUCLA, Los Angeles, CA, USAe-mail: [email protected]
2 V. Giardino, G. Greenberg
representation is exemplified by the lexicons of languages like English, Chinese, orPredicate Logic. It also includes codes like those governing maritime signal flags,Arabic numerals, and emblematic gestures (e.g. the “OK” hand sign). According toa rough first approximation, all forms of symbolic representation are based on arbi-trary connections between signs and their contents. Thus, for example, the string“tree” is associated in English with the concept for tree, but the association is arbi-trary, because the string “dree” would have served just as well. By contrast, ICONIC
representations include the likes of drawings, photographs, maps, graphs, Venn dia-grams, and depictive gestures (e.g. gestural maps or indicators of size). Such signsare characterized, very roughly, by natural and non-arbitrary relations between signand content, often described as relations of “resemblance.” The relationship betweenan accurate drawing of a tree and the tree itself is one of intimate correspondence,quite unlike that of the linguistic string; a drawing of a flower would not have servedjust as well.
Both Peirce (1868) and his contemporary Ferdinand de Saussure (1922) imag-ined a general science of signs, encompassing symbolic, iconic, and other forms ofrepresentation. But in the twentieth century, breakthroughs in logic, linguistics, andcomputer science meant that it was symbolic representation, especially language,which was the focus of philosophical attention. Iconicity remained marginalizedand poorly understood. And yet, as matter of actual use, iconic signs have alwaysplayed a central role in human society, in everything from communication, reason-ing, and proof, to planning and navigation. This role has only grown in recent years,with the explosion of diagrams and pictures in social media, digital communication,and the sciences. In this special issue, we seek to bring additional attention to thisfoundational topic.
To fix ideas, we’ll use the term REPRESENTATION to describe any event, process,state or object which is a vehicle for content, broadly construed. In this sense, thereare both symbolic and iconic representations. We may further distinguish betweenthose representations which are purely mental, and those which are instantiated insome publicly perceivable physical medium. For the latter class of public represen-tations we reserve the term SIGN. Thus there are both symbolic signs (“symbols”)and iconic signs (“icons”). There are also complex signs, which combine iconicand symbolic elements, such as advertisements, magazine articles, depictive ges-tures with speech, and certain kinds of sentences in signed languages (Lascarides andStone 2009; Schlenker et al. 2013). The articles in this special issue focus specif-ically on representations which are wholly or primarily iconic, and upon iconicsigns specifically. They thus bypass some of the more familiar examples of men-tal iconic representation, including those involved in perception and mental imagery.We propose that, like languages, icons deserve treatment as an independent object ofinquiry.
Iconic signs divide naturally, but not necessarily exhaustively, into pictures anddiagrams. Although the terms ‘picture’ and ‘diagram’ admit many readings, under atleast one natural precisification they mark a basic distinction in iconic kinds. Amongthe class of PICTURES we include the likes of perspectival drawings, photographs,paintings, and film clips. Among the class of DIAGRAMS we include the likes ofgraphs, charts, timelines, and Venn diagrams. The distinction is certainly not a sharp
Introduction: Varieties of Iconicity 3
one, with the likes of maps and pictographs occupying intermediate positions; it mayinstead reflect polar ends of a spectrum of kinds (Greenberg 2011, 160–163; Casatiand Giardino 2013, 118-125). But what characterizes these two classes of sign?
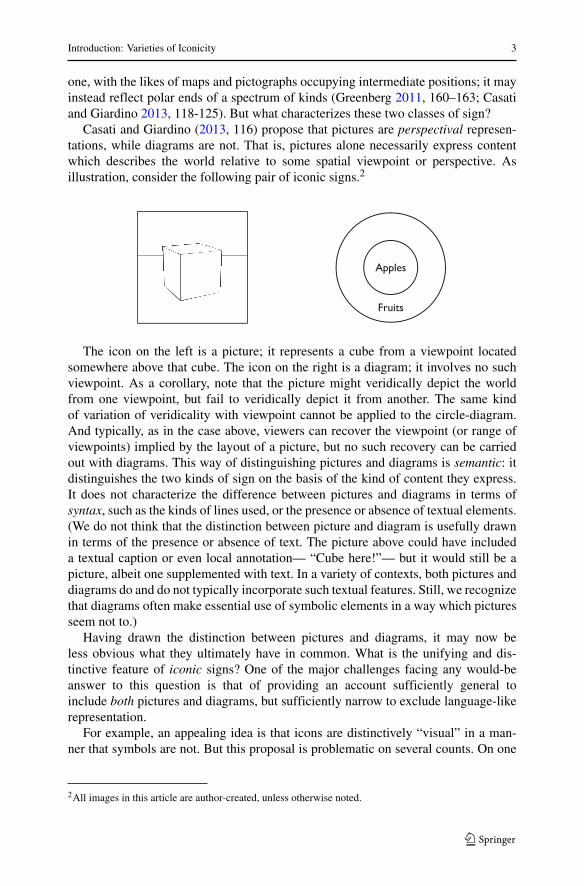
Casati and Giardino (2013, 116) propose that pictures are perspectival represen-tations, while diagrams are not. That is, pictures alone necessarily express contentwhich describes the world relative to some spatial viewpoint or perspective. Asillustration, consider the following pair of iconic signs.2
The icon on the left is a picture; it represents a cube from a viewpoint locatedsomewhere above that cube. The icon on the right is a diagram; it involves no suchviewpoint. As a corollary, note that the picture might veridically depict the worldfrom one viewpoint, but fail to veridically depict it from another. The same kindof variation of veridicality with viewpoint cannot be applied to the circle-diagram.And typically, as in the case above, viewers can recover the viewpoint (or range ofviewpoints) implied by the layout of a picture, but no such recovery can be carriedout with diagrams. This way of distinguishing pictures and diagrams is semantic: itdistinguishes the two kinds of sign on the basis of the kind of content they express.It does not characterize the difference between pictures and diagrams in terms ofsyntax, such as the kinds of lines used, or the presence or absence of textual elements.(We do not think that the distinction between picture and diagram is usefully drawnin terms of the presence or absence of text. The picture above could have includeda textual caption or even local annotation— “Cube here!”— but it would still be apicture, albeit one supplemented with text. In a variety of contexts, both pictures anddiagrams do and do not typically incorporate such textual features. Still, we recognizethat diagrams often make essential use of symbolic elements in a way which picturesseem not to.)
Having drawn the distinction between pictures and diagrams, it may now beless obvious what they ultimately have in common. What is the unifying and dis-tinctive feature of iconic signs? One of the major challenges facing any would-beanswer to this question is that of providing an account sufficiently general toinclude both pictures and diagrams, but sufficiently narrow to exclude language-likerepresentation.
For example, an appealing idea is that icons are distinctively “visual” in a man-ner that symbols are not. But this proposal is problematic on several counts. On one
2All images in this article are author-created, unless otherwise noted.
4 V. Giardino, G. Greenberg
hand, if it means that iconic signs must be seen to be understood, then the criterion istoo broad, for it would include sentences of written languages. On the other hand, ifit means that the cognition characteristically engaged by iconic signs belongs to thevisual system, then the criteria is likely too narrow. While it is clear that the compre-hension of pictures is governed by the same systems which give rise to perceptionand mental imagery, this is not the case of graphs, charts, and Venn diagrams. Afterall, the visual system seems to work specifically with perspectival representations;but the contents of diagrams are characteristically non-perspectival. Of course, theinterpretation of diagrams may indeed rely on spatial cognition, but this need not bevisual cognition. Thus we have reason to think that iconic representation includes,but is not limited to, visual signs.
More promising characterizations of iconicity begin with the intuitive idea that,for pictures and diagrams alike, there is a kind of “direct” or “natural” correspon-dence between the spatial structure of the sign and the internal structure of thething it represents. These vague ideas have in turn been analyzed in terms of like-ness, resemblance, isomorphism, or transformation (e.g. Peirce 1906, French 2003,Abell 2009, Greenberg 2013). Though iconicity seems to be a fundamental rep-resentational kind, its precise nature remains the subject of open and activeinquiry. It awaits collaborative investigation from philosophy, cognitive science, andbeyond.
Further understanding of iconicity requires a more intimate acquaintance with therange of phenomena it includes. We now turn to introduce two basic dimensions ofvariation, exhibited by both pictures and diagrams. The first concerns differencesamong the systems of representation to which individual icons belong. The sec-ond concerns the various use properties which these signs are designed and usedto serve.
1.1 Systems of Iconic Representation
Pictorial and diagrammatic representation are not homogenous kinds. There is notone sort of picture, nor one sort of diagram. Instead, there are indefinitely manyspecies of each, corresponding to indefinitely many SYSTEMS OF REPRESENTATION.(In the special case of pictures, these systems are often called SYSTEMS OF DEPIC-TION, but we opt here for the more inclusive term.) Such systems are the iconiccounterparts of languages. They embody the general rules which artists and view-ers must coordinate on in order to arrive at the same association of public signs withinformational content.
Though their significance has long been appreciated, the idea that iconic represen-tations are thoroughly governed by systems was championed by Nelson Goodman(1968) under the banner of “languages of art” (though officially he termed them“symbol systems”). Goodman took an especially bloodless view of such systems,attempting to define them primarily in terms of low-level features of syntax. Theo-rists since Goodman have inherited his conviction that iconic representations are bestexplained as elements of general systems, without endorsing his view of the natureof these systems.
Introduction: Varieties of Iconicity 5
Systems of iconic representation share two fundamental features with languages.First, each determines a set of construction rules, the analogue of linguistic syntax;every representation in a given system is constructed according to these rules. Sec-ond, and most important for our purposes, each determines a set of interpretationrules, the analogue of a linguistic semantics; every representation in a given systemis (at least partly) associated with its content according to these rules. This secondfeature implies that pictures and diagrams have content only relative to one systemor another, but not in isolation, just as sentences are only meaningful relative to onelanguage or another. In the case studies that follow, we demonstrate these pointsfirst with respect to systems of diagrammatic representation, and then with respect tosystems of pictorial representation.
Despite these broad commonalities, the character of iconic systems differs funda-mentally from that of languages, in a number of ways. To reiterate the basic point:languages are based on lexicons of arbitrary associations between signs and contents,while systems of iconic representation are founded on rules that establish more natu-ral and direct associations.3 (We expect this to be true however the terms “arbitrary,”“natural,” and “direct” are ultimately understood.) The distribution of iconic systemsalso seems to differ substantially from that of languages. Whereas citizens of mod-ern industrial societies are typically fluent in two or three languages at most, we areall competent consumers of dozens, possibly hundreds, of iconic systems of repre-sentation.4 These are the subtle codes which mediate our use of graphical displayson computers and phones, street signs, maps, movies, newspapers, technical articles,and so on. In this sense, we are all massively, iconically multi-lingual.5
Though it is natural to group iconic signs into something like systems, the ideathat these systems are based on sets of definite rules is open to challenge. The alter-native is that iconic signs are produced and interpreted in a manner which is ad-hoc,organic, and unsystematic. On this view, iconic representations may be organized intoloose groups of affiliated style and subject matter, but not subsumed under strict setsof rules. This intuition is often fueled by a sense that, while language is genuinelyrule-governed, pictorial and diagrammatic representations are merely pragmatic andimprovised. But as we will see, such skepticism is not born out by careful study ofthe phenomena.
One of the most compelling pieces of evidence for systematicity is the record ofsuccess that rule-based analysis of iconic representation has enjoyed over the last
3This is a difference in rules of interpretation, but there are vivid differences in construction rules aswell. Symbolic languages are widely thought to be governed by recursive syntax, but this does not seemto be true of pictures, at least not in anything like the same way (Hauser et al. 2002). The contrast (orcomparison) between linguistic syntax and diagrammatic syntax is more complex, since many diagramsystems clearly are governed by recursive construction rules, albeit relatively simple ones (Shin 1994).4But see Armstrong (2013) for the view that languages are as numerous as iconic systems.5In order to overcome differences in education, Otto Neurath worked over the course of his life on alanguage-like visual system, “Isotype,” motivated by the modernist idea that purely visual signs would notrequire interpretation or enculturation (Neurath 1945/1973). Though perhaps partly accurate, this assump-tion was misguided: even Neurath’s icons must be interpreted, and the conventions regulating their usemust be specified in order for the system to be effectively shared by a community of consumers.
6 V. Giardino, G. Greenberg
25 years. Close study of specific systems has yielded mathematical models of theirunderlying rules, and these models are admirable in their ability to predict and explainour own, intuitive understanding of icons. Later in this essay we’ll discuss somenotable examples of this approach, including Shin’s (1994) logic for Venn diagrams,and the analysis of perspective line drawing that has emerged from projective geom-etry and computer vision. These findings parallel achievements in formal linguistics,where theorists have developed sophisticated mathematical and computational mod-els of linguistic representation. Unfortunately, only a small handful of iconic systemshave been studied in any depth.
Positing knowledge of such rule-based systems helps explain our patterns of usewith iconic representations. With reference to pictures, Schier (1986, 43) called suchknowledge “pictorial competence,” analogous to linguistic competence. He observedthat a viewer who can interpret one line drawing, under suitable conditions, is, allthings equal, in a position to interpret any line drawing. Similarly, a viewer whocan interpret one Venn diagram is in a position to interpret any other Venn diagram(but not any other Euler diagram or graph). The best explanation for this capacityfor constrained generalization is that, in learning to interpret token icons, viewersare also acquiring competence with an underlying system of interpretive rules. Oncelearned, such rules can then be freely applied to other tokens. By contrast, if therewere no systems of iconic representation, each icon would be interpreted on its ownterms. The knowledge of how to interpret any one icon would provide at best a looseguide for the interpretation of any other— but this is not what we find.
Such an account follows a tradition established by Chomsky (1957, 1965), whichdistinguishes implicit from explicit knowledge of rules. Implicit knowledge requiresonly that subjects have internalized, and be able to follow, the rules in question. Onemay or may not be able to describe these rules, and they may be encoded in entirelyunconscious aspects of cognition. This is the typical condition for a speaker of a lan-guage or a consumer of diagrams or pictures. We can understand a sentence or agraphic, and can use it in communication, planning, and so on, but we aren’t in a posi-tion to explain how this understanding was achieved. Explicit knowledge, by contrast,requires that the subject be in a position to consciously articulate the precise rules inquestion. This is the kind of knowledge that a theorist achieves with deliberate study.Both artists and viewers have possessed implicit knowledge of iconic systems sincethe ancient appearance of iconic representation in human society. But full, explicitknowledge of these rules has only come about recently, with the application of meth-ods from logic, linguistics, computer science, and mathematics. And even now, suchknowledge is limited.6
6In fact, explicit knowledge comes in degrees. Artists and theorists of art have codified rules of draw-ing and diagramming for hundreds of years, at least. The formalization of linear perspective during theRenaissance is a vivid example. While such informal descriptions are explicit, they typically fall shortof full mathematical precision. As a consequence, they are insufficiently exact to train a computer in theinterpretation of the class of icons in question. As we will see for the cases of Euler and Venn diagrams,this is true even when the systems in question were deliberately invented. The inventors relied on implicithuman understanding to supplement their own explicit but partial descriptions.
Introduction: Varieties of Iconicity 7
1.2 Iconic Use Properties
Although a system-based analysis is necessary to understand the underlying struc-ture of iconic representation, it does little to explain how or why iconicity makesan entrance into daily life (Lewis 1975). After all, signs are not merely realizationsof abstract rules— they are typically created to serve some more or less practicalpurposes. And different systems of representation have distinctive features which,relative to a given kind of user and given kind of use, make them more or less suitedto these purposes. We shall introduce the term USE PROPERTY to describe genericdispositional features of the signs of a given system having to do with the use of thosesigns in context.7 The relevant “users” of a sign may be its creators or its consumers.As examples, signs from one system might, depending on context, have the use prop-erties of being easy (or difficult) to construct, facilitating proof, or allowing efficientinterpretation. They may pertain to features of signs having to do with their physicalimplementation, computation, design, and more.8 The field of possible use proper-ties is open-ended, limited only by the kinds of tasks signs are enlisted to fulfill. Butbecause the same kinds of context of use tend to recur, certain generic use propertiesacquire explanatory relevance. Variation among such properties is our subject here.
At a relatively high level, different systems of representation facilitate different“cognitive” functions. That is, they enable their users to achieve distinctively cogni-tive tasks, like navigation, problem solving, inference, communication, informationstorage, and so on. Of course, other, more mundane kinds of tools— like pencil,paper, or eyeglass— also promote navigation and problem solving. But icons makea distinctive contribution to cognitive tasks by fulfilling more proximal representa-tional functions, having to do with how and what they are supposed to represent(Burge 2010). Our primary concern here is with those relatively low-level useproperties relevant to the construction of signs and the expression of content.
Suppose, for example, that a stranger asks you for directions to the nearest gasstation, and you elect to draw him a map. When you decide to draw a map, you ineffect select from a range of possible sign systems. In addition to a drawn map (typ-ically, with verbal annotation), you could have constructed a “virtual map” throughspatial gestures, or produced a purely verbal description. Each of these complex signscan express more or less the same geographic content. If your only goal was to pro-duce a sign that expressed a certain content, you would be indifferent among theseoptions. But of course, you likely have other representational priorities. In order toassist your interlocutor with navigation, you will want to select a sign with the useproperty of expressing its spatial content in a manner that is immediately availableto spatial cognition. In this case, a map of some kind is likely more appropriate thana purely verbal description. If, further, you wished to produce a durable sign, one
7Strictly speaking, use properties might best be thought of as relations to contexts or types of context, butnothing we say depends on such details.8Use properties include but are not limited to the likes of what (Larkin and Simon 1987) term“computational efficiency.”
8 V. Giardino, G. Greenberg
whose content can be accessed at any time without the aid of memory, then a drawnmap is more appropriate than a gestural one. (Of course, other kinds of use proper-ties may come into play as well, like the time and energy required to produce signsfrom each kind of system.) In the end, it is the drawn map which is enlisted, becauseits use properties– its natural expression of spatial content, and its durability– bestsatisfy your immediate goals.
Identifying the use properties associated with a given system can help explainwhen it is and is not employed among a population of potential users. More oftenthan not, designers begin with some function (or set of functions) in mind, and on thisbasis select that form of representation whose use properties, they guess, best suitsthis purpose. Such considerations guide the choice of whether to express oneself in asymbolic or iconic idiom, and if the latter, with pictures or with diagrams, and finallywith one or another of the myriad possible systems of representation. Of course the“choice” between systems may be an entirely unconscious process, guided only byimplicit awareness of the relevant use properties. There may even be use propertieswhich are relevant to viewers, and help explain their continuing engagement with aclass of signs, but which may have played no causal role in the creative process ofthe artist.
To be sure, many factors may influence the use of a given system beyond its useproperties. As Lewis (1969) has emphasized, when a system is subject to coordina-tion with other agents (even your future self), social factors like precedence, salience,and even arbitrary fiat may play an essential role in the selection of one system overanother. And Gombrich (1960) documents many cases where the choice of systemwas limited simply by the state of cultural innovation at the time of use. (Iconicsystems, he shows, are often not only intentionally created, but also subsequentlyimproved.) And yet, over and above these external factors, it is undeniable that a sys-tem’s use properties play a key role in whether or not that system is enlisted for use.We suspect that this is especially true for the iconic realm, where there is particularlydramatic variation in use properties from system to system.
For our purposes, one use property is especially important, but difficult to describeprecisely. For lack of a better term, we join other authors in calling it “naturalness.”(Bordwell 2008, 61–63; Cumming et al. 2014) A system is more or less NATU-RAL to the degree to which human nature— including relatively universal aspects ofcognition, physiology, social behavior, and environmental interaction— rather thanenculturation, makes that system easy to internalize and use.9 Bordwell (2008, 60)illustrates roughly this idea with the system of turn signals on cars. The system inwhich a left-hand blinking light indicates a left turn, and a right-hand blinking lightindicates a right turn is especially natural in this sense: it is easy to internalize anduse, presumably because it harmonizes with basic features of human cognition andbody organization. The opposite system, where a left-hand light indicates a right turnis correspondingly unnatural.
In this sense, commonly used iconic representations are typically more naturalthan symbolic representations with similar expressive power. For example, the fact
9This characterization of naturalness derives from conversations with Sam Cumming.
Introduction: Varieties of Iconicity 9
that diagram systems are often used to teach Boolean algebra and set theory sug-gests that these diagram systems are more natural than their symbolic counterparts.Whether naturalness as we have defined it is not only characteristic of iconicity,but coextensive with iconicity is an open question awaiting further investigation.(As a corollary, naturalness as we define it may or may not be the complement ofarbitrariness, the property which characterizes symbolic lexicons; though certainlynon-arbitrary systems tend to be more natural than arbitrary ones.) In the cases weinvestigate below, people choose to use iconic signs instead of symbolic ones for avariety of practical reasons. They may be easier to construct, more familiar to theiraudience, or more attractive. But a common theme is the desire to represent somesubject matter in a manner that is especially natural.
In what follows, we first consider a case study of diagram systems, and in thenext section, a case study of pictorial systems. In each case, we’ll see that differentsystems continue to be used in contemporary discourse because they offer subtlydifferent suites of use properties.
2 Diagrammatic Representation
While the class of diagrams is extraordinarily heterogeneous, we have selected heretwo closely related diagram systems as exemplars. Many of the lessons illustrated bythis pair of cases apply to diagrams in general. Still, readers should not be misleadby the orientation of the cases discussed here. Diagrams are realized not only by inkon paper, but with gestures, road signs, buttons, trail markings, even bodily actions—and they serve an equally diverse range of cognitive functions (Tversky 2011).
Like most other diagram systems, those considered here exploit spatial relation-ships between shapes to represent relationships in some other domain— in this case,logical relationships between classes of objects. The first, the system of EULER DIA-GRAMS, was introduced by Leonard Euler in 1761. His aim was to make Aristotle’ssyllogistic term-logic— a logic exclusively concerned with the relationship betweenclasses— intuitive and visual, with the aid of overlapping circles. In his own words:“these circles, or rather these spaces, for it is of no importance of what figure theyare of, are extremely commodious for facilitating our reflection on this subject, andfor unfolding all the boasted mysteries of logic, which that art finds it so difficult toexplain; whereas by means of these signs the whole is rendered sensible to the eye”Euler (1795, 340).
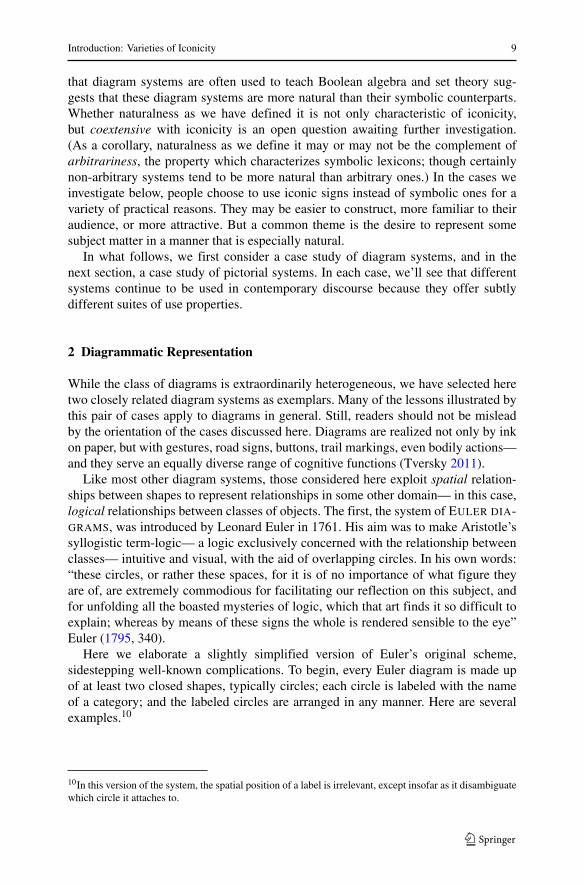
Here we elaborate a slightly simplified version of Euler’s original scheme,sidestepping well-known complications. To begin, every Euler diagram is made upof at least two closed shapes, typically circles; each circle is labeled with the nameof a category; and the labeled circles are arranged in any manner. Here are severalexamples.10
10In this version of the system, the spatial position of a label is irrelevant, except insofar as it disambiguatewhich circle it attaches to.
10 V. Giardino, G. Greenberg
The interpretation of these diagrams is familiar and probably obvious up to a point.Diagram (A) indicates that the class of fruits and the class of red things are overlap-ping, but not identical. (B) indicates that nothing is both a fruit and a car, and (C) thatall apples are fruits. At this point, most readers will easily interpret (D) without guid-ance. This in itself is a demonstration of viewers’ implicit competence with someunderlying system. Since you have almost certainly not encountered (D) before, yourability to interpret it is evidence that you have applied a general interpretive rule to anovel example. Thus Euler diagrams, like all systems of representation, are governedby general semantic rules.
Two points help to clarify the nature of these rules. First, the size and shape ofthe enclosed regions in Euler diagrams have no semantic significance. The definingfeatures of Euler diagrams— inclusion, overlap, and disjunction— are essentiallytopological features. Thus, while Euler diagrams are in an important sense spatial,the space in question is highly abstract. Second, the interpretation of Euler diagramsseems to be “course grained” in the sense that their content cannot, in general, becaptured by a single atomic sentence. For example, (C) indicates that all apples arefruits; but it also seems to indicate that there are non-apple fruits. This inevitableinformational coupling is, as we will see, precisely what Venn sought to overcome inhis alternative system.
Explicitly stating the rules underlying the Euler system, in mathematically preciseterms, is not trivial. Euler himself claimed that the basic interpretive principle couldbe stated in two clauses: “Whatever is in the thing contained must likewise be in thething containing; whatever is out of the containing must likewise be out of the con-tained” (Euler 1795, 350). Such a principle in effect sets up an equivalence betweenspatial inclusion (in the diagram) and logical inclusion. More recently, Hammer andShin (1998) have elaborated on Euler’s own remarks with a comprehensive formalsemantics and logic for the Euler system. A careful presentation of their analysis isbeyond the scope of the present essay, but it can hardly be doubted that a logic ofsome kind is at work here.
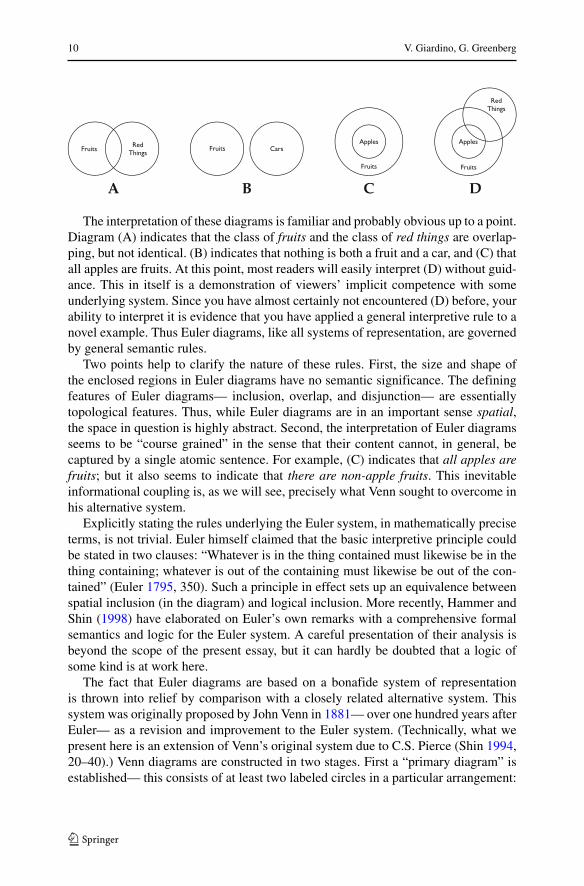
The fact that Euler diagrams are based on a bonafide system of representationis thrown into relief by comparison with a closely related alternative system. Thissystem was originally proposed by John Venn in 1881— over one hundred years afterEuler— as a revision and improvement to the Euler system. (Technically, what wepresent here is an extension of Venn’s original system due to C.S. Pierce (Shin 1994,20–40).) Venn diagrams are constructed in two stages. First a “primary diagram” isestablished— this consists of at least two labeled circles in a particular arrangement:
Introduction: Varieties of Iconicity 11
every circle must overlap every other circle, as well as every other overlap of circles,as in the following cases.11
In the Venn system, primary diagrams alone have no standard interpretation.Rather, they merely delimit regions of logical space. As with Euler diagrams, thestructure of a Venn diagram is ultimately topological; the shapes and sizes of theclosed regions don’t matter.
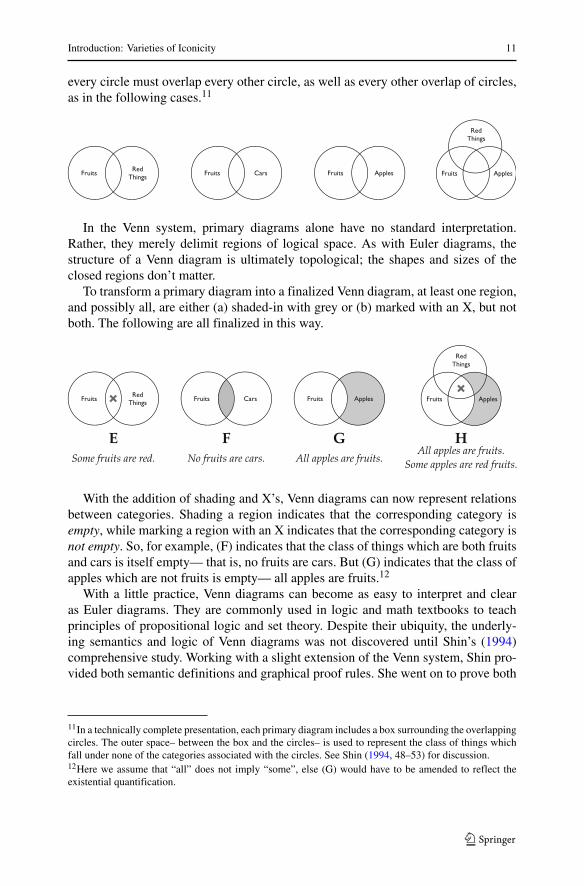
To transform a primary diagram into a finalized Venn diagram, at least one region,and possibly all, are either (a) shaded-in with grey or (b) marked with an X, but notboth. The following are all finalized in this way.
With the addition of shading and X’s, Venn diagrams can now represent relationsbetween categories. Shading a region indicates that the corresponding category isempty, while marking a region with an X indicates that the corresponding category isnot empty. So, for example, (F) indicates that the class of things which are both fruitsand cars is itself empty— that is, no fruits are cars. But (G) indicates that the class ofapples which are not fruits is empty— all apples are fruits.12
With a little practice, Venn diagrams can become as easy to interpret and clearas Euler diagrams. They are commonly used in logic and math textbooks to teachprinciples of propositional logic and set theory. Despite their ubiquity, the underly-ing semantics and logic of Venn diagrams was not discovered until Shin’s (1994)comprehensive study. Working with a slight extension of the Venn system, Shin pro-vided both semantic definitions and graphical proof rules. She went on to prove both
11In a technically complete presentation, each primary diagram includes a box surrounding the overlappingcircles. The outer space– between the box and the circles– is used to represent the class of things whichfall under none of the categories associated with the circles. See Shin (1994, 48–53) for discussion.12Here we assume that “all” does not imply “some”, else (G) would have to be amended to reflect theexistential quantification.
12 V. Giardino, G. Greenberg
soundness and completeness for the diagram system, and demonstrated its equiv-alence to a monadic predicate logic (Shin 1994, 141–152). In the wake of thesefindings, it is clear that Venn diagrams constitute a genuine system of representation,replete with rules of construction, interpretation, and even proof.
Though the systems of Euler and Venn were deliberately invented and extended,and are in this sense artificial, they live on, without formal explication, in textbooks,technical documents, newspaper articles, and classrooms. What’s more, even theoriginal definitions for these systems were vague and highly informal— nowherenear sufficient, for example, to train a computer in their interpretation. Instead, theirinventors happened upon systems that were sufficiently natural for humans to acquireimplicitly, circumventing the cumbersome chore of explicit learning. It wasn’t untilthe likes of Shin (1994) and Hammer and Shin (1998) that these systems were explic-itly codified. Such logical studies of iconic systems are a counterpart to contemporaryformal linguistics, but they are still in their infancy.
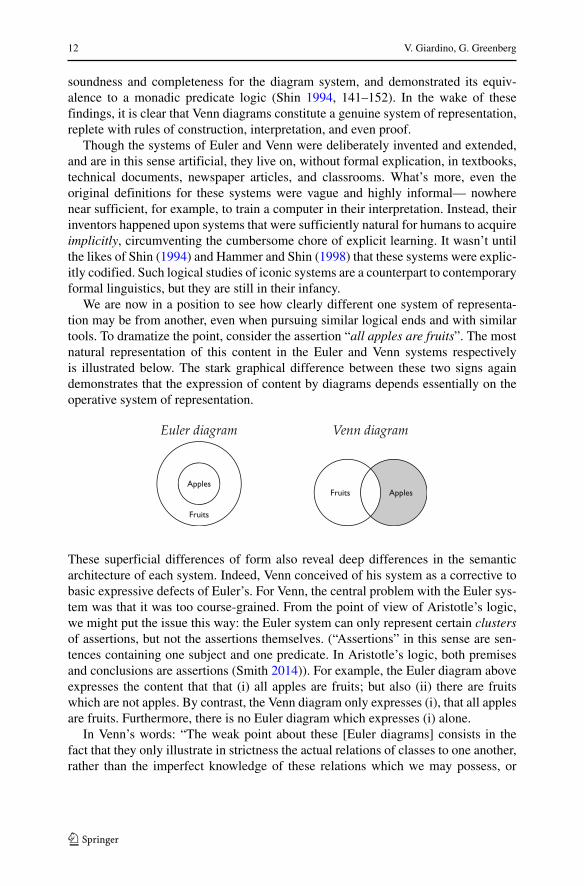
We are now in a position to see how clearly different one system of representa-tion may be from another, even when pursuing similar logical ends and with similartools. To dramatize the point, consider the assertion “all apples are fruits”. The mostnatural representation of this content in the Euler and Venn systems respectivelyis illustrated below. The stark graphical difference between these two signs againdemonstrates that the expression of content by diagrams depends essentially on theoperative system of representation.
These superficial differences of form also reveal deep differences in the semanticarchitecture of each system. Indeed, Venn conceived of his system as a corrective tobasic expressive defects of Euler’s. For Venn, the central problem with the Euler sys-tem was that it was too course-grained. From the point of view of Aristotle’s logic,we might put the issue this way: the Euler system can only represent certain clustersof assertions, but not the assertions themselves. (“Assertions” in this sense are sen-tences containing one subject and one predicate. In Aristotle’s logic, both premisesand conclusions are assertions (Smith 2014)). For example, the Euler diagram aboveexpresses the content that that (i) all apples are fruits; but also (ii) there are fruitswhich are not apples. By contrast, the Venn diagram only expresses (i), that all applesare fruits. Furthermore, there is no Euler diagram which expresses (i) alone.
In Venn’s words: “The weak point about these [Euler diagrams] consists in thefact that they only illustrate in strictness the actual relations of classes to one another,rather than the imperfect knowledge of these relations which we may possess, or
Introduction: Varieties of Iconicity 13
wish to convey, by means of the proposition” (1881, 424). As Venn observes, thetwo systems seem to have different subject matters. In the Euler system, circlesdirectly represent actual classes of objects, and relationships among circles indicatesactual relationships among these classes. In the Venn system, circles represent merelypossible classes, and their spatial relationships reflect the merely logically possiblerelations between these possible classes. As a consequence, Venn diagrams representfine-grained propositions, while Euler diagrams can only represent more concrete,course-grained situations.
These expressive differences are not in themselves problematic. But anyone set-ting out to represent a deduction involving the assertion “all apples are fruits” inthe Euler system would inevitably commit themselves to more information than isstrictly implied by that assertion. Thus Euler diagrams cannot generally stand in aspremises in an Aristotelean deductions, for they would license unintended inferences.By contrast, for each expression in Aristotle’s term logic, there is exactly one Venndiagram which expresses the same content, making them ideal stand-ins for premisesin a deduction. (Euler himself was apparently sensitive to this problem, and deviseda solution, albeit an awkward solution. But the solution raises even greater problems,and to the extent that the Euler system lives on today, it is the simplified version pre-sented above, not the one he originally offered (Euler 1795, 340–342; Shin 1994,13–16).)
The formal differences between Euler and Venn reflect differences of immediaterelevance to their use— that is, differences in their use properties. Venn diagramsfacilitate the representation of Aristotelean deduction in a way that Euler diagramsdo not. This fact motivated their adoption by Venn, and even today, when Aristotle’slogic no longer commands the same interest, the Venn system is preferred for visual-izing principles of Boolean algebra for essentially the same reasons. Yet expressivepower is only one relevant use property among many. For, despite its shortcomings,the Euler system was not eclipsed by Venn’s, but continues to thrive in the modernera. This flourishing can be attributed largely to a different kind of use property, whatwe earlier term naturalness, one of the hallmarks of iconic representation. The Eulersystem is easier to learn and apply than Venn’s, and it makes its content more eas-ily accessible through its distinctive spatial organization. Put simply, Euler diagramssimply seem to be more iconic than Venn diagrams.
Here there appears to be a kind of trade-off between expressive power andiconicity. Hammer and Shin (p. 14) describe the situation this way: “Venn’s revi-sion resulted in loss of visual clarity at the cost of gaining expressive power...in the process of extending the system Peirce lost even more of the capacity forvisual naturalness.” (The Venn system presented here is a mixture of Venn’s orig-inal account with some of Peirce’s additions.) It is difficult to pinpoint what it isabout the Venn system which makes it less natural than the Euler system, thoughthis claim can hardly be doubted. Perhaps it is the addition of quasi-symbolic ele-ments like the grey shading or X-markings. Perhaps it is the more abstract contentsVenn diagrams express. Understanding this difference is an important but unresolvedsubject of inquiry.
14 V. Giardino, G. Greenberg
We have dwelt upon this case in part because the contrast between Euler andVenn parallels the contrast between iconic and symbolic representation generally.On one side lies greater naturalness, on the other, greater expressivity. Long aftertheir invention, the continued use of these diagram systems in the modern era sug-gests that both boast use properties not possessed by conventional, symbolic means.This is underscored by the fact that all human languages and even simple artificiallanguages (like Predicate Logic) have expressive power that far outstrips those ofeither the Euler or Venn systems. Thus their ongoing use must be explained in part,once again, by their naturalness: both systems allow content to be made manifest ina way that, for human cognition, is particularly easy to grasp, especially as comparedto familiar symbolic systems. The point was captured by Euler’s initial remark thathis diagrams “are extremely commodious for facilitating our reflection... By meansof these signs the whole is rendered sensible to the eye.”
3 Pictorial Representation
It might be thought that abstract diagrams, with their natural parallels to language, arecorrespondingly system-driven, while pictures, with their roots in perception, couldnot be. In fact, however, pictorial representation appears to be governed by systemsof representation in the same way. While all pictorial systems do recapitulate theperspectival character of visual perception, they also deviate from vision freely inresponse to external demands. The range of variation is wide: differences can befound in the treatment of overall geometry, line, color, and the encoding of light(Willats 1997; Maynard 2005). In this section we focus again on a pair of illustrativeexamples: the system of linear perspective and that of parallel perspective.13 As wewill discuss, they differ fundamentally in their use of projective geometry to expresscontent.
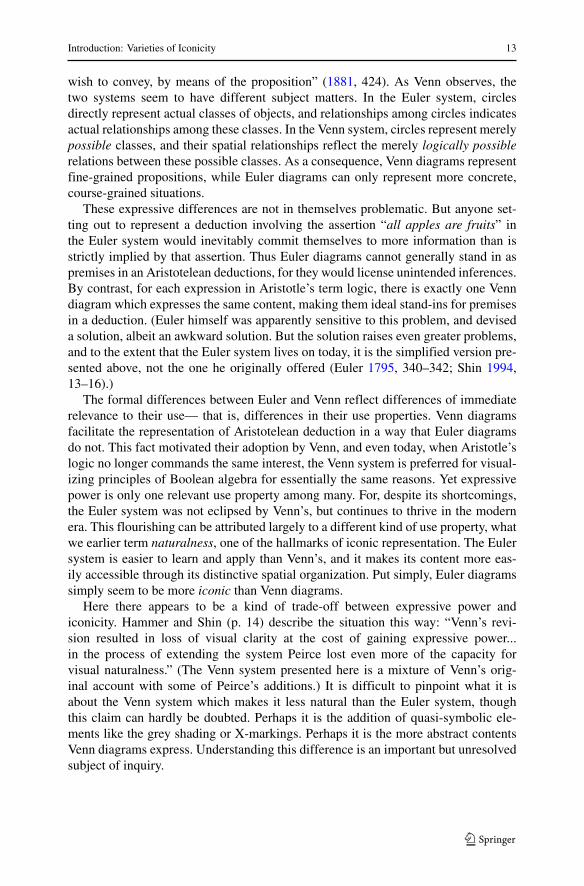
Pictures in the system of LINEAR PERSPECTIVE are dominant in contemporarymedia, realized as drawings, paintings, and photographs.14 They are marked by afew prototypical features. In linear perspective, for example, as objects move fartherfrom the viewpoint, they are depicted by smaller regions on the picture plane, as infigure A below. A related feature is exhibited by the representation of parallel lines,as in figure B below: in linear perspective, parallel lines extending away from theviewpoint are depicted by converging lines on the picture plane. Though elements oflinear perspective have been employed since antiquity, the geometry it depends onwas not explicitly codified and mastered until the Renaissance (Alberti 1991 [1435];Hagen 1986; Willats 1997).
13Strictly speaking, these are two classes of system. Each class can be realized with different treatmentsof line, color, and light— and each such realization corresponds to a distinct system of representation.14Linear perspective is often simply called “perspective.” Linear perspective is to be distinguished fromcurvilinear perspective— the sort of image produced by a fisheye lens.
Introduction: Varieties of Iconicity 15
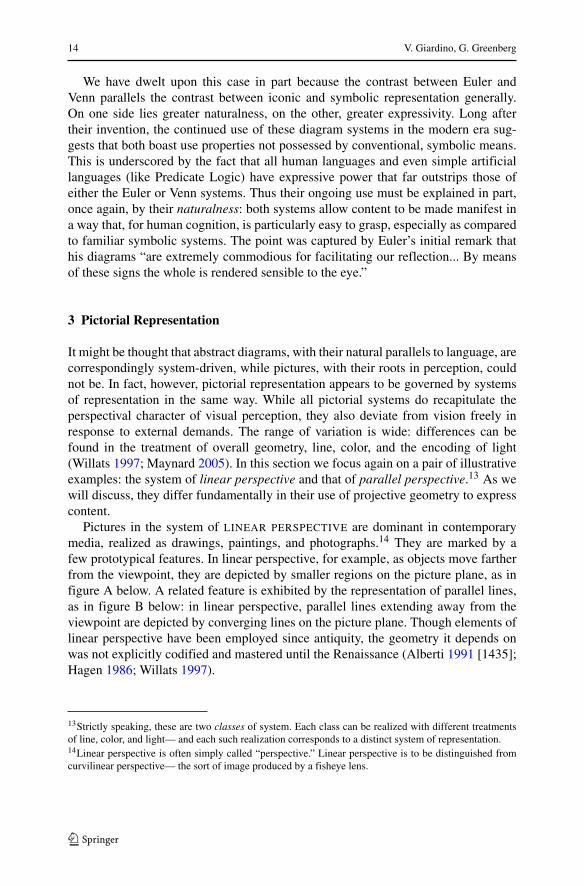
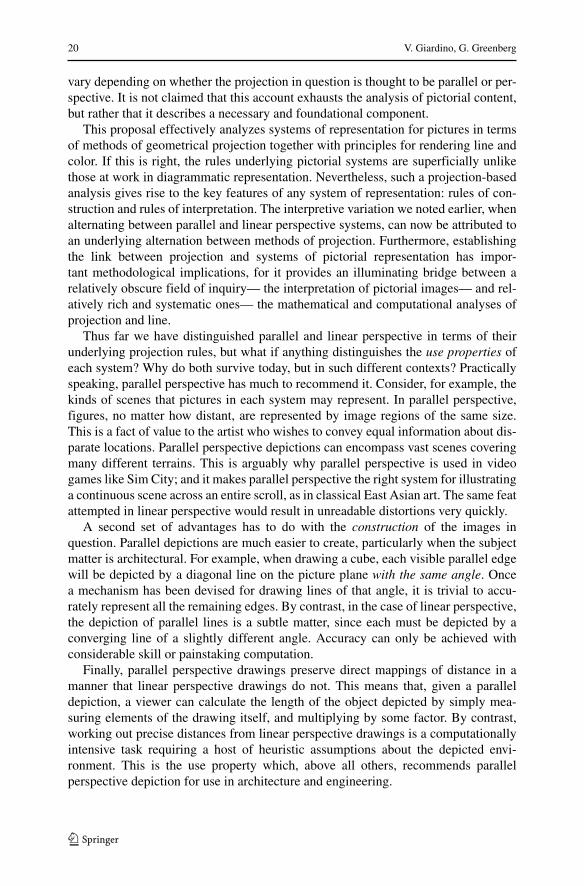
Pictures in PARALLEL PERSPECTIVE are less common in mainstream media, butprevalent in architecture, engineering, and other technical fields.15 The same featureswhich characterize linear perspective distinguish it from parallel perspective. In par-allel perspective, for example, even as objects move farther from the viewpoint, theyare depicted by regions of the same size on the picture plane, as shown in figure C.In addition, parallel lines extending away from the picture plane are depicted by par-allel lines on the picture plane, as in D. Parallel perspective is sometimes describedas giving rise to a kind of unsituated “god’s eye view.”
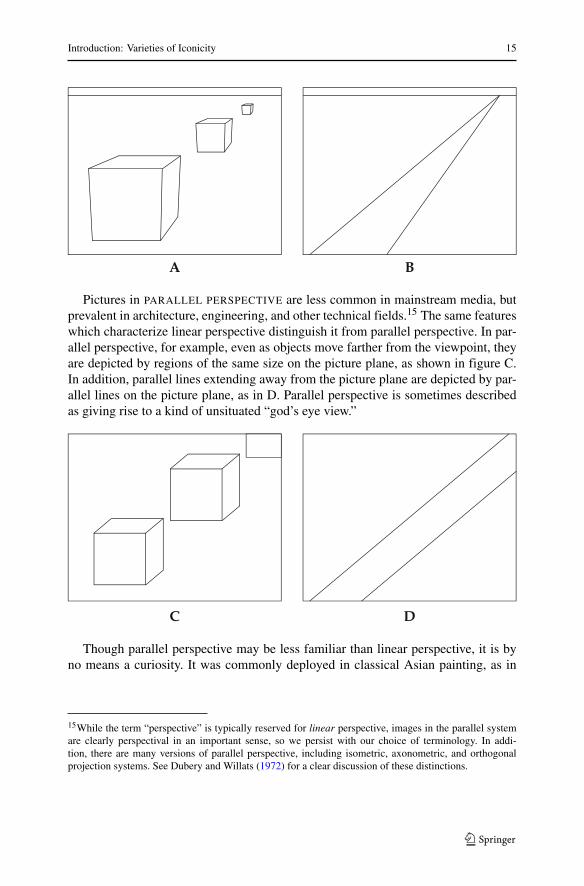
Though parallel perspective may be less familiar than linear perspective, it is byno means a curiosity. It was commonly deployed in classical Asian painting, as in
15While the term “perspective” is typically reserved for linear perspective, images in the parallel systemare clearly perspectival in an important sense, so we persist with our choice of terminology. In addi-tion, there are many versions of parallel perspective, including isometric, axonometric, and orthogonalprojection systems. See Dubery and Willats (1972) for a clear discussion of these distinctions.
16 V. Giardino, G. Greenberg
figure E, and has been used in technical drawing continually since the 19th century,as in figure F (Willats 1997, 37–59).16
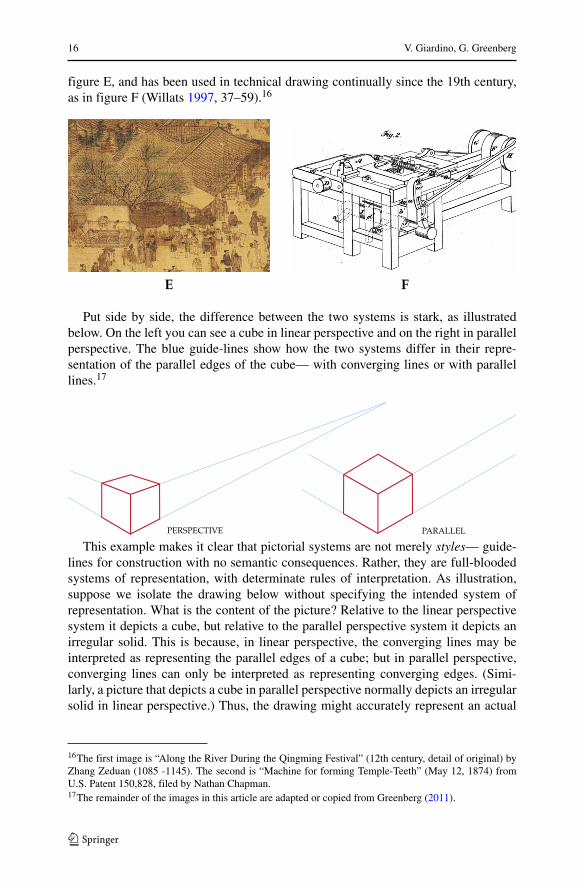
Put side by side, the difference between the two systems is stark, as illustratedbelow. On the left you can see a cube in linear perspective and on the right in parallelperspective. The blue guide-lines show how the two systems differ in their repre-sentation of the parallel edges of the cube— with converging lines or with parallellines.17
This example makes it clear that pictorial systems are not merely styles— guide-lines for construction with no semantic consequences. Rather, they are full-bloodedsystems of representation, with determinate rules of interpretation. As illustration,suppose we isolate the drawing below without specifying the intended system ofrepresentation. What is the content of the picture? Relative to the linear perspectivesystem it depicts a cube, but relative to the parallel perspective system it depicts anirregular solid. This is because, in linear perspective, the converging lines may beinterpreted as representing the parallel edges of a cube; but in parallel perspective,converging lines can only be interpreted as representing converging edges. (Simi-larly, a picture that depicts a cube in parallel perspective normally depicts an irregularsolid in linear perspective.) Thus, the drawing might accurately represent an actual
16The first image is “Along the River During the Qingming Festival” (12th century, detail of original) byZhang Zeduan (1085 -1145). The second is “Machine for forming Temple-Teeth” (May 12, 1874) fromU.S. Patent 150,828, filed by Nathan Chapman.17The remainder of the images in this article are adapted or copied from Greenberg (2011).
Introduction: Varieties of Iconicity 17
cube relative to the linear system, but not relative to the parallel system. Just as withdiagram systems and languages, pictorial content is system-relative.
It is not immediately obvious that the pictorial systems we have just describedcan be defined in terms of precise and coherent sets of rules. The alternative is thatthey are merely the products of loose heuristics like draw parallel lines parallel, ordraw further objects smaller. The conclusion that pictorial system are rule governedis the result of centuries of work by artists and art theorists, as well as some recentinnovations in computer vision and cognitive science. Today, scholars of depictionhave achieved considerable success in the formal analysis of pictorial systems byusing tools from projective geometry, as we now briefly explain.
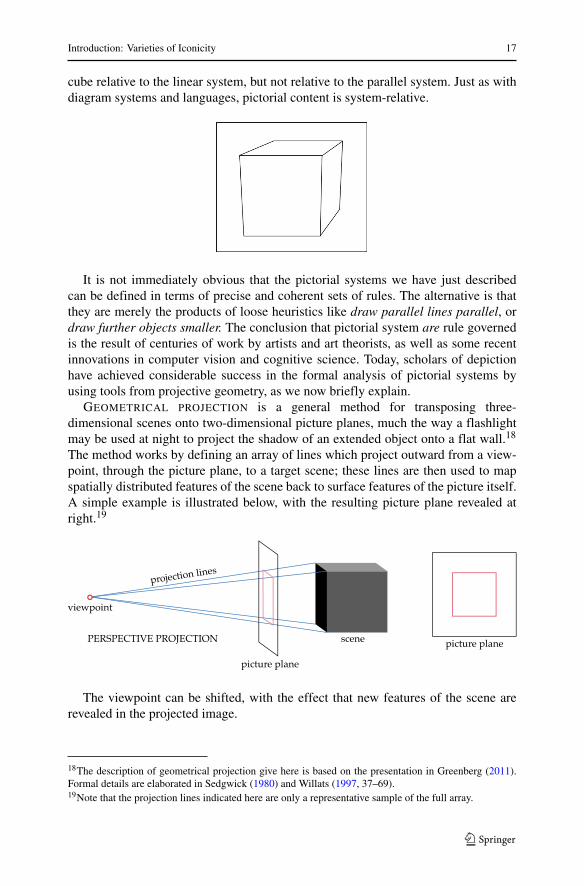
GEOMETRICAL PROJECTION is a general method for transposing three-dimensional scenes onto two-dimensional picture planes, much the way a flashlightmay be used at night to project the shadow of an extended object onto a flat wall.18
The method works by defining an array of lines which project outward from a view-point, through the picture plane, to a target scene; these lines are then used to mapspatially distributed features of the scene back to surface features of the picture itself.A simple example is illustrated below, with the resulting picture plane revealed atright.19
The viewpoint can be shifted, with the effect that new features of the scene arerevealed in the projected image.
18The description of geometrical projection give here is based on the presentation in Greenberg (2011).Formal details are elaborated in Sedgwick (1980) and Willats (1997, 37–69).19Note that the projection lines indicated here are only a representative sample of the full array.
18 V. Giardino, G. Greenberg
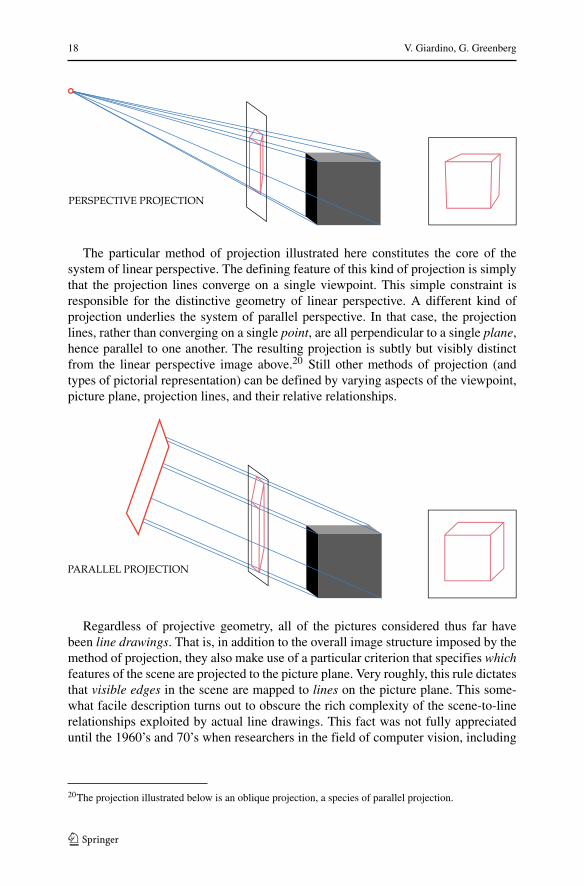
The particular method of projection illustrated here constitutes the core of thesystem of linear perspective. The defining feature of this kind of projection is simplythat the projection lines converge on a single viewpoint. This simple constraint isresponsible for the distinctive geometry of linear perspective. A different kind ofprojection underlies the system of parallel perspective. In that case, the projectionlines, rather than converging on a single point, are all perpendicular to a single plane,hence parallel to one another. The resulting projection is subtly but visibly distinctfrom the linear perspective image above.20 Still other methods of projection (andtypes of pictorial representation) can be defined by varying aspects of the viewpoint,picture plane, projection lines, and their relative relationships.
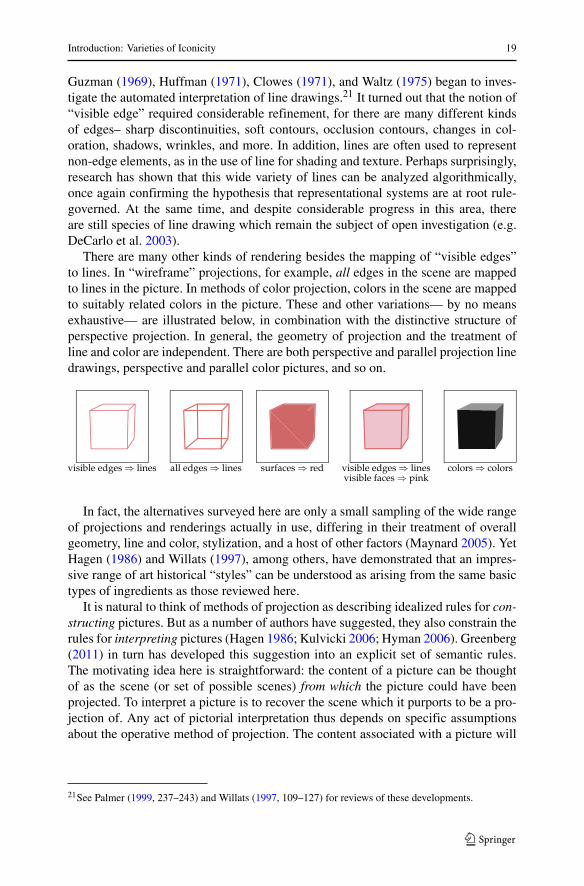
Regardless of projective geometry, all of the pictures considered thus far havebeen line drawings. That is, in addition to the overall image structure imposed by themethod of projection, they also make use of a particular criterion that specifies whichfeatures of the scene are projected to the picture plane. Very roughly, this rule dictatesthat visible edges in the scene are mapped to lines on the picture plane. This some-what facile description turns out to obscure the rich complexity of the scene-to-linerelationships exploited by actual line drawings. This fact was not fully appreciateduntil the 1960’s and 70’s when researchers in the field of computer vision, including
20The projection illustrated below is an oblique projection, a species of parallel projection.
Introduction: Varieties of Iconicity 19
Guzman (1969), Huffman (1971), Clowes (1971), and Waltz (1975) began to inves-tigate the automated interpretation of line drawings.21 It turned out that the notion of“visible edge” required considerable refinement, for there are many different kindsof edges– sharp discontinuities, soft contours, occlusion contours, changes in col-oration, shadows, wrinkles, and more. In addition, lines are often used to representnon-edge elements, as in the use of line for shading and texture. Perhaps surprisingly,research has shown that this wide variety of lines can be analyzed algorithmically,once again confirming the hypothesis that representational systems are at root rule-governed. At the same time, and despite considerable progress in this area, thereare still species of line drawing which remain the subject of open investigation (e.g.DeCarlo et al. 2003).
There are many other kinds of rendering besides the mapping of “visible edges”to lines. In “wireframe” projections, for example, all edges in the scene are mappedto lines in the picture. In methods of color projection, colors in the scene are mappedto suitably related colors in the picture. These and other variations— by no meansexhaustive— are illustrated below, in combination with the distinctive structure ofperspective projection. In general, the geometry of projection and the treatment ofline and color are independent. There are both perspective and parallel projection linedrawings, perspective and parallel color pictures, and so on.
In fact, the alternatives surveyed here are only a small sampling of the wide rangeof projections and renderings actually in use, differing in their treatment of overallgeometry, line and color, stylization, and a host of other factors (Maynard 2005). YetHagen (1986) and Willats (1997), among others, have demonstrated that an impres-sive range of art historical “styles” can be understood as arising from the same basictypes of ingredients as those reviewed here.
It is natural to think of methods of projection as describing idealized rules for con-structing pictures. But as a number of authors have suggested, they also constrain therules for interpreting pictures (Hagen 1986; Kulvicki 2006; Hyman 2006). Greenberg(2011) in turn has developed this suggestion into an explicit set of semantic rules.The motivating idea here is straightforward: the content of a picture can be thoughtof as the scene (or set of possible scenes) from which the picture could have beenprojected. To interpret a picture is to recover the scene which it purports to be a pro-jection of. Any act of pictorial interpretation thus depends on specific assumptionsabout the operative method of projection. The content associated with a picture will
21See Palmer (1999, 237–243) and Willats (1997, 109–127) for reviews of these developments.
20 V. Giardino, G. Greenberg
vary depending on whether the projection in question is thought to be parallel or per-spective. It is not claimed that this account exhausts the analysis of pictorial content,but rather that it describes a necessary and foundational component.
This proposal effectively analyzes systems of representation for pictures in termsof methods of geometrical projection together with principles for rendering line andcolor. If this is right, the rules underlying pictorial systems are superficially unlikethose at work in diagrammatic representation. Nevertheless, such a projection-basedanalysis gives rise to the key features of any system of representation: rules of con-struction and rules of interpretation. The interpretive variation we noted earlier, whenalternating between parallel and linear perspective systems, can now be attributed toan underlying alternation between methods of projection. Furthermore, establishingthe link between projection and systems of pictorial representation has impor-tant methodological implications, for it provides an illuminating bridge between arelatively obscure field of inquiry— the interpretation of pictorial images— and rel-atively rich and systematic ones— the mathematical and computational analyses ofprojection and line.
Thus far we have distinguished parallel and linear perspective in terms of theirunderlying projection rules, but what if anything distinguishes the use properties ofeach system? Why do both survive today, but in such different contexts? Practicallyspeaking, parallel perspective has much to recommend it. Consider, for example, thekinds of scenes that pictures in each system may represent. In parallel perspective,figures, no matter how distant, are represented by image regions of the same size.This is a fact of value to the artist who wishes to convey equal information about dis-parate locations. Parallel perspective depictions can encompass vast scenes coveringmany different terrains. This is arguably why parallel perspective is used in videogames like Sim City; and it makes parallel perspective the right system for illustratinga continuous scene across an entire scroll, as in classical East Asian art. The same featattempted in linear perspective would result in unreadable distortions very quickly.
A second set of advantages has to do with the construction of the images inquestion. Parallel depictions are much easier to create, particularly when the subjectmatter is architectural. For example, when drawing a cube, each visible parallel edgewill be depicted by a diagonal line on the picture plane with the same angle. Oncea mechanism has been devised for drawing lines of that angle, it is trivial to accu-rately represent all the remaining edges. By contrast, in the case of linear perspective,the depiction of parallel lines is a subtle matter, since each must be depicted by aconverging line of a slightly different angle. Accuracy can only be achieved withconsiderable skill or painstaking computation.
Finally, parallel perspective drawings preserve direct mappings of distance in amanner that linear perspective drawings do not. This means that, given a paralleldepiction, a viewer can calculate the length of the object depicted by simply mea-suring elements of the drawing itself, and multiplying by some factor. By contrast,working out precise distances from linear perspective drawings is a computationallyintensive task requiring a host of heuristic assumptions about the depicted envi-ronment. This is the use property which, above all others, recommends parallelperspective depiction for use in architecture and engineering.
Introduction: Varieties of Iconicity 21
Given how the foregoing considerations of use favor parallel perspective so heav-ily, why does linear perspective not only survive but flourish? Linear perspectiveimages are, in a word, more “visual.” The contents they express are closer to the con-tents of visual perception. And the images themselves have more affinities with theretinal images that are the input to vision. Overall, the cognitive processes govern-ing the interpretation of linear perspective drawings seem likely closer to those atwork in normal visual perception. As a result, linear perspective images put viewersin a better position to imagine for themselves what a given scene would look like inperson. As Gombrich (1960) has documented, such “visualness” was a use propertywhich was hard won by generations of artists making incremental improvements overmany centuries— a testament to its profound human importance. Today, an architectwishing to help her client envision the interior of his future house would likely usea system of linear perspective, though she would likely employ a system of parallelperspective in any transactions with her engineers. Like naturalness, visualness is adesideratum that is as difficult to define as it is sought after in the history of iconicity.
4 Conclusion
We have attempted to sketch a map by which the reader may begin to navigate thevaried domain of iconic signs. We began with the basic distinction between picturesand diagrams, noting both their unity– the “iconicity” of this introduction’s title– andtheir expressive differences. We went on to show that both pictures and diagrams canbe analyzed along two interrelated axes of variation. On one hand, individual iconsbelong to general, rule-based systems of representation, of which they are elements.From this point of view, icons as well as linguistic symbols belong to “languages,”as Goodman (1968) rightly suggested. On the other hand, classes of icons possesswhat we termed use properties, generic features that reflect the characteristic effectsthey have on and for their users. It is these use properties which inform most directlywhether one or another system of representation is deployed in context.
We illustrated these ideas first for the case of diagrams, comparing the systems ofEuler and Venn diagrams, and then for the case of pictures, comparing the systems oflinear perspective and parallel perspective. We selected these particular case studiesbecause both their system-based and use properties have already been studied in con-siderable detail. The challenge then is to carry the successes of these analyses over tothe diverse range of diagrammatic and pictorial forms. Many of these have been thesubject of systematic research— but even more have not.
We turn now, briefly, to a few of the unresolved questions this study provokes. Inthe context of the preceding discussion, we must wonder what general relationshipsexist between the formal descriptions of systems, on one hand, and their practicaluses, on the other. It would be of great practical significance to be able to taxonom-ically associate specific kinds of tasks with the systems best suited to them. Morespecific but fundamental questions about the status of iconicity also remain unre-solved. For example, is iconicity in general best defined as an intrinsic feature ofsystems, or only relationally, as a use property that emerges in interaction with human
22 V. Giardino, G. Greenberg
nature and human interest? There seems to be a close relationship between iconicityand the use property of naturalness discussed throughout— but the idea of natural-ness itself remains at best vague. How should it be defined? Are there general featuresof systems which correspond to naturalness? And are there other features of systemswhich are incompatible with naturalness? Our study of the Euler and Venn systems,for instance, suggested a kind of trade-off between expressive power, on one hand,and relative naturalness on the other. Does this pattern generalize to other domains,even the symbolic/iconic distinction itself?
Finally, there are questions which lie outside the scope of the present discussion,but demand attention. Linguistic representation has traditionally been studied througha multi-layered approach which includes the fields of syntax, semantics, and prag-matics. The systemic approach outlined here is clearly affiliated with the traditionalsubjects of syntax and semantics; and the use-based approach has connections withpragmatics. Still, the broader concerns of pragmatics— the public status of signs, thestructure of communicative acts (aka “speech acts”), and the interaction of signs withsocial context— have not been engaged here. How should a pragmatics of iconicitybe elaborated?
Nearly all of the questions enumerated have been taken up by scholars of iconicityat one point or another, with varying results. But such discussions are, by any account,still in their infancy. The articles in this volume attack many of these problems attheir core, bringing fresh and promising strategies to bear on the enduring puzzles oficonic representation.
5 Contributions
The first article, “Wayfinding: Notes on the ‘Public’ as Interactive,” by PatrickMaynard, examines the public nature of representation by signs. He focuses on thechallenges and choices faced by the designer of a representation, as she prepares itfor use by a broader public, and the various functions such a sign may assume in thiscontext. His analysis is informed throughout by attention to the artifactual nature ofvisual displays, the intentionality behind their construction, and the cognitive makeupof their consumers.
In “The Mystery of Deduction and Diagrammatic Aspects of Representation,”Sun-Joo Shin introduces what she calls the “mystery of deduction.” The first aspectof this, “surprise effect,” refers to the fact that the conclusion of a deduction may besurprising, despite the fact that its truth is guaranteed by the truth of the premises, andits content contained in them. The second aspect, “demonstration-difficulty” refers tothe challenge of identifying the premises and proof for a theorem which is guaranteedto be true. What explains these “mysteries”? Shin explores this question as it arisesfor logical reasoning carried out in different representational media, in particularsymbolic and diagrammatic proof.
In “Meaning and Demonstration,” Matthew Stone and Una Stojnic examinethe phenomena of demonstration, in which an interlocutor at once performs a practi-cal action and communicates a message through that action. They focus on the case
Introduction: Varieties of Iconicity 23
of an origami-based proof of the Pythagorean Theorem— that is, a demonstrationwhich communicates a geometrical proof through the actions of folding, unfold-ing and cutting a piece of paper. By relying on David Lewis’s characterizations ofcoordination and conversational scorekeeping, Stone and Stojnic aims to show howpractical actions can acquire precise informational significance. In their view, as adiscourse unfolds, representations of diverse kinds make integrated contributions toan evolving conversational record.
“The Cognitive Design of Tools of Thought” by Barbara Tversky explores theways in which humans deliberately modify their spatial environments to express,shape, and extend their cognitive lives. She illustrates these ideas with a panoply ofhistorical and contemporary examples, ranging over diverse media, with case studiesdrawn from both naturally occuring uses and laboratory studies.
In “Diagrams as Tools for Scientific Reasoning,” Adele Abrahamsen andWilliam Bechtel examine the role of diagrams in scientific inquiry through a casestudy of diagrams used in circadian rhythm research. They argue that diagrams inscience serve not only as useful vehicles of communication, but as integrated partsof the research itself. Scientists rely on diagrams to “give a shape” to the phenomenathat are to be explained, to identify explanatory relations, and to construct and revisetheir theories.
Marcello Frixione and Antonio Lombardi propose a pragmatic approach to pic-torial communication in “Street Signs and Ikea Instruction Sheets: Pragmaticsand Pictorial Communication.” The authors take aim at Wittgensteinian skepticismabout the possibility of communication with pictures, arguing that verbal commu-nication suffers from the same apparent defects. Both challenges can be met, theyhold, with suitable attention to the pragmatics of communication, and they illustratea Gricean approach with examples drawn from street signs and Ikea instructions.
In “Pictures Have Propositional Content” Alex Grzankowski argues for theclaim expressed by his title. A common objection to the view turns on the apparentimpossibility of expressing negation by pictorial means. Grzankowski first contendsthat the objection misses its mark, and goes on to argue that closely related phe-nomena in fact imply the opposite— that pictures do, after all, have propositionalcontent.
In “Analog Representation and the Parts Principle,” John Kulvicki reconsid-ers the familiar distinction between analog and digital representation, arguing thatwe can achieve a better taxonomy of representational kinds by leaving aside the tra-ditional focus on continuous versus discrete structure. Instead, he proposes that aversion of the “Parts Principle,” prominently advocated by Jerry Fodor, captures thedistinctive character of analog representation. But Kulvicki reconceives a picture’s“parts” as including the levels of abstraction that it realizes. On the resulting view,analog representations are structure-preserving representations which allow viewersto freely engage the content expressed at multiple levels of abstraction.
Finally, in “Trompe l’oeil” and the Dorsal/Ventral Account of Picture Per-ception,” Bence Nanay takes an interdisciplinary approach to the topic of pictureperception. He aims to resolve long-standing puzzles about the perception oftromp l’oeil depictions, by drawing on his own “dorsal/ventral account” of picture
24 V. Giardino, G. Greenberg
perception. Nanay holds that the characteristic “two-foldedness” of picture percep-tion derives from the duality of dorsal and ventral visual processing, and goes on toapply this idea both to tromp l’oeil perception and normal picture perception.
Acknowledgments We would like to thank Paul Egre and Roberto Casati at the Institut Jean Nicod, andAllan Nebres, Christi Lue and Ties Nijssen at Springer for their patience and competence as they helpedus to prepare this issue. We thank Joshua Armstrong, Sam Cumming, and Katie Elliott for constructiveconversation and Milo Crimi for editorial assistance. Special thanks are due to our anonymous reviewersfor their careful and insightful comments, and to our authors for their outstanding contributions.
References
Abell, C. 2009. Canny resemblance. The Philosophical Review, 118(2): 183-223.Alberti, L.B 1991/1435. On painting, ed. C. Grayson. London: Pengu in Classics.Armstrong, J. 2013. Language change in context. PhD diss., Rutgers University.Bordwell, D. 2008. Poetics of cinema. Routledge New York. ISBN: 0415977789.Burge, T. 2010. Origins of objectivity. Oxford: Oxford University Press.Casati, R., and V. Giardino 2013. Public representation and indeterminicies of perspectival content. In
Enacting images, ed. Zsuzsanna Kondor, 111-126. Herbert von Halem Verlag.Chomsky, N. 1957. Syntactic structures. Walter de Gruyter.Chomsky, N. 1965. Aspects of the theory of syntax. The MIT press.Clowes, M.B. 1971. On seeing things. Artificial Intelligence, 2(1): 79116.Cumming, S., G. Greenberg, and R Kelly 2014. The representation of space in visual sequences.DeCarlo, D., A. Finkelstein, S. Rusinkiewicz, and A. Santella. 2003. Suggestive contours for conveying
shape. ACM Transactions on Graphics (TOG), 22(3): 848-855.Dubery, F., and J. Willats 1972. Drawing systems. Studio Vista London.Euler, L. 1795. Letters to a german princess, on different subjects in physics and philosophy. London.French, S. 2003. A model-theoretic account of representation (or, i dont know much about art but i know
it involves isomorphism). Philosophy of Science, 70(5): 14721483.Gombrich, E.H. 1960. Art and illusion: a study in the psychology of pictorial representation. London:
Phaidon.Goodman, N. 1968. Languages of art: an approach to a theory of symbols. Indianapolis: Bobbs-Merrill.Greenberg, G. 2011. The semiotic spectrum. PhD diss., Rutgers University.Greenberg, G. 2013. Beyond resemblance. Philosophical Review, 122(2): 215287.Guzman, A. 1969. Decomposition of a visual scene into three-dimensional bodies. In Automatic
interpretation and classification of images, ed. A. Griselli, 243-276. New York: Academic Press.Hagen, M.A. 1986. Varieties of realism: geometries of representational art. Cambridge: Cambridge
University Press.Hammer, E., and S.J. Shin. 1998. Eulers visual logic. History and Philosophy of Logic, 19(1): 129. ISSN:
0144–5340.Hauser, M.D, N. Chomsky, and W Tecumseh Fitch. 2002. The faculty of language: what is it, who has it,
and how did it evolve? Science, 298(5598): 1569-1579.Huffman, D.A. 1971. Impossible objects as nonsense sentences. Machine Intelligence: 295.Hyman, J. 2006. The objective eye: color, form, and reality in the theory of art. Chicago: University of
Chicago Press.Kulvicki, J. 2006. On images: their structure and content. Oxford: Clarendon.Larkin, J.H., and H.A Simon. 1987. Why a diagram is (sometimes) worth ten thousand words. Cognitive
Science, 11(1): 65-100.Lascarides, A., and M. Stone. 2009. A formal semantic analysis of gesture. Journal of Semantics, 26(4).Lewis, D. 1969. Convention: a philosophical study. Oxford: Blackwell.Lewis, D. 1975. Languages and language. In Language, mind and knowledge, ed. Keith Gunderson, 3-35.
Vol. 7. Minnesota Studies in the Philosophy of Science. Minneapolis: University of Minnesota Press.Maynard, P. 2005. Drawing distinctions: the varieties of graphic expression. Cornell University Press.
Introduction: Varieties of Iconicity 25
Neurath, O. 1945/1973. Visual education: humanisation versus popularisation. In, ed. R. S. Cohen andM. Neurath, 227248. Dordrecht: Reidel.
Palmer, S. 1999. Vision science: photons to phenomenology. The MIT Press.Peirce, C.S. 1868. On a new list of categories. In Proceedings of the american academy of arts and
sciences, 287-298. Vol. 7. 1868.Peirce, C.S. 1906. Prolegomena to an apology for pragmaticism. The Monist, 16(4): 492-546.Saussure, F., C. Bally, A. Sechehaye, A. Riedlinger, L.J. Calvet, and T. De Mauro. 1922. Cours de
linguistique generale. Paris: Payot.Schier, F. 1986. Deeper into pictures: an essay on pictorial representation. Cambridge University Press.Schlenker, P., J. Lamberton, and M. Santoro. 2013. Iconic variables. Linguistics and philosophy, 36(2):
91-149.Sedgwick, H.A. 1980. The geometry of spatial layout in pictorial represenation. In The perception of
pictures, 33-90. Vol. 1. London: Academic Press.Shin, S.J. 1994. The logical status of diagrams. Cambridge Univ Press.Smith, R. 2014. Aristotles logic. In The stanford encyclopedia of philosophy, Spring 2014, ed.
Edward N. Zalta.Tversky, B. 2011. Visualizing thought. Topics in Cognitive Science, 3(3): 499-535.Venn, J. 1881. Symbolic logic. Macmillan.Waltz, D. 1975. Understanding line drawings of scenes with shadows. In The psychology of computer
vision. Citeseer.Willats, J. 1997. Art and representation: new principles in the analysis of pictures. Princeton: Princeton
University Press.