Embed Size (px)
Citation preview
Influence of the Lake Erie Overlake Boundary Layer on DeepConvective Storm Evolution
THOMAS E. WORKOFF*
Department of Atmospheric Sciences, and Center for Atmospheric Science, Illinois State Water Survey,
Prairie Research Institute, University of Illinois at Urbana–Champaign, Urbana, Illinois
DAVID A. R. KRISTOVICH
Center for Atmospheric Science, Illinois State Water Survey, Prairie Research Institute, University of
Illinois at Urbana–Champaign, Urbana, Illinois
NEIL F. LAIRD
Hobart and William Smith Colleges, Geneva, New York
ROBERT LAPLANTE
NOAA/National Weather Service Forecast Office, Cleveland, Ohio
DANIEL LEINS
NOAA/National Weather Service Forecast Office, Phoenix, Arizona
(Manuscript received 1 July 2011, in final form 6 February 2012)
ABSTRACT
The influence that the overlake boundary layer has on storm intensity and structure is not well understood.
To improve scientists’ understanding of the evolution of storms crossing Lake Erie, 111 events during 2001–09
were examined using observations from Weather Surveillance Radar-1988 Doppler (WSR-88D), surface,
buoy, and rawinsonde sites. It was found that on average, all storm modes tended to weaken over the lake;
however, considerable variability in changes of storm intensity existed, with some storms exhibiting steady-
state or increasing intensity in specific environments. Noteworthy changes in the storm maximum reflectivity
generally occurred within 60 min after storms crossed the upwind shoreline. Isolated and cluster storm modes
exhibited much greater weakening than those storms organized into lines or convective complexes. The at-
mospheric parameters having the greatest influence on storm intensity over Lake Erie varied by mode.
Isolated and cluster storms generally weakened more rapidly with increasingly cold overlake surface air
temperatures. Linear and complex systems, on the other hand, tended to exhibit constant or increasing
maximum reflectivity with cooler overlake surface air temperatures. It is suggested that strongly stable
conditions near the lake surface limit the amount of boundary layer air ingested into storms in these cases.
1. Introduction and background
It is well known that on climatic time scales the Great
Lakes suppress clouds and precipitation near the
coastlines during the warm season, particularly in re-
gions downwind of the lakes (e.g., Augustine et al. 1994;
Scott and Huff 1996). However, operational weather
forecasts for these regions must account for the rate of
* Current affiliation: Systems Research Group, Inc., NOAA/
Hydrometeorological Prediction Center, Camp Springs, Maryland.
Corresponding author address: David Kristovich, ISWS, PRI,
University of Illinois at Urbana–Champaign, 2204 Griffith Dr.,
Champaign, IL 61820.
E-mail: [email protected]
OCTOBER 2012 W O R K O F F E T A L . 1279
DOI: 10.1175/WAF-D-11-00076.1
� 2012 American Meteorological SocietyUnauthenticated | Downloaded 02/09/22 01:20 AM UTC
change of storm intensity as well as situations where the
storm evolution differs from climatology. Few published
studies have examined how the lakes and their associ-
ated overlake boundary layers (OLBLs)1 affect preex-
isting deep convective storms, particularly during the
warm season where the water surface is predominately
cooler than the surrounding land.
To develop better forecasting techniques for areas in
western lower Michigan, Graham et al. (2004) constructed
a 5-yr climatology of the behavior of severe mesoscale
convective systems (MCSs) crossing Lake Michigan. They
found that MCSs responded variably to passing over the
water surface, depending on time of year and structure.
For example, MCSs were more likely to weaken or dis-
sipate in the summer months (June–August, JJA) than
in the spring or fall. In addition, the stability of the OLBL
appeared to influence storm evolution over the lake. The
study showed that the convection tended to maintain
intensity when the OLBL was strongly stable (lake
surface $2.58C colder than the overlake air tempera-
ture), despite the reduction in surface-based instability.
However, their study did not examine the rate at which
storm intensity changes occurred.
Other studies have used numerical modeling tech-
niques to examine the effect of surface-based stable
layers on convective systems. Parker (2008) used an ide-
alized model to simulate squall-line interactions with
such layers. In his study, a surface-based isothermal cool
layer, approximately 1 km deep, was introduced to a ma-
ture squall line. He found that storm evolution is associ-
ated with the relative buoyancies of the cool layer and
the cold pool produced by the convective system. When
the cold pool is denser, lifting along the leading edge
of the cold pool can overcome a significant amount of
surface-based convective inhibition (CIN) if convective
available potential energy (CAPE) is present. This, in
turn, allows updrafts to maintain their intensity despite
interaction with convectively unfavorable near-surface
conditions. The results of Parker (2008) also showed
that in instances where the surface cool layer ahead of
the storm is cooler than the cold pool air, storms can
become elevated atop the surface layer, with continuous
updrafts being driven by bore propagation.
The effect of changing low-level conditions near shore-
lines on mature squall lines was examined in an ideali-
zed modeling study by Lericos et al. (2007). Their study
focused on squall lines moving eastward from the Gulf
of Mexico onto the northern Florida coast. In cases of
moderate to strong ambient low-level vertical wind shear,
land breezes were found to reduce the magnitude of
ambient shear. This, in turn, caused the updraft of the
squall line to tilt in an upshear direction, resulting in
weakening of the squall line.
While the Graham et al. (2004), Parker (2008), and
Lericos et al. (2007) studies provide important insights
into the evolution of convection interacting with varying
near-surface conditions in the vicinity of coastlines, they
consider only organized convective systems (e.g., MCSs),
leaving the potential effect of a large lake on other con-
vective modes unknown. In addition, the rate of change
in the storm system, critical in an area of widely varying
lake sizes, was not examined. The current study uses
a climatological approach incorporating observations
commonly available to forecasters (e.g., radar, hourly
surface observations, rawinsonde observations) to ex-
amine how large lakes influence the intensity of the wide
range of convective modes.
2. Data and methodology
Statistical analyses were performed by season, time of
day, and storm mode to identify common storm re-
sponses and the potential causes. Weather Surveillance
Radar-1988 Doppler (WSR-88D) data from Cleveland,
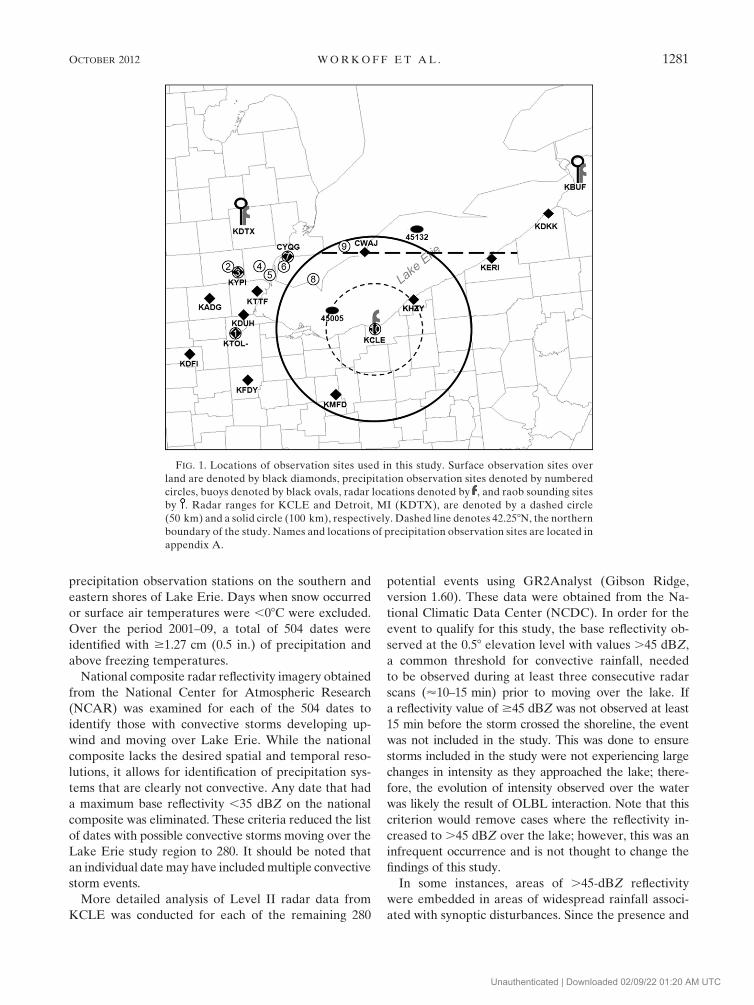
Ohio (KCLE) (Fig. 1), were used for this study. The area
of study chosen was south of 42.258N over Lake Erie;
this was selected to include storms within a range of
;100 km of the radar when crossing the lake. This is an
area where convective storms frequently pass over Lake
Erie (Laing and Fritsch 1997) and are routinely moni-
tored by the Cleveland National Weather Service
Forecast Office.
a. Identification of events
Appropriate events (preexisting convective storms
that advected from land to over Lake Erie) were identi-
fied by a three-step process: 1) surface observations were
used to identify dates when significant rain occurred,
2) composite radar reflectivity imagery was used to re-
move events where the observed precipitation was clearly
not associated with convective storms moving over Lake
Erie, and 3) more detailed analyses of WSR-88D Level II
data were conducted to identify which of the remaining
events were appropriate for this study.
Precipitation observations at sites around Lake Erie
(Fig. 1, appendix A) were used to identify potentially
appropriate events. The azimuth range of 1208–3408 with
respect to the location of KCLE was chosen to capture
the most likely path of storms crossing the lake while
staying inside the study area, despite the lack of suitable
1 Overlake boundary layers are often identified in the scientific
literature and forecast discussions as marine internal boundary
layers. OLBL is used in this article to emphasize the more limited
spatial extent of lakes relative to oceans.
1280 W E A T H E R A N D F O R E C A S T I N G VOLUME 27
Unauthenticated | Downloaded 02/09/22 01:20 AM UTC
precipitation observation stations on the southern and
eastern shores of Lake Erie. Days when snow occurred
or surface air temperatures were ,08C were excluded.
Over the period 2001–09, a total of 504 dates were
identified with $1.27 cm (0.5 in.) of precipitation and
above freezing temperatures.
National composite radar reflectivity imagery obtained
from the National Center for Atmospheric Research
(NCAR) was examined for each of the 504 dates to
identify those with convective storms developing up-
wind and moving over Lake Erie. While the national
composite lacks the desired spatial and temporal reso-
lutions, it allows for identification of precipitation sys-
tems that are clearly not convective. Any date that had
a maximum base reflectivity ,35 dBZ on the national
composite was eliminated. These criteria reduced the list
of dates with possible convective storms moving over the
Lake Erie study region to 280. It should be noted that
an individual date may have included multiple convective
storm events.
More detailed analysis of Level II radar data from
KCLE was conducted for each of the remaining 280
potential events using GR2Analyst (Gibson Ridge,
version 1.60). These data were obtained from the Na-
tional Climatic Data Center (NCDC). In order for the
event to qualify for this study, the base reflectivity ob-
served at the 0.58 elevation level with values .45 dBZ,
a common threshold for convective rainfall, needed
to be observed during at least three consecutive radar
scans (’10–15 min) prior to moving over the lake. If
a reflectivity value of $45 dBZ was not observed at least
15 min before the storm crossed the shoreline, the event
was not included in the study. This was done to ensure
storms included in the study were not experiencing large
changes in intensity as they approached the lake; there-
fore, the evolution of intensity observed over the water
was likely the result of OLBL interaction. Note that this
criterion would remove cases where the reflectivity in-
creased to .45 dBZ over the lake; however, this was an
infrequent occurrence and is not thought to change the
findings of this study.
In some instances, areas of .45-dBZ reflectivity
were embedded in areas of widespread rainfall associ-
ated with synoptic disturbances. Since the presence and
FIG. 1. Locations of observation sites used in this study. Surface observation sites over
land are denoted by black diamonds, precipitation observation sites denoted by numbered
circles, buoys denoted by black ovals, radar locations denoted by , and raob sounding sites
by . Radar ranges for KCLE and Detroit, MI (KDTX), are denoted by a dashed circle
(50 km) and a solid circle (100 km), respectively. Dashed line denotes 42.258N, the northern
boundary of the study. Names and locations of precipitation observation sites are located in
appendix A.
OCTOBER 2012 W O R K O F F E T A L . 1281
Unauthenticated | Downloaded 02/09/22 01:20 AM UTC
organization of convective storms is not always obvious
in such situations, these events were also eliminated
from the database. Finally, events when the convective
storm moved north of the 42.258N boundary were re-
moved. This resulted in a total of 111 events (on 101 days)
used for analysis of storm evolution over Lake Erie.
b. Determination of convective mode
Each storm was classified by mode to investigate its
role in convective evolution over the lake. During events
when the storm mode underwent a change over the lake,
the storm was classified by the mode at the time it moved
over the upwind shoreline. Previous studies (e.g., Fowle
and Roebber 2003; Gallus et al. 2008) tended to use three
dominate convective modes (linear, isolated, multicellu-
lar); a fourth mode (complex) was added for this study
due to the propensity for nonlinear mesoscale convective
complex (MCC) development in the study area, as well
as to allow for a more direct comparison with the findings
from Graham et al. (2004).
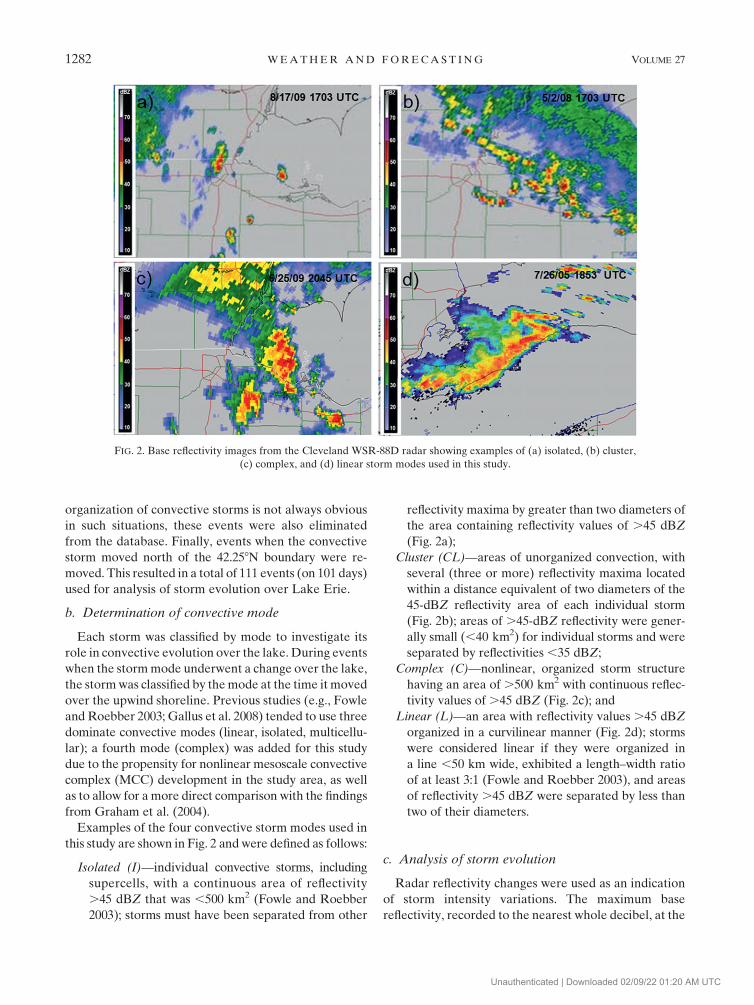
Examples of the four convective storm modes used in
this study are shown in Fig. 2 and were defined as follows:
Isolated (I)—individual convective storms, including
supercells, with a continuous area of reflectivity
.45 dBZ that was ,500 km2 (Fowle and Roebber
2003); storms must have been separated from other
reflectivity maxima by greater than two diameters of
the area containing reflectivity values of .45 dBZ
(Fig. 2a);
Cluster (CL)—areas of unorganized convection, with
several (three or more) reflectivity maxima located
within a distance equivalent of two diameters of the
45-dBZ reflectivity area of each individual storm
(Fig. 2b); areas of .45-dBZ reflectivity were gener-
ally small (,40 km2) for individual storms and were
separated by reflectivities ,35 dBZ;
Complex (C)—nonlinear, organized storm structure
having an area of .500 km2 with continuous reflec-
tivity values of .45 dBZ (Fig. 2c); and
Linear (L)—an area with reflectivity values .45 dBZ
organized in a curvilinear manner (Fig. 2d); storms
were considered linear if they were organized in
a line ,50 km wide, exhibited a length–width ratio
of at least 3:1 (Fowle and Roebber 2003), and areas
of reflectivity .45 dBZ were separated by less than
two of their diameters.
c. Analysis of storm evolution
Radar reflectivity changes were used as an indication
of storm intensity variations. The maximum base
reflectivity, recorded to the nearest whole decibel, at the
FIG. 2. Base reflectivity images from the Cleveland WSR-88D radar showing examples of (a) isolated, (b) cluster,
(c) complex, and (d) linear storm modes used in this study.
1282 W E A T H E R A N D F O R E C A S T I N G VOLUME 27
Unauthenticated | Downloaded 02/09/22 01:20 AM UTC
0.58 elevation angle was determined from KCLE Level II
data for each volume scan (approximate time interval
of 5 min). Maximum reflectivity was recorded from
30 min before (230 min) the time the storm moved
over the water (TMOW) to at least 60 min following
the TMOW (160 min), or until the storm arrived at the
downwind shoreline. In events when the storm had not
developed at 230 min, the maximum reflectivity was
determined from the volume scan at the time when
the maximum reflectivity exceeded 35 dBZ prior to
TMOW.
The storm evolution over Lake Erie was determined
by comparing the maximum reflectivity at TMOW with
both the maximum reflectivity at 30 (130 min) and at
60 min (160 min) over the lake. For simplification of
discussion, five categories were used to describe the
evolution of an individual storm:
major strengthening, with $ 18 dBZ maximum reflec-
tivity change,
moderate strengthening, with 13 to 17 dBZ maximum
reflectivity change,
no change, with 2 to 12 dBZ maximum reflectivity
change,
moderate weakening, with 23 to 27 dBZ maximum
reflectivity change, and
major weakening, with # 28 dBZ maximum reflec-
tivity change.
d. Environmental and storm parameters
To examine the influence of environmental conditions
on storm evolution over Lake Erie, several parameters
were developed to represent the atmospheric conditions
that storms encountered. These parameters and their
associated definitions are given in appendix B. The data
used to calculate these parameters for each storm are
described below.
Observations of temperature, wind speed, and wind
direction collected at surface sites over land near the
upwind (downwind) shore of Lake Erie were used to
represent the upwind (downwind) conditions encoun-
tered by each storm (Fig. 1). The upwind and down-
wind observation sites were relative to individual storm
motion as determined from radar data. The majority
(about 75%) of the storms examined had mean motions
in the range from southwest (2258) through northwest
(3158C). Observation sites used for each storm were
those deemed closest to the storm path. Only obser-
vations taken before the storm appeared to influence
conditions at each site were used for this purpose.
Overlake conditions were derived from air and water
temperature data collected at National Oceanic Atmo-
spheric Administration (NOAA) buoy 45005 (Fig. 1) for
each storm when the buoy was operational (generally
April–November). All buoy data were acquired from
the National Data Buoy Center. Storms for which
buoy data were not available were excluded from any
analyses that included overlake conditions. Velocity
azimuth display (VAD) wind analyses provided in
the KCLE WSR-88D Level III dataset were used to
represent surface to 3-km and surface to 6-km wind
velocities.
3. Results
a. Temporal distribution of storms
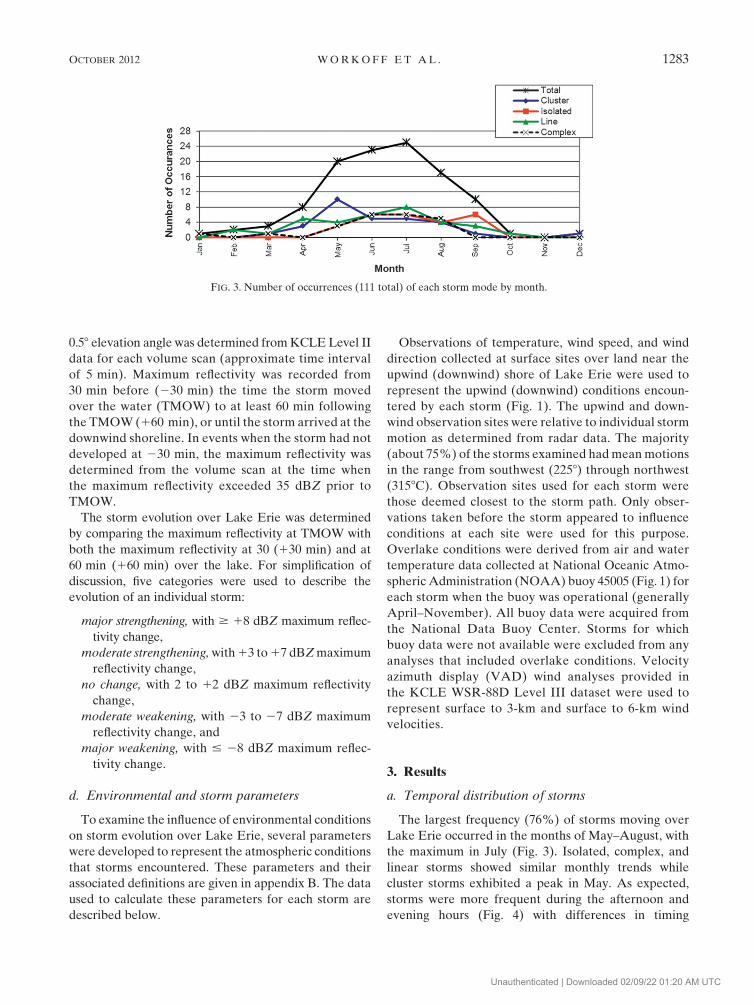
The largest frequency (76%) of storms moving over
Lake Erie occurred in the months of May–August, with
the maximum in July (Fig. 3). Isolated, complex, and
linear storms showed similar monthly trends while
cluster storms exhibited a peak in May. As expected,
storms were more frequent during the afternoon and
evening hours (Fig. 4) with differences in timing
FIG. 3. Number of occurrences (111 total) of each storm mode by month.
OCTOBER 2012 W O R K O F F E T A L . 1283
Unauthenticated | Downloaded 02/09/22 01:20 AM UTC
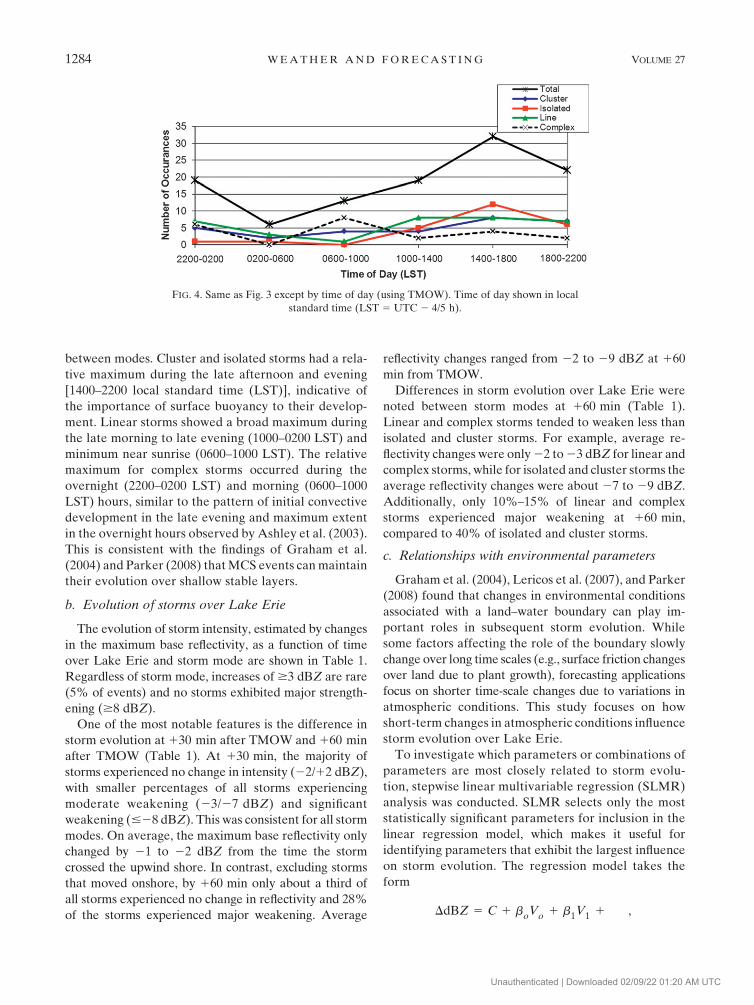
between modes. Cluster and isolated storms had a rela-
tive maximum during the late afternoon and evening
[1400–2200 local standard time (LST)], indicative of
the importance of surface buoyancy to their develop-
ment. Linear storms showed a broad maximum during
the late morning to late evening (1000–0200 LST) and
minimum near sunrise (0600–1000 LST). The relative
maximum for complex storms occurred during the
overnight (2200–0200 LST) and morning (0600–1000
LST) hours, similar to the pattern of initial convective
development in the late evening and maximum extent
in the overnight hours observed by Ashley et al. (2003).
This is consistent with the findings of Graham et al.
(2004) and Parker (2008) that MCS events can maintain
their evolution over shallow stable layers.
b. Evolution of storms over Lake Erie
The evolution of storm intensity, estimated by changes
in the maximum base reflectivity, as a function of time
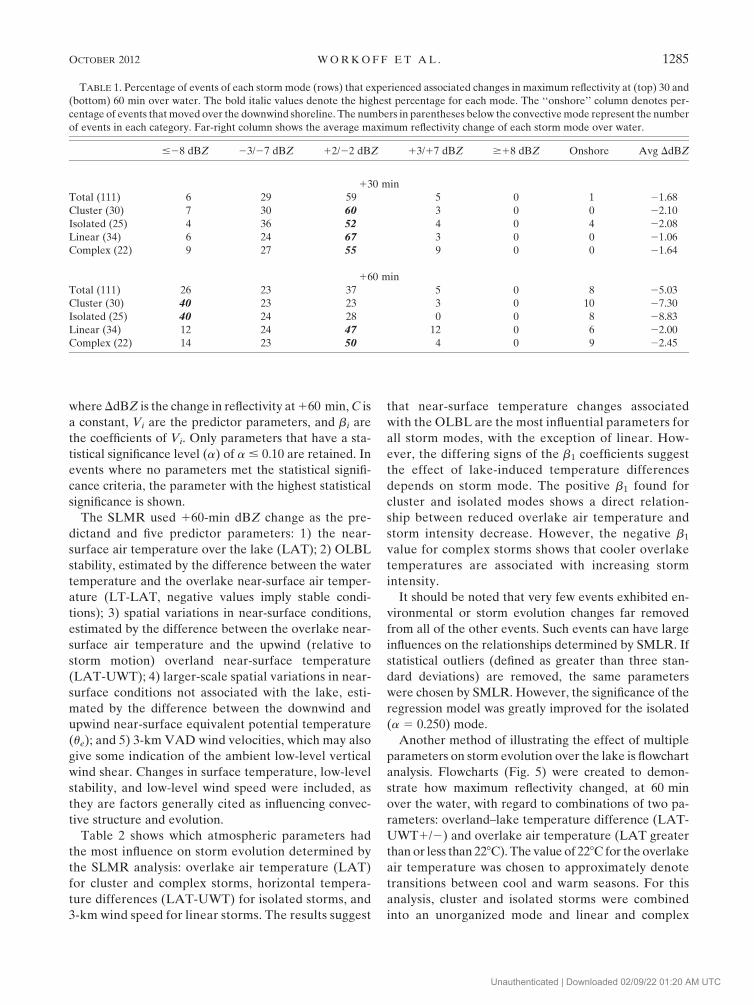
over Lake Erie and storm mode are shown in Table 1.
Regardless of storm mode, increases of $3 dBZ are rare
(5% of events) and no storms exhibited major strength-
ening ($8 dBZ).
One of the most notable features is the difference in
storm evolution at 130 min after TMOW and 160 min
after TMOW (Table 1). At 130 min, the majority of
storms experienced no change in intensity (22/12 dBZ),
with smaller percentages of all storms experiencing
moderate weakening (23/27 dBZ) and significant
weakening (#28 dBZ). This was consistent for all storm
modes. On average, the maximum base reflectivity only
changed by 21 to 22 dBZ from the time the storm
crossed the upwind shore. In contrast, excluding storms
that moved onshore, by 160 min only about a third of
all storms experienced no change in reflectivity and 28%
of the storms experienced major weakening. Average
reflectivity changes ranged from 22 to 29 dBZ at 160
min from TMOW.
Differences in storm evolution over Lake Erie were
noted between storm modes at 160 min (Table 1).
Linear and complex storms tended to weaken less than
isolated and cluster storms. For example, average re-
flectivity changes were only 22 to 23 dBZ for linear and
complex storms, while for isolated and cluster storms the
average reflectivity changes were about 27 to 29 dBZ.
Additionally, only 10%–15% of linear and complex
storms experienced major weakening at 160 min,
compared to 40% of isolated and cluster storms.
c. Relationships with environmental parameters
Graham et al. (2004), Lericos et al. (2007), and Parker
(2008) found that changes in environmental conditions
associated with a land–water boundary can play im-
portant roles in subsequent storm evolution. While
some factors affecting the role of the boundary slowly
change over long time scales (e.g., surface friction changes
over land due to plant growth), forecasting applications
focus on shorter time-scale changes due to variations in
atmospheric conditions. This study focuses on how
short-term changes in atmospheric conditions influence
storm evolution over Lake Erie.
To investigate which parameters or combinations of
parameters are most closely related to storm evolu-
tion, stepwise linear multivariable regression (SLMR)
analysis was conducted. SLMR selects only the most
statistically significant parameters for inclusion in the
linear regression model, which makes it useful for
identifying parameters that exhibit the largest influence
on storm evolution. The regression model takes the
form
DdBZ 5 C 1 boVo 1 b1V1 1 � � � ,
FIG. 4. Same as Fig. 3 except by time of day (using TMOW). Time of day shown in local
standard time (LST 5 UTC 2 4/5 h).
1284 W E A T H E R A N D F O R E C A S T I N G VOLUME 27
Unauthenticated | Downloaded 02/09/22 01:20 AM UTC
where DdBZ is the change in reflectivity at 160 min, C is
a constant, Vi are the predictor parameters, and bi are
the coefficients of Vi. Only parameters that have a sta-
tistical significance level (a) of a # 0.10 are retained. In
events where no parameters met the statistical signifi-
cance criteria, the parameter with the highest statistical
significance is shown.
The SLMR used 160-min dBZ change as the pre-
dictand and five predictor parameters: 1) the near-
surface air temperature over the lake (LAT); 2) OLBL
stability, estimated by the difference between the water
temperature and the overlake near-surface air temper-
ature (LT-LAT, negative values imply stable condi-
tions); 3) spatial variations in near-surface conditions,
estimated by the difference between the overlake near-
surface air temperature and the upwind (relative to
storm motion) overland near-surface temperature
(LAT-UWT); 4) larger-scale spatial variations in near-
surface conditions not associated with the lake, esti-
mated by the difference between the downwind and
upwind near-surface equivalent potential temperature
(ue); and 5) 3-km VAD wind velocities, which may also
give some indication of the ambient low-level vertical
wind shear. Changes in surface temperature, low-level
stability, and low-level wind speed were included, as
they are factors generally cited as influencing convec-
tive structure and evolution.
Table 2 shows which atmospheric parameters had
the most influence on storm evolution determined by
the SLMR analysis: overlake air temperature (LAT)
for cluster and complex storms, horizontal tempera-
ture differences (LAT-UWT) for isolated storms, and
3-km wind speed for linear storms. The results suggest
that near-surface temperature changes associated
with the OLBL are the most influential parameters for
all storm modes, with the exception of linear. How-
ever, the differing signs of the b1 coefficients suggest
the effect of lake-induced temperature differences
depends on storm mode. The positive b1 found for
cluster and isolated modes shows a direct relation-
ship between reduced overlake air temperature and
storm intensity decrease. However, the negative b1
value for complex storms shows that cooler overlake
temperatures are associated with increasing storm
intensity.
It should be noted that very few events exhibited en-
vironmental or storm evolution changes far removed
from all of the other events. Such events can have large
influences on the relationships determined by SMLR. If
statistical outliers (defined as greater than three stan-
dard deviations) are removed, the same parameters
were chosen by SMLR. However, the significance of the
regression model was greatly improved for the isolated
(a 5 0.250) mode.
Another method of illustrating the effect of multiple
parameters on storm evolution over the lake is flowchart
analysis. Flowcharts (Fig. 5) were created to demon-
strate how maximum reflectivity changed, at 60 min
over the water, with regard to combinations of two pa-
rameters: overland–lake temperature difference (LAT-
UWT1/2) and overlake air temperature (LAT greater
than or less than 228C). The value of 228C for the overlake
air temperature was chosen to approximately denote
transitions between cool and warm seasons. For this
analysis, cluster and isolated storms were combined
into an unorganized mode and linear and complex
TABLE 1. Percentage of events of each storm mode (rows) that experienced associated changes in maximum reflectivity at (top) 30 and
(bottom) 60 min over water. The bold italic values denote the highest percentage for each mode. The ‘‘onshore’’ column denotes per-
centage of events that moved over the downwind shoreline. The numbers in parentheses below the convective mode represent the number
of events in each category. Far-right column shows the average maximum reflectivity change of each storm mode over water.
#28 dBZ 23/27 dBZ 12/22 dBZ 13/17 dBZ $18 dBZ Onshore Avg DdBZ
130 min
Total (111) 6 29 59 5 0 1 21.68
Cluster (30) 7 30 60 3 0 0 22.10
Isolated (25) 4 36 52 4 0 4 22.08
Linear (34) 6 24 67 3 0 0 21.06
Complex (22) 9 27 55 9 0 0 21.64
160 min
Total (111) 26 23 37 5 0 8 25.03
Cluster (30) 40 23 23 3 0 10 27.30
Isolated (25) 40 24 28 0 0 8 28.83
Linear (34) 12 24 47 12 0 6 22.00
Complex (22) 14 23 50 4 0 9 22.45
OCTOBER 2012 W O R K O F F E T A L . 1285
Unauthenticated | Downloaded 02/09/22 01:20 AM UTC
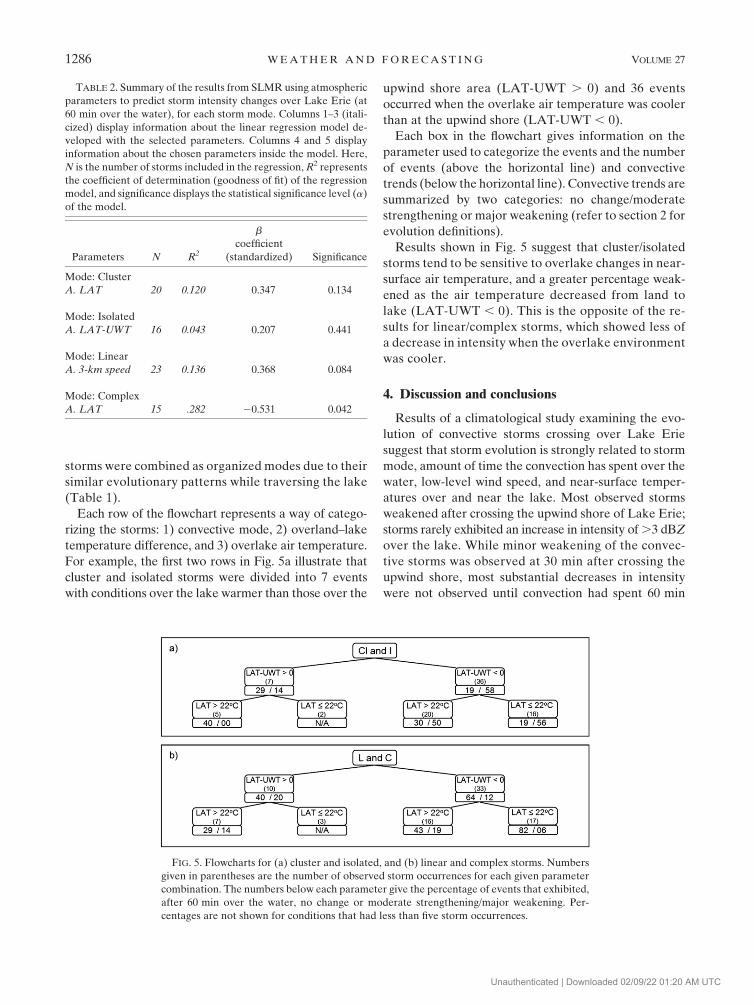
storms were combined as organized modes due to their
similar evolutionary patterns while traversing the lake
(Table 1).
Each row of the flowchart represents a way of catego-
rizing the storms: 1) convective mode, 2) overland–lake
temperature difference, and 3) overlake air temperature.
For example, the first two rows in Fig. 5a illustrate that
cluster and isolated storms were divided into 7 events
with conditions over the lake warmer than those over the
upwind shore area (LAT-UWT . 0) and 36 events
occurred when the overlake air temperature was cooler
than at the upwind shore (LAT-UWT , 0).
Each box in the flowchart gives information on the
parameter used to categorize the events and the number
of events (above the horizontal line) and convective
trends (below the horizontal line). Convective trends are
summarized by two categories: no change/moderate
strengthening or major weakening (refer to section 2 for
evolution definitions).
Results shown in Fig. 5 suggest that cluster/isolated
storms tend to be sensitive to overlake changes in near-
surface air temperature, and a greater percentage weak-
ened as the air temperature decreased from land to
lake (LAT-UWT , 0). This is the opposite of the re-
sults for linear/complex storms, which showed less of
a decrease in intensity when the overlake environment
was cooler.
4. Discussion and conclusions
Results of a climatological study examining the evo-
lution of convective storms crossing over Lake Erie
suggest that storm evolution is strongly related to storm
mode, amount of time the convection has spent over the
water, low-level wind speed, and near-surface temper-
atures over and near the lake. Most observed storms
weakened after crossing the upwind shore of Lake Erie;
storms rarely exhibited an increase in intensity of .3 dBZ
over the lake. While minor weakening of the convec-
tive storms was observed at 30 min after crossing the
upwind shore, most substantial decreases in intensity
were not observed until convection had spent 60 min
TABLE 2. Summary of the results from SLMR using atmospheric
parameters to predict storm intensity changes over Lake Erie (at
60 min over the water), for each storm mode. Columns 1–3 (itali-
cized) display information about the linear regression model de-
veloped with the selected parameters. Columns 4 and 5 display
information about the chosen parameters inside the model. Here,
N is the number of storms included in the regression, R2 represents
the coefficient of determination (goodness of fit) of the regression
model, and significance displays the statistical significance level (a)
of the model.
Parameters N R2
b
coefficient
(standardized) Significance
Mode: Cluster
A. LAT 20 0.120 0.347 0.134
Mode: Isolated
A. LAT-UWT 16 0.043 0.207 0.441
Mode: Linear
A. 3-km speed 23 0.136 0.368 0.084
Mode: Complex
A. LAT 15 .282 20.531 0.042
FIG. 5. Flowcharts for (a) cluster and isolated, and (b) linear and complex storms. Numbers
given in parentheses are the number of observed storm occurrences for each given parameter
combination. The numbers below each parameter give the percentage of events that exhibited,
after 60 min over the water, no change or moderate strengthening/major weakening. Per-
centages are not shown for conditions that had less than five storm occurrences.
1286 W E A T H E R A N D F O R E C A S T I N G VOLUME 27
Unauthenticated | Downloaded 02/09/22 01:20 AM UTC
over the water. This may reflect a common time scale for
atmospheric circulations associated with the convection
to incorporate surface-influenced air parcels and in-
fluence precipitation rates.
An important finding is that storm mode plays
a critical role on the amount of weakening that storms
experience while over Lake Erie. Cluster and isolated
storms tended to decrease in intensity much more
rapidly than linear and complex storms. This decrease
in intensity was found to be most strongly correlated
with the overlake near-surface air temperature (LAT)
and its relation to the overland air temperature (LAT-
UWT). Overlake air temperature and horizontal land–
lake temperature differences were diagnosed as the
most influential parameters by stepwise linear multi-
variate regression (SLMR). It is thought that these
relationships reflect the dependence of cluster and
isolated convection on local near-surface stability, in
agreement with their peak occurrence during times of
greatest surface heating: late afternoon and evening.
As a result, the majority of these storms were observed
to undergo substantial weakening while over the lake,
particularly when the overlake air temperature was
cooler than the upwind overland air temperature
(LAT-UWT , 0).
Linear and complex storms were shown to be less
sensitive to local lake-induced atmospheric changes and
more influenced by the 3-km wind speed. This finding
appears to be consistent with previous studies (Weisman
et al. 1988; Rotunno et al. 1988; Weisman and Rotunno
2004; Bryan et al. 2006) that suggest dependence be-
tween linear storm intensity and low-level vertical wind
shear.
While the relationship between surface temperatures
and intensity changes of the storms tended to be weaker
than 3-km wind speed for linear and complex storm
modes, surface temperatures did exhibit an interesting
influence. The rate of decrease of reflectivity within
linear and complex storms was inversely correlated
with land–lake air temperature differences. SLMR
found this relationship to be nonstatistically signifi-
cant. However, this relationship is supported by the
flowchart analyses, which showed that organized (lin-
ear and complex) storms maintained intensity more
often in events where the OLBL was cooler (relative to
land). These results are in agreement with the earlier
observational results of Graham et al. (2004) for Lake
Michigan and the idealized modeling results of Parker
(2008).
It is important to note that the data used in this study
do not capture potentially important features in the
synoptic environment associated with the storms. Features
such as elevated or midlevel instability, or the location of
the convection relative to the original convective forcing,
could not always be determined. Indeed, preliminary
examination of storm environments suggested that
complex-mode storms were generally found to form
north of surface warm fronts or during the local over-
night/morning hours, suggesting that a majority of them
are elevated. This would likely result in minimal in-
teractions with the OLBL. This is a topic of that should
be explored in more detail in future studies. It would
also be anticipated that the thermodynamic structure
within the OLBL, as well as its depth, which could not
be determined in this study, play significant roles in
storm evolution over Lake Erie.
The influences of the OLBL on convective storms are
anticipated to be different depending on the size of the
water body. For the Great Lakes it is possible that in
events where the OLBL is highly stable, unstable air
from nearby land areas may move over the OLBL and
help maintain the convective storm. This seems likely
for organized convective storms, where bore propaga-
tion atop a highly stable OLBL would work to lift un-
stable air atop the OLBL. For an oceanic coastal region,
no downwind shore is available to maintain convective
buoyancy. Further observational and numerical model-
ing studies of convective changes over lakes of various
sizes and convective types are needed. To fully un-
derstand the mechanisms influencing convective storm
evolution over a water body, further investigation of the
relative importance of the sources and sinks of buoyant
energy would be highly beneficial.
Finally, smaller-scale variations in surface conditions
can play important roles in storm evolution. For exam-
ple, lake surface temperatures can vary rapidly with
time and space over a lake. Likewise, spatial variations
in atmospheric conditions, such as stability and wind
characteristics, could not be investigated with currently
available observational datasets. Future studies should
seek to quantify the influences of such surface and at-
mospheric conditions on storm evolution over the Great
Lakes.
Acknowledgments. This research was supported by
the National Science Foundation Mesoscale and Dy-
namic Meteorology Program (Grant ATM 07-11033)
and the Cooperative Meteorology, Education, and
Training (COMET) program (Grant COM UCAR S09-
71437). We appreciate the comments and suggestions
from Michael Timlin and James Angel from the Uni-
versity of Illinois at Urbana–Champaign, the anonymous
reviewers, and the editor. This manuscript represents
the opinions of the authors and does not necessarily
reflect the views of the funding agencies or the authors’
affiliations.
OCTOBER 2012 W O R K O F F E T A L . 1287
Unauthenticated | Downloaded 02/09/22 01:20 AM UTC
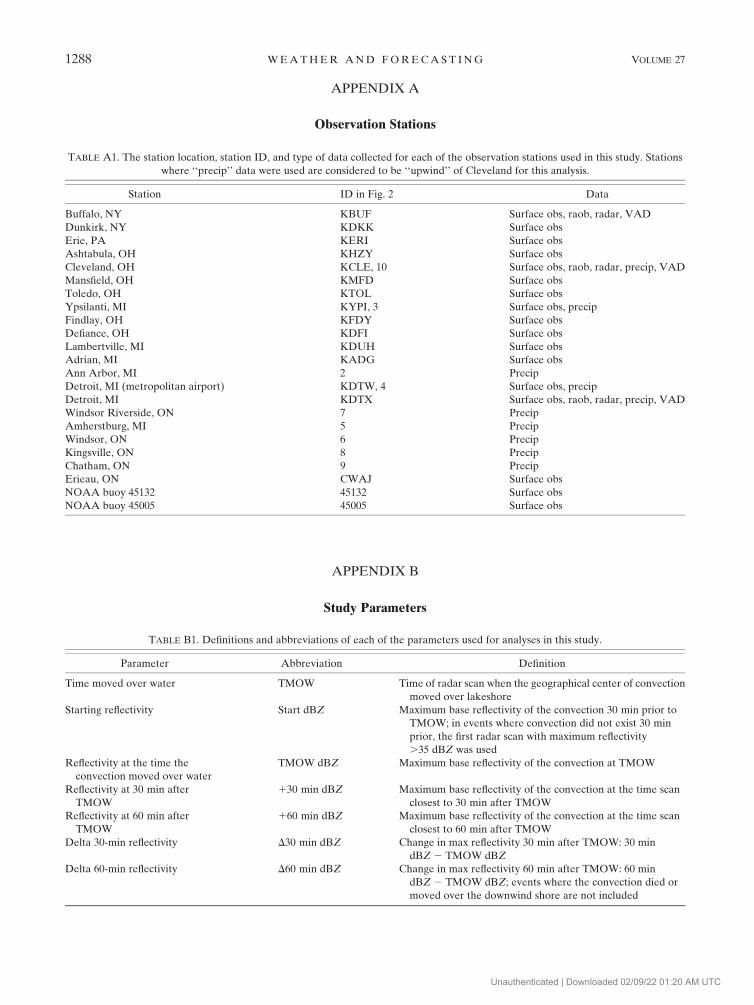
APPENDIX A
Observation Stations
APPENDIX B
Study Parameters
TABLE A1. The station location, station ID, and type of data collected for each of the observation stations used in this study. Stations
where ‘‘precip’’ data were used are considered to be ‘‘upwind’’ of Cleveland for this analysis.
Station ID in Fig. 2 Data
Buffalo, NY KBUF Surface obs, raob, radar, VAD
Dunkirk, NY KDKK Surface obs
Erie, PA KERI Surface obs
Ashtabula, OH KHZY Surface obs
Cleveland, OH KCLE, 10 Surface obs, raob, radar, precip, VAD
Mansfield, OH KMFD Surface obs
Toledo, OH KTOL Surface obs
Ypsilanti, MI KYPI, 3 Surface obs, precip
Findlay, OH KFDY Surface obs
Defiance, OH KDFI Surface obs
Lambertville, MI KDUH Surface obs
Adrian, MI KADG Surface obs
Ann Arbor, MI 2 Precip
Detroit, MI (metropolitan airport) KDTW, 4 Surface obs, precip
Detroit, MI KDTX Surface obs, raob, radar, precip, VAD
Windsor Riverside, ON 7 Precip
Amherstburg, MI 5 Precip
Windsor, ON 6 Precip
Kingsville, ON 8 Precip
Chatham, ON 9 Precip
Erieau, ON CWAJ Surface obs
NOAA buoy 45132 45132 Surface obs
NOAA buoy 45005 45005 Surface obs
TABLE B1. Definitions and abbreviations of each of the parameters used for analyses in this study.
Parameter Abbreviation Definition
Time moved over water TMOW Time of radar scan when the geographical center of convection
moved over lakeshore
Starting reflectivity Start dBZ Maximum base reflectivity of the convection 30 min prior to
TMOW; in events where convection did not exist 30 min
prior, the first radar scan with maximum reflectivity
.35 dBZ was used
Reflectivity at the time the
convection moved over water
TMOW dBZ Maximum base reflectivity of the convection at TMOW
Reflectivity at 30 min after
TMOW
130 min dBZ Maximum base reflectivity of the convection at the time scan
closest to 30 min after TMOW
Reflectivity at 60 min after
TMOW
160 min dBZ Maximum base reflectivity of the convection at the time scan
closest to 60 min after TMOW
Delta 30-min reflectivity D30 min dBZ Change in max reflectivity 30 min after TMOW: 30 min
dBZ 2 TMOW dBZ
Delta 60-min reflectivity D60 min dBZ Change in max reflectivity 60 min after TMOW: 60 min
dBZ 2 TMOW dBZ; events where the convection died or
moved over the downwind shore are not included
1288 W E A T H E R A N D F O R E C A S T I N G VOLUME 27
Unauthenticated | Downloaded 02/09/22 01:20 AM UTC
REFERENCES
Ashley, W. S., T. L. Mote, P. G. Dixon, S. L. Trotter, E. J. Powell,
J. D. Durkee, and A. J. Grundstein, 2003: Distribution of
mesoscale convective complex rainfall in the United States.
Mon. Wea. Rev., 131, 3003–3017.
Augustine, J. A., W. L. Woodley, R. W. Scott, and S. A. Changnon,
1994: Using geosynchronous satellite imagery to estimate
summer-season rainfall over the Great Lakes. J. Great Lakes
Res., 20, 683–700.
Bryan, G. H., J. C. Knievel, and M. D. Parker, 2006: A multimodel
assessment of RKW theory’s relevance to squall-line charac-
teristics. Mon. Wea. Rev., 134, 2772–2792.
Fowle, M. A., and P. J. Roebber, 2003: Short-range (0–48 h) nu-
merical prediction of convective occurrence, mode, and loca-
tion. Wea. Forecasting, 18, 782–794.
Gallus, W. A., Jr., N. A. Snook, and E. V. Johnson, 2008: Spring
and summer severe weather reports over the Midwest as
a function of convective mode: A preliminary study. Wea.
Forecasting, 23, 101–113.
Graham, R., M. Bentley, J. Sparks, B. Dukesherer, and J. Evans,
2004: Lower Michigan MCS climatology: Trends, pattern
types, and marine layer impacts. Preprints, 22nd Conf. on
Severe Local Storms, Hyannis, MA, Amer. Meteor. Soc., 7B.6.
[Available online at http://ams.confex.com/ams/pdfpapers/
81343.pdf.]
Laing, A. G., and J. M. Fritsch, 1997: The global population of
mesoscale convective complexes. Quart. J. Roy. Meteor. Soc.,
123, 389–405.
Lericos, T. P., H. E. Fuelberg, M. L. Weisman, and A. I. Watson,
2007: Numerical simulations of the effects of coastlines on the
evolution of strong, long-lived squall lines. Mon. Wea. Rev.,
135, 1710–1731.
Parker, M. D., 2008: Response of simulated squall lines to low-level
cooling. J. Atmos. Sci., 65, 1323–1341.
Rotunno, R., J. B. Klemp, and M. L. Weisman, 1988: A theory for
strong, long-lived squall lines. J. Atmos. Sci., 45, 463–485.
Scott, R. W., and F. A. Huff, 1996: Impacts of the Great Lakes
on regional climate conditions. J. Great Lakes Res., 22, 845–
863.
Weisman, M. L., and R. Rotunno, 2004: ‘‘A theory for strong,
long-lived squall lines’’ revisited. J. Atmos. Sci., 61, 361–
382.
——, J. B. Klemp, and R. Rotunno, 1988: Structure and evolution
of numerically simulated squall lines. J. Atmos. Sci., 45, 1990–
2013.
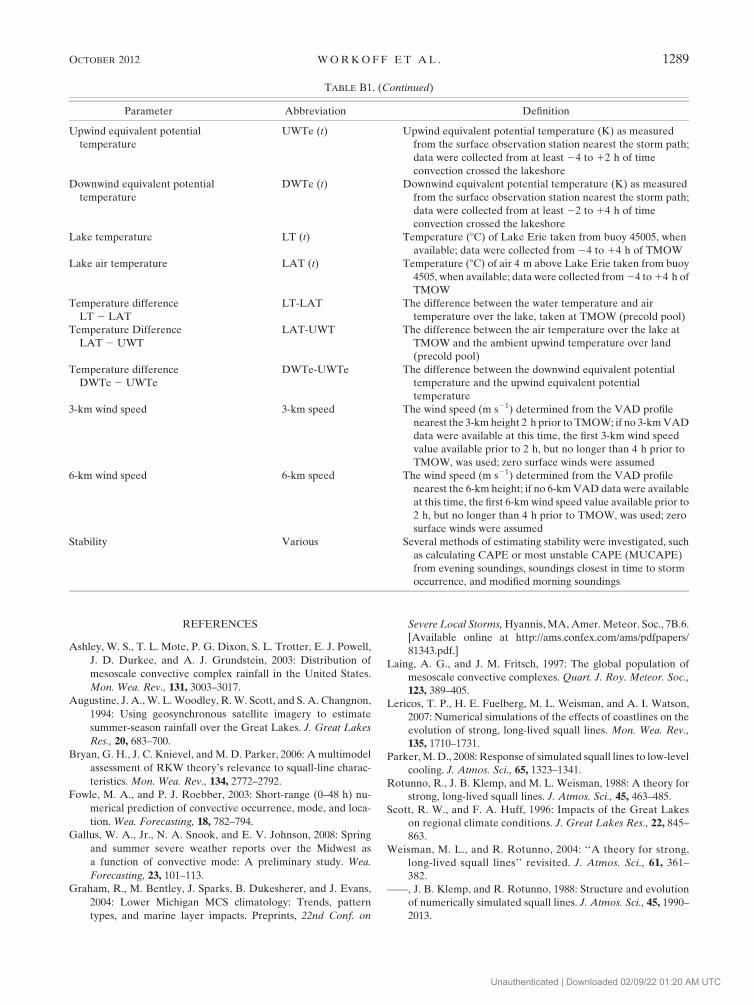
TABLE B1. (Continued)
Parameter Abbreviation Definition
Upwind equivalent potential
temperature
UWTe (t) Upwind equivalent potential temperature (K) as measured
from the surface observation station nearest the storm path;
data were collected from at least 24 to 12 h of time
convection crossed the lakeshore
Downwind equivalent potential
temperature
DWTe (t) Downwind equivalent potential temperature (K) as measured
from the surface observation station nearest the storm path;
data were collected from at least 22 to 14 h of time
convection crossed the lakeshore
Lake temperature LT (t) Temperature (8C) of Lake Erie taken from buoy 45005, when
available; data were collected from 24 to 14 h of TMOW
Lake air temperature LAT (t) Temperature (8C) of air 4 m above Lake Erie taken from buoy
4505, when available; data were collected from 24 to 14 h of
TMOW
Temperature difference
LT 2 LAT
LT-LAT The difference between the water temperature and air
temperature over the lake, taken at TMOW (precold pool)
Temperature Difference
LAT 2 UWT
LAT-UWT The difference between the air temperature over the lake at
TMOW and the ambient upwind temperature over land
(precold pool)
Temperature difference
DWTe 2 UWTe
DWTe-UWTe The difference between the downwind equivalent potential
temperature and the upwind equivalent potential
temperature
3-km wind speed 3-km speed The wind speed (m s21) determined from the VAD profile
nearest the 3-km height 2 h prior to TMOW; if no 3-km VAD
data were available at this time, the first 3-km wind speed
value available prior to 2 h, but no longer than 4 h prior to
TMOW, was used; zero surface winds were assumed
6-km wind speed 6-km speed The wind speed (m s21) determined from the VAD profile
nearest the 6-km height; if no 6-km VAD data were available
at this time, the first 6-km wind speed value available prior to
2 h, but no longer than 4 h prior to TMOW, was used; zero
surface winds were assumed
Stability Various Several methods of estimating stability were investigated, such
as calculating CAPE or most unstable CAPE (MUCAPE)
from evening soundings, soundings closest in time to storm
occurrence, and modified morning soundings
OCTOBER 2012 W O R K O F F E T A L . 1289
Unauthenticated | Downloaded 02/09/22 01:20 AM UTC