Embed Size (px)
Citation preview

ORIGINAL PAPER
Inulin and oligofructose as fat and sugar substitutesin quick breads (scones): a mixture design approach
Christian Roßle • Anastasia Ktenioudaki •
Eimear Gallagher
Received: 23 March 2011 / Revised: 23 May 2011 / Accepted: 24 May 2011 / Published online: 7 June 2011
� Springer-Verlag 2011
Abstract Mixture (D-optimal) design was used to
investigate the effects of prebiotics such as inulin and
oligofructose as fat and sugar replacers on quality param-
eters of quick breads (scones). Crust and crumb colour
increased with the inclusion of prebiotics. Higher concen-
tration of inulin and oligofructose in quick breads also
showed a slight increase in crust and crumb hardness. Loaf
volume significantly increased with the inclusion of pre-
biotics. The optimization tool indicated that by using a
mixture of margarine (3.53%), oligofructose Orafti� L95
(10%), caster sugar (0.55%) and inulin Orafti� GR
(5.92%), a quick bread with similar baking properties and
textural attributes to the control can be achieved. The
mixture design was successfully used to reduce the original
levels of 10% fat and 10% sugar (percentages are based on
flour weight). The calculated model performance indices
accuracy factor and bias factor of the predicted quick-bread
formulations showed a high applicability of the model. The
variations between the predicted and experimental values
obtained were within the acceptable error range, as
depicted by the average mean deviation. Therefore, the
predictive performance of the established model may be
considered acceptable.
Keywords Oligofructose � Inulin � Fat � Sugar �Replacer � Substitute � Mixture design � Quick bread
Introduction
Over the last number of years, a trend is emerging towards
healthier foods, in particular in the cereal area due to
increasing consumer awareness. Quick breads such as tra-
ditional scones are a popular product in Ireland, UK, USA
and elsewhere. They are consumed by people of all ages
and are characterized by a soft texture and sweet flavour.
Typically, quick breads would be consumed within 24 h of
baking. However, due to their fat (10%) and sugar (10%)
levels, regular consumption can lead to high energy intake
and may cause dental problems, obesity, type-2 diabetes,
high blood cholesterol and coronary heart disease [1]. Fat
and sugar are important ingredients in the formulation of
scones as they contribute to essential quality attributes such
as texture, flavour and appearance. Replacing these con-
stituents without affecting the quality characteristics poses
a significant technical challenge. Carbohydrate-based fat
mimetics are under investigation by a number of
researchers as they have been reported to form a gel-like
matrix in the presence of substantial levels of water,
resulting in lubricant and flow properties similar to those of
fats [2]. Inulin and oligofructose have been reported as
potential ingredients to imitate the functional and sensorial
properties of fat and sugar, while at the same time pro-
viding high-quality baked products with considerably
fewer calories. In addition, oligofructose and inulin can be
classified as functional ingredients as they are described as
prebiotics and have been defined as ‘selectively fermented
ingredients that allow specific changes, both in the com-
position and/or activity in the gastrointestinal microbiota
that confers benefits upon host well-being’ [3]. These
beneficial effects however are indirectly caused, as prebi-
otics selectively feed one or a limited number of micro-
organisms, thus causing a selective modification of the
C. Roßle (&) � A. Ktenioudaki � E. Gallagher
Teagasc Food Research Centre, Ashtown, Dublin 15, Ireland
e-mail: [email protected]
123
Eur Food Res Technol (2011) 233:167–181
DOI 10.1007/s00217-011-1514-9
host’s intestinal microflora [4]. Probiotic micro-organisms
such as lactobacilli and bifidobacteria are examples of the
bacteria that are being stimulated [5].
Several attempts have recently been made to use func-
tional ingredients such as prebiotics to substitute fat and
sugar, in particular in cookies [6, 7], biscuits [8, 9] and
breads [10, 11], and the results are promising. However, to
date, no work has been undertaken to substitute the fat and
sugar of widely consumed quick breads with prebiotics.
Therefore, the objective of this study was to characterize
and optimize the effects of oligofructose and inulin
as healthier alternatives to fat and sugar in quick
breads (scones) through the application of mixture design
methodology.
Materials and methods
Quick-bread preparation
Cream (weak) flour (Odlum Group Ltd, Dublin, Ireland),
baking powder (Dr. Oetker Ireland Ltd, Dublin, Ireland),
salt (Premier Foods Group Ltd, Long Sutton, UK) and
margarine (Irish Bakels Ltd, Dunshaughlin, Co. Meath,
Ireland; Table 1) were initially mixed in a Kenwood pre-
mier chef (Kenwood Ltd, Havant, UK) mixing machine
with a K-beater attachment for 1 min. A solution con-
taining caster sugar and/or oligofructose (Orafti� L95;
Beneo-Orafti, Tienen, Belgium) and/or inulin (Orafti�
GR), and milk (low fat 1.7%; purchased in a local super-
market; Table 1) were then added to the dry mixture and
mixed for a further 1 min until the dough was formed.
Orafti� L95 is a syrup containing mainly oligofructose
produced by partial enzymatic hydrolysis of chicory inulin,
while Orafti� GR is a granulated powder consisting mainly
of chicory inulin. Table 2 represents the experimental
design for the four variable components (X1 = margarine,
X2 = oligofructose, X3 = caster sugar and X4 = inulin).
The dough was allowed to rest for 20 min and rolled out to
a thickness of 1.3 cm. A round cutter (6.5 cm diameter)
was used to cut out the dough pieces which were then
placed on a silicon tray. The scones were baked for 17 min
at 2108C (Tom Chandley Ovens, Manchester, UK) and left
to cool for 2 h on a cooling tray for further analysis. The
experimental design was set up using Design expert 7.1.6
(Stat-Ease Inc., Minneapolis, MN, USA). Assessment of
error was derived from two replications of fine treatment
combinations.
Quality measurements
Quick-bread samples (based on 500 g of flour) were pre-
pared as previously described. Nine breads were produced
per formulation (1–24; Table 2). Five of these were used
for bread volume, crust/crumb colour and crust texture.
The remaining four were sliced (1.5 cm thickness; two
slices per scone) and used for crumb texture, C-Cell crumb
imaging and moisture measurements.
Table 1 Formulations used in quick-bread (scone) formulation
Material Compositiona (%)
Cream (weak) flour 100
Baking powder 4
Salt 0.25
Milk (low fat 1.7%) 60
Fat 0–10 (Table 2)
Oligofructose (Orafti� L95) 0–10 (Table 2)
Caster sugar 0–10 (Table 2)
Inulin (Orafti� GR) 0–10 (Table 2)
a % Values are based on the total flour weight (100 g)
Table 2 Experimental design of four components in quick-bread
formulation
Design
point
Margarine
(X1)
Oligofructose
L95 (X2)
Caster sugar
(X3)
Inulin GR
(X4)
1 0 6.67 6.67 6.67
2 2.5 7.5 7.5 2.5
3 3.33 3.33 3.33 10
4 7.5 2.5 7.5 2.5
5 10 0 0 10
6 10 0 0 10
7 6.67 0 6.67 6.67
8 10 3.33 3.33 3.33
9 6.67 6.67 6.67 0
10 10 10 0 0
11 5 5 5 5
12 10 0 10 0
13 3.33 3.33 10 3.33
14 0 10 0 10
15 0 0 10 10
16 10 0 10 0
17 6.67 6.67 0 6.67
18 7.5 2.5 2.5 7.5
19 0 10 10 0
20 0 10 0 10
21 0 0 10 10
22 3.33 10 3.33 3.33
23 7.5 7.5 2.5 2.5
24 0 10 10 0
Where X1 ? X2 ? X3 ? X4 = 20%
168 Eur Food Res Technol (2011) 233:167–181
123

Bread volume
Quick-bread volumes of five replicates per experiment
were measured with a TexVol volume meter (BVM-L370,
TexVol Instruments, Viken, Sweden). Analysis was carried
out using VolCalc 3.2.3.10.
Crumb and crust colour
Crust and crumb colour were measured using a HunterLab
Ultrascan XE colorimeter (Hunterlab, Reston, VA, USA).
Readings were obtained as a three-dimensional L*, a*, b*
colour solid and expressed as browning index (BI) according
to Buera and others [12], as shown in Eq. 1 below.
BI ¼ 100ðx� 0:31Þ=0:172 where
x ¼ a � þ1:75L=ð5:645L � þ a � �3:012b�Þ ð1Þ
Crumb and crust texture
Crust and crumb hardness was measured using a Texture
Analyzer TA-XT2i (TAXT2i, Stable Micro Systems, Sur-
rey, UK). For crust hardness (penetration, stainless steel
cylindrical probe; 6 mm diameter; test speed 3 mm/s), the
crust was removed from the five quick-bread samples from
each experiment. Crumb hardness (texture profile analysis
[TPA], cylindrical LAP perspex probe; 20 mm diameter;
test speed 1 mm/s, 40% strain) was measured on five slices
of 1.5 cm thickness for each experiment. Results for crust
and crumb hardness were expressed in N.
C-Cell image analysis
The C-Cell Imaging System (Calibre Control Interna-
tional LTD, Warrington, UK) was used to acquire, under
Table 3 Regression models for quality parameters of quick-breads
Independent
variable
Dependent variable
Crust
colour
(Y1)
Crumb
colour (Y2)
Crust
hardness
(Y3)
Crumb
hardness
(Y4)
Crumb
moisture
(Y5)
Bread
volume
(Y6)
Area of
cells
(Y7)
Average
cell volume
(Y8)
Texture non-
uniformity
(Y9)
Margarine (X1) 264.79 64.02 2.07 5.31 35.06 111.92 45.55 1.47 5.71
Oligof. L95
(X2)
203.50 45.83 -2.79 0.82 42.09 148.44 56.94 9.42 3.78
Sugar (X3) 254.58 53.40 -3.63 -0.37 40.95 173.29 58.75 10.20 12.2
Inulin GR (X4) 146.67 49.70 2.81 4.42 36.70 149.51 53.87 10.02 3.41
Marg/L95 (X1/
X2)
-482.82 -43.48 8.37 9.86 16.60 -139.52 -6.81 2.33 -15.23
Marg/sug
(X1/X3)
-633.28 -64.39 17.30 18.65 8.23 -206.74 -8.83 1.41 -33.19
Marg/GR
(X1/X4)
-472.50 -57.91 -0.12 9.27 18.37 -137.95 -0.93 0.94 -14.94
L95/sug
(X2/X3)
-422.17 -26.64 27.73 27.29 -0.47 -268.45 -25.05 -10.12 -27.97
L95/GR
(X2/X4)
-151.31 -14.51 14.60 18.45 6.62 -194.25 -16.19 -9.71 -12.27
Sug/GR
(X3/X4)
-419.75 -47.12 18.17 26.62 2.81 -250.68 -17.05 -8.51 -25.77
Marg/L95/sug
(X1/X2/X3)
964.57 10.81 -44.54 -16.24 -20.86 413.38 23.08 0.90 51.43
Marg/L95/GR
(X1/X2/X4)
824.86 69.50 -33.16 -65.8 -10.02 334.86 51.49 41.37 36.10
Marg/L95/GR
(X1/X3/X4)
621.31 113.13 -51.00 -67.77 -11.33 359.05 -5.40 -11.28 41.13
L95/sug/GR
(X2/X3/X4)
123.26 6.06 -18.29 -32.6 -12.09 419.18 4.27 -8.53 33.25
R2 0.88 0.88 0.87 0.82 0.94 0.87 0.87 0.80 0.85
p (model) 0.005 0.005 0.006 0.026 0.0002 0.005 0.007 0.04 0.01
p (lack of fit) 0.11 0.16 0.47 0.36 0.93 0.29 0.21 0.26 0.14
Eur Food Res Technol (2011) 233:167–181 169
123

standardized conditions, high-resolution images of quick-
bread slices (1.5 cm thickness). Crumb grain properties of
the slices were calculated using the dedicated software (C-
Cell, Version 2 Software, Calibre Control International
LTD, Warrington, UK), where quality attributes such as
area of cells (as a percentage of the total slice area),
average cell volume and texture non-uniformity were
determined.
Table 4 Mean and standard deviation of quality parameters
Experiments
No.
Bread
volume
(mL)
Crust
colour (BI)
Crumb
colour
(BI)
Crust
hardness
(N)
Crumb
hardness
(N)
Area of
cells (%)
Average cell
volume (mm3)
Texture non-
uniformity
Crumb
moisture
(%)
1 94.1 ± 2.3 101.0 ± 4.7 40.0 ± 1.0 4.9 ± 0.5 8.5 ± 0.9 50.5 ± 0.5 6.6 ± 0.6 0.4 ± 0.03 40.4 ± 0.2
2 91.6 ± 0.8 89.0 ± 2.4 39.6 ± 0.3 3.5 ± 0.7 7.9 ± 0.9 49.9 ± 0.2 6.2 ± 0.4 0.6 ± 0.17 41.4 ± 0.2
3 98.8 ± 1.4 88.7 ± 3.1 40.5 ± 0.9 3.5 ± 0.6 7.0 ± 0.6 50.6 ± 0.7 7.0 ± 0.5 0.6 ± 0.01 40.4 ± 0.1
4 94.7 ± 2.1 87.8 ± 2.9 40.7 ± 0.7 2.5 ± 0.2 6.9 ± 0.5 49.6 ± 0.6 6.3 ± 0.4 0.9 ± 0.12 40.9 ± 0.2
5 97.2 ± 2.6 85.4 ± 1.5 42.2 ± 0.4 2.5 ± 0.2 7.4 ± 0.4 49.4 ± 0.6 5.7 ± 0.6 1.0 ± 0.11 40.6 ± 0.2
6 95.4 ± 3.7 86.9 ± 1.7 42.3 ± 0.9 2.3 ± 0.4 6.9 ± 0.3 49.4 ± 0.8 6.1 ± 0.6 0.7 ± 0.14 40.3 ± 0.1
7 91.6 ± 1.7 75.9 ± 4.6 40.6 ± 0.8 2.7 ± 0.3 6.8 ± 0.4 49.5 ± 0.3 5.9 ± 0.5 0.5 ± 0.16 40.3 ± 0.4
8 91.3 ± 1.3 107.3 ± 3.2 43.0 ± 0.9 2.7 ± 0.6 6.6 ± 0.7 48.9 ± 0.5 5.5 ± 0.5 0.8 ± 0.13 40.6 ± 0.6
9 92.0 ± 2.0 112.8 ± 2 40.1 ± 0.7 2.9 ± 0.6 7.5 ± 0.9 50.4 ± 1.7 6.5 ± 0.9 0.6 ± 0.06 41.2 ± 0.3
10 95.3 ± 2.3 112.0 ± 2.3 44.3 ± 0.7 1.7 ± 0.2 5.5 ± 0.3 49.4 ± 0.4 6.0 ± 0.4 0.9 ± 0.08 42.7 ± 0.1
11 95.4 ± 1.8 90.0 ± 2.2 41.4 ± 0.4 2.1 ± 0.3 5.4 ± 0.2 49.7 ± 0.9 6.3 ± 0.3 0.7 ± 0.16 41.1 ± 0.1
12 92.1 ± 2.6 101.8 ± 1.9 42.5 ± 0.8 3.0 ± 0.1 6.7 ± 0.4 49.7 ± 1.1 6.1 ± 0.6 0.5 ± 0.16 40.4 ± 0.1
13 99.7 ± 2.1 111.1 ± 4.1 40.8 ± 0.3 2.8 ± 0.5 6.7 ± 0.5 51.4 ± 1.0 7.1 ± 1.0 1.8 ± 0.13 40.7 ± 0.4
14 99.2 ± 2.1 136.1 ± 3.2 45.0 ± 0.4 3.2 ± 0.5 7.0 ± 0.3 51.6 ± 0.9 7.4 ± 0.4 0.6 ± 0.26 40.8 ± 0.1
15 98.5 ± 2.6 99.9 ± 3.7 40.2 ± 0.9 4.0 ± 0.3 8.0 ± 1.0 52.6 ± 0.3 8.6 ± 0.6 1.4 ± 0.30 39.2 ± 0.2
16 89.3 ± 2.2 101.5 ± 0.7 42.9 ± 0.5 4.1 ± 0.5 7.5 ± 0.5 50.2 ± 0.5 6.2 ± 0.5 0.9 ± 0.07 39.7 ± 0.1
17 96.8 ± 2.5 110.5 ± 1.9 42.5 ± 0.8 2.3 ± 0.5 5.5 ± 0.2 51.2 ± 1.3 7.6 ± 0.7 0.9 ± 0.08 42.1 ± 0.3
18 94.1 ± 2.8 102.8 ± 3.6 43.2 ± 0.1 1.8 ± 0.5 6.3 ± 0.5 50.6 ± 0.7 7.5 ± 0.2 0.6 ± 0.02 41.0 ± 0.3
19 93.0 ± 2.1 121.5 ± 2.7 43.2 ± 0.7 3.7 ± 0.1 6.9 ± 0.5 51.7 ± 0.9 7.3 ± 0.5 1.0 ± 0.05 41.6 ± 0.3
20 101.5 ± 3.3 137.6 ± 1.7 43.4 ± 0.8 4.0 ± 0.9 7.4 ± 0.6 51.1 ± 0.5 7.2 ± 0.5 0.5 ± 0.13 41.3 ± 0.2
21 98.9 ± 1.8 90.2 ± 3.5 39.4 ± 1.0 4.2 ± 0.3 9.4 ± 0.9 51.5 ± 0.8 7.3 ± 0.6 1.3 ± 0.27 39.9 ± 0.3
22 98.7 ± 1.6 116.7 ± 5.1 40.9 ± 0.8 2.5 ± 0.4 6.3 ± 0.2 51.4 ± 0.7 7.3 ± 0.5 0.6 ± 0.09 41.8 ± 0.2
23 93.9 ± 2.9 109.8 ± 0.8 41.0 ± 0.8 2.0 ± 0.5 5.9 ± 0.9 50.5 ± 0.6 6.5 ± 0.8 1.2 ± 0.08 42.0 ± 0.1
24 95.2 ± 2.7 127.1 ± 1.1 42.8 ± 0.7 3.6 ± 0.7 7.0 ± 0.3 51.6 ± 1.2 7.3 ± 0.9 1.0 ± 0.01 41.2 ± 0.4
Table 5 Pearson’s correlation matrix between quick-bread properties
Bread
volume
Crust
colour
Crumb
colour
Crust
hardness
Crumb
hardness
Area of
cells
Average cell
volume
Texture non-
uniformity
Crumb
moisture
Bread volume 1
Crust colour 0.32 1
Crumb colour 0.01 0.55** 1
Crust hardness 0.08 0.11 -0.28 1
Crumb hardness 0.07 -0.18 -0.47* 0.81*** 1
Area of cells 0.54** 0.51* -0.06 0.45* 0.26 1
Average cell volume 0.56** 0.42* -0.05 0.31 0.16 0.94*** 1
Non-uniformity 0.28 0.01 -0.19 0.01 0.10 0.41* 0.31 1
Crumb moisture 0.03 0.43* 0.31 -0.53** -0.65*** -0.07 -0.07 -0.12 1
* Significant at p \ 0.05
** Significant at p \ 0.01
*** Significant at p \ 0.001
170 Eur Food Res Technol (2011) 233:167–181
123
Crumb moisture
Crumb moisture analyses were carried out in duplicates
according to the official AACC method 62.05 [13]. The
crust of quick-bread slices (1.5 cm thickness) was
removed. The remaining crumb was air-dried for 24 h at
room temperature in a secure room/environment. The dried
crumb was then milled and sieved (sieve size:
1,680 microns) to obtain a homogenous crumb. Ten grams
of ground crumb were placed in Brabender aluminium
dishes and dried at 130 �C for 2 h in a Brabender oven
(Brabender GmbH & Co. KG, Duisburg, Germany). Total
moisture was calculated from air drying and Brabender
drying steps and expressed as %.
Experimental design and data analysis
Mixture experiments were designed and analysed by using
the software Design expert 7.1.6. The effects of ingredient
proportions on baked product characteristics were studied
with a D-optimal design (Table 2) for the 4-component
mixture systems with constraints which comprised mar-
garine (X1), Oligofructose Orafti� L95 (X2), caster sugar
(X3) and Inulin Orafti� GR (X4). The constraints (lower
and upper) for each ingredient were established following
extensive preliminary trials (0–10% for each of the four
components) and according to a traditional quick bread
(scone) recipe containing 10% fat and 10% sugar, as rec-
ommended by The Baking Academy Of Ireland (Dublin,
Ireland). The mixture design was constructed to enable the
study of the effects of margarine, oligofructose, caster
sugar and inulin; all of which were restricted at the total
maximum of 20% of total flour weight. After data collec-
tion, Scheffe’s special cubic model for four components
(Eq. 2) was used to model the responses.
Y ¼ b1x1 þ b2x2 þ b3x3 þ b4x4
þ b12x1x2 þ b13x1x3 þ b14x1x4 þ b23x2x3 þ b24x2x4
þ b34x3x4 þ b123x1x2x3 þ b124x1x2x4
þ b134x1x3x4 þ b234x2x3x4 ð2Þ
where Y is the predicted dependent variable; b, the equa-
tion coefficients; X, the proportions of pseudo-components.
The dependent variables, bread volume (Y1), crust colour
(Y2), crumb colour (Y3), crust hardness (Y4), crumb hard-
ness (Y5), area of cells (Y6), average cell volume (Y7),
texture non-uniformity (Y8) and crumb moisture (Y9), were
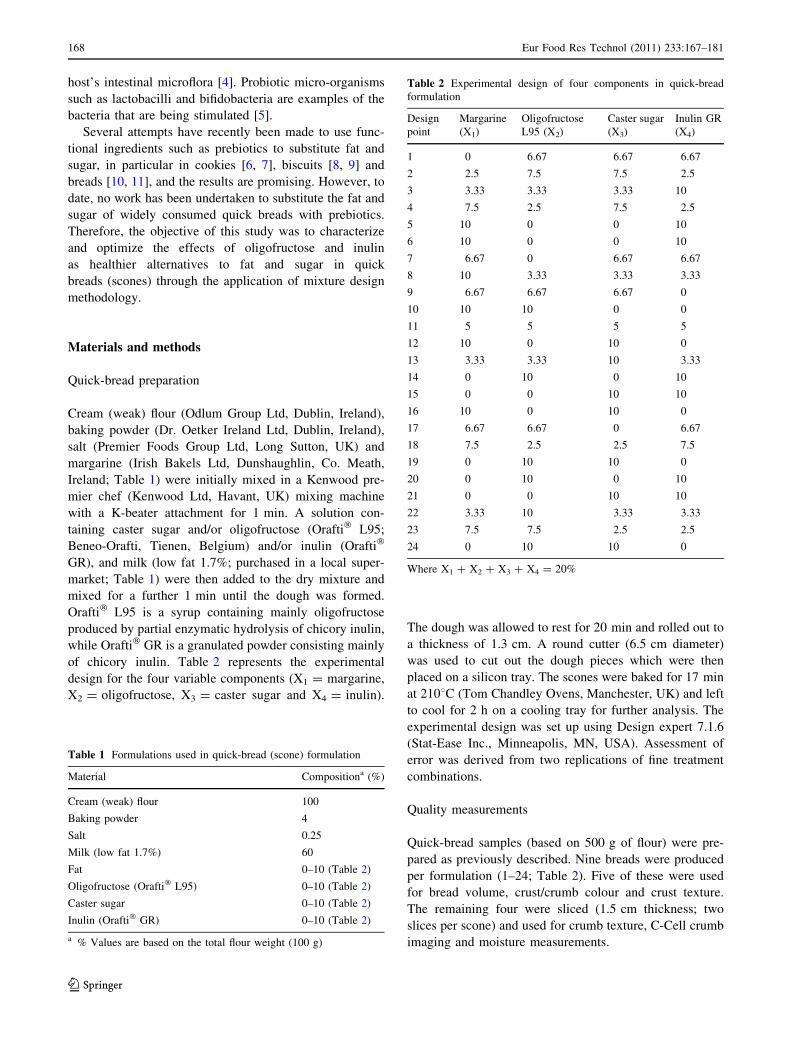
Fig. 1 3D contour plots of bread volume expressed in mL (a margarine; b oligofructose; c sugar; d inulin)
Eur Food Res Technol (2011) 233:167–181 171
123
analysed. The models were subject to variance analysis
(ANOVA) to determine the significance (P \ 0.05),
determination coefficient (R2) and lack of fit.
Model validation
The predictive performance of the developed models,
describing the effects of the mixture components with the
dependent variables margarine (X1), oligofructose (X2),
sugar (X3) and inulin (X4) on independent variables (bread
volume, crust and crumb colour, crust and crumb hardness,
area of cells, average cell volume, texture non-uniformity
and crumb moisture) of quick breads, was validated. The
assessments were carried out by calculating the model per-
formance indices, as described by Hossain et al. [14]:
accuracy factor (AF, Eq. [3a] and bias factor (BF, Eq. [3b]).
AF ¼ 10
Plog VP=VEj j
ne ð3aÞ
BF ¼ 10
Plog VP=VEð Þ
ne ð3bÞ
The criterion used to characterize the fitting efficiency of
the data to the model was the average mean deviation (E) [15]
Eð%Þ ¼ 1
ne
Xn
i¼1
VE � VP
VE
����
����� 100 ð4Þ
where E is the average mean deviation, ne is the number of
experimental data, VE is the experimental value and VP is
the calculated value.
Results and discussion
Table 2 presents the mixture design for the 24 formulations
which underwent quality analysis. The experimental results
obtained by the special cubic model for all responses were
statistically evaluated, and the calculated regression coef-
ficients are shown in Table 3. Mean values for the nine
responses analysed (crust and crumb colour, crust and
crumb texture, crumb moisture, bread volume, area of
cells, average volume of cells and texture non-uniformity)
are listed in Table 4. For comparison purposes, experiment
12 and 16 represent the control formulation. To establish
an accurate model, it is required to replicate some data
points (usually extremes/maximum). As outlined in
Table 1, the following experiments are equivalent:
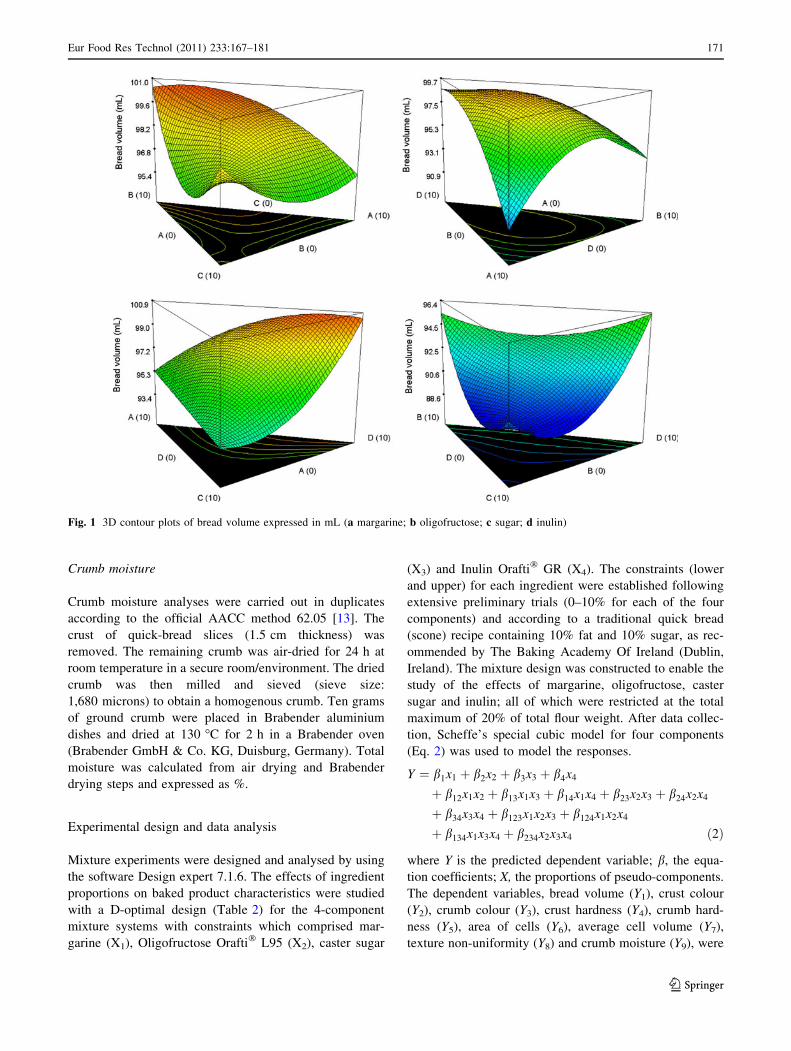
Fig. 2 3D contour plots of crust colour expressed as browning index (a margarine; b oligofructose; c sugar; d inulin)
172 Eur Food Res Technol (2011) 233:167–181
123
experiment 5 = 6; 12 = 16; 14 = 20; 15 = 21; 19 = 24.
Pearson‘s correlation coefficients which were determined
by analysis of variance (ANOVA) are shown in Table 5.
All the models were statistically significant, with satisfac-
tory coefficients of determination (R2) and the lack of fit
showing no significance throughout the model.
Bread volume
Volume of quick breads is significant criteria for consumer
acceptability. As shown in Table 4 and Fig. 1, the highest
bread volume (101.5 mL) was achieved by replacing fat
and sugar completely with inulin and oligofructose. This is
significantly higher compared with the control formula-
tions 12 and 16 which showed a combined average volume
of 90.7 mL. Similar results were obtained and reported by
Hager et al. [16] and Peressini and Sensidoni [17]. This
was also confirmed by the optimization tool which pre-
dicted an optimum volume of 100.4 mL with 10% inulin,
10% oligofructose and 0% fat and sugar if all other
responses are not taken into account.
Crust and crumb colour
The crust and crumb colour of breads is generally a key
quality attribute for consumer acceptance. Crust colour
varied significantly among the experiments, as shown in
Table 4 and Fig. 2. Higher values for browning index
indicate a darker appearance. The browning index (BI) for
crust colour varied from 75.9 to 136.1 (Table 4). A general
trend emerged that higher concentrations of inulin and
oligofructose led to a higher BI (Fig. 2). This is a well-
reported phenomenon, as the addition of oligosaccharides
accelerates caramelization and Maillard reaction and
therefore speeds up the formation of bread crust colour.
[11]. However, the mixture design optimization tool indi-
cated that a BI of 107 can be achieved by minimizing
margarine (0%), sugar (2.75%) and maximizing oligo-
fructose (7.25%) and inulin (10%) if all other dependent
variables are disregarded. If compared with control
experiments (12 and 16) which showed a browning index
of approx. 101, the slight increase in crust colour would be
considered to be acceptable in practical terms.
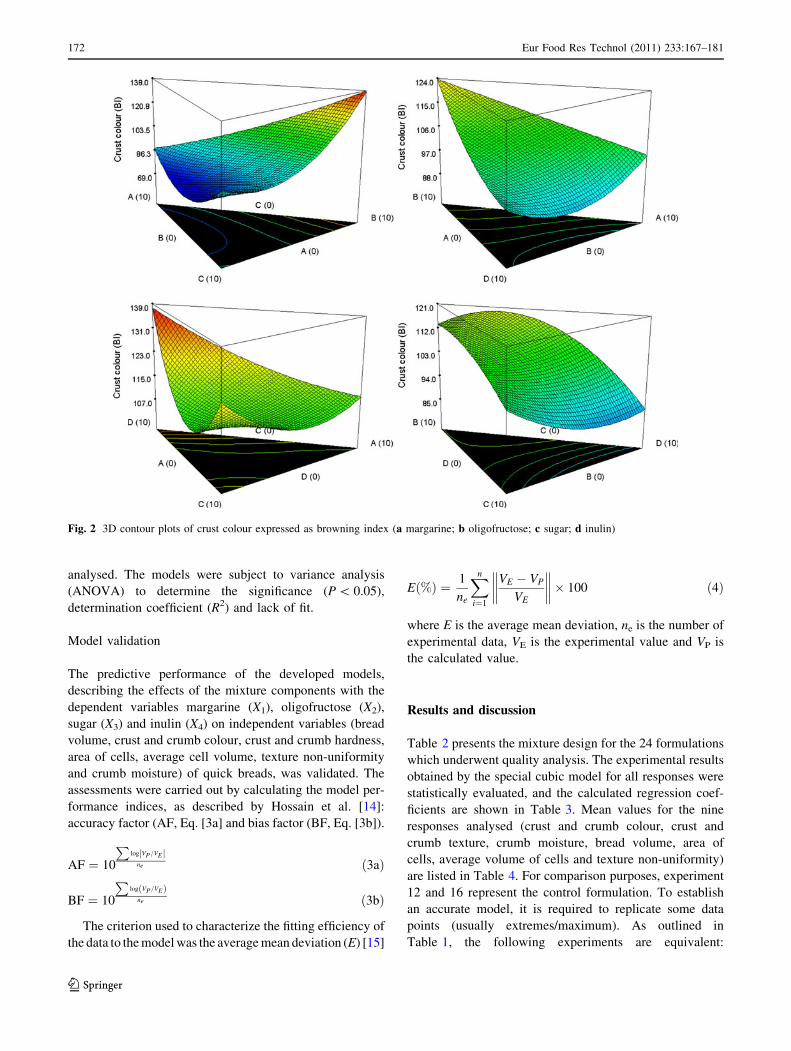
Fig. 3 3D contour plots of crumb colour expressed as browning index (a margarine; b oligofructose; c sugar; d inulin)
Eur Food Res Technol (2011) 233:167–181 173
123
For crumb colour, the effects of substitution of fat and
sugar with prebiotics were less significant as those for crust
colour. BI for crumb colour ranged from 39.6 to 45
(Table 4); the differences are not obvious to the human
eye. Similar to crust colour, higher concentration of oli-
gosaccharides but also sugar led to an increase in BI, as
shown in Fig. 3, again due to non-enzymatic browning
reactions. This explains the occurrence of a significant
correlation (r2 = 0.55) between crust and crumb colour.
Large changes for crumb colour were not expected as it is
usually similar to the colour of the fat/sugar replacers
(prebiotics did not change colour of liquid ingredients)
used, because the crumb does not reach as high tempera-
tures as the crust. To optimize in terms of crumb colour, to
the same requirements as for crust colour the predicted BI
of 41.9 can be achieved with margarine (0%), oligofructose
(9.35%) sugar (2.31%) and inulin (8.34%).
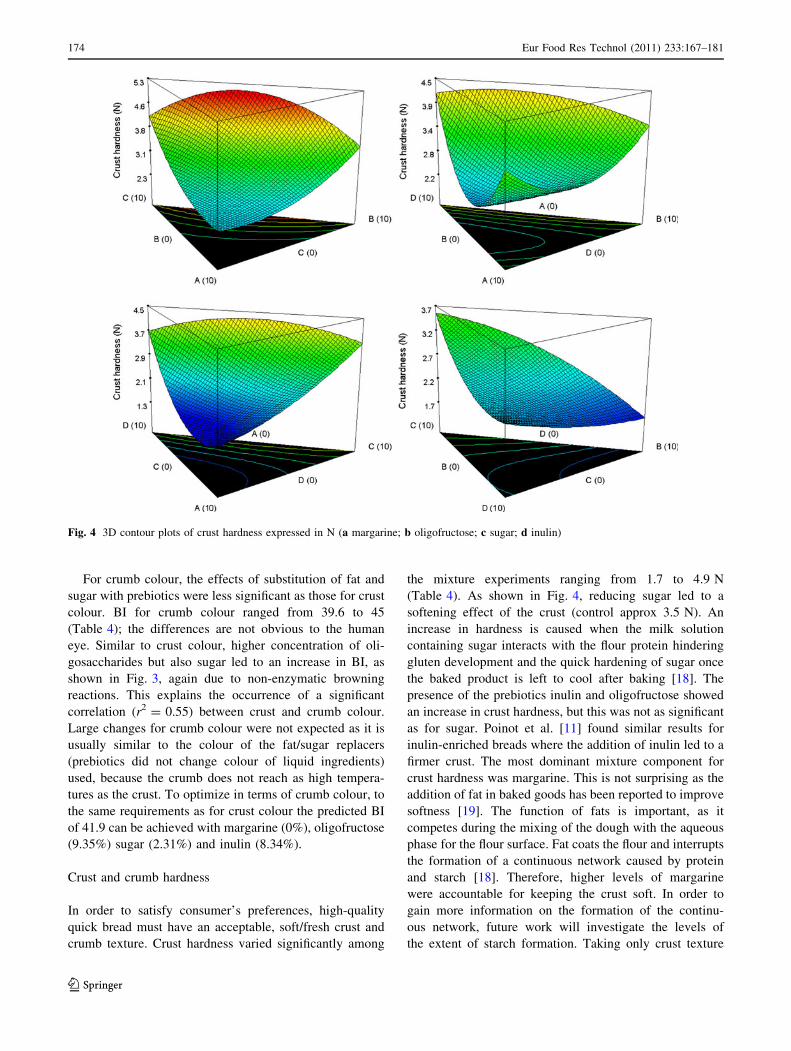
Crust and crumb hardness
In order to satisfy consumer’s preferences, high-quality
quick bread must have an acceptable, soft/fresh crust and
crumb texture. Crust hardness varied significantly among
the mixture experiments ranging from 1.7 to 4.9 N
(Table 4). As shown in Fig. 4, reducing sugar led to a
softening effect of the crust (control approx 3.5 N). An
increase in hardness is caused when the milk solution
containing sugar interacts with the flour protein hindering
gluten development and the quick hardening of sugar once
the baked product is left to cool after baking [18]. The
presence of the prebiotics inulin and oligofructose showed
an increase in crust hardness, but this was not as significant
as for sugar. Poinot et al. [11] found similar results for
inulin-enriched breads where the addition of inulin led to a
firmer crust. The most dominant mixture component for
crust hardness was margarine. This is not surprising as the
addition of fat in baked goods has been reported to improve
softness [19]. The function of fats is important, as it
competes during the mixing of the dough with the aqueous
phase for the flour surface. Fat coats the flour and interrupts
the formation of a continuous network caused by protein
and starch [18]. Therefore, higher levels of margarine
were accountable for keeping the crust soft. In order to
gain more information on the formation of the continu-
ous network, future work will investigate the levels of
the extent of starch formation. Taking only crust texture
Fig. 4 3D contour plots of crust hardness expressed in N (a margarine; b oligofructose; c sugar; d inulin)
174 Eur Food Res Technol (2011) 233:167–181
123
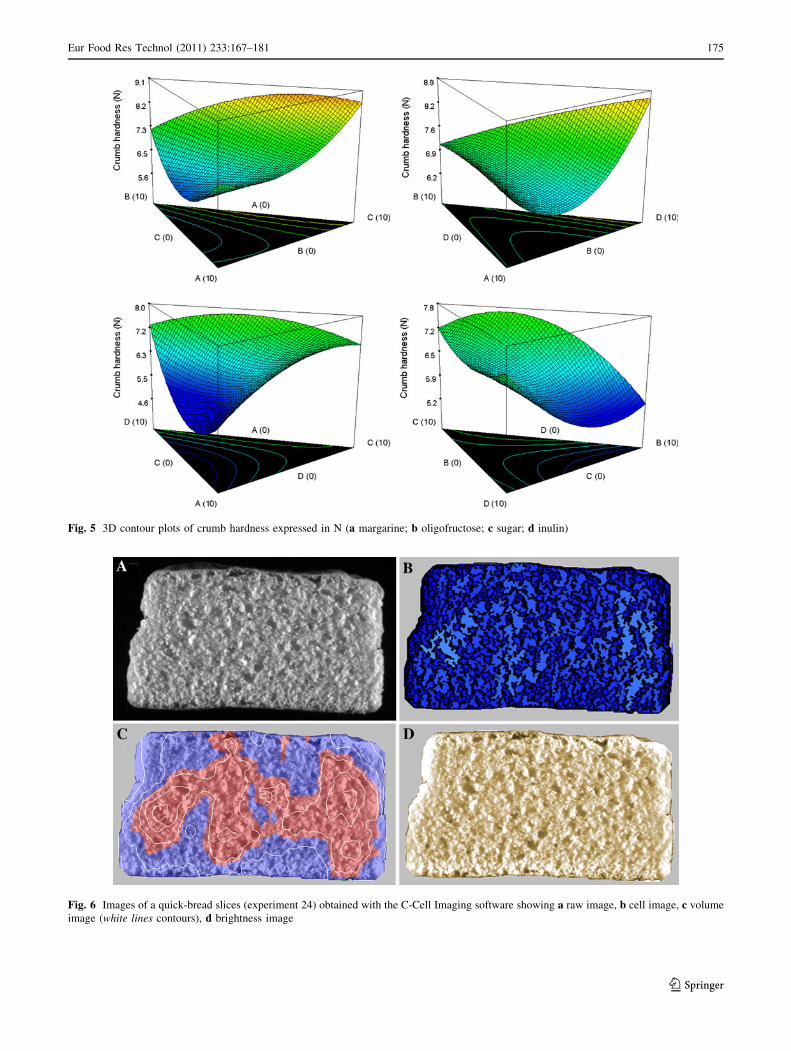
Fig. 5 3D contour plots of crumb hardness expressed in N (a margarine; b oligofructose; c sugar; d inulin)
Fig. 6 Images of a quick-bread slices (experiment 24) obtained with the C-Cell Imaging software showing a raw image, b cell image, c volume
image (white lines contours), d brightness image
Eur Food Res Technol (2011) 233:167–181 175
123

into account by using the optimization tool, an accept-
able low fat/sugar product can be reached with a crust
hardness of 2.83 N with a mixture of 1.5% margarine,
10% oligofructose, 0% sugar and 8.49% inulin. This is
similar to the control which had an approximate hardness
of 3.5 N.
Crumb hardness also showed variations due to changes
in the four components and ranged from 5.4 to 9.4 N
(Table 4). Similarly to the crust hardness, higher levels of
sugar and oligosaccharides increased the crumb hardness
(Fig. 5). Again this is due to the same reasons as outlined
for crust hardness. Similar observations for bread were
made by other authors where the inclusion of prebiotics
increased crumb hardness [10]. Increasing concentrations
of fat again led to a softening of the crumb. Crumb hard-
ness correlated well with crust hardness (r2 = 0.81). The
margarine used in this study serves a function to emulsify
the liquid in the formulation [20], and therefore fats con-
tribute to the soft and tender eating properties. However, in
order to reduce fat and sugar, a crumb hardness of 6.5 N is
made possible with 1.04% margarine, 10% oligofructose,
0% sugar and 8.96% inulin, which is softer compared with
the control (7.1 N).
Crumb image analysis (area of cells, average cell
volume, texture non-uniformity)
The C-Cell Imaging system was used to assess the crumb
grain characteristics of 1.5 cm slices of quick breads from
each of the 24 formulations. The results for area of cells,
average cell volume and texture non-uniformity were
obtained from images, as shown in Fig. 6. As the fat and
sugar levels in the quick-bread formulations are changing
significantly, it is important to gain a good understanding
as to the effects on crumb grain, as both of these ingredi-
ents are highly influential.
Area of cells was determined, as it represents total area
of cells as a percentage of the slice area. Large values
indicate a more open texture. The value nevertheless pro-
vides a measurement of the relative visual appearance of
slices. The area of cells varied significantly among the 24
experiments ranging from 48.9 to 52.6% (Table 4). The
components that most affected this result were in particular
sugar and oligosaccharides. As shown in Fig. 7, an
increasing amount of sugar and oligosaccharides led to a
higher area of cells and therefore indicating a more open
texture. Sugar is well known to influence structural and
Fig. 7 3D contour plots of area of cells expressed in % (a margarine; b oligofructose; c sugar; d inulin)
176 Eur Food Res Technol (2011) 233:167–181
123
textural properties of baked goods. A more open texture
with a higher sugar content and the positive correlation
(r2 = 0.54) with the bread volume was found. A correla-
tion between the area of cells and crust colour (r2 = 0.51)
and crust hardness (r2 = 0.45) was noticed. This is most
likely due to the fact that higher sugar levels will influence
the distribution of water in the product and accelerate
Maillard reaction, thus influencing both the texture and the
appearance of the crumb grain.
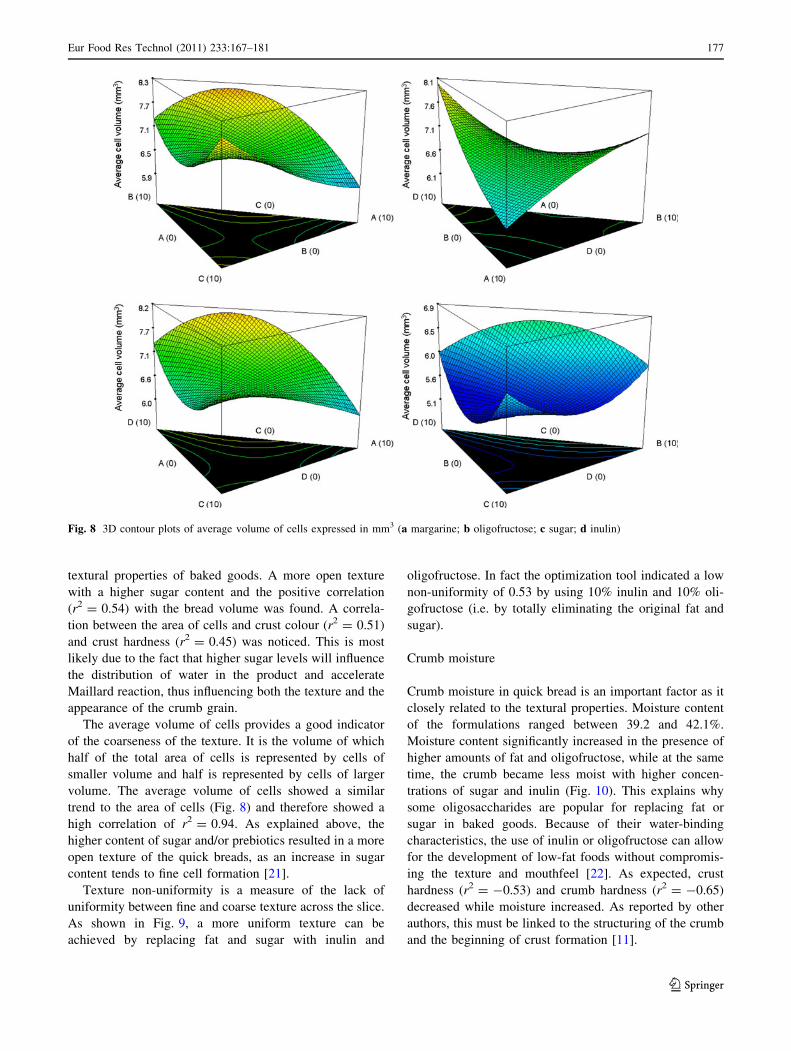
The average volume of cells provides a good indicator
of the coarseness of the texture. It is the volume of which
half of the total area of cells is represented by cells of
smaller volume and half is represented by cells of larger
volume. The average volume of cells showed a similar
trend to the area of cells (Fig. 8) and therefore showed a
high correlation of r2 = 0.94. As explained above, the
higher content of sugar and/or prebiotics resulted in a more
open texture of the quick breads, as an increase in sugar
content tends to fine cell formation [21].
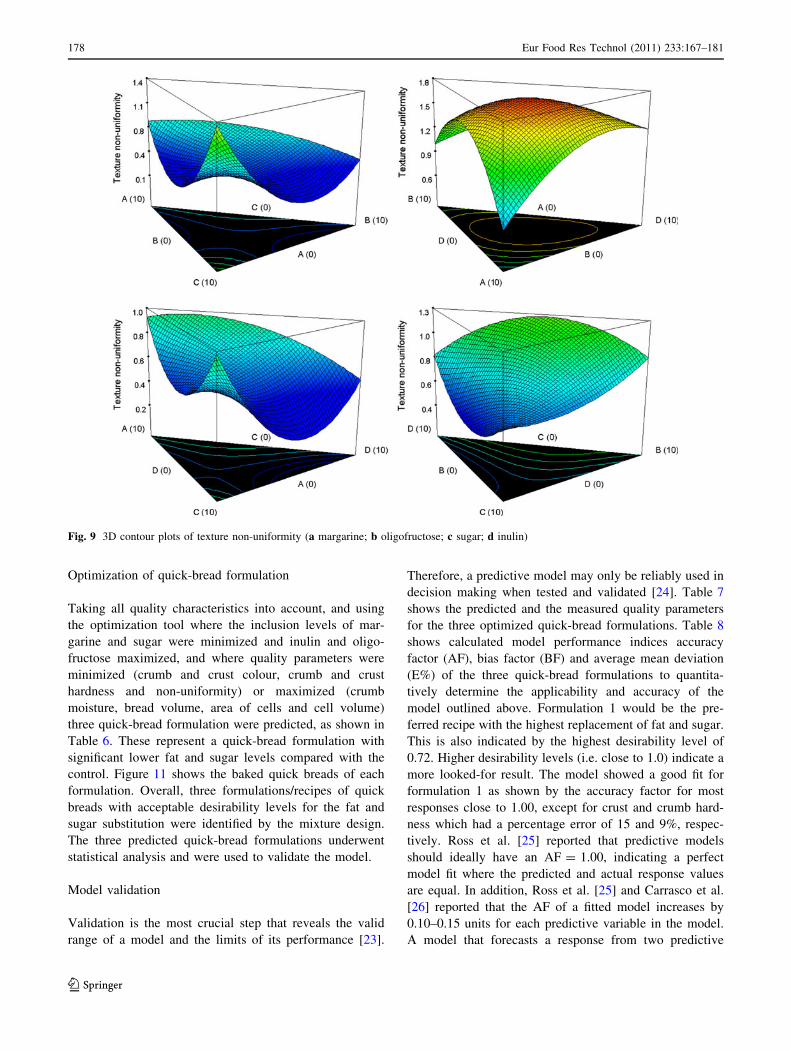
Texture non-uniformity is a measure of the lack of
uniformity between fine and coarse texture across the slice.
As shown in Fig. 9, a more uniform texture can be
achieved by replacing fat and sugar with inulin and
oligofructose. In fact the optimization tool indicated a low
non-uniformity of 0.53 by using 10% inulin and 10% oli-
gofructose (i.e. by totally eliminating the original fat and
sugar).
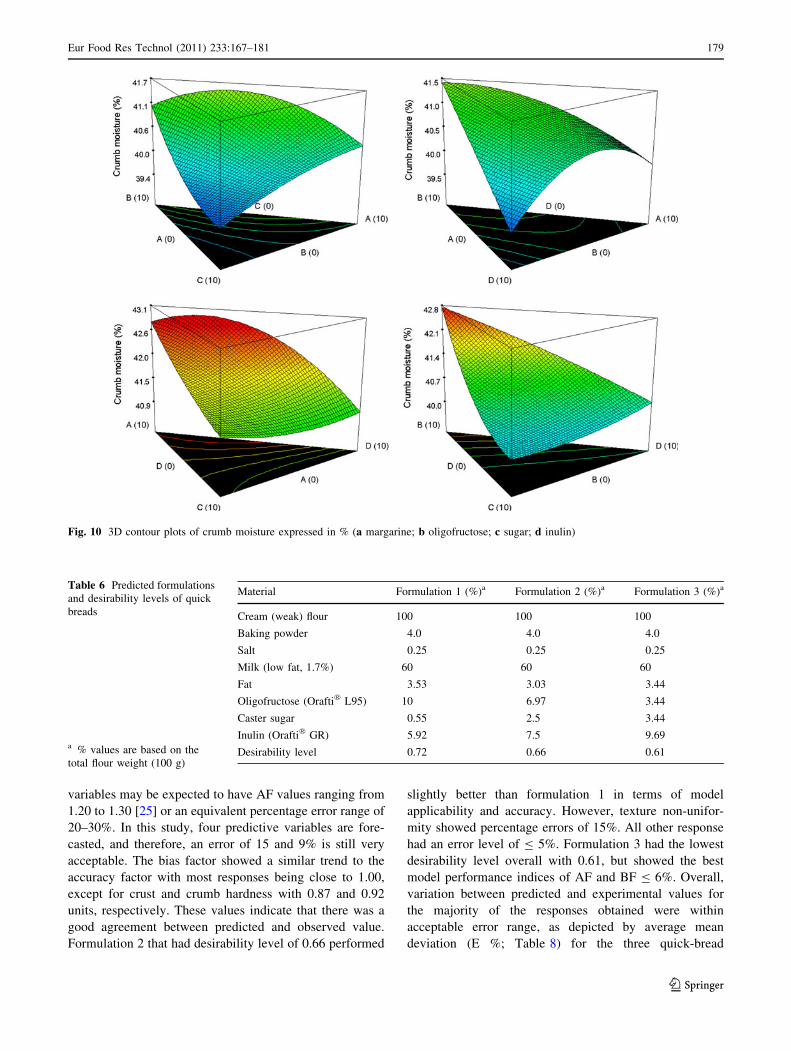
Crumb moisture
Crumb moisture in quick bread is an important factor as it
closely related to the textural properties. Moisture content
of the formulations ranged between 39.2 and 42.1%.
Moisture content significantly increased in the presence of
higher amounts of fat and oligofructose, while at the same
time, the crumb became less moist with higher concen-
trations of sugar and inulin (Fig. 10). This explains why
some oligosaccharides are popular for replacing fat or
sugar in baked goods. Because of their water-binding
characteristics, the use of inulin or oligofructose can allow
for the development of low-fat foods without compromis-
ing the texture and mouthfeel [22]. As expected, crust
hardness (r2 = -0.53) and crumb hardness (r2 = -0.65)
decreased while moisture increased. As reported by other
authors, this must be linked to the structuring of the crumb
and the beginning of crust formation [11].
Fig. 8 3D contour plots of average volume of cells expressed in mm3 (a margarine; b oligofructose; c sugar; d inulin)
Eur Food Res Technol (2011) 233:167–181 177
123
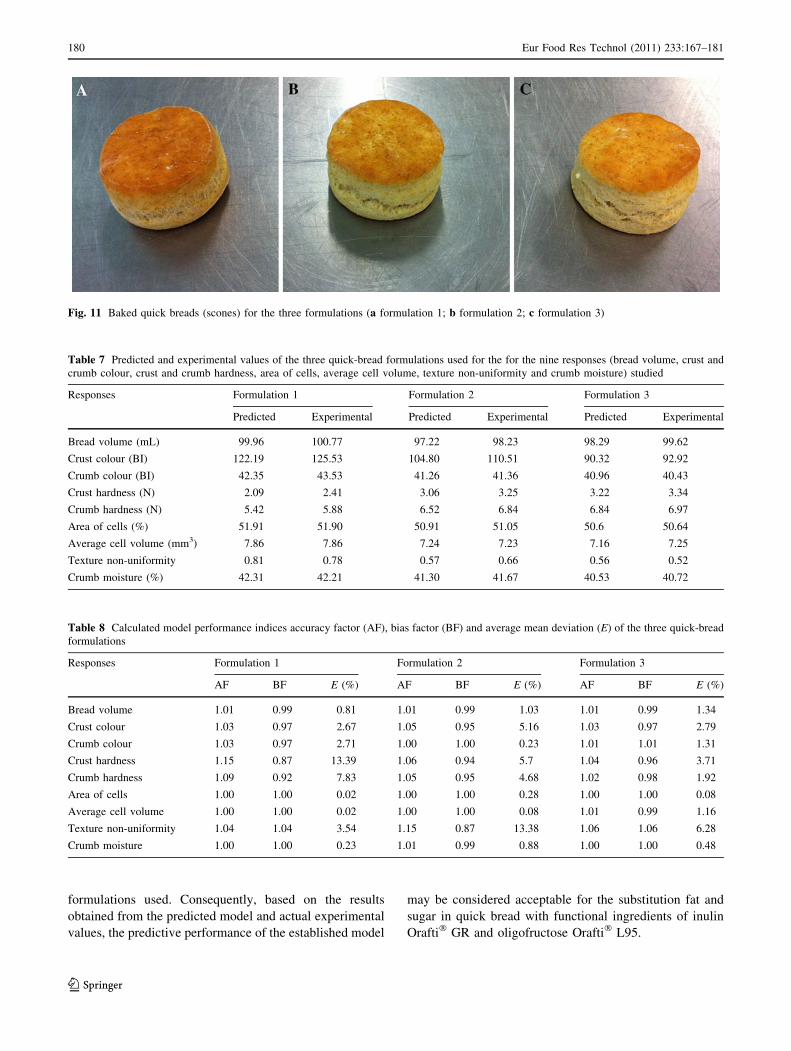
Optimization of quick-bread formulation
Taking all quality characteristics into account, and using
the optimization tool where the inclusion levels of mar-
garine and sugar were minimized and inulin and oligo-
fructose maximized, and where quality parameters were
minimized (crumb and crust colour, crumb and crust
hardness and non-uniformity) or maximized (crumb
moisture, bread volume, area of cells and cell volume)
three quick-bread formulation were predicted, as shown in
Table 6. These represent a quick-bread formulation with
significant lower fat and sugar levels compared with the
control. Figure 11 shows the baked quick breads of each
formulation. Overall, three formulations/recipes of quick
breads with acceptable desirability levels for the fat and
sugar substitution were identified by the mixture design.
The three predicted quick-bread formulations underwent
statistical analysis and were used to validate the model.
Model validation
Validation is the most crucial step that reveals the valid
range of a model and the limits of its performance [23].
Therefore, a predictive model may only be reliably used in
decision making when tested and validated [24]. Table 7
shows the predicted and the measured quality parameters
for the three optimized quick-bread formulations. Table 8
shows calculated model performance indices accuracy
factor (AF), bias factor (BF) and average mean deviation
(E%) of the three quick-bread formulations to quantita-
tively determine the applicability and accuracy of the
model outlined above. Formulation 1 would be the pre-
ferred recipe with the highest replacement of fat and sugar.
This is also indicated by the highest desirability level of
0.72. Higher desirability levels (i.e. close to 1.0) indicate a
more looked-for result. The model showed a good fit for
formulation 1 as shown by the accuracy factor for most
responses close to 1.00, except for crust and crumb hard-
ness which had a percentage error of 15 and 9%, respec-
tively. Ross et al. [25] reported that predictive models
should ideally have an AF = 1.00, indicating a perfect
model fit where the predicted and actual response values
are equal. In addition, Ross et al. [25] and Carrasco et al.
[26] reported that the AF of a fitted model increases by
0.10–0.15 units for each predictive variable in the model.
A model that forecasts a response from two predictive
Fig. 9 3D contour plots of texture non-uniformity (a margarine; b oligofructose; c sugar; d inulin)
178 Eur Food Res Technol (2011) 233:167–181
123
variables may be expected to have AF values ranging from
1.20 to 1.30 [25] or an equivalent percentage error range of
20–30%. In this study, four predictive variables are fore-
casted, and therefore, an error of 15 and 9% is still very
acceptable. The bias factor showed a similar trend to the
accuracy factor with most responses being close to 1.00,
except for crust and crumb hardness with 0.87 and 0.92
units, respectively. These values indicate that there was a
good agreement between predicted and observed value.
Formulation 2 that had desirability level of 0.66 performed
slightly better than formulation 1 in terms of model
applicability and accuracy. However, texture non-unifor-
mity showed percentage errors of 15%. All other response
had an error level of B 5%. Formulation 3 had the lowest
desirability level overall with 0.61, but showed the best
model performance indices of AF and BF B 6%. Overall,
variation between predicted and experimental values for
the majority of the responses obtained were within
acceptable error range, as depicted by average mean
deviation (E %; Table 8) for the three quick-bread
Fig. 10 3D contour plots of crumb moisture expressed in % (a margarine; b oligofructose; c sugar; d inulin)
Table 6 Predicted formulations
and desirability levels of quick
breads
a % values are based on the
total flour weight (100 g)
Material Formulation 1 (%)a Formulation 2 (%)a Formulation 3 (%)a
Cream (weak) flour 100 100 100
Baking powder 4.0 4.0 4.0
Salt 0.25 0.25 0.25
Milk (low fat, 1.7%) 60 60 60
Fat 3.53 3.03 3.44
Oligofructose (Orafti� L95) 10 6.97 3.44
Caster sugar 0.55 2.5 3.44
Inulin (Orafti� GR) 5.92 7.5 9.69
Desirability level 0.72 0.66 0.61
Eur Food Res Technol (2011) 233:167–181 179
123
formulations used. Consequently, based on the results
obtained from the predicted model and actual experimental
values, the predictive performance of the established model
may be considered acceptable for the substitution fat and
sugar in quick bread with functional ingredients of inulin
Orafti� GR and oligofructose Orafti� L95.
Fig. 11 Baked quick breads (scones) for the three formulations (a formulation 1; b formulation 2; c formulation 3)
Table 7 Predicted and experimental values of the three quick-bread formulations used for the for the nine responses (bread volume, crust and
crumb colour, crust and crumb hardness, area of cells, average cell volume, texture non-uniformity and crumb moisture) studied
Responses Formulation 1 Formulation 2 Formulation 3
Predicted Experimental Predicted Experimental Predicted Experimental
Bread volume (mL) 99.96 100.77 97.22 98.23 98.29 99.62
Crust colour (BI) 122.19 125.53 104.80 110.51 90.32 92.92
Crumb colour (BI) 42.35 43.53 41.26 41.36 40.96 40.43
Crust hardness (N) 2.09 2.41 3.06 3.25 3.22 3.34
Crumb hardness (N) 5.42 5.88 6.52 6.84 6.84 6.97
Area of cells (%) 51.91 51.90 50.91 51.05 50.6 50.64
Average cell volume (mm3) 7.86 7.86 7.24 7.23 7.16 7.25
Texture non-uniformity 0.81 0.78 0.57 0.66 0.56 0.52
Crumb moisture (%) 42.31 42.21 41.30 41.67 40.53 40.72
Table 8 Calculated model performance indices accuracy factor (AF), bias factor (BF) and average mean deviation (E) of the three quick-bread
formulations
Responses Formulation 1 Formulation 2 Formulation 3
AF BF E (%) AF BF E (%) AF BF E (%)
Bread volume 1.01 0.99 0.81 1.01 0.99 1.03 1.01 0.99 1.34
Crust colour 1.03 0.97 2.67 1.05 0.95 5.16 1.03 0.97 2.79
Crumb colour 1.03 0.97 2.71 1.00 1.00 0.23 1.01 1.01 1.31
Crust hardness 1.15 0.87 13.39 1.06 0.94 5.7 1.04 0.96 3.71
Crumb hardness 1.09 0.92 7.83 1.05 0.95 4.68 1.02 0.98 1.92
Area of cells 1.00 1.00 0.02 1.00 1.00 0.28 1.00 1.00 0.08
Average cell volume 1.00 1.00 0.02 1.00 1.00 0.08 1.01 0.99 1.16
Texture non-uniformity 1.04 1.04 3.54 1.15 0.87 13.38 1.06 1.06 6.28
Crumb moisture 1.00 1.00 0.23 1.01 0.99 0.88 1.00 1.00 0.48
180 Eur Food Res Technol (2011) 233:167–181
123
Conclusions
Mixture surface methodology using D-optimal design was
found to be an effective technique to investigate the effects
of fat and sugar substitution by inulin and oligofructose on
bread volume, crust and crumb colour, crust and crumb
texture, crumb grain properties and crumb moisture of
quick breads. Overall, it was found that quick breads
(scones) containing inulin and oligofructose can show
similar quality characteristics to a control which contains
10% fat and 10% sugar. Some quality parameters such as
bread volume even showed an improvement due to inclu-
sion of prebiotics. The validation of the model has shown
that it can be successfully used to produce low fat and
sugar quick breads with the potential health benefits of
prebiotics. All three predicted formulations used to deter-
mine the accuracy of the model showed a good model fit
and had acceptable desirability levels. The successful fat
and sugar reduction and the introduction of healthy alter-
natives may be especially appealing to the elderly, as they
are one of the main consumers of these products. Future
work will focus on the nutritional and sensory character-
ization of the optimized quick bread product.
Acknowledgments This research was funded by the Irish Depart-
ment of Agriculture Fisheries and Food under the Food Institutional
Research Measure (FIRM). The authors would like to thank Beneo-
Orafti (Tienen, Belgium) for providing the samples and the Baking
Academy of Ireland (Dublin, Ireland).
References
1. Pareyt B, Talhaoui F, Kerckhofs G, Brijs K, Goesaert H, Wevers
M, Delcour JA (2009) The role of sugar and fat in sugar-snap
cookies: structural and textural properties. J Food Eng
90:400–408
2. Yackel WC, Cox CL (1992) Application of starch-based fat
replacers. Food Technol 46:146–148
3. Gibson GR, Probert HM, Van Loo J, Rastall RA, Roberfroid MB
(2004) Dietary modulation of the human colonic microbiota:
updating the concept of prebiotics. Nutr Res Rev 17:259–275
4. Wang Y (2009) Prebiotics: present and future in food science and
technology. Food Res Int 42:8–12
5. Teitelbaum JE, Walker WA (2002) Nutritional impact of pre- and
probiotics as protective gastrointestinal organisms. Ann Rev Nutr
22:107–138
6. Zoulias EI, Oreopoulou V, Tzia C (2002) Textural properties of
low-fat cookies containing carbohydrate-or protein-based fat
replacers. J Food Eng 55:337–342
7. Pareyt B, Goovaerts M, Broekaert WF, Delcour JA (2011) Ara-
binoxylan oligosaccharides (AXOS) as a potential sucrose
replacer in sugar-snap cookies. LWT Food Sci Technol
44:725–728
8. Gallagher E, O’Brien CM, Scannell AGM, Arendt EK (2003)
Evaluation of sugar replacers in short dough biscuit production.
J Food Eng 56:261–263
9. Gallagher E, O’Brien CM, Scannell AGM, Arendt EK (2003) Use
of response surface methodology to produce functional short
dough biscuits. J Food Eng 56:269–271
10. O‘Brien CM, Mueller A, Scannell AGM, Arendt EK (2003)
Evaluation of the effects of fat replacers on the quality of wheat
bread. J Food Eng 56:265–267
11. Poinot P, Arvisenet G, Grua-Priol J, Filloneau C, Le-Bail A, Prost
C (2010) Influence of inulin on bread: kinetics and physico-
chemical indicators of the formation of volatile compounds
during baking. Food Chem 119:1474–1484
12. Buera MP, Lozano RD, Petriella C (1985) Definition of colour in
the non-enzymatic browning process. Die Farbe 32–33:318–322
13. AACC (1991) American Association of Cereal Chemists
(AACC), Official method 62-05. Preparation of sample: bread
Brabender moisture oven. In: Manufactures handbook
14. Hossain MB, Brunton NP, Martin-Diana AB, Barry-Ryan C
(2010) Application of response surface methodology to optimize
pressurized liquid extraction of antioxidant compounds from sage
(Salvia officinalis L.), basil (Ocimum basilicum L.) and thyme
(Thymus vulgaris L.). Food Funct 1:269–277
15. Tiwari BK, Muthukumarappan K, O’Donnell CP, Cullen PJ
(2008) Modelling colour degradation of orange juice by ozone
treatment using response surface methodology. J Food Eng
8:553–560
16. Hager AS, Ryan LAM, Schwab C, Ganzle MG, O‘Doherty J,
Arendt EK (2011) Influence of the soluble fibres inulin and oat b-
glucan on quality of dough and bread. Eur Food Res Technol.
doi:10.1007/s00217-010-1409-1
17. Peressini D, Sensidoni A (2009) Effect of soluble dietary fibre
addition on rheological and breadmaking properties of wheat
doughs. J Cereal Sci 49:190–201
18. Manley DJR (1991) Technology of biscuits crackers and cookies,
2nd edn. Ellis Horwood, Chichester
19. Esteller MS, Amaral RL, Lannes SC (2004) Effect of sugar and
fat replacers on the texture of baked goods. J Texture Stud
35:383–393
20. Brooker BE (1993) The stabilization of air in cake batter—the
role of fat. Food Struct 12:285–296
21. Lassoued N, Delarue J, Launary B (2008) Baked product texture:
correlations between instrumental and sensory characterization
using Flash Profile. J Cereal Sci 48:133–143
22. Franck A (2002) Technological functionality of inulin and oli-
gofructose. Br J Nutr 2:287–291
23. Gabriel AA (2008) Estimation of water activity from pH and Brix
values of some food products. Food Chem 108:1106–1113
24. Jagannath A, Tsuchido T (2003) Validation of a polynomial
regression model: the thermal inactivation of Bacillus subtilis
spores in milk. Lett Appl Microbiol 37:399–404
25. Ross T, Dalgaard P, Tienungoon S (2000) Predictive modelling
of the growth and survival of Listeria in fishery products. Int J
Food Microbiol 62:231–245
26. Carrasco E, Garcia-Gimeno R, Seselovsky R, Valero A, Perez F,
Zurera G (2006) Predictive model of Listeria monocytogenes’growth rate under different temperatures and acids. Food Sci
Technol Int 12:47–56
Eur Food Res Technol (2011) 233:167–181 181
123


![[a Fuchs] Inulin and Inulin-containing Crops(BookZZ.org)](https://img.pdfslide.net/doc/110x75/5695d16f1a28ab9b02968236/a-fuchs-inulin-and-inulin-containing-cropsbookzzorg.jpg)