Embed Size (px)
Citation preview
Inventor collaboration and its' persistence across
European regions
Gergő Tóth1,2 - Sándor Juhász1,3 - Zoltán Elekes1,3 - Balázs Lengyel1,4
1 Agglomeration and Social Networks Lendület Research Group, Hungarian Academy of Sciences, 1097 Budapest, Hungary
2 Spatial Dynamics Lab, University College Dublin, Belfield, Dublin 4, Ireland
3 Faculty of Economics and Business Administration, University of Szeged, 6722 Szeged, Hungary
4 International Business School Budapest, 1037 Budapest, Hungary
Data
Spatial patterns of inventor collaborations
Multivariate gravity models
Results
Policy implications
MTA KRTK KTI ANET 2
MTA KRTK KTI ANET 3
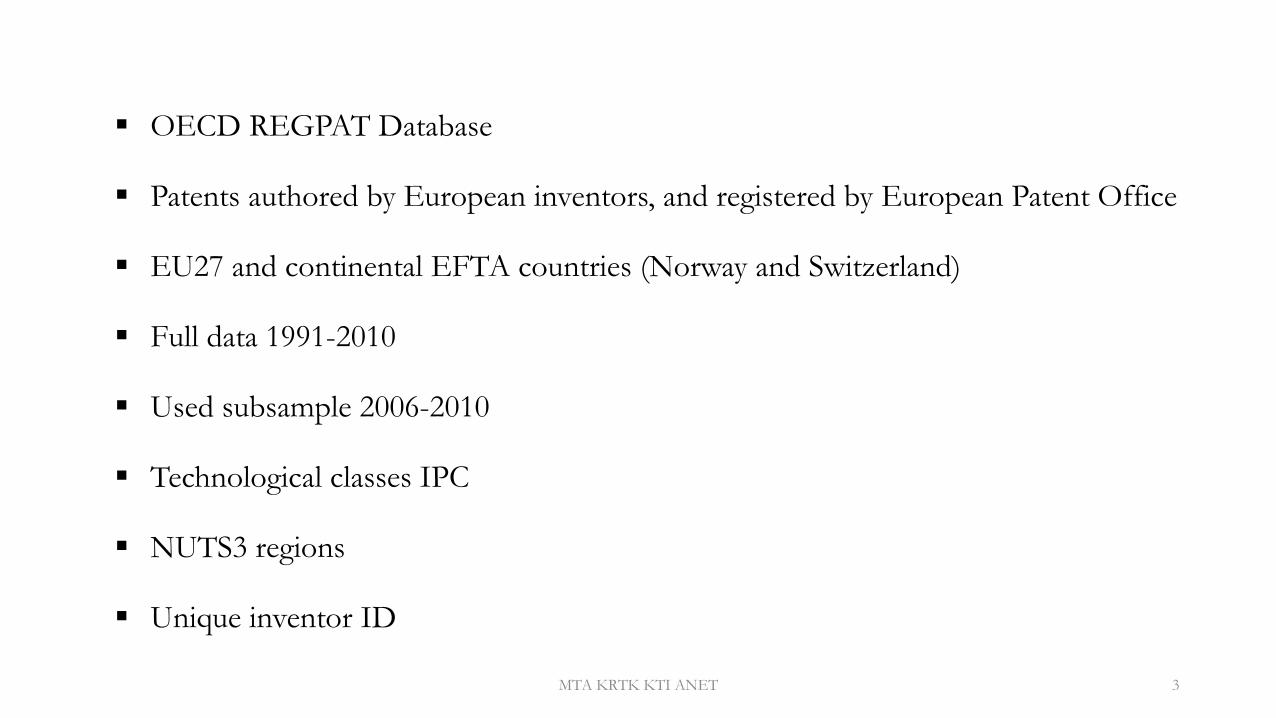
OECD REGPAT Database
Patents authored by European inventors, and registered by European Patent Office
EU27 and continental EFTA countries (Norway and Switzerland)
Full data 1991-2010
Used subsample 2006-2010
Technological classes IPC
NUTS3 regions
Unique inventor ID
MTA KRTK KTI ANET 4
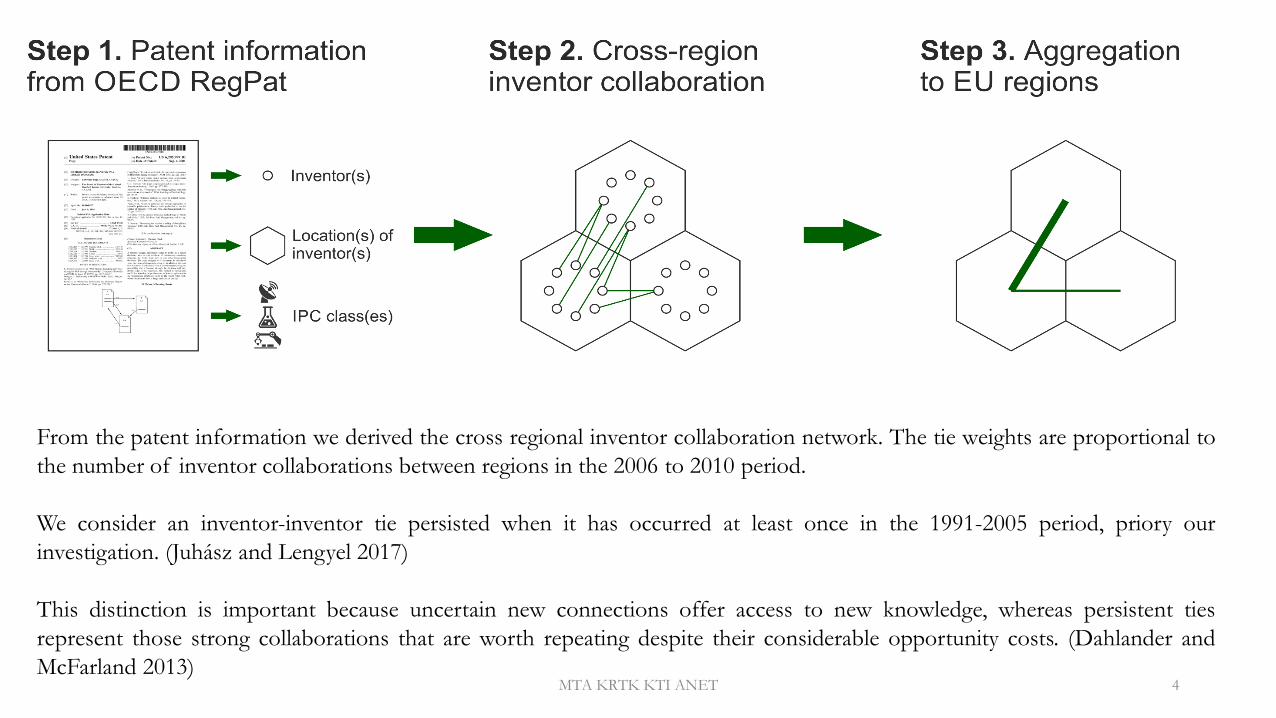
From the patent information we derived the cross regional inventor collaboration network. The tie weights are proportional to
the number of inventor collaborations between regions in the 2006 to 2010 period.
We consider an inventor-inventor tie persisted when it has occurred at least once in the 1991-2005 period, priory our
investigation. (Juhász and Lengyel 2017)
This distinction is important because uncertain new connections offer access to new knowledge, whereas persistent ties
represent those strong collaborations that are worth repeating despite their considerable opportunity costs. (Dahlander and
McFarland 2013)
MTA KRTK KTI ANET 5
Collaboration Persisted Collaboration
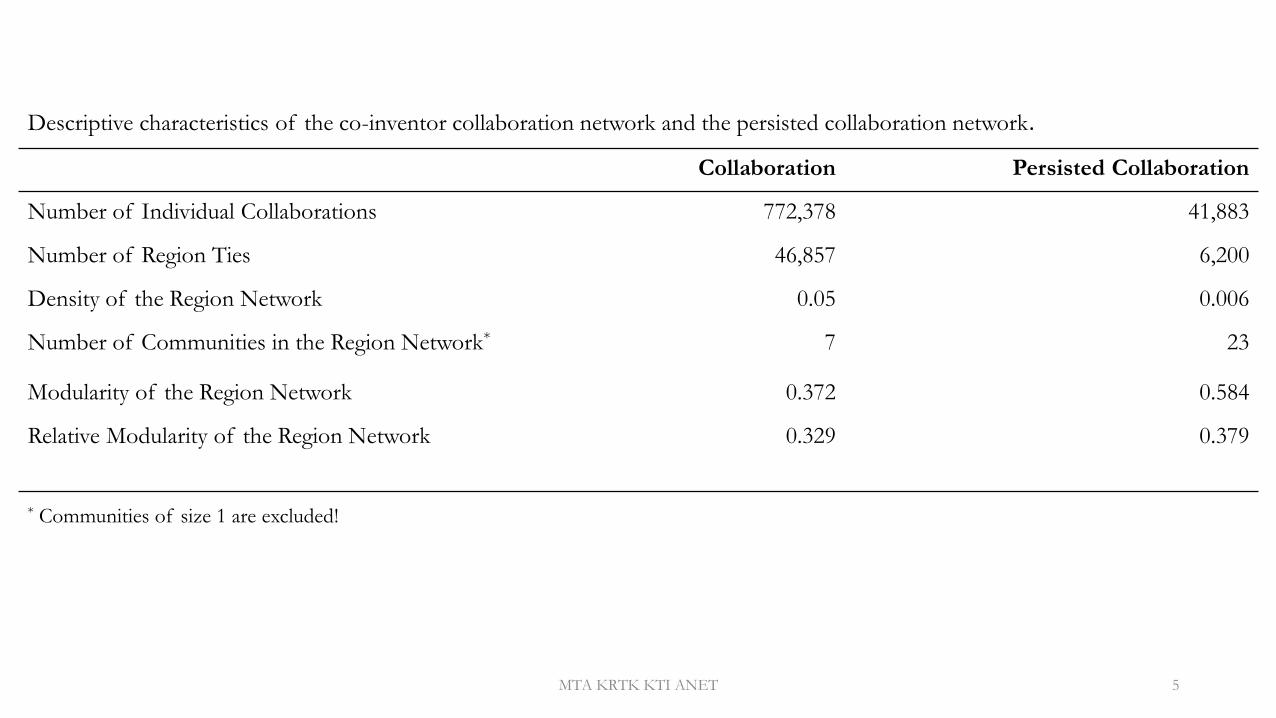
Number of Individual Collaborations 772,378 41,883
Number of Region Ties 46,857 6,200
Density of the Region Network 0.05 0.006
Number of Communities in the Region Network* 7 23
Modularity of the Region Network 0.372 0.584
Relative Modularity of the Region Network 0.329 0.379
Descriptive characteristics of the co-inventor collaboration network and the persisted collaboration network.
* Communities of size 1 are excluded!
MTA KRTK KTI ANET 6
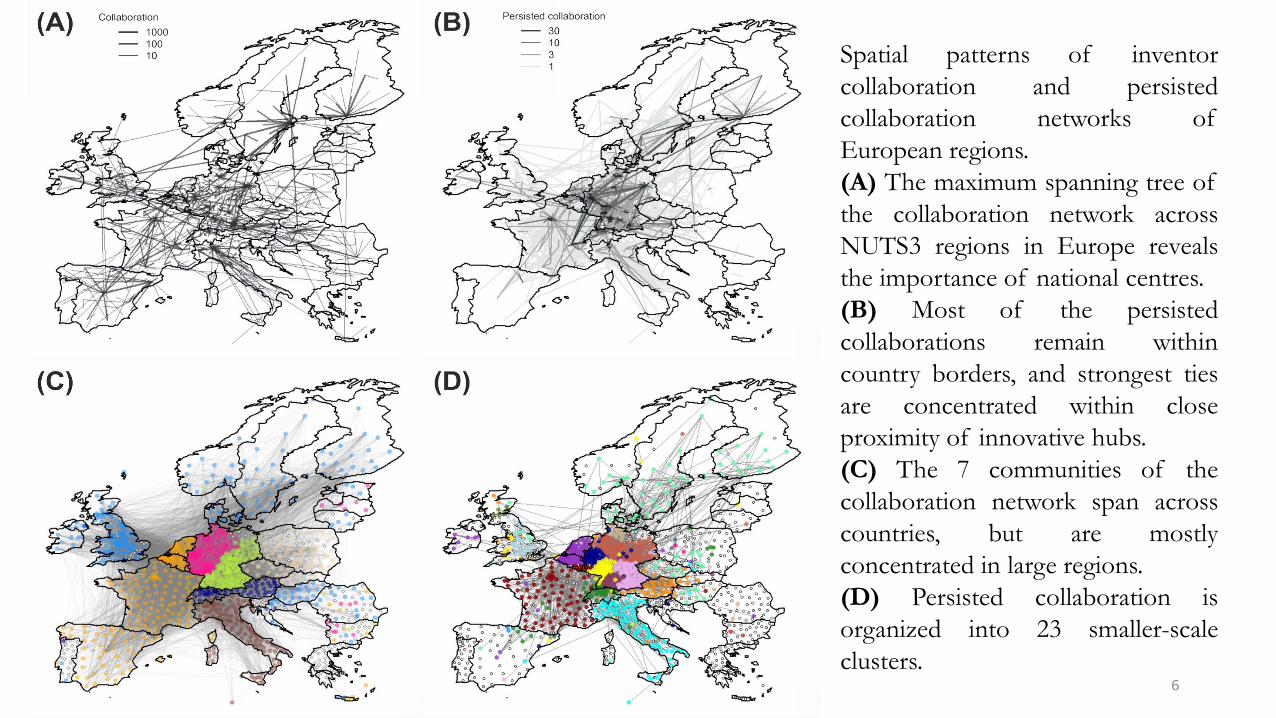
Spatial patterns of inventor
collaboration and persisted
collaboration networks of
European regions.
(A) The maximum spanning tree of
the collaboration network across
NUTS3 regions in Europe reveals
the importance of national centres.
(B) Most of the persisted
collaborations remain within
country borders, and strongest ties
are concentrated within close
proximity of innovative hubs.
(C) The 7 communities of the
collaboration network span across
countries, but are mostly
concentrated in large regions.
(D) Persisted collaboration is
organized into 23 smaller-scale
clusters.
MTA KRTK KTI ANET 7
What are the driving factors of the probability of (persistent) co-inventorship across
European regions?
How the spatial patterns of persistent inventor collaborations differ from newly
created ones?
MTA KRTK KTI ANET 8
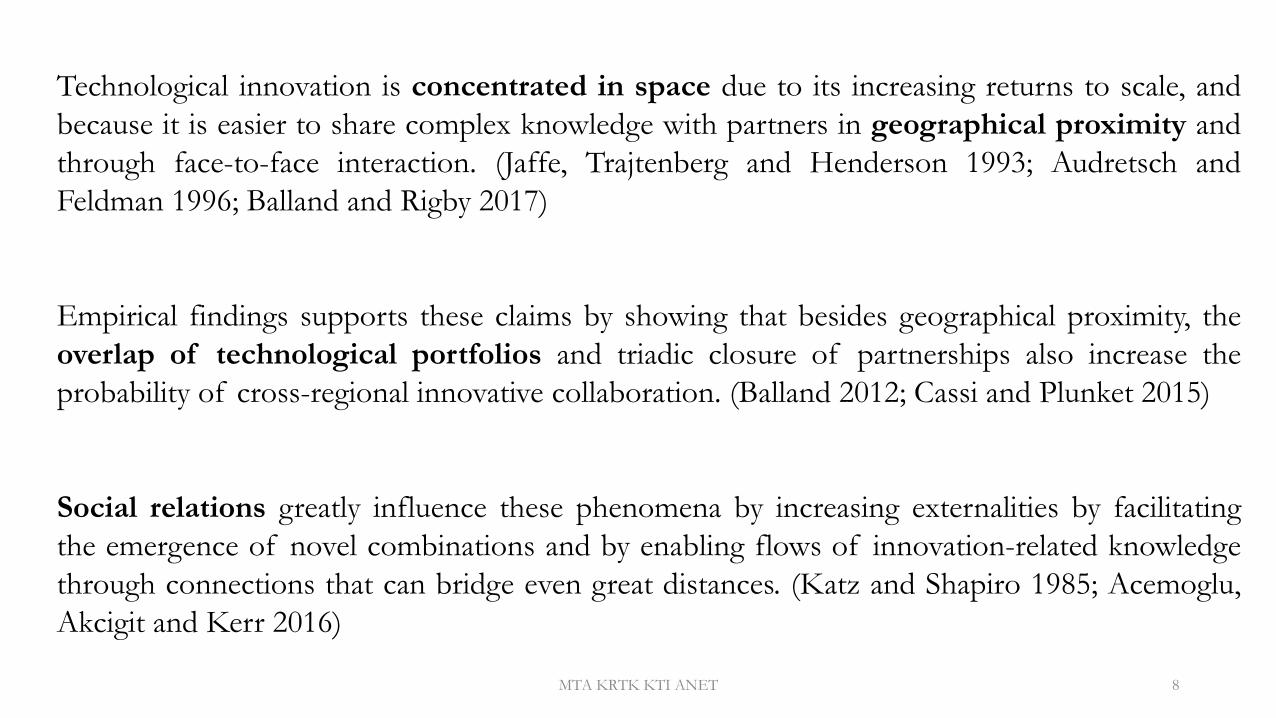
Technological innovation is concentrated in space due to its increasing returns to scale, and
because it is easier to share complex knowledge with partners in geographical proximity and
through face-to-face interaction. (Jaffe, Trajtenberg and Henderson 1993; Audretsch and
Feldman 1996; Balland and Rigby 2017)
Empirical findings supports these claims by showing that besides geographical proximity, the
overlap of technological portfolios and triadic closure of partnerships also increase the
probability of cross-regional innovative collaboration. (Balland 2012; Cassi and Plunket 2015)
Social relations greatly influence these phenomena by increasing externalities by facilitating
the emergence of novel combinations and by enabling flows of innovation-related knowledge
through connections that can bridge even great distances. (Katz and Shapiro 1985; Acemoglu,
Akcigit and Kerr 2016)
MTA KRTK KTI ANET 9
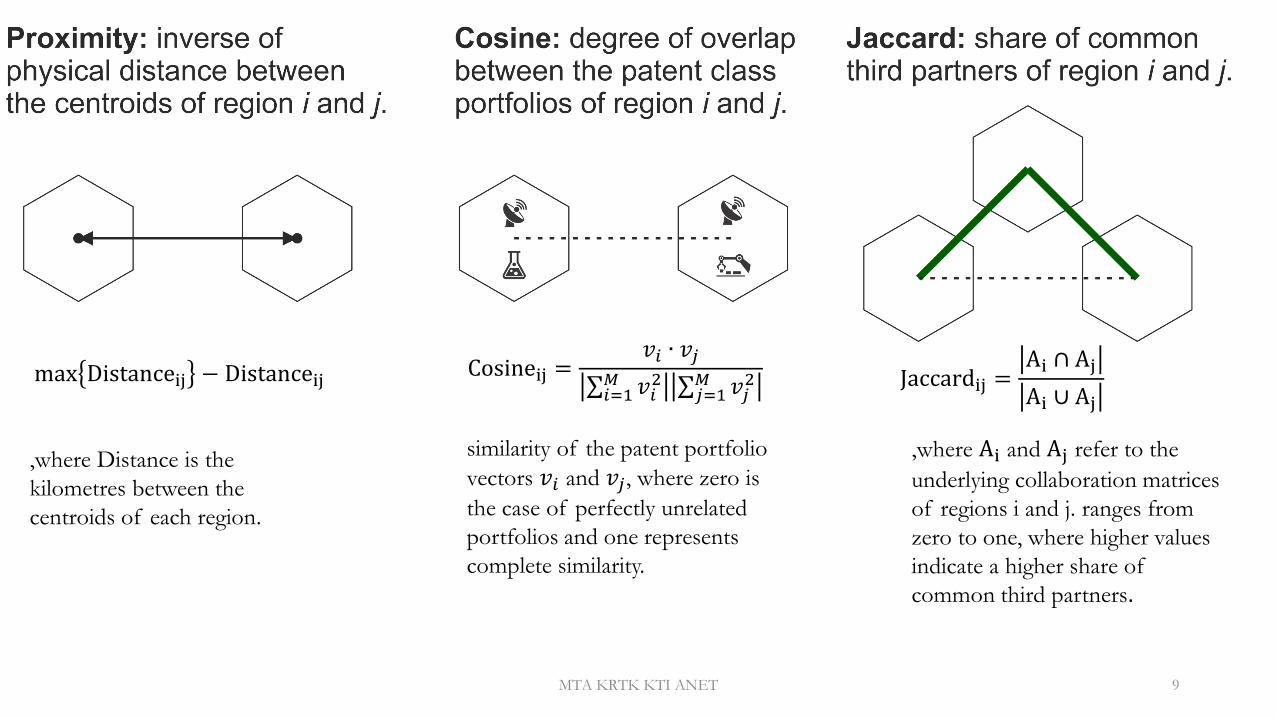
Cosineij =𝑣𝑖 ∙ 𝑣𝑗
𝑣𝑖2𝑀
𝑖=1 𝑣𝑗2𝑀
𝑗=1
max Distanceij − Distanceij Jaccardij =Ai ∩ Aj
Ai ∪ Aj
,where Distance is the
kilometres between the
centroids of each region.
similarity of the patent portfolio
vectors 𝑣𝑖 and 𝑣𝑗, where zero is
the case of perfectly unrelated
portfolios and one represents
complete similarity.
,where Ai and Aj refer to the
underlying collaboration matrices
of regions i and j. ranges from
zero to one, where higher values
indicate a higher share of
common third partners.
MTA KRTK KTI ANET 10
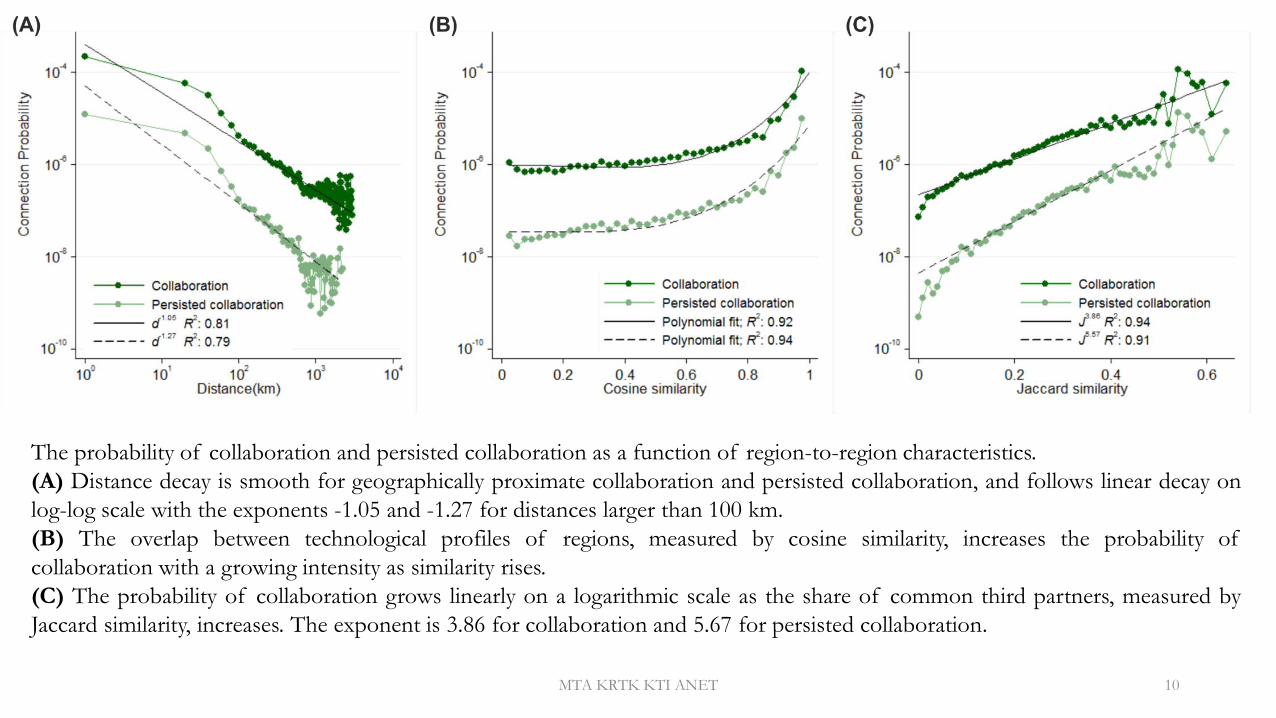
The probability of collaboration and persisted collaboration as a function of region-to-region characteristics.
(A) Distance decay is smooth for geographically proximate collaboration and persisted collaboration, and follows linear decay on
log-log scale with the exponents -1.05 and -1.27 for distances larger than 100 km.
(B) The overlap between technological profiles of regions, measured by cosine similarity, increases the probability of
collaboration with a growing intensity as similarity rises.
(C) The probability of collaboration grows linearly on a logarithmic scale as the share of common third partners, measured by
Jaccard similarity, increases. The exponent is 3.86 for collaboration and 5.67 for persisted collaboration.
MTA KRTK KTI ANET 11
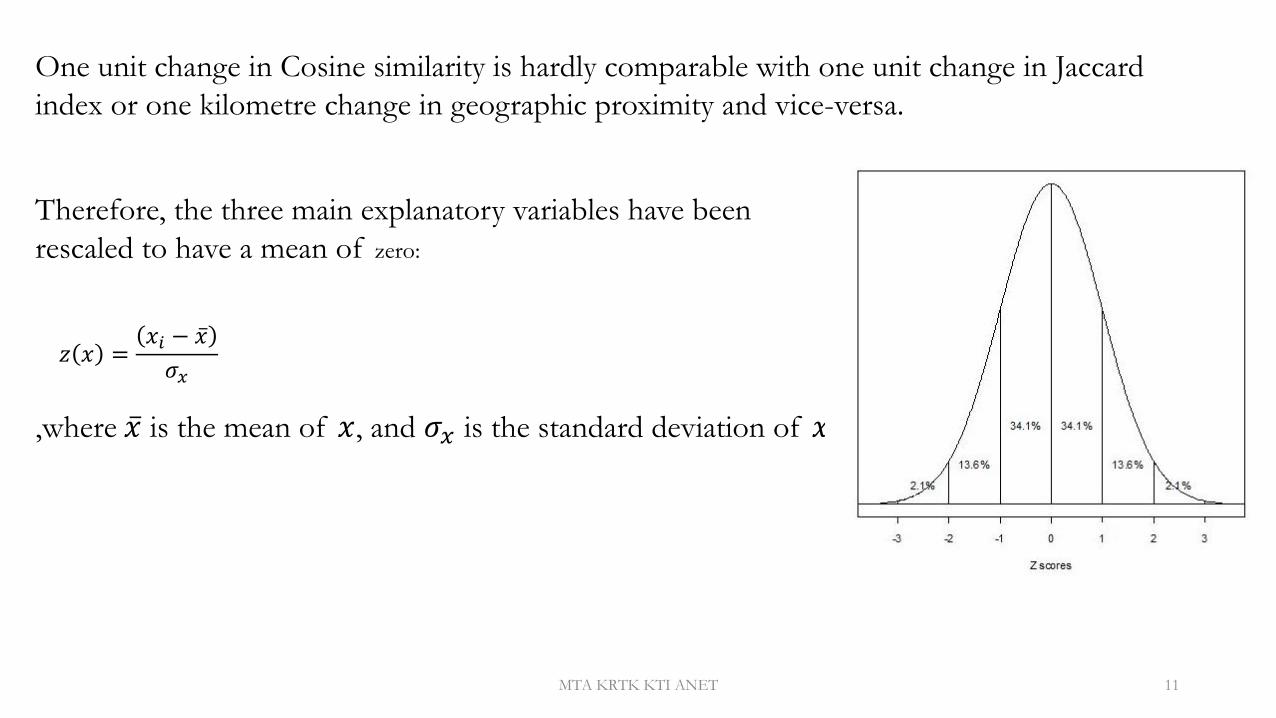
One unit change in Cosine similarity is hardly comparable with one unit change in Jaccard
index or one kilometre change in geographic proximity and vice-versa.
𝑧 𝑥 =𝑥𝑖 − 𝑥
𝜎𝑥
Therefore, the three main explanatory variables have been
rescaled to have a mean of zero:
,where 𝑥 is the mean of 𝑥, and 𝜎𝑥 is the standard deviation of 𝑥.
MTA KRTK KTI ANET 12
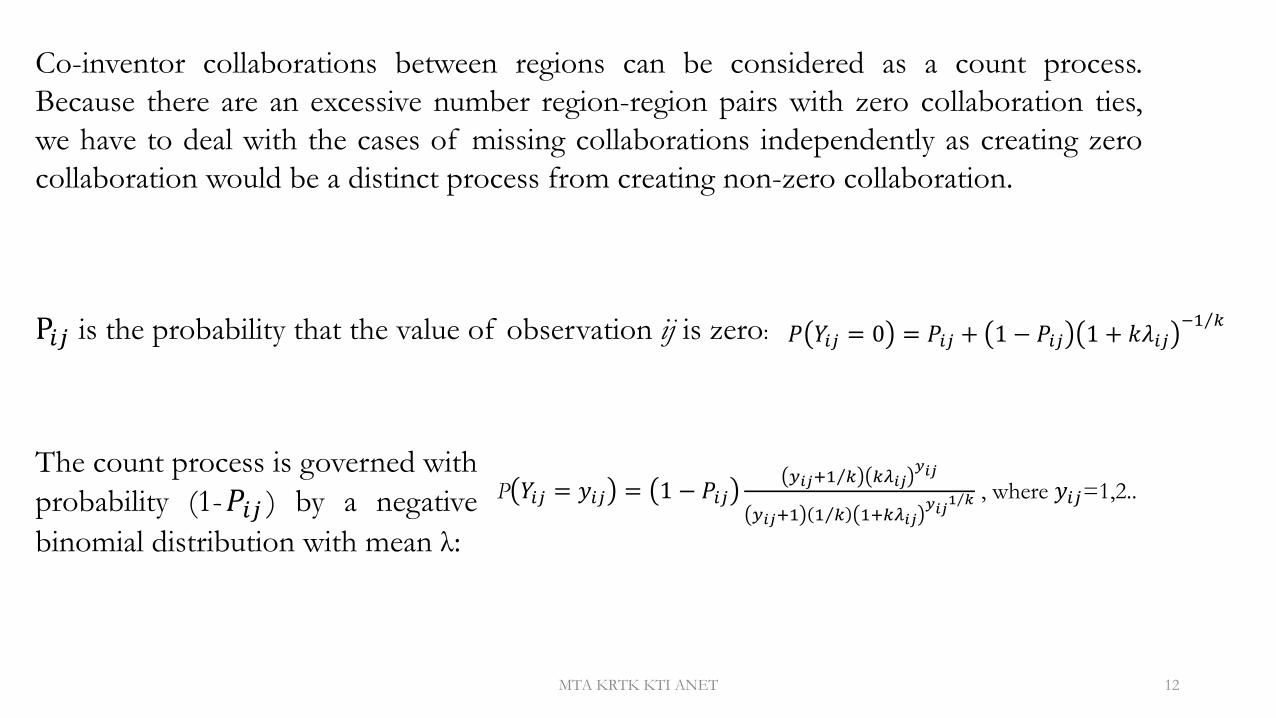
Co-inventor collaborations between regions can be considered as a count process.
Because there are an excessive number region-region pairs with zero collaboration ties,
we have to deal with the cases of missing collaborations independently as creating zero
collaboration would be a distinct process from creating non-zero collaboration.
𝑃 𝑌𝑖𝑗 = 0 = 𝑃𝑖𝑗 + 1 − 𝑃𝑖𝑗 1 + 𝑘𝜆𝑖𝑗−1 𝑘
P 𝑌𝑖𝑗 = 𝑦𝑖𝑗 = 1 − 𝑃𝑖𝑗𝑦𝑖𝑗+1 𝑘 𝑘𝜆𝑖𝑗
𝑦𝑖𝑗
𝑦𝑖𝑗+1 1 𝑘 1+𝑘𝜆𝑖𝑗𝑦𝑖𝑗
1 𝑘 , where 𝑦𝑖𝑗=1,2..
P𝑖𝑗 is the probability that the value of observation ij is zero:
The count process is governed with
probability (1-𝑃𝑖𝑗 ) by a negative
binomial distribution with mean λ:
MTA KRTK KTI ANET 13
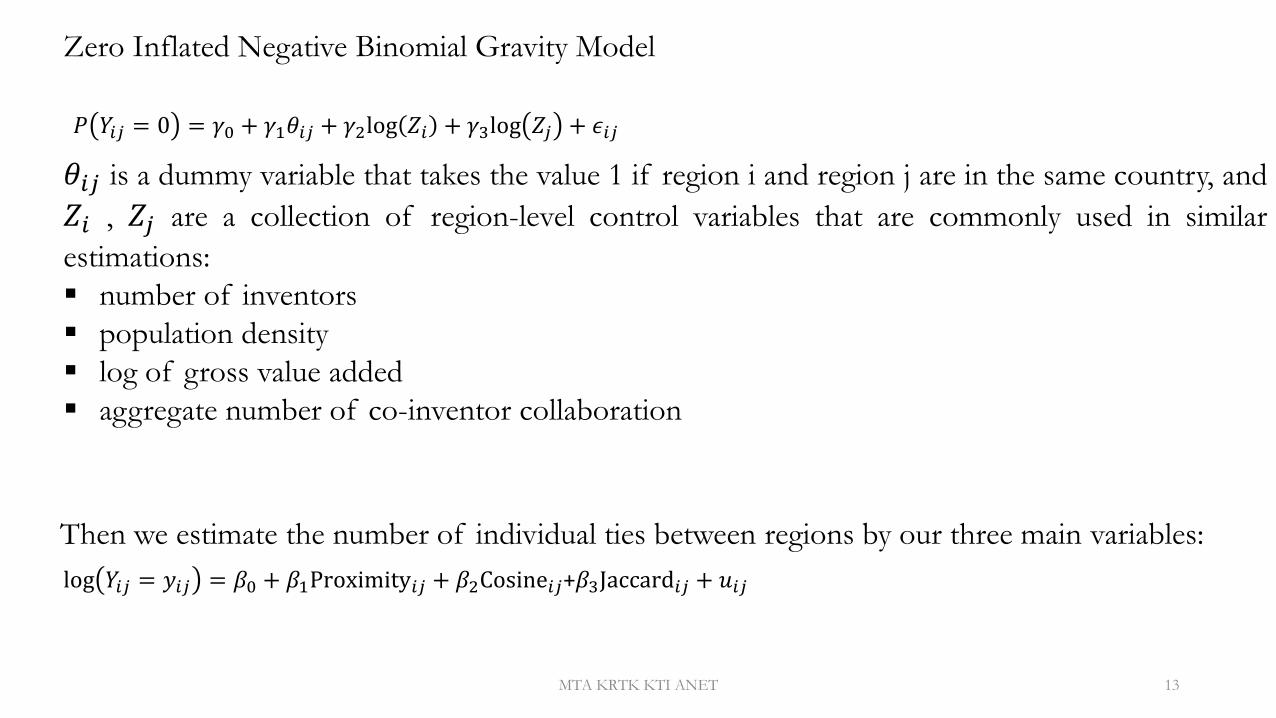
𝑃 𝑌𝑖𝑗 = 0 = 𝛾0 + 𝛾1𝜃𝑖𝑗 + 𝛾2log 𝑍𝑖 + 𝛾3log 𝑍𝑗 + 𝜖𝑖𝑗
𝜃𝑖𝑗 is a dummy variable that takes the value 1 if region i and region j are in the same country, and
𝑍𝑖 , 𝑍𝑗 are a collection of region-level control variables that are commonly used in similar
estimations:
number of inventors
population density
log of gross value added
aggregate number of co-inventor collaboration
Zero Inflated Negative Binomial Gravity Model
log 𝑌𝑖𝑗 = 𝑦𝑖𝑗 = 𝛽0 + 𝛽1Proximity𝑖𝑗 + 𝛽2Cosine𝑖𝑗+𝛽3Jaccard𝑖𝑗 + 𝑢𝑖𝑗
Then we estimate the number of individual ties between regions by our three main variables:
14
MTA KRTK KTI ANET 15
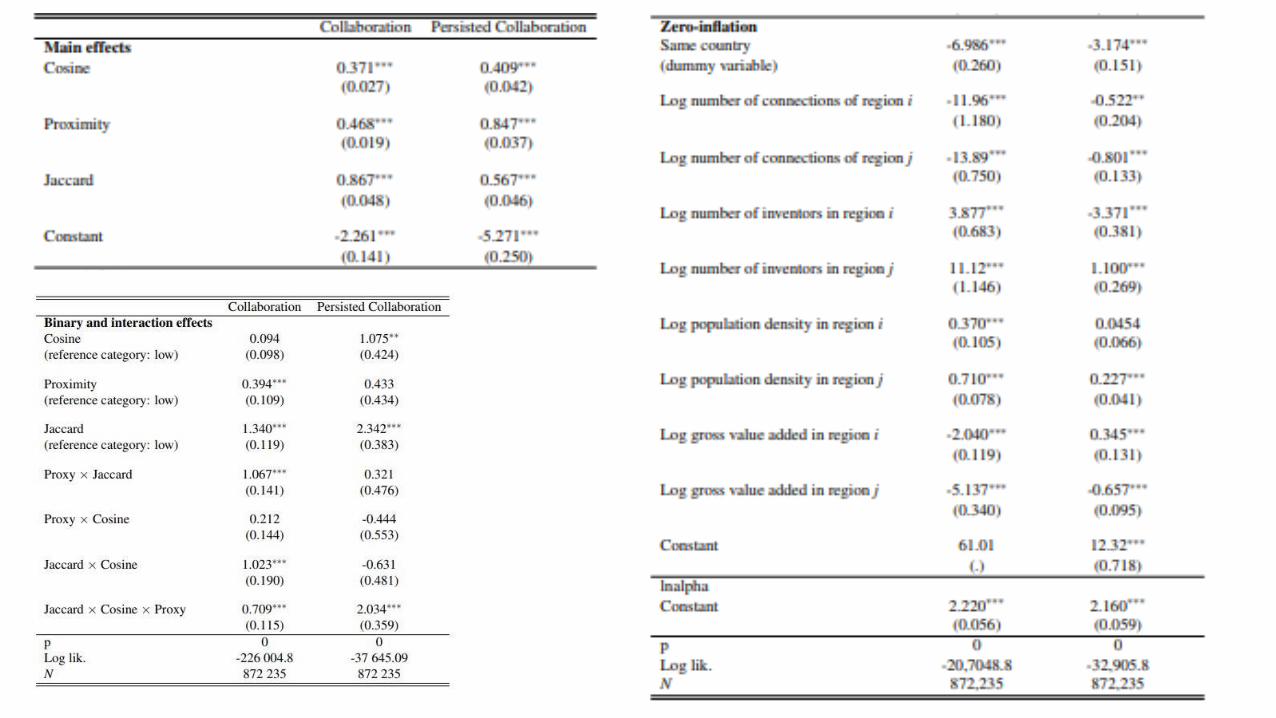
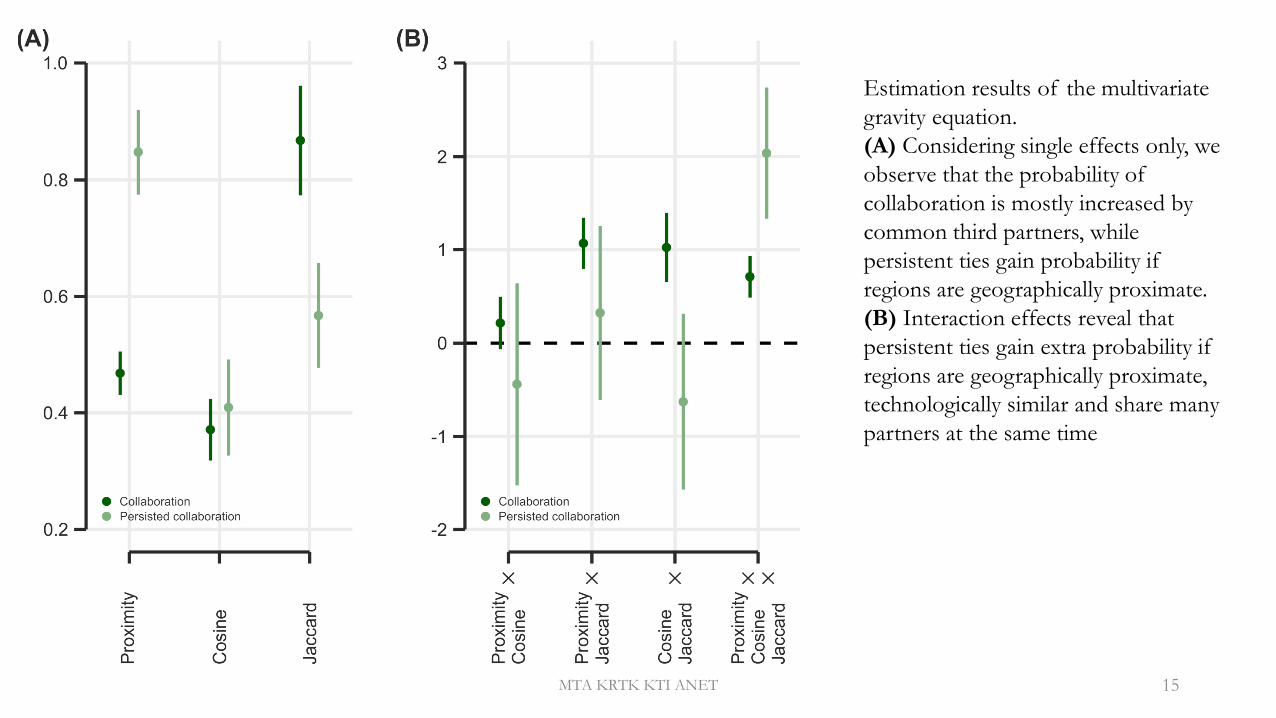
Estimation results of the multivariate
gravity equation.
(A) Considering single effects only, we
observe that the probability of
collaboration is mostly increased by
common third partners, while
persistent ties gain probability if
regions are geographically proximate.
(B) Interaction effects reveal that
persistent ties gain extra probability if
regions are geographically proximate,
technologically similar and share many
partners at the same time
MTA KRTK KTI ANET 16
Spatial clustering offers positive externalities, while fostering a diverse and open network of inventors
helps exploring opportunities, and in avoiding lock-in.
European Research Area intended to decrease the fragmentation of the European research activities.
These are still self-organized into national innovation systems.
Repeated inter-regional collaborations are fragmented at a smaller spatial scale, regional innovation
systems more adequate.
Our evidence suggests that lasting cooperations are strongly bounded by multidimensional proximity,
and are likely to revert to spatial clustering.
European innovation policy could address these issues by specifically targeting persisted collaborations
across national borders and larger distances.
Takeaway message and policy implications
MTA KRTK KTI ANET 18
Acemoglu, D., Akcigit, U. & Kerr, W. R. Innovation network. Proc. Natl. Acad. Sci. 113, 11483–11488 (2016).
Audretsch, D. B. & Feldman, M. P. R&d spillovers and the geography of innovation and production. The Am. economic
review 86, 630–640 (1996).
Balland, P.-A. Proximity and the evolution of collaboration networks: evidence from research and development projects
within the global navigation satellite system (gnss) industry. Reg. Stud. 46, 741–756 (2012)
Balland, P.-A. & Rigby, D. The geography of complex knowledge. Econ. Geogr. 93, 1–23 (2017).
Cassi, L. & Plunket, A. Research collaboration in co-inventor networks: combining closure, bridging and proximities. Reg.
Stud. 49, 936–954 (2015).
Dahlander, L. & McFarland, D. A. Ties that last: Tie formation and persistence in research collaborations over time. Adm.
science quarterly 58, 69–110 (2013).
Jaffe, A. B., Trajtenberg, M. & Henderson, R. Geographic localization of knowledge spillovers as evidenced by patent
citations. Q. journal Econ. 108, 577–598 (1993).
Juhasz, S. & Lengyel, B. Creation and persistence of ties in cluster knowledge networks. ´ J. Econ. Geogr. (2017).
Katz, M. L. & Shapiro, C. Network externalities, competition, and compatibility. The Am. economic review 75, 424–440
(1985).