Embed Size (px)
Citation preview

INVENTORY O^ &LACIERS IN THE NORTH CASCADES, WASINGTON
PAPER 705-A
*a%iifs.
[R;« :i . fi 1<1 .f,.
By AUSTIN POST, DON RICHARDSON,
WENDELL V. TANGBORN, and F. L. ROSSELOT
GLACIERS IN THE UNITED STATES
GEOLOGICAL SURVEY PROFESSIONAL PAPER 705-A
A contribution to the International Hydrological Decade
UNITED STATES GOVERNMENT PRINTING OFFICE, WASHINGTON : 1971

UNITED STATES DEPARTMENT OF THE INTERIOR
ROGERS G. B. MORTON, Secretary
GEOLOGICAL SURVEY
W. A. Radlinski, Acting Director
Library of Congress catalog-card No. 75-610936
For sale by the Superintendent of Documents, U.S. Government Printing OfficeWashington, D.C. 20402 Stock Number 2401-1127
CONTENTS
Compilation method Continued PagePageAbstract __________________________ 1 List of glaciers ____ _ ___ ___ 3Introduction _________________________ 1 Summary of data 4The North Cascades setting ________________ 1 Mean altitude and orientation of glaciers _____ 5Definition of a glacier ___________________ 2 Recent activity _ _____ _ _ 7Present glaciers ______________________ 2 Hydrologic significance ___________________ 9Compilation method ____________________ 3 References ___________ _ _ 10
ILLUSTRATIONS
Page PLATE 1. Topographic map of the North Cascades _______________________________ ___ In pocket
2. Map showing glaciers and drainage basins of the North Cascades _ _ _ _ In pocket3. Photographs of various types of glaciers in the North Cascades _______________________ In pocket
FIGURE 1. Southwest-northeast profile across the North Cascades showing topography, precipitation, and gradient ofmean glacier altitudes _______________________ _________________________ 5
2. North-south profiles between Marble Creek and McAllister Creek, and Basin Creek and Skagit Queen Creek,showing the effect of orientation on glacier size _______ _______________________ 6
3. Maps showing mean altitudes of glaciers _________________________________________ 74. Diagrams showing orientation of glaciers, by drainage basin _________________________________ 8
TABLES
PageTABLE 1. Glaciers of the North Cascades ____________________________________________ 12
2. Glacier areas and volumes by size categories _____ ________________________________ 43. Volumes of August and September runoff at selected river basins in the North Cascades, 1964 and 1966 ___ 9
III

GLACIERS IN THE UNITED STATES
INVENTORY OF GLACIERS IN THE NORTH CASCADES, WASHINGTON
By AUSTIN POST, DON RICHARDSON, WENDELL V. TANGBORN, and F. L. ROSSELOT
ABSTRACT
Perennial bodies of ice in the North Cascades having areas of at least 0.1 km2 (square i kilometer) are tabulated and classified. The inventory, a contribution to the International Hydrological Decade, includes 756 glaciers, covering 267 km2 , about half of the glacier area in the United States south of Alaska. Listings include each glacier's location, drainage basin, area, length, orientation, altitude, and classification as to form, source, surface, nature of terminus, and activity. These glaciers contribute annually about 800 million cubic meters of water to streamflow in the State of Washington.
INTRODUCTION
The first census of glaciers in this country de scribed glaciers on the higher volcanic peaks of the Cascade Range (Russell, 1885). Russell (1897) later recognized that there also were glaciers in the non- volcanic mountains of the North (or Northern) Cas cade Range, known popularly as the North Cascades. Because of the remoteness and inaccessibility of the interior of this mountainous area, the extent of the glacier cover was not recognized for many decades. Recent attempts at a glacier census were more com plete owing to aerial photographs and better maps. An inventory taken by Meier (1961) included 519 glaciers in the North Cascades, covering a total area of 252km2 (squarekilometers).
A comprehensive inventory is now appropriate as part of a program of the International Hydrological Decade (1965-74).* Objectives of the IHD, outlined at the first meeting of its Coordinating Council in 1965, include a "world inventory of perennial ice and snow masses" (Resolution 1-12). The world in ventory is being taken under the technical direction of a working group of the International Commission of Snow and Ice of the International Association of Scientific Hydrology (IASH). This program pro-
J The International Hydrological Decade (IHD) is a cooperative program of many countries working individually and collectively to advance the knowledge of water and hydrological processes. UNESCO is a coordinating agency for the IHD.
vides a synoptic look at an estimated 80 percent (the frozen part) of the world's fresh water resources. It also provides important background data for the Permanent Service on the Fluctuations of Glaciers, recently established at Zurich, Switzerland.
This census of glaciers in the North Cascades is the first American contribution to the "world inven tory of perennial ice and snow masses." It has been estimated (Meier, 1961) that 77 percent of the gla cier area in the United States south of Alaska occurs in the State of Washington and that 63 percent of that glacier area is in the North Cascades. Thus, the present inventory covers about half of the glacier area in the United States south of Alaska. Later in ventories will cover other glacierized areas of the country.
THE NORTH CASCADES SETTING
As defined by Fenneman (1931, p. 422) and others, the range comprises all the mountains between Sno- qualmie Pass on the south and the Fraser River (in Canada) on the north. The North Cascades are bor dered by the Puget Sound lowland on the west and the Columbia and Okanogan Rivers on the east. This report covers the glacierized American parts of the range and includes the Wenatchee Mountains west of Blewett Pass, the Entiat and Chelan Mountains, and the mountains west of the Methow and Chewack Rivers (pi. 1). This encompasses an area of about 20,000 km2 180 km in length from north to south and 140 km in maximum width.
The North Cascades are characterized by great vertical relief (pi. 1). Most ridges and peaks, typi cally sharp-crested and rugged, are separated by nar row, steep-walled valleys whose floors are generally less than 1,000 m (meters) above sea level, even near their headwaters. In many valleys, relief changes of 2,000 m occur in a horizontal distance of less than 5,000 m.
Al

A2 GLACIERS IN THE UNITED STATES
Two volcanoes, Mount Baker (3,285 m) and Gla cier Peak (3,213 m), stand conspicuously above the general level of the surrounding peaks, which aver age about 2,500 m in altitude. Of the 20 nonvolcanic peaks that are above 2,700 m, Bonanza Peak (2,899 m) is the highest. Only a few of the higher peaks are on the Cascade divide, a hydrologic boundary that divides the State of Washington into two distinct parts. In much of the North Cascades the divide is so obscure that it is difficult to recognize among the seemingly random jumble of mountain peaks.
Present-day glaciers cover the slopes of higher peaks, cling to the sides of steep ridges, or occupy high-level cirques. The floors and lower slopes of valleys are heavily forested but, at altitudes near timberline, natural alpine parks contain some of the region's most magnificent scenery. Scenic, recrea tional, and scientific possibilities of the region have resulted in the creation of the North Cascades Na tional Park, Lake Chelan and Ross Lake National Recreation Areas, and the Glacier Peak and Pasayten National Wilderness areas. Large hydroelectric de velopments include Ross, Diablo, and Gorge Dams on the Skagit River; Lake Shannon and Baker Lake on the Baker River; and Lake Chelan. Storage dams also impound Spada, Cle Elum, Kachess, and Keeche- lus Lakes.
Access to the region is provided by two cross-State highways Interstate 90, which crosses Snoqualmie Pass, and U.S. 2, which crosses Stevens Pass and by dead-end roads leading into the larger valleys. The North Cascades Highway, now under construc tion, will provide access to some of the most scenic areas. Commercial boats ply Lake Chelan, and sev eral other large lakes are accessible to float planes.
The oldest rocks of the North Cascades are a meta- morphic-plutonic complex that formed before Middle Devonian time. The predominant outcrops in the range are schists and migmatites, probably pre- Jurassic in age, and intrusive rocks which date from Cretaceous and Tertiary time. The present altitude of the range is largely a result of uparching that occurred during the late Cenozoic period. The arch ing, with a north-south trend, was associated with displacements on normal and thrust faults. During the Pleistocene, the volcanoes of Mount Baker and Glacier Peak were superimposed on terrain grossly similar to that of today (Grant, 1969).
All the high mountains have been repeatedly sculp tured by glaciation during the Pleistocene, and their present ruggedness is due largely to ice modification of a highland already maturely dissected by streams
and rivers. During each major glacial episode all high peaks and ridges were accumulation areas for glaciers that descended the major stream valleys. The northern part of the area was invaded by the Cordilleran Ice Sheet which covered most of the Skagit and Methow River drainages. Most of the westward-draining valley glaciers probably joined a lobe of this ice sheet in the Puget Sound lowland dur ing early and middle Pleistocene time (Crandell, 1965). All the larger natural lakes, such as Chelan, Wenatchee, Cle Elum, Kachess, and Keechelus, are retained by moraine dams or are in basins that were overdeepened by ice erosion.
DEFINITION OF A GLACIER
A glacier may be roughly defined as an accumula tion, on land, of perennial ice that slowly flows by creep because of its own weight. An exact definition, however, is more complicated because (1) even thick accumulations of winter or seasonal snow, as well as tiny ice bodies on cliffs, exhibit flow properties, (2) perennial ice that shows no clear evidence of flow may cover large areas, (3) formerly active glaciers may stagnate and cease to show evidence of flow, and (4) perennial ice accumulations fed by avalanches from active hanging glaciers often exhibit little mo tion. Recognition of active-glacier ice is sometimes difficult when it is concealed by seasonal snow. Even where some moving ice is evident, defining the boundaries of individual glaciers presents problems for several of the reasons listed above.
For this study, a glacier is defined as any peren nial ice that has an area of at least 0.10 km2 . Included are (1) active glaciers, (2) ice patches derived from direct snow accumulation, wind drift, or snow ava lanches, without regard for evidence of glacier flow, and (3) relict ice from former active glaciers. Ice patches derived from avalanching of ice from hang ing glaciers are considered to be part of the parent glacier.
PRESENT GLACIERS
There are mountain glaciers of many diverse forms in the North Cascades (pis. 2 and 3). The most common are small ice patches scattered widely throughout the range. Next most common are gla ciers on steep, irregular slopes (pi. SA, B, C, D, F, G). Many cirque glaciers (pi. 2»E, H, 7) are present; Boston Glacier (pi. 3E) covers 7 km2 and is the largest single glacier of this type. McAllister, Honey comb, and South Cascade Glaciers are small valley glaciers. Seven slope glaciers that diverge from a common ice cap on Mount Baker cover an area of
INVENTORY OF GLACIERS IN THE NORTH CASCADES, WASHINGTON A3
35 km2. Small ice fields consisting of contiguous gla ciers of various forms are around Eldorado and Dome Peaks and south of Glacier Peak. The longest glaciers in the North Cascades are the Deming (4.7 km) and Park (4.7 km) on Mount Baker and Honey comb (4.8 km) near Glacier Peak.
COMPILATION METHOD
This report has been compiled by utilizing aerial photographs and large-scale topographic maps re cently published by the Geological Survey. In areas for which these are not available, planimetric maps compiled by the U.S. Forest Service were used. The glacier boundaries were determined from vertical and oblique aerial photographs taken when little snow remained from the previous winter. Informa tion obtained from the photographs was augmented by personal observations. The outlines of the glaciers were traced on the maps and their geographical co ordinates determined (pi. 2). Each glacier was clas sified as to type, form, source, surface, nature of terminus, and activity, using a somewhat modified form of a standard glacier inventory guide recom mended by the International Commission of Snow and Ice (UNESCO/IASH, 1970). These data were placed on computer punchcards. The tabulation scheme and computer compilation program were de signed for all types of glaciers occurring in the United States; thus, not all these categories have been used in this particular study.
LIST OF GLACIERS
The resulting glacier tabulation is shown as table 1, the headings for which are explained below:BASN gives the location in four digits, each denot ing a subdivision, as follows from left to right:
First digit. The number 2 signifies the State of Washington.
Second digit. The major river basins are deline ated as follows:
1 Fraser and Nooksack Rivers2 Skagit River3 Stillaguamish and Snohomish Rivers4 Columbia River
Third digit. Indicates a secondary river basin. Fourth digit. Indicates a tertiary drainage
basin of one or more smaller streams.GL refers to individual glaciers, numbered in a clock wise direction, in each subbasin.LAT and LONG refer to the latitude and longitude of the glacier, in degrees and minutes. Where several
very small glaciers are close enough to fall under the same coordinates, the order in which the numbers appear on plate 2 aids in identification. AREA indicates the area of the glacier, in square kilometers.A gives the probable accuracy of the area determina tion in three categories:
1 Excellent (95 percent). Derived from recent topographic maps of 1:62,500 or larger or from U.S. Forest Service planimetric maps of scale 1:31,680.
2 Good (not used in this report).3 Fair (5 percent). Where derivation was
from modern maps that do not show the glaciers or topography in detail or where aerial photography of good quality was not available.
0 indicates the orientation of the glaciers based on an 8-point compass rose, with 1 as north, 2 northeast, and so on. The orientation represents an average where varying directions of flow are present. LNTH gives the length of the glaciers, in kilometers.CLASS indicates classification of the glaciers by a series of five digits, reading as follows from left to right:
First digit. Glacier form:0 Insufficient information to classify1 Outlet glacier from a large ice sheet
(not used in this report)2 Valley glacier, simple3 Valley glacier, branched4 Branch of another glacier (not used in
this report)5 Icecap on summit or ridge crest6 Cirque or niche7 Slope or irregular topography8 Small ice or snow patch9 Cirque glacier associated with active
rock glacier below (not used in this report)
Second digit. Snow or ice accumulation source: 0 Insufficient information to classify1 Direct snowfall and minor drift snow2 Primarily drift snow3 Avalanche snow
Third digit. Surface conditions:0 Insufficient information to classify1 Not appreciably crevassed2 Moderately crevassed3 Severely crevassed

A4 GLACIERS IN THE UNITED STATES
4 Moderately crevassed in upper part of glacier but inactive in terminal area
Fourth digit. Type of terminus:0 Insufficient information to classify1 Expanded foot, piedmont glaciers (not
used in this report)2 Calving in salt or fresh water3 Coalescing, noncontributing tributary
to a large glacier (not used in this report)
4 Hanging, little reconstructed ice in valley below
5 Hanging, perennial reconstructed ice in valley below
6 Ends on moderate to gentle slopesFifth digit. Terminal activity:
0 Insufficient information to classify1 Rapid retreat2 Slight retreat3 Stationary4 Slight advance5 Rapid advance6 Possible surge (not used in this report)7 Known surge (not used in this report)8 Small-scale avalanching9 Infrequent large-scale avalanching;
may be periodic
TOP lists the altitude of the highest point of the gla cier, not including snow chimneys or ice patches of little area.2BOT lists the bottom altitude, generally the termi nus. 2 Where active glaciers discharge over cliffs to perennial avalanche ice in the valley below, the low est altitudes of the avalanche ice is indicated.ACC lists the mean altitude of the snow accumula tion area. 2ABL lists the mean altitude of the ablation area.2 FRN shows the mean fun-line altitude (average lowest altitude of the seasonal snow remaining at the end of the summer melt season).2 The data shown were derived from averaging 3 or more years' information.E indicates the probable accuracy of the altitude figures in columns ACC, ABL, and FRN. Number 1, indicating areas measured by planimeter and com puted, is not used in this report. Number 2 indicates that glacier outlines on maps of a scale 1:62,500 or larger and a contour interval of 30 m or less were
2 Altitude is given in meters. Where 0 appears, insufficient information was available to obtain a meaningful figure.
checked or adjusted by plotting from recent aerial photographs. On these maps the accumulation and ablation areas were then outlined, and the mean altitude of each was estimated by observing which contour line most nearly divided the area in half. Where 0 appears, usable data were not available.
SUMMARY OF DATA
The present inventory lists 756 glaciers that cover 267 km2 538 of these (220 km2 ) are west of the Cascade divide and 218 (47 km2 ) are east of the divide.3
Within the boundaries of North Cascades Na tional Park, 318 glaciers cover an area of 117 km2 ; this may be compared with 87 km2 of glaciers in Mount Rainier National Park and still smaller ice- covered areas in all other national parks except Mount McKinley National Park, Alaska.
Glacier areas and volumes are tabulated by size categories in table 2. Using data for South Cascade
TABLE 2. Glacier areas and volumes by size categories
Sizecategory
(km2 )
0 0.5.5 11 22 5
5 10
Numberof
glaciers
629683519
5
Area(km2 )
7750506228
Assumedthickness
(m)
20406590
120
Volume(km3 )
1.52.03.25.63.4
Total 756 267 15.7
and Blue Glaciers and other inventories, values of mean thickness were assumed for glaciers in each size class. Thickness data are available for only one glacier in the North Cascades, South Cascade Glacier, which has a mean thickness of 83 m for the main trunk glacier and is 2.6 km2 in area (Meier and Tangborn, 1965, p. 564). The Blue Glacier, in the Olympic Mountains of Washington, has an area of 4.3 km2 and a mean thickness of 133 m (LaCha- pelle, 1965, p. 613). Thickness values in table 2 are based on these data and a compromise between the assumed values for small glaciers given in Canadian (Ommanney and others, 1969) and Russian (Avsiuk and Kotlyakov, 1967) inventories. Most (83 per cent) of the glaciers in the North Cascades are small, less than 0.5 km2 , but these glaciers con tribute only 29 percent of the total area and only 10 percent of the total volume. It is interesting to note that each size category (arranged in a geometric
3 The glaciers Nos. 2455-3 2455-9 and 2463-1 2463-7. shown on plates 1 and 2, were discovered too late to be included in table 1 and the data analysis. The combined area of these small glaciers is about 1 km2.

INVENTORY OF GLACIERS IN THE NORTH CASCADES, WASHINGTON A5
progression), except the largest, contributes a roughly equal share to the total glacier area.
Of all the glaciers in this inventory, those classi fied as ice or snow patches make up 47 percent; those on a slope or irregular topography, 30 percent ; and those occupying cirques or niches, 19 percent. The largest glaciers in the North Cascades are clas sified as valley glaciers. Although in numbers these represent only 2 percent of the inventory, they account for 17 percent of the total glacierized area.
Eighty-one percent of the glaciers are nourished directly by snowfall and minor amounts of drift snow. Fifteen percent are small deposits of ice and snow at the base of steep gullies where most of the snow accumulates as a result of avalanches. Two percent are fed primarily by drift snow. Insufficient information was available for classifying 2 percent of the glaciers either by type or by source of snow.
MEAN ALTITUDE AND ORIENTATION OF GLACIERS
The western slopes and crests of the Cascade Range are subject to heavy precipitation in winter as moisture-bearing storms sweep in from the North Pacific Ocean. As these storms rise and pass over the mountains, most of their moisture is released as rain or snow (fig. 1). Temperatures are usually moderate at all times of the year. At higher alti tudes snow flurries may accompany summer storms and, in winter, rain may occur occasionally, even on the higher peaks. Under normal conditions fall, winter, and spring temperatures are cool enough to permit extremely heavy snow accumulation at altitudes above 1,000 m. At Mount Baker Lodge, where annual precipitation averages 2,790 mm (millimeters), snow on the ground has been meas-
Southwest
ured to a depth of 7.6 m. At South Cascade Glacier, 3,800 mm average annual precipitation has been measured, and snow depths may exceed 10 m in April and May. East of the divide, temperatures are more extreme, and precipitation decreases sharply. At Stehekin the average annual precipitation is 864 mm, while at Chelan (at the eastern edge of the mountains) it is only 277 mm.
Glaciers in the contiguous Western States are re lated to precipitation and latitude on a regional basis. Glacier altitudes are lower toward the north and toward the Pacific coast (Meier, 1961). In limited areas such as the North Cascades, which pre sent a wide variety of topographic forms, these relationships become obscured by local effects of glacier orientation and exposure. Between lat 47° and 49°N., north- and northeast-facing glaciers of the North Cascades receive far less solar radiation than glaciers flowing south and southwest. Glaciers in deep north- and northeast-facing cirques are further protected; snow is also swept into these glacier basins from slopes exposed to the prevailing south and southwest winds. Thus, under otherwise similar topographic conditions, the largest per centage of glaciers lies on north- and northeast- facing slopes (fig. 2). Glaciers draining south are generally much smaller (fig. 2) . Other local anoma lous situations occur. On the exposed slopes of Mount Baker and Glacier Peak, the mean altitudes of glaciers are exceptionally high relative to those of other glaciers in the vicinity. Some unusually low mean altitudes of glaciers are also found, generally where snow and ice masses are sheltered by high protective cliffs, such as at the Entiat glaciers (Nos. 2432-1 2432-5).
Northeast
METERS
100 150 200
DISTANCE, IN KILOMETERS
FIGURE 1; Southwest-northeast profile across the North Cascades showing topography, precipitation, and gradient of mean glacier altitudes. Short, heavier segments on topographic profile indicate glaciers. Precipitation is indicated by circles where measured and by dashed line where inferred from streamflow records.

A6 GLACIERS IN THE UNITED STATES
Meters 2500 r
2000
1500
North
1 2
DISTANCE, IN KILOMETERS
Meters 3000
2500
2000
1500 -
B
South
Datum is mean sea level____I____________I
North
DISTANCE, IN KILOMETERS
FIGURE 2. North-south profiles between (A) Marble Creek and McAllister Creek and (B) Basin Creek and Skagit QueenCreek, showing the effect of orientation on glacier size.
The heavy snow accumulation west of the Cas cade divide has resulted in a few glaciers being situ ated below the regional timberline. South Cascade Glacier, which has a mean altitude of 1,875 m, is the lowest large glacier in the North Cascades. Trees grow on slopes above the accumulation area of this glacier. The other extreme is found well east of the Cascade divide at the southeast extremity of the Stuart Range, where the Snow Creek glaciers (Nos. 2242-3 2242-7) have a mean altitude of 2,493 m, the highest mean altitude of any glaciers in the North Cascades.
The mean altitude of selected glaciers and the annual precipitation on a southwest-northeast pro file across the range are shown in figure 1. The distribution of glacier mean altitudes is shown in figure 3A. Glacier orientation and the configuration
of cirque walls, the occurrence of snow avalanches, and the efficiency of a basin to trap wind-drifted snow are not uniform throughout the area so it is virtually impossible to construct a consistent map of glacier altitudes. The altitudes of selected glaciers of relatively uniform characteristics are shown in figure SB; note how low these altitudes are in com parison with those of the relatively unprotected glaciers on the volcanic cones of Glacier Peak (GP) and Mount Baker (MB).
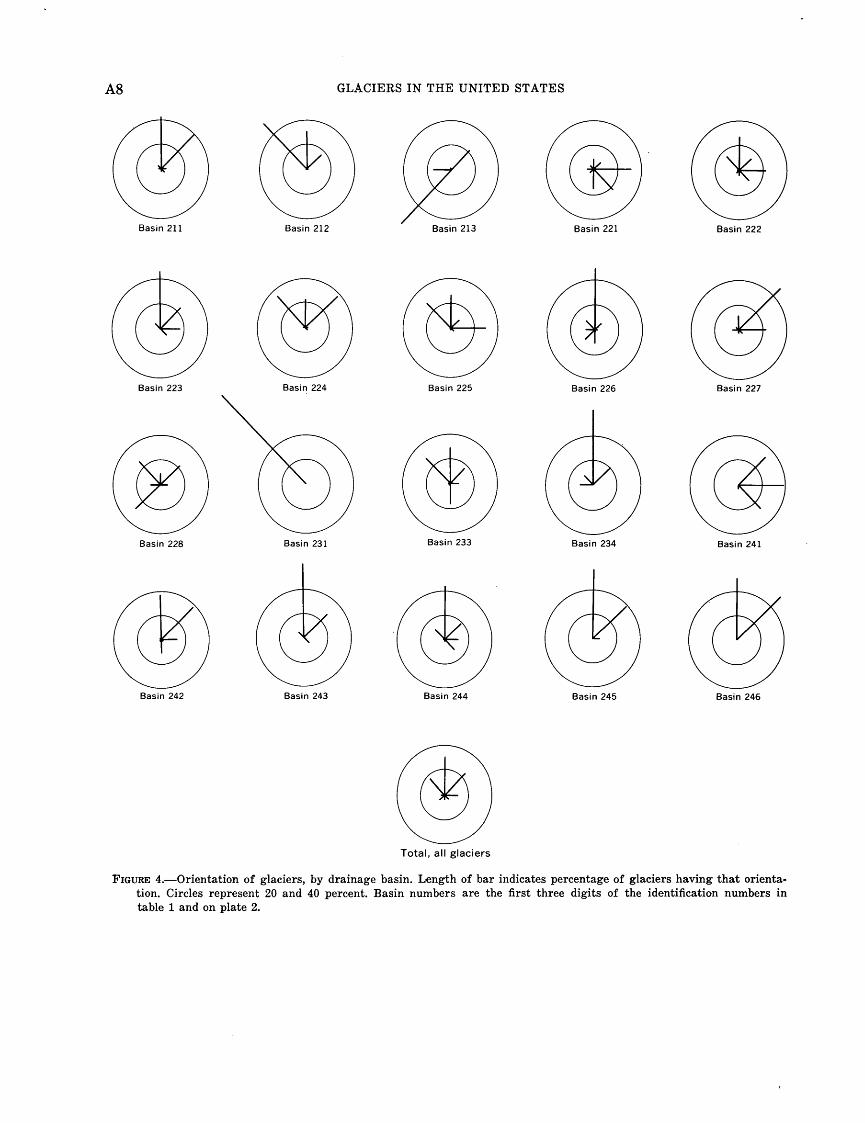
Orientations of the glaciers, by drainage basin, are shown in figure 4. North or northeast orienta tions are favored in most areas. Some drainage basins show very different orientation patterns (for example, basin 213). These orientation anomalies result from high-altitude topography which favors glacier development in more exposed quadrants.

INVENTORY OF GLACIERS IN THE NORTH CASCADES, WASHINGTON A7
122
EXPLANATION
2000
Control pointNumber is altitude, in meters
above mean sea level
FIGURE 3. Mean altitudes of glaciers. The dotted line is the Cascade divide. A, Distribution of mean glacier alti tudes. All mean glacier altitudes within each secondary drainage basin have been averaged and weighted by area; plotting points are the centroids of glacier area in each basin. Although smooth contours can be drawn, a large amount of scatter exists. B, Mean altitudes of glaciers in selected glacierized areas. Solid dots repre sent north- and east-facing glaciers in cirques where there is no appreciable avalanching of snow or ice at the base. Glaciers on the volcanic cones (solid triangles)
ContourShows mean glacier altitude.
Contour interval 200 meters. Datum is mean sea level
show mean altitudes about 300 m higher. Areas are identified as follows: B, Bonanza Peak; C, Mount Chal lenger; CM, Clark Mountain; CP, Cardinal Peak; CR, Chimney Rock; D, Mount Daniel (two points); E, Eldo rado Peak; GP, Glacier Peak; J, Jack Mountain; L, Mount Logan; MB, Mount Baker; MS, Mount Shuksan; R, Mount Redoubt; RR, Ragged Ridge; SC, Snow Creek; SK, Snow King Mountain; SP, Sloan Peak; SS, Silver Star Mountain; T, Tommyhoi Mountain; TS, Twin Sis ters; WC, White Chuck Mountain; WH, Whitehorse Mountain.
RECENT ACTIVITY
Measurements by K. B. Bengtson revealed that the terminus of the Coleman Glacier on Mount Baker began to advance in 1949 (Harrison, 1961). Prior to this, all North Cascades glaciers had been rapidly retreating for several decades, as is clearly demonstrated by extensive barren recently exposed ground near the lower margins of the glaciers. Hubley (1956) reported that 37 of 54 glaciers ob served in the North Cascades between 1953 and 1955 were definitely advancing.
Since 1955 most of the glaciers that Hubley ob served have maintained terminal positions fairly
close to those of 1955; two, the Coleman and Roose velt, have made significant further advances. The Deming, Boulder, Inspiration, and Boston Glaciers have made small gains, as have three others on Glacier Peak. Four less active glaciers (Lynch, White Chuck, South Cascade, and "Banded") have continued to retreat, and six stagnant, relict ice masses have undergone considerable losses. Aside from the last two groups, most of the glaciers of the North Cascades appear to have been in equilibrium with climatic conditions during the past decades.
Several glaciers demonstrate rather remarkable flow properties. Most unusual of these is "Spillway"
A8 GLACIERS IN THE UNITED STATES
Basin 211 Basin 212 Basin 213 Basin 221 Basin 222
Basin 228 Basin 231
Basin 225
Basin 233
Basin 226
Basin 234
Basin 227
Basin 241
Basin 242 Basin 243 Basin 244 Basin 245 Basin 246
Total, all glaciers
FIGURE 4. Orientation of glaciers, by drainage basin. Length of bar indicates percentage of glaciers having that orienta tion. Circles represent 20 and 40 percent. Basin numbers are the first three digits of the identification numbers in table 1 and on plate 2.
INVENTORY OF GLACIERS IN THE NORTH CASCADES, WASHINGTON A9
Glacier (No. 2214-3). Every 2 to 4 years most of this small glacier becomes unstable and avalanches down a steep slope. These movements, however, are not regarded as true glacier surges.
Crevassed, steeply pitched hanging glaciers, com mon in the North Cascades, present unusual hazards as large avalanches may occur at any time. A spec tacular ice avalanche occurs frequently on Johannes- berg Mountain where the small hanging glacier (No. 2262-13) has spilled ice over an area as large as 0.5 km2.
A more comprehensive analysis of recent glacier changes in the North Cascades will appear in another hydrologic report.
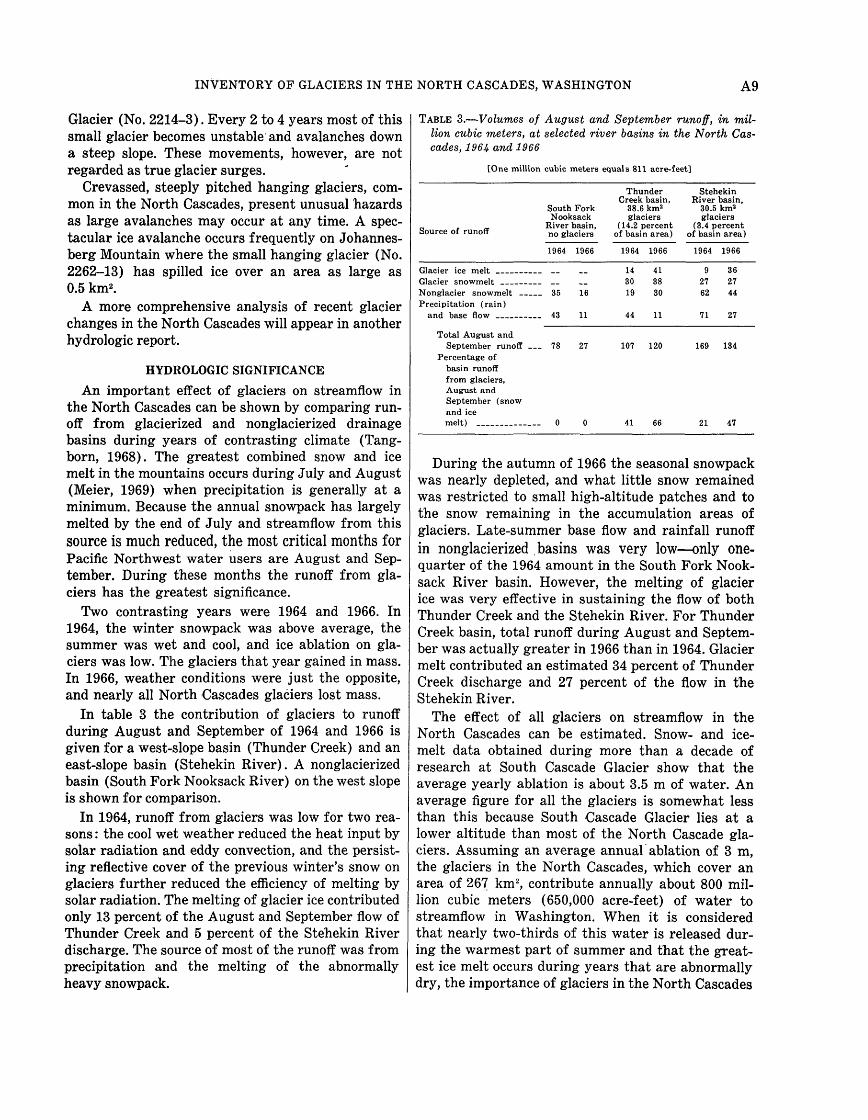
HYDROLOGIC SIGNIFICANCE
An important effect of glaciers on streamflow in the North Cascades can be shown by comparing run off from glacierized and nonglacierized drainage basins during years of contrasting climate (Tang- born, 1968). The greatest combined snow and ice melt in the mountains occurs during July and August (Meier, 1969) when precipitation is generally at a minimum. Because the annual snowpack has largely melted by the end of July and streamflow from this source is much reduced, the most critical months for Pacific Northwest water users are August and Sep tember. During these months the runoff from gla ciers has the greatest significance.
Two contrasting years were 1964 and 1966. In 1964, the winter snowpack was above average, the summer was wet and cool, and ice ablation on gla ciers was low. The glaciers that year gained in mass. In 1966, weather conditions were just the opposite, and nearly all North Cascades glaciers lost mass.
In table 3 the contribution of glaciers to runoff during August and September of 1964 and 1966 is given for a west-slope basin (Thunder Creek) and an east-slope basin (Stehekin River). A nonglacierized basin (South Fork Nooksack River) on the west slope is shown for comparison.
In 1964, runoff from glaciers was low for two rea sons : the cool wet weather reduced the heat input by solar radiation and eddy convection, and the persist ing reflective cover of the previous winter's snow on glaciers further reduced the efficiency of melting by solar radiation. The melting of glacier ice contributed only 13 percent of the August and September flow of Thunder Creek and 5 percent of the Stehekin River discharge. The source of most of the runoff was from precipitation and the melting of the abnormally heavy snowpack.
TABLE 3. Volumes of August and September runoff, in mil lion cubic meters, at selected river basins in the North Cas cades, 1964 and 1966
[One million cubic meters equals 811 acre-feet]
South Fork Nooksack
_ _ River basin, Source of runoff no giaciers
1964 1966
Precipitation (rain)
Total August andSeptember runoff ___ 78 27
Percentage ofbasin runofffrom glaciers,August andSeptember (snowand ice melt) _________ 0 0
Thunder Stehekin Creek basin, River basin,
38.6 km2 30.5 km2 glaciers glaciers
(14. 2 percent (3.4 percent of basin area) of basin area)
1964 1966 1964 1966
14 41 9 3630 38 27 2719 30 62 44
44 11 71 27
107 120 169 134
41 66 21 47
During the autumn of 1966 the seasonal snowpack was nearly depleted, and what little snow remained was restricted to small high-altitude patches and to the snow remaining in the accumulation areas of glaciers. Late-summer base flow and rainfall runoff in nonglacierized .basins was very low only one- quarter of the 1964 amount in the South Fork Nook- sack River basin. However, the melting of glacier ice was very effective in sustaining the flow of both Thunder Creek and the Stehekin River. For Thunder Creek basin, total runoff during August and Septem ber was actually greater in 1966 than in 1964. Glacier melt contributed an estimated 34 percent of Thunder Creek discharge and 27 percent of the flow in the Stehekin River.
The effect of all glaciers on streamflow in the North Cascades can be estimated. Snow- and ice- melt data obtained during more than a decade of research at South Cascade Glacier show that the average yearly ablation is about 3.5 m of water. An average figure for all the glaciers is somewhat less than this because South Cascade Glacier lies at a lower altitude than most of the North Cascade gla ciers. Assuming an average annual ablation of 3 m, the glaciers in the North Cascades, which cover an area of 267 km2 , contribute annually about 800 mil lion cubic meters (650,000 acre-feet) of water to streamflow in Washington. When it is considered that nearly two-thirds of this water is released dur ing the warmest part of summer and that the great est ice melt occurs during years that are abnormally dry, the importance of glaciers in the North Cascades
A10 GLACIERS IN THE UNITED STATES
is evident. A more detailed analysis of the contribu tion of glaciers to streamflow in the North Cascades will appear in another hydrologic report.
REFERENCES
Avsiuk, G. A., and Kotlyakov, V. M., 1967, Mountain glacia- tion in the U.S.S.R.; extension, classification and ice storage in glaciers, Part 1 of Oura, Hirobumi, ed., Physics of snow and ice, Sapporo Conf. 1966: Hokkaido Univ. Inst, Low Temperature Sci., p. 389-394.
Crandell, D. R., 1965, The glacial history of western Washing ton and Oregon, in Wright, H. E., Jr., and Frey, D. G., eds., The Quaternary of the United States: Princeton, N.J., Princeton Univ. Press, p. 341-354.
Fenneman, N. M., 1931, Physiography of western United States: New York, McGraw-Hill, 534 p.
Grant, A. R., 1969, Chemical and physical controls for base metal deposition in the Cascade Range of Washington: Washington Div. Mines and Geology Bull. 58, 107 p.
Harrison, A. E., 1961, Fluctuations of the Coleman Glacier, Mt. Baker, Washington: Jour. Geophys. Research, v. 66, no. 2, p. 649-650.
Hubley, R. C., 1956, Glaciers of the Washington Cascade and Olympic Mountains; their present activity and its rela tion to local climatic trends: Jour. Glaciology, v. 2, no. 19, p. 669-674.
LaChapelle, E. R., 1965, The mass budget of Blue Glacier,Washington: Jour. Glaciology, v. 5, no. 41, p. 609-623.
Meier, M. F., 1961, Distribution and variations of glaciers inthe United States exclusive of Alaska: Internat. Assoc.Sci. Hydrology, Helsinki Assembly 1960, Pub. 54, p. 420-429.
1969, Glaciers and water supply: Jour. Am. WaterWorks Assn., v. 61, no. 1, p. 8-12.
Meier, M. F., and Tangborn, W. V., 1965, Net budget and flowof South Cascade Glacier, Washington: Jour. Glaciology,v. 5, no. 41, p. 547-566.
Ommanney, C. S. L., Goodman, R. H., and Miiller, Fritz, 1969,Computer analysis of a glacier inventory of Axel HeibergIsland, Canadian Arctic Archipelago: Internat. Assoc.Sci. Hydrology Bull. 14, v. 1, p. 19-28.
Russell, I. E., 1885, Existing glaciers of the United States:U.S. Geol. Survey 5th Ann. Rept. 1883-84, p. 344-346.
1897, Glaciers of North America: Boston, Ginn and Co., 210 p.
Tangborn, W. V., 1968, Mass balances of some North Cascade glaciers as determined by hydrologic parameters, 1920- 65: Internat. Assoc. Sci. Hydrology, Bern Assembly 1967, Pub. 79, p. 267-274.
UNESCO/IASH, 1970, Combined heat, ice and water balances at selected glacier basins, a guide for compilation and assemblage of data for glacier mass balance measure ments: UNESCO/IASH Tech. Papers in Hydrology, no. 5, 20 p.
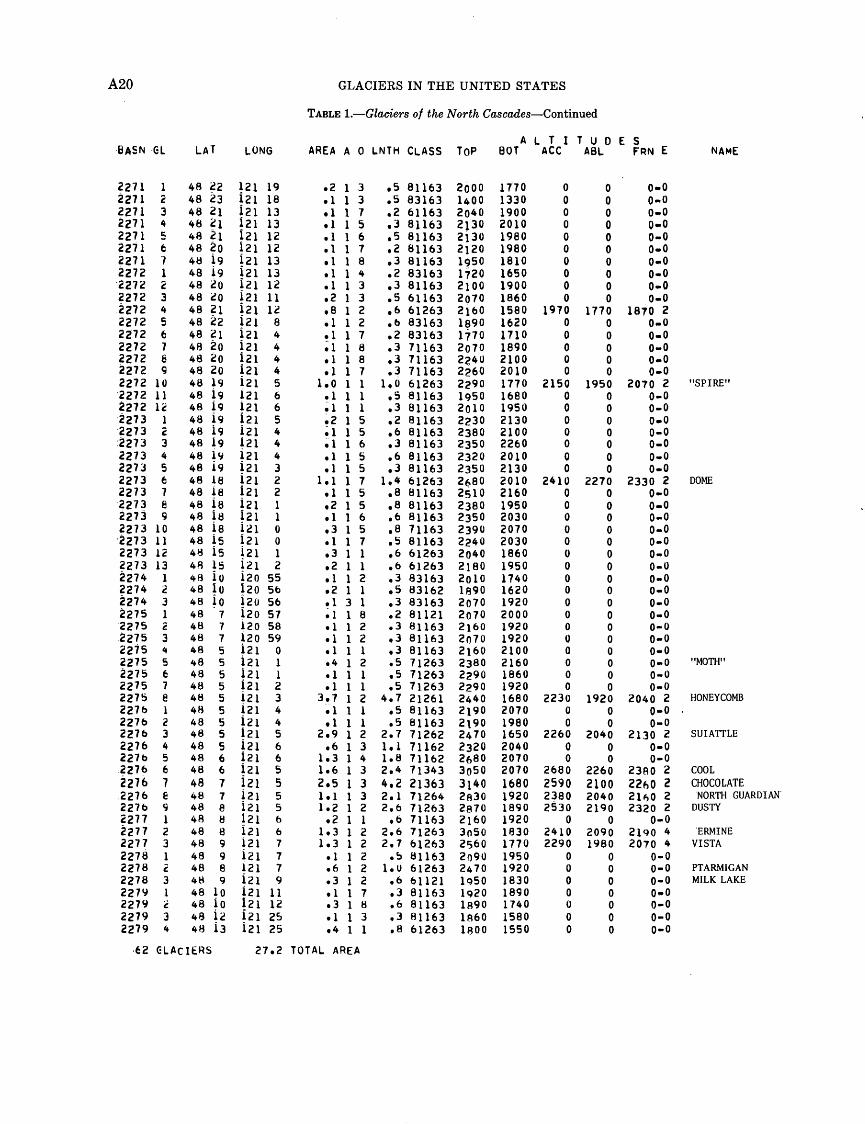
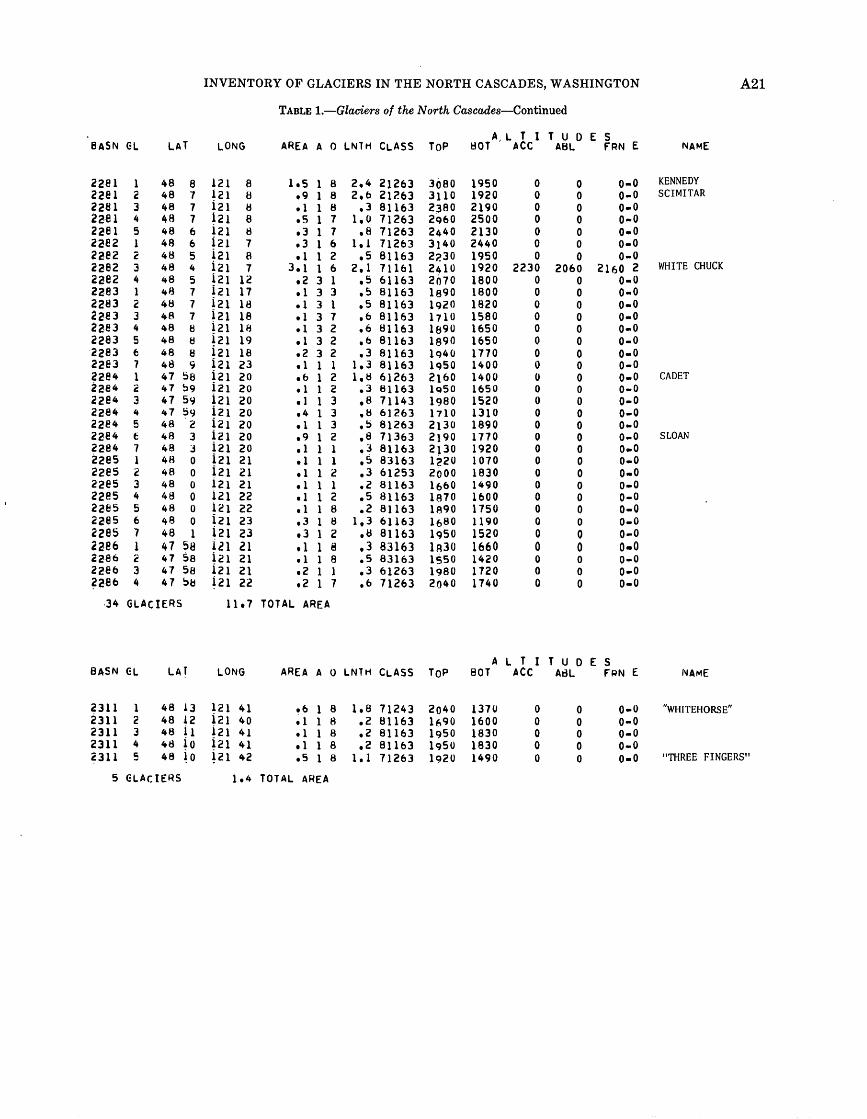
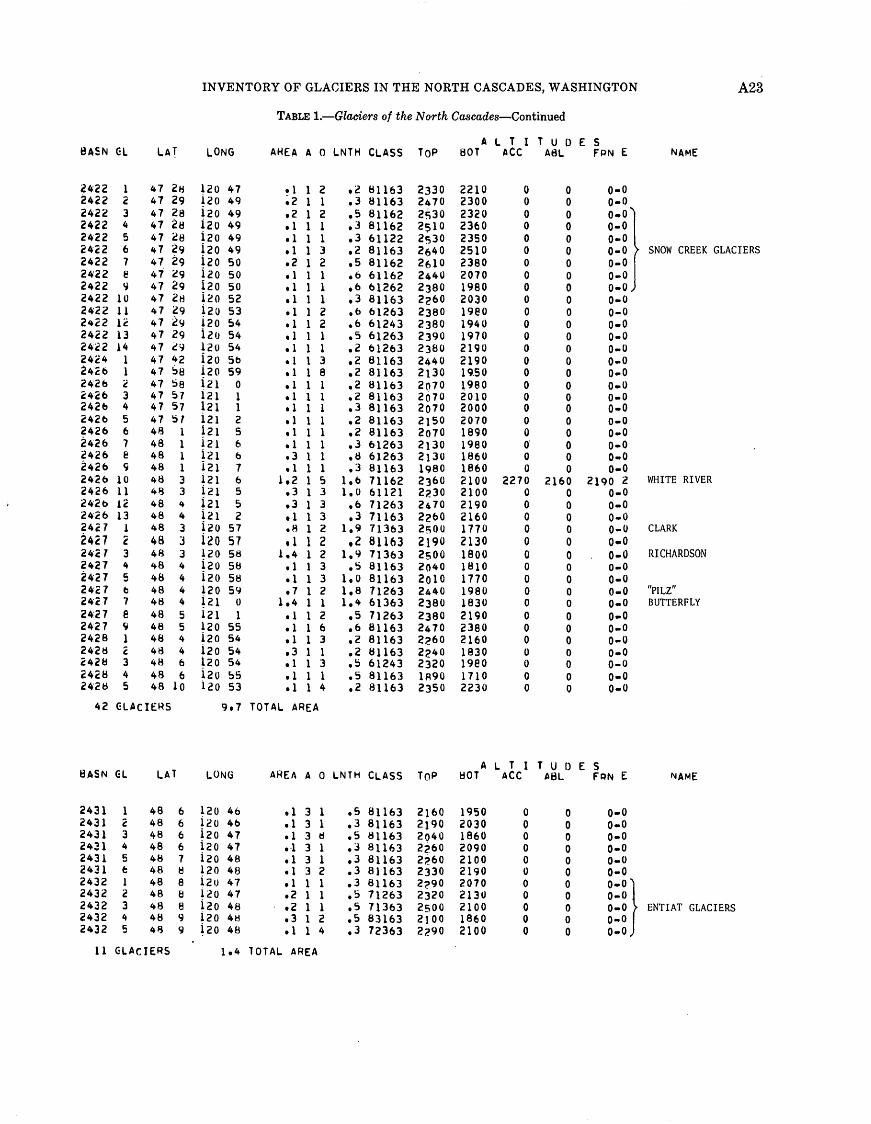
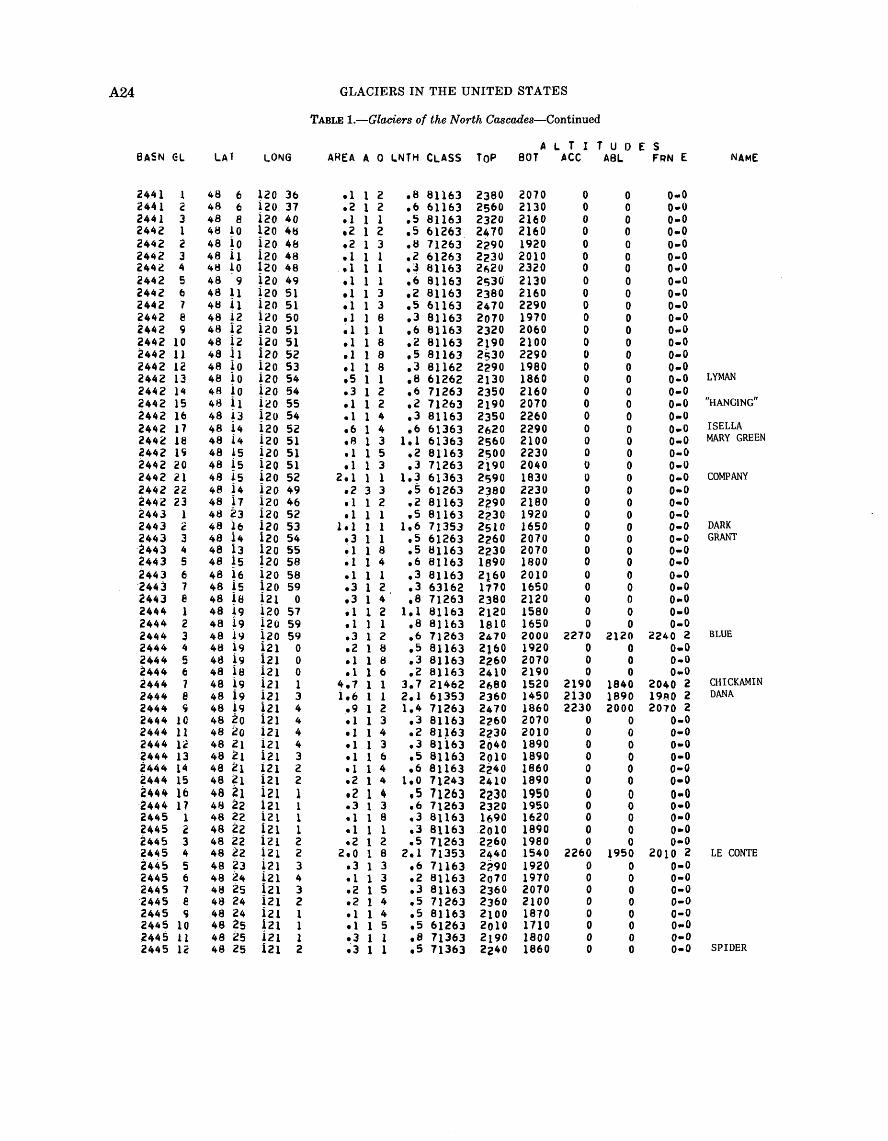
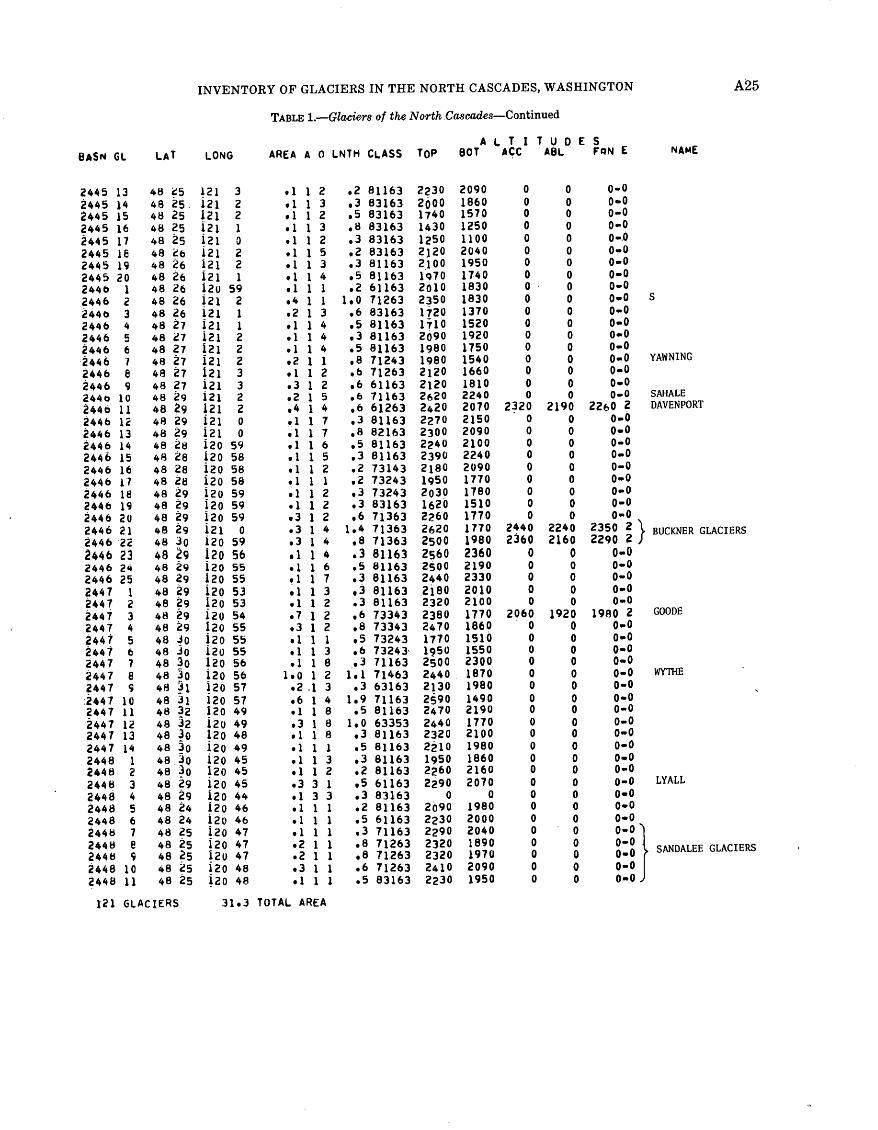
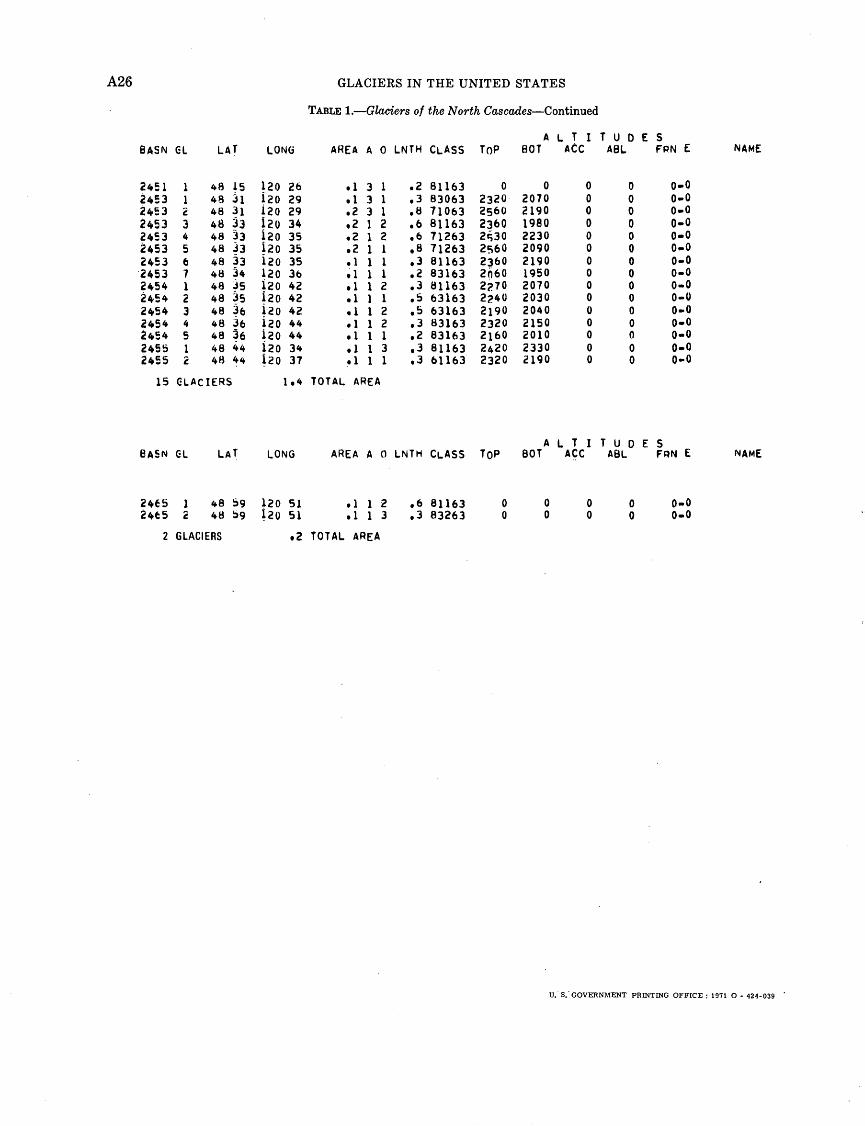
TABLE 1

A12
BASN GL LAT LONG
GLACIERS IN THE UNITED STATES
TABLE 1. Glaciers of the North Cascades
AREA A 0 UNTH CLASS ToPALTITUDES
80T ACC A8L FRN E
2111 12111 22111 32111 42112 12112 22112 32112 42112 52112 62112 72112 62112 92112 102112 112113 12113 22113 32113 42113 52113 62113 72114 12114 22114 32114 42114 52114 62114 72114 82114 92114 102114 U2114 122114 132114 142114 152114 162115 12115 22115 32115 42115 52115 62115 72115 62115 92115 102116 12116 22116 32116 42117 12117 22118 12118 22118 32118 42118 52119 12119 22119 32119 42119 5
49 048 5848 5848 5948 5648 5648 5648 5748 5948 5948 5948 5948 5948 5949 048 5848 5448 5648 5648 5648 5648 6748 5648 5648 by48 5748 5748 5748 5949 049 049 049 048 5949 048 5848 5848 6948 5948 5948 5948 5848 5848 5b48 5848 5848 b«48 5848 5?48 5748 5648 5648 5348 5448 5248 5248 5248 5248 5348 5248 5248 5248 5248 52
121 40121 42121 42121 42121 37121 37121 37121 37121 38121 38121 36121 38121 38121 39121 39121 31121 33121 34121 34121 34121 34121 35121 27121 28121 28121 28121 28121 28121 28121 28121 28121 28121 28121 29121 29121 30i21 30121 31121 15121 15121 15121 15121 15121 16121 17121 18121 19121 19121 18121 18121 19121 20121 22121 22121 23121 23121 24121 25121 2b121 27121 28121 30121 31121 31
1.1.1.6.1tl.1.1tl.1.1.1*2.9.3.1.1.1.1.1.1.2 1.2.1.1.1.1.1.2.1.1.1.1.1.1 1.1.1.1.1 1.1
2.51.0.4.2.3.1.1.2.3.1tl.3.2.1.5.1.3.1.1.1.2
1 51 41 41 11 31 31 31 21 41 41 11 81 11 11 21 11 21 11 21 21 21 21 21 21 21 21 21 21 11 21 11 81 51 11 11 41 11 81 61 81 51 71 81 21 11 21 21 21 71 71 11 11 21 11 11 11 11 11 31 31 11 11 11 1
3.3.2.8.3.2.2.3.2.2,3.3.6
1.0.6.2.5,2.3.5.6.3.3.2.2.2.5.3.2.3,3.2.3.2.5.2.3.2.6.2.2.5.3
2.61.31.3.8
1.1.3,3.3.5.3.2.8,5.3.5.2.6.5.2.2.2
81163811638116371243831638116381163811638116381163612436324361353613636336381163811638116381163811638116381163811638116381163811638116381163811636116381163811638116381163811638116383163811638116381163811638116381163712526136361363811638116381163811636326363163811638116361363613638116361363821637126361163821638216382163
185021302190219015101770180017102070216021601A60216021301R60
0U9019501950U8019401890195020701950192019501920201020702190
021602()302070
0187020902440
0000
25002^302380239021602380
01950189020001980210010601740183015702nlO1980
018302070
183020602130174014001710171015501950195020401680171014901580
01300181017101360154016801800174017701830174018001890I8602010
0198018701860
0163018902330
000
2070174018901780190016802260
017101490190018601650158015501520151017401830
016501780
000
2040000000000
189000000000000000000000000000000
21902130
0000000000000000000
000
1890000000000
174000000000000000000000000000000
20102000
0000000000000000000
1840*02040-02160-01950 2
0-00-00-00-00-00-0o-oo-o0-0
1780 2o-o0-00-00-0o-oo-oo-oo-oo-oo-oo.oo-oo-oo-oo-oo-oo-oo-oo-oo-oo-oo-oo-oo-oo-oo-oo-oo-oo-o
2100 22040 2
o-oo-oo-oo-oo-oo-oo-o0-0o-oo-oo-oo-oo-oo-oo-oo-oo-oo-oo-o
NAME
REDOUBT
64 GLACIERS 12.0 TOTAL AREA
BASN GL
INVENTORY OF GLACIERS IN THE NORTH CASCADES, WASHINGTON
TABLE 1. Glaciers of the North Cascades Continued
A13
LAT LONG AREA A 0 LNTH CLASSALTITUDES
BOT ACC A8L FRN E NAME
2121 12121 £2122 12122 22122 32122 42122 52122 62122 72122 62122 92122 102122 112122 ic2123 1 2123 2 2123 3 2123 4 2123 5 2123 62123 7212* 12124 22124 32124 42125 12126 12126 c 2126 3 2126 42126 52126 62126 72126 82126 92126 10 2127 1 2127 2 2127 32127 4
48 5648 5648 5248 5248 5248 5348 5348 5348 5348 5348 5j48 5448 5448 5448 51 48 50 48 50 48 50 48 51 48 6l48 5048 5048 5048 5048 5048 5148 5048 49 48 49 48 4848 4948 4948 494b 4948 4948 50 48 4H 48 48 48 4748 47
121 38121 38121 32121 33121 33121 34121 34121 34121 35121 35121 35121 35121 36121 36121 32 121 32 121 32 121 34 121 34 121 35121 36121 36121 37121 38121 38121 42121 44121 45 121 46 121 48121 49121 48121 48121 49121 50121 51 121 50 121 51 121 52121 52
.2 1 1
.1 1 1
.5 1 1
.1 1 2
.1 1 1
.1 1 2
.1 1 2
.1 1 2
.1 1 1
.1 1 2
.2 1 2
.1 1 2
.1 1 2
.3 1 8
.137
.5 I 8
.4 1 8 2.9 1 2 .112
1.6 1 8.2 1 1.8 1 8.4 1 1.2 1 1.1 1 1.1 3 1.1 1 1.4 1 1
1.0 1 8 4.1 1 1.2 1 3.2 1 3.1 1 2.6 1 1.2 1 2.1 1 1 .2 1 7
4.1 I 8 5.2 1 1.8 1 6
1.0.2.5.2.5.2.6.6.5.3.5.3.2
1.3.2 .8 .3
1.9 .2
2,1.6
1.4.6.3.3.2.3.5
1,3 3,4.8.5.3.6.2,3 .3
3.9 3.2.8
811638116371263821638316382163831638316382163821637326373263831636326381163 71263 71263 61353 71263 713527324371353713636126381163811637126371163 71263 71362711637116381163712637126382163 61263 71364 7126471264
189019502]601950201019501710192019502040190018301R3020702010 2070 1800 2320 1890 2560247025902160180017101*80
01890 2070 29002J6020102010226020702070 2190 3260 21902190
15501890183018001770I860151015801710183016501650165014901950 1710 1580 1040 1620 1190156014601250155014901550
01710 1620 1430189018301890I86018601920 2010 1400 14001890
0000000D0000000
1920 1710 1920 1780
000
177000000
1830 2130
000000 0
2380 23802100
000000000000000
1770 1600 1550 1680
000
165000000
1690 1770
000000 0
1890 18901980
0-00*0o-oo-oo-oo-oo-oo-oo-oo-oo-oo-oo-oo-oo-o
1830 2 1620 2 1650 2 1710 2 1950 2
0-00-0
1710 2o-o0-00-00-0o-o
1740 4 1890 4
Q.O0-00-0o-o0-0o-o0-0
2070 4 2070 42040 4
NOOKSACK WEST NOOKSACK PRICE
"SHOLES"
MAZAMA
"BASTIEE"
ROOSEVELT COLEMAN
40 GLACIERS 26.2 TOTAL AREA
BASN GL LAT LONG AREA A 0 LNTH CLASS TOP
2131213121312131213121322132
1c34512
48484848484848
47464646454243
121121121121121121121
52525252515859
.9
.2
.1
.14.5.6.9
1111111
77H7622
1.6.6.2.2
4.81.31.0
61262612638316371263213646126371263
7 GLACIERS 7.2 TOTAL AREA
A L T I T U D BOT ACC A8L
E SFRN
1800186021302290134013601620
2260000
244017701770
1980000
174016501660
2070 40-00-0o-o
2070 41680 41690 4
NAME
THUNDER
DEMING
424-039 O - 71 - 2
A14
BASN GL LAT LONG
GLACIERS IN THE UNITED STATES
TABLE 1. Glaciers of the North Cascades Continued
AREA A 0 LNTH CLASS TOP NAME
2211 12211 22211 32211 42211 52211 t2211 72211 62211 92211 102212 12212 22212 32212 42212 52212 62213 12213 22213 32213 42214 12214 22214 32214 42214 52214 62215 12215 22215 32215,. 42216 12216 22216 32216 42216 52216 62217 12217 22217 32217 42217 52217 k2217 72217 62217 92217 102217 112217 1<2217 132217 142218 12218 22218 32218 42218 52218 62218 72218 82218 92219 12219 22219 32219 4
48 4548 4548 4648 4748 4748 4748 4848 4848 4848 4948 4848 4948 4948 5Q48 4g48 4948 4948 4948 4948 4948 4948 5048 5048 5148 5l48 5248 5148 5l48 5048 bo48 5048 5048 So48 4948 4g48 4848 4848 4548 4548 4548 4448 4548 4448 4448 4448 4448 4548 4548 4548 4648 4648 4648 4648 4648 4648 4548 4548 4448 4448 4Q48 4o48 3948 39
121 50121 48121 47121 47121 45121 46121 46121 46121 47121 46121 43121 44121 40121 37121 37121 37121 36i21 35121 34121 33121 33121 31121 31121 32121 31121 30121 27121 27121 22121 23121 22121 21121 21121 21121 21121 23121 24121 23121 24121 25121 26121 26121 27121 28121 28121 29121 28121 29121 29121 28121 27121 28121 29121 29121 29121 29121 29121 29121 30121 32121 31121 33121 34
5,01.63.45.1.1.1.1
1.5.2.1.2.2.1.8.1.1
3,22.3.1.1.1.1.3.1.2.1.4 1,2.1.1.1.8.1.2.2.3.3.2.5.1.2.1.1.1.1.1.1.1.3.2.1.1.2.3.1.1.2
1.0.5.1.4.4
1 51 41 31 31 21 21 21 31 41 53 21 23 11 61 71 71 41 41 51 51 31 21 21 21 41 61 31 41 71 11 61 61 61 73 81 11 83 11 21 11 81 81 11 21 13 21 21 21 41 41 11 11 81 11 11 81 81 83 71 11 71 21 2
3.91.93.54.5.5.5.3
2.7.5.2.5
1.0.3
1.8.6.2
3.13,2.3.2.6.2
1.0.2.8.2
1.3.2
1,4.2.6.5
1.3.2.5.a.3.8.5.5.5.5.3.2.8.3.6.3.3.5.5.2.5
1.0.6.3.2.5
1.11.4.2.5
1.1
21364213632136421364711637126361364712638116382163811638116381163713537124371263713537135381163712636336381163623638116381163811637325381163633538116381163811637126373263633637126371263632638316371263811636U63831638116361263821638316381163811637116381163811636126371363712638116381163811637116361162811636316371163
30502960326032601650189017402290204019801740174016302440232022702560265019502100195021202100177021301650192018901980165022602320232021301870204020701680158019501Q50162013901830183020401580201018302190192019501950216020701890207019802n702040215017401810
165018001490125014601650152013401680177015501430155015201780213011301130183019201580171015801680177014001130177012801580204020701890177015801680189015201460158016801480133016801430183013101840166018601720183015501680180017401940186017401650200015401460
2440226023502410
000
192000000
229000
22302350
000000000000000000000000000000000000000000000
2010195017701860
000
158000000
166000
18902040
000000000000000000000000000000000000000000000
2160 42040 41920 42130 4
0-0o-o0-0
1710 40-0o-o0-00-00-0
2190 20-00-0
2010 22090 2
0-00-00-00-0o-oo-o0-0o-oo-oo-oo-oo-oo-oo-oo-oo-oo-oo-oo-oo-oo-oo-oo-oo-oo-oo-oo-oo-oo-oo-oo-oo-oo-oo-oo-oo-oo-oo-oo-oo-oo-oo-oo-oo-oo-o
EASTON
BOULDERPARK
CURTIS
SULPHIDECRYSTAL
"SPILLWAY"
63 GLACIERS 33.6 TOTAL AREA
BASN C-L
INVENTORY OF GLACIERS IN THE NORTH CASCADES, WASHINGTON
TABLE 1. Glaciers of the North Cascades Continued
A15
LAT LONG AREA A 0 LNTH CLASS ToPALTITUDES
HOT ACC ABL FRN E
2221222122212222222222222222222222222222222222222222222322232223222322232223222322232223222322232223222322232223222322242224222422242224222422242224222522252226222b22262227
1231234567e9
101'(.
345676S
10111213141516
12345676121231
48 4Q48 4Q48 3948 3948 3948 4048 404B 4Q48 4048 4148 4448 4448 4448 4248 4348 4348 4448 4448 4548 4548 454d 4?48 4848 4848 4a48 4648 4648 4648 4648 4448 4448 4448 4548 4548 4648 4648 4648 J948 3948 3548 3448 3548 35
121121121121121121121121121121121121121121121121121121121121121121121121121iaii2i121121121iai121121121121121121121}21121121121121
3030292929292930303129262321212222222222232d212119181716161212Ib15151516169
1011131616
1.0.4.1.1.1.1.1.8.9.1.4 1.1.4.4 1.1.2.2.1.2.2.1.1.2.2.5*2.2.3.2.1.1.1.1.2.2
1.2.2 1.1.1 1
1 31 51 73 33 21 41 31 11 11 11 3I 41 71 31 11 11 11 21 41 21 21 21 31 41 41 61 41 51 61 21 11 21 41 21 21 11 31 81 81 81 11 31 8
1.4.6.6.5.3.3.5
1.41.1.3.8.3,3
1.1.6.6.2.6.6.2.5.5.3.2.3.3.8.6.6.5.3.3,3,5
1.01.1,5
2,6.8.3.2.3,2
71000631628116381163811638116381163612637126381163712638116383163613536136363163831636134371363732637336371263612636126373243731637134371263631636334361263733438116373243733637336371163712637126381163712637116381163
21301710i8601830177017101R90201021001920201019801830192017401710U602070198015801710207018701830Iq50219021902190184015802040171020701950192019501920244021902130177020402010
1710158016201460165016201680158015401770165017101520128013701460131015801580137014601800168017101680198019201970168012201770146018601710134013401600171018602010165017701860
0000000000000000000000000000000000000
219000000
0000000000000000000000000000000000000
186000000
o-oo-oo.oo-oo-oo-oo-oo-oo-oo-oo.oo.oo-oo.oo.oo-oo-oo-oo-oo-oo-oo-oo-oo-oo-oo-oo-oo-o0-0o-oo-oo-oo-oo-oo.oo-o0-0
1950 2o-oo-oo-oo-oo-o
NAME
LADDER CREEK
43 GLACIERS 10.6 TOTAL AREA
A16
BASN GL LAT LONG
GLACIERS IN THE UNITED STATES
TABLE 1. Glaciers of the North Cascades Continued
AREA A 0 LNTH CLASS TOP
223122312231 22312231223222322232 2232223222322232223322332233223322332234 22342234223422342234223422342235223522352235223622362236223622362236223622362236223b22362236223722372237
123 45123 4c
671c3451 e.34567ei2341234567e9
101112
1e.3
48 4748 4?48 48 48 4848 4848 bQ48 4948 49 48 4948 5048 5048 5148 5148 5148 bl48 5248 b548 55 48 5548 5548 b548 b648 5648 5748 5748 5648 5648 5748 5843 5848 5848 5848 b948 5948 5948 5949 049 049 049 048 5948 5648 5648 56
121121121Izi121121121121izi121121121121121121121121121 121121121121121121121121121121121121121121121121121121121121Izi121121121121121
171«1H IB18161718 19202019192122221817 171717181817161415151513131414141515131414151689
10
.6 1 1
.9 1 2,1 1 4 1 1 4.6 1 4.138.2 1 8.4 1 1
1.3 1 21.0 1 3.2 1 3.9 1 3.6 1 1
3.4 1 1.2 1 4.3 1 2.1 1 5.1 1 2 1 1 2.1 1 2 1 1 2.2 1 2.1 1 2.3 1 4.1 1 6.1 1 2 4 1 1.2 1 2.2 1 4.1 1 1 1 1 2.2 1 3.2 1 3.1 1 8.9 1 1.2 1 3.3 1 2.1 1 1.5 1 1.3 1 8.2 1 8.1 1 1.6 1 1.1 1 8
.6 713531.9 73353.3 81163 .6 61363
1.1 71343.3 81163
1,0 73253.8 71343
2.6 733531.6 73353.3 71363
1.1 71263.6 71263
2.7 71352,5 71163.6 73363.3 81163.3 73343 .6 73343.3 73343.2 73343.3 73343.2 81163.8 71263,5 81163.3 81163.5 73243
1.0 61243.3 81163.6 73263.H 63263.0 73263.3 73243.2 71263
1.8 21222.5 81163.5 61343.S 61263.6 61343.8 61263.3 61263,6 83163.8 61343.5 63263
219023802290 20402500207021602130 24702?302?602230219024402?30201020702Q40 2190204020702070210023502320
024102320
00000000000
25302320
000
162013102010 17101830158014901710 1220125019801800192014601950162019801770 1800177018001800198021602190
019501890
00000000000
20701860
000
000 00000 00000
21000000 00000000000000000000000000
000 00000 00000
16500000 00000000000000000000000000
0-00-0o-o o-oo-oo-oo-oo-o o-oo-oo-oo-oo-o
1830 2o-oo-oo-oo-o o-oo-oo-oo-oo-oo-oo-oo-oo-o0-0o-oo-oo-oo-o0-0o-o0-0o-oo-oo-oo-o0-0o-oo-oo-oo-o
NAME
CHALLENGER
44 C-LACIERS 16.8 TOTAL AREA
BASN GL
INVENTORY OF GLACIERS IN THE NORTH CASCADES, WASHINGTON
TABLE 1. Glaciers of the North Cascades Continued
A17
LAT LONG AREA A 0 LNTH CLASS ToPALTITUDES
BOT ACC A8L FRN E
224222422242224422442244224422442245224522«<>224622462246224622462246224622462246224722472247224722472247224722472247234722472247224722472248
122123451212345fc769
101234567fc9
10111213141
48 5948 5948 5948 4448 4548 4548 4?48 *708 4648 *648 3048 3148 3148 3248 3248 3248 3348 3548 3548 4048 3548 3548 3548 3548 3548 3548 3548 3ft08 3648 3648 3648 3?48 4048 4fl48 42
120 51120 52120 52120 54120 55120 55120 57120 58120 57120 57120 47120 48120 49120 48120 48120 49120 49120 51120 51120 55120 52120 53120 54120 54120 54120 55120 56120 59120 59120 59120 59121 0120 58120 57121 2
.1
.1
.1
.2 4.1.5
1.8.1.2.1.2.1.1.1.1.1.2.1.1.5.3.9.1.2.9.1.1tltl.1.1.1.2.1
1 71 81 11 81 21 21 21 81 51 41 11 21 41 31 21 11 21 21 31 21 81 81 21 21 11 11 81 21 21 11 21 11 11 11 2
.2 83263
.5 83263
.3 83263
.6 61221
.6 71262
.3 821631.6 713531.9 61363.2 83263.5 71363.2 83163.5 61161,5 81163.2 73263.2 81163.2 81163.2 81163.5 61163.5 71163.2 81163
1,0 71364.8 71363
1.4 71364.3 61263.3 81163.8 71362.5 81163.3 81163.2 81163,5 81163.3 81163,5 81163.2 81163.3 61263.6 81163
000
2i50000
250000
20702?802470213022602190212020902?702oOO24102*10244021902?602«s30213022102210221021902190204021902210
000
1950000
183000
1980195022901830204019801980189020101900189019501920183018701870186020602100201020401950189018901970
00000000000000000000
21900
22602120
00000000000
00000000000000000000
20100
21202060
00000000000
o-oo-oo.oo-oo-oo-oo-oo-oo-oo-oo-oo-oo-oo-oo-oo-oo-oo-oo-oo-o
2100 2o-o
21QO 22090 2
o-oo-oo-oo-oo«oo-oo-oo-oo-oo-oo-o
NAME
JERRY
LEWIS
MESAHCHIE
KATSUK
KIMTAH
35 GLACIERS 8,2 TOTAL AREA
A18
BASN GL
GLACIERS IN THE UNITED STATES
TABLE 1. Glaciers of the North Cascades Continued
LAT LONG AREA A 0 LNTH CLASSALTITUDES
BOT ACC ABL FPN E NAME
2251 12251 22251 32251 42251 52251 62251 72251 B2251 92251 102251 112251 122251 132251 142251 152252 12252 22252 32252 42252 52253 12253 22253 32253 42253 S2253 62253 72253 62253 92253 102254 12254 22254 32255 12255 22255 32255 42255 52255 62255 72255 82255 92255 102255 112255 122255 132255 142256 12256 22257 12257 2
48 3348 3348 3348 3348 3348 3248 3248 3248 3248 3348 3348 3348 3348 3348 3248 3l48 3o48 3048 3Q48 3048 3248 3248 3148 3148 3148 3248 3348 3348 3348 3448 3448 3448 3548 3548 3648 3548 3548 3548 3548 3548 3548 3448 3448 344H 3448 3448 3548 3848 3948 4"Q48 4Q
120 50120 50120 50120 50120 51120 52120 55120 55120 56120 56120 57120 57120 57120 57120 58120 57120 57120 59121 0121 1121 3121 3121 4121 5121 6121 7121 6121 5121 6121 5121 4121 4121 4121 5121 5121 6121 6121 7121 8121 7121 7121 7121 9121 9121 10121 10121 11121 6121 6121 8121 9
.1 1
.1 1
.1 1
.1 1
.2 1
.1 1
.3 1 4 1.9 1.1 1.3 1 1 1.3 1.8 1
1.1 1.2 1 2 1.2 1 2 1
7.0 1.1 1.5 1
1*9 1 2 1 2 1
5.1 1.7 1 1 1
1.9 11.6 1.1 1 2 1.2 1
1.2 1.1 1.1 1.6 1 2 1.2 1 1 1 1 1
5.4 1.3 1 2 1 8 1.2 1.3 1 2 1
3.0 1 9 1.2 1
88111111338118a682118881135434123217812658222228313
.5 71163
.3 83163
.2 83163
.2 61163
.5 61263
.6 71263
.3 71163
.5 812631.4 71363.3 61263
1.1 71253.3 71163,3 71163
1,4 612632.4 71163.3 81160.5 81100.5 61263.3 61263
2.4 61344.3 71263,5 71263
1.4 71353.5 71263.3 71263
2.9 71243.5 71163.3 8H63
1.3 712532.3 21262.6 81163,5 81163.8 61243
1.4 61162.3 81163.3 81163.6 71163.3 61163.8 61122,5 81163.5 81163
3.9 312621.3 71263.6 71263
1.0 71263.8 71263.6 81163
1.1 611633.5 712621,0 61162.5 8U63
232019201920226023202190232022602710238022302350229027102&20232021602060219026502360238024402o7026702700244U2?6025502410219024102190238020102320244022302070229023202<OO2~l302QOO2180200020901980244021902i90
201018401800207020601830210019801830201017402070195020701950224019201710197015202040201013701800186014802010198016501720186020101800183018602230180018901550207021001200165015801650165017101460165017701950
000000
223021302380
0000
244000000
223000
210000
226000
22902270
000
21900000000
2260000000
21902030
0
000000
216020402130
0000
218000000
189000
177000
189000
19801950
000
18900000000
1540000000
18601870
0
o-oo-oQ.Oo-oo-oo-o
2190 22090 22290 2
o-oo-oo-oo-o
2320 20-00-00*0o-oo-o
2040 20-0o-o
1950 20-00-0
2010 20-0o-o
2130 22120 2
0-00-0o-o
1980 20-0o-o0-00-00-00-0o-o
2010 2o-oo-o0-0o-oo-oo-o
19RO 21950 2
o-o
DOUGLAS
"BANDED"
FREMONT
THUNDER CREEK
BOSTON
FORBIDDEN
INSPIRATION
KLAWATTINORTH KLAWATTI
MCALLISTER
NEVECOLONIAL
51 GLACIERS 39t3 TOTAL AREA
BASN C-L
INVENTORY OF GLACIERS IN THE NORTH CASCADES, WASHINGTON
TABLE 1. Glaciers of the North Cascades Continued
A19
LAT LONG AREA A 0 LNTH CLASSALTITUDES
BOT ACC A8L FRN E
2261 12261 22261 32261 42261 52261 62261 72261 82261 92261 102262 12262 22262 32262 42262 52262 62262 /2262 62262 92262 102262 112262 122262 132263 12263 22263 32263 42263 52263 62263 72263 62264 i2264 22264 32264 42264 52264 62264 72264 82264 92264 102264 112264 122264 132265 12265 22265 32265 42265 52266 12266 c2266 32266 42267 12267 c2260 12268 c2268 32268 42269 12269 i226^ 32269 42269 5
48 3448 3448 3348 3348 3348 3248 3148 3148 3148 3448 3148 3148 3l48 3148 3148 3148 3048 3048 3048 2848 2848 2848 2848 2848 2648 2548 2548 2548 2548 2548 2548 2548 2548 2348 2248 2148 2248 2248 2248 2348 2348 2348 2448 2448 2248 2248 2248 2248 2248 2448 2448 2448 2448 2548 2548 2748 2748 2448 244ft 2448 2448 2448 2348 23
121121121121121121121121}21121121121121121121121121121121}21121121121121121121121121121121121121121121121121121121121121121121121121121121121i2i121121121121121121121121121121121121121121121121
1010998899
10161098655443445663344445444333488b9
10101012131414141516161617191918191717172021
.1
.1
.8
.2
.5 1.2.8.3.3.1.1
1.5.1.1.1.3.2.9.1.1.2.3.1.1
1.0.3.1.1.1.1.1.1.1.2.1
2.9.5.6.1.1.1.1.1.2 8.1.1.1.1
1.3.2.1.3.8.1.1.3.1.1.1.5.3.1
1 61 61 61 61 61 71 71 81 11 41 61 41 51 51 71 71 51 51 71 11 11 11 11 61 81 11 11 81 81 81 81 51 61 81 81 71 11 11 21 31 11 21 11 11 81 11 21 11 21 21 11 21 31 21 11 11 31 11 11 41 51 61 81 7
.3
.31.1.6
1.1.3.5
1.1.5.6.3.3
1.1.3.3.3.6.8
1.1,3.3
1.31.0.2.5
2.41.0.5.3,3,3.5.3.3.5.5
3.9.8
1.0,5.3.3.5.6.6
1.0.3.3.5.3
1.0.5.3,8
1.4.5.3.5.5.3,3
1.11.6.6
81163811636116271163711638116373163712637126361162811638116371262811636126361263612636126361263711637116373253613438116381163212627124361263612636126361163811638116381163811638116321222712436116283162811638116381163811638116371263831638116381163811637125281163811637116371262811638116381163811638116381163611626116371163
22302?302500238024402240192021302120i9602}902040236021502130226023002*2026101870195020702s3020102190242023902?60241022902 130230023802?60241023302180223021301830178019502Q602Q4019202130172018901800198021602120216021902230194019702130181021602010197018901890
2070203019402100186019501600146017801830195019201890207019502010201020402040165017401100178018302000137018001980213020701890207021902070207020401620178016901650165018101770171015701520158016301580180015401860194018901660175018401840168020401940177014901650
000000000000
226000000
2380000000
21300000000000
1970000000000000000000000000000
000000000000
204000000
2190000000
17400000000000
1750000000000000000000000000000
o-oo-oo-oo-oo-oo-oo-oo-oo-o0 1o-oo-o
2160 2o-oo-oo-oo-oo-o
2290 2o-oo-oo-oo-oo-oo-o
2010 20-0o-oo-oo-oo-oo-oo-oo-oo-oo-o
I860 2o-oo-oo-oo-oo-oo-oo-oo-oo-oo-oo-oo-oo-oo-oo-oo-oo-oo-oo-oo-oo-oo-oo-o0-0o-oo-oo-o
NAME
"MONOGRAM"
ELDORADO
"QUIEN SABE"
MIDDLE CASCADE
SOUTH CASCADE
64 GLACIERS 19.4 TOTAL AREA
A20
BASN GL
GLACIERS IN THE UNITED STATES
TABLE 1. Glaciers of the North Cascades Continued
LAT LONG AREA A 0 LNTH CLASS TOPALTITUDES
BOT ACC A8L FRN E NAME
2271 12271 22271 32271 42271 52271 62271 72272 12272 22272 32272 42272 52272 62272 72272 62272 92272 102272 112272 122273 12273 22273 32273 42273 52273 62273 72273 82273 92273 102273 112273 122273 132274 12274 22274 32275 12275 22275 32275 42275 52275 62275 72275 82276 12276 22276 32276 42276 52276 62276 72276 fi2276 92277 12277 22277 32278 12278 22278 3227V 12279 22279 32279 4
48 2248 2348 2148 *148 2148 2048 1948 1948 2048 2048 2148 2248 2148 2048 2048 2048 1948 1948 1948 1948 1948 1948 1948 1948 1648 1848 1848 1848 1848 1548 1548 1548 1048 lO48 Io48 "748 748 748 548 548 548 548 548 548 548 548 548 648 648 748 748 848 848 848 948 948 848 948 1048 1048 1248 13
121121121121121izi121121121121121121121121121121121121121121121121121121121121121i2i121121121121120120120120iao120121121121121121121121121121121121121121121121121121121121121121121121izi
1918131312121313121112844445665444322110012
55565657585901123445665555667779
11122525
.2 1 3
.1 1 3
.1 1 7
.1 1 5
.1 1 6
.1 1 7
.1 1 S
.1 1 4
.1 1 3
.2 1 3
.6 1 2
.1 1 2
.1 1 7
.1 1 8
.1 1 8
.1 1 71.0 1 1.1 1 1.1 1 1.2 1 5.1 1 5.1 1 6.1 1 5.1 1 5
1.1 1 7.1 1 5,2 1 5.1 1 6.3 1 5.1 1 7.3 1 1.2 1 1.1 1 2.2 1 1.1 3 1 1 1 8.1 1 2 1 1 2 1 1 1.4 1 2 1 1 1.1 1 1
3.7 1 2.1 1 1tl 1 1
2.9 1 2.6 1 3
1.3 1 41.6 1 32.5 1 31.1 1 31.2 1 2 2 1 1
1.3 1 21.3 1 2.1 1 2.6 1 2.3 1 2.1 1 7.3 1 8.1 1 3.4 1 1
.5 81163
.5 83163
.2 61163,3 81163.5 81163.2 81163.3 81163.2 83163.3 81163.5 61163.6 61263.6 83163.2 83163.3 71163.3 71163.3 71163
1.0 61263.5 81163.3 81163.2 81163.6 81163.3 81163.6 81163.3 81163
1.* 61263.8 81163.8 81163.6 81163.8 71163.5 81163.6 61263.6 61263.3 83163.5 83162.3 83163.2 81121.3 8H63.3 81163.3 81163.5 71263.5 71263.5 71263
4.7 21261.5 81163.5 81163
2.7 712621,1 711621.8 711622.4 713434.2 213632.1 712642.6 71263,6 71163
2.6 712632.7 61263.5 81163
1.0 61263.6 61121.3 81163.6 81163,3 81163.8 61263
2000UOO20402}30213021201950172021002070216018901770207022402260229019502010223023802350232023502*8025102380235023902240204021802010189020702070216020702160238022902290244021902\90247023202680305031402830287021603o50256020902470195019201890i8601800
17701330190020101980198018101650190018601580162017101890210020101770168019502130210022602010213020102160195020302070203018601950174016201920200019201920210021601860192016802070198016502040207020701680192018901920183017701950192018301890174015801550
0000000000
197000000
21500000000
241000000000000000000
223000
226000
2680259023802530
024102290
0000000
0000000000
177000000
19500000000
227000000000000000000
192000
204000
2260210020402190
020901980
0000000
0-0o-o0-0o-oo-oo-oo-oo-oo-oo-o
1870 20-00-00-0o-oo-o
2070 20-00-00-00-0o-oo-oo-o
2330 20-0o-o0-00-0o-oo-oo-oo-oo-oo-oo-oo-oo-o0-0o-oo-oo-o
2040 2o-oo-o
2130 20-00-0
23BO 22260 22lf>0 22320 2
0-02190 42070 4
0-00-00-00-00-00-00-0
"SPIRE"
DOME
"MOTH"
HONEYCOMB
SUIATTLE
COOLCHOCOLATENORTH GUARDIANDUSTY
ERMINEVISTA
PTARMIGANMILK LAKE
62 GLACIERS 27.2 TOTAL AREA
BASN GL
INVENTORY OF GLACIERS IN THE NORTH CASCADES, WASHINGTON
TABLE 1. Glaciers of the North Cascades Continued
A21
LAT LONG AREA A 0 LNTH CLASS TOPALTITUDES
HOT ACC ABL FRN E NAME
2281226122812261226122622262226222622283228322632263226322632263226422642264226422642264228422652265226522652265228522652266228622662286
123451234123456712345fc71I345671234
48 848 748 748 708 648 648 548 448 548 748 748 748 848 «48 848 947 5847 b947 5947 5948 248 348 348 Q48 048 048 048 048 048 147 5847 5847 5847 be)
121121121121121121121121121121121121121121121121121121121121121121121121121121121121121121in121121121
88888787
1217181818191823202020202020202121212222232321212122
1.5 1 8.9 1 8.1 1 8.5 1 7.3 1 7.3 1 6.1 1 2
3.1 I 6.2 3 1.133.1 3 1.137.132.132.232.1 1 1.6 1 2.1 1 2.1 1 3.4 1 3.1 1 3.9 1 2.1 1 1.1 1 1.1 1 2.1 1 1.1 1 2.1 1 8,3 1 8.3 1 2.1 1 8.1 1 8.2 1 1.2 1 7
2,42.6.3
1,0.8
1.1.5
2,1.5.5.5.6,6.6.3
1.31,8.3.8.«.5.8.3.5.3.2.5.2
1.3.8.3.5.3.6
21263212638116371263712637126381163711616116381163811638116381163811638116381163612638116371143612638126371363811638316361253811638116381163611638116363163831636126371263
3Q80311023802960244031402?3024102070189019201710189018901940195021601Q5019801710213021902130122020001660187018901&8019501R30155019802040
1950192021902500213024401950192018001800182015801650165017701400140016501520131018901770192010701830149016001750119015201660142017201740
0000000
223000000000000000000000000000
0000000
206000000000000000000000000000
0.0 KENNEDY0-0 SCIMITAR0-0o-oo-oo-oo-o
2160 2 WHITE CHUCKo-oo-oo-oo-oo-oo-oo-oo-o0-0 CADET0-00-0o-oo-o0-0 SLOAN0-0o-oo.oo-oo-o0-0o-oo-oo»oo-oo-oo-o
34 GLACIERS 11.7 TOTAL AREA
BASN
23112311231123112311
GL
12345
LAT LONG
4848484848
131211io10
121121121121121
4140414142
AREA A
.6 1
.1 1 1 1.1 1.5 1
0
88888
LNTH
1.8.2.2.2
1.1
CLASS
7124381163811638116371263
TOP
20401690195019501920
80T ACC ABL
13701600183018301490
00000
00000
FRN E
o-oo-oo-oo-oo-o
NAME
"WHITEHORSE"
"THREE FINGERS"
5 GLACIERS 1.4 TOTAL AREA
A22
BASN GL LAT
GLACIERS IN THE UNITED STATES
TABLE 1. Glaciers of the North Cascades Continued
LONG AREA A 0 LNTH CLASS ToPALTITUDES
80T ACC A8L FRN E NAME
2331233223322332233223322332233223322332233423342334233423342334233423342334
11234c6789123456789
48474747474747474747474747474747474747
15757be585858585858353435343435353433
121121121121121121121121121121121121121121121121121121121
31212121212020201918111111121213141517
.2
.1tl.1.9.1.1.1.1.1.1.9 1.3.8.2
1.3.1.1
3111111111111111111
8333567332118121811
1.3.3.2.3
1.6.5.2,3.5,3.6
1.6.2
1.11.1.6
2.4.2.3
81163811637124372263212627126381163712638316381163611637122283163611637116381162711626116361163
1650192020302420174020102130223014301570219023902130198022902130223017701800
0000
1660000000
21900000000
0000
1570000000
19000000000
0-0o-o0-00-0
1620 20-0o-o0-0o-o0-0o-o
2010 20-00-00-00-0o-oo-o0-0
COLUMBIA
LYNCH
HINMAN
19 GLACIERS 5.7 TOTAL AREA
BASN GL LAT LONG AREA A 0 LNTH CLASS ToPALTITUDES
80T ACC ABL FPN E NAME
234223422342234223422342
1c3456
47 3247 3247 3247 3l47 3047 29
121121J 21121121121
16161617IB19
.1 1 8 1 1 1.1 1 2.5 1 1.1 1 7.1 1 2
3 81163.5 83163.6 81163
1.6 71162.2 73163.5 81163
195017101870213019502100
178015201630172017401870
000000
000000
0-0o-oo-o0-00-00-0
6 GLACIERS 1.0 TOTAL AREA
BASN GL LAT LONG AREA A 0 LNTH CLASSA L T I T U D
80T ACC ABLE S
FPN E NAME
24132413241324132413241324132413241424152415241524152415
1234567e112345
47 2947 *947 3<J47 3047 3o47 3147 3147 3147 3247 3447 3447 3447 3447 35
121121}21121121121121121121121121121121121
1918181717171716151010101010
.2
.2
.2
.1
.4
.1
.2
.1
.1
.2
.1
.1
.5
.1
1 31 31 41 41 41 31 21 51 31 31 31 31 21 2
.5
.3
.5
.61.3.3.6.2.3.6,2.2.8.2
811.6381163811638116371243831637124381163811636116281163811637126381163
2070207021001*60207017702?60H60171021202320235024102160
18001780183014601480160019501420158019002160210019502010
00000000000000
00000000000000
o-oo-oo-oo-o0-00*0o-oo-o0-0o-o0-00-00-0o-o
14 GLACIERS
BASN GL
INVENTORY OF GLACIERS IN THE NORTH CASCADES, WASHINGTON
TABLE 1. Glaciers of the North Cascades Continued
A23
UT LONGALTITUDES
BOT ACC A8L FPN E NAME
2422 12422 22422 32422 42422 52422 62422 72422 fi2422 92422 102422 112o22 122422 132422 142424 12426 1242 6 22426 32426 42426 52426 62426 72426 £2426 92426 102426 112426 122426 132427 12427 22427 32427 < 2427 52427 62427 72427 62427 SI2428 12428 22428 3242 8 42428 5
474747474747474747474747474747474747474748484848484848484848484848484848484848484848
2829282828292929292829^929*942bebe5757b7
111133443334444554466
10
120120120120120120120120120120120120120120120120121121121121121121121121121121121121120120120120120120121121120120120120120120
47494949494950505052535454545659011256676552
57575858585901
555454545553
1.2.2.1.1.1.2.1.1.1 1.1.1.1.1.1.1.1.1.1.1.1.3.1
1.2.3.3.1.8
.11.4.1.1.7
1.4.1.1.1.3.1.1.1
1 21 11 21 11 11 31 21 11 11 11 21 21 11 11 31 81 11 11 11 11 11 11 11 11 51 31 31 31 21 21 21 31 31 21 11 21 61 31 11 31 11 4
.2
.3
.5
.3
.3
.2
.5
.6
.6
.3
.6
.6
.5
.2
.2
.2
.2
.2
.3,2.2.3.6.3
1.61.0.6.3
1.9.2
1.9.5
1.01.81.4.5.6.2.2.5.5.2
811638116381162811626112281163811626116261262811636126361243612636126381163811638116381163811638116381163612636126381163711626112171263711637136381163713638116381163712636136371263811638116381163612438116381163
23302470253025102«j3026*02610244023802?60238023802390238024402130207020702Q70215020702130213019802360223024702?602SOO2190250020402010244023802380247022602?40232018902350
2210230023202360235025102380207019802030I960194019702190219019.5019802010200020701890I96018601860210021002190216017702130180018101770198018302190238021601830I96017102230
000000000000000000000000
227000000000000000000
000000000000000000000000
216000000000000000000
o-oo-oo-o^io-oo-o0-0 > SNOW CREEK GLACIERS0-0o-oo-ojo-oo-oo-oo-oo-oo-oo-oo-oo-oo-oo-oo-oo-oo-o0-0
2190 2 WHITE RIVERo-oo-oo-o0-0 CLARKo-o0-0 RICHARDSON0-00-00-0 "PILZ"0-0 BUTTERFLYo-oo-oo-o0-00-0o-oo-o
42 GLACIERS 9.7 TOTAL AREA
BASN GL LAT LONG AREA A 0 LNTH CLASSALTITUDES
BOT ACC A8L FPN E
24312431243124212431243124322432243224322432
12345fc123< 5
4848484848484848484848
66667886899
120120120120120120120120120120120
4646474748484747484H48
.1
.1
.1
.1
.1
.1
.1
.2
.2
.3
.1
33333311111
11d11211124
.5
.3
.5
.3
.3
.3
.3
.5
.5
.5
.3
8116381163811638U6381163811638116371263713638316372363
216021902Q402?602?6023302?902320250021002290
19502030I86020902100219020702130210018602100
00000000000
00000000000
o-oo-oo-oo-oo-oo-oo-oo-oo-oo-oo-o
11 GLACIERS 1.4 TOTAL AREA
NAME
ENTIAT GLACIERS
A24
BASN GL
GLACIERS IN THE UNITED STATES
TABLE 1. Glaciers of the North Cascades Continued
LAT LONG AREA A 0 LNTH CLASSALTITUDES
80T ACC A8L FPN E NAME
2441 12441 22441 32442 12442 22442 32442 42442 52442 62442 72442 82442 92442 102442 112442 122442 132442 142442 152442 162442 172442 162442 192442 202442 212442 222442 232443 12443 22443 32443 42443 52443 62443 72443 fi2444 12444 22444 32444 42444 52444 62444 72444 62444 92444 102444 112444 122444 132444 142444 152444 162444 172445 12445 22445 32445 42445 52445 62445 72445 2445 924«5 102445 112445 12
48 648 648 848 1048 1048 H48 1048 948 1148 il48 1248 1248 1248 1148 lO48 1048 1048 U48 1348 1448 U48 1548 1548 1546 1448 i?48 2348 1648 1448 i348 1548 1648 1548 1848 1948 1948 1948 1948 1948 1848 1948 1948 1948 2048 2048 2148 2148 2148 2148 2148 2248 2248 2248 2248 2248 2348 2448 2548 2448 2448 2548 2548 25
120 36120 37120 40120 4«120 48i20 48120 48120 49120 51i20 51i20 50120 51120 51120 52120 53120 54120 54i20 55120 54120 52120 51120 51120 51120 52i20 49i20 46120 52120 53120 54i20 55120 58120 58120 59121 0120 57i20 59120 59121 0121 0121 0i21 1121 3121 4121 4121 4i21 4i21 3121 2i2l 2121 1121 1121 1121 1121 2121 2121 3121 4i21 3i21 2121 1121 1i21 1121 2
.1 1 2
.2 1 2
.1 1 1
.2 1 2
.2 1 3
.1 1 1
.1 1 1
.1 1 1
.1 1 3 113.1 1 8.1 1 1.1 1 8.1 1 8.1 1 8.5 1 1.3 1 2.1 1 2.1 1 4 614,8 1 3.1 1 5.1 1 3
2,1 1 1.233.1 1 2.1 1 1
1.1 1 1 3 1 1 1 1 8.1 1 4.1 1 1.312,.3 1 4.1 1 2.1 1 1.3 1 2.2 1 8.1 1 8.1 1 6
4.7 1 11.6 1 1.9 1 2.1 1 3.1 1 4.1 1 3 1 1 6.1 1 4.2 1 4.2 1 4.3 1 3.1 1 8.1 1 1.2 1 2
2.0 1 8.3 1 3.1 1 3.2 1 5.2 1 4.1 1 4.1 1 5 3 1 1.3 1 1
.8
.6,5.5.8.2,3.6.2.5.3.6.2.5.3.8.6.2.3.6
1.1.2.3
1.3.5.2.5
1.6.5.5.6.3.3.8
1.1.8.6.5.3.2
3.72.11.4.3.2.3.5.6
1.0.5.6,3.3.5
2.1.6.2.3.5.5.5.8.5
811636116381163612637126361263811638116381163611638116381163811638116381162612627126371263811636136361363811637126361363612638116381163713536126381163811638116363162712638116381163712638116381163811632146261353712638116381163811638116381163712437126371263811638116371263713537116381163811637126381163612637136371363
2380256023202470229022302*202530238024702070232021902OO229021302350219023502620256025002190259023802290223025102260223018902160177023802120181024702160226024102680236024702?6022302Q402010224024102230232016902010226024402?902o702360236021002010219022*0
20702130216021601920201023202130216022901970206021002290198018602160207022602290210022302040183022302180192016502070207018002010165021201580165020001920207021901520145018602070201018901890I860189019501950162018901980154019201970207021001870171018001860
000000000000000000000000000000000000
2270000
219021302230
00000000000
226000000000
000000000000000000000000000000000000
2120000
184018902000
00000000000
195000000000
0-00-0o-oo-o0*>0o-oo-oo-oo-oo-oo-oo-o0-0o-oo-oo-oo-oo-oo-oo-oo-oo-oo-oo-oo-oo-oo-oo-oo-oo-oo-oo-oo-oo-oo-oo-o
2240 2o-oo-oo-o
2040 21990 22070 2
0-00-0o-oo-oo-oo-oo-oo-oo-oo-oo-o
2010 2o-oo-oo-oo-oo-oo-oo-oo-o
LYMAN
"HANGING"
ISELLAMARY GREEN
COMPANY
DARKGRANT
BLUE
CHICKAMINDANA
LE CONTE
SPIDER
BASN GL
INVENTORY OF GLACIERS IN THE NORTH CASCADES, WASHINGTON
TABLE 1. Glaciers of the North Cascades Continued
A25
LAT LONG AREA A 0 LNTH CLASS TOPALTITUDES
BOT ACC ABL FPN E NAME
2445 132445 142445 152445 162445 172445 162445 192445 202446 12446 I2440 32446 42446 52446 62446 72446 82446 9244b 102446 112446 122446 132446 142446 152446 162446 172446 162446 192446 202446 212446 222446 232446 242446 252447 12447 22447 32447 42447 52447 62447 72447 62447 92447 102447 112447 122447 132447 142448 12448 22448 32448 42448 52448 62448 72448 6 2448 92448 102448 11
48 2548 2548 2548 2548 2548 2648 2648 2648 2648 2648 2648 2748 2748 2748 2748 2748 2748 2948 2948 2948 2948 2848 2848 2848 2848 2948 2948 2948 2948 3Q48 2948 2948 2948 2948 2948 2948 2948 JO48 3{)48 3048 3fl48 3l48 3148 3248 3248 3048 3048 3048 3o48 2948 2948 2448 2448 2548 25 48 2548 2548 25
121121121121121121121121120121121121121121121121121121121121121120120120120120120120121120120120120120120120120120120120120120120120120120120120120120120120120120120 120120120
32210221
59211222332200
595858585959590
5956555553535455555556565757494948494545454446464747 474848
.1 1 2
.1 1 3*1 1 2 1 1 3.1 1 2.1 1 5.1 1 3.1 1 4.1 1 1.4 1 1.2 1 3 1 1 4tl 1 4 1 1 4.2 I 1 1 1 2.3 1 2.2 1 5t4 1 4.1 1 7.1 1 7.1 1 6.1 1 5.1 1 2 1 1 1.1 1 2 1 1 2.3 1 2.3 1 4.3 1 4.1 1 4 1 1 6.1 1 7.1 1 3.1 1 2 7 1 2.3 1 2 1 1 1.1 1 3.1 1 8
1*0 1 2.2.1 3 6 1 4.1 1 8.3 1 8 1 1 8 1 1 1.1 1 3.1 1 2.3 3 1.133.1 1 1.1 1 1.1 1 1 2 1 1.2 1 1.3 1 1 1 1 1
.2
.3
.5
.8
.3
.2
.3
.5
.21.0.6.5.3.5.8.6.6.6.6.3.8.5.3.2.2.3.3.6
1.4.8.3,5.3,3.3.6.8.5.6.3
1.1.3
1.9.5
1.0,3.5.3.2.5.3.2.5.3.8 .8.6
81163831638316383163831638316381163811636116371263831638116381163811637124371263611637116361263811638216381163811637314373243732438316371363713637136381163811638116381163811637334373343732437324371163714636316371163811636335381163811638116381163611638316381163611637116371263 7126371263
.5 83163
2230200017401430125021202100197020102350172017102090198019802120212026202420227023002?40239021801950203016203?602620250025602500244021802320238024701770195025002440213025902470244023202210195022602290
02090223022902320 232024102230
20901860157012501100204019501740183018301370152019201750154016601610224020702150209021002240209017701780151017701770I96023602190233020102100177018601510155023001870198014902190177021001980186021602070
01980200020401890 197020901950
000000000000000000
2320000000000
24402360
00000
20600000000000000000000 000
000000000000000000
2190000000000
22402160
00000
19200000000000000000000 000
o-oo-oo-oo-oo-oo-oo-oo-oo-oo-o so-oo-oo-oo-o0-0 YAWNINGo-oo-oQ.O SAHALE
2260 2 DAVENPORTo-oo-oo-oo-oo-oo-oo-oo-oo-o
2350 2 | BUCKNER GLACIERS2290 2 /
0-00-00-00-0o-o
1980 2 GOODEo-o0-0o-o0-00-0 WYTHEo-oo-oo-oo-o0-0o-oo-oo-o0-0 LYALL0*00-00-00-0^1
olo i SANDALEE GLACIERS
o-o [0-0 )
121 GLACIERS 31.3 TOTAL AREA
A26
BASN GL LAT
GLACIERS IN THE UNITED STATES
TABLE 1. Glaciers of the North Cascades Continued
LONG AREA A 0 LNTH CLASS Tf)PALTITUDES
BOT ACC ABL FPN E NAME
245124532453245324532453245324532454245424542454245424552455
112345671234512
48 1548 3148 3148 3348 3348 3348 3348 3448 3548 3548 3648 3648 3648 4448 44
120120120120120120120120120120120120120120120
262929343535353642424244443437
1 3 1tl 3 1.2 3 1.2 1 2,2 1 2.2 1 1.1 1 1.1 1 1.1 1 2.1 1 1.1 1 2.1 1 2.1 1 1.1 1 3.1 1 1
.2
.3
.8
.6
.6
.8
.3,2.3.5.5.3.2.3,3
811638306371063811637126371263811638316381163631636316383163831638116361163
02320256023602^302560236020602?702?4021902320216024202320
020702190198022302090219019502070203020402150201023302190
000000000000000
000000000000000
0*0o-oo-o0-0o-oo-o0-0o-oo-oo-oo-oo-oo-oo.oo-o
15 GLACIERS 1.4 TOTAL AREA
BASN GL LAT LONG AREA A 0 LNTH CLASSALTITUDES
BOT ACC ABL FPN E NAME
2465 12465 2
2 GLACIERS
120 51120 51
112 >1 1 3
2 TOTAL AREA
.6 81163
.3 832630-0 0-0
U.S.'GOVERNMENT PRINTING OFFICE : 1971 O - 424-039