Embed Size (px)
Citation preview

Inventory of cultivatable populations of S-cycling, fermentative, Fe-reducing, and aerobic
heterotrophic bacteria from salt marsh sediments.
David Emerson1*, and Cynthia M. Lydell2.
1Bigelow Laboratory for Ocean Sciences, East Boothbay, ME 04544 1American Type Culture Collection, Manassas, VA 20110;
*Corresponding Author: David Emerson, Bigelow Laboratory, PO Box 380, East
Boothbay, ME 04544, 207 315 2567, [email protected]
.CC-BY-NC 4.0 International licenseis made available under aThe copyright holder for this preprint (which was not peer-reviewed) is the author/funder. It. https://doi.org/10.1101/048611doi: bioRxiv preprint

Emerson, et al Salt marsh bacteria 2
ABSTRACT
A survey was carried out of the dominant chemotrophic groups of bacteria inhabiting
surface salt marsh sediments in the Virginia Coastal Reserve (VCR) on the Atlantic coast
of Virginia. Total direct cell counts were carried out on all samples. Aerobic
heterotrophs, sulfur oxidizers, sulfate reducing bacteria (SRB), sulfur disproportionaters,
Fe-reducing (FeRB) and fermentative bacteria were all quantified by most probable
number (MPN) at four different sites that ranged in spatial scale from a few meters to 15
km apart. The sites were sampled every 3 – 4 months over a two year period. Total cell
counts were quite consistent temporally at each of the sites, and ranged from a high of 1.4
x 1010 cells . gdw-1 to a low of 8 x 10⁸ cells . gdw-1. Recoveries of all culturable bacteria
were also site dependent and ranged from a minimum of 0.4% to a maximum of 40% of
the total cell count. Aerobic bacteria were the dominant recovered population at all of the
sites, followed by sulfur-oxidizing bacteria. Together these two groups accounted for
>75% of the total recovered bacteria at each of the sites. The populations of anaerobic
groups fluctuated significantly; S-disproportionating and SRB were most abundant
followed by FeRB and fermenters. On average, all the anaerobes were in the same order
of magnitude of abundance (107 cells . gdw-1). Overall, these results suggest that aerobic
bacteria consistently predominated in the top 10 cm of the marsh sediments, and that
autotrophy related to sulfur oxidation and disproportionation may be important, but under
studied processes in salt marsh ecosystems.
.CC-BY-NC 4.0 International licenseis made available under aThe copyright holder for this preprint (which was not peer-reviewed) is the author/funder. It. https://doi.org/10.1101/048611doi: bioRxiv preprint

Emerson, et al Salt marsh bacteria 3
INTRODUCTION
Coastal salt marshes can be among the most productive of ecosystems in terms of the
amount of C-produced per m2. While their precise role in the nutrient dynamics of
associated larger coastal ecosystems remains a source of debate(Odum 2000), it is agreed
that salt marshes are important nurseries for the larval and juvenile stages of a number of
commercially important fin- and shellfish species (Deegan 2000). Furthermore salt
marshes are important physical buffers that can act to ameliorate storm waves and tidal
surges thus protecting the fragile inshore coast line. The macrofauna and microfauna that
comprise the marsh and its sediments play an important role in maintaining this physical
integrity. The United States Environmental Protection Agency has reported that one
consequence of global warming will be radical alteration of coastal marshes due to sea
level rise along the Eastern Seaboard of the United States (Anonymous 2002), lending a
new imperative to the study of these resilient, yet potentially endangered ecosystems.
Despite a monotonous plant cover dominated by Spartina alterniflora, salt
marshes are home to a diverse and abundant community of microorganisms that
mineralize plant matter using a variety of electron acceptors and pathways. The most
intensively studied group of salt marsh microbes are the sulfate reducing bacteria (SRB)
(Rooney-Varga et al. 1998, Hines et al. 1999, Kostka et al. 2002a, Purdy et al. 2002).
More recently FeRB have also received attention (Lowe et al. 2000, Kostka et al. 2002b,
Koretsky et al. 2003). Lovell and co-workers have carried out detailed molecular and
cultural studies on diazotrophic bacteria in salt marsh sediments in South Carolina
(Bagwell et al. 2000, Piceno et al. 2000a, b, Lovell et al. 2001). Recently these same
workers showed that diverse functional sequences for the formyltetrahydrofolate synthase
genes indicative of acetogenic bacteria were ubiquitous in the rhizosphere of salt marsh
plants (Leaphart et al 2003). Another recent study used fluorescence in situ hybridization
(FISH) to quantitate different microbial groups in rhizosphere sediments associated with
a mesohaline Spartina salt marsh and an immediately adjacent region of marsh in which
.CC-BY-NC 4.0 International licenseis made available under aThe copyright holder for this preprint (which was not peer-reviewed) is the author/funder. It. https://doi.org/10.1101/048611doi: bioRxiv preprint
Emerson, et al Salt marsh bacteria 4
Phragmites was dominant (Burke et al 2002). In general, these latter studies indicate that
populations of salt marsh microbes while diverse appear quite stable throughout the
seasons. However, there have been surprisingly few attempts at quantitating other
potentially important microbial groups in salt marsh sediments, including S-oxidizing and
S-disproportionating bacteria, aerobic heterotrophs, and fermentative bacteria.
As part of a biotic survey of microbes in Atlantic coastal salt marshes, we have
systematically attempted to assess the culturable populations of dominant chemotrophic
microbes from salt marsh sediments both temporally and spatially. In the marshes we
investigated, our general findings are consistent with the above mentioned theme of
relatively consistent population sizes and structures. Furthermore, population sizes for
culturable members of under studied but important microbial groups including S-
oxidizing bacteria, S-disproportionating bacteria, fermentative bacteria, and, aerobic
heterotrophs are reported, as well as numbers for SRB, and FeRB. These data provide an
important baseline for both microbial community studies and biogeochemical studies in
salt marsh ecosystems.
METHODS AND MATERIALS
Sites
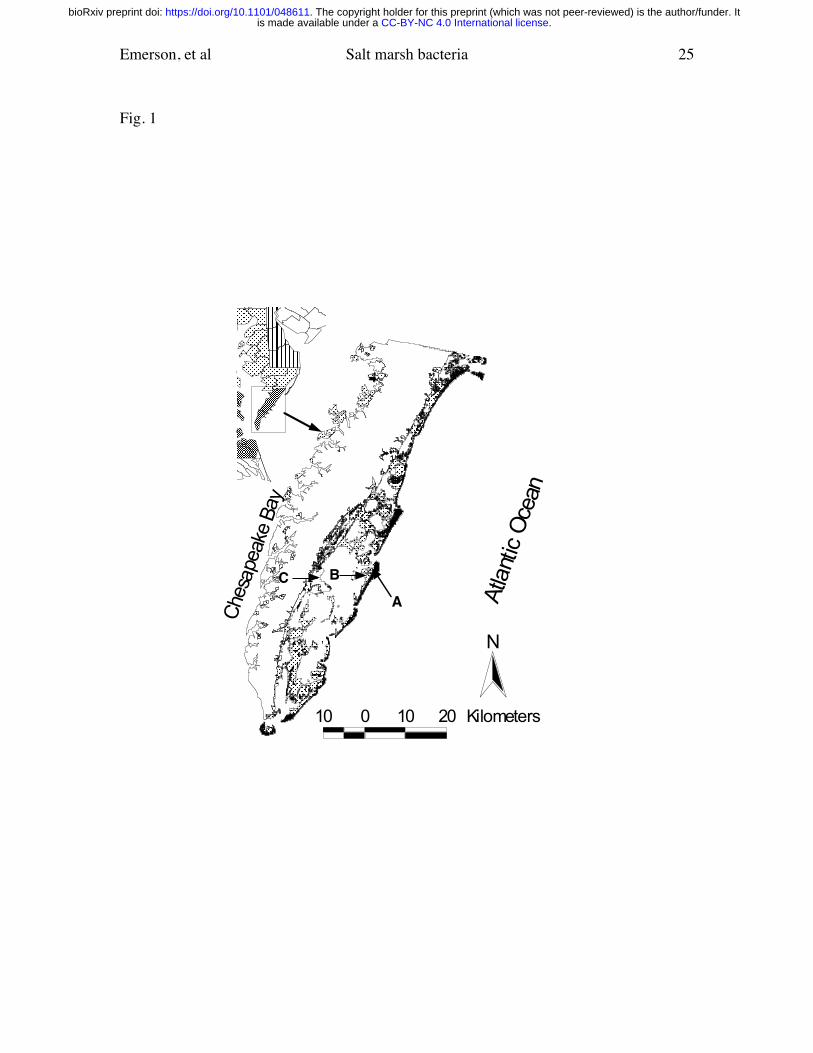
The VCR is a long term ecological research site maintained by the University of Virginia.
Four sites that were separated on a scale of meters to kilometers were chosen for repeated
sampling and are shown in Fig 1. These sites were marked and at each sampling time
cores were taken within 3 m of the marker. Physical characteristics of these sites are
given in Table 1. The Hog Island S1 site was in a tall form Spartina marsh a few meters
from the upland margin on Hog Island. The Hog Island S2 site was about 4 meters from
the S1 site, located in a small pool (approx. 2 x 4 m) that was devoid of plant growth,
although the sediment did contain roots from the surrounding Spartina. The sediment at
this site was a thick black mud that often smelled of sulfide; in the winter white
precipitates of elemental S were visible on the surface of the mud. The third site,
.CC-BY-NC 4.0 International licenseis made available under aThe copyright holder for this preprint (which was not peer-reviewed) is the author/funder. It. https://doi.org/10.1101/048611doi: bioRxiv preprint

Emerson, et al Salt marsh bacteria 5
Cattleshed, was located in a large open marsh approximately 1.5 km from the Hog Island
sites. It was dominated by short form Spartina, and the sediment was a homogeneous
gray mud. The fourth site, Red Bank, was on a creek bank adjacent to the mainland about
15 km from Hog Island. The sediment at this site was also gray colored and appeared to
have a very high clay content. The site was at the edge of a growth of Spartina;
immediately above this the vegetation shifted to Distyclis.
Sampling
Samples were collected using sterilized core barrels constructed from 3 inch diameter
PVC pipe that was sharpened at one end. The cores were pushed by hand approximately
15 cm into the sediment, and intact sediment cores were extracted. The cores were stored
on ice. All processing of the cores was done in an anaerobic glove box (Coy Laboratory
Products, Grass Lake, MI) containing 97% N2 : 3% H2 within 12-24 h of collection. The
top 5 – 7 cm of the sediment was removed and enough filtered and autoclaved seawater
(collected from the site) was added to yield a slurry that could be pipeted easily. The
slurry was used to set-up dilution series for inoculation of most probable number (MPN)
tubes or for quantitative plating. All samples were normalized to a gram dry wt (gdw)
basis by drying measured amounts of the slurry (in triplicate) at 85°C for at least 72h.
Sediment organic matter content was calculated by loss on ignition at 430°C for 16 hours
(Nelson and Sommers 1982). Total sediment C and N were determined using a CHN
analyzer (Perkin Elmer Series II 2400). The pH at the sampling sites was determined in
situ with a hand held pH meter (Cole-Parmer pH/CON10); the probe was placed in the
core hole immediately after removal of the core. Salinity was determined on site with a
hand held refractometer.
.CC-BY-NC 4.0 International licenseis made available under aThe copyright holder for this preprint (which was not peer-reviewed) is the author/funder. It. https://doi.org/10.1101/048611doi: bioRxiv preprint
Emerson, et al Salt marsh bacteria 6
Quantitative culture work
Eight different metabolic groups of organisms were enumerated using 3 tube or 5 tube
MPNs (de Man 1975). All MPN dilutions were done using Eppendorf pipettors with
barrier pipet tips to reduce the risk of contamination. All MPNs were done in glass tubes
(1.3 x 16 cm) and incubated at room temperature (20 – 23 C).
Aerobic heterotrophs were enumerated by a 5-tube MPN using 7 ml of R2 medium. The
tubes were incubated in the dark and scored for growth by the appearance of visible
turbidity up to 4 weeks after inoculation. Fermentative heterotrophs were enumerated by
a 5 tube MPN using brain heart infusion in tubes sealed with butyl rubber septa. Positive
tubes were scored by turbidity up to 4 weeks after inoculation. SRB were enumerated
using 3 tube MPNs in glass tubes sealed with butyl rubber stoppers. Positive tubes were
scored by the abundant precipitation of iron sulfides, turbidity, and microscopic checks
for growth, as well as the strong odor of sulfide. Some high dilution positive tubes were
spot checked for the disappearance of sulfate using a turbidimetric assay (Kolmert et al
2000). FeRB were determined in 3 tube MPNs done in glass vials (15 x 45 mm). The
medium contained amorphous Fe-oxides that were produced by the oxidation of FeCl2
under microaerobic conditions in a bicarbonate buffered system, pH 6.3 (Neubauer et al
2002). Putative Fe-reduction was determined by measuring the presence of Fe(II) by the
ferrozine assay (Stookey 1970), and microscopic evidence for cell growth for up to 2
months. Sulfur-oxidizing bacteria were quantitated in a 3 tube MPN with thiosulfate
medium. The presence of S-oxidizing bacteria was determined ( for up to 2 months) by
microscopic evidence for growth and in almost all cases by the precipitation of elemental
S-particles in the medium. S-disproportionating bacteria were enumerated using a 3 tube
MPN series. Putative S-disproportionation was assessed by the formation of a black FeS
precipitate, the smell of H2S, and microscopic evidence for cell growth for up to 2
months. Neutrophilic Fe-oxidizing bacteria were enumerated using a three tube MPN
technique using FeS gradient tubes (Emerson & Moyer 1997). Hydrogen-oxidizing
.CC-BY-NC 4.0 International licenseis made available under aThe copyright holder for this preprint (which was not peer-reviewed) is the author/funder. It. https://doi.org/10.1101/048611doi: bioRxiv preprint

Emerson, et al Salt marsh bacteria 7
bacteria were assessed in 3 tube MPNs done in Balch tubes using a mineral salts medium
(Malik 1981) with a ratio of 80:10:10, N2:O2:H2.
Media
Aerobes were grown using R2A medium (Difco Laboratories, #1826-17-1) amended with
2% NaCl and without agar for MPNs. Fermentative bacteria were grown in MPNs on
brain heart infusion (Difco Laboratories #0037) with 2% NaCl added, or on plates with
Trypticase soy agar with 5% defibrinated sheep’s blood. The composition of the medium
for S-oxidizing bacteria (Kuenen et al 1992) was (g/l): NaCl, 25.0 g; (NH4)2SO4, 1.0 g;
MgSO4 . 7H2O, 1.5 g; CaCl2, 0.3 g; K2HPO4, 0.5 g; Na2S2O3 . 5H2O, 8.0 g; 10 mM
HEPES buffer, pH adjusted to 7.2. The medium was filter-sterilized and 1 ml/l of
Wolfe’s vitamins and minerals (Wolin et al 1963) stocks solutions were added. The
composition of the medium for FeRB (Lovley & Phillips1988) was: NaCl, 20 g;
NaHCO3, 2.5 g; MgCl2, 2.0 g; CaCl2, 0.4 g; KCl, 0.5 g; NH4Cl, 0.24 g; KH2PO4, 0.2;
yeast extract, 0.05 g; sodium acetate 0.67 g. The pH of the medium was adjusted to 7.3. It
was filter-sterilized and amended with Wolfe’s minerals and approximately 0.1 g per 10
ml of amorphous FeOOH was added. The composition of the medium for S-
disproportionaters (Finster et al 1998)was: NaCl, 20g; NaHCO3, 2.5g; MgCl2.6H2O, 2g;
CaCl2. 2H2O, 0.4g; KCl, 0.5g; NH4Cl, 0.25g; KH2PO4, 0.2g. The pH was adjusted to 7.3,
the medium was filter-sterized and stocks of Wolfe’s vitamins and minerals (1 ml/l) were
added. After the medium was dispensed (10 ml), approximately 0.1 g of amorphous
FeOOH and 0.1 g of flowers of S was added. Following inoculation the tubes were
gassed with N2:CO2 (80:20). The primary medium used for SRB was a lactate medium
described in Widdel and Bak (Widdel & Bak 1992) amended with 2.5% NaCl. The
medium for Desulfobacterium (Widdel & Bak 1992) and related genera was also used
with different C-sources as described above.
.CC-BY-NC 4.0 International licenseis made available under aThe copyright holder for this preprint (which was not peer-reviewed) is the author/funder. It. https://doi.org/10.1101/048611doi: bioRxiv preprint

Emerson, et al Salt marsh bacteria 8
Total cell counts
To determine total cell numbers in the sediments, subsamples of the slurries were fixed
with 2% glutaraldehyde. For cell counting, this material was diluted either 1:200 or 1:300
using either sterile phosphate buffered saline or artificial seawater, and 10 µl of this
material was smeared evenly within a circle of known diameter on a microscope slide and
air dried. A 10 µl solution of 0.25 mM Syto (Molecular Probes, Eugene, OR) was added
to the slide and air dried in the dark. Finally 8 µl of sterile PBS was placed on the smear,
and a coverslip was added. Using the 100x objective on an Olympus BX 60 microscope
12 – 15 fields were counted per smear (usually between 300 and 700 cells/smear), and
three smears per sample were done. The total cell number was determined by taking into
account the dilution factors and then normalized to gdw.
RESULTS
Total cell numbers
The results of direct cell counts for each of the four sites over 2 1/2 years is shown in Fig
2, and averaged values are shown in Table 2. The total cell number averaged over all the
sites at all times was 4.0 x 10⁹ cells . gdw-1 sediment. Overall, total cell counts at each of
the sites were quite consistent during the course of this study; there were no obvious
seasonal fluctuations. The Hog Is. S2 site consistently had the highest cell numbers, and
Red Bank consistently had the lowest cell numbers. The Hog Is S1 site, (average = 3.8 x
109 cells; SD = 2.7 x 10⁹) showed the widest fluctuations in total cell number with a range
of 1.2 – 9.1 x 10⁹ cells . gdw-1. At all sites, most of the cells were associated with
sediment particles, and were only visible by microscopy when stained with a DNA-
binding fluorescent dye.
.CC-BY-NC 4.0 International licenseis made available under aThe copyright holder for this preprint (which was not peer-reviewed) is the author/funder. It. https://doi.org/10.1101/048611doi: bioRxiv preprint

Emerson, et al Salt marsh bacteria 9
MPN studies
The recovery of different populations of bacteria by MPN enumerations are shown in Fig
3 and averaged values in Table2. As is evident there was a wide range in the recovery of
different populations between the sites, much greater than the changes documented in
total cell numbers. It appeared that the temporal variation within each site was less than
the spatial variation between different sites, and there were no obvious seasonal trends in
the recoveries of different groups. A synopsis of the results for each of the physiological
groups is given below.
Aerobic heterotrophs. An important change was made in how aerobes and anaerobes
were enumerated during the course of this study. Initially these organisms were
quantitated by dilution plating, the results of plating for 3/2000 for aerobes and 3/2000
and 7/2000 for anaerobes are shown in Fig 3. At all subsequent times we used a 5-tube
MPN technique and found this gave 100- to 1000-fold increases in total recovered
numbers for aerobes, and 10- to 100-fold increases in the numbers of anaerobes
compared to plating (Lydell 2002). Thus the numbers used for calculating cell numbers
of aerobes and anaerobes are based only on those sampling times when the MPN
technique was used. As a result, the aerobic bacteria were the most abundant group
recovered overall. The highest numbers were from the Hog Is S1 & S2 sites which had an
average of 6 x 10⁸ cells. gdw-1, while RB had the lowest numbers.
Sulfur-oxidizers. Thiosulfate-oxidizing bacteria were also abundant with the highest
numbers recorded at the Hog Is S2 and S1 sites. Again CS had intermediate numbers and
RB yielded the lowest recoveries. The numbers of S-oxidizers were relatively consistent,
generally fluctuating by less than an order of magnitude at each site across the seasons.
SRB. The highest recoveries of SRB were from the Hog Is. S1 site and the lowest was
from Cattleshed and Red Bank, respectively. An initial study on the SRB using different
carbon sources, acetate, lactate, butyrate and ethanol indicated that lactate and ethanol
yielded the highest recoveries at all these sites. The March, 2000, July 2000, and
.CC-BY-NC 4.0 International licenseis made available under aThe copyright holder for this preprint (which was not peer-reviewed) is the author/funder. It. https://doi.org/10.1101/048611doi: bioRxiv preprint
Emerson, et al Salt marsh bacteria 10
November 2000 MPN results are combined data from lactate and ethanol MPN’s;
however the recoveries on ethanol were always approximately 10-fold lower than those
on lactate (results not shown), so later studies were done using lactate only.
Sulfur-disproportionating bacteria. This group was present at all the sites at all times of
year; however their numbers did fluctuate substantially, note the high SDs in Table 2.
For example at the Hog Is S2 site where S-disproportionaters were in the greatest overall
abundance (1.6 x 10⁸; SD = 3.1 x 10⁸) their numbers ranged from 5.3 x 10⁸ . gdw-1 in
July and November, 2000 to 3.1 x 10⁵ . gdw-1 in February, 2001.
Fe-reducers. FeRB were also present at all the sites that were sampled although overall
abundances were the lowest of any of the groups sampled. They were most abundant at
the Hog Is S1 and S2 sites, and least abundant at Cattleshed, where their numbers were
consistently low, 2.4 x 10⁵ cells . gdw-1 (SD = 3.4 x 10⁵). Like the S-disproportionating
bacteria, their numbers tended to fluctuate more with sampling time than other groups as
evidenced by the high standard deviations.
Fermenters. Populations of fermentative anaerobic bacteria were consistently abundant at
all the sites, the highest number was recorded in July, 2001 at the Hog Is S2 site, 1.7 x
108 cells . gdw-1 (SD = 9.5 x 10⁷), and numbers were generally in the range of 106 - 107
cells . gdw-1, except for Red Bank, where numbers were in the 105 range. The numbers
shown in Fig 3 for March and July, 2000 were based on plate counts using blood agar;
subsequent numbers were based on MPNs using BHI, which gave at least a 10-fold
greater recovery from most samples.
Others. MPN quantitation of hydrogen-oxidizing and Fe-oxidizing bacteria indicated
these organisms were not abundant members of the community. Fe-oxidizing bacteria
were detected at the Red Bank site at numbers of approximately 103 cells . gdw-1, but were
below this detection limit at the other sites. MPNs for H2-oxidizing bacteria showed
some growth in the initial dilution series; however transfer of the cultures from high
.CC-BY-NC 4.0 International licenseis made available under aThe copyright holder for this preprint (which was not peer-reviewed) is the author/funder. It. https://doi.org/10.1101/048611doi: bioRxiv preprint

Emerson, et al Salt marsh bacteria 11
dilutions revealed they did not grow on H2; indicating their numbers were below the
limits of detection set for the MPNs, which was 104 cells . g-1 wet sediment.
Total recoveries of different metabolic groups
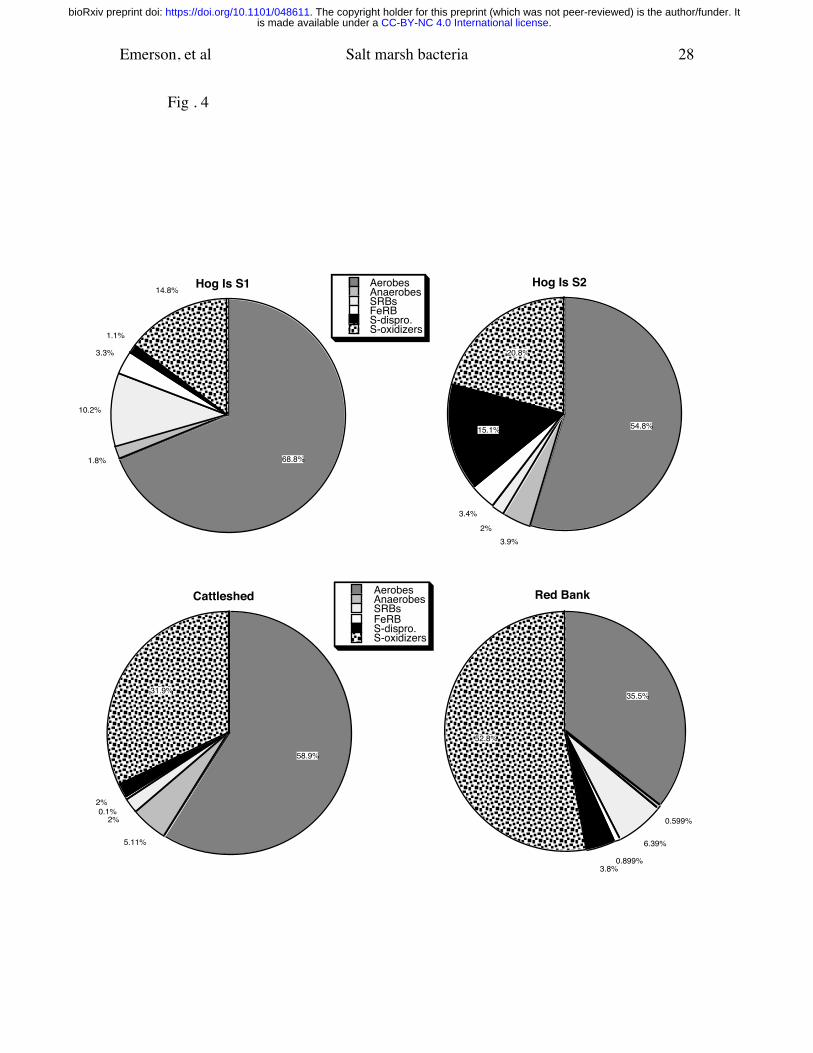
The total recovered cells for all sampling times at the different sites is summarized in Fig
4. At the Hog Is S1 and S2 sites aerobic heterotrophs made up 67% of the combined
average population at the S1 site and 55% at the S2 site. Next most abundant at these
sites were aerobic S-oxidizing bacteria. At the S1 site these two groups accounted for 76
% of the total. At the Cattleshed site these two aerobic groups accounted for 92% of the
total recovered populations. The SRB were on average the most abundant of the
anaerobic bacteria, accounting for between 2 and 10% of the total recovered populations.
At the Hog Is S2 site S-disproportionating bacteria comprised, on average, a larger
proportion of the population than SRB, 15% vs. 4%, respectively.
Comparison of total cell counts and total recovered cells
Combining all the MPN data at each sampling allowed a comparison of the total number
of cells cultured and the total cell direct counts. Two examples of these comparisons, one
from winter and one from summer are shown in Fig 5. The numbers and percentages of
recovered bacteria at the different sites ranged from a low of 8 x 10⁶ cells . gdw-1,
representing 0.4% of the total population at Red Bank in July, 2001 to a high of 2 x 10⁹
cells . gdw-1 at Hog Is S1 in February, 2001, representing 21% of the total population. The
highest percentage recovery for any of the sampling sites was 43% of the total population
at Hog Is S1 in July 2001. The two Hog Is sites consistently had the highest numbers of
cells recovered averaging about 15% of the total direct count. In contrast, at Red Bank
cell recoveries averaged only about 2% or less of the total direct count. At Cattleshed,
recoveries were typically between 5 and 10% of the total count.
.CC-BY-NC 4.0 International licenseis made available under aThe copyright holder for this preprint (which was not peer-reviewed) is the author/funder. It. https://doi.org/10.1101/048611doi: bioRxiv preprint
Emerson, et al Salt marsh bacteria 12
DISCUSSION
Overall microbial abundance
Total cell numbers at each of the VCR sites were quite constant throughout the 2 years of
this study, suggesting that seasonal changes did not dramatically alter total cell numbers.
There were significant differences between the total populations at different sites. Total
counts ranged from a high of 1.4 x 10¹⁰ at Hog Is S2 to a low of 7.6 x 10⁸ at Red Bank. In
part these differences may be due to differences in the physico-chemical conditions, the
Hog Is S2 site had a very high organic content and was not as clay-rich as the Red Bank
site. Organic matter alone does not appear to account for all the difference, because at
times the Hog Is S1 site had cell numbers nearly as high as S2. Athough S1 was within 3
m of S2, it had a much lower organic C content ( 4% vs 44%), although it did not appear
as rich in clay as the Red Bank site.
A study of a salt marsh in North Carolina found cell numbers ranged from a
maximum of 1.4 x 10¹⁰ cells . gdw-1 in the top cm of sediment down to about 2 x 10⁹ cells . gdw-1 at a depth of 10 cm (Rublee & Dornseif 1978). Similar to the results reported here
this study also found the cell numbers were quite constant, especially at depth, during a
12 month period. In France, salt marsh sediments taken from a tidal channel were
reported to contain a maximum of between 2 and 3 x 10¹⁰ cells . gdw (Lucas et al 2003) A
study of a mid-range salinity (5 –15 ppt) salt marsh with high organic matter on the
Hudson River in New York, found total cell numbers of 3 – 4 x 10¹⁰ cells . gdw-1, which
are substantially higher numbers than reported here (Burke et al 2002).
Recoveries of individual metabolic groups
Although salt marsh sediments are thought of as primarily anaerobic habitats, the
dominant microbial groups that were recovered during this study were aerobic
heterotrophic and thiosulfate-oxidizing bacteria. These results suggest that aerobic
metabolism plays an important role in the upper layers of salt marsh sediments.
.CC-BY-NC 4.0 International licenseis made available under aThe copyright holder for this preprint (which was not peer-reviewed) is the author/funder. It. https://doi.org/10.1101/048611doi: bioRxiv preprint
Emerson, et al Salt marsh bacteria 13
Bioturbation by fiddler crabs and marine invertebrates, and the extensive rhizosphere
created by S. alterniflorans provide important mechanisms and conduits for transport of
both oxygen and labile C into the sediment (Bertness et al 1985, Howes et al 1994).
These processes may create a mosaic of oxic habitats ideal for the survival of aerobic and
facultative microbes in the top 10 – 20 cm of the salt marsh sediment. It has been
estimated that approximately 50% of the O2 taken up by salt marsh sediments is used for
aerobic microbial respiration, and the remainder goes toward oxidative processes,
primarily S-oxidation (Howes & Teal 1984), where chemical oxidation is supposed to
play at least as important a role as biotic oxidation. In part due to methodological
considerations, these types of studies based on mass balance calculations have not taken
into account microbial population structure, and tend to exclude either bioturbation or
rhizosphere transport of O2 as important processes. In light of the high numbers of active
aerobic organisms presented here, it may be worth re-evaluating the oxidative respiratory
processes in salt marsh sediments, especially vis a vis S-oxidation (see below).
Aerobic heterotrophs. There are few published numbers documenting the abundance of
aerobic bacteria in salt marsh sediments. A study of a salt marsh in England dominated
by Spartina townsendii, found numbers that averaged around 5 x 10⁶ cells . gdw-1
(Sivanesan & Manners 1972). At Sapelo Island, Georgia, plate counts typically recovered
between 105 and 106 cells . g sediment (wet weight) (Lowe et al 2000). These are similar
to the numbers we recovered at the VCR using plate counts. However, as mentioned
above, we subsequently found that MPN analysis yielded numbers > 100-fold higher than
plate counts, which put recoveries of aerobes in the range of 108 cells . gdw-1, with a
maximum value of 1.5 x 10⁹ at Hog Is. S1. These latter numbers are in the range of a
value of 1.2 x 10⁸ cells . g sediment reported from an MPN enumeration of aerobes from
another salt marsh on Sapelo Island, Georgia (Bachoon et al 2001). Preliminary
characterization by fatty acid methyl ester analysis indicates that the aerobic
heterotrophic bacteria are quite diverse and include representatives from most of the
.CC-BY-NC 4.0 International licenseis made available under aThe copyright holder for this preprint (which was not peer-reviewed) is the author/funder. It. https://doi.org/10.1101/048611doi: bioRxiv preprint

Emerson, et al Salt marsh bacteria 14
groups of the proteobacteria, the Cytophaga-Flexibacter-Bacteroides (CFB) phylum, as
well as gram positive genera. A number of them are likely facultative anaerobes. A more
detailed analysis of isolated CFB strains indicates that they are diverse and many appear
novel, representing new species and potentially new genera (Lydell et al 2003). Results
from clone libraries from DNA extracted directly from the same sediments as were used
for MPNs, also show an abundance of presumptive aerobic organisms (Emerson,
unpublished results). These results from the VCR sites are consistent with another recent
study of a salt marsh in England, where analysis of phospholipid fatty acids (PLFA)
profiles during the course of a year found that PFLAs of indicative of aerobic bacteria
were consistently more abundant than PFLA’s indicative of SRB (Keith-Roach et al
2002) .
Sulfur-oxidizing bacteria. We could find no reliable estimates for numbers of S-oxidizers
in salt marsh sediments. The numbers of sulfur-oxidizers at the VCR are among the
highest reported for any environment with an overall average number of 1.1 x 10⁸ and an
average of 2.3 x 10⁸ at the Hog Is S2 site, which had the highest numbers of S-oxidizers.
Imhoff and colleagues found in the range of 106 sulfur-oxidizers . gdw-1 in shallow marine
sediments associated with reed beds in the Baltic Sea (Imhoff et al 1995). Sievert et al
found maximal numbers of 1.4 x 10⁶ cells . g wet wt in sediment associated with a
shallow hydrothermal vent site (Sievert et al. 1999). Sulfur-oxidizers have also been
quantified in rice paddy soil by an MPN technique similar to the one used here, in this
case 105 to 106 cells . gdw-1 were found (Stubner & Conrad 1998). Based on relative
numbers of dominant populations that could be cultivated, our results suggest that S-
oxidation is an important process in the marsh. This empirical population data supports
mass balance assessments of S-cycling in salt marshes that have previously suggested
that chemoautotrophic S-oxidation may contribute substantially to the overall
productivity of salt marshes (Howarth 1984, 1993). Almost all of our MPNs were done
using thiosulfate as the sole energy source. One comparative MPN series was done using
.CC-BY-NC 4.0 International licenseis made available under aThe copyright holder for this preprint (which was not peer-reviewed) is the author/funder. It. https://doi.org/10.1101/048611doi: bioRxiv preprint

Emerson, et al Salt marsh bacteria 15
thiosulfate and elemental sulfur. The cell numbers from the elemental sulfur MPNs were
5- to 10-fold lower than those on thiosulfate. Almost all the S-oxidizing bacteria that
were enriched through MPNs formed white precipitates of elemental S when grown on
thiosulfate, and a number of them accumulated intracellular granules of S. Most are either
obligate S-oxidizers, or else grow poorly on heterotrophic media. Analysis of the DNA
sequences of the 16S rRNA gene for three of the strains revealed two of them were
gamma-proteobacteria not that that closely related to cultivated strains (≤93%
similiarity); the third strain was closely related to Thiobacillus prosperus.
The sulfur-disproportionating bacteria were present at most sites in numbers of ≥ 106
cells . gdw-1, with an overall average of 4.5 x 10⁷ cells . gdw-1. At the Hog Is S2 site they
were enumerated in maximum numbers of 5.3 x 10⁸ cells . gdw-1 in July and November of
2000. To our knowledge there has only been one previous study that quantitated the
numbers of S-disproportionaters in both pelagic marine and salt marsh sediments in
Denmark (Thamdrup et al 1993). In this case, a maximum of 1.1 x 10⁶ cells/cm3 were
reported from the salt marsh, taking into account differences in wet wt versus dry wt,
these numbers are generally consistent, although on the lower end of the numbers at the
VCR. A number of purified enrichments and pure cultures of S-disproportionaters have
been obtained from high dilution MPN tubes; however these have not yet been
characterized. For example, we do not know what percentage are obligate S-
disproportionaters versus being sulfate reducers that are also capable of
disproportionation. In any event, these organisms were all enriched under
chemolithoautotrophic conditions using elemental S, and given that their numbers are
equivalent those of SRB (overall average 3.0 x 10⁷), this provides organismal support to
the biogeochemical evidence (Canfield et al 1996) that S-disproportionation is an
important pathway for both S- and C-cycling in these sediments.
Sulfate reducing bacteria. Literature values for SRB numbers based on MPNs vary
widely. One report from Sapelo Island in Georgia found 0.1 to 4 x 10⁴ SRB . g wet wt-1,
.CC-BY-NC 4.0 International licenseis made available under aThe copyright holder for this preprint (which was not peer-reviewed) is the author/funder. It. https://doi.org/10.1101/048611doi: bioRxiv preprint

Emerson, et al Salt marsh bacteria 16
where numbers showed substantial spatial fluctuation both vertically and horizontally
(Lowe et al 2000). Another study from Savannah, Georgia found SRB numbers ranged
from 105 to 106, which are closer to the numbers we have found at the VCR (Kostka et al
2002b). A comprehensive study by Hines et al enumerated SRB temporally in a marsh in
New Hampshire (Hines et al. 1999). Integrating their data for the top 3 cm of bulk salt
marsh sediment over time results in about 3.5 x 10⁷ SRB per g wet wt for their study site.
Unfortunately, it is not possible to accurately compare these numbers with the numbers
from the VCR (overall average = 3.0 x 10⁷ . gdw-1), since the literature values cited above
are based on wet wt of sediment. At the VCR sites, dry wt cell numbers averaged about 3
– 5 times the wet wt numbers. Estimates of SRB from a marsh in Lewes, Delaware using
noncultivation-based molecular methods, suggested that averaged total SRB populations
could be as high as 1.1 x 10⁹ cells . gdw-1 (Edgecomb et al1999). Using the same
technique, based on total DNA extraction, these workers estimated the total bacterial
population size in this marsh at 5.2 x 10¹⁰, which is 3 fold higher than the highest direct
counts we have obtained at Hog Island S2. The work of Burke, et al, (2002) used FISH
probes specific for SRB to enumerate their numbers in a meso-haline marsh and found
numbers that averaged 2 – 3 x 10⁹ cells . gdw-1, again total direct counts indicated the total
population size in this marsh was in the range of 4 – 5 x 10¹⁰ cells . gdw-1 . Roony-Varga,
et al have found that the dominant SRB that could be cultivated from a marsh in New
Hampshire did not appear to be the dominant organisms detected using molecular
methods (Rooney-Varga et al 1998). Given the comparisons to molecular results, it is
possible we are underestimating the total population sizes of SRB by 5- to 10-fold.
FeRB. Recent work by Kostka, et al, suggests that under conditions where there is both
vegetation and extensive bioturbation, Fe-reduction may be as, or more important than
sulfate-reduction as a pathway for organic C-mineralization (Kostka et al 2002b). While
we were unable to couple process studies with enumeration in the scope of this study,
FeRB were abundant and on average were found in comparable numbers to the SRB. The
.CC-BY-NC 4.0 International licenseis made available under aThe copyright holder for this preprint (which was not peer-reviewed) is the author/funder. It. https://doi.org/10.1101/048611doi: bioRxiv preprint

Emerson, et al Salt marsh bacteria 17
overall average of FeRB at the VCR was 1.7 x 10⁷ cells . gdw-1. A study that quantified
FeRB in a salt marsh at Sapelo Island using a plating method found on average between
105 and 106 cells/cm-3 (Koretsky et al 2003). This is at least circumstantial evidence
confirming that Fe-reduction is an important process in the salt marshes and needs further
investigation. All MPNs and subsequent enrichments were done using acetate as the
growth substrate, physiologically this suggests these organisms are members of the
Geobacteracae (Lovley 2000), although we have not as yet characterized the enrichments.
Fermentative bacteria were also in the same order of abundance as the other anaerobes
when enumerated using the MPN technique, an overall average of 1.2 x 10⁷. While
fermentation is generally recognized as an important pathway for C-cycling in salt
marshes (King & Wiebe 1980); there are few quantitative analyses of fermenters; most
of these have been in the context of investigating the relative contributions of fermenters
and SRB to N2-fixation (Gandy & Yoch 1988). A study of sediments from an estuary in
Scotland reported MPN numbers for fermenters of about 103 cells . gdw-1 (Herbert 1975),
which is far lower than the numbers reported here; however it is difficult to compare a
permanently water-covered estuarine sediment to the more dynamic salt marsh sediment.
At the VCR fermentative populations are numerically in balance with anaerobes that
respire using organic compounds as electron donors. Based on initial studies
approximately two thirds of the isolates obtained under strictly anaerobic conditions were
obligate anaerobes. Fatty acid analysis indicates some of the strains are related to
Neisseira spp, while phenotypic evaluation suggests a number of the strains may also be
related to Clostridium spp.
Cultured vs uncultured populations
Over the past decade it has become widely accepted that only 1% or less of the microbes
that grow in the environment can be cultured (Pace 1997). However, there are few studies
that have explicitly tested this idea by attempting to quantify the important physiological
groups from a given environment. The results presented here illustrate the underlying
.CC-BY-NC 4.0 International licenseis made available under aThe copyright holder for this preprint (which was not peer-reviewed) is the author/funder. It. https://doi.org/10.1101/048611doi: bioRxiv preprint

Emerson, et al Salt marsh bacteria 18
complexity of the problem of ascertaining the culturability of a given community. At the
Hog Is sites, which had the greatest total cell numbers and appeared to be most active, the
greatest cell recoveries were obtained, typically >10% of the total direct count and as
high as 43% of the total count. By contrast, Red Bank, a site with high clay content and
little sign of microbial activity, had the lowest total cell counts and total cell recoveries
were often <1%. Recognizing the lack of precision in quantifying cell numbers either by
MPNs or direct counts in complex samples, these recoveries suggest that a substantial
percentage ( >10%) of the population may be culturable using standard techniques at
some sites at the VCR.
It should also be kept in mind that a recent study on the culturability of soil
bacteria suggested that any dilution-based analysis will under estimate actual numbers by
30-40 % due to the inherent clumping of the cells on particles(Janssen et al 2002). While
we have not quantified this for the salt marsh sediments, the same phenomena certainly
holds true, since most of the cells are particle associated. It is almost certain that the MPN
techniques used here are underestimating individual populations by anywhere between 5
and 10-fold, depending upon site (see discussion of SRB above). However if we assume
that this underestimation is consistent across the different physiological groups, then the
MPN data should reflect the overall relative populations of different physiological groups
within the salt marsh sediment community. Ultimately, it will be the combination of
process studies and molecular studies corroborated with cultivation/MPN work that will
provide the most efficacy in understanding the functioning of these complex and
important ecosystems.
ACKNOWLEDGEMENTS
We thank Dr. Linda Blum of the University of Virginia for advice and help in accessing
the VCR, and the boat captains of the VCR-LTER site for transportation to and from sites
under all weather conditions. We are indebted to Dr. Johanna Weiss for the CHN
.CC-BY-NC 4.0 International licenseis made available under aThe copyright holder for this preprint (which was not peer-reviewed) is the author/funder. It. https://doi.org/10.1101/048611doi: bioRxiv preprint

Emerson, et al Salt marsh bacteria 19
analysis. We thank A. Sit for the gift of elemental sulfur. In addition we thank Dr. Pat
Gillevet, Dr. Tom Nerad, Mike Peglar, Jeff Cole, Lori Dowell, and Lindsey Murray for
assistance in processing samples. This work was supported in part by NSF grant DEB-
9972099.
.CC-BY-NC 4.0 International licenseis made available under aThe copyright holder for this preprint (which was not peer-reviewed) is the author/funder. It. https://doi.org/10.1101/048611doi: bioRxiv preprint

Emerson, et al Salt marsh bacteria 20
References.
Anonymous (2002) U.S. Climate Action Report -- 2002. United States Environmental Protection Agency
Bachoon DS, Hodson RE, Araujo R (2001) Microbial community assessment in oil-impacted salt marsh sediment microcosms by traditional and nucleic-acid based indices. J Microbiol Meth 46:37-49
Bagwell CE, Lovell CR (2000) Persistence of selected Spartina alterniflora rhizosphere diazotrophs exposed to natural and manipulated environmental variability. Appl Environ Microbiol 66:4625-4633
Bertness MD (1985) Fiddler crab regulation of Spartina alterniflora production on a New England salt marsh. Ecology 66:1042-1055
Burke DJ, Hamerlynck, EP, Hahn D. (2002) Interactions among plant species and microorganisms in salt marsh sediments. Appl Environ Microbiol 68:1157-1164
Canfield DE, Thamdrup B. (1996) Fate of elemental sulfur in an intertidal sediment. FEMS Microbiol Ecol 19:95-103
de Man JC (1975) The probability of most probable numbers. European J Appl Microbiol 1:67-78
Deegan LA, Hughes JE, Rountree RA (2000) Salt marsh ecosystem support of marine transient species. In: Weinstein MP, Kreeger DA (ed) Concepts and Controversies in Tidal Marsh Ecology. Kluwer Academic Publishers, Boston, MA, p 333-368
Edgecomb VP, McDonald JH, Devereux R, Smith DW (1999) Estimation of bacterial cell numbers in humic acid-rich salt marsh sediments with probes directed to 16S ribosomal DNA. Appl Environ Microbiol 65:1516-1523
Emerson D, Moyer C (1997) Isolation and characterization of novel iron-oxidizing bacteria that grow at circumneutral pH. Appl Environ Microbiol 63:4784-4792
Finster K, Liesack W, Thamdrup B (1998) Elemental sulfur and thiosulfate disproportionation by Desulfocapsa sulfoexigens sp. nov. a new anaerobic bacterium isolated from marine surface sediement. Appl Environ Microbiol 64:119-125
Gandy EL, Yoch DC (1988) Relationship between nitrogen-fixing sulfate reducers and fermenters in salt marsh sediments and roots of Spartina alterniflora. Appl Environ Microbiol 54:2031-2036
Herbert RA (1975) Heterotrophic nitrogen fixation in shallow estuarine sediments. J Exp Mar Biol Ecol 18:215-225
Hines ME, Evans RE, Genthner BRS, Willis SG, Friedman S, Rooney-Varga JN, Devereux R (1999) Molecular phylogenetic and biogeochemical study of sulfate-reducing bacteria in the rhizoshere of Spartina alterniflora. Appl Environ Microbiol 65:2209-2216
Howarth RW (1984) The ecological significance of sulfur in the energy dynamics of salt marsh and coastal marine sediments. Biogeochemistry 1:5-27
Howarth RW (1993) Microbial process in salt-marsh sediments. In: Ford TE (ed) Aquatic microbiology: an ecological approach. Blackwell Scientific Publications, Inc., Cambridge, MA, p 239-259
Howes BL, Teal JM (1994) Oxygen loss from Spartina alterniflora and its relationship to salt marsh oxygen balance. Oecologia 97:431-438
Howes BL, Dacey JWH, King GM (1984) Carbon flow through oxygen and sulfate reduction pathways in salt marsh sediments. Limnol Oceanogr 29:1037-1051
Imhoff JF, Schneider A, Podgorsek L (1995) Correlation of viable cell counts, metabolic activity of sulphur-oxidizing bacteria and chemical parameters of marine sediments. Helgolander Meeresunters. 49:223-236
Janssen PH, Yates PS, Grinton BE, Taylor PM, Sait M (2002) Improved culturability of soil bacteria and isolation in pure culture of novel members of the divisions
.CC-BY-NC 4.0 International licenseis made available under aThe copyright holder for this preprint (which was not peer-reviewed) is the author/funder. It. https://doi.org/10.1101/048611doi: bioRxiv preprint
Emerson, et al Salt marsh bacteria 21
Acidobacteria, Actinobacteria, Proteobacteria, and Verrucomicrobia. Appl Environ Microbiol 68:2391-2396
Keith-Roach MJ, Bryan, ND, Bardgett, RD, Livens FR (2002) Seasonal changes in the microbial community of a salt marsh, measured by phospholipid fatty acid analysis. Biogeochemistry 60:77-96
King GM, Wiebe WJ (1980) Regulation of sulfate concentrations and methanogenesis in salt marsh soils. Estaur. Coast. Mar. Sci. 10:215-223
Kolmert A, Wikstrom P, Hallberg KB (2000) A fast and simple turbidimetric method for the determination of sulfate in sulfate-reducing bacterial cultures. J Microbiol Meth 41:179-184
Koretsky CM, Moore CM, Lowe KL, Meile C, Dichristina TJ, Van Cappellen P (2003) Seasonal oscillation of microbial iron and sulfate reduction in saltmarsh sediments (Sapelo Island, GA, USA). Biogeochemistry 64:179-203
Kostka JE, Roychoudhury A, Van Cappellen P (2002a) Rates and controls of anaerobic microbial respiration across spatial and temporal gradients in saltmarsh sediments. Biogeochemistry 60:49-76
Kostka JE, Gribsholt B, Petrie E, Dalton D, Skelton H, Kristensen E (2002b) The rates and pathways of carbon oxidation in bioturbated saltmarsh sediments. Limnol Oceanogr 47:230-240
Kuenen JG, Robertson LA, Tuovinen OH (1992) The Genera Thiobacillus, Thiomicrospira, and Thiosphaera. In: Balows A, Truper, H.G., Dworkin, M., Harder, W., Schleifer, K.H. (ed) The Prokaryotes. Springer, New York, p 2638-2657
Leaphart AB, Friez, MJ, Lovell CR (2003) Formyltetrahydrofolate synthetase sequences from salt marsh plant roots reveal a diversity of acetogenic bacteria and other bacteria functional groups. Appl Environ Microbiol 69:693-696
Lovell CR, Bagwell CE, Czako M, Marton L, PicenoYM, Ringelberg DB (2001) Stability of a rhizosphere microbial community exposed to natural and manipulated environmental variability. FEMS Microbiol Ecol 38:69-76
Lovley DR (2000) Fe(III) and Mn(IV) Reduction. In: Lovley DR (ed) Environmental Microbe-Metal Interactions. ASM Press, Washington, D.C., p 3-30
Lovley DR, Phillips EJP (1988) Novel mode of microbial energy metabolism: organic carbon oxidation coupled to dissimilatory reduction of iron or manganese. Appl Environ Microbiol 54:1472-1480.
Lowe KL, DiChristina TJ, Roychoudhury AN, Van Cappellen P (2000) Microbiological and geochemical characterization of microbial Fe(III) reduction in salt marsh sediments. Geomicrobiol J 17:163-178
Lucas FS, Bertru G, Hofle MG (2003) Characterization of free-living and attached bacteria in sediments colonized by Hediste diversicolor. Aq Microbial Ecol 32:165-174
Lydell C, Emerson D. Gillevet P (2002) The hidden diversity right in front of us: most probable number's techniques recover much higher numbers of cells than plate counts done from salt marsh sediments Abstr Ann Mtg Am Soc Microbiol, Salt Lake City
Lydell C, Dowell L, Sikaroodi M, Gillevet P, Emerson D (2003) A population survey of members of the phylum Bacteroidetes isolated from salt marsh sediments along the East coast of the United States. Microb Ecol In Press
Malik KA, Schlegel HG (1981) Chemolithoautotrophic growth of bacteria able to grow under N2-fixing conditions. FEMS Microbiol Lett 11:63-67
Nelson DW, Sommers LE. (1982) Total carbon, organic carbon, and organic matter. In: Page AL Miller RH, Kenny DR (ed) Methods of Soil Analysis: Part 2- Chemical and Microbiological Properties. Soil Science Society of America, Inc., p 539-579
.CC-BY-NC 4.0 International licenseis made available under aThe copyright holder for this preprint (which was not peer-reviewed) is the author/funder. It. https://doi.org/10.1101/048611doi: bioRxiv preprint
Emerson, et al Salt marsh bacteria 22
Neubauer SC, Emerson D, Megonigal JP (2002) Life at the energetic edge: Kinetics of circumneutral iron oxidation by lithotrophic iron-oxidizing bacteria isolated from the wetland plant rhizosphere. Appl Environ Microbiol 68:3988-3995
Odum EP (2000) Tidal marshes as outwelling/pulsing systems. In: Weinstein MP, Kreeger DA (ed) Concepts and Controversies in Tidal Marsh Ecology. Kluver Academic Publishers, Boston, MA, p 3-8
Pace NR (1997) A Molecular View of Microbial Diversity and the Biosphere. Science 276:734-739
Piceno YM, Lovell CR (2000a) Stability in natural bacterial communities: I. Nutrient addition effects on rhizosphere diazotroph assemblage composition. Microbial Ecol 39:32-40
Piceno YM, and. Lovell CR (2000b) Stability in natural bacterial communities: II. Plant resource allocation effects on rhizosphere diazotroph assemblage composition. Microbial Ecol 39:41-48
Purdy KJ, Embley TM, Nedwell DB (2002) The distribution and activity of sulphate reducing bacteria in estuarine and coastal marine sediments. Antonine van Leeuwenhoek 81:181-187
Rooney-Varga J, Sharak Genther BR, Devereux R, Willis SG, Friedman SD, Hines ME (1998) Phylogenetic and physiological diversity of sulphate-reducing bacteria isolated from a salt marsh sediment. System Appl Microbiol 21:557-568
Rublee P, Dornseif BE (1978) Direct counts of bacteria in the sediments of a North Carolina salt marsh. Estuaries 1:188-191
Sievert SM, Brinkhoff T, Muyzer G, Ziebis W, Kuever J (1999) Spatial heterogeneity of bacterial populations along an environmental gradient at a shallow submarine hydrothermal vent near Milos Island (Greece). Appl Environ Microbiol 65:3834-3842
Sivanesan A, Manners JG (1972) Bacteria of muds colonized by Spartina townsendii and their possible role in spartina die-back. Plant Soil 36:349-361
Stookey LL (1970) Ferrozine-a new spectrophotometric reagent for iron. Anal Chem 42:779-781
Stubner STW, Conrad R. (1998) Sulfur oxidation in rice field soil: Activity, enumeration, isolation and characterization of thiosulfate-oxidizing bacteria. System Appl Microbiol 21:569-578
Thamdrup B, Finster K, Hansen JW, and Bak F (1993) Bacterial disproportionation of elemental sulfur coupled to chemical reduction of iron and manganese. Appl Environ Microbiol 59:101-108
Widdel F, Bak F (1992) Gram-negative mesophilic sulfate-reducing bacteria. In: Balows A, Truper, H.G., Dworkin, M., Harder, W., Schleifer, K.H. (ed) The Prokaryotes. Springer, New York, p 3352-3372
Wolin EA, Wolin, MJ, Wolfe RS (1963) Formation of methane by bacterial extracts. J Biol Chem 238:2882-2886
.CC-BY-NC 4.0 International licenseis made available under aThe copyright holder for this preprint (which was not peer-reviewed) is the author/funder. It. https://doi.org/10.1101/048611doi: bioRxiv preprint
Emerson, et al Salt marsh bacteria 23
FIGURE LEGENDS
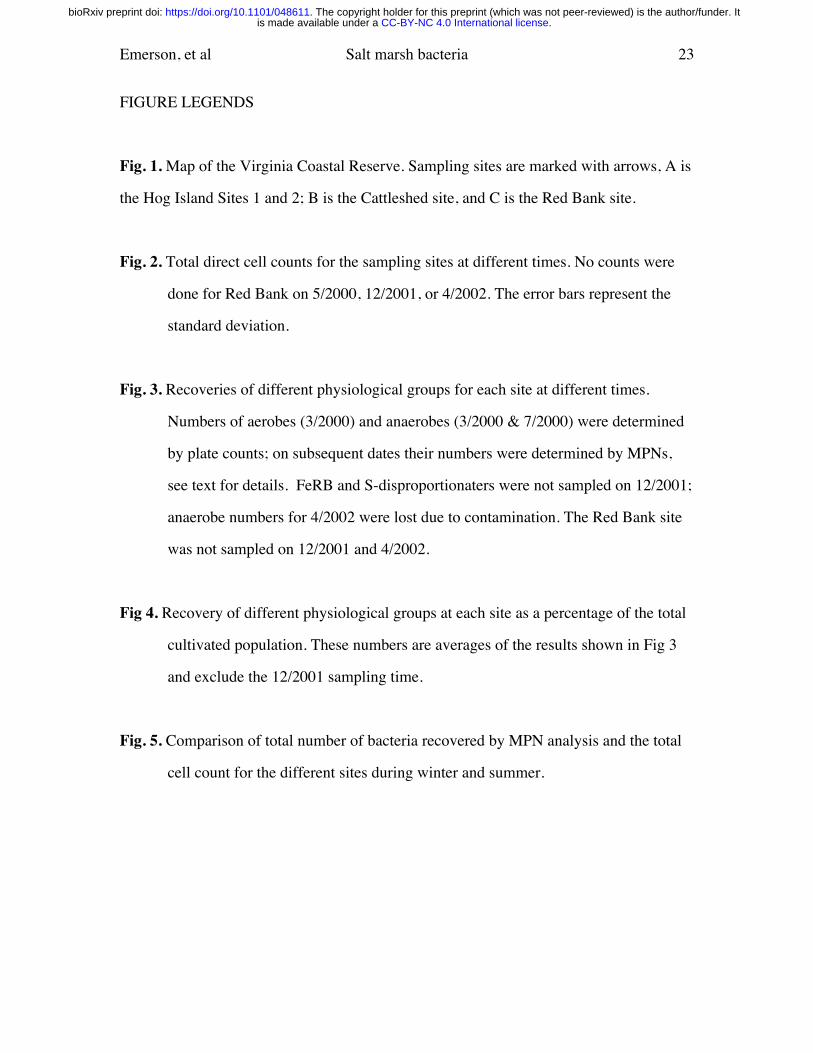
Fig. 1. Map of the Virginia Coastal Reserve. Sampling sites are marked with arrows, A is
the Hog Island Sites 1 and 2; B is the Cattleshed site, and C is the Red Bank site.
Fig. 2. Total direct cell counts for the sampling sites at different times. No counts were
done for Red Bank on 5/2000, 12/2001, or 4/2002. The error bars represent the
standard deviation.
Fig. 3. Recoveries of different physiological groups for each site at different times.
Numbers of aerobes (3/2000) and anaerobes (3/2000 & 7/2000) were determined
by plate counts; on subsequent dates their numbers were determined by MPNs,
see text for details. FeRB and S-disproportionaters were not sampled on 12/2001;
anaerobe numbers for 4/2002 were lost due to contamination. The Red Bank site
was not sampled on 12/2001 and 4/2002.
Fig 4. Recovery of different physiological groups at each site as a percentage of the total
cultivated population. These numbers are averages of the results shown in Fig 3
and exclude the 12/2001 sampling time.
Fig. 5. Comparison of total number of bacteria recovered by MPN analysis and the total
cell count for the different sites during winter and summer.
.CC-BY-NC 4.0 International licenseis made available under aThe copyright holder for this preprint (which was not peer-reviewed) is the author/funder. It. https://doi.org/10.1101/048611doi: bioRxiv preprint

Emerson, et al Salt marsh bacteria 24
Table 1. Site Characteristics. Site Location %Organic
Matter CHN Temp.
Range Sediment pH
Salinity Color/Texture
Hog Is, S1 37° 27.167' N 75° 40.513' W
3.96 1.32: 0.13: 0.09
8 - 29 7.03 NDa Gray - brown, clay/sand
Hog Is, S2 37° 27.167' N 75° 40.513' W
44.0 9.38: 1.31: 0.70
5 - 30.5 7.28 30 Black, sand/clay
Cattleshed 37° 26.595' N 75° 41.315' W
5.42 1.73: 0.33: 0.19
13 - 27 7.01 33 Gray, clay/sand
Red Bank 37° 26.731' N 75° 50.382' W
3.73 0.85: 0.21: 0.09
14 - 30 6.99 35 Gray, clay aND, not determined.
.CC-BY-NC 4.0 International licenseis made available under aThe copyright holder for this preprint (which was not peer-reviewed) is the author/funder. It. https://doi.org/10.1101/048611doi: bioRxiv preprint
Emerson, et al Salt marsh bacteria 25
Fig. 1
N
10 0 10 20 Kilometers
Ches
apea
ke B
ay
Atla
ntic
Ocea
n
A
BC
.CC-BY-NC 4.0 International licenseis made available under aThe copyright holder for this preprint (which was not peer-reviewed) is the author/funder. It. https://doi.org/10.1101/048611doi: bioRxiv preprint

Emerson, et al Salt marsh bacteria 26
Fig 2.
108
109
1010
1011
12/1999 3/2000 5/2000 7/2000 11/2000 2/2001 7/2001 12/2001 4/2002
Hog Is, S1Hog Is, S2CattleshedRed Bank
Cel
ls . g
dw-1
Date
.CC-BY-NC 4.0 International licenseis made available under aThe copyright holder for this preprint (which was not peer-reviewed) is the author/funder. It. https://doi.org/10.1101/048611doi: bioRxiv preprint

Emerson, et al Salt marsh bacteria 27
Fig 3.
104
105
106
107
108
109
1010
3/2000 7/2000 11/2000 2/2001 7/2001 12/2001 4/2002
Hog Island S1
SRBsS-oxidizersS-disprop.FeRBAnaerobesAerobes
Cel
ls . gd
w-1
Sampling time
105
106
107
108
109
1010
3/2000 7/2000 11/2000 2/2001 7/2001 12/2001 4/2002
Hog Island S2
Cel
ls . gd
w-1
Sampling time
104
105
106
107
108
109
1010
3/2000 7/2000 11/2000 2/2001 7/2001 12/2001 4/2002
Cattleshed
Cel
ls . gd
w-1
Sampling time
104
105
106
107
108
109
1010
3/2000 7/2000 11/2000 2/2001 7/2001 12/2001 4/2002
Red Bank
SRBsS-oxidizersS-disprop.FeRBAnaerobesAerobes
Cel
ls . gd
w-1
Sampling time
.CC-BY-NC 4.0 International licenseis made available under aThe copyright holder for this preprint (which was not peer-reviewed) is the author/funder. It. https://doi.org/10.1101/048611doi: bioRxiv preprint
Emerson, et al Salt marsh bacteria 28
Fig . 4
Hog Is S1 AerobesAnaerobesSRBsFeRBS-dispro.S-oxidizers
68.8%1.8%
10.2%
3.3%
1.1%
14.8%Hog Is S2
54.8%
3.9%2%
3.4%
15.1%
20.8%
Cattleshed AerobesAnaerobesSRBsFeRBS-dispro.S-oxidizers
58.9%
5.11%
2%0.1%2%
31.9%
Red Bank
35.5%
0.599%
6.39%
0.899%3.8%
52.8%
.CC-BY-NC 4.0 International licenseis made available under aThe copyright holder for this preprint (which was not peer-reviewed) is the author/funder. It. https://doi.org/10.1101/048611doi: bioRxiv preprint

Emerson, et al Salt marsh bacteria 29
Fig . 5
106
107
108
109
1010
Hog Is S1 Hog Is S2 Cattleshed Red Bank
February, 2001 Total RecoveredTotal Cell Count
Tota
l Rec
over
ed
Location
107
108
109
1010
Hog Is S1 Hog Is S2 Cattleshed Red Bank
July, 2001
Tota
l Rec
over
ed
Location
.CC-BY-NC 4.0 International licenseis made available under aThe copyright holder for this preprint (which was not peer-reviewed) is the author/funder. It. https://doi.org/10.1101/048611doi: bioRxiv preprint