Embed Size (px)
Citation preview
ORIGINAL RESEARCH
Methane Oxidation by Endophytic Bacteria Inhabiting Sphagnumsp. and Some Vascular Plants
Z. Stępniewska1 &W. Goraj1 & A. Kuźniar1 & A. Szafranek-Nakonieczna1 & A. Banach1& A. Górski1 & A. Pytlak1 & D. Urban2
Received: 24 November 2015 /Accepted: 28 November 2017 /Published online: 7 February 2018# The Author(s) 2018. This article is an open access publication
AbstractMethane emission fromwetlands is responsible for about 24% of the total CH4 emissions. The value of emission is a result of thebalance between the processes of methane formation (methanogenesis) and sinks (methanotrophy). The methanotrophic activityfrom well-aerated soil surface layers has been relatively well recognized. On the contrary, the active role of plants in reduction ofmethane emission is rather not fully known. The association of methanotrophic bacteria with plants of Sphagnum spp., hasalready been recognized. In our investigations, particular attention was paid to vascular plants from a peatland overgrown bySphagnum spp. but also Eriophorum vaginatum, Carex nigra, and Vaccinium oxycoccos. The gases emitted from the surface ofMoszne peatland were collected using the chamber method from selected sites during growing seasons (spring, summer,autumn). To estimate the contribution of plants in methane emissions from the peatland, in each investigated site gas was sampledfrom the surface with the native flora cover and after removal thereof. Our results show that the reduction in the CH4 emissionwas related to the plant composition, vegetation period, and conditions of the plants. It was confirmed that the endophytes underinvestigation belonged to type I methanotrophs.
Keywords Methane . Peat soil . Endophytic methanotrophs
Introduction
Methane and carbon dioxide are the main greenhouse gases(IPCC 2013). At the time of the global warming effect, reduc-tion of the methane concentration in the atmosphere, bothfrom natural and anthropogenic sources, is very important.Wetlands, including peatlands, are considered the largest nat-ural source of methane emissions; they emit 100–231 Tg CH4
into the atmosphere annually, which accounts for 10%–45%of the total emissions of this gas (IPCC 2007). The emission ofmethane from peatlands is a result of the balance between theprocesses of formation thereof (methanogenesis) and its sinks(methanotrophy) (Le Mer and Roger 2001) with the latter
process being long considered to take place only in the upper-most, well-aerated soil horizons.
The role of plants in wetland methane cycling has been asubject of a two decade-long scientific query (Thomas et al.1996; Laanbroek 2010; Kip et al. 2012). It was stated that theoccurrence of plants such as e.g. Carex sp. enhances methaneemission by up to 90% (Whiting and Chanton 1992). It wassuggested that the increased methane emission is a side effect ofplant adaptation to soil anoxia, which includes formation of aninternal gas-space ventilation system in stems, roots, and rhi-zomes aiming to allowoxygen transport to the submerged organs.However, aerenchyma acts as gas conduits not only for O2. It alsocreates a shortcut for CH4 by which it can bypass the aerated soilhorizons without being oxidized by methanotrophic bacteria.
Recent discoveries have shown that the carbon cycling inwetlands is far more complicated due to the presence of viablemethanotrophic bacteria in the endosphere of Sphagnummosses(Raghoebarsing et al. 2005). It has been demonstrated thatmethanotrophs inhabiting Sphagnum spp., e.g., Methylocellapalustris and Methylocapsa acidiphila, oxidize methane to car-bon dioxide, which is later used by Sphagnum spp. plants in theprocess of photosynthesis (Raghoebarsing et al. 2005;Stępniewska et al. 2013). This discovery has substantially
* A. [email protected]
1 The John Paul II Catholic University of Lublin, Lublin, Poland2 University of Life Sciences in Lublin, Institute of Soil Science,
Environment Engineering and Management, ul. Leszczyńskiego 7,20-069 Lublin, Poland
Wetlands (2018) 38:411–422https://doi.org/10.1007/s13157-017-0984-3
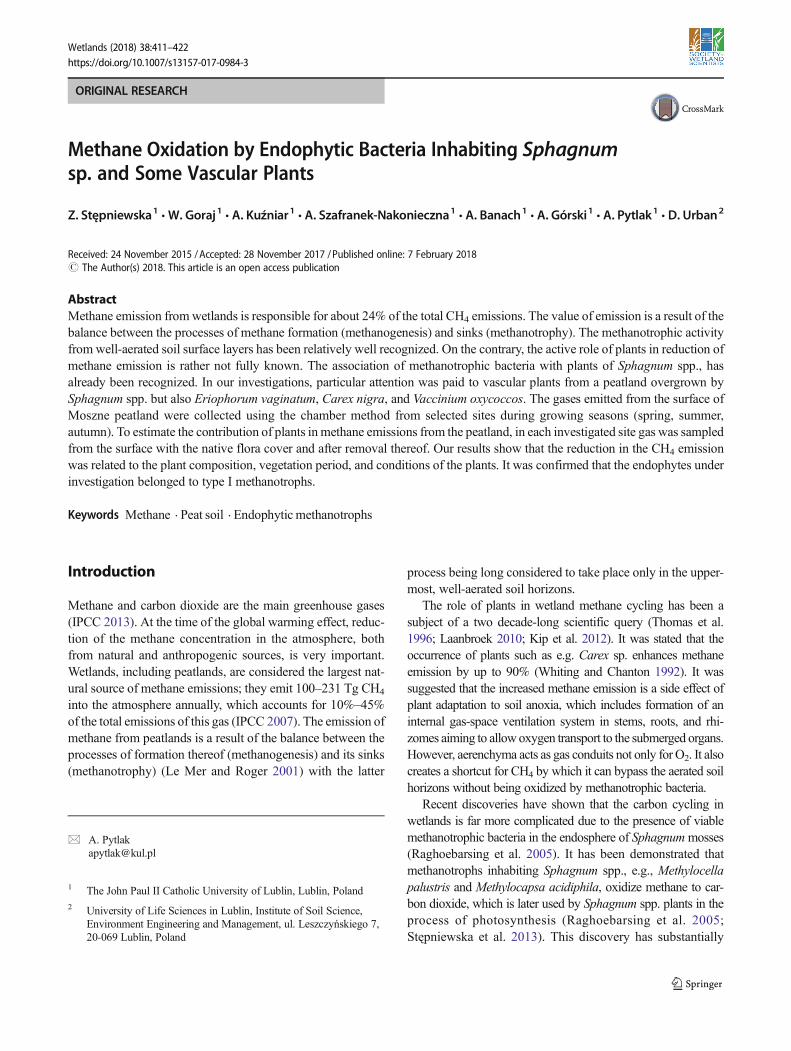
changed the description of the carbon cycle in peat ecosystemsand, at the same time, the global carbon cycle. It has becomeclear that the methanotrophic endophytes inhabiting plant tissuesact as a natural methane filter that can reduce CH4 and CO2
emission from peatlands by up to 50% (Kip et al. 2012;Fig. 1). Other field studies have shown the potential ability ofthe plant–methanotrophic bacteria systems to reduce methaneemission up to 77%, depending on the season and the host plant(Goraj et al. 2013).
The role of Sphagnum spp. as a host for endophyticmethanotrophs has already been a subject of a number ofstudies (Raghoebarsing et al. 2005; Liebner et al. 2011;Stępniewska et al. 2013; Putkinen et al. 2014). However,mosses are not the only component of the peatland flora. Inthese ecosystems, a vast array of vascular plants can be found,including numerous species of Poales and Ericales.Wetland-adapted plants are known to transport soil-produced methaneto the atmosphere; these plants also comprise a probable hab-itat for methanotrophic bacteria. This association however,has not been described so far.
In our investigation, particular attention was paid toSphagnum sp., Eriophorum sp., Carex sp., and Vacciniumsp. - species dominating in the Moszne peatland. The specificresearch goals were to:
– determine the role that the plant species play in methaneemission in situ,
– determine the influence of soil properties on methaneemission,
– investigate the presence and activity of endophyticmethanotrophic bacteria in plant tissues,
– identify methanotrophic endophytic bacteria
Material and Methods
Location
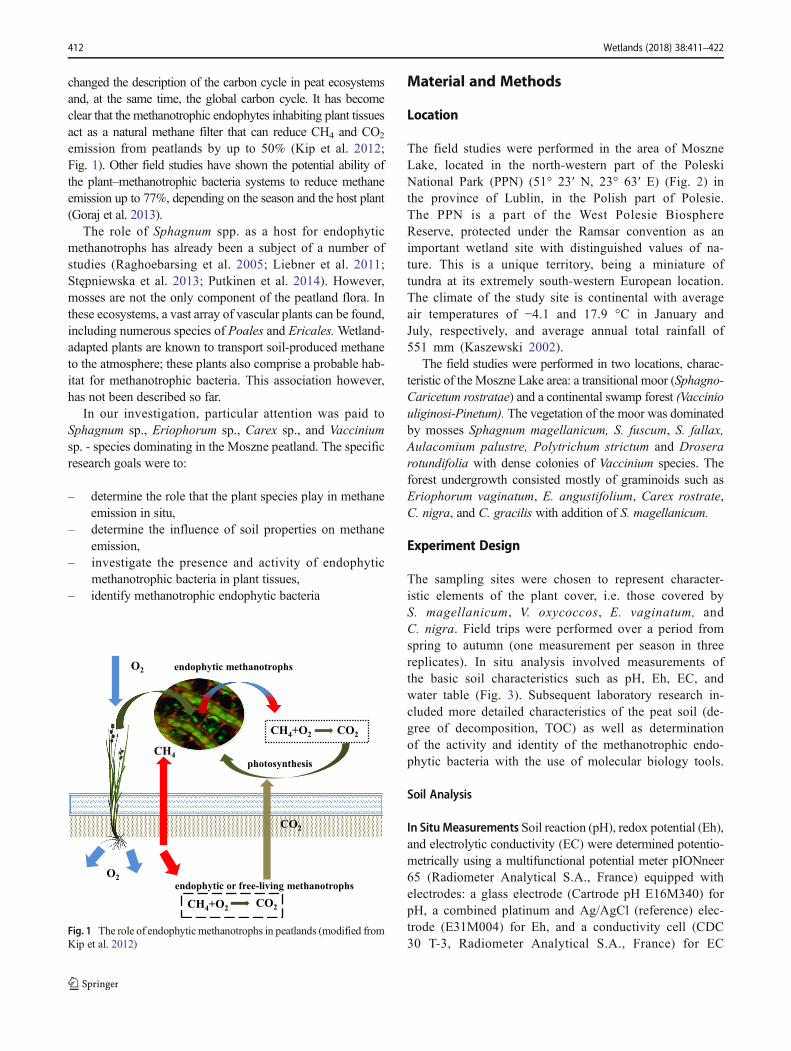
The field studies were performed in the area of MoszneLake, located in the north-western part of the PoleskiNational Park (PPN) (51° 23′ N, 23° 63′ E) (Fig. 2) inthe province of Lublin, in the Polish part of Polesie.The PPN is a part of the West Polesie BiosphereReserve, protected under the Ramsar convention as animportant wetland site with distinguished values of na-ture. This is a unique territory, being a miniature oftundra at its extremely south-western European location.The climate of the study site is continental with averageair temperatures of −4.1 and 17.9 °C in January andJuly, respectively, and average annual total rainfall of551 mm (Kaszewski 2002).
The field studies were performed in two locations, charac-teristic of the Moszne Lake area: a transitional moor (Sphagno-Caricetum rostratae) and a continental swamp forest (Vacciniouliginosi-Pinetum). The vegetation of the moor was dominatedby mosses Sphagnum magellanicum, S. fuscum, S. fallax,Aulacomium palustre, Polytrichum strictum and Droserarotundifolia with dense colonies of Vaccinium species. Theforest undergrowth consisted mostly of graminoids such asEriophorum vaginatum, E. angustifolium, Carex rostrate,C. nigra, and C. gracilis with addition of S. magellanicum.
Experiment Design
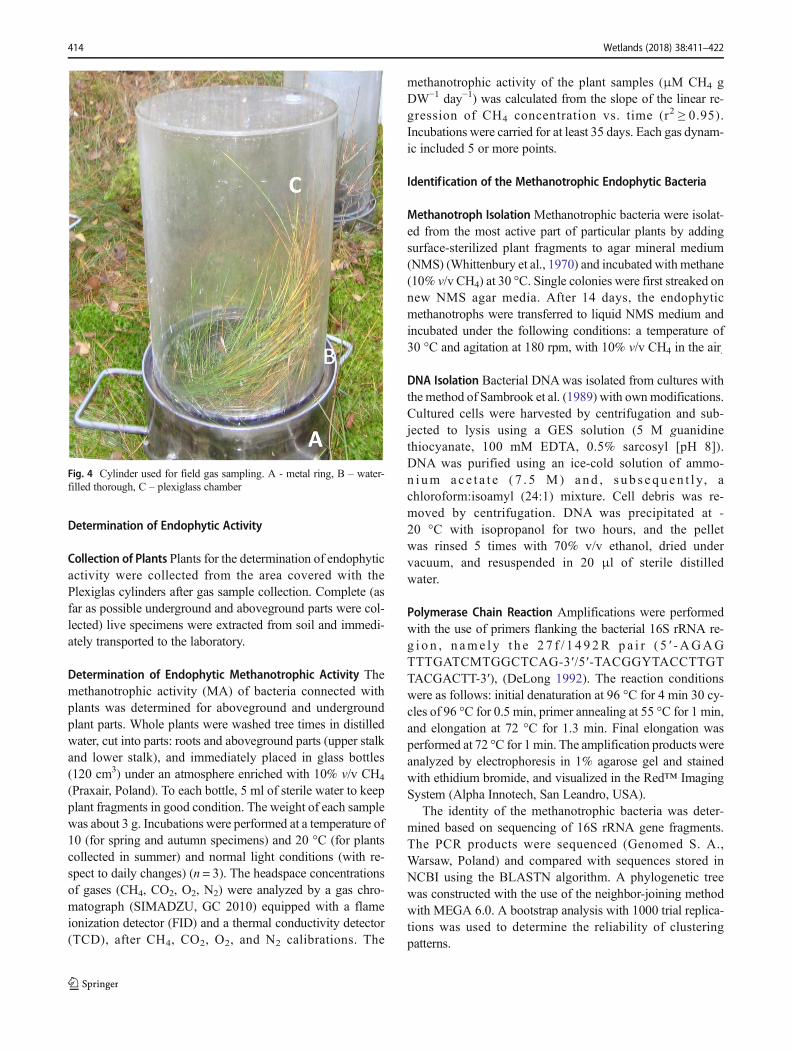
The sampling sites were chosen to represent character-istic elements of the plant cover, i.e. those covered byS. magellanicum, V. oxycoccos, E. vaginatum, andC. nigra. Field trips were performed over a period fromspring to autumn (one measurement per season in threereplicates). In situ analysis involved measurements ofthe basic soil characteristics such as pH, Eh, EC, andwater table (Fig. 3). Subsequent laboratory research in-cluded more detailed characteristics of the peat soil (de-gree of decomposition, TOC) as well as determinationof the activity and identity of the methanotrophic endo-phytic bacteria with the use of molecular biology tools.
Soil Analysis
In Situ Measurements Soil reaction (pH), redox potential (Eh),and electrolytic conductivity (EC) were determined potentio-metrically using a multifunctional potential meter pIONneer65 (Radiometer Analytical S.A., France) equipped withelectrodes: a glass electrode (Cartrode pH E16M340) forpH, a combined platinum and Ag/AgCl (reference) elec-trode (E31M004) for Eh, and a conductivity cell (CDC30 T-3, Radiometer Analytical S.A., France) for EC
O2
O2
endophytic methanotrophs
CH4+O2 CO2
CH4+O2 CO2
endophytic or free-living methanotrophs
CH4
CO2
photosynthesis
Fig. 1 The role of endophyticmethanotrophs in peatlands (modified fromKip et al. 2012)
412 Wetlands (2018) 38:411–422
(Bennicelli et al.; 2006; Malawska et al. 2006). Thefinal Eh was corrected for pH values according to apattern developed by Bennicelli et al. (2006).
Laboratory Determinations of the Peat Soil The degree of peatdecomposition was determined using the microscopic method(Fuchsman 1980), while the soil moisture content was esti-mated by sample weighing after 48-h (105 °C) oven-drying(Gnatowski et al. 2010; Szafranek-Nakonieczna andBennicelli 2010). The organic matter content (OM) wascalculated by loss-on-ignition during combustion of thepeat at 550 °C, (Zaccone et al. 2007; Kechavarzi et al.2010). Organic carbon was determined in water extracts(dissolved organic carbon, DOC) and dry peat samples(total organic carbon, TOC) by combustion and analysisof evolved CO2 by means of TOC-VCSH with an SSM-5000A module (Shimadzu, Japan).
Methane Emissions
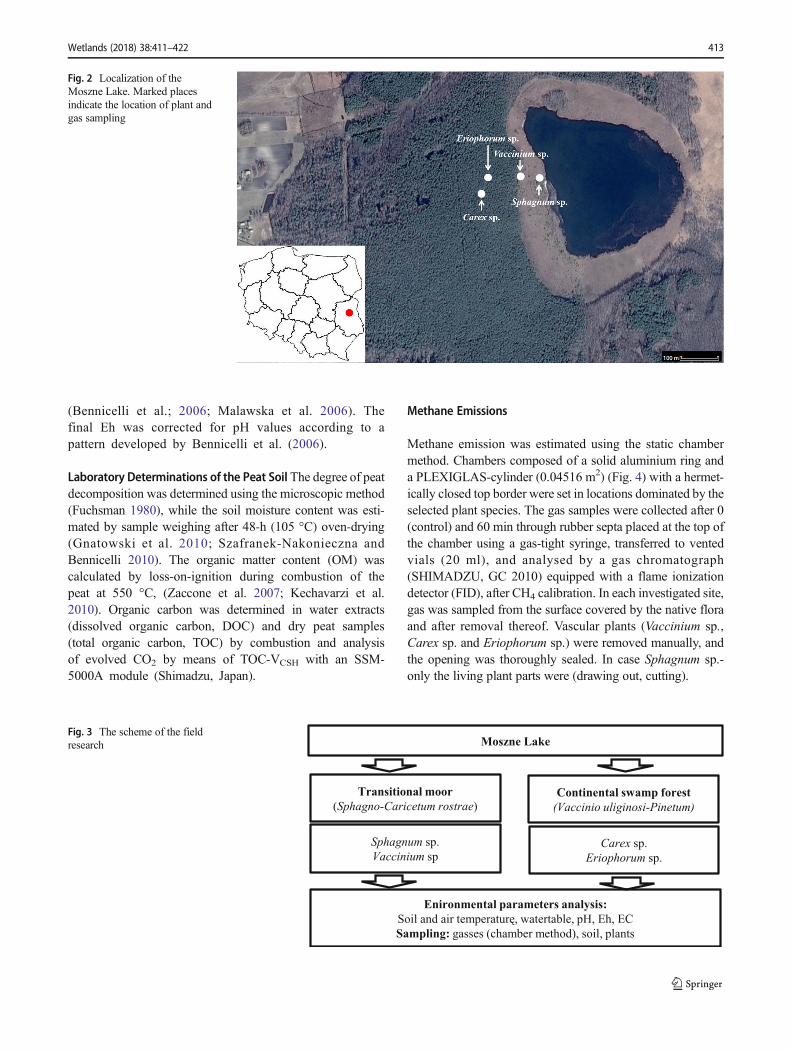
Methane emission was estimated using the static chambermethod. Chambers composed of a solid aluminium ring anda PLEXIGLAS-cylinder (0.04516 m2) (Fig. 4) with a hermet-ically closed top border were set in locations dominated by theselected plant species. The gas samples were collected after 0(control) and 60 min through rubber septa placed at the top ofthe chamber using a gas-tight syringe, transferred to ventedvials (20 ml), and analysed by a gas chromatograph(SHIMADZU, GC 2010) equipped with a flame ionizationdetector (FID), after CH4 calibration. In each investigated site,gas was sampled from the surface covered by the native floraand after removal thereof. Vascular plants (Vaccinium sp.,Carex sp. and Eriophorum sp.) were removed manually, andthe opening was thoroughly sealed. In case Sphagnum sp.-only the living plant parts were (drawing out, cutting).
Fig. 2 Localization of theMoszne Lake. Marked placesindicate the location of plant andgas sampling
Moszne Lake
Sphagnum sp.
Vaccinium sp
Transitional moor
(Sphagno-Caricetum rostrae)
Enironmental parameters analysis:
Soil and air temperaturę, watertable, pH, Eh, EC
Sampling: gasses (chamber method), soil, plants
Carex sp.
Eriophorum sp.
Continental swamp forest
(Vaccinio uliginosi-Pinetum)
Fig. 3 The scheme of the fieldresearch
Wetlands (2018) 38:411–422 413
Determination of Endophytic Activity
Collection of Plants Plants for the determination of endophyticactivity were collected from the area covered with thePlexiglas cylinders after gas sample collection. Complete (asfar as possible underground and aboveground parts were col-lected) live specimens were extracted from soil and immedi-ately transported to the laboratory.
Determination of Endophytic Methanotrophic Activity Themethanotrophic activity (MA) of bacteria connected withplants was determined for aboveground and undergroundplant parts. Whole plants were washed tree times in distilledwater, cut into parts: roots and aboveground parts (upper stalkand lower stalk), and immediately placed in glass bottles(120 cm3) under an atmosphere enriched with 10% v/v CH4
(Praxair, Poland). To each bottle, 5 ml of sterile water to keepplant fragments in good condition. The weight of each samplewas about 3 g. Incubations were performed at a temperature of10 (for spring and autumn specimens) and 20 °C (for plantscollected in summer) and normal light conditions (with re-spect to daily changes) (n = 3). The headspace concentrationsof gases (CH4, CO2, O2, N2) were analyzed by a gas chro-matograph (SIMADZU, GC 2010) equipped with a flameionization detector (FID) and a thermal conductivity detector(TCD), after CH4, CO2, O2, and N2 calibrations. The
methanotrophic activity of the plant samples (μM CH4 gDW−1 day−1) was calculated from the slope of the linear re-gression of CH4 concentration vs. time (r2 ≥ 0.95).Incubations were carried for at least 35 days. Each gas dynam-ic included 5 or more points.
Identification of the Methanotrophic Endophytic Bacteria
Methanotroph Isolation Methanotrophic bacteria were isolat-ed from the most active part of particular plants by addingsurface-sterilized plant fragments to agar mineral medium(NMS) (Whittenbury et al., 1970) and incubated with methane(10% v/v CH4) at 30 °C. Single colonies were first streaked onnew NMS agar media. After 14 days, the endophyticmethanotrophs were transferred to liquid NMS medium andincubated under the following conditions: a temperature of30 °C and agitation at 180 rpm, with 10% v/v CH4 in the air.
DNA Isolation Bacterial DNAwas isolated from cultures withthe method of Sambrook et al. (1989) with ownmodifications.Cultured cells were harvested by centrifugation and sub-jected to lysis using a GES solution (5 M guanidinethiocyanate, 100 mM EDTA, 0.5% sarcosyl [pH 8]).DNA was purified using an ice-cold solution of ammo-n i um ac e t a t e ( 7 . 5 M) and , s ub s e qu en t l y, achloroform:isoamyl (24:1) mixture. Cell debris was re-moved by centrifugation. DNA was precipitated at -20 °C with isopropanol for two hours, and the pelletwas rinsed 5 times with 70% v/v ethanol, dried undervacuum, and resuspended in 20 μl of sterile distilledwater.
Polymerase Chain Reaction Amplifications were performedwith the use of primers flanking the bacterial 16S rRNA re-g i o n , n ame l y t h e 2 7 f / 1 4 9 2R p a i r ( 5 ′ -AGAGTTTGATCMTGGCTCAG-3′/5′-TACGGYTACCTTGTTACGACTT-3′), (DeLong 1992). The reaction conditionswere as follows: initial denaturation at 96 °C for 4 min 30 cy-cles of 96 °C for 0.5 min, primer annealing at 55 °C for 1 min,and elongation at 72 °C for 1.3 min. Final elongation wasperformed at 72 °C for 1 min. The amplification products wereanalyzed by electrophoresis in 1% agarose gel and stainedwith ethidium bromide, and visualized in the Red™ ImagingSystem (Alpha Innotech, San Leandro, USA).
The identity of the methanotrophic bacteria was deter-mined based on sequencing of 16S rRNA gene fragments.The PCR products were sequenced (Genomed S. A.,Warsaw, Poland) and compared with sequences stored inNCBI using the BLASTN algorithm. A phylogenetic treewas constructed with the use of the neighbor-joining methodwith MEGA 6.0. A bootstrap analysis with 1000 trial replica-tions was used to determine the reliability of clusteringpatterns.
Fig. 4 Cylinder used for field gas sampling. A - metal ring, B – water-filled thorough, C – plexiglass chamber
414 Wetlands (2018) 38:411–422
Statistical Analysis
Statistical analyses were performed using Statistica 9(STATSOFT, USA). The significance of differences be-tween soil characteristics and methane emissions in par-ticular sampling points were tested at the level ofp < 0.05. Homogeneity of variances and distributionswere assessed using Brown-Forsyth and Shapiro-Wilktests, respectively. Further analysis of the data was per-formed using parametric (one-way ANOVA) or non-parametric (Kruskal-Wallis or U-Mann Whitney) tests.Pearson or Spearman correlation coefficients were cal-culated to evaluate the relationship between peat prop-erties and methane emission.
Results and Discussion
Soil Properties
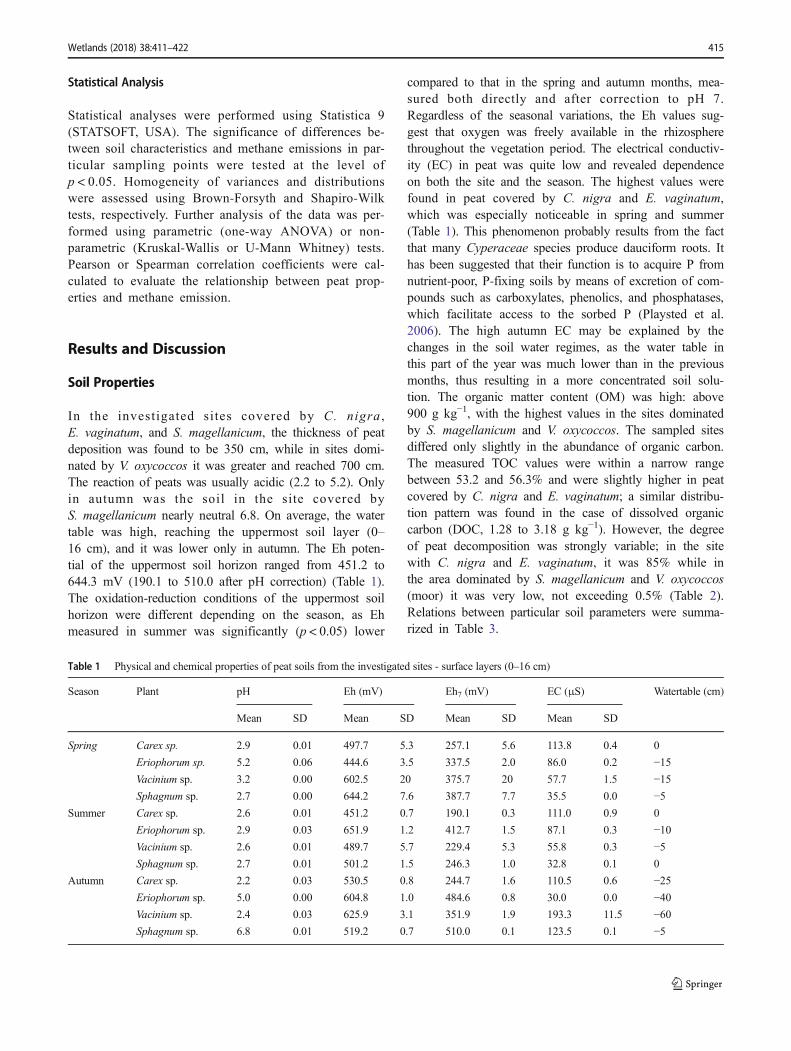
In the investigated sites covered by C. nigra ,E. vaginatum, and S. magellanicum, the thickness of peatdeposition was found to be 350 cm, while in sites domi-nated by V. oxycoccos it was greater and reached 700 cm.The reaction of peats was usually acidic (2.2 to 5.2). Onlyin autumn was the soil in the site covered byS. magellanicum nearly neutral 6.8. On average, the watertable was high, reaching the uppermost soil layer (0–16 cm), and it was lower only in autumn. The Eh poten-tial of the uppermost soil horizon ranged from 451.2 to644.3 mV (190.1 to 510.0 after pH correction) (Table 1).The oxidation-reduction conditions of the uppermost soilhorizon were different depending on the season, as Ehmeasured in summer was significantly (p < 0.05) lower
compared to that in the spring and autumn months, mea-sured both directly and after correction to pH 7.Regardless of the seasonal variations, the Eh values sug-gest that oxygen was freely available in the rhizospherethroughout the vegetation period. The electrical conductiv-ity (EC) in peat was quite low and revealed dependenceon both the site and the season. The highest values werefound in peat covered by C. nigra and E. vaginatum,which was especially noticeable in spring and summer(Table 1). This phenomenon probably results from the factthat many Cyperaceae species produce dauciform roots. Ithas been suggested that their function is to acquire P fromnutrient-poor, P-fixing soils by means of excretion of com-pounds such as carboxylates, phenolics, and phosphatases,which facilitate access to the sorbed P (Playsted et al.2006). The high autumn EC may be explained by thechanges in the soil water regimes, as the water table inthis part of the year was much lower than in the previousmonths, thus resulting in a more concentrated soil solu-tion. The organic matter content (OM) was high: above900 g kg−1, with the highest values in the sites dominatedby S. magellanicum and V. oxycoccos. The sampled sitesdiffered only slightly in the abundance of organic carbon.The measured TOC values were within a narrow rangebetween 53.2 and 56.3% and were slightly higher in peatcovered by C. nigra and E. vaginatum; a similar distribu-tion pattern was found in the case of dissolved organiccarbon (DOC, 1.28 to 3.18 g kg−1). However, the degreeof peat decomposition was strongly variable; in the sitewith C. nigra and E. vaginatum, it was 85% while inthe area dominated by S. magellanicum and V. oxycoccos(moor) it was very low, not exceeding 0.5% (Table 2).Relations between particular soil parameters were summa-rized in Table 3.
Table 1 Physical and chemical properties of peat soils from the investigated sites - surface layers (0–16 cm)
Season Plant pH Eh (mV) Eh7 (mV) EC (μS) Watertable (cm)
Mean SD Mean SD Mean SD Mean SD
Spring Carex sp. 2.9 0.01 497.7 5.3 257.1 5.6 113.8 0.4 0
Eriophorum sp. 5.2 0.06 444.6 3.5 337.5 2.0 86.0 0.2 −15Vacinium sp. 3.2 0.00 602.5 20 375.7 20 57.7 1.5 −15Sphagnum sp. 2.7 0.00 644.2 7.6 387.7 7.7 35.5 0.0 −5
Summer Carex sp. 2.6 0.01 451.2 0.7 190.1 0.3 111.0 0.9 0
Eriophorum sp. 2.9 0.03 651.9 1.2 412.7 1.5 87.1 0.3 −10Vacinium sp. 2.6 0.01 489.7 5.7 229.4 5.3 55.8 0.3 −5Sphagnum sp. 2.7 0.01 501.2 1.5 246.3 1.0 32.8 0.1 0
Autumn Carex sp. 2.2 0.03 530.5 0.8 244.7 1.6 110.5 0.6 −25Eriophorum sp. 5.0 0.00 604.8 1.0 484.6 0.8 30.0 0.0 −40Vacinium sp. 2.4 0.03 625.9 3.1 351.9 1.9 193.3 11.5 −60Sphagnum sp. 6.8 0.01 519.2 0.7 510.0 0.1 123.5 0.1 −5
Wetlands (2018) 38:411–422 415
Methane Emission
The study was performed in four sites covered by variousspecies of vascular plants and a moss. Methane fluxes frombare soil at the different sites were very variable. Regardless ofthe season, the highest emissions were detected in the transi-tional moor, in particular in S. magellanicum habitats(p < 0.05), where in autumn they reached values as high as3.052 g CH4m
−2 h−2 (Table 3). The lowest flux of the methanewas found in locations covered by E. vaginatum (0.002 to0.210 g CH4 m
−2 h−2) (Table 4).The high temporal and spatial variation of CH4 emission in
the air over the investigated sites is a typical feature of thewetland ecosystem (Ding and Cai 2007; Noyce et al. 2014).It has to be noted that methane emission depends upon manyphysical and chemical factors, e.g. temperature, pH, Eh, etc.(Noyce et al. 2014; Putkinen et al. 2014). Consequently, evenin ecologically homogeneous research areas, the coefficient ofspatial variation can range from 30% to 100% over short dis-tances (Bartlett and Harris 1993). In theMoszne area, relations
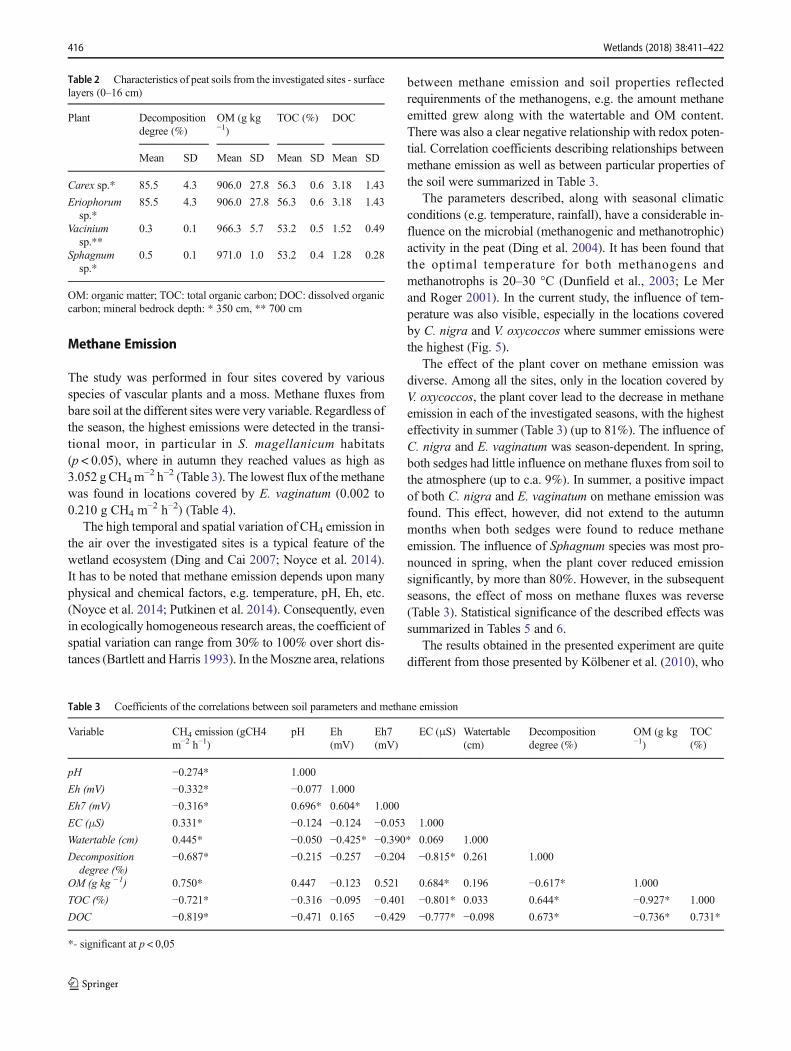
between methane emission and soil properties reflectedrequirenments of the methanogens, e.g. the amount methaneemitted grew along with the watertable and OM content.There was also a clear negative relationship with redox poten-tial. Correlation coefficients describing relationships betweenmethane emission as well as between particular properties ofthe soil were summarized in Table 3.
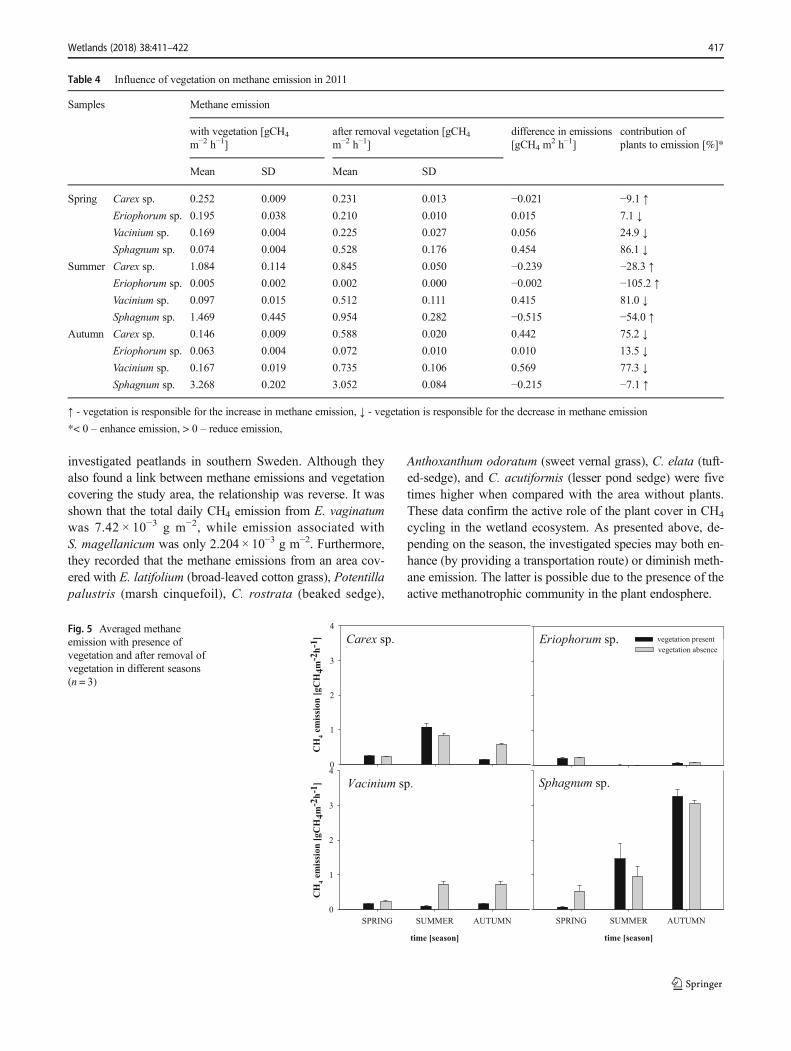
The parameters described, along with seasonal climaticconditions (e.g. temperature, rainfall), have a considerable in-fluence on the microbial (methanogenic and methanotrophic)activity in the peat (Ding et al. 2004). It has been found thatthe optimal temperature for both methanogens andmethanotrophs is 20–30 °C (Dunfield et al., 2003; Le Merand Roger 2001). In the current study, the influence of tem-perature was also visible, especially in the locations coveredby C. nigra and V. oxycoccos where summer emissions werethe highest (Fig. 5).
The effect of the plant cover on methane emission wasdiverse. Among all the sites, only in the location covered byV. oxycoccos, the plant cover lead to the decrease in methaneemission in each of the investigated seasons, with the highesteffectivity in summer (Table 3) (up to 81%). The influence ofC. nigra and E. vaginatum was season-dependent. In spring,both sedges had little influence on methane fluxes from soil tothe atmosphere (up to c.a. 9%). In summer, a positive impactof both C. nigra and E. vaginatum on methane emission wasfound. This effect, however, did not extend to the autumnmonths when both sedges were found to reduce methaneemission. The influence of Sphagnum species was most pro-nounced in spring, when the plant cover reduced emissionsignificantly, by more than 80%. However, in the subsequentseasons, the effect of moss on methane fluxes was reverse(Table 3). Statistical significance of the described effects wassummarized in Tables 5 and 6.
The results obtained in the presented experiment are quitedifferent from those presented by Kölbener et al. (2010), who
Table 2 Characteristics of peat soils from the investigated sites - surfacelayers (0–16 cm)
Plant Decompositiondegree (%)
OM (g kg−1)
TOC (%) DOC
Mean SD Mean SD Mean SD Mean SD
Carex sp.* 85.5 4.3 906.0 27.8 56.3 0.6 3.18 1.43
Eriophorumsp.*
85.5 4.3 906.0 27.8 56.3 0.6 3.18 1.43
Vaciniumsp.**
0.3 0.1 966.3 5.7 53.2 0.5 1.52 0.49
Sphagnumsp.*
0.5 0.1 971.0 1.0 53.2 0.4 1.28 0.28
OM: organic matter; TOC: total organic carbon; DOC: dissolved organiccarbon; mineral bedrock depth: * 350 cm, ** 700 cm
Table 3 Coefficients of the correlations between soil parameters and methane emission
Variable CH4 emission (gCH4m−2 h−1)
pH Eh(mV)
Eh7(mV)
EC (μS) Watertable(cm)
Decompositiondegree (%)
OM (g kg−1)
TOC(%)
pH −0.274* 1.000
Eh (mV) −0.332* −0.077 1.000
Eh7 (mV) −0.316* 0.696* 0.604* 1.000
EC (μS) 0.331* −0.124 −0.124 −0.053 1.000
Watertable (cm) 0.445* −0.050 −0.425* −0.390* 0.069 1.000
Decompositiondegree (%)
−0.687* −0.215 −0.257 −0.204 −0.815* 0.261 1.000
OM (g kg −1) 0.750* 0.447 −0.123 0.521 0.684* 0.196 −0.617* 1.000
TOC (%) −0.721* −0.316 −0.095 −0.401 −0.801* 0.033 0.644* −0.927* 1.000
DOC −0.819* −0.471 0.165 −0.429 −0.777* −0.098 0.673* −0.736* 0.731*
*- significant at p < 0,05
416 Wetlands (2018) 38:411–422
investigated peatlands in southern Sweden. Although theyalso found a link between methane emissions and vegetationcovering the study area, the relationship was reverse. It wasshown that the total daily CH4 emission from E. vaginatumwas 7.42 × 10⁻³ g m−2, while emission associated withS. magellanicum was only 2.204 × 10⁻³ g m−2. Furthermore,they recorded that the methane emissions from an area cov-ered with E. latifolium (broad-leaved cotton grass), Potentillapalustris (marsh cinquefoil), C. rostrata (beaked sedge),
Anthoxanthum odoratum (sweet vernal grass), C. elata (tuft-ed-sedge), and C. acutiformis (lesser pond sedge) were fivetimes higher when compared with the area without plants.These data confirm the active role of the plant cover in CH4
cycling in the wetland ecosystem. As presented above, de-pending on the season, the investigated species may both en-hance (by providing a transportation route) or diminish meth-ane emission. The latter is possible due to the presence of theactive methanotrophic community in the plant endosphere.
Table 4 Influence of vegetation on methane emission in 2011
Samples Methane emission
with vegetation [gCH4
m−2 h−1]after removal vegetation [gCH4
m−2 h−1]difference in emissions[gCH4 m
2 h−1]contribution ofplants to emission [%]*
Mean SD Mean SD
Spring Carex sp. 0.252 0.009 0.231 0.013 −0.021 −9.1 ↑
Eriophorum sp. 0.195 0.038 0.210 0.010 0.015 7.1 ↓
Vacinium sp. 0.169 0.004 0.225 0.027 0.056 24.9 ↓
Sphagnum sp. 0.074 0.004 0.528 0.176 0.454 86.1 ↓
Summer Carex sp. 1.084 0.114 0.845 0.050 −0.239 −28.3 ↑Eriophorum sp. 0.005 0.002 0.002 0.000 −0.002 −105.2 ↑
Vacinium sp. 0.097 0.015 0.512 0.111 0.415 81.0 ↓
Sphagnum sp. 1.469 0.445 0.954 0.282 −0.515 −54.0 ↑Autumn Carex sp. 0.146 0.009 0.588 0.020 0.442 75.2 ↓
Eriophorum sp. 0.063 0.004 0.072 0.010 0.010 13.5 ↓
Vacinium sp. 0.167 0.019 0.735 0.106 0.569 77.3 ↓
Sphagnum sp. 3.268 0.202 3.052 0.084 −0.215 −7.1 ↑
↑ - vegetation is responsible for the increase in methane emission, ↓ - vegetation is responsible for the decrease in methane emission
*< 0 – enhance emission, > 0 – reduce emission,
Eriophorum sp.
Sphagnum sp.
time [season]
SPRING SUMMER AUTUMN
vegetation absence
Carex sp.
CH
4 em
issio
n [g
CH
4m-2
h-1 ]
0
1
2
3
4
Vacinium sp.
time [season]
SPRING SUMMER AUTUMN
CH
4 em
issio
n [g
CH
4m-2
h-1 ]
0
1
2
3
4
vegetation present
Fig. 5 Averaged methaneemission with presence ofvegetation and after removal ofvegetation in different seasons(n = 3)
Wetlands (2018) 38:411–422 417
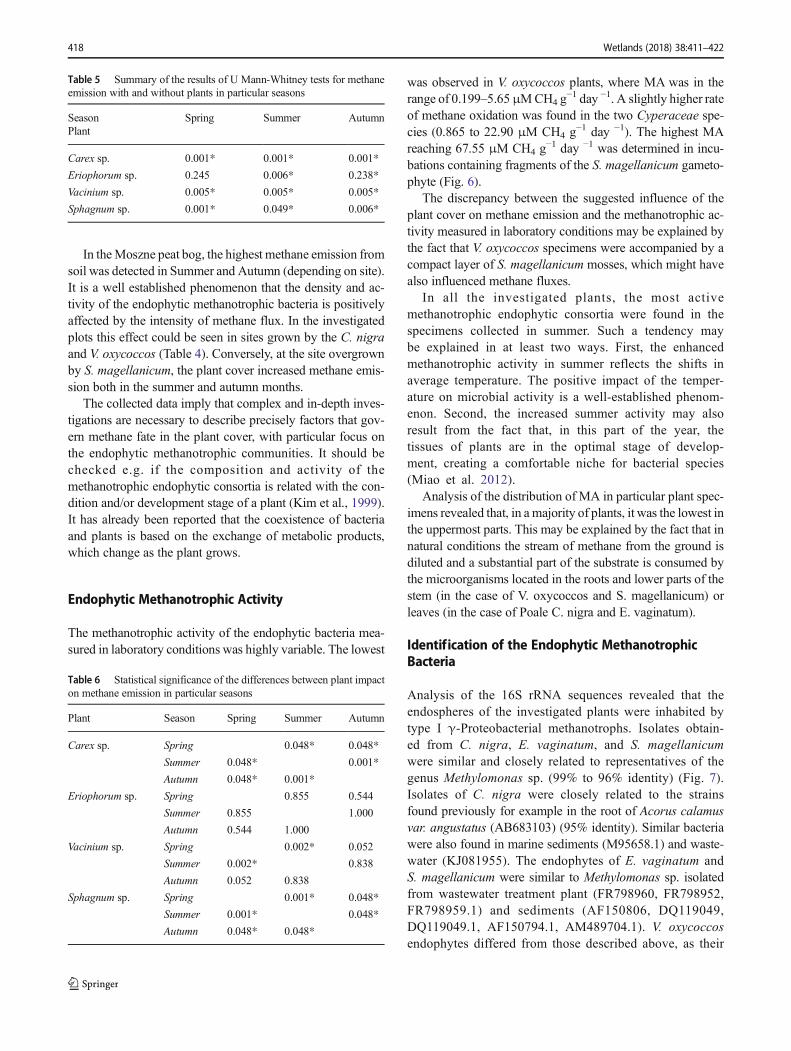
In theMoszne peat bog, the highest methane emission fromsoil was detected in Summer and Autumn (depending on site).It is a well established phenomenon that the density and ac-tivity of the endophytic methanotrophic bacteria is positivelyaffected by the intensity of methane flux. In the investigatedplots this effect could be seen in sites grown by the C. nigraand V. oxycoccos (Table 4). Conversely, at the site overgrownby S. magellanicum, the plant cover increased methane emis-sion both in the summer and autumn months.
The collected data imply that complex and in-depth inves-tigations are necessary to describe precisely factors that gov-ern methane fate in the plant cover, with particular focus onthe endophytic methanotrophic communities. It should bechecked e.g. if the composition and activity of themethanotrophic endophytic consortia is related with the con-dition and/or development stage of a plant (Kim et al., 1999).It has already been reported that the coexistence of bacteriaand plants is based on the exchange of metabolic products,which change as the plant grows.
Endophytic Methanotrophic Activity
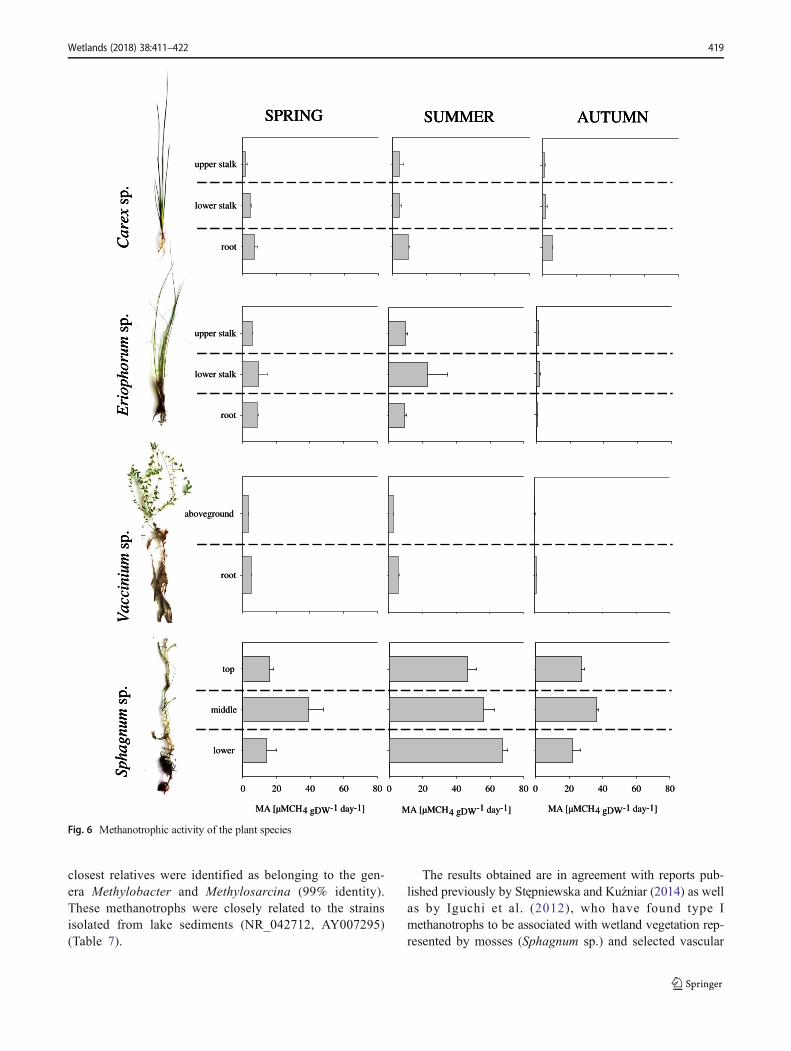
The methanotrophic activity of the endophytic bacteria mea-sured in laboratory conditions was highly variable. The lowest
was observed in V. oxycoccos plants, where MA was in therange of 0.199–5.65μMCH4 g
−1 day −1. A slightly higher rateof methane oxidation was found in the two Cyperaceae spe-cies (0.865 to 22.90 μM CH4 g
−1 day −1). The highest MAreaching 67.55 μM CH4 g
−1 day −1 was determined in incu-bations containing fragments of the S. magellanicum gameto-phyte (Fig. 6).
The discrepancy between the suggested influence of theplant cover on methane emission and the methanotrophic ac-tivity measured in laboratory conditions may be explained bythe fact that V. oxycoccos specimens were accompanied by acompact layer of S. magellanicum mosses, which might havealso influenced methane fluxes.
In all the investigated plants, the most activemethanotrophic endophytic consortia were found in thespecimens collected in summer. Such a tendency maybe explained in at least two ways. First, the enhancedmethanotrophic activity in summer reflects the shifts inaverage temperature. The positive impact of the temper-ature on microbial activity is a well-established phenom-enon. Second, the increased summer activity may alsoresult from the fact that, in this part of the year, thetissues of plants are in the optimal stage of develop-ment, creating a comfortable niche for bacterial species(Miao et al. 2012).
Analysis of the distribution of MA in particular plant spec-imens revealed that, in a majority of plants, it was the lowest inthe uppermost parts. This may be explained by the fact that innatural conditions the stream of methane from the ground isdiluted and a substantial part of the substrate is consumed bythe microorganisms located in the roots and lower parts of thestem (in the case of V. oxycoccos and S. magellanicum) orleaves (in the case of Poale C. nigra and E. vaginatum).
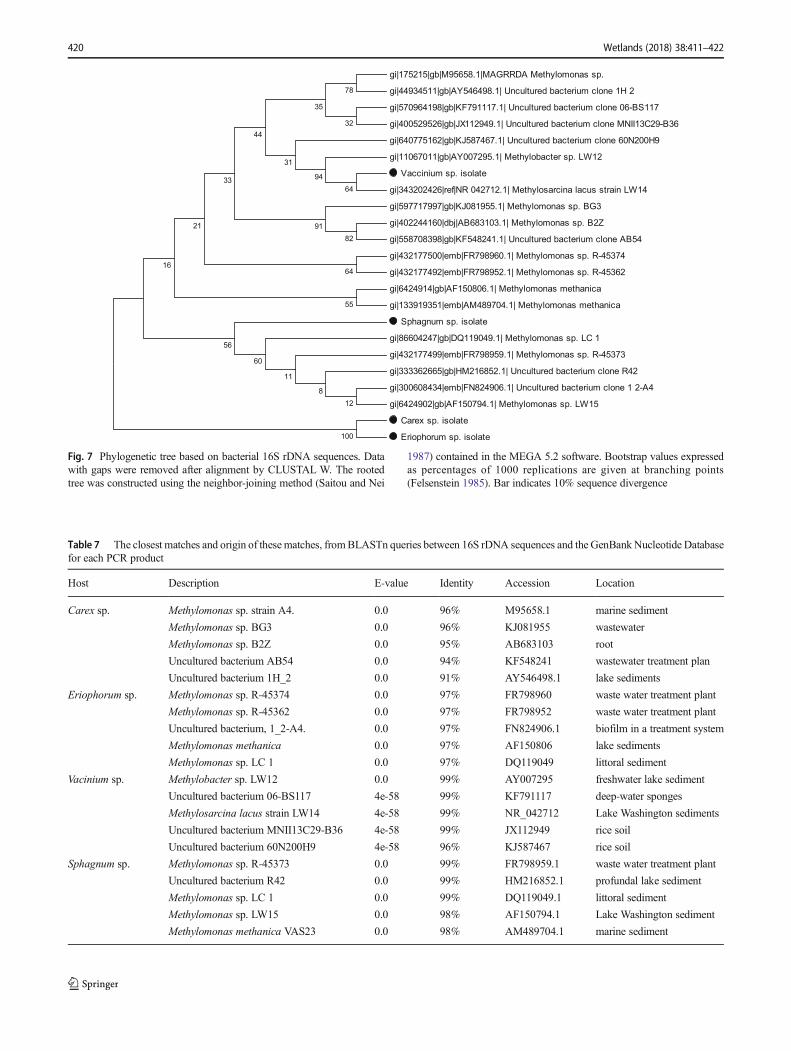
Identification of the Endophytic MethanotrophicBacteria
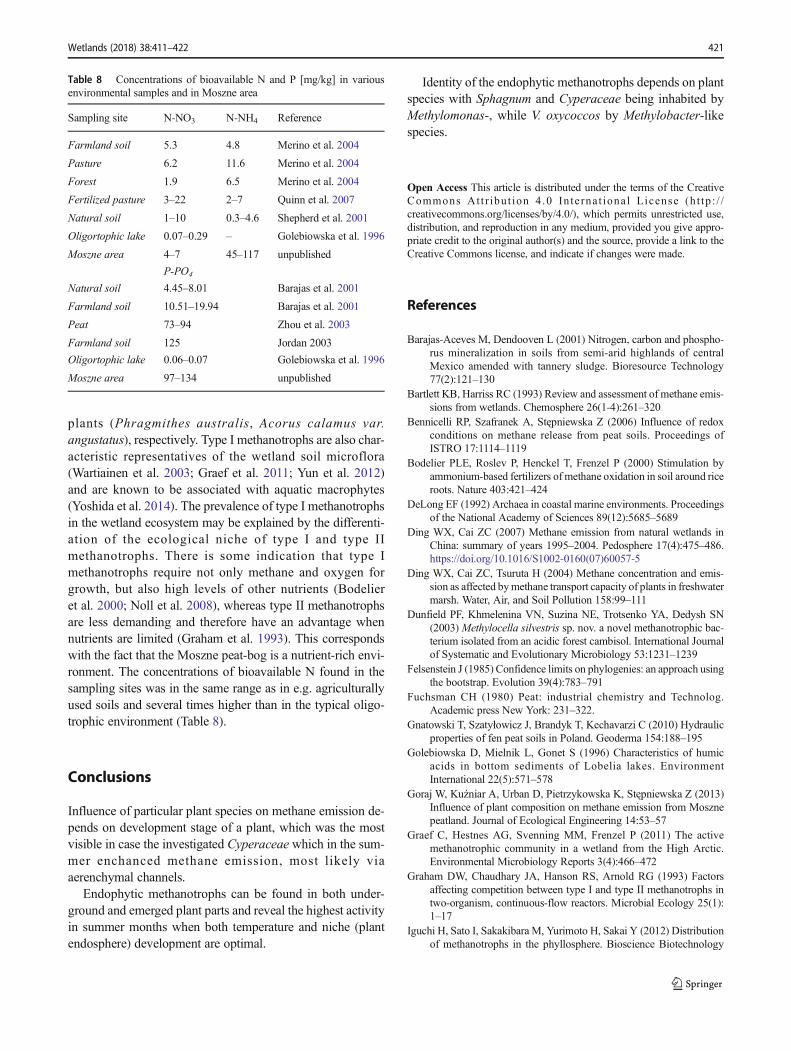
Analysis of the 16S rRNA sequences revealed that theendospheres of the investigated plants were inhabited bytype I γ-Proteobacterial methanotrophs. Isolates obtain-ed from C. nigra, E. vaginatum, and S. magellanicumwere similar and closely related to representatives of thegenus Methylomonas sp. (99% to 96% identity) (Fig. 7).Isolates of C. nigra were closely related to the strainsfound previously for example in the root of Acorus calamusvar. angustatus (AB683103) (95% identity). Similar bacteriawere also found in marine sediments (M95658.1) and waste-water (KJ081955). The endophytes of E. vaginatum andS. magellanicum were similar to Methylomonas sp. isolatedfrom wastewater treatment plant (FR798960, FR798952,FR798959.1) and sediments (AF150806, DQ119049,DQ119049.1, AF150794.1, AM489704.1). V. oxycoccosendophytes differed from those described above, as their
Table 6 Statistical significance of the differences between plant impacton methane emission in particular seasons
Plant Season Spring Summer Autumn
Carex sp. Spring 0.048* 0.048*
Summer 0.048* 0.001*
Autumn 0.048* 0.001*
Eriophorum sp. Spring 0.855 0.544
Summer 0.855 1.000
Autumn 0.544 1.000
Vacinium sp. Spring 0.002* 0.052
Summer 0.002* 0.838
Autumn 0.052 0.838
Sphagnum sp. Spring 0.001* 0.048*
Summer 0.001* 0.048*
Autumn 0.048* 0.048*
Table 5 Summary of the results of U Mann-Whitney tests for methaneemission with and without plants in particular seasons
Season Spring Summer AutumnPlant
Carex sp. 0.001* 0.001* 0.001*
Eriophorum sp. 0.245 0.006* 0.238*
Vacinium sp. 0.005* 0.005* 0.005*
Sphagnum sp. 0.001* 0.049* 0.006*
418 Wetlands (2018) 38:411–422
closest relatives were identified as belonging to the gen-era Methylobacter and Methylosarcina (99% identity).These methanotrophs were closely related to the strainsisolated from lake sediments (NR_042712, AY007295)(Table 7).
The results obtained are in agreement with reports pub-lished previously by Stępniewska and Kuźniar (2014) as wellas by Iguchi et al. (2012), who have found type Imethanotrophs to be associated with wetland vegetation rep-resented by mosses (Sphagnum sp.) and selected vascular
MA [µMCH4 gDW-1 day-1]
0 20 40 60 80
lower
middle
top
MA [µMCH4 gDW-1 day-1]
0 20 40 60 80
MA [µMCH4 gDW-1 day-1]
0 20 40 60 80
root
lower stalk
upper stalk
root
lower stalk
upper stalk
root
aboveground
SPRING SUMMER AUTUMNxera
C.ps
mungahpS.ps
murohpoirE
.psmuinicca
V.ps
MA [µMCH4 gDW-1 day-1]
0 20 40 60 80
lower
middle
top
MA [µMCH4 gDW-1 day-1]
0 20 40 60 80
MA [µMCH4 gDW-1 day-1]
0 20 40 60 80
root
lower stalk
upper stalk
root
lower stalk
upper stalk
root
aboveground
SPRING SUMMER AUTUMNxera
C.ps
mungahpS.ps
murohpoirE
.psmuinicca
V.ps
SPRING SUMMER AUTUMNxera
C.ps
mungahpS.ps
murohpoirE
.psmuinicca
V.ps
Fig. 6 Methanotrophic activity of the plant species
Wetlands (2018) 38:411–422 419
gi|175215|gb|M95658.1|MAGRRDA Methylomonas sp.
gi|44934511|gb|AY546498.1| Uncultured bacterium clone 1H 2
gi|570964198|gb|KF791117.1| Uncultured bacterium clone 06-BS117
gi|400529526|gb|JX112949.1| Uncultured bacterium clone MNII13C29-B36
gi|640775162|gb|KJ587467.1| Uncultured bacterium clone 60N200H9
gi|11067011|gb|AY007295.1| Methylobacter sp. LW12
Vaccinium sp. isolate
gi|343202426|ref|NR 042712.1| Methylosarcina lacus strain LW14
gi|597717997|gb|KJ081955.1| Methylomonas sp. BG3
gi|402244160|dbj|AB683103.1| Methylomonas sp. B2Z
gi|558708398|gb|KF548241.1| Uncultured bacterium clone AB54
gi|432177500|emb|FR798960.1| Methylomonas sp. R-45374
gi|432177492|emb|FR798952.1| Methylomonas sp. R-45362
gi|6424914|gb|AF150806.1| Methylomonas methanica
gi|133919351|emb|AM489704.1| Methylomonas methanica
Sphagnum sp. isolate
gi|86604247|gb|DQ119049.1| Methylomonas sp. LC 1
gi|432177499|emb|FR798959.1| Methylomonas sp. R-45373
gi|333362665|gb|HM216852.1| Uncultured bacterium clone R42
gi|300608434|emb|FN824906.1| Uncultured bacterium clone 1 2-A4
gi|6424902|gb|AF150794.1| Methylomonas sp. LW15
Carex sp. isolate
Eriophorum sp. isolate100
78
82
32
91
35
6494
31
44
33
64
21
55
16
56
128
11
60
Fig. 7 Phylogenetic tree based on bacterial 16S rDNA sequences. Datawith gaps were removed after alignment by CLUSTAL W. The rootedtree was constructed using the neighbor-joining method (Saitou and Nei
1987) contained in the MEGA 5.2 software. Bootstrap values expressedas percentages of 1000 replications are given at branching points(Felsenstein 1985). Bar indicates 10% sequence divergence
Table 7 The closest matches and origin of thesematches, fromBLASTn queries between 16S rDNA sequences and the GenBankNucleotide Databasefor each PCR product
Host Description E-value Identity Accession Location
Carex sp. Methylomonas sp. strain A4. 0.0 96% M95658.1 marine sediment
Methylomonas sp. BG3 0.0 96% KJ081955 wastewater
Methylomonas sp. B2Z 0.0 95% AB683103 root
Uncultured bacterium AB54 0.0 94% KF548241 wastewater treatment plan
Uncultured bacterium 1H_2 0.0 91% AY546498.1 lake sediments
Eriophorum sp. Methylomonas sp. R-45374 0.0 97% FR798960 waste water treatment plant
Methylomonas sp. R-45362 0.0 97% FR798952 waste water treatment plant
Uncultured bacterium, 1_2-A4. 0.0 97% FN824906.1 biofilm in a treatment system
Methylomonas methanica 0.0 97% AF150806 lake sediments
Methylomonas sp. LC 1 0.0 97% DQ119049 littoral sediment
Vacinium sp. Methylobacter sp. LW12 0.0 99% AY007295 freshwater lake sediment
Uncultured bacterium 06-BS117 4e-58 99% KF791117 deep-water sponges
Methylosarcina lacus strain LW14 4e-58 99% NR_042712 Lake Washington sediments
Uncultured bacterium MNII13C29-B36 4e-58 99% JX112949 rice soil
Uncultured bacterium 60N200H9 4e-58 96% KJ587467 rice soil
Sphagnum sp. Methylomonas sp. R-45373 0.0 99% FR798959.1 waste water treatment plant
Uncultured bacterium R42 0.0 99% HM216852.1 profundal lake sediment
Methylomonas sp. LC 1 0.0 99% DQ119049.1 littoral sediment
Methylomonas sp. LW15 0.0 98% AF150794.1 Lake Washington sediment
Methylomonas methanica VAS23 0.0 98% AM489704.1 marine sediment
420 Wetlands (2018) 38:411–422
plants (Phragmithes australis, Acorus calamus var.angustatus), respectively. Type I methanotrophs are also char-acteristic representatives of the wetland soil microflora(Wartiainen et al. 2003; Graef et al. 2011; Yun et al. 2012)and are known to be associated with aquatic macrophytes(Yoshida et al. 2014). The prevalence of type I methanotrophsin the wetland ecosystem may be explained by the differenti-ation of the ecological niche of type I and type IImethanotrophs. There is some indication that type Imethanotrophs require not only methane and oxygen forgrowth, but also high levels of other nutrients (Bodelieret al. 2000; Noll et al. 2008), whereas type II methanotrophsare less demanding and therefore have an advantage whennutrients are limited (Graham et al. 1993). This correspondswith the fact that the Moszne peat-bog is a nutrient-rich envi-ronment. The concentrations of bioavailable N found in thesampling sites was in the same range as in e.g. agriculturallyused soils and several times higher than in the typical oligo-trophic environment (Table 8).
Conclusions
Influence of particular plant species on methane emission de-pends on development stage of a plant, which was the mostvisible in case the investigated Cyperaceae which in the sum-mer enchanced methane emission, most likely viaaerenchymal channels.
Endophytic methanotrophs can be found in both under-ground and emerged plant parts and reveal the highest activityin summer months when both temperature and niche (plantendosphere) development are optimal.
Identity of the endophytic methanotrophs depends on plantspecies with Sphagnum and Cyperaceae being inhabited byMethylomonas-, while V. oxycoccos by Methylobacter-likespecies.
Open Access This article is distributed under the terms of the CreativeCommons At t r ibut ion 4 .0 In te rna t ional License (h t tp : / /creativecommons.org/licenses/by/4.0/), which permits unrestricted use,distribution, and reproduction in any medium, provided you give appro-priate credit to the original author(s) and the source, provide a link to theCreative Commons license, and indicate if changes were made.
References
Barajas-Aceves M, Dendooven L (2001) Nitrogen, carbon and phospho-rus mineralization in soils from semi-arid highlands of centralMexico amended with tannery sludge. Bioresource Technology77(2):121–130
Bartlett KB, Harriss RC (1993) Review and assessment of methane emis-sions from wetlands. Chemosphere 26(1-4):261–320
Bennicelli RP, Szafranek A, Stępniewska Z (2006) Influence of redoxconditions on methane release from peat soils. Proceedings ofISTRO 17:1114–1119
Bodelier PLE, Roslev P, Henckel T, Frenzel P (2000) Stimulation byammonium-based fertilizers of methane oxidation in soil around riceroots. Nature 403:421–424
DeLong EF (1992) Archaea in coastal marine environments. Proceedingsof the National Academy of Sciences 89(12):5685–5689
Ding WX, Cai ZC (2007) Methane emission from natural wetlands inChina: summary of years 1995–2004. Pedosphere 17(4):475–486.https://doi.org/10.1016/S1002-0160(07)60057-5
Ding WX, Cai ZC, Tsuruta H (2004) Methane concentration and emis-sion as affected bymethane transport capacity of plants in freshwatermarsh. Water, Air, and Soil Pollution 158:99–111
Dunfield PF, Khmelenina VN, Suzina NE, Trotsenko YA, Dedysh SN(2003) Methylocella silvestris sp. nov. a novel methanotrophic bac-terium isolated from an acidic forest cambisol. International Journalof Systematic and Evolutionary Microbiology 53:1231–1239
Felsenstein J (1985) Confidence limits on phylogenies: an approach usingthe bootstrap. Evolution 39(4):783–791
Fuchsman CH (1980) Peat: industrial chemistry and Technolog.Academic press New York: 231–322.
Gnatowski T, Szatyłowicz J, Brandyk T, Kechavarzi C (2010) Hydraulicproperties of fen peat soils in Poland. Geoderma 154:188–195
Golebiowska D, Mielnik L, Gonet S (1996) Characteristics of humicacids in bottom sediments of Lobelia lakes. EnvironmentInternational 22(5):571–578
Goraj W, Kuźniar A, Urban D, Pietrzykowska K, Stępniewska Z (2013)Influence of plant composition on methane emission from Mosznepeatland. Journal of Ecological Engineering 14:53–57
Graef C, Hestnes AG, Svenning MM, Frenzel P (2011) The activemethanotrophic community in a wetland from the High Arctic.Environmental Microbiology Reports 3(4):466–472
Graham DW, Chaudhary JA, Hanson RS, Arnold RG (1993) Factorsaffecting competition between type I and type II methanotrophs intwo-organism, continuous-flow reactors. Microbial Ecology 25(1):1–17
Iguchi H, Sato I, Sakakibara M, Yurimoto H, Sakai Y (2012) Distributionof methanotrophs in the phyllosphere. Bioscience Biotechnology
Table 8 Concentrations of bioavailable N and P [mg/kg] in variousenvironmental samples and in Moszne area
Sampling site N-NO3 N-NH4 Reference
Farmland soil 5.3 4.8 Merino et al. 2004
Pasture 6.2 11.6 Merino et al. 2004
Forest 1.9 6.5 Merino et al. 2004
Fertilized pasture 3–22 2–7 Quinn et al. 2007
Natural soil 1–10 0.3–4.6 Shepherd et al. 2001
Oligortophic lake 0.07–0.29 – Golebiowska et al. 1996
Moszne area 4–7 45–117 unpublished
P-PO4
Natural soil 4.45–8.01 Barajas et al. 2001
Farmland soil 10.51–19.94 Barajas et al. 2001
Peat 73–94 Zhou et al. 2003
Farmland soil 125 Jordan 2003
Oligortophic lake 0.06–0.07 Golebiowska et al. 1996
Moszne area 97–134 unpublished
Wetlands (2018) 38:411–422 421
and Biochemistry 76(8):1580–1583. https://doi.org/10.1271/bbb.120281
IPCC Climate Change (2007) The physical science basis. In: Solomon S,Qin D, Manning M (eds) Contribution of working group I to thefourth assessment report of the intergovernmental panel on climatechange. Cambridge University Press, Cambridge and New York
IPCCClimate Change (2013) The Physical Science Basis. In: Stocker TF,Qin D, Plattner G-K, Tignor M, Allen SK, Boschung J, Nauels A,Xia Y, Bex V, Midgley PM (eds) Contribution of Working Group Ito the Fifth Assessment Report of the Intergovernmental Panel onClimate Change. Cambridge University Press, Cambridge, UnitedKingdom and New York
Kaszewski BM (2002) Climatic conditions of Poleski National Park In: SRadwan red. Poleski National Park – monography. Morpol, Lublin
Kechavarzi C, Dawson Q, BartlettM, Leeds-Harrison PB (2010) The roleof soil moisture, temperature and nutrient amendment on CO2 effluxfrom agricultural peat soil microcosms. Geoderma 154:203–210
Kim JN, Verma SB, Billesbach DP (1999) Seasonal variation in methaneemission from a temperate Phragmites-dominated marsh: effect ofgrowth stage and plant-mediated transport. Global Change Biology5(4):433–440
Kip N, Fritz C, Langelaan ES, Pan Y, Bodrossy L, Pancotto V, JettenMSM, Smolders AJP, Op den Camp HJM (2012) Methanotrophicactivity and diversity in different Sphagnum Magellanicum domi-nated habitats in the southernmost peat bogs of Patagonia.Biogeosciences 9:47–55
Kölbener A, StrömL, Edwards PJ, Olde Venterink H (2010) Plant speciesfrommesotrophic wetlands cause relatively high methane emissionsfrom peat soil. Plant and Soil 326:147–158
Laanbroek HJ (2010) Methane emission from natural wetlands: interplaybetween emergent macrophytes and soil microbial processes. Amini-review. Annals of Botany 105(1):141–153. https://doi.org/10.1093/aob/mcp201
Le Mer J, Roger P (2001) Production, oxidation, emission and consump-tion of methane by soils a review. European Journal of Soil Biology37:25–50
Liebner S, Zeyer J, Wagner D, Schubert C, Pfeiffer EM, Knoblauch C(2011)Methane oxidation associated with submerged brownmossesreduces methane emissions from Siberian polygonal tundra. Journalof Ecology 99(4):914–922. https://doi.org/10.1111/j.1365-2745.2011.01823.x
Malawska M, Ekonomiuk A, Wiłkomirski B (2006) Chemical character-istics of some peatlands in southern Poland.Mires and Peat 1:Article02 http://www.mires-and-peat.net/
Merino A, Pérez-Batallón, P, Macı́as F (2004) Responses of soil organicmatter and greenhouse gas fluxes to soil management and land usechanges in a humid temperate region of southern Europe. SoilBiology and Biochemistry 36 (6):917-925
Miao Y, Song C, Sun L, Wang X, Meng H, Mao R (2012) Growingseason methane emission from a boreal peatland in the continuouspermafrost zone of Northeast China: effects of active layer depth andvegetation. Biogeosciences 9:4455–4464. https://doi.org/10.5194/bg-9-4455-2012
Noll M, Frenzel P, Conrad R (2008) Selective stimulation of type Imethanotrophs in a rice paddy soil by urea fertilization revealed byRNA-based stable isotope probing. FEMS Microbiology Ecology65(1):125–132
Noyce GL, Varner RK, Bubier JL, Frolking S (2014) Effect of Carexrostrata on seasonal and interannual variability in peatland methaneemissions. Journal of Geophysical Research – Biogeosciences119(1):24–34
Playsted CW, Johnston ME, Ramage CM, Edwards DG, Cawthray GR,Lambers H (2006) Functional significance of dauciform roots:
exudation of carboxylates and acid phosphatase under phosphorusdeficiency in Caustis blakei (Cyperaceae). New Phytologist 170(3):491–500. https://doi.org/10.1111/j.1469-8137.2006.01697.x
Putkinen A, Larmola T, Tuomivirta T, Siljanen HM, Bodrossy L, TuittilaES, Fritze H (2014) Peatland succession induces a shift in the com-munity composition of Sphagnum-associated active methanotrophs.FEMS Microbiology Ecology 88(3):596-611
Quinn JP, Kulakova AN, Cooley NA, McGrath JW (2007) New ways tobreak an old bond: the bacterial carbon? phosphorus hydrolases andtheir role in biogeochemical phosphorus cycling. EnvironmentalMicrobiology 9(10):2392–2400
Raghoebarsing AA, Alfons JP, Smolders AJP, Schmid MC, RijpstraWIC, Wolters-Arts M, Derksen J, Jetten MSM, Schouten S,Damste JSS, Lamers LPM, Roelofs JGM, Op den Camp HJM,StrousM (2005)Methanotrophic symbionts provide carbon for pho-tosynthesis in peat bogs. Nature 436:1153–1156
Saitou N, Nei M (1987) The Neighbor-Joining Method A New Methodfor Reconstructing Phylogenetic Trees. Molecular Biology andEvolution 4:406–425
Sambrook J, Fritsch EF, Maniatis T (1989) Molecular cloning: a labora-tory manual. Cold Spring Harbor Laboratory, Cold Spring Harbor
Shepherd TG, Saggar S, Newman RH, Ross CW, Dando JL (2001)Tillage-induced changes to soil structure and organic carbon frac-tions in New Zealand soils. Soil Research 39(3):465–489
Stępniewska Z, Kuźniar A (2014) Cultivation and detection of endophyt-ic aerobic methanotrophs isolated from sphagnum species as a per-spective for environmental biotechnology. AMB Express 4(58).https://doi.org/10.1186/s13568-014-0058-3
Stępniewska Z, Kuźniar A, Pytlak A, Szymczycha J (2013) Detection ofmethanotrophic endosymbionts in sphagnum sp. originating fromMoszne peat bog (East Poland). African journal. MicrobiologyResearch 7:1319–1325
Szafranek-Nakonieczna A, Bennicelli RP (2010) Ability of peat soil tooxidize methane and affect temperature and layer deposition. PolishJournal of Environmental Studies 19(4):805–810
Thomas KL, Benstead J, Davies KL, Lloyd D (1996) Role of wetlandplants in the diurnal control of CH4 and CO2 fluxes in peat. SoilBiology and Biochemistry 28(1):17–23. https://doi.org/10.1016/0038-0717(95)00103-4
Wartiainen I, Hestnes AG, Svenning MM (2003) Methanotrophic diver-sity in high arctic wetlands on the islands of Svalbard (Norway) -denaturing gradient gel electrophoresis analysis of soil DNA andenrichment cultures. Canadian Journal of Microbiology 49(10):602–612
Whiting GJ, Chanton JP (1992) Plant-dependent CH4 emission in a sub-arctic Canadian fen. Global Biogeochemical Cycles 6:225–231
Whittenbury R, Phillips KC, Wilkinson JF (1970) Enrichment, isolationand some properties of methane-utilizing bacteria. Journal ofGeneral Microbiology 61(2):205–218
Yoshida N, Iguchi H, Yurimoto H, Murakami A, Sakai Y (2014) Aquaticplant surface as a niche for methanotrophs. Frontiers inMicrobiology 5
Yun J, Zhuang G, Ma A, Guo H, Wang Y, Zhang H (2012) CommunityStructure, Abundance, and Activity of Methanotrophs in the ZoigeWetland of the Tibetan Plateau. Microbial Ecology 63(4):835–843
Zaccone C, Cocozza C, Cheburkin AK, Shotyk W, Miano TM (2007)Enrichment and depletion of major and trace elements, and radionu-clides in ombrotrophic raw peat and corresponding humic acids.Geoderma 141:235–246
ZhouW, Beck BF, Green TS (2003) Evaluation of a peat filtration systemfor treating highway runoff in a karst setting. EnvironmentalGeology 44(2):187–202
422 Wetlands (2018) 38:411–422