Embed Size (px)
Citation preview
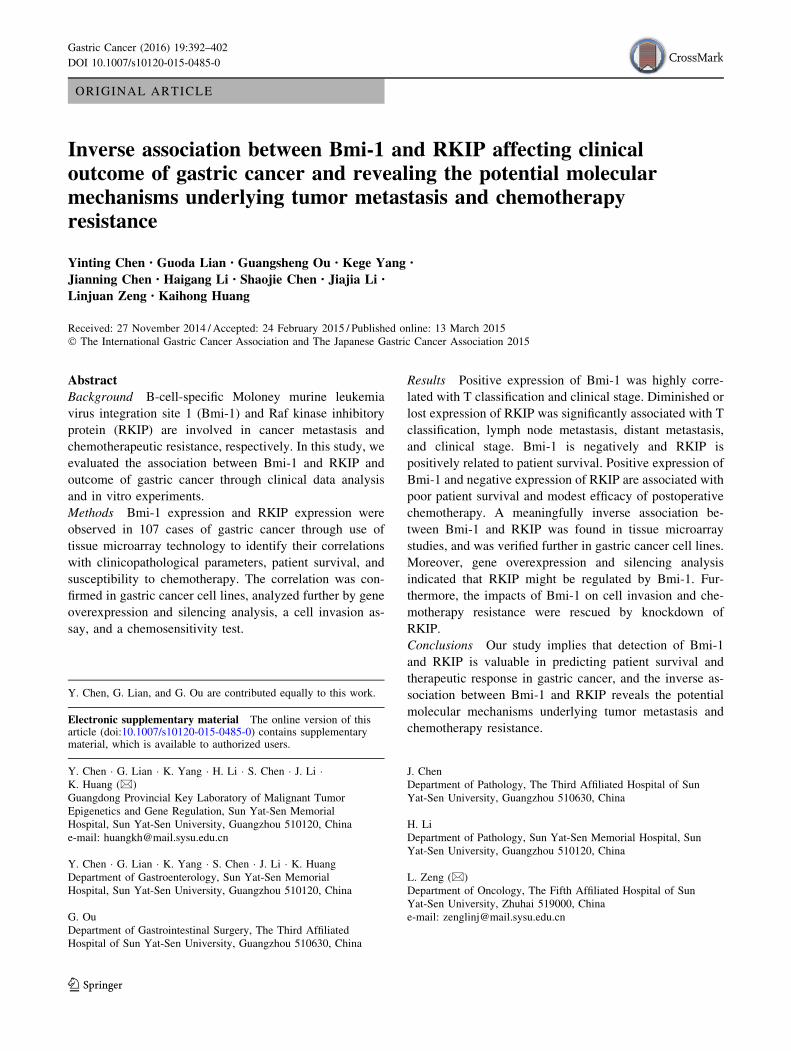
ORIGINAL ARTICLE
Inverse association between Bmi-1 and RKIP affecting clinicaloutcome of gastric cancer and revealing the potential molecularmechanisms underlying tumor metastasis and chemotherapyresistance
Yinting Chen • Guoda Lian • Guangsheng Ou • Kege Yang •
Jianning Chen • Haigang Li • Shaojie Chen • Jiajia Li •
Linjuan Zeng • Kaihong Huang
Received: 27 November 2014 / Accepted: 24 February 2015 / Published online: 13 March 2015
� The International Gastric Cancer Association and The Japanese Gastric Cancer Association 2015
Abstract
Background B-cell-specific Moloney murine leukemia
virus integration site 1 (Bmi-1) and Raf kinase inhibitory
protein (RKIP) are involved in cancer metastasis and
chemotherapeutic resistance, respectively. In this study, we
evaluated the association between Bmi-1 and RKIP and
outcome of gastric cancer through clinical data analysis
and in vitro experiments.
Methods Bmi-1 expression and RKIP expression were
observed in 107 cases of gastric cancer through use of
tissue microarray technology to identify their correlations
with clinicopathological parameters, patient survival, and
susceptibility to chemotherapy. The correlation was con-
firmed in gastric cancer cell lines, analyzed further by gene
overexpression and silencing analysis, a cell invasion as-
say, and a chemosensitivity test.
Results Positive expression of Bmi-1 was highly corre-
lated with T classification and clinical stage. Diminished or
lost expression of RKIP was significantly associated with T
classification, lymph node metastasis, distant metastasis,
and clinical stage. Bmi-1 is negatively and RKIP is
positively related to patient survival. Positive expression of
Bmi-1 and negative expression of RKIP are associated with
poor patient survival and modest efficacy of postoperative
chemotherapy. A meaningfully inverse association be-
tween Bmi-1 and RKIP was found in tissue microarray
studies, and was verified further in gastric cancer cell lines.
Moreover, gene overexpression and silencing analysis
indicated that RKIP might be regulated by Bmi-1. Fur-
thermore, the impacts of Bmi-1 on cell invasion and che-
motherapy resistance were rescued by knockdown of
RKIP.
Conclusions Our study implies that detection of Bmi-1
and RKIP is valuable in predicting patient survival and
therapeutic response in gastric cancer, and the inverse as-
sociation between Bmi-1 and RKIP reveals the potential
molecular mechanisms underlying tumor metastasis and
chemotherapy resistance.
Y. Chen, G. Lian, and G. Ou are contributed equally to this work.
Electronic supplementary material The online version of thisarticle (doi:10.1007/s10120-015-0485-0) contains supplementarymaterial, which is available to authorized users.
Y. Chen � G. Lian � K. Yang � H. Li � S. Chen � J. Li �K. Huang (&)
Guangdong Provincial Key Laboratory of Malignant Tumor
Epigenetics and Gene Regulation, Sun Yat-Sen Memorial
Hospital, Sun Yat-Sen University, Guangzhou 510120, China
e-mail: [email protected]
Y. Chen � G. Lian � K. Yang � S. Chen � J. Li � K. HuangDepartment of Gastroenterology, Sun Yat-Sen Memorial
Hospital, Sun Yat-Sen University, Guangzhou 510120, China
G. Ou
Department of Gastrointestinal Surgery, The Third Affiliated
Hospital of Sun Yat-Sen University, Guangzhou 510630, China
J. Chen
Department of Pathology, The Third Affiliated Hospital of Sun
Yat-Sen University, Guangzhou 510630, China
H. Li
Department of Pathology, Sun Yat-Sen Memorial Hospital, Sun
Yat-Sen University, Guangzhou 510120, China
L. Zeng (&)
Department of Oncology, The Fifth Affiliated Hospital of Sun
Yat-Sen University, Zhuhai 519000, China
e-mail: [email protected]
123
Gastric Cancer (2016) 19:392–402
DOI 10.1007/s10120-015-0485-0
Keywords B-cell-specific Moloney murine leukemia
virus integration site 1 � Raf kinase inhibitory protein �Gastric cancer � Tissue microarray � Clinical outcome
Introduction
Gastric cancer (GC) is one of the most frequently diagnosed
and aggressive carcinomas of the gastrointestinal tract [1].
It is estimated that the number of new cases of GC will
reach 930,000 a year worldwide, of which China accounts
for 42 % [2]. Although GC is usually managed by surgery
or chemotherapy, the prognosis is still poor, mainly because
of tumor metastasis and chemotherapy resistance, and the
overall 5-year survival rate is less than 15 % [3]. Numerous
studies have reported that the causes of GC include genetic
factors, such as p53, E-cadherin, c-Met, and trefoil factor 1
[4, 5]. However, the molecular mechanisms underlying tu-
mor metastasis and chemotherapy resistance, and affecting
clinical outcome in GC remain unknown.
The polycomb group (PcG) genes, which are pivotal in
gene expression through chromatin modifications, constitute
a global system with important roles in multicellular devel-
opment, stem cell biology, and cancer [6]. B-cell-specific
Moloney murine leukemia virus integration site 1 (Bmi-1), a
transcriptional repressor member of the PcG family, plays a
pivotal role in tumor progression and metastasis. Its effects
on tumorigenesis involve repression of the Ink4a-Arf locus,which is an essential cell cycle regulator and encodes p16 and
p19arf [7]. Aberrant Bmi-1 expression has been reported in a
variety of human cancers [8–13]. In our previous study, Bmi-
1 expression was correlated with tumor size, clinical stage,
and prognosis for patients with gastric carcinoma [14]. Pa-
tients with Bmi-1 expression had a shorter overall survival
time than those without Bmi-1 expression. This indicated that
Bmi-1 expression was related to an invasive phenotype in
patients with gastric carcinoma.
On the other hand, Raf kinase inhibitory protein (RKIP),
a member of the phosphatidylethanolamine-binding protein
family, has proved to be a significant molecule in sup-
pressing cancer metastasis [15]. It is an evolutionarily
conserved small protein, and was originally identified as a
physiological inhibitor of the Raf–mitogen-activated pro-
tein kinase kinase (MEK)–extracellular-signal-regulated
kinase (ERK) pathway [16]. RKIP regulates the activity of
and mediates the cross talk between several important
cellular signaling pathways, including the Raf–mitogen-
activated protein kinase–ERK pathway [17], the nuclear
factor jB (NF-jB) pathway [18], and the G protein path-
way [19]. A variety of evidence suggests that reduced
RKIP function may influence metastasis, angiogenesis,
resistance to apoptosis, and genome integrity. Recent
studies have shown that the expression levels of RKIP are
frequently downregulated in various cancer types, and
correlate with an invasive or metastatic phenotype [20–23].
Moreover, recent data implicated RKIP depletion in
chemotherapeutic resistance both in vitro and in vivo [24].
Until now, the exact tumor markers that are associated
with metastasis, chemotherapy resistance, and prognosis of
GC have not been discovered. Our previous study indicated
that Bmi-1 expression was related to an invasive phenotype
in patients with gastric carcinoma. Further, we stably
transfected the human gastric epithelial immortalized cell
line GES-1 with Bmi-1, and demonstrated that overex-
pression of Bmi-1 enhanced the migration and invasion
abilities in vitro. Besides, overexpression of Bmi-1
upregulated an epithelial–mesenchymal transition (EMT)
marker [25]. Yet, the precise molecular mechanism of Bmi-
1 in the motility and invasiveness of GC remains to be
further elucidated. RKIP is well known for its important role
in EMT and in metastasis suppression in various cancer
types. As already stated, RKIP regulates the activity of and
mediates the cross talk between several important cellular
signaling pathways, including the NF-jB pathway. We re-
viewed the literature, and found that Bmi-1 promotes the
aggressiveness of glioma via activation of the NF-jBpathway [26]. Moreover, Bmi-1 can directly promote
metastasis in head and neck squamous cancer and
nasopharyngeal carcinoma by regulating Snail [27].
Further, recent elegant experiments have revealed the NF-
jB–Snail–RKIP circuitry as a possible mechanism for
chemotherapeutic resistance in cancer cells [24]. Although
no studies have been done on the regulatory relationships
between Bmi-1 and RKIP, on the basis of the adverse effects
of these two markers on cancer metastasis, and accounting
for the potential correlation between Bmi-1 and RKIP by
way of NF-jB and/or Snail, we hypothesized that there may
be a regulation mechanism between Bmi-1 and RKIP in GC,
and conducted this study. In this study, 107 cases of GC
were analyzed for Bmi-1 and RKIP expression through
immunohistochemistry by use of tissue microarray tech-
nology to identify their correlation with clinicopathological
parameters, patient survival, susceptibility to chemotherapy,
and outcome in GC. Then, the inverse relationship between
Bmi-1 and RKIP was validated in GC cell lines, further
analyzed by gene overexpression and silencing methods, a
cell invasion assay, and a chemosensitivity test.
Materials and methods
Patients
Data from patients with GC who underwent a primary re-
section at Sun Yat-Sen Memorial Hospital of Sun Yat-Sen
University (Guangzhou, China) between November 2007
Bmi-1 and RKIP in gastric cancer 393
123
and January 2011 were collected. Proximal (cardia) cancers
were excluded so as to reduce confounding variables. None
of the patients had received chemotherapy or radiotherapy
prior to surgery. All the cases were histologically diagnosed
and classified using the Lauren system as intestinal-type or
diffuse-type gastric adenocarcinoma. Tumors exhibiting a
mixed intestinal and diffuse pattern were classified as dif-
fuse [28, 29]. Stages were classified according to the 2010
GC staging system of the American Joint Committee on
Cancer. This study was approved by the Research Ethics
Committee of Sun Yat-Sen Memorial Hospital.
Tissue microarray and immunohistochemistry
Paraffin blocks containing areas consisting of unalloyed
gastric carcinoma were reviewed for confirmation of di-
agnosis in corresponding hematoxylin–eosin-stained sec-
tions. Two different and representative areas of the tumor
were determined and marked on the source block. The
source block was cored and punched with 1-mm diameter,
and re-embedded in a recipient paraffin block in a defined
position, using a tissue arraying instrument (Beecher In-
struments, Alphelys, Plaisir, France). The tissue microarray
blocks were cut into 5-lm sections for immunohisto-
chemical staining. Immunoblot analysis was performed as
previously described [14] using anti-Bmi-1 antibody (1:50
dilution; Abcam) and anti-RKIP antibody (1:50 dilution;
Abcam). A negative control was achieved by replacing the
primary antibody with a normal IgG.
Evaluation of immunostaining
The degree of immunostaining was evaluated and scored by
two independent pathologists, Jianning Chen and Haigang
Li, who were blinded to both clinical and pathology data.
Staining intensity was scored as four grades: 0 for a com-
plete absence of staining, 1 for weak staining, 2 for mod-
erate staining, and 3 for strong staining. The extent of Bmi-1
staining was scored as follows: 0 for completely negative
staining, 1 for tumors with less than 10 % of cells staining
positive, and 2 for tumors with at least 10 % of cells
staining positive [14]. The extent of RKIP staining was
scored as four grades: 0 for completely negative staining, 1
for tumors with less than 10 % of cells staining positive, 2
for tumors with 10–50 % of cells staining positive, and 3 for
tumors with more than 50 % of cells staining positive. The
final scores were derived from multiplication of the extent
of staining by the intensity. For the statistical analysis,
scores were further grouped into two categories as follows:
negative (final scores below 4) and positive (final scores of
4 or more) [28]. The correlations of the Bmi-1 and RKIP
scores between the two pathologists were good. For Bmi-1,
discordant results were obtained in eight cases: the
Spearman correlation coefficient was 0.836 (p\ 0.01), and
the kappa coefficient for a score below 4 versus a score of 4
or more was 0.833 (p\ 0.01). For RKIP, discordant results
were obtained in six cases: the Spearman correlation coef-
ficient was 0.874 (p\ 0.01), and the Kappa coefficient for a
score below 4 versus a score of 4 or more was 0.871
(p\ 0.01). In these cases, the slides were reevaluated to-
gether, and a consensus was reached.
Cell lines
Six GC cell lines—BGC-823, HGC-27, AGS, MGC80-3,
NCI-N87, and SGC7901—were obtained from the Institute
of Biochemistry and Cell Biology, Chinese Academy of
Sciences (Shanghai, China). The human gastric epithelial
immortalized cell line GES-1 was purchased from Beijing
Institute for Cancer Research Collection. All cell lines
were maintained according to the respective protocols.
Plasmids, virus production, and infection of target cells
We produced pLNCX2-Bmi-1 constructs and performed
retroviral transfection as previously described [25]. Stable
cell lines nominated as SGC7901-Bmi-1, GES-1-Bmi-1#1,
and GES-1-Bmi-1#2, respectively, were generated. Human
RKIP was amplified by PCR from complementary DNA
from fresh human GC and was cloned into the pcDNA
3.1? vector. Stable cell lines expressing RKIP were gener-
ated by G418 selection (500 lg/ml) for 14 days. Small in-
terfering RNA (siRNA) oligos targeting Bmi-1 (siBmi-1#1,
50-UGUCUACAUUCCUUCUGUATT-30; siBmi-1#2, 50-GCCACAACCAUAAUAGAAUTT-30), RKIP (siRKIP#1,
50-CACCCAGGUUAAGAAUAGATT-30; siRKIP#2, 50-CCAGUUCAGUGUUGCAUGUTT-30), and negative con-
trol siRNAs were purchased from GenePharma (Shanghai).
The siRNA transfectionswere donewith 50 nMsiRNAusing
Lipofectamine 2000 (Invitrogen Life Technologies) fol-
lowing the manufacturer’s instructions.
Western blotting analysis
Western blotting analysis was performed as previously
described [14] using anti-Bmi-1 antibody (1:1,000 dilution;
Cell Signaling Technology) and anti-RKIP antibody
(1:2,000 dilution; Abcam).
In vitro cell invasion assay
Equal numbers of cells (5 9 104 cells per well) were plated
on the top side of a polycarbonate Transwell filter (with
Matrigel) in the upper chamber of BioCoat invasion
chambers (BD), and were incubated for 40 h, followed by
removal of cells from the upper chamber with cotton
394 Y. Chen et al.
123

swabs. Cells on the lower membrane surface were fixed in
4 % paraformaldehyde, stained with 0.1 % crystal violet,
and counted under a microscope (five random fields per
well, 9100 magnification). Cell counts were expressed as
the mean number of cells per field. Each experiment was
done independently three times.
Chemosensitivity test
Oxaliplatin (Sigma, USA) and 5-fluorouracil (5-FU; Sig-
ma, USA) were dissolved in saline. Cells were seeded at a
density of 1 9 104 cells per well in 96-well plates 24 h
prior to exposure to 5-FU (62.5, 125, 250, 500, or
1,000 lM) or oxaliplatin (15.6, 31.2, 62.5, 125, or
250 lM). For siRNA-mediated-knockdown cells, cells
transfected with appropriate siRNAs for 24 h were subse-
quently exposed to 5-FU or oxaliplatin. Phosphate-buffered
saline (pH7.4) was used as the control. After incubation of
cells for 72 h, the medium was removed and 10 ll of
3-(4,5-dimethylthiazol-2-yl)-5-(3-carboxymethoxyphenyl)-
2-(4-sulfophenyl)-2H-tetrazolium solution (Promega) with
90 ll cell culture medium was added to each well. After
incubation at 37 �C for 2 h, the absorbance at 492 nm was
determined using an ELISA reader (Labsystem Dragon,
Oy, Finland). Each experiment was done in triplicate, and
was done independently three times.
Statistical analysis
Statistical analyses were performed using SPSS 18.0. For
categorical, nonordered variables, cross tabulations were
analyzed using the v2 test, or when the v2 test was not valid,Fisher’s exact test was used. The associations between Bmi-
1 expression and RKIP expression were analyzed using the
Spearman rank test. Survival curves were plotted by the
Kaplan–Meier method, and were compared by the log-rank
test. Multiple Cox proportional hazards regression was
performed to identify the independent factors which had a
significant impact on patient survival. For continuous
variables, data were presented as the mean ± the standard
error of the mean, and were analyzed by one-way ANOVA.
A p value below 0.05 was considered significant.
Results
Bmi-1 expression in GC
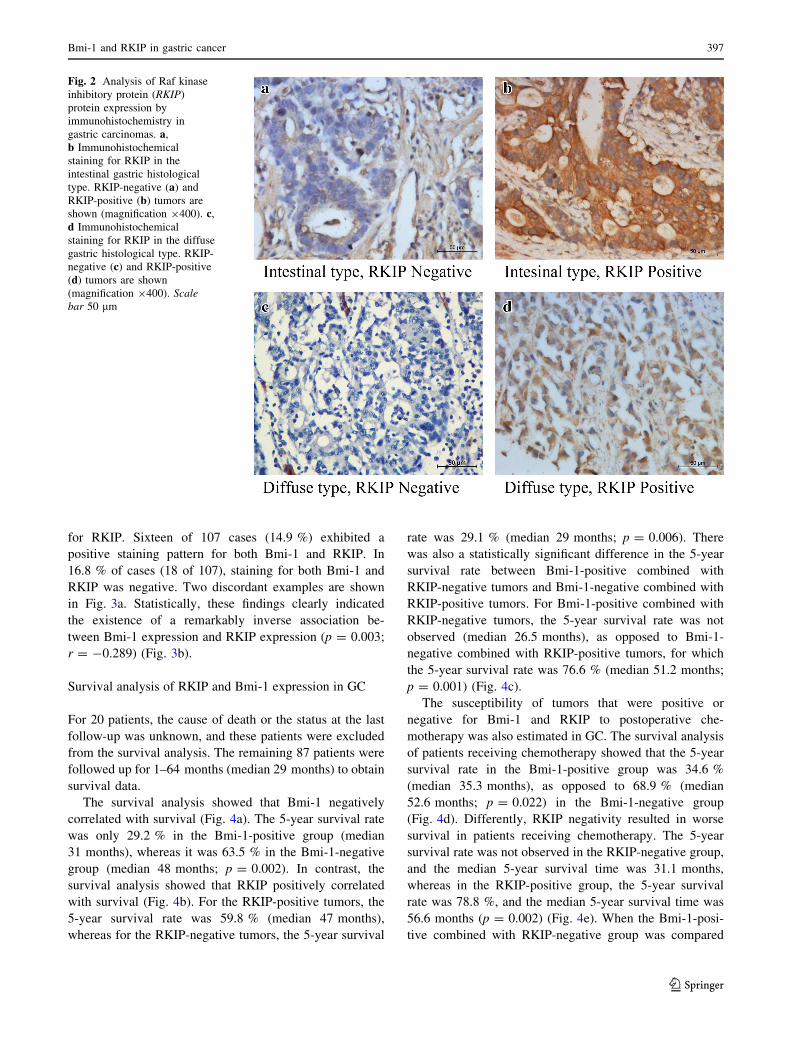
Bmi-1 expression was detected by immunohistochemistry
on gastric tissue microarrays. Among the 107 GC samples,
70 (65.4 %) showed moderate to strong nuclear staining of
Bmi-1 in most of the tumor cells in the form of yellow–
brown granules (Fig. 1).
Fig. 1 Analysis of B-cell-
specific Moloney murine
leukemia virus integration site 1
(Bmi-1) protein expression by
immunohistochemistry in
gastric carcinomas. a,b Immunohistochemical
staining for Bmi-1 in the
intestinal gastric histological
type. Bmi-1-negative (a) andBmi-1-positive (b) tumors are
shown (magnification 9400). c,d Immunohistochemical
staining for Bmi-1 in the diffuse
gastric histological type. Bmi-1-
negative (c) and Bmi-1-positive
(d) tumors are shown
(magnification 9400). Scale
bar 50 lm
Bmi-1 and RKIP in gastric cancer 395
123
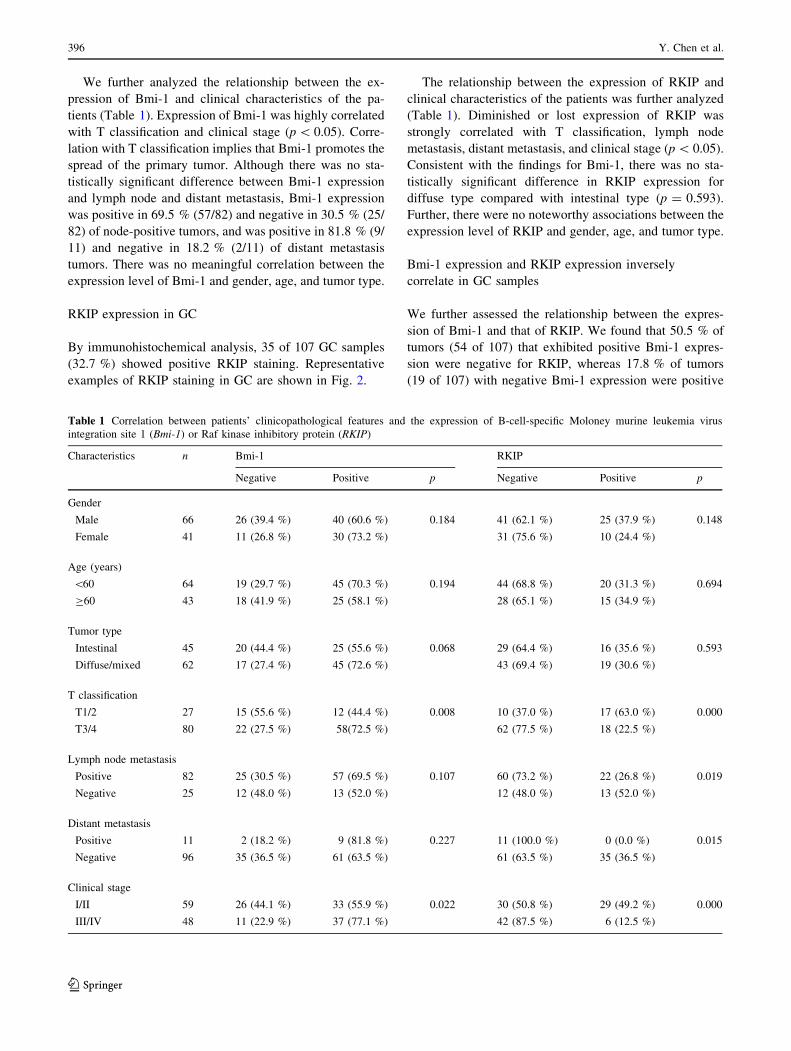
We further analyzed the relationship between the ex-
pression of Bmi-1 and clinical characteristics of the pa-
tients (Table 1). Expression of Bmi-1 was highly correlated
with T classification and clinical stage (p\ 0.05). Corre-
lation with T classification implies that Bmi-1 promotes the
spread of the primary tumor. Although there was no sta-
tistically significant difference between Bmi-1 expression
and lymph node and distant metastasis, Bmi-1 expression
was positive in 69.5 % (57/82) and negative in 30.5 % (25/
82) of node-positive tumors, and was positive in 81.8 % (9/
11) and negative in 18.2 % (2/11) of distant metastasis
tumors. There was no meaningful correlation between the
expression level of Bmi-1 and gender, age, and tumor type.
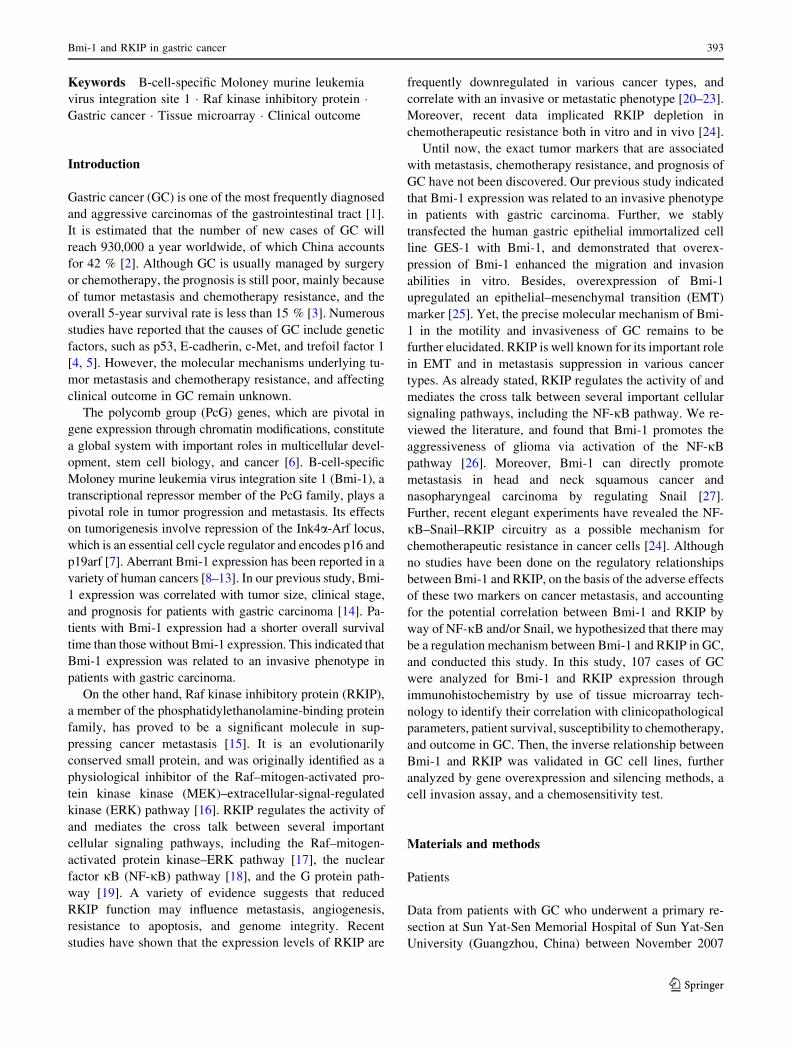
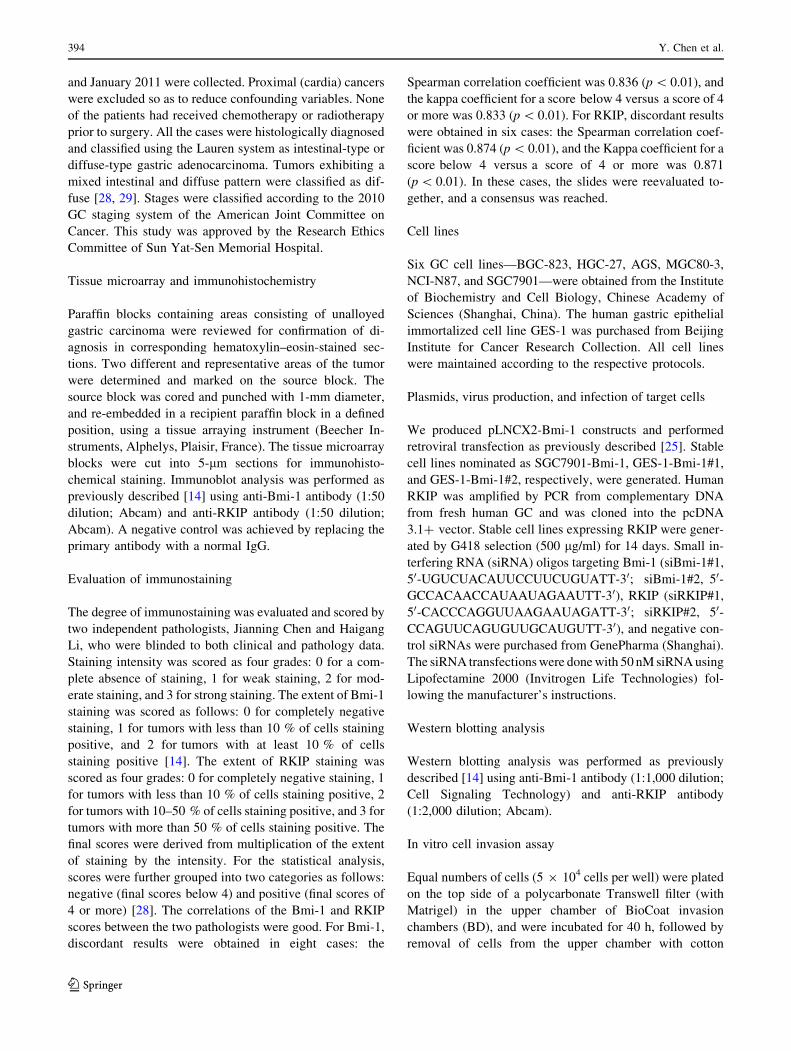
RKIP expression in GC
By immunohistochemical analysis, 35 of 107 GC samples
(32.7 %) showed positive RKIP staining. Representative
examples of RKIP staining in GC are shown in Fig. 2.
The relationship between the expression of RKIP and
clinical characteristics of the patients was further analyzed
(Table 1). Diminished or lost expression of RKIP was
strongly correlated with T classification, lymph node
metastasis, distant metastasis, and clinical stage (p\ 0.05).
Consistent with the findings for Bmi-1, there was no sta-
tistically significant difference in RKIP expression for
diffuse type compared with intestinal type (p = 0.593).
Further, there were no noteworthy associations between the
expression level of RKIP and gender, age, and tumor type.
Bmi-1 expression and RKIP expression inversely
correlate in GC samples
We further assessed the relationship between the expres-
sion of Bmi-1 and that of RKIP. We found that 50.5 % of
tumors (54 of 107) that exhibited positive Bmi-1 expres-
sion were negative for RKIP, whereas 17.8 % of tumors
(19 of 107) with negative Bmi-1 expression were positive
Table 1 Correlation between patients’ clinicopathological features and the expression of B-cell-specific Moloney murine leukemia virus
integration site 1 (Bmi-1) or Raf kinase inhibitory protein (RKIP)
Characteristics n Bmi-1 RKIP
Negative Positive p Negative Positive p
Gender
Male 66 26 (39.4 %) 40 (60.6 %) 0.184 41 (62.1 %) 25 (37.9 %) 0.148
Female 41 11 (26.8 %) 30 (73.2 %) 31 (75.6 %) 10 (24.4 %)
Age (years)
\60 64 19 (29.7 %) 45 (70.3 %) 0.194 44 (68.8 %) 20 (31.3 %) 0.694
C60 43 18 (41.9 %) 25 (58.1 %) 28 (65.1 %) 15 (34.9 %)
Tumor type
Intestinal 45 20 (44.4 %) 25 (55.6 %) 0.068 29 (64.4 %) 16 (35.6 %) 0.593
Diffuse/mixed 62 17 (27.4 %) 45 (72.6 %) 43 (69.4 %) 19 (30.6 %)
T classification
T1/2 27 15 (55.6 %) 12 (44.4 %) 0.008 10 (37.0 %) 17 (63.0 %) 0.000
T3/4 80 22 (27.5 %) 58(72.5 %) 62 (77.5 %) 18 (22.5 %)
Lymph node metastasis
Positive 82 25 (30.5 %) 57 (69.5 %) 0.107 60 (73.2 %) 22 (26.8 %) 0.019
Negative 25 12 (48.0 %) 13 (52.0 %) 12 (48.0 %) 13 (52.0 %)
Distant metastasis
Positive 11 2 (18.2 %) 9 (81.8 %) 0.227 11 (100.0 %) 0 (0.0 %) 0.015
Negative 96 35 (36.5 %) 61 (63.5 %) 61 (63.5 %) 35 (36.5 %)
Clinical stage
I/II 59 26 (44.1 %) 33 (55.9 %) 0.022 30 (50.8 %) 29 (49.2 %) 0.000
III/IV 48 11 (22.9 %) 37 (77.1 %) 42 (87.5 %) 6 (12.5 %)
396 Y. Chen et al.
123
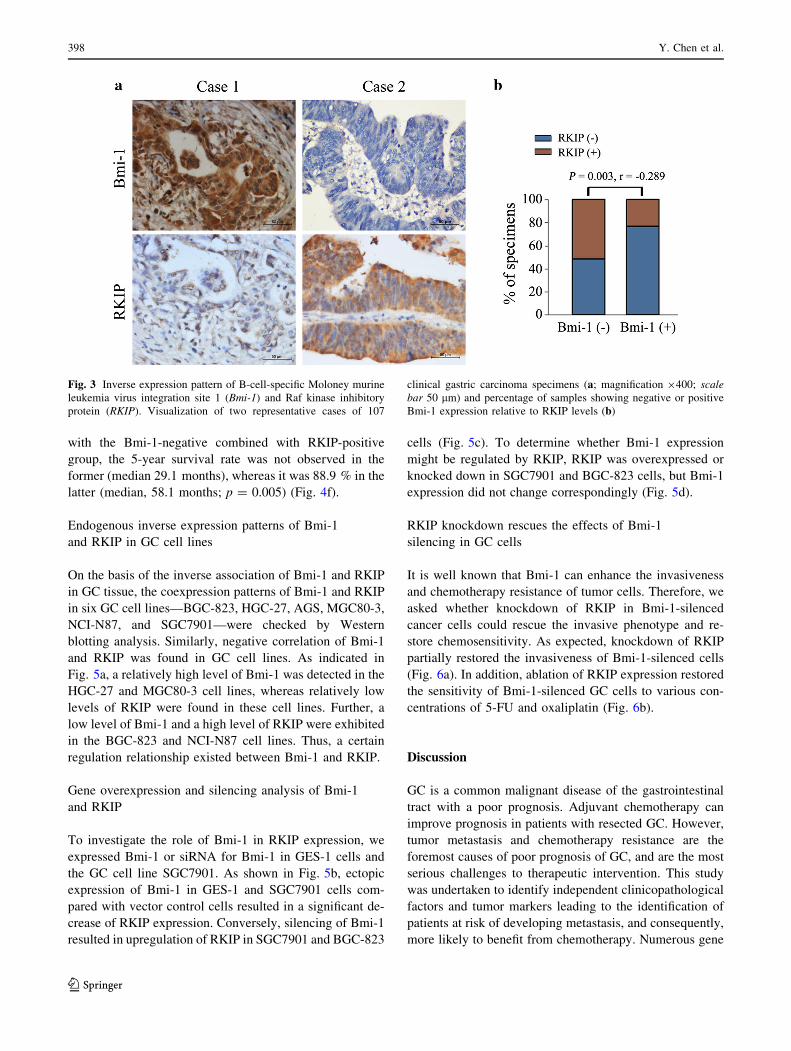
for RKIP. Sixteen of 107 cases (14.9 %) exhibited a
positive staining pattern for both Bmi-1 and RKIP. In
16.8 % of cases (18 of 107), staining for both Bmi-1 and
RKIP was negative. Two discordant examples are shown
in Fig. 3a. Statistically, these findings clearly indicated
the existence of a remarkably inverse association be-
tween Bmi-1 expression and RKIP expression (p = 0.003;
r = -0.289) (Fig. 3b).
Survival analysis of RKIP and Bmi-1 expression in GC
For 20 patients, the cause of death or the status at the last
follow-up was unknown, and these patients were excluded
from the survival analysis. The remaining 87 patients were
followed up for 1–64 months (median 29 months) to obtain
survival data.
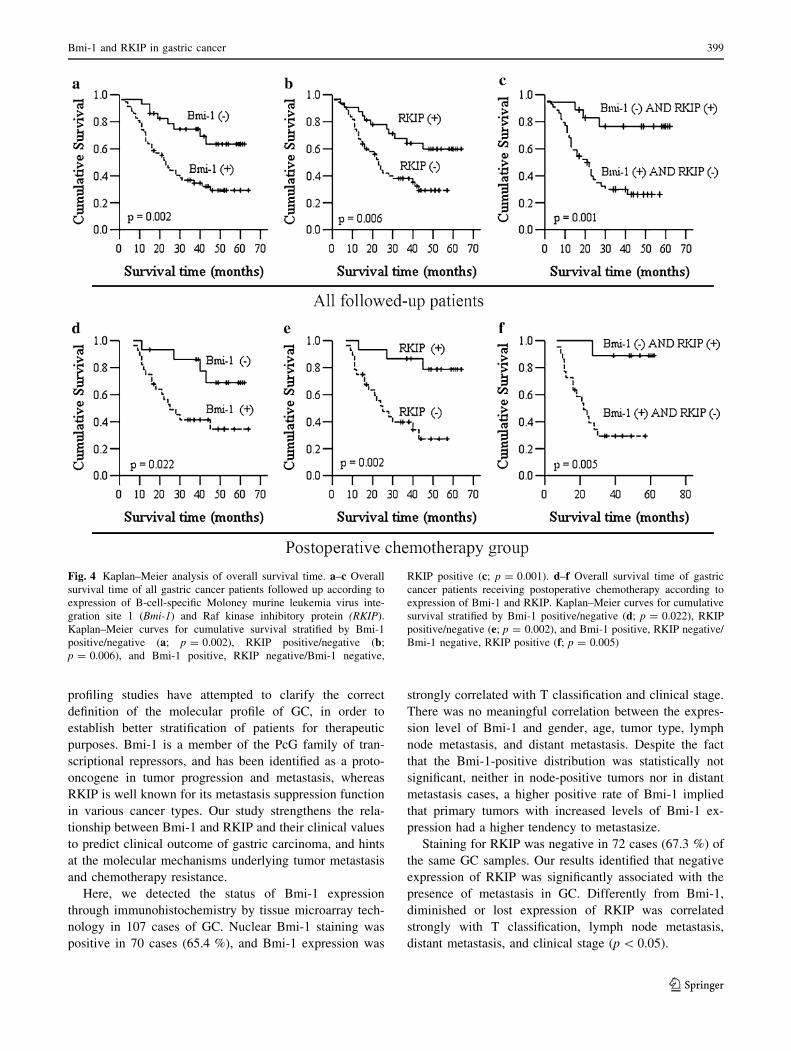
The survival analysis showed that Bmi-1 negatively
correlated with survival (Fig. 4a). The 5-year survival rate
was only 29.2 % in the Bmi-1-positive group (median
31 months), whereas it was 63.5 % in the Bmi-1-negative
group (median 48 months; p = 0.002). In contrast, the
survival analysis showed that RKIP positively correlated
with survival (Fig. 4b). For the RKIP-positive tumors, the
5-year survival rate was 59.8 % (median 47 months),
whereas for the RKIP-negative tumors, the 5-year survival
rate was 29.1 % (median 29 months; p = 0.006). There
was also a statistically significant difference in the 5-year
survival rate between Bmi-1-positive combined with
RKIP-negative tumors and Bmi-1-negative combined with
RKIP-positive tumors. For Bmi-1-positive combined with
RKIP-negative tumors, the 5-year survival rate was not
observed (median 26.5 months), as opposed to Bmi-1-
negative combined with RKIP-positive tumors, for which
the 5-year survival rate was 76.6 % (median 51.2 months;
p = 0.001) (Fig. 4c).
The susceptibility of tumors that were positive or
negative for Bmi-1 and RKIP to postoperative che-
motherapy was also estimated in GC. The survival analysis
of patients receiving chemotherapy showed that the 5-year
survival rate in the Bmi-1-positive group was 34.6 %
(median 35.3 months), as opposed to 68.9 % (median
52.6 months; p = 0.022) in the Bmi-1-negative group
(Fig. 4d). Differently, RKIP negativity resulted in worse
survival in patients receiving chemotherapy. The 5-year
survival rate was not observed in the RKIP-negative group,
and the median 5-year survival time was 31.1 months,
whereas in the RKIP-positive group, the 5-year survival
rate was 78.8 %, and the median 5-year survival time was
56.6 months (p = 0.002) (Fig. 4e). When the Bmi-1-posi-
tive combined with RKIP-negative group was compared
Fig. 2 Analysis of Raf kinase
inhibitory protein (RKIP)
protein expression by
immunohistochemistry in
gastric carcinomas. a,b Immunohistochemical
staining for RKIP in the
intestinal gastric histological
type. RKIP-negative (a) andRKIP-positive (b) tumors are
shown (magnification 9400). c,d Immunohistochemical
staining for RKIP in the diffuse
gastric histological type. RKIP-
negative (c) and RKIP-positive
(d) tumors are shown
(magnification 9400). Scale
bar 50 lm
Bmi-1 and RKIP in gastric cancer 397
123
with the Bmi-1-negative combined with RKIP-positive
group, the 5-year survival rate was not observed in the
former (median 29.1 months), whereas it was 88.9 % in the
latter (median, 58.1 months; p = 0.005) (Fig. 4f).
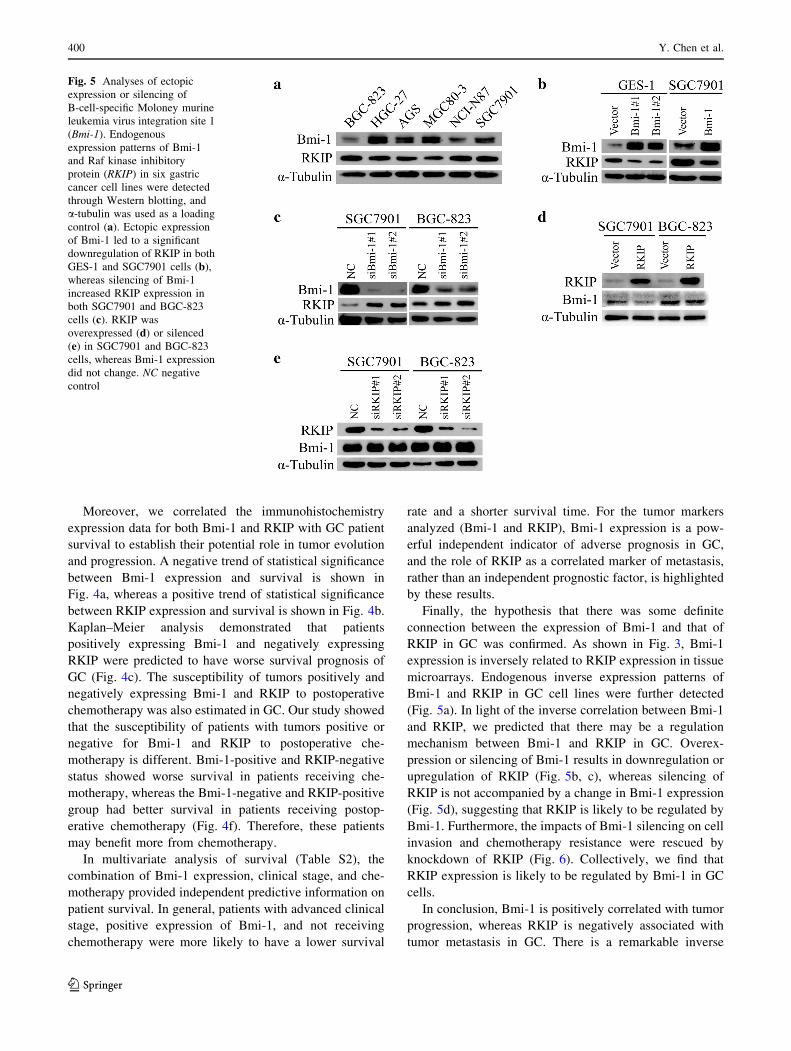
Endogenous inverse expression patterns of Bmi-1
and RKIP in GC cell lines
On the basis of the inverse association of Bmi-1 and RKIP
in GC tissue, the coexpression patterns of Bmi-1 and RKIP
in six GC cell lines—BGC-823, HGC-27, AGS, MGC80-3,
NCI-N87, and SGC7901—were checked by Western
blotting analysis. Similarly, negative correlation of Bmi-1
and RKIP was found in GC cell lines. As indicated in
Fig. 5a, a relatively high level of Bmi-1 was detected in the
HGC-27 and MGC80-3 cell lines, whereas relatively low
levels of RKIP were found in these cell lines. Further, a
low level of Bmi-1 and a high level of RKIP were exhibited
in the BGC-823 and NCI-N87 cell lines. Thus, a certain
regulation relationship existed between Bmi-1 and RKIP.
Gene overexpression and silencing analysis of Bmi-1
and RKIP
To investigate the role of Bmi-1 in RKIP expression, we
expressed Bmi-1 or siRNA for Bmi-1 in GES-1 cells and
the GC cell line SGC7901. As shown in Fig. 5b, ectopic
expression of Bmi-1 in GES-1 and SGC7901 cells com-
pared with vector control cells resulted in a significant de-
crease of RKIP expression. Conversely, silencing of Bmi-1
resulted in upregulation of RKIP in SGC7901 and BGC-823
cells (Fig. 5c). To determine whether Bmi-1 expression
might be regulated by RKIP, RKIP was overexpressed or
knocked down in SGC7901 and BGC-823 cells, but Bmi-1
expression did not change correspondingly (Fig. 5d).
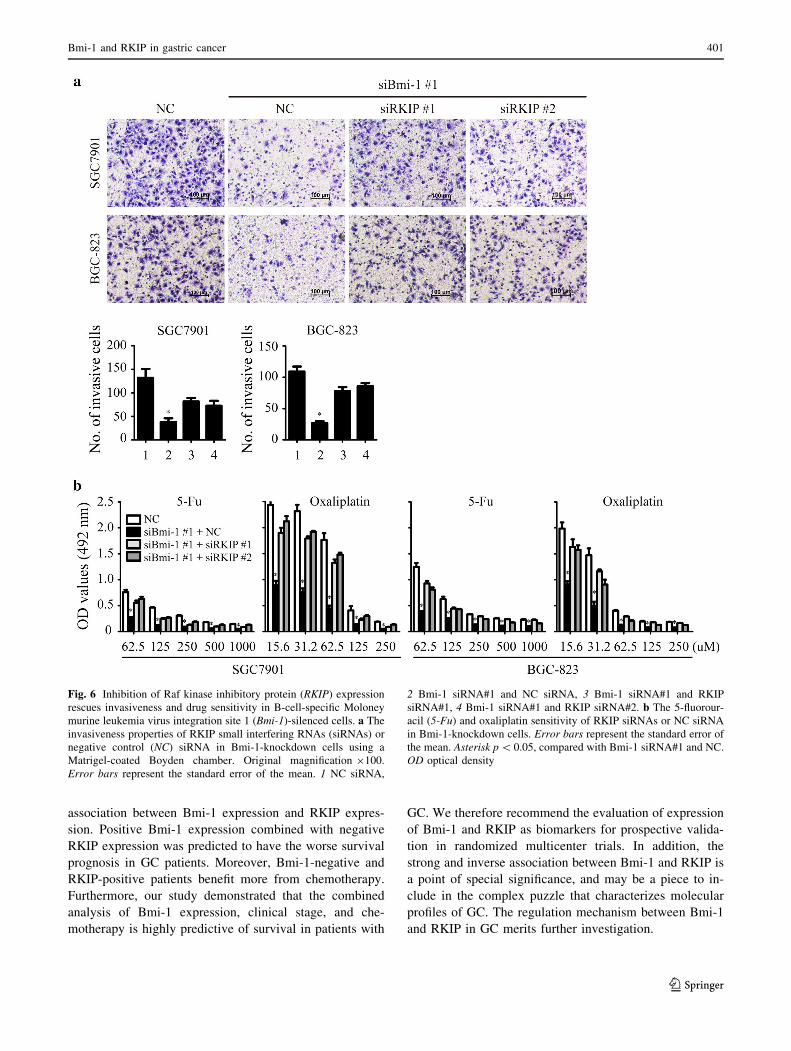
RKIP knockdown rescues the effects of Bmi-1
silencing in GC cells
It is well known that Bmi-1 can enhance the invasiveness
and chemotherapy resistance of tumor cells. Therefore, we
asked whether knockdown of RKIP in Bmi-1-silenced
cancer cells could rescue the invasive phenotype and re-
store chemosensitivity. As expected, knockdown of RKIP
partially restored the invasiveness of Bmi-1-silenced cells
(Fig. 6a). In addition, ablation of RKIP expression restored
the sensitivity of Bmi-1-silenced GC cells to various con-
centrations of 5-FU and oxaliplatin (Fig. 6b).
Discussion
GC is a common malignant disease of the gastrointestinal
tract with a poor prognosis. Adjuvant chemotherapy can
improve prognosis in patients with resected GC. However,
tumor metastasis and chemotherapy resistance are the
foremost causes of poor prognosis of GC, and are the most
serious challenges to therapeutic intervention. This study
was undertaken to identify independent clinicopathological
factors and tumor markers leading to the identification of
patients at risk of developing metastasis, and consequently,
more likely to benefit from chemotherapy. Numerous gene
Fig. 3 Inverse expression pattern of B-cell-specific Moloney murine
leukemia virus integration site 1 (Bmi-1) and Raf kinase inhibitory
protein (RKIP). Visualization of two representative cases of 107
clinical gastric carcinoma specimens (a; magnification 9400; scale
bar 50 lm) and percentage of samples showing negative or positive
Bmi-1 expression relative to RKIP levels (b)
398 Y. Chen et al.
123
profiling studies have attempted to clarify the correct
definition of the molecular profile of GC, in order to
establish better stratification of patients for therapeutic
purposes. Bmi-1 is a member of the PcG family of tran-
scriptional repressors, and has been identified as a proto-
oncogene in tumor progression and metastasis, whereas
RKIP is well known for its metastasis suppression function
in various cancer types. Our study strengthens the rela-
tionship between Bmi-1 and RKIP and their clinical values
to predict clinical outcome of gastric carcinoma, and hints
at the molecular mechanisms underlying tumor metastasis
and chemotherapy resistance.
Here, we detected the status of Bmi-1 expression
through immunohistochemistry by tissue microarray tech-
nology in 107 cases of GC. Nuclear Bmi-1 staining was
positive in 70 cases (65.4 %), and Bmi-1 expression was
strongly correlated with T classification and clinical stage.
There was no meaningful correlation between the expres-
sion level of Bmi-1 and gender, age, tumor type, lymph
node metastasis, and distant metastasis. Despite the fact
that the Bmi-1-positive distribution was statistically not
significant, neither in node-positive tumors nor in distant
metastasis cases, a higher positive rate of Bmi-1 implied
that primary tumors with increased levels of Bmi-1 ex-
pression had a higher tendency to metastasize.
Staining for RKIP was negative in 72 cases (67.3 %) of
the same GC samples. Our results identified that negative
expression of RKIP was significantly associated with the
presence of metastasis in GC. Differently from Bmi-1,
diminished or lost expression of RKIP was correlated
strongly with T classification, lymph node metastasis,
distant metastasis, and clinical stage (p\ 0.05).
Fig. 4 Kaplan–Meier analysis of overall survival time. a–c Overall
survival time of all gastric cancer patients followed up according to
expression of B-cell-specific Moloney murine leukemia virus inte-
gration site 1 (Bmi-1) and Raf kinase inhibitory protein (RKIP).
Kaplan–Meier curves for cumulative survival stratified by Bmi-1
positive/negative (a; p = 0.002), RKIP positive/negative (b;p = 0.006), and Bmi-1 positive, RKIP negative/Bmi-1 negative,
RKIP positive (c; p = 0.001). d–f Overall survival time of gastric
cancer patients receiving postoperative chemotherapy according to
expression of Bmi-1 and RKIP. Kaplan–Meier curves for cumulative
survival stratified by Bmi-1 positive/negative (d; p = 0.022), RKIP
positive/negative (e; p = 0.002), and Bmi-1 positive, RKIP negative/
Bmi-1 negative, RKIP positive (f; p = 0.005)
Bmi-1 and RKIP in gastric cancer 399
123
Moreover, we correlated the immunohistochemistry
expression data for both Bmi-1 and RKIP with GC patient
survival to establish their potential role in tumor evolution
and progression. A negative trend of statistical significance
between Bmi-1 expression and survival is shown in
Fig. 4a, whereas a positive trend of statistical significance
between RKIP expression and survival is shown in Fig. 4b.
Kaplan–Meier analysis demonstrated that patients
positively expressing Bmi-1 and negatively expressing
RKIP were predicted to have worse survival prognosis of
GC (Fig. 4c). The susceptibility of tumors positively and
negatively expressing Bmi-1 and RKIP to postoperative
chemotherapy was also estimated in GC. Our study showed
that the susceptibility of patients with tumors positive or
negative for Bmi-1 and RKIP to postoperative che-
motherapy is different. Bmi-1-positive and RKIP-negative
status showed worse survival in patients receiving che-
motherapy, whereas the Bmi-1-negative and RKIP-positive
group had better survival in patients receiving postop-
erative chemotherapy (Fig. 4f). Therefore, these patients
may benefit more from chemotherapy.
In multivariate analysis of survival (Table S2), the
combination of Bmi-1 expression, clinical stage, and che-
motherapy provided independent predictive information on
patient survival. In general, patients with advanced clinical
stage, positive expression of Bmi-1, and not receiving
chemotherapy were more likely to have a lower survival
rate and a shorter survival time. For the tumor markers
analyzed (Bmi-1 and RKIP), Bmi-1 expression is a pow-
erful independent indicator of adverse prognosis in GC,
and the role of RKIP as a correlated marker of metastasis,
rather than an independent prognostic factor, is highlighted
by these results.
Finally, the hypothesis that there was some definite
connection between the expression of Bmi-1 and that of
RKIP in GC was confirmed. As shown in Fig. 3, Bmi-1
expression is inversely related to RKIP expression in tissue
microarrays. Endogenous inverse expression patterns of
Bmi-1 and RKIP in GC cell lines were further detected
(Fig. 5a). In light of the inverse correlation between Bmi-1
and RKIP, we predicted that there may be a regulation
mechanism between Bmi-1 and RKIP in GC. Overex-
pression or silencing of Bmi-1 results in downregulation or
upregulation of RKIP (Fig. 5b, c), whereas silencing of
RKIP is not accompanied by a change in Bmi-1 expression
(Fig. 5d), suggesting that RKIP is likely to be regulated by
Bmi-1. Furthermore, the impacts of Bmi-1 silencing on cell
invasion and chemotherapy resistance were rescued by
knockdown of RKIP (Fig. 6). Collectively, we find that
RKIP expression is likely to be regulated by Bmi-1 in GC
cells.
In conclusion, Bmi-1 is positively correlated with tumor
progression, whereas RKIP is negatively associated with
tumor metastasis in GC. There is a remarkable inverse
Fig. 5 Analyses of ectopic
expression or silencing of
B-cell-specific Moloney murine
leukemia virus integration site 1
(Bmi-1). Endogenous
expression patterns of Bmi-1
and Raf kinase inhibitory
protein (RKIP) in six gastric
cancer cell lines were detected
through Western blotting, and
a-tubulin was used as a loading
control (a). Ectopic expression
of Bmi-1 led to a significant
downregulation of RKIP in both
GES-1 and SGC7901 cells (b),whereas silencing of Bmi-1
increased RKIP expression in
both SGC7901 and BGC-823
cells (c). RKIP was
overexpressed (d) or silenced(e) in SGC7901 and BGC-823
cells, whereas Bmi-1 expression
did not change. NC negative
control
400 Y. Chen et al.
123
association between Bmi-1 expression and RKIP expres-
sion. Positive Bmi-1 expression combined with negative
RKIP expression was predicted to have the worse survival
prognosis in GC patients. Moreover, Bmi-1-negative and
RKIP-positive patients benefit more from chemotherapy.
Furthermore, our study demonstrated that the combined
analysis of Bmi-1 expression, clinical stage, and che-
motherapy is highly predictive of survival in patients with
GC. We therefore recommend the evaluation of expression
of Bmi-1 and RKIP as biomarkers for prospective valida-
tion in randomized multicenter trials. In addition, the
strong and inverse association between Bmi-1 and RKIP is
a point of special significance, and may be a piece to in-
clude in the complex puzzle that characterizes molecular
profiles of GC. The regulation mechanism between Bmi-1
and RKIP in GC merits further investigation.
Fig. 6 Inhibition of Raf kinase inhibitory protein (RKIP) expression
rescues invasiveness and drug sensitivity in B-cell-specific Moloney
murine leukemia virus integration site 1 (Bmi-1)-silenced cells. a The
invasiveness properties of RKIP small interfering RNAs (siRNAs) or
negative control (NC) siRNA in Bmi-1-knockdown cells using a
Matrigel-coated Boyden chamber. Original magnification 9100.
Error bars represent the standard error of the mean. 1 NC siRNA,
2 Bmi-1 siRNA#1 and NC siRNA, 3 Bmi-1 siRNA#1 and RKIP
siRNA#1, 4 Bmi-1 siRNA#1 and RKIP siRNA#2. b The 5-fluorour-
acil (5-Fu) and oxaliplatin sensitivity of RKIP siRNAs or NC siRNA
in Bmi-1-knockdown cells. Error bars represent the standard error of
the mean. Asterisk p\ 0.05, compared with Bmi-1 siRNA#1 and NC.
OD optical density
Bmi-1 and RKIP in gastric cancer 401
123

Acknowledgments This work was supported by the National Nat-
ural Science Foundation of China (grants 81302140, 81072045, and
30670951). Grant KLB09001 from the Key Laboratory of Malignant
Tumor Gene Regulation and Target Therapy of Guangdong Higher
Education Institutes, Sun-Yat-Sen University, and grant [2013]163
from the Key Laboratory of Malignant Tumor Molecular Mechanism
and Translational Medicine of Guangzhou Bureau of Science and
Information Technology are acknowledged.
Conflict of interest The authors declare that they have no conflict
of interest.
References
1. Desai AM, Pareek M, Nightingale PG, Fielding JW. Improving
outcomes in gastric cancer over 20 years. Gastric Cancer.
2004;7:196–201; discussion 201–3.
2. Parkin DM, Bray F, Ferlay J, Pisani P. Global cancer statistics,
2002. CA Cancer J Clin. 2005;55:74–108.
3. Dhar DK, Kubota H, Tachibana M, Kinugasa S, Masunaga R,
Shibakita M, et al. Prognosis of T4 gastric carcinoma patients: an
appraisal of aggressive surgical treatment. J Surg Oncol.
2001;76:278–82.
4. Park WS, Oh RR, Park JY, Lee JH, Shin MS, Kim HS, et al.
Somatic mutations of the trefoil factor family 1 gene in gastric
cancer. Gastroenterology. 2000;119:691–8.
5. Li QL, Ito K, Sakakura C, Fukamachi H, Ki Inoue, Chi XZ, et al.
Causal relationship between the loss of RUNX3 expression and
gastric cancer. Cell. 2002;109:113–24.
6. Bracken AP, Helin K. Polycomb group proteins: navigators of
lineage pathways led astray in cancer. Nat Rev Cancer.
2009;9:773–84.
7. Jacobs JJ, Kieboom K, Marino S, DePinho RA, van Lohuizen M.
The oncogene and Polycomb-group gene bmi-1 regulates cell
proliferation and senescence through the ink4a locus. Nature.
1999;397:164–8.
8. Bea S, Tort F, Pinyol M, Puig X, Hernandez L, Hernandez S,
et al. BMI-1 gene amplification and overexpression in hemato-
logical malignancies occur mainly in mantle cell lymphomas.
Cancer Res. 2001;61:2409–12.
9. Vonlanthen S, Heighway J, Altermatt HJ, Gugger M, Kappeler A,
Borner MM, et al. The bmi-1 oncoprotein is differentially ex-
pressed in non-small cell lung cancer and correlates with INK4A-
ARF locus expression. Br J Cancer. 2001;84:1372–6.
10. Raaphorst FM, Meijer CJ, Fieret E, Blokzijl T, Mommers E,
Buerger H, et al. Poorly differentiated breast carcinoma is asso-
ciated with increased expression of the human polycomb group
EZH2 gene. Neoplasia. 2003;5:481–8.
11. Glinsky GV, Berezovska O, Glinskii AB. Microarray analysis
identifies a death-from-cancer signature predicting therapy failure
in patients with multiple types of cancer. J Clin Invest.
2005;115:1503–21.
12. Song LB, Zeng MS, Liao WT, Zhang L, Mo HY, Liu WL, et al.
Bmi-1 is a novel molecular marker of nasopharyngeal carcinoma
progression and immortalizes primary human nasopharyngeal
epithelial cells. Cancer Res. 2006;66:6225–32.
13. Kim JH, Yoon SY, Kim CN, Joo JH, Moon SK, Choe IS, et al.
The Bmi-1 oncoprotein is overexpressed in human colorectal
cancer and correlates with the reduced p16INK4a/p14ARF pro-
teins. Cancer Lett. 2004;203:217–24.
14. Liu JH, Song LB, Zhang X, Guo BH, Feng Y, Li XX, et al. Bmi-1
expression predicts prognosis for patients with gastric carcinoma.
J Surg Oncol. 2008;97:267–72.
15. Granovsky AE, Rosner MR. Raf kinase inhibitory protein: a
signal transduction modulator and metastasis suppressor. Cell
Res. 2008;18:452–7.
16. Yeung K, Janosch P, McFerran B, Rose DW, Mischak H, Sedivy
JM, et al. Mechanism of suppression of the Raf/MEK/extracel-
lular signal-regulated kinase pathway by the Raf kinase inhibitor
protein. Mol Cell Biol. 2000;20:3079–85.
17. Fu Z, Smith PC, Zhang L, Rubin MA, Dunn RL, Yao Z, et al.
Effects of Raf kinase inhibitor protein expression on suppression
of prostate cancer metastasis. J Natl Cancer Inst.
2003;95:878–89.
18. Yeung KC, Rose DW, Dhillon AS, Yaros D, Gustafsson M,
Chatterjee D, et al. Raf kinase inhibitor protein interacts with NF-
jB-inducing kinase and TAK1 and inhibits NF-jB activation.
Mol Cell Biol. 2001;21:7207–17.
19. Kroslak T, Koch T, Kahl E, Hollt V. Human phos-
phatidylethanolamine-binding protein facilitates heterotrimeric G
protein-dependent signaling. J Biol Chem. 2001;276:39772–8.
20. Hagan S, Al-Mulla F, Mallon E, Oien K, Ferrier R, Gusterson B,
et al. Reduction of Raf-1 kinase inhibitor protein expression
correlates with breast cancer metastasis. Clin Cancer Res.
2005;11:7392–7.
21. Schuierer MM, Bataille F, Hagan S, Kolch W, Bosserhoff AK.
Reduction in Raf kinase inhibitor protein expression is associated
with increased Ras-extracellular signal-regulated kinase signaling
in melanoma cell lines. Cancer Res. 2004;64:5186–92.
22. Xu YF, Yi Y, Qiu SJ, Gao Q, Li YW, Dai CX, et al. PEBP1
downregulation is associated to poor prognosis in HCC related to
hepatitis B infection. J Hepatol. 2010;53:872–9.
23. Zlobec I, Baker K, Minoo P, Jass JR, Terracciano L, Lugli A.
Node-negative colorectal cancer at high risk of distant metastasis
identified by combined analysis of lymph node status, vascular
invasion, and Raf-1 kinase inhibitor protein expression. Clin
Cancer Res. 2008;14:143–8.
24. Baritaki S, Yeung K, Palladino M, Berenson J, Bonavida B.
Pivotal roles of Snail inhibition and RKIP induction by the pro-
teasome inhibitor NPI-0052 in tumor cell chemoimmunosensiti-
zation. Cancer Res. 2009;69:8376–85.
25. Chen Y, Lian G, Zhang Q, Zeng L, Qian C, Chen S, et al.
Overexpression of Bmi-1 induces the malignant transformation of
gastric epithelial cells in vitro. Oncol Res. 2013;21:33–41.
26. Jiang L, Wu J, Yang Y, Liu L, Song L, Li J, et al. Bmi-1 pro-
motes the aggressiveness of glioma via activating the NF-kap-
paB/MMP-9 signaling pathway. BMC Cancer. 2012;12:406.
27. Yu CC, Lo WL, Chen YW, Huang PI, Hsu HS, Tseng LM, et al.
Bmi-1 Regulates Snail expression and promotes metastasis ability
in head and neck squamous cancer-derived ALDH1 positive
cells. J Oncol 2011. doi:10.1155/2011/609259.
28. Chatterjee D, Sabo E, Tavares R, Resnick MB. Inverse asso-
ciation between Raf kinase inhibitory protein and signal trans-
ducers and activators of transcription 3 expression in gastric
adenocarcinoma patients: implications for clinical outcome. Clin
Cancer Res. 2008;14:2994–3001.
29. Huang D, Lu N, Fan Q, Sheng W, Bu H, Jin X, et al. HER2 status
in gastric and gastroesophageal junction cancer assessed by local
and central laboratories: Chinese results of the HER-EAGLE
study. PLoS One. 2013;8:e80290.
402 Y. Chen et al.
123