Embed Size (px)
Citation preview

December

Index
Market Outlook
Fund Managers Profile
Fund Performance
Secure Fund
Stable Fund
Growth Fund
Growth Advantage Fund
Money Market Fund
Income Advantage Fund
Gilt Fund
Bond Fund
Fixed Interest Fund
Short Term Debt Fund
Pg 1
Pg 3
Pg 4
Pg 5
Pg 6
Pg 7
Pg 8
Pg 9
Pg 10
Pg 11
Pg 12
Pg 13
Pg 14
as on 31st December 2013

Market Update
In spite of high inflation, with the CPI at 11.2% and WPI at 7.52%, RBI, in its mid-quarter monetary policy on
December 18, 2013, chose to keep policy rates unchanged. This stance of RBI, much against the consensus
expectation of a 25bps hike in the repo rate, was guided by RBI's expectation that inflation would ease in the near
future. An expected fall in inflation in the coming months will drive a shift in debate to a rate cut sometime in the 2nd
half of CY14.
On the external front, the US Fed's decision to begin tapering by $10bn was well weathered by global equity markets.
Indian equity markets too were resilient. Improving growth prospects in the developed world will aid Indian exports in
2014. Imports will remain muted due to the domestic slowdown and lower commodity prices.
CY2014 looks to be a year of two distinct halves, the first till the general elections and the second post the general
elections. Politics and US Federal Reserve tapering will be the headlines in the first half, with the subtexts being
inflation, interest rates and corporate earnings. In the short to medium term, asset markets will be driven by monthly
inflation data, any RBI action on the rate front, political developments, policy reforms and tapering tantrums.
Post elections, fiscal deficit funding and the economic recovery and its resultant impact on earnings will be key
headlines.
31-Dec-13 29-Nov-13 % ChangeINDEX
Nifty
Sensex
BSE 100
Dow Jones
Hang Seng
Nikkei
Nasdaq
6304.00 6176.10 2.07%
21170.68 20791.93 1.82%
6326.72 6177.75 2.41%
16576.66 16086.41 3.05%
16291.31 15661.87 4.02%
23306.39 23881.29 -2.41%
4176.59 4059.89 2.87%
1
BSE NSE
In U
S $
MN
FII MF
No
v-1
2
No
v-1
3
De
c-1
2
De
c-1
3
Jan
-13
Fe
b-1
3
Ma
r-1
3
Ap
r-1
3
Ma
y-1
3
Jun
-13
Jul-
13
Au
g-1
3
Sep
-13
Oct
-13
No
v-1
3
De
c-1
2
De
c-1
3
Jan
-13
Fe
b-1
3
Ma
r-1
3
Ap
r-1
3
Ma
y-1
3
Jun
-13
Jul-
13
Au
g-1
3
Sep
-13
Oct
-13
(2500)
(1500)
(500)
500
1500
2500
3500
4500
5500
3000
3500
4000
4500
5000
5500
6000
6500
14000
15000
16000
17000
18000
19000
20000
21000
22000
Rs v/s USD
No
v-1
2
No
v-13
De
c-1
2
De
c-13
Jan-
13
Fe
b-1
3
Ma
r-1
3
Ap
r-1
3
Ma
y-1
3
Jun-
13
Jul-1
3
Au
g-1
3
Sep
-13
Oct
-13
45
50
55
60
65
70
Market Update
31-Dec-13 29-Nov-13 % ChangeKey Indices
10 year G-Sec
5 Year G-Sec
91 Day T Bill
364 day T-Bill
MIBOR
Call Rates
8.83% 8.70% 1.47%
8.89% 8.85% 0.45%
8.59% 8.86% -3.14%
8.80% 8.81% -0.11%
9.02% 9.03% -0.11%
8.73% 8.04% 7.90%
2
Outlook for equities
Indian equities saw a relatively volatile December with index returns of 9% for CY2013. The front line indices
proceeded to make fresh all-time highs as market sentiment was buoyed by the outcome of the State Elections.
Foreign Institutional Investors (FIIs) ended December 2013 as net buyers, with net inflows of $2.5bn, taking their
total inflows for CY13 to $20bn. This is the third biggest year for FII inflows. Domestic Institutional Investors (DIIs)
remained net sellers, notching up $1.2bn net outflows in December 2013, taking their total outflows for CY13 to
$12.9bn.
For FY15, we expect the BSE Sensex EPS at 1500, an earnings growth of 12%. Based on fundamental valuations
of 15.5-16x FY15e EPS, the full year BSE Sensex target would be 23300-24000.
Outlook for debt
Bond markets were range bound in the absence of any triggers. Liquidity is within RBI's comfort zone of +/- 1% of
NDTL. Bond spreads remained tight due to a lack of supply at the longer end of the curve. This was also due to a
large amount of tax free bonds issued by PSU's. We expect the 10 year government bond to trade in the range of
8.75% to 8.90% in the near term. Corporate bonds spreads are expected to remain at 60bps for some more time.
perc
en
tag
e (%
)
bp
s
No
v-1
2
No
v- 1
3
De
c- 1
2
De
c- 1
3
Jan
- 13
Fe
b- 1
3
Ma
r-1
3
Ap
r-1
3
Ma
y- 1
3
Jun
- 13
Jul-
13
Au
g- 1
3
Sep
- 13
Oct
- 13
10 Yr G-Sec yield 5 year AAA Corporate Bond Spread
25
50
75
100
125
150
5.0
6.0
7.0
8.0
9.0

Fund Managers Profile
Mr. Devendra Singhvi
Mr. Sameer Mistry
Mr. Parin Vora
Mr. Devendra Singhvi has been with BSLI since May 2006. He has over 16 years of experience in markets such as Fixed Income, Treasury, Forex and Derivatives. His previous three assignments have been with Reliance ADA Group Treasury, Prebon Yamane and Hindalco Industries Ltd. Devendra has done his graduation in Mathematics and an MBA in Finance along with a PhD.
Mr. Devendra Singhvi - Head- Fixed Income
Mr. Sameer Mistry joined BSLI in January 2009. He has over 14 years of experience in Equity Research and Fund Management. Prior to joining us, he worked as a Fund Manager with Reliance Capital Asset Management, Tata Mutual Fund and SBI Life Insurance. Sameer has done his BE (Electronics & Telecom) as well as an MBA in Finance.
Mr. Sameer Mistry - Fund Manager – Equity
Mr. Parin S Vora has been with BSLI since October 2007 and is primarily responsible for Fixed Income trading and Fund Management. He has 14 years of experience in Fixed Income Industry and was associated with Birla Sun Life Securities & Mata Securities. Parin has done his MBA in Finance from Welingkar’s Institute of Management and DPMIR from Narsee Monjee Institute of Management studies.
Mr. Parin S Vora - Chief Manager – Investments
3
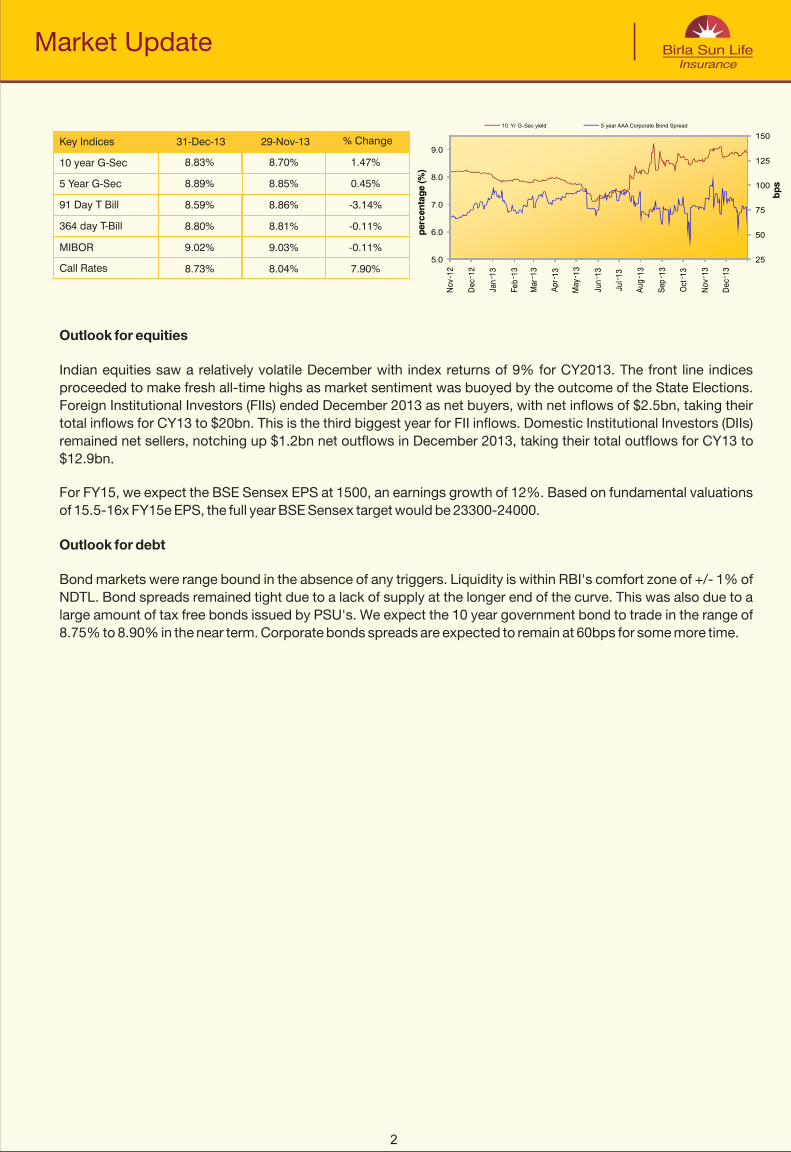
stFund Performance as on 31 December 2013
Life Funds Figures in percentage (%)
Absolute Return
CAGR
Returns Period
Absolute Return
CAGR
Returns Money Market Fund
Short Term Debt Fund
BM BM BMPeriod
0.69%
2.09%
4.21%
8.04%
8.06%
7.96%
7.14%
6.61%
6.85%
0.70%
2.21%
2.99%
7.29%
7.98%
7.80%
6.92%
-
6.56%
0.46%
2.13%
-1.02%
4.08%
6.60%
6.66%
-
-
6.30%
0.77%
2.24%
4.53%
9.04%
9.42%
9.36%
8.72%
9.74%
9.57%
0.78%
2.50%
3.63%
8.33%
9.61%
9.40%
8.66%
9.00%
8.90%
1 month
3 months
6 months
1 Year
2 Years
3 Years
4 Years
5 Years
Since Inception
Absolute Return
CAGR
Returns Gilt Fund Bond Fund Fixed Interest Fund
BM BMPeriod
0.70%
2.21%
3.09%
7.53%
8.36%
7.83%
7.07%
6.33%
6.81%
0.46%
2.13%
-1.02%
4.07%
6.60%
6.66%
6.20%
5.63%
4.56%
0.30%
2.53%
-6.05%
0.86%
5.28%
5.27%
4.85%
4.71%
6.06%
0.58%
2.34%
1.29%
6.76%
9.51%
9.07%
8.84%
9.59%
10.92%
0.41%
2.32%
-0.03%
6.49%
9.50%
9.09%
8.89%
9.79%
8.50%
1 month
3 months
6 months
1 Year
2 Years
3 Years
4 Years
5 Years
Since Inception
1 month
3 months
6 months
1 Year
2 Years
3 Years
4 Years
5 Years
Since Inception
Secure Fund
0.85%
3.82%
0.73%
3.77%
9.05%
5.60%
6.18%
8.97%
10.46%
BM
0.80%
3.58%
0.75%
4.39%
8.43%
5.58%
5.86%
7.72%
6.66%
Stable Fund
1.15%
5.13%
2.07%
3.39%
10.49%
4.63%
5.90%
10.59%
13.21%
BM
1.05%
4.67%
2.05%
4.57%
9.76%
4.71%
5.54%
9.21%
8.07%
Growth Advantage
1.59%
7.21%
4.44%
2.84%
12.99%
3.59%
6.06%
14.43%
11.48%
BM BM
1.31%
5.77%
3.34%
4.70%
11.05%
3.80%
5.16%
10.62%
9.63%
1.47%
6.50%
4.19%
4.76%
11.90%
3.16%
4.88%
11.53%
5.78%
Growth Fund
1.46%
6.39%
3.55%
3.01%
11.90%
3.45%
5.76%
12.50%
14.64%
Income Advantage Fund
0.43%
2.72%
-1.82%
4.23%
7.96%
9.41%
-
-
8.70%
Fund Name Benchmark Composition
Secure
Stable
Growth
Growth Advantage
Money Market
Income Advantage
Fixed Interest
Short Term Debt Fund
Bond Fund
Gilt Fund
BSE 100
BSE 100
BSE 100
BSE 100
-
-
-
-
-
-
Crisil Composite Bond Index
Crisil Composite Bond Index
Crisil Composite Bond Index
Crisil Composite Bond Index
-
Crisil Composite Bond Index
Crisil Composite Bond Index
Crisil Short Term Bond Index
CRISIL Short Term Bond Index
-
Crisil Liquid Fund Index
Crisil Liquid Fund Index
Crisil Liquid Fund Index
Crisil Liquid Fund Index
Crisil Liquid Fund Index
Crisil Liquid Fund Index
Crisil Liquid Fund Index
Disclaimer:
This document is issued by BSLI. While all reasonable care has been taken in preparing this document, no responsibility or liability is accepted for errors of fact or for any opinion expressed herein. This document is for information purposes only. It does not constitute any offer, recommendation or solicitation to any person to enter into any transaction or adopt any investment strategy, nor does it constitute any prediction of likely future movements in NAVs. Past performance is not necessarily indicative of future performance. We have reviewed the report, and in so far as it includes current or historical information, it is believed to be reliable though its accuracy or completeness cannot be guaranteed. Neither Birla Sun Life Insurance Company Limited, nor any person connected with it, accepts any liability arising from the use of this document. You are advised to make your own independent judgment with respect to any matter contained herein.
ULGF00212/06/01BSLGSECURE109
ULGF00312/06/01BSLGSTABLE109
ULGF00112/06/01BSLGGROWTH109
ULGF01026/11/07BSLIGGRADV109
ULGF00824/08/04BSLIGRMMKT109
ULGF01425/02/10BSLGINCADV109
ULGF00416/07/02BSLGFIXINT109ULGF01322/09/08BSLGSHTDBT109
ULGF00530/05/03BSLIGRBOND109
ULGF00630/05/03BSLIGRGILT109
SFIN
4
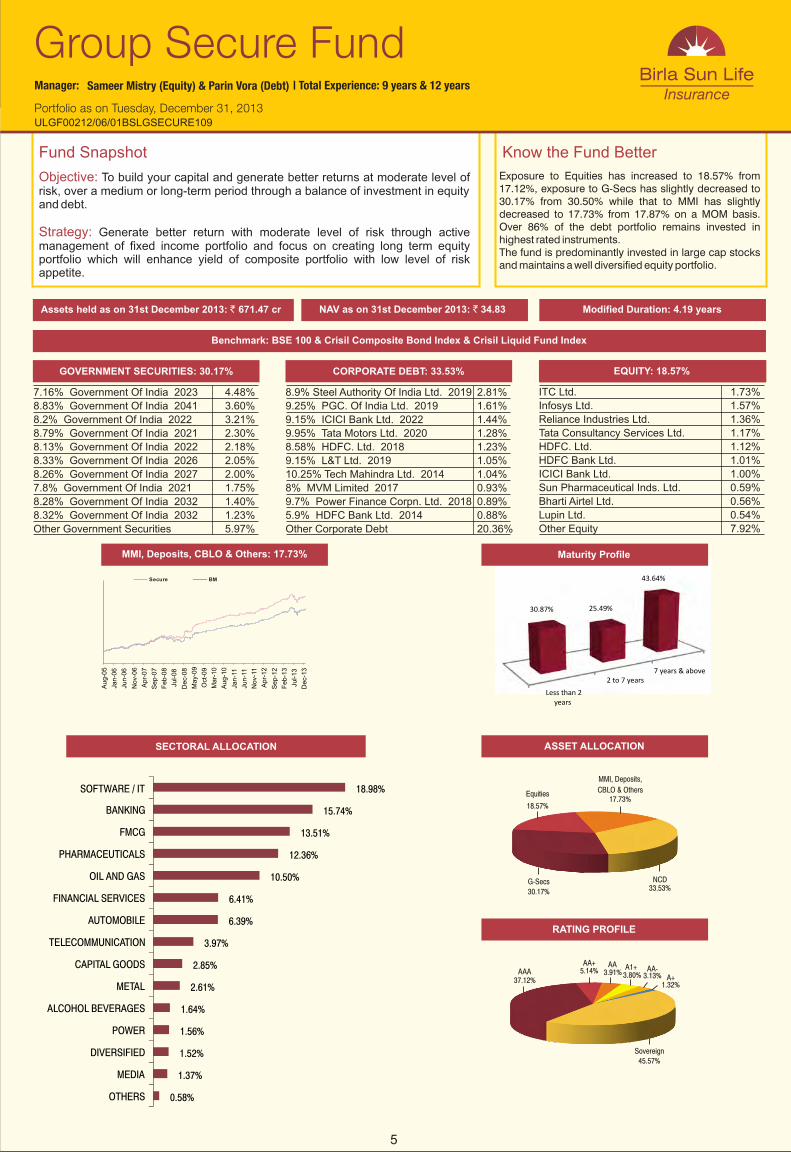
Assets held as on 3: ` 671.47 cr31st December 201
GOVERNMENT SECURITIES: 30.17%
7.16% Government Of India 2023 4.48%
8.83% Government Of India 2041 3.60%
8.2% Government Of India 2022 3.21%
8.79% Government Of India 2021 2.30%
8.13% Government Of India 2022 2.18%
8.33% Government Of India 2026 2.05%
8.26% Government Of India 2027 2.00%
7.8% Government Of India 2021 1.75%
8.28% Government Of India 2032 1.40%
8.32% Government Of India 2032 1.23%
Other Government Securities 5.97%
8.9% Steel Authority Of India Ltd. 2019 2.81%
9.25% PGC. Of India Ltd. 2019 1.61%
9.15% ICICI Bank Ltd. 2022 1.44%
9.95% Tata Motors Ltd. 2020 1.28%
8.58% HDFC. Ltd. 2018 1.23%
9.15% L&T Ltd. 2019 1.05%
10.25% Tech Mahindra Ltd. 2014 1.04%
8% MVM Limited 2017 0.93%
9.7% Power Finance Corpn. Ltd. 2018 0.89%
5.9% HDFC Bank Ltd. 2014 0.88%
Other Corporate Debt 20.36%
ITC Ltd. 1.73%
Infosys Ltd. 1.57%
Reliance Industries Ltd. 1.36%
Tata Consultancy Services Ltd. 1.17%
HDFC. Ltd. 1.12%
HDFC Bank Ltd. 1.01%
ICICI Bank Ltd. 1.00%
Sun Pharmaceutical Inds. Ltd. 0.59%
Bharti Airtel Ltd. 0.56%
Lupin Ltd. 0.54%
Other Equity 7.92%
RATING PROFILE
Exposure to Equities has increased to 18.57 from 17.12%, exposure to G-Secs has slightly decreased to 30.17% from 30.50% while that to MMI has slightly decreased to 17.73 from 17.87% on a MOM basis. Over 86% of the debt portfolio remains invested in highest rated instruments.The fund is predominantly invested in large cap stocks and maintains a well diversified equity portfolio.
%
%
Modified Duration: 4.19 years
EQUITY: 18.57%
NAV as on 31st December 2013: ` 34.83
CORPORATE DEBT: 33.53%
Maturity Profile
ASSET ALLOCATION
MMI, : 17.73%Deposits, CBLO & Others
Objective:
Strategy:
To build your capital and generate better returns at moderate level of risk, over a medium or long-term period through a balance of investment in equity and debt.
Generate better return with moderate level of risk through active management of fixed income portfolio and focus on creating long term equity portfolio which will enhance yield of composite portfolio with low level of risk appetite.
Fund Snapshot Know the Fund Better
Group Secure FundManager: Sameer Mistry (Equity) & Parin Vora (Debt) | Total Experience: 9 years & 12 years
ULGF00212/06/01BSLGSECURE109
Benchmark: BSE 100 & Crisil Composite Bond Index & Crisil Liquid Fund Index
5
SECTORAL ALLOCATION
Portfolio as on Tuesday, December 31, 2013
AAAA+
45.57%Sovereign
Secure BM
0.58%
1.37%
1.52%
1.56%
1.64%
2.61%
2.85%
3.97%
6.39%
6.41%
10.50%
12.36%
13.51%
15.74%
18.98%
OTHERS
MEDIA
DIVERSIFIED
POWER
ALCOHOL BEVERAGES
METAL
CAPITAL GOODS
TELECOMMUNICATION
AUTOMOBILE
FINANCIAL SERVICES
OIL AND GAS
PHARMACEUTICALS
FMCG
BANKING
SOFTWARE / IT
7 years & above2 to 7 years
Less than 2years
43.64%
25.49% 30.87%
NCD33.53%
G-Secs
30.17%
18.57%
Equities17.73%
MMI, Deposits,
CBLO & Others
5.14%AAA37.12%
3.13%3.80%AA-3.91%
A1+
1.32%A+
Maturity Profile
Aug-0
5
Jan-0
6
Jun-0
6
Nov-
06
Apr-
07
Sep-0
7
Feb-0
8
Jul-08
Dec-
08
May-
09
Oct
-09
Mar-
10
Aug-1
0
Jan-1
1
Jun-1
1
Nov-
11
Apr-
12
Sep-1
2
Feb-1
3
Jul-13
Dec-
13

Assets held as on 3: ` 232.86 cr31st December 201
GOVERNMENT SECURITIES: 29.19%
8.79% Government Of India 2021 5.26%
8.83% Government Of India 2023 4.30%
8.33% Government Of India 2026 3.72%
8.08% Government Of India 2022 2.51%
8.3% Government Of India 2040 1.94%
8.28% Government Of India 2032 1.85%
7.16% Government Of India 2023 1.70%
7.5% Government Of India 2034 1.62%
7.8% Government Of India 2021 1.52%
8.26% Government Of India 2027 1.49%
Other Government Securities 3.29%
8.65% REC. Ltd. 2019 4.04%
10.1% PGC. Of India Ltd. 2017 2.18%
8.9% Power Finance Corpn. Ltd. 2014 2.14%
9.25% LIC Housing Finance Ltd. 2023 1.92%
8.6% Power Finance Corpn. Ltd. 2014 1.71%
9.6% HDFC. Ltd. 2016 1.29%
9.4% NABARD 2016 1.28%
10.85% REC. Ltd. 2018 1.12%
9.61% Power Finance Corpn. Ltd. 2021 1.07%
9.33% 2017 1.06%
Other Corporate Debt 6.02%
NABARD
ITC Ltd. 3.02%
Infosys Ltd. 2.69%
Reliance Industries Ltd. 2.36%
Tata Consultancy Services Ltd. 2.03%
HDFC. Ltd. 1.94%
HDFC Bank Ltd. 1.75%
ICICI Bank Ltd. 1.75%
Sun Pharmaceutical Inds. Ltd. 1.03%
Bharti Airtel Ltd. 0.97%
L&T Ltd . 0.95%
Other Equity 13.71%
RATING PROFILE
Over 96% of the debt portfolio remains invested in highest rated instruments.The fund is predominantly invested in large cap stocks and maintains a well diversified equity portfolio. Top 4 equity sectors remain same as the previous month.
Modified Duration: 4.20 years
EQUITY: 32.21%
NAV as on 31st December 2013: ` 46.23
CORPORATE DEBT: 23.82%
Maturity Profile
ASSET ALLOCATION
MMI, Deposits, CBLO & Others: 14.78%
Stable BM
SECTORAL ALLOCATION
Objective:
Strategy:
Helps you to grow your capital through enhanced returns over a medium to long term period through investments in equity and debt instruments, thereby providing a good balance between risk and return.
To earn capital appreciation by maintaining diversified equity portfolio and seek to earn regular return on fixed income portfolio by active management resulting in wealth creation for policyholders.
Fund Snapshot Know the Fund Better
Group Stable FundManager: Sameer Mistry (Equity) & Parin Vora (Debt) | Total Experience: 9 years & 11 years
ULGF00312/06/01BSLGSTABLE109
Benchmark: BSE 100 & Crisil Composite Bond Index & Crisil Liquid Fund Index
Portfolio as on Tuesday, December 31, 2013
6
32.21%
Equities
0.52%
1.31%
1.55%
1.64%
1.65%
2.53%
2.95%
3.91%
6.40%
6.50%
10.58 %
12.25 %
13.49 %
15.81%
18.92 %
OTHERS
MEDIA
DIVERSIFIED
ALCOHOL BEVERAGES
POWER
METAL
CAPITAL GOODS
TELECOMMUNICATION
AUTOMOBILE
FINANCIAL SERVICES
OIL AND GAS
PHARMACEUTICALS
FMCG
BANKING
SOFTWARE / IT
7 years & above2 to 7 years
Less than 2years
49.04%
21.77% 29.19%
29.19%G-Secs
MMI, Deposits,
CBLO & Others14.78%NCD
23.82%
AA+
1.74%AA-
0.16%
AA1.62%
Sovereign55.06%
AAA41.43%
Aug
-05
Jan-
06
Jun-
06
Nov
-06
Apr
-07
Sep
-07
Feb
-08
Jul-0
8
Dec
-08
May
-09
Oct
-09
Mar
-10
Aug
-10
Jan-
11
Jun-
11
Nov
-11
Apr
-12
Sep
-12
Feb
-13
Jul-1
3
Dec
-13
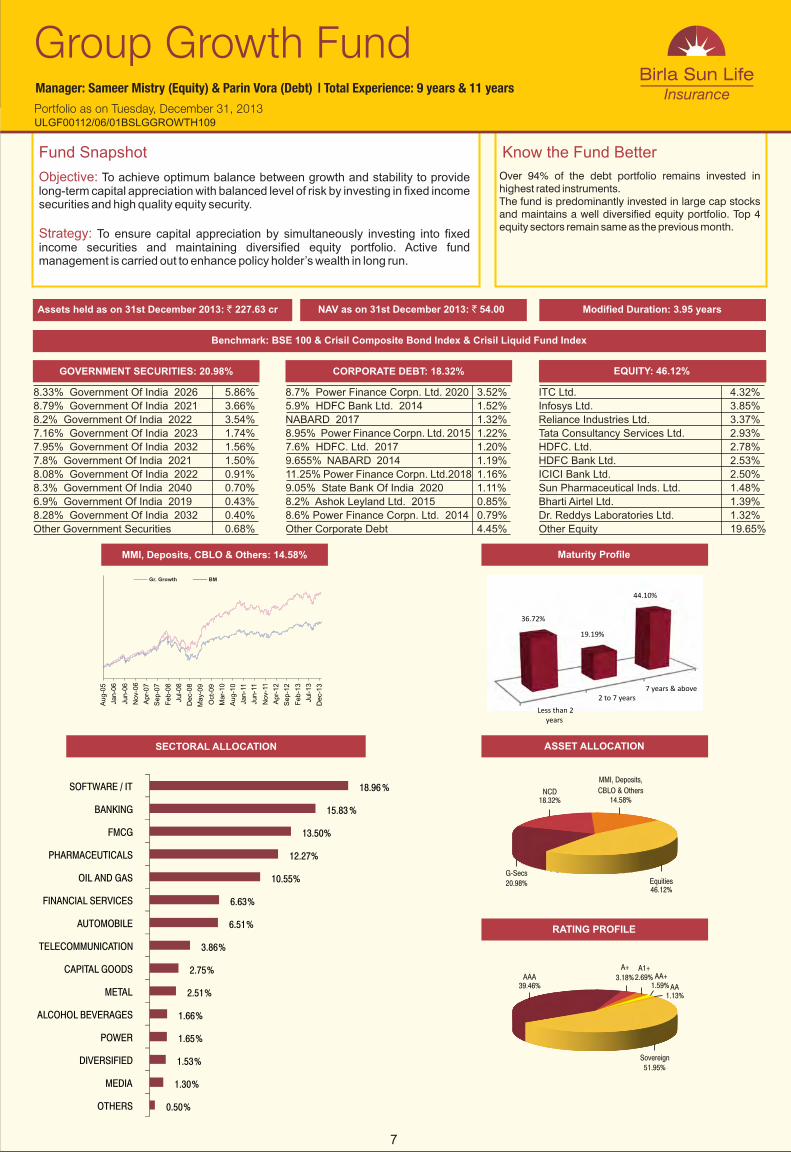
Assets held as on 3: ` 227.63 cr31st December 201
GOVERNMENT SECURITIES: 20.98%
8.33% Government Of India 2026 5.86%
8.79% Government Of India 2021 3.66%
8.2% Government Of India 2022 3.54%
7.16% Government Of India 2023 1.74%
7.95% Government Of India 2032 1.56%
7.8% Government Of India 2021 1.50%
8.08% Government Of India 2022 0.91%
8.3% Government Of India 2040 0.70%
6.9% Government Of India 2019 0.43%
8.28% Government Of India 2032 0.40%
Other Government Securities 0.68%
8.7% Power Finance Corpn. Ltd. 2020 3.52%
5.9% HDFC Bank Ltd. 2014 1.52%
NABARD 2017 1.32%
8.95% Power Finance Corpn. Ltd. 2015 1.22%
7.6% HDFC. Ltd. 2017 1.20%
9.655% 2014 1.19%
11.25% Power Finance Corpn. Ltd.2018 1.16%
9.05% State Bank Of India 2020 1.11%
8.2% Ashok Leyland Ltd. 2015 0.85%
8.6% Power Finance Corpn. Ltd. 2014 0.79%
Other Corporate Debt 4.45%
NABARD
ITC Ltd. 4.32%
Infosys Ltd. 3.85%
Reliance Industries Ltd. 3.37%
Tata Consultancy Services Ltd. 2.93%
HDFC. Ltd. 2.78%
HDFC Bank Ltd. 2.53%
ICICI Bank Ltd. 2.50%
Sun Pharmaceutical Inds. Ltd. 1.48%
Bharti Airtel Ltd. 1.39%
Dr. Reddys Laboratories Ltd. 1.32%
Other Equity 19.65%
RATING PROFILE
Over 94% of the debt portfolio remains invested in highest rated instruments.The fund is predominantly invested in large cap stocks and maintains a well diversified equity portfolio. Top 4 equity sectors remain same as the previous month.
Modified Duration: 3.95 years
EQUITY: 46.12%
NAV as on 31st December 2013: ` 54.00
CORPORATE DEBT: 18.32%
Maturity Profile
ASSET ALLOCATION
MMI, Deposits, CBLO & Others: 14.58%
Gr. Growth BM
SECTORAL ALLOCATION
Objective:
Strategy:
To achieve optimum balance between growth and stability to provide long-term capital appreciation with balanced level of risk by investing in fixed income securities and high quality equity security.
To ensure capital appreciation by simultaneously investing into fixed income securities and maintaining diversified equity portfolio. Active fund management is carried out to enhance policy holder’s wealth in long run.
Fund Snapshot Know the Fund Better
Group Growth FundManager: Sameer Mistry (Equity) & Parin Vora (Debt) | Total Experience: 9 years & 11 years
ULGF00112/06/01BSLGGROWTH109
Benchmark: BSE 100 & Crisil Composite Bond Index & Crisil Liquid Fund Index
Portfolio as on Tuesday, December 31, 2013
51.95%
7
0.50%
1.30%
1.53%
1.65%
1.66%
2.51%
2.75%
3.86%
6.51%
6.63%
10.55%
12.27%
13.50%
15.83 %
18.96 %
OTHERS
MEDIA
DIVERSIFIED
POWER
ALCOHOL BEVERAGES
METAL
CAPITAL GOODS
TELECOMMUNICATION
AUTOMOBILE
FINANCIAL SERVICES
OIL AND GAS
PHARMACEUTICALS
FMCG
BANKING
SOFTWARE / IT
7 years & above2 to 7 years
Less than 2years
44.10%
19.19%
36.72%
NCD18.32%
MMI, Deposits,
CBLO & Others14.58%
46.12%
G-Secs
20.98% Equities
AAA39.46% AA
2.69%A1+
1.13%
A+
3.18% AA+1.59%
Sovereign
Aug-0
5
Jan-0
6
Jun-0
6
Nov-0
6
Apr-
07
Sep-0
7
Feb-0
8
Jul-08
Dec-0
8
May-0
9
Oct-
09
Mar-
10
Aug-1
0
Jan-1
1
Jun-1
1
Nov-1
1
Apr-
12
Sep-1
2
Feb-1
3
Jul-13
Dec-1
3
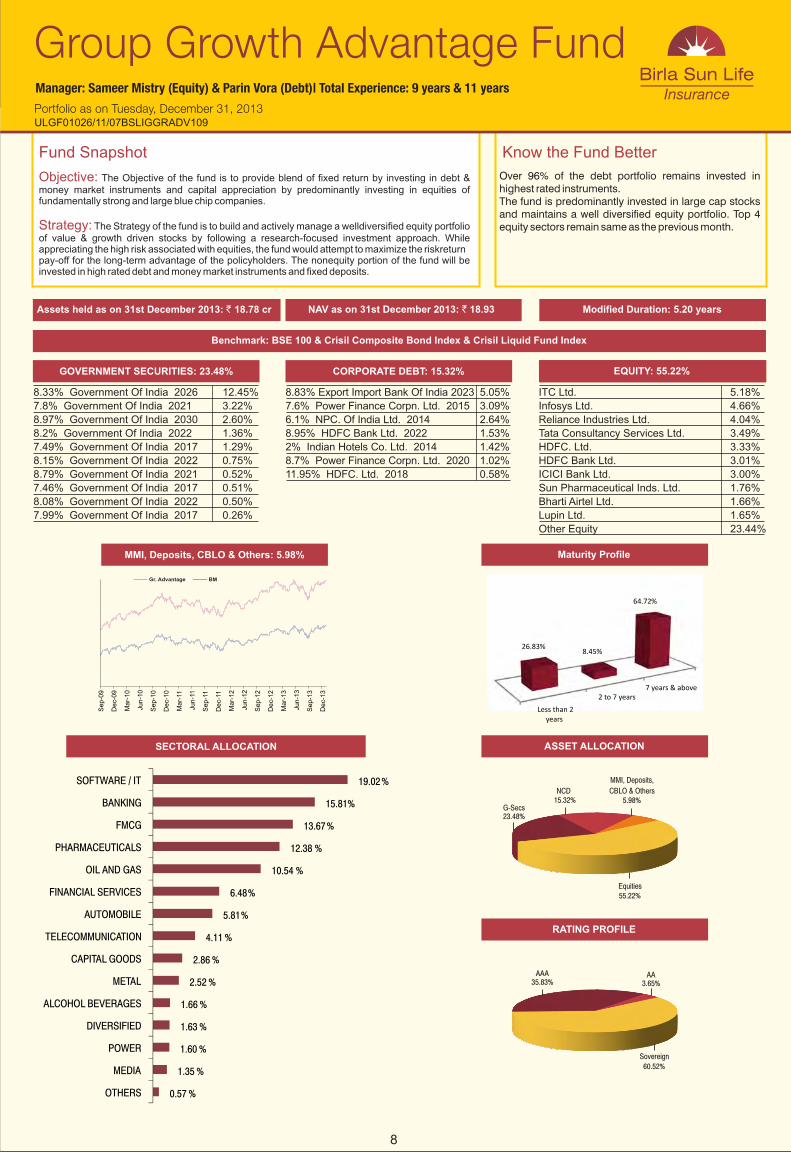
Assets held as on 3: ` 18.78 cr31st December 201
GOVERNMENT SECURITIES: 23.48%
8.33% Government Of India 2026 12.45%
7.8% Government Of India 2021 3.22%
8.97% Government Of India 2030 2.60%
8.2% Government Of India 2022 1.36%
7.49% Government Of India 2017 1.29%
8.15% Government Of India 2022 0.75%
8.79% Government Of India 2021 0.52%
7.46% Government Of India 2017 0.51%
8.08% Government Of India 2022 0.50%
7.99% Government Of India 2017 0.26%
8.83% Export Import Bank Of India 2023 5.05%
7.6% Power Finance Corpn. Ltd. 2015 3.09%
6.1% NPC. Of India Ltd. 2014 2.64%
8.95% HDFC Bank Ltd. 2022 1.53%
2% Indian Hotels Co. Ltd. 2014 1.42%
8.7% Power Finance Corpn. Ltd. 2020 1.02%
11.95% HDFC. Ltd. 2018 0.58%
ITC Ltd. 5.18%
Infosys Ltd. 4.66%
Reliance Industries Ltd. 4.04%
Tata Consultancy Services Ltd. 3.49%
HDFC. Ltd. 3.33%
HDFC Bank Ltd 3.01%
ICICI Bank Ltd. 3.00%
Sun Pharmaceutical Inds. Ltd. 1.76%
Bharti Airtel Ltd. 1.66%
Lupin Ltd. 1.65%
Other Equity 23.44%
.
RATING PROFILE
Over 96% of the debt portfolio remains invested in highest rated instruments.The fund is predominantly invested in large cap stocks and maintains a well diversified equity portfolio. Top 4 equity sectors remain same as the previous month.
Modified Duration: 5.20 years
EQUITY: 55.22%
NAV as on 31st December 2013: ` 18.93
CORPORATE DEBT: 15.32%
Maturity Profile
ASSET ALLOCATION
MMI, Deposits, CBLO & Others: 5.98%
Gr. Advantage BM
SECTORAL ALLOCATION
Objective:
Strategy:
The Objective of the fund is to provide blend of fixed return by investing in debt & money market instruments and capital appreciation by predominantly investing in equities of fundamentally strong and large blue chip companies.
The Strategy of the fund is to build and actively manage a welldiversified equity portfolio of value & growth driven stocks by following a research-focused investment approach. While appreciating the high risk associated with equities, the fund would attempt to maximize the riskreturnpay-off for the long-term advantage of the policyholders. The nonequity portion of the fund will be invested in high rated debt and money market instruments and fixed deposits.
Fund Snapshot Know the Fund Better
Group Growth Advantage FundManager: Sameer Mistry (Equity) & Parin Vora (Debt) | Total Experience: 9 years & 11 years
ULGF01026/11/07BSLIGGRADV109
Benchmark: BSE 100 & Crisil Composite Bond Index & Crisil Liquid Fund Index
Portfolio as on Tuesday, December 31, 2013
8
0.57 %
1.35 %
1.60 %
1.63 %
1.66 %
2.52 %
2.86 %
4.11 %
5.81%
6.48%
10.54 %
12.38 %
13.67 %
15.81%
19.02 %
OTHERS
MEDIA
POWER
DIVERSIFIED
ALCOHOL BEVERAGES
METAL
CAPITAL GOODS
TELECOMMUNICATION
AUTOMOBILE
FINANCIAL SERVICES
OIL AND GAS
PHARMACEUTICALS
FMCG
BANKING
SOFTWARE / IT
7 years & above2 to 7 years
Less than 2years
64.72%
8.45% 26.83%
NCD15.32%
MMI, Deposits,
CBLO & Others5.98%
G-Secs23.48%
55.22%Equities
AA3.65%
AAA35.83%
Sovereign60.52%
Sep-0
9
Dec-
09
Mar-
10
Jun-1
0
Sep-1
0
Dec-
10
Mar-
11
Jun-1
1
Sep-1
1
Dec-
11
Mar-
12
Jun-1
2
Sep-1
2
Dec-
12
Mar-
13
Jun-1
3
Sep-1
3
Dec-
13

Assets held as on 3: ` 267.13 cr31st December 201
100% of the fund is invested in highest rated instruments.The fund continues to maintain very low maturity profile.
Modified Duration: 0.30 yearsNAV as on 31st December 2013: ` 22.27
Objective:
Strategy:
The primary objective of this BSLI Fund Option is to provide reasonable returns, at a high level of safety and liquidity for capital conservation for the Policyholder
The strategy of this BSLI Fund Option is to make judicious investments in high quality debt and money market instruments to protect capital of the Policyholder with very low level of risk.
Fund Snapshot Know the Fund Better
Group Money Market FundManager: Devendra Singhvi | Total Experience: 12 years
ULGF00824/08/04BSLIGRMMKT109
Benchmark: CRISIL Liquid Fund Index
Portfolio as on Tuesday, December 31, 2013
9
Maturity Profile
Less than 2 years
100.00%
ASSET ALLOCATION
MMI, Deposits,
CBLO & Others100.00%
RATING PROFILE
A1+100.00%
MMI, Deposits, CBLO & Others: 100.00%
MM BM
Se
p-0
9
De
c-0
9
Ma
r-1
0
Jun
-10
Se
p-1
0
De
c-1
0
Ma
r-11
Jun
-11
Se
p-1
1
De
c-11
Ma
r-1
2
Jun
-12
Se
p-1
2
De
c-1
2
Ma
r-1
3
Jun
-13
Se
p-1
3
De
c-1
3
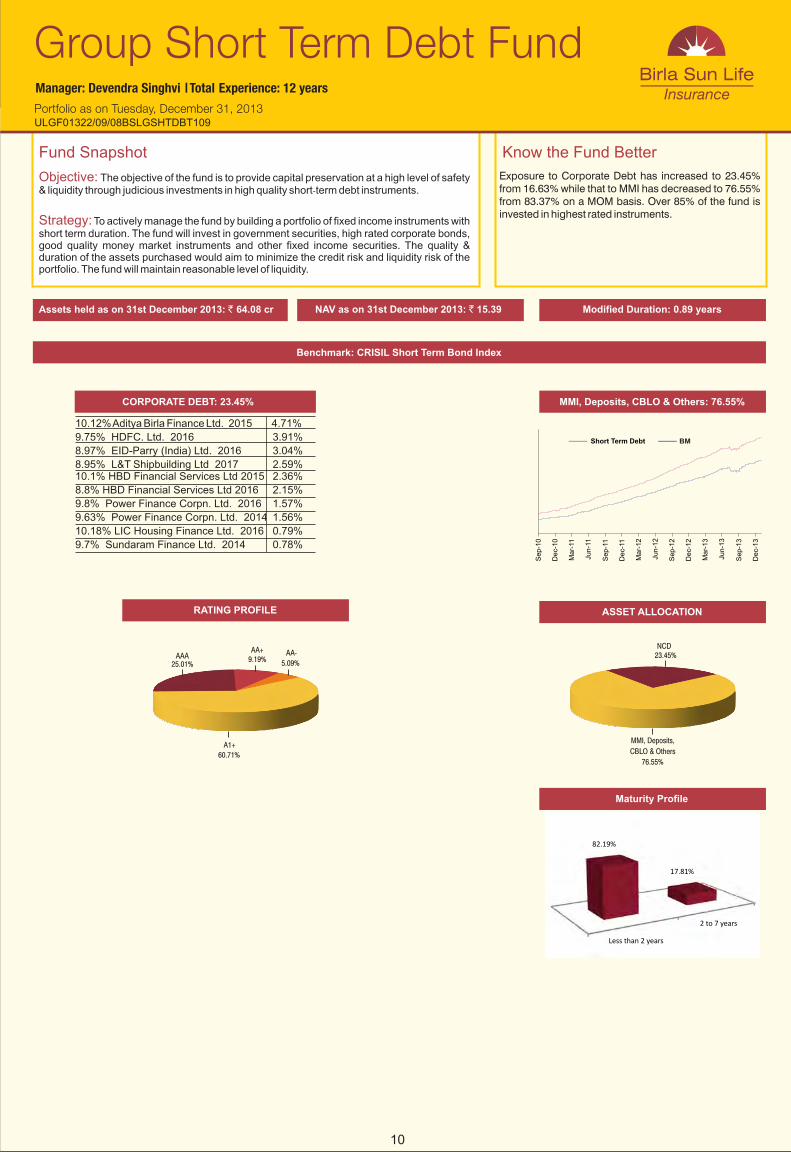
Exposure to Corporate Debt has increased to 23.45% from 16.63% while that to MMI has decreased to 76.55% from 83.37% on a MOM basis. Over 85% of the fund is invested in highest rated instruments.
CORPORATE DEBT: 23.45%
10.12% Aditya Birla Finance Ltd. 2015 4.71%
9.75% HDFC. Ltd. 2016 3.91%
8.97% EID-Parry (India) Ltd. 2016 3.04%
8.95% L&T Shipbuilding Ltd 2017 2.59%10.1% HBD Financial Services Ltd 2015 2.36%
8.8% HBD Financial Services Ltd 2016 2.15%
9.8% Power Finance Corpn. Ltd. 2016 1.57%
9.63% Power Finance Corpn. Ltd. 2014 1.56%
10.18% LIC Housing Finance Ltd. 2016 0.79%
9.7% Sundaram Finance Ltd. 2014 0.78%
NAV as on 31st December 2013: ` 15.39
MMI, Deposits, CBLO & Others: 76.55%
Benchmark: CRISIL Short Term Bond Index
Objective:
Strategy:
The objective of the fund is to provide capital preservation at a high level of safety & liquidity through judicious investments in high quality short‐term debt instruments.
To actively manage the fund by building a portfolio of fixed income instruments with short term duration. The fund will invest in government securities, high rated corporate bonds, good quality money market instruments and other fixed income securities. The quality & duration of the assets purchased would aim to minimize the credit risk and liquidity risk of the portfolio. The fund will maintain reasonable level of liquidity.
Fund Snapshot Know the Fund Better
Group Short Term Debt FundManager: Devendra Singhvi | Total Experience: 12 years
ULGF01322/09/08BSLGSHTDBT109
Assets held as on 3: ` 64.08 cr31st December 201 Modified Duration: 0.89 years
Portfolio as on Tuesday, December 31, 2013
10
Maturity Profile
ASSET ALLOCATION
NCD23.45%
RATING PROFILE
BMShort Term Debt
2 to 7 years
Less than 2 years
17.81%
82.19%
MMI, Deposits,
CBLO & Others
76.55%
A1+60.71%
AA-
5.09%
AA+9.19%AAA
25.01%
Sep-1
0
Dec-1
0
Mar-
11
Jun-1
1
Sep-1
1
Dec-1
1
Mar-
12
Jun-1
2
Sep-1
2
Dec-1
2
Mar-
13
Jun-1
3
Sep-1
3
Dec-1
3
Assets held as on 3: ` 34.00 cr31st December 201
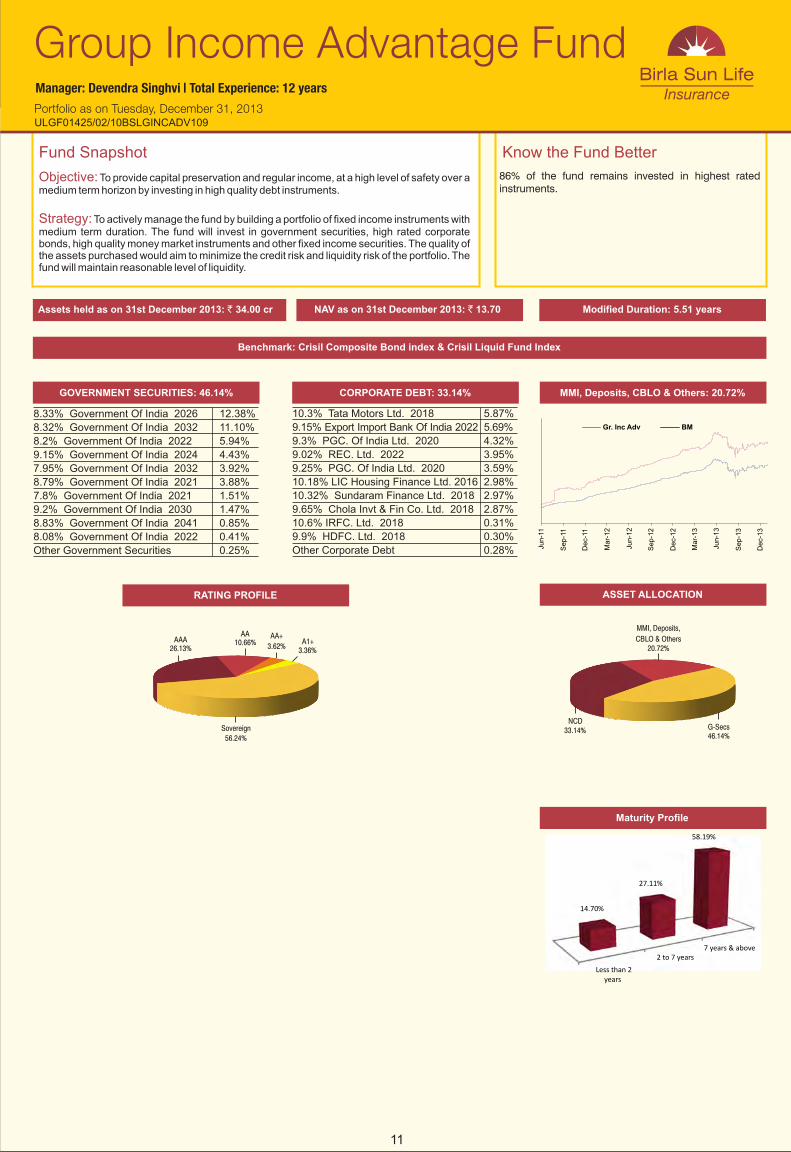
86% of the fund remains invested in highest rated instruments.
Modified Duration: 5.51 yearsNAV as on 31st December 2013: ` 13.70
10.3% Tata Motors Ltd. 2018 5.87%
9.15% Export Import Bank Of India 2022 5.69%
9.3% PGC. Of India Ltd. 2020 4.32%
9.02% REC. Ltd. 2022 3.95%
9.25% PGC. Of India Ltd. 2020 3.59%
10.18% LIC Housing Finance Ltd. 2016 2.98%
10.32% Sundaram Finance Ltd. 2018 2.97%
9.65% Chola Invt & Fin Co. Ltd. 2018 2.87%
10.6% IRFC. Ltd. 2018 0.31%
9.9% HDFC. Ltd. 2018 0.30%
Other Corporate Debt 0.28%
CORPORATE DEBT: 33.14%
Benchmark: Crisil Composite Bond index & Crisil Liquid Fund Index
Objective:
Strategy:
To provide capital preservation and regular income, at a high level of safety over a medium term horizon by investing in high quality debt instruments.
To actively manage the fund by building a portfolio of fixed income instruments with medium term duration. The fund will invest in government securities, high rated corporate bonds, high quality money market instruments and other fixed income securities. The quality of the assets purchased would aim to minimize the credit risk and liquidity risk of the portfolio. The fund will maintain reasonable level of liquidity.
Fund Snapshot Know the Fund Better
Group Income Advantage FundManager: Devendra Singhvi | Total Experience: 12 years
ULGF01425/02/10BSLGINCADV109
Portfolio as on Tuesday, December 31, 2013
Maturity Profile
ASSET ALLOCATIONRATING PROFILE
AA+
3.62%
GOVERNMENT SECURITIES: 46.14%
8.33% Government Of India 2026 12.38%
8.32% Government Of India 2032 11.10%
8.2% Government Of India 2022 5.94%
9.15% Government Of India 2024 4.43%
7.95% Government Of India 2032 3.92%
8.79% Government Of India 2021 3.88%
7.8% Government Of India 2021 1.51%
9.2% Government Of India 2030 1.47%
8.83% Government Of India 2041 0.85%
8.08% Government Of India 2022 0.41%
Other Government Securities 0.25%
MMI, Deposits, CBLO & Others: 20.72%
Gr. Inc Adv BM
11
7 years & above2 to 7 years
Less than 2years
58.19%
27.11%
14.70%
NCD
46.14%G-Secs33.14%
20.72%
MMI, Deposits,
CBLO & OthersAAA26.13%
A1+3.36%
AA10.66%
56.24%Sovereign
Ju
n-1
1
Se
p-1
1
De
c-1
1
Ma
r-1
2
Ju
n-1
2
Se
p-1
2
De
c-1
2
Ma
r-1
3
Ju
n-1
3
Se
p-1
3
De
c-1
3

Assets held as on 3: ` 6.16 cr31st December 201
Exposure to G-Secs has decreased to 92.91% from % while that to MMI has increased to 7.09% from
6.17% on a MOM basis.93.83
Modified Duration: 7.12 yearsNAV as on 31st December 2013: ` 17.68
Objective:
Strategy:
The fund aims to deliver safe and consistent returns over along-term period by investing in Government Securities.
Active fund management at very low level of risk by having entire exposure to government securities & money market instruments, maintaining medium term duration of the portfolio to achieve capital conservation.
Fund Snapshot Know the Fund Better
Group Gilt FundManager: Devendra Singhvi | Total Experience: 12 years
ULGF00630/05/03BSLIGRGILT109
GOVERNMENT SECURITIES: 92.91%
8.35% Government Of India 2022 15.33%
8.28% Government Of India 2032 14.88%
9.15% Government Of India 2024 13.05%
8.33% Government Of India 2026 11.40%
8.79% Government Of India 2021 9.54%
9.2% Government Of India 2030 8.12%
8.15% Government Of India 2022 7.65%
8.28% Government Of India 2027 7.53%
8.83% Government Of India 2041 3.90%
7.5% Government Of India 2034 1.36%
Other Government Securities 0.15%
MMI, Deposits, CBLO & Others: 7.09%
Maturity Profile
ASSET ALLOCATION
Portfolio as on Tuesday, December 31, 2013
RATING PROFILE
Sovereign100.00%
12
7 years & above
Less than 2 years
94.74%
5.26%
MMI, Deposits,
CBLO & Others
7.09%
92.91%G-Secs
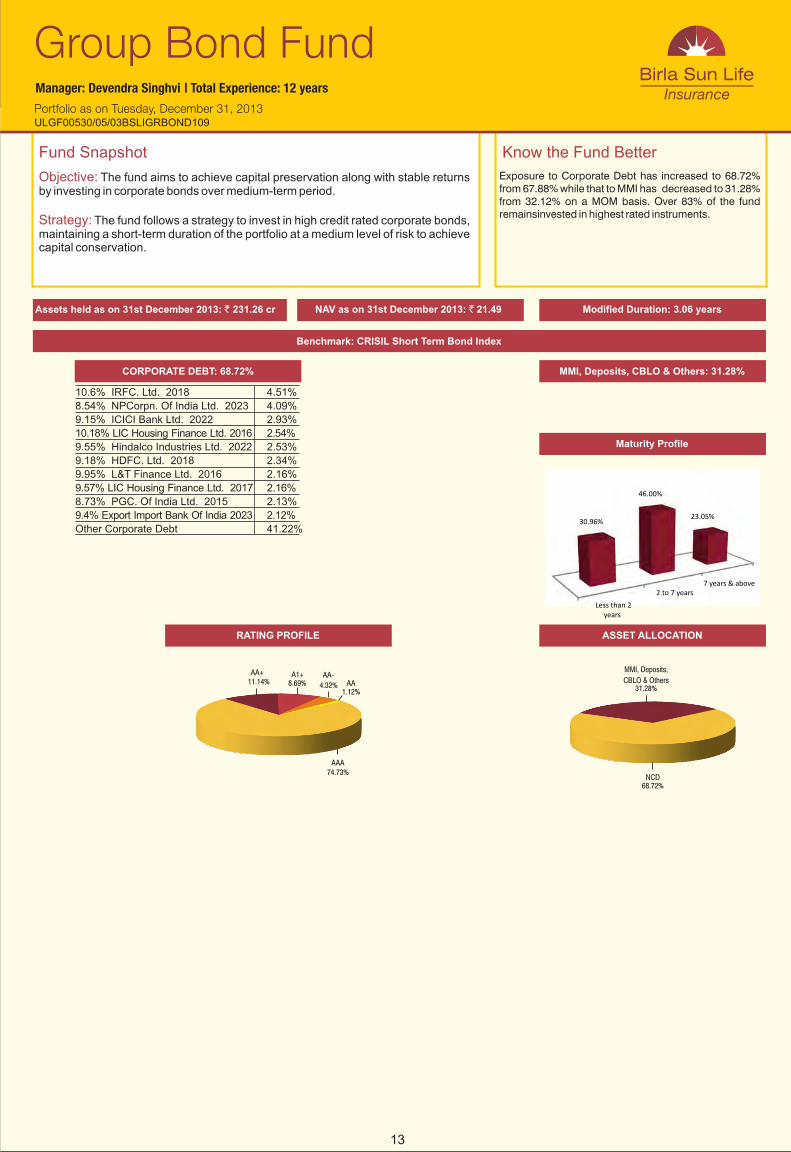
Assets held as on 3: ` 231.26 cr31st December 201
Exposure to Corporate Debt has increased to 68.72% from 67.88% while that to MMI has decreased to 31.28% from 32.12% on a MOM basis. Over 83% of the fund remainsinvested in highest rated instruments.
Modified Duration: 3.06 yearsNAV as on 31st December 2013: ` 21.49
Objective:
Strategy:
The fund aims to achieve capital preservation along with stable returns by investing in corporate bonds over medium-term period.
The fund follows a strategy to invest in high credit rated corporate bonds, maintaining a short-term duration of the portfolio at a medium level of risk to achieve capital conservation.
Fund Snapshot Know the Fund Better
Group Bond FundManager: Devendra Singhvi | Total Experience: 12 years
ULGF00530/05/03BSLIGRBOND109
CORPORATE DEBT: 68.72%
10.6% IRFC. Ltd. 2018 4.51%
8.54% NPCorpn. Of India Ltd. 2023 4.09%
9.15% ICICI Bank Ltd. 2022 2.93%
10.18% LIC Housing Finance Ltd. 2016 2.54%
9.55% Hindalco Industries Ltd. 2022 2.53%
9.18% HDFC. Ltd. 2018 2.34%
9.95% L&T Finance Ltd. 2016 2.16%
9.57% LIC Housing Finance Ltd. 2017 2.16%
8.73% PGC. Of India Ltd. 2015 2.13%
9.4% Export Import Bank Of India 2023 2.12%
Other Corporate Debt 41.22%
MMI, Deposits, CBLO & Others: 31.28%
Benchmark: CRISIL Short Term Bond Index
Maturity Profile
Portfolio as on Tuesday, December 31, 2013
13
ASSET ALLOCATIONRATING PROFILE
AAA74.73%
7 years & above2 to 7 years
Less than 2years
23.05%
46.00%
30.96%
MMI, Deposits,
CBLO & Others31.28%
NCD68.72%
11.14%AA+ AA-
4.32% AA1.12%
A1+8.69%

Assets held as on 3: ` 488.54 cr31st December 201
Exposure to Corporate Debt has slightly decreased to 28.64% from 28.65%, to G-Secs it has decreased to 40.02% from 41.64% and to MMI, it has increased to 31.33% from 29.71% on a MOM basis. Over 92% of the fund remains invested in highest rated instruments.
Modified Duration: 4.62 yearsNAV as on 31st December 2013: ` 24.78
Objective:
Strategy:
The Fixed Interest Fund, with full exposure in debt market instrument, aims to achieve value creation at low risk over a long-term horizon by investing into high quality fixed interest securities.
The strategy is to actively manage the fund at a medium level of risk by having entire exposure to government securities, corporate bonds maintaining medium to long-term duration of the portfolio to achieve capital conservation.
Fund Snapshot Know the Fund Better
Group Fixed Interest FundManager: Devendra Singhvi | Total Experience: 12 years
ULGF00416/07/02BSLGFIXINT109
GOVERNMENT SECURITIES: 40.02%
8.33% Government Of India 2026 7.85%
7.8% Government Of India 2021 5.53%
7.16% Government Of India 2023 4.49%
8.28% Government Of India 2032 3.51%
8.32% Government Of India 2032 3.02%
8.2% Government Of India 2022 2.51%
8.97% Government Of India 2030 2.10%
8.83% Government Of India 2023 2.05%
9.2% Government Of India 2030 1.64%
8.83% Government Of India 2041 1.52%
Other Government Securities 5.81%
9.95% State Bank Of India 2026 2.44%
9.64% PGC. Of India Ltd. 2021 2.04%
9.4% Export Import Bank Of India 2023 2.01%
9.55% Hindalco Industries Ltd. 2022 1.79%
8.7% Power Finance Corpn. Ltd. 2020 1.56%
8.95% Power Finance Corpn. Ltd. 2018 1.56%
10.6% IRFC. Ltd. 2018 1.07%
10.32% Sundaram Finance Ltd. 2018 1.03%
9.8% Power Finance Corpn. Ltd. 2016 1.03%
10.3% Tata Motors Ltd. 2018 1.02%
Other Corporate Debt 13.10%
CORPORATE DEBT: 28.64%
Maturity Profile
ASSET ALLOCATION
Benchmark: Crisil Composite Bond index & Crisil Liquid Fund Index
MMI, Deposits, CBLO & Others: 31.33%
Portfolio as on Tuesday, December 31, 2013
14
RATING PROFILE
AAA31.17%
53.70%Sovereign
5.00%AA+
7.87%A1+
AA2.23%
0.03%AA-
FIF BM
7 years & above2 to 7 years
Less than 2years
57.17%
15.93% 26.90%
NCD28.64%
MMI, Deposits,
CBLO & Others 40.02%G-Secs
31.33%
Au
g-0
5
Jan
-06
Jun
-06
No
v-0
6
Ap
r-0
7
Se
p-0
7
Fe
b-0
8
Jul-0
8
De
c-0
8
Ma
y-0
9
Oct
-09
Ma
r-1
0
Au
g-1
0
Jan
-11
Jun
-11
No
v-11
Ap
r-1
2
Se
p-1
2
Fe
b-1
3
Jul-1
3
De
c-1
3