Embed Size (px)
Citation preview
Research Report ETS RR-13-34
Investigating 10-Year Trends of Learning Outcomes at Community Colleges
Ou Lydia Liu
Katrina Crotts Roohr
December 2013
ETS Research Report Series
EIGNOR EXECUTIVE EDITOR James Carlson
Principal Psychometrician
ASSOCIATE EDITORS
Beata Beigman Klebanov Research Scientist
Heather Buzick Research Scientist
Brent Bridgeman Distinguished Presidential Appointee
Keelan Evanini Managing Research Scientist
Marna Golub-Smith Principal Psychometrician
Shelby Haberman Distinguished Presidential Appointee
Gary Ockey Research Scientist
Donald Powers Managing Principal Research Scientist
Gautam Puhan Senior Psychometrician
John Sabatini Managing Principal Research Scientist
Matthias von Davier Director, Research
Rebecca Zwick Distinguished Presidential Appointee
PRODUCTION EDITORS
Kim Fryer Manager, Editing Services
Ruth Greenwood Editor
Since its 1947 founding, ETS has conducted and disseminated scientific research to support its products and services, and to advance the measurement and education fields. In keeping with these goals, ETS is committed to making its research freely available to the professional community and to the general public. Published accounts of ETS research, including papers in the ETS Research Report series, undergo a formal peer-review process by ETS staff to ensure that they meet established scientific and professional standards. All such ETS-conducted peer reviews are in addition to any reviews that outside organizations may provide as part of their own publication processes. Peer review notwithstanding, the positions expressed in the ETS Research Report series and other published accounts of ETS research are those of the authors and not necessarily those of the Officers and Trustees of Educational Testing Service.
The Daniel Eignor Editorship is named in honor of Dr. Daniel R. Eignor, who from 2001 until 2011 served the Research and Development division as Editor for the ETS Research Report series. The Eignor Editorship has been created to recognize the pivotal leadership role that Dr. Eignor played in the research publication process at ETS.
Investigating Ten-Year Trends of Learning Outcomes at Community Colleges
Ou Lydia Liu and Katrina Crotts Roohr
Educational Testing Service, Princeton, New Jersey
December 2013

Find other ETS-published reports by searching the ETS ReSEARCHER
database at http://search.ets.org/researcher/
To obtain a copy of an ETS research report, please visit
http://www.ets.org/research/contact.html
Action Editor: Donald M. Powers
Reviewers: Brigid Finn and Ross Markle
Copyright © 2013 by Educational Testing Service. All rights reserved.
ETS, the ETS logo, and LISTENING. LEARNING. LEADING. are registered trademarks of Educational Testing Service (ETS).
SAT is a registered trademark of the College Board.
i
Abstract
Community colleges currently enroll about 44% of the undergraduate students in the United
States and are rapidly expanding. It is of critical importance to obtain direct evidence of student
learning to see if students receive adequate training at community colleges. This study
investigated the 10-year trends of community college students’ (n = 46,403) performance in
reading, writing, mathematics, and critical thinking, as assessed by the ETS® Proficiency Profile
(EPP), an assessment of college-level learning outcomes. Results showed that community
college students caught up with and significantly outperformed students from liberal arts colleges
by the end of the 10-year period and made significant improvement in critical-thinking skills. An
increasing gender gap was observed in mathematics at community colleges. Prevalent ethnic
minority and English as a second language (ESL) gaps were noted but gaps between ESL and
non-ESL students and between Hispanic and White students were decreasing. Additionally,
Asian students at community colleges showed an overall decline in performance. Findings from
this study provide significant implications for community college leaders, researchers, and
policymakers.
Key words: community college, ETS Proficiency Profile, EPP, higher education, learning
outcomes assessment
ii
Table of Contents
Page
Literature Review............................................................................................................................ 2
Method ............................................................................................................................................ 6
Instrument ................................................................................................................................ 6
Participants .............................................................................................................................. 6
Analyses ................................................................................................................................... 9
Results ........................................................................................................................................... 10
Community Colleges’ Performance in Comparison to Other Types of Institutions ............. 10
Trends and Gaps .................................................................................................................... 15
Factors Predicting Performance ............................................................................................. 21
Concurrent Validity of the EPP ............................................................................................. 21
Discussion and Implications ......................................................................................................... 28
Comparison of Community Colleges to Other Types of Institutions .................................... 28
Consistent Improvement in Critical Thinking ....................................................................... 31
Gender Gap in Mathematics Performance ............................................................................. 32
Performance Gap Disfavoring Ethnic and Language Minority Students .............................. 33
Declining Asian Student Performance ................................................................................... 34
Limitations ............................................................................................................................. 35
Conclusions............................................................................................................................ 36
References ..................................................................................................................................... 38
iii
List of Tables
Page
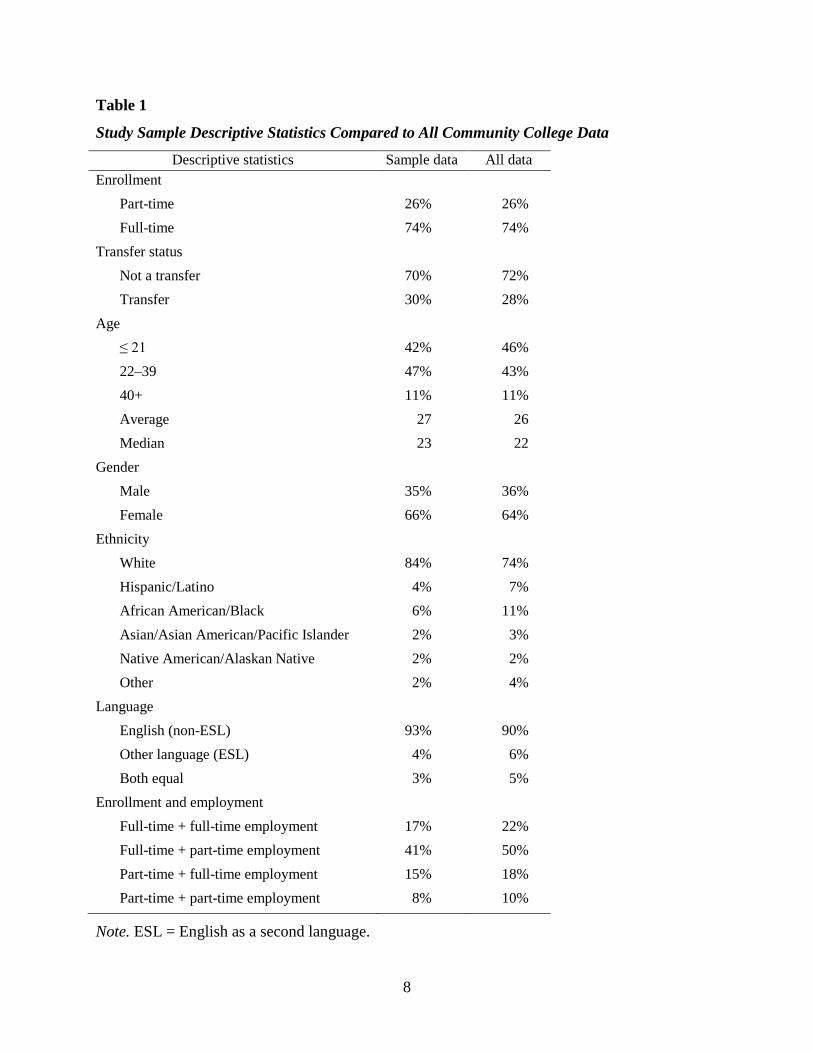
Table 1. Study Sample Descriptive Statistics Compared to All Community College Data .......... 8
Table 2. Ability of Incoming Students Over 10 Years ................................................................ 14
Table 3. Community College Regression Results ....................................................................... 23
iv
List of Figures
Page
Figure 1. Institutional performance differences on total score controlling for credit hours. ...... 11
Figure 2. Institutional performance differences on four subscales controlling for credit hours.. 13
Figure 3. Credit hours by total score for liberal arts and community colleges.. ......................... 15
Figure 4. EPP scores for 2001–2010 by gender. ......................................................................... 16
Figure 5. EPP subscale scores for 2001–2010 by gender. .......................................................... 17
Figure 6. Total EPP scores for 2001–2010 by language group. ................................................. 18
Figure 7. EPP subscale scores for 2001–2010 by language group. ............................................ 19
Figure 8. Total EPP scores for 2001–2010 by ethnicity.. ........................................................... 20
Figure 9. EPP subscale scores for 2001–2010 by ethnicity.. ...................................................... 22
Figure 10. Total EPP scores for 2001–2010 by GPA.. ................................................................. 24
Figure 11. EPP subscale scores for 2001–2010 by GPA. ............................................................. 25
Figure 12. Total EPP scores for 2001–2010 by credit hours. ....................................................... 26
Figure 13. EPP subscale scores for 2001–2010 by credit hours. .................................................. 27
Figure 14. College enrollment by 2- and 4-year institutions.. ...................................................... 30
1
Community colleges enroll about 44% of the undergraduate students in the United States.
In 2012 there were 1,132 community colleges in the United States, providing education to about
eight million for-credit students and 13 million noncredit students (American Association of
Community Colleges [AACC], 2012a). The estimated increase in enrollment was about 2.9%
from 2009 to 2011 (AACC, 2012a). Furthermore, to ensure that by 2020 about 60% of
Americans hold a higher education degree, the United States needs to educate an additional eight
million students with an associate’s degree or higher; most will be educated at community
colleges (Kelly, 2010). Given the critical role community colleges play in America’s strategic
plan for higher education, it is of upmost importance to evaluate student learning outcomes to see
if community colleges provide adequate support to students as they progress through their
educational pathways.
Evaluation of student learning outcomes at community colleges has received national
attention for the last several years. For example, AACC initiated the Voluntary Framework of
Accountability (VFA; http://vfa.aacc.nche.edu/Pages/default.aspx), the first comprehensive
national accountability system created for community colleges (AACC, 2012b). VFA aims to
provide a common ground for community colleges to assess learning and ensure quality and to
provide a benchmark for national comparison.
Despite the emerging efforts to evaluate learning at community colleges, very few studies
have provided direct, empirical results of student learning comparable across community
colleges. Furthermore, little is known about how students at community colleges compare to
peers at other types of institutions in terms of learning outcomes. Without objective data, it is
difficult to evaluate whether specific changes in the curriculum or policy are effective in
improving student outcomes. In addition, it is important to understand how community college
students stand in terms of core college-level skills among themselves or as compared to peers at
4-year institutions.
This study attempts to fill the void by investigating the performance of students from a
relatively small number of community colleges (N = 13) over the course of 10 years in critical
thinking, reading, writing, and quantitative skills. Although the findings of this study may not
generalize to all community colleges in the United States, we hope that they will provide insight
into how students have performed over the last 10 years with regard to necessary skills for the
21st century workforce. We also hope that this study will serve as an impetus for researchers and
2
practitioners to focus more on demonstrating direct evidence of learning at community colleges.
In-depth analyses were conducted for subgroups such as gender, ethnicity, and language.
Comparisons were also provided between community colleges and 4-year institutions. Four
primary research questions were addressed:
1. How do community college students perform as compared to students at other types
of institutions over the last 10 years?
2. What are the trends of 10-year performance by gender, ethnicity, and language groups
at community colleges?
3. What factors predict community college students’ performance on learning outcomes
assessment?
4. What is the relationship between community college students’ performance on
learning outcomes assessment, their college grade point average (GPA), and credit
hours?
Literature Review
Despite the abundant literature on learning outcomes for 4-year college students, such
studies are scarce for community college students. When evaluating the success of community
college students, most prior studies have focused on indicators such as graduation rates,
retention, transfer, or student engagement, rather than on direct student learning outcomes.
When examining graduation at community colleges, a commonly referred to measure is
the graduation rate within 150% of the time in which students are expected to complete a degree.
Researchers have investigated the factors that are associated with graduation rates. For example,
Hyers and Zimmerman (2002) analyzed 7-year data at a community college and found that both
high-school rank and first-quarter GPA in college are significant predictors of graduation within
3 years. Realizing the heterogeneity in institutional characteristics such as location, size,
expenditure, and student composition, researchers also analyzed the effect of such characteristics
on graduation rates. Findings indicated that colleges serving students with better academic
preparation, from wealthier families, and with a higher percentage of full-time students had
higher graduation rates (Mortenson, 1997; Pascarella & Terenzini, 1991). Large community
colleges (i.e., with more than 2,500 full-time students) tended to have lower graduation rates than
smaller community colleges (Astin, Tsui, & Avalos, 1996; Bailey, Calcagno, Jenkins, Leinbach,
& Kienzl, 2006). In addition, community colleges with larger proportions of part-time faculty
3
and minority students tended to have lower graduation rates (Bailey, Calcagno, Jenkins, Kienzl,
& Leinbach, 2005; Bailey, Jenkins, & Leinbach, 2005). Findings from other studies suggest that
graduation rates were also positively affected by academic expenditures (Astin, 1993; Ryan,
2004).
Researchers have used psychological, socio-demographic, situational, and academic
preparation factors to predict retention and transferring (Allen, Robbins, Casillas, & Oh, 2008;
Fischer, 2007; Napoli & Wortman, 1998; Porchea, Allen, Robbins, & Phelps, 2010; Tinto,
1993). Community colleges have been a pipeline for 4-year institutions. In fact, 36% of students
enrolling at community colleges intended to transfer to a 4-year institution (Provasnik & Planty,
2008). In addition, 15% intended to transfer to another 2-year college. Porchea et al. (2010)
tracked approximately 4,500 entering students at 21 community colleges for 5 years. The
researchers collected data on academic preparation (e.g., high school grades and standardized
test scores), psychosocial factors (e.g., motivation), demographic variables, and situational
factors (e.g., degree expectations, number of hours working). They also collected information on
five types of outcomes, including combinations of earning a degree or certificate, transferring to
a 4-year institution, and enrolling at a community college during a fifth year. Through a
multinomial logit model (Agresti, 1990), they found that 48% of the students dropped out,
without earning a degree, transferring to a 4-year institution, or enrolling at any other institution.
Academic preparation and motivation significantly predicted transfer. Academic discipline
predicted degree attainment, regardless of transfer. African American students were less likely to
obtain a degree than to drop out. Studies also reported that for African American students, high
school preparation, college GPA, number of credits hours required for degree, and financial
resources were significant predictors of retention (Cofer & Somers, 2000; Hagedorn, Maxwell,
& Hampton, 2001). Similarly, for Hawaiian students at community colleges, college cumulative
GPA and financial aid also significantly predicted their retention (Makaukane-Drechsel &
Hagedorn, 2000). Robbins, Allen, Casillas, Peterson, and Le (2006) found that gender
differences in retention tend to be small.
Another frequently used outcome is student self-report engagement. Engagement refers
to students’ involvement in a broad range of educational and social activities on a college
campus (Pascarella & Terenzini, 2005). The Community College Survey of Student Engagement
(CCSSE) is a survey used widely to elicit students’ perceived engagement on five dimensions:
4
active and collaborative learning, student effort, academic challenge, student-faculty interaction,
and support for learners (Marti, 2009; McClenney, 2007). Through a latent analysis with multi-
institutional samples, Marti (2009) found that full-time students were more engaged than other
students on CCSSE dimensions such as class assignment, collaborative learning, information
technology, and student services.
Although outcomes such as student engagement levels and rates of graduation, retention,
and transfer are important indicators of the quality of community colleges, they provide little
direct information about actual student learning, which is normally demonstrated through
assessment. In addition to the pressure from national initiatives, which stress the importance of
assessment, accreditors have also begun demanding that colleges demonstrate direct evidence of
learning for accountability and transparency purposes. Provezis (2010) reported that the most
common deficiency in institutional evaluations lies in the inadequate assessment of student
learning outcomes. Evidence from the Commission on Colleges for the Southern Association of
Colleges and Schools, a regional accrediting organization, suggests that 70% of colleges in the
organization failed to articulate a set of expected learning outcomes and lacked a mechanism to
evaluate the achievement of such outcomes (Head & Johnson, 2011; Nunley, Bers, & Manning,
2011). In fact, satisfying accreditation requirements was the number one factor influencing
community colleges’ decisions to assess learning outcomes, followed by strategic planning
(Nunley et al., 2011).
To assess student learning outcomes, many community colleges have turned to
standardized measures such as the ETS® Proficiency Profile (EPP; previously known as the
MAPP), the Collegiate Learning Assessment, and the Collegiate Assessment of Academic
Proficiency. A national institutional survey reported that 28% of community colleges used one of
the standardized measures for program evaluation or accountability purposes, a figure that was
nearly 10% higher than the national higher education average of 19% (Kuh & Ikenberry, 2009).
Other colleges used general rubrics or course-specific tests, such as the Major Field Tests
(Nunley et al., 2011).
Despite the pervasive use of standardized measures, very few studies have obtained
results from these standardized measures that are comparable across community colleges. Lakin,
Elliott, and Liu (2012) analyzed the performance of college students who spoke English as a
second language (ESL) and non-ESL students on the EPP. They found that the non-ESL students

5
significantly outperformed the ESL students in all four general domains (critical thinking,
reading, writing, and mathematics). The largest performance gap occurred in reading, where the
standardized mean difference was 0.44; in contrast, the smallest performance gap was in
mathematics (0.18 SD). The Lakin et al. (2012) study included students from both 4-year
institutions and community colleges. However, since the analyses were conducted at the
aggregate level, it is unknown whether the findings would be upheld if community colleges were
considered a stand-alone group. Focusing on critical thinking, communication, and cultural
diversity skills, Calhoun Community College (CCC) used the Collegiate Assessment of
Academic Proficiency to measure the learning outcomes of its students. The CCC’s 2012 report
showed that 55% of the students performed below the national mean on the critical-thinking
section (Calhoun Community College [CCC], 2012); however, this was an improvement from
the 2009/2010 assessment results. Furthermore, the percentage of students who scored above the
national mean in writing increased from 2009/2010 to 2012 (CCC, 2012). Such results provide
valuable and timely information for the college-level effort to foster student success.
Previous studies have also factored in student demographic variables, such as gender and
ethnicity, in evaluating direct or indirect learning outcomes at community colleges (Bailey,
Jeong, & Cho, 2010; Bush & Bush, 2010; Lakin et al., 2012). For example, Bush and Bush
(2010) found that compared to other ethnic and gender groups in community college, African
American males exhibited disproportionately low performances on academic outcome measures,
including degree attainment, cumulative GPA, and persistence rates. Bailey et al. (2010) found
that female, African American, and Hispanic students tended to need more levels of remedial
education than their peers. In addition, compared to their peers, male and African American
students were less likely to progress through their full remediation sequences. Miller (2006)
found that in community colleges, African American and Hispanic/Latino male students did not
make adequate progress through the remedial math courses, even though successful completion
of remedial math courses is critical for success in college-level math courses. Greene, Marti, and
McClenney (2008) surveyed community college students and found that African American
students demonstrated lower academic outcomes than their White peers. Furthermore, although
Hispanic students demonstrated higher levels of engagement on the Mental Activities factor,
they earned significantly lower grades than their White peers. These findings suggest the
importance of taking into account gender and ethnicity when assessing student learning at
6
community colleges. In addition, as ESL students constitute the fastest growing population in
many community colleges (Chisman & Crandall, 2007), it is critical to examine whether
students’ language status is associated with their learning outcomes.
Method
Instrument
The EPP was used in this study to assess students’ general skills at community colleges.
It measures four college-level general skills: reading, writing, mathematics, and critical thinking.
The EPP has a standard form and a short form. The standard form contains 108 multiple-choice
questions with 27 questions in each skill area and can be in administered in about 2 hours. The
short form has 36 items and can be completed in 40 minutes. For our study, both forms were
used. The scores from both the standard and short forms are equated to ensure that they are
comparable. Scaled scores for the total score range from 400–500 and from 100–130 for each of
the four skill areas (ETS, 2010). The validity of the EPP is supported by abundant research
studies, including research investigating construct validity (Klein et al., 2009; Lakin et al., 2012),
predictive validity (Hendel, 1991; Lakin et al., 2012; Marr, 1995), ability to detect learning gain
(Liu, 2011a, 2011b; Liu, Bridgeman, & Adler, 2012), suitability for English language learners
(Lakin et al., 2012), and the effect of student test-taking motivation on test scores (Liu, 2012; Liu
et al., 2012). The reliabilities of the subscales range from .78 to .84 (Liu, 2011a).
Participants
This study involved a 10-year analysis of community/2-year-college students’
performance on the EPP. Both the test data and examinee background information were obtained
from the ETS data warehouse. Community colleges were defined as institutions offering degrees
at the associate’s level or degrees at the bachelor’s level to less than 10% of all undergraduate
students, which was the definition used by the Carnegie Foundation for the Advancement of
Teaching (2010). Students from 13 community colleges (n = 46,402) in eight different states
were included in the analyses. These institutions were selected as their students took the EPP
from 2001 to 2010. The institutions varied in terms of their recruitment methods for the test (Liu,
2011b). In many cases, incentives (e.g., cash, credits) were provided and students signed up for
the test voluntarily. Although the students taking the assessment each year within a college were
7
not necessarily the same group of students, analysis of the same colleges is likely to provide
information on the trends of performance among community colleges over the last 10 years.
All but one of the 13 community colleges included in this study were public, with two
offering bachelor’s degrees in addition to certificates and associate’s degrees. Seven of the
community colleges were located in small cities/towns and six were located in large cities/towns
(as identified by the College Board’s college search engine;
https://bigfuture.collegeboard.org/find-colleges). Additionally, six community colleges were
located in a rural setting, five in a suburban setting, and two in an urban setting. Undergraduate
enrollment was mostly of small-to-medium size for 11 of the 13 colleges, with the number of
students ranging from around 2,500 to 8,500. The two exceptions were that one institution had
approximately 730 enrolled students and the other had 21,000.
Demographic data suggest that the sample is representative of all community college
students taking the EPP (Table 1) from 2001 to 2010. For the 13 community colleges in this
study, approximately 7% of the students were entering freshmen and therefore had zero credits,
2% had less than 30 credits, 53% had 30–60 credits, 32% had 61–90 credits, and 7% had greater
than 90 credits. It is important to note that although most community college degrees only
require around 60 credits, it is common for students to have excess credits (Zeidenberg, 2012). A
number of factors may explain students’ excess credits, including changing majors, transferring
in credits, retaking a course for GPA improvement, and a desire for more knowledge through
additional coursework (Zeidenberg, 2012). Also, some institutions classified as community
colleges may still offer bachelor’s degrees, thus requiring additional credits.
For comparison purposes, we also included students from eight research universities
(n = 68,045), 13 comprehensive colleges/universities (n = 120,269), and 11 liberal arts colleges
(n = 52,245). Thus, in total, 286,961 students were included in this study. Institutions were
categorized into the respective institution types based on the basic classification categories
defined by the Carnegie Foundation for the Advancement of Teaching. Specifically, research
universities, comprehensive colleges, and liberal arts colleges correspond to the definitions of
doctorate-granting universities, masters’ colleges and universities, and baccalaureate colleges,
respectively (Carnegie Foundation for the Advancement of Teaching, 2010).
8
Table 1
Study Sample Descriptive Statistics Compared to All Community College Data
Descriptive statistics Sample data All data Enrollment
Part-time 26% 26% Full-time 74% 74%
Transfer status Not a transfer 70% 72% Transfer 30% 28%
Age ≤ 21 42% 46% 22–39 47% 43% 40+ 11% 11% Average 27 26 Median 23 22
Gender Male 35% 36% Female 66% 64%
Ethnicity White 84% 74% Hispanic/Latino 4% 7% African American/Black 6% 11% Asian/Asian American/Pacific Islander 2% 3% Native American/Alaskan Native 2% 2% Other 2% 4%
Language English (non-ESL) 93% 90% Other language (ESL) 4% 6% Both equal 3% 5%
Enrollment and employment Full-time + full-time employment 17% 22% Full-time + part-time employment 41% 50% Part-time + full-time employment 15% 18% Part-time + part-time employment 8% 10%
Note. ESL = English as a second language.
9
Analyses
Community college students’ performance in comparison to students at other types
of institutions. Analysis of covariance (ANCOVA) was used to examine mean performance
differences between community colleges and the three other institution types, controlling for the
number of credit hours received. The number of credit hours was used as an indicator of the
amount of college-level instruction. The outcome variables were the EPP total and subscale
scores. To examine differences in performance across the 10-year period, separate analyses were
conducted at three different time points (2001, 2005, and 2010). Differences in performance
from 2001 to 2010 were examined within each institution type to identify trends (i.e., increased,
decreased, or stable performance from 2001 to 2010). Cohen’s d (i.e., standardized mean
difference) was used to evaluate the effect size for each comparison.
Trends and gaps. Performance trends within community colleges were investigated for
gender, ethnicity, and language groups for the total score and for the subscales. Independent-
sample t-tests were used to compare mean score differences between males and females and
between students who speak English as a second language (ESLs) and English-speaking students
(non-ESLs). ANOVA was conducted with regard to ethnicity. White students’ performance was
compared to that of African American, Hispanic/Latino, and Asian/Asian American/Pacific
Islander students. It is important to note that the Hispanic/Latino group combined Hispanic,
Latin American, and Black Hispanic ethnic groups.
For all comparisons of performance (e.g., between groups or over time), Cohen’s d was
also used to evaluate the effect size between the comparison and each reference group. Reference
groups included males, non-ESLs, and White students.
Factors predicting performance. To investigate factors predicting community college
performance, stepwise regression was conducted using total test score as the dependent variable.
Predictors included ethnicity, language, transfer status, gender, age, number of hours worked per
week, college GPA, and credit hours. Ethnicity, language, transfer status, and gender variables
were all dummy coded, with White, non-ESL, nontransfer, and males as the reference groups.
Age was a continuous variable from age 14–75. Hours worked per week, GPA, and credit hours
were all treated as continuous interval variables.
Prior to running the stepwise regression, a variance components analysis was conducted
to evaluate the necessity of a multilevel modeling approach. Compared to the within-institution
10
variance, the between-institution variance was negligible (i.e., only explaining 2.2% of the
variance in test scores), which suggested that a multilevel model was not necessary. This result
resonated with other studies reporting small between-institution differences (Blaich & Wise,
2011; Kuh, 2003).
Concurrent validity of the EPP. Since the EPP tends to measure academic achievement,
we expect the test scores to reflect variations in college GPA. Namely, students with higher EPP
scores should have higher GPAs, and vice versa. EPP scores were conditioned on levels of GPA
and illustrated in graphs.
Additionally, as a test of academic outcomes, we also expect test scores to reflect
variations in student exposure to college coursework (i.e., credit hours). Specifically, we expect
that students exposed to more course work will perform better on the EPP and vice versa. As
with GPA, the EPP scores were conditioned on credit hour categories and illustrated in graphs.
Results
Community Colleges’ Performance in Comparison to Other Types of Institutions
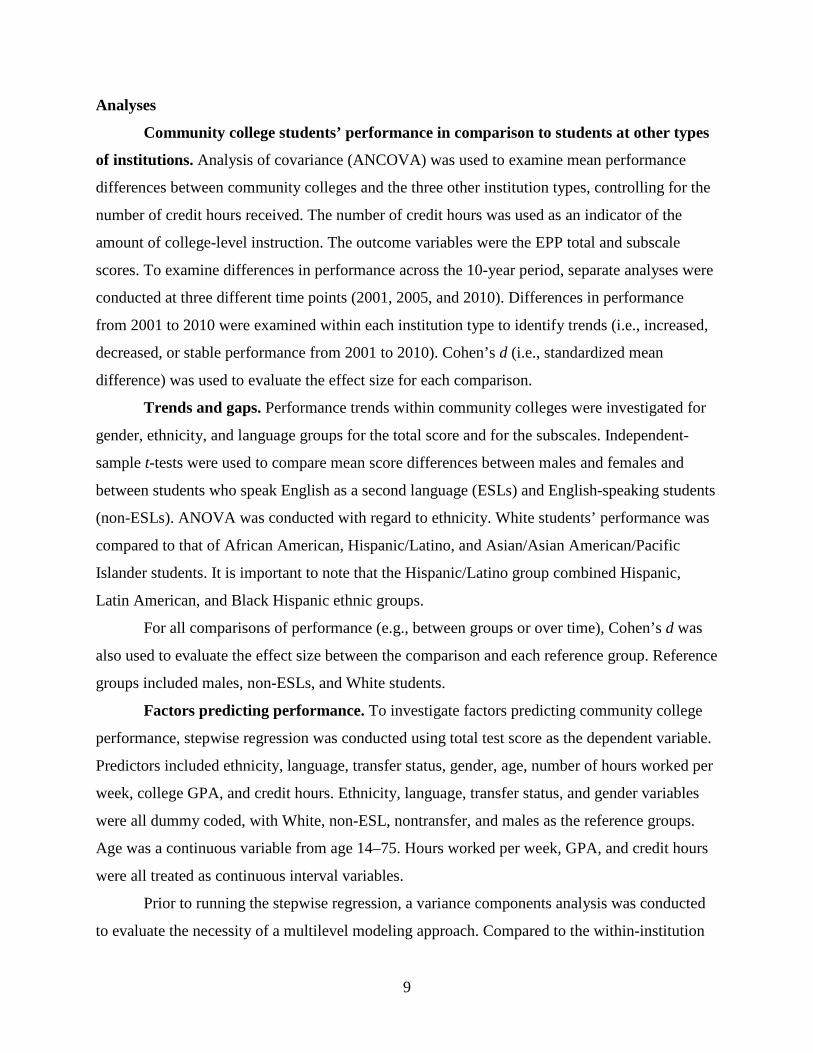
Figures 1 and 2 show that research universities performed highest in both total and
subscale scores when controlling for students’ number of college credit hours. Focusing on the
total score performance (Figure 1), research universities and comprehensive colleges both
significantly outperformed community colleges. Specifically, differences in performance
between research universities and community colleges widened from 2001 (d = 0.13) to 2010
(d = 0.43), but differences between comprehensive colleges and community colleges narrowed
from 2001 (d = 0.12) to 2010 (d = 0.06). The most noteworthy finding is that community
colleges were outperformed by liberal arts colleges in 2001 (p < .05, d = 0.05), but performed the
same in 2005 and actually outperformed liberal arts colleges in 2010 (p < .05, d = -0.04). Figure
1 also shows the trends in performance within each institution type. Research universities
improved in performance over the 10-year period (d = 0.29), and both comprehensive and liberal
arts colleges decreased slightly in performance (d = -0.06 and d = -0.09, respectively).
Community college performance, however, remained stable (d = 0.00).
11
Figure 1. Institutional performance differences on total score controlling for credit hours.
CompColl = comprehensive college; CC = community college; LibArts = liberal arts. [a] Effect size calculated between 2001 and 2010 within the same type of institution. [b] For
four of eight research institutions and 10 of 13 CCs, data were not available in 2001, so
2002 data were used as a substitution. *p < .05. **p < .001 between CC and institution of
interest in specified year.
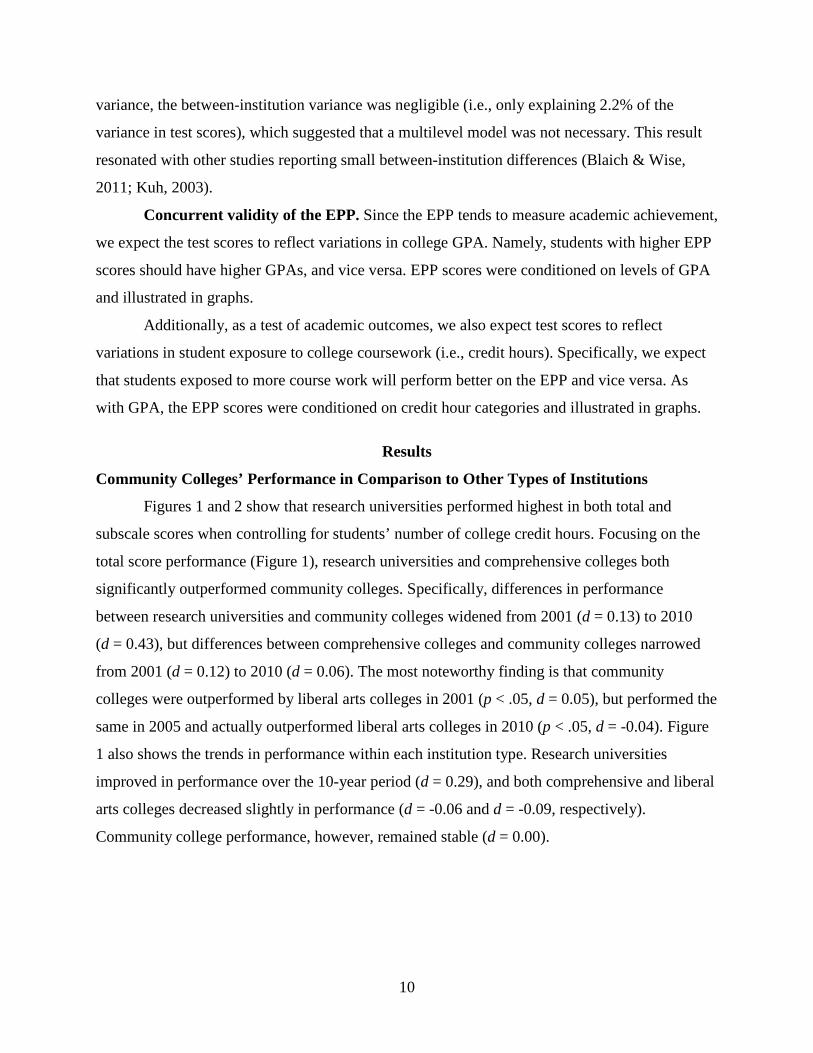
In relation to performance on the four subscales when controlling for the number of
credit hours (Figure 2), research universities significantly outperformed community colleges.
Performance differences between research universities and community colleges widened in all
four subscales due to increases in performance for research universities, with the largest
difference in performance occurring in mathematics from 2001 (d = 0.23) to 2010 (d = 0.50).
Alternatively, the trend between comprehensive and community colleges narrowed in all four
subscales, and in critical thinking, the gap in performance completely closed in 2010 (p = .50,
d = 0.01). Interestingly, in reading, comprehensive and community colleges did not perform
significantly differently across the 10 years. Again, community college students performed
12
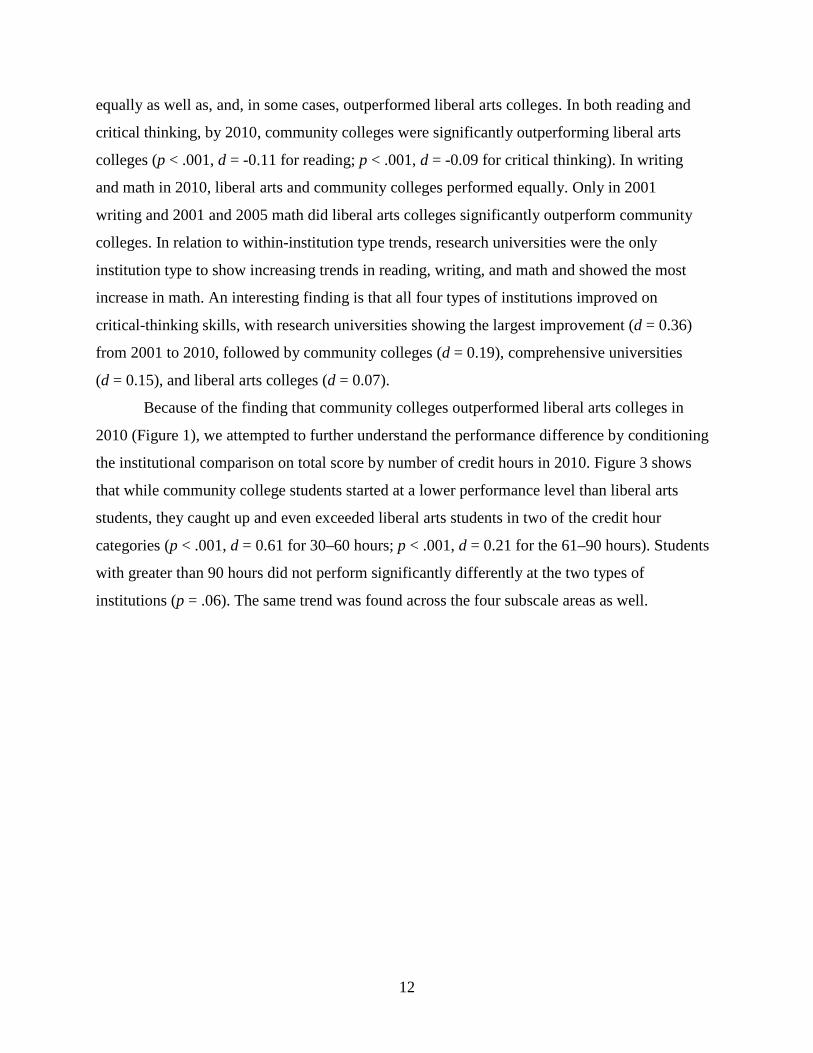
equally as well as, and, in some cases, outperformed liberal arts colleges. In both reading and
critical thinking, by 2010, community colleges were significantly outperforming liberal arts
colleges (p < .001, d = -0.11 for reading; p < .001, d = -0.09 for critical thinking). In writing
and math in 2010, liberal arts and community colleges performed equally. Only in 2001
writing and 2001 and 2005 math did liberal arts colleges significantly outperform community
colleges. In relation to within-institution type trends, research universities were the only
institution type to show increasing trends in reading, writing, and math and showed the most
increase in math. An interesting finding is that all four types of institutions improved on
critical-thinking skills, with research universities showing the largest improvement (d = 0.36)
from 2001 to 2010, followed by community colleges (d = 0.19), comprehensive universities
(d = 0.15), and liberal arts colleges (d = 0.07).
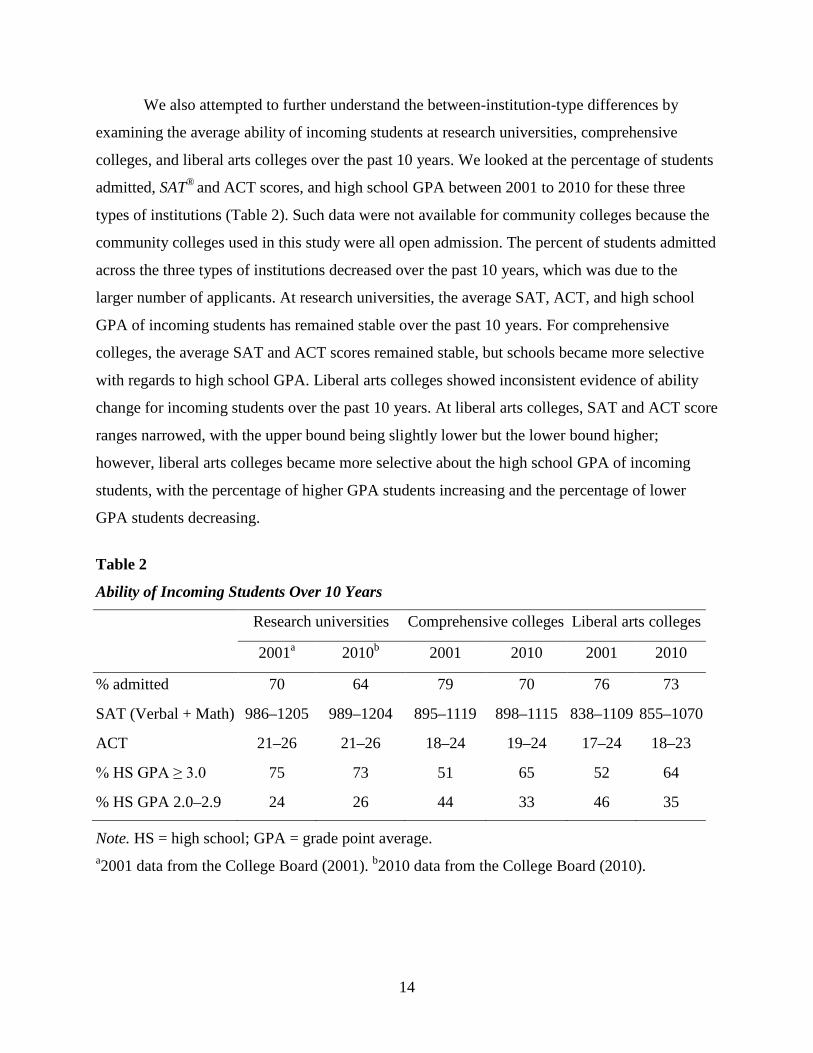
Because of the finding that community colleges outperformed liberal arts colleges in
2010 (Figure 1), we attempted to further understand the performance difference by conditioning
the institutional comparison on total score by number of credit hours in 2010. Figure 3 shows
that while community college students started at a lower performance level than liberal arts
students, they caught up and even exceeded liberal arts students in two of the credit hour
categories (p < .001, d = 0.61 for 30–60 hours; p < .001, d = 0.21 for the 61–90 hours). Students
with greater than 90 hours did not perform significantly differently at the two types of
institutions (p = .06). The same trend was found across the four subscale areas as well.
13
Figure 2. Institutional performance differences on four subscales controlling for credit hours. CompColl = comprehensive
college; CC = community college; LibArts = liberal arts. For four of eight research institutions and 10 of 13 CCs, data were
not available in 2001, so 2002 data were used as a substitution. [a]Effect size calculated between 2001 and 2010 within the same
type of institution. *p < .05. **p < .001 between CC and institution of interest in specified year.
14
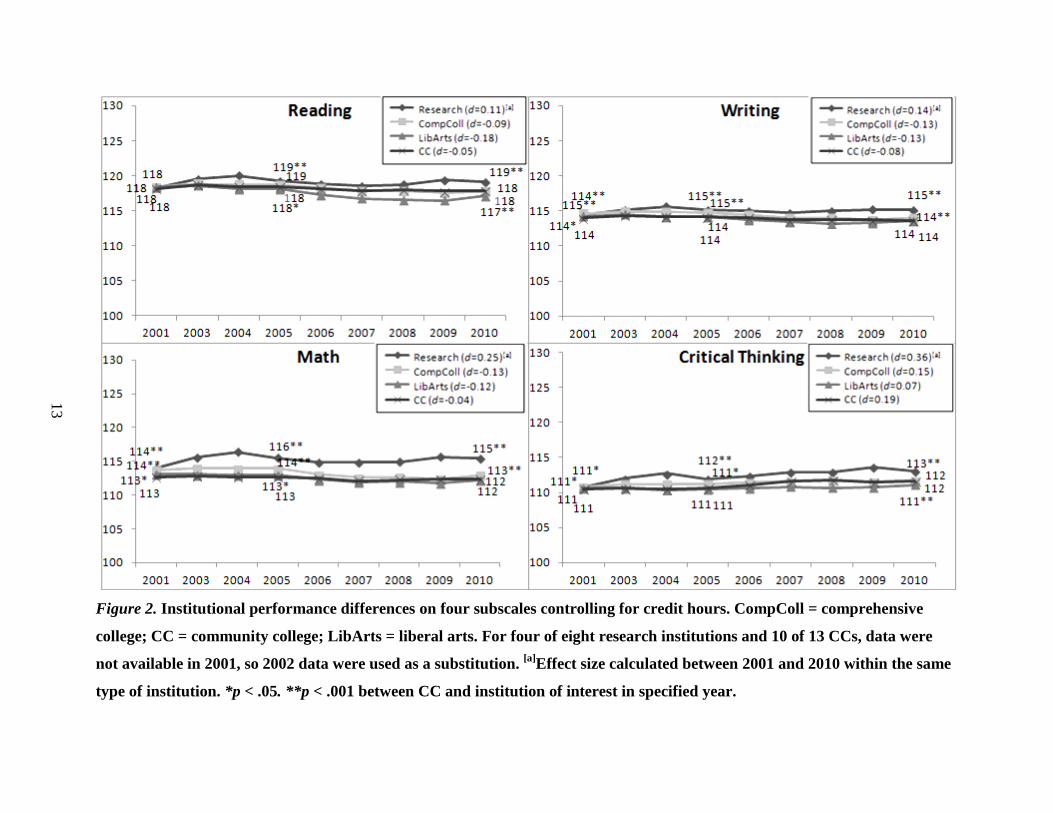
We also attempted to further understand the between-institution-type differences by
examining the average ability of incoming students at research universities, comprehensive
colleges, and liberal arts colleges over the past 10 years. We looked at the percentage of students
admitted, SAT® and ACT scores, and high school GPA between 2001 to 2010 for these three
types of institutions (Table 2). Such data were not available for community colleges because the
community colleges used in this study were all open admission. The percent of students admitted
across the three types of institutions decreased over the past 10 years, which was due to the
larger number of applicants. At research universities, the average SAT, ACT, and high school
GPA of incoming students has remained stable over the past 10 years. For comprehensive
colleges, the average SAT and ACT scores remained stable, but schools became more selective
with regards to high school GPA. Liberal arts colleges showed inconsistent evidence of ability
change for incoming students over the past 10 years. At liberal arts colleges, SAT and ACT score
ranges narrowed, with the upper bound being slightly lower but the lower bound higher;
however, liberal arts colleges became more selective about the high school GPA of incoming
students, with the percentage of higher GPA students increasing and the percentage of lower
GPA students decreasing.
Table 2
Ability of Incoming Students Over 10 Years
Research universities Comprehensive colleges Liberal arts colleges
2001a 2010b 2001 2010 2001 2010
% admitted 70 64 79 70 76 73
SAT (Verbal + Math) 986–1205 989–1204 895–1119 898–1115 838–1109 855–1070
ACT 21–26 21–26 18–24 19–24 17–24 18–23
% HS GPA ≥ 3.0 75 73 51 65 52 64
% HS GPA 2.0–2.9 24 26 44 33 46 35
Note. HS = high school; GPA = grade point average. a2001 data from the College Board (2001). b2010 data from the College Board (2010).
15
Figure 3. Credit hours by total score for liberal arts and community colleges. CC =
community college; LibArts = liberal arts. **LibArts significantly lower (p < .001) than CC.
Trends and Gaps
Note that all subsequent results only apply to community colleges, as community
colleges are the focus of this study.
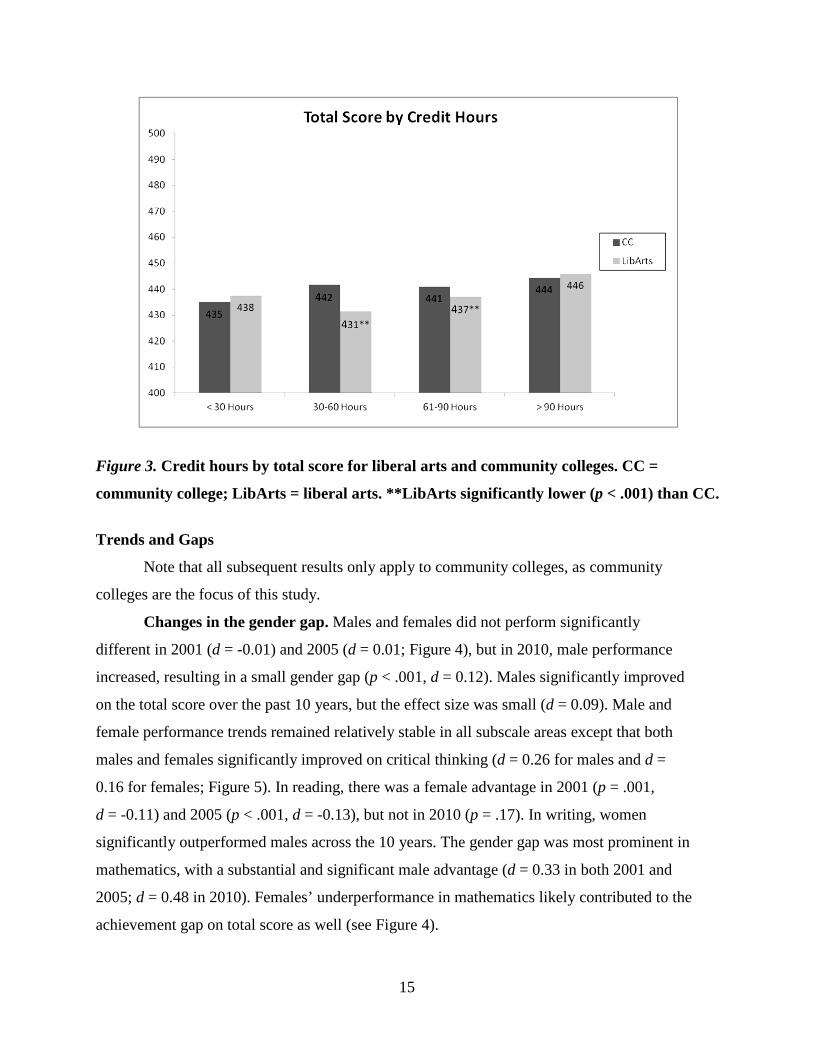
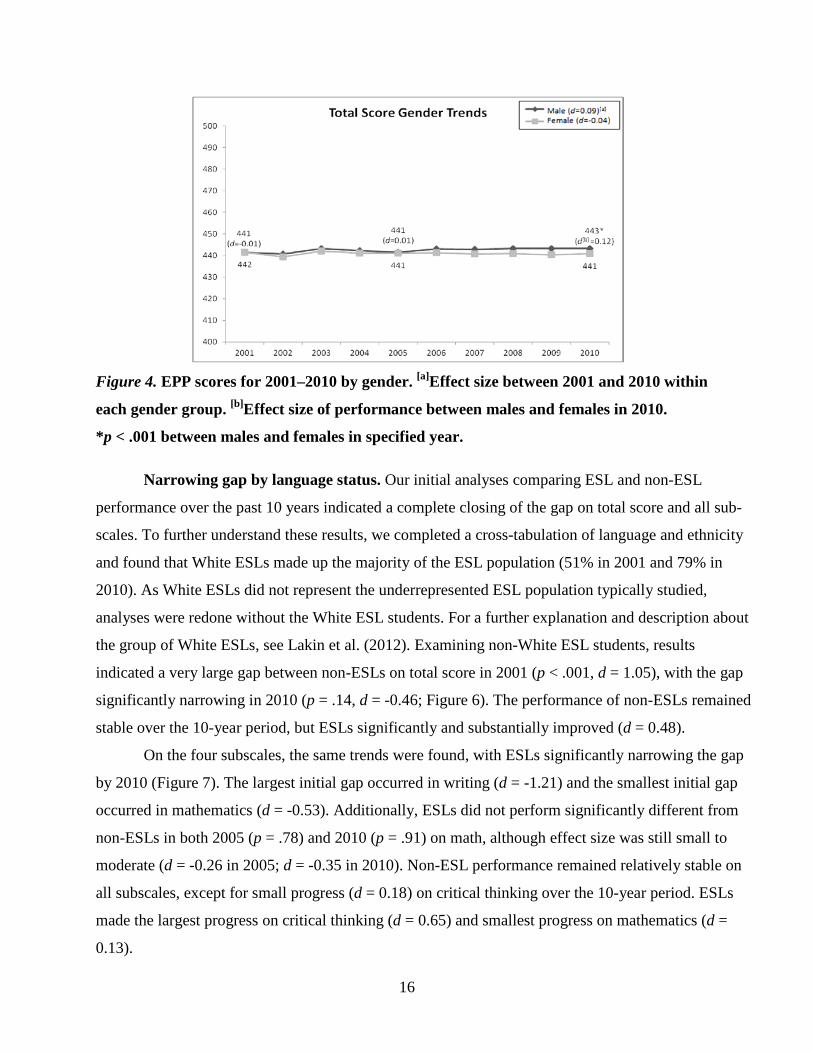
Changes in the gender gap. Males and females did not perform significantly
different in 2001 (d = -0.01) and 2005 (d = 0.01; Figure 4), but in 2010, male performance
increased, resulting in a small gender gap (p < .001, d = 0.12). Males significantly improved
on the total score over the past 10 years, but the effect size was small (d = 0.09). Male and
female performance trends remained relatively stable in all subscale areas except that both
males and females significantly improved on critical thinking (d = 0.26 for males and d =
0.16 for females; Figure 5). In reading, there was a female advantage in 2001 (p = .001,
d = -0.11) and 2005 (p < .001, d = -0.13), but not in 2010 (p = .17). In writing, women
significantly outperformed males across the 10 years. The gender gap was most prominent in
mathematics, with a substantial and significant male advantage (d = 0.33 in both 2001 and
2005; d = 0.48 in 2010). Females’ underperformance in mathematics likely contributed to the
achievement gap on total score as well (see Figure 4).
16
Figure 4. EPP scores for 2001–2010 by gender. [a]Effect size between 2001 and 2010 within
each gender group. [b]Effect size of performance between males and females in 2010.
*p < .001 between males and females in specified year.
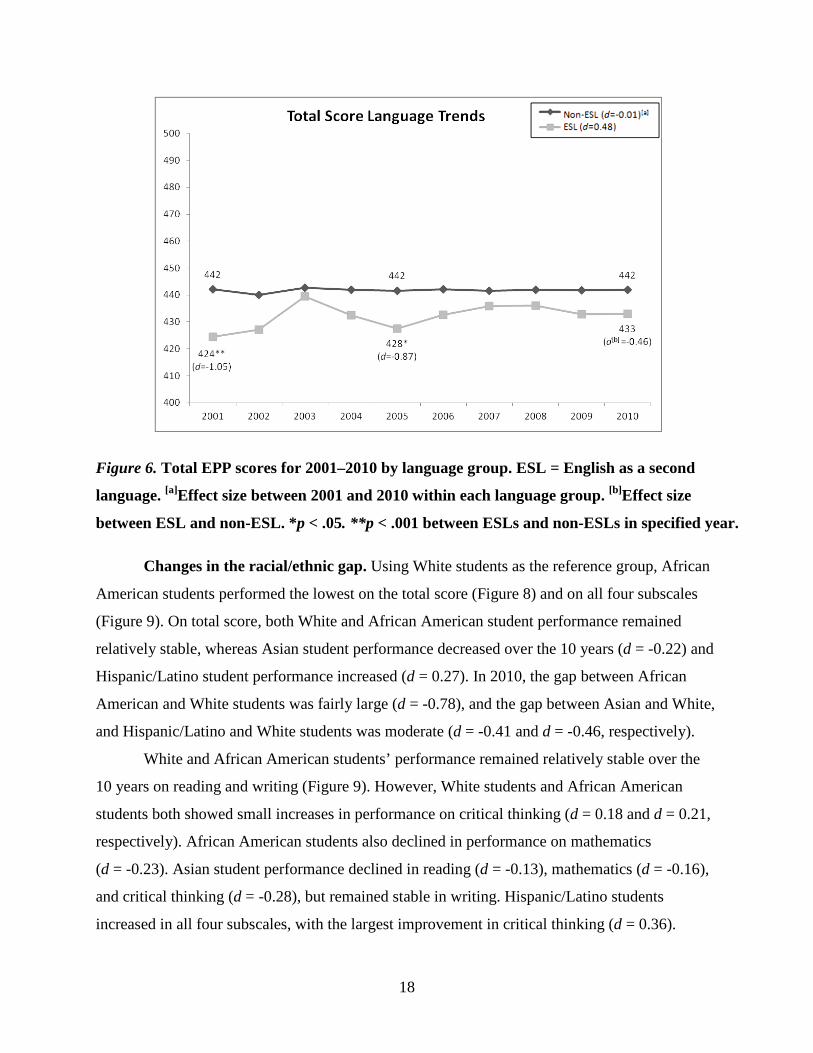
Narrowing gap by language status. Our initial analyses comparing ESL and non-ESL
performance over the past 10 years indicated a complete closing of the gap on total score and all sub-
scales. To further understand these results, we completed a cross-tabulation of language and ethnicity
and found that White ESLs made up the majority of the ESL population (51% in 2001 and 79% in
2010). As White ESLs did not represent the underrepresented ESL population typically studied,
analyses were redone without the White ESL students. For a further explanation and description about
the group of White ESLs, see Lakin et al. (2012). Examining non-White ESL students, results
indicated a very large gap between non-ESLs on total score in 2001 (p < .001, d = 1.05), with the gap
significantly narrowing in 2010 (p = .14, d = -0.46; Figure 6). The performance of non-ESLs remained
stable over the 10-year period, but ESLs significantly and substantially improved (d = 0.48).
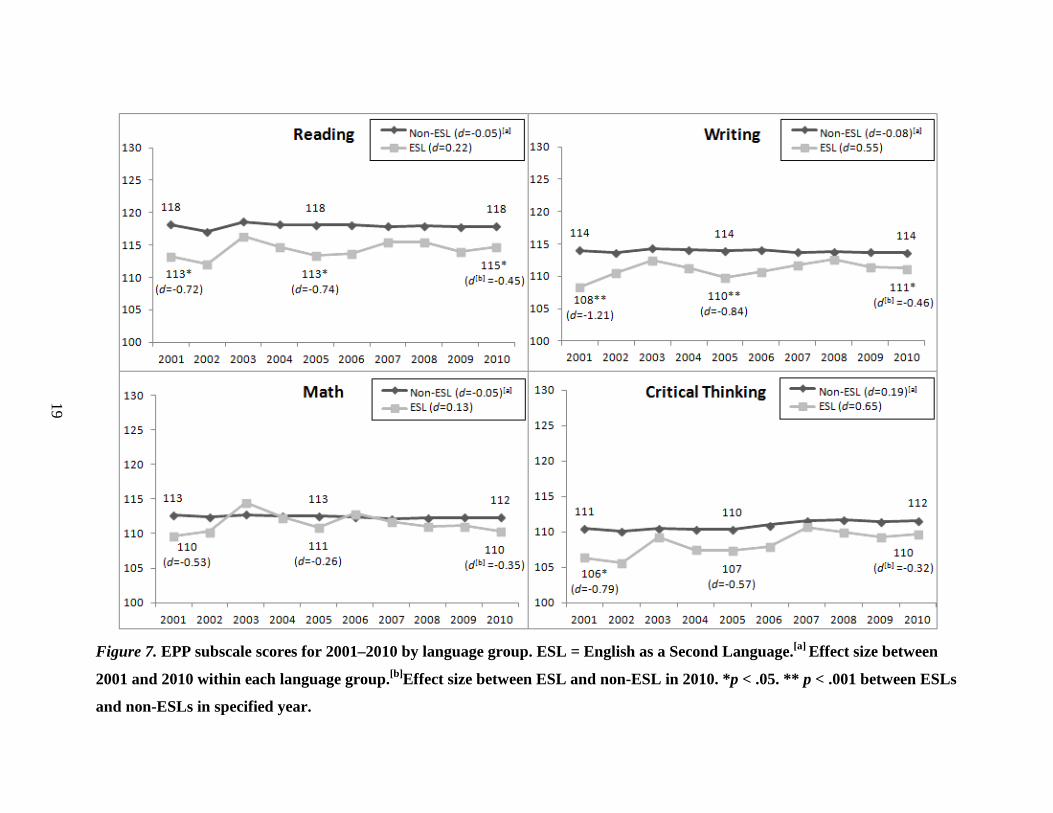
On the four subscales, the same trends were found, with ESLs significantly narrowing the gap
by 2010 (Figure 7). The largest initial gap occurred in writing (d = -1.21) and the smallest initial gap
occurred in mathematics (d = -0.53). Additionally, ESLs did not perform significantly different from
non-ESLs in both 2005 (p = .78) and 2010 (p = .91) on math, although effect size was still small to
moderate (d = -0.26 in 2005; d = -0.35 in 2010). Non-ESL performance remained relatively stable on
all subscales, except for small progress (d = 0.18) on critical thinking over the 10-year period. ESLs
made the largest progress on critical thinking (d = 0.65) and smallest progress on mathematics (d =
0.13).

17
Figure 5. EPP subscale scores for 2001–2010 by gender. [a]Effect size between 2001 and 2010 within each gender group. [b]Effect size of performance between males and females in 2010. ** p ≤ .001 between males and females in specified year.
18
Figure 6. Total EPP scores for 2001–2010 by language group. ESL = English as a second
language. [a]Effect size between 2001 and 2010 within each language group. [b]Effect size
between ESL and non-ESL. *p < .05. **p < .001 between ESLs and non-ESLs in specified year.
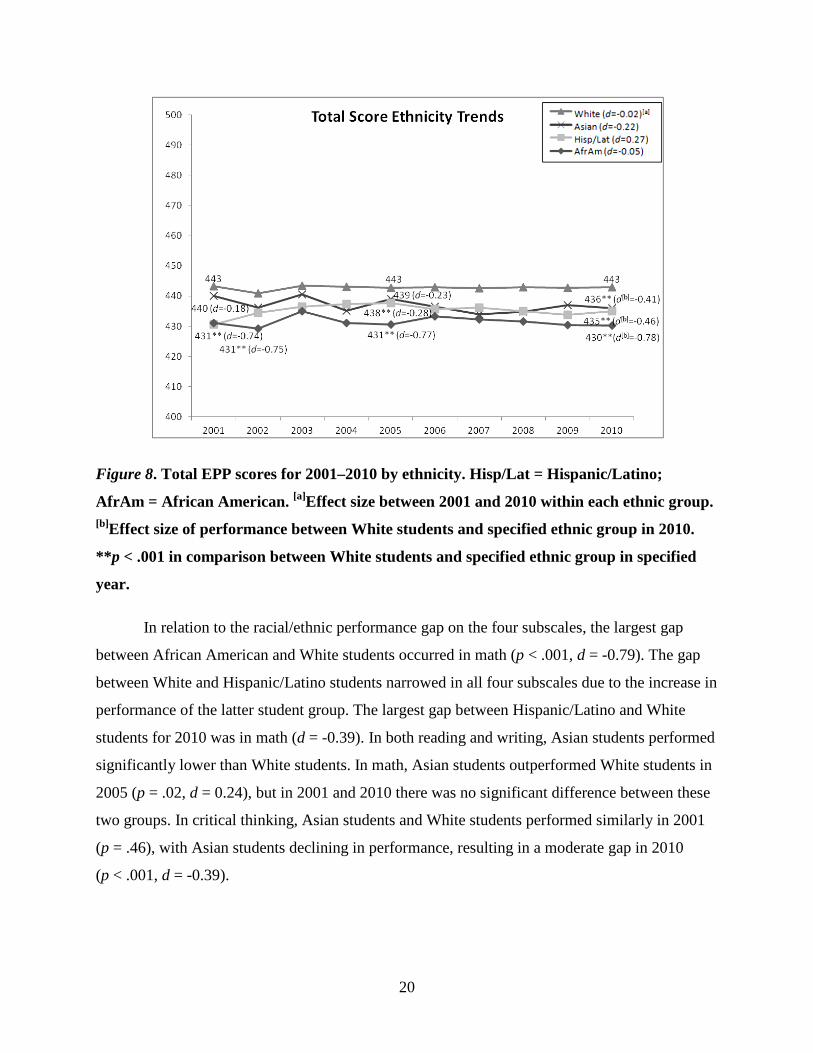
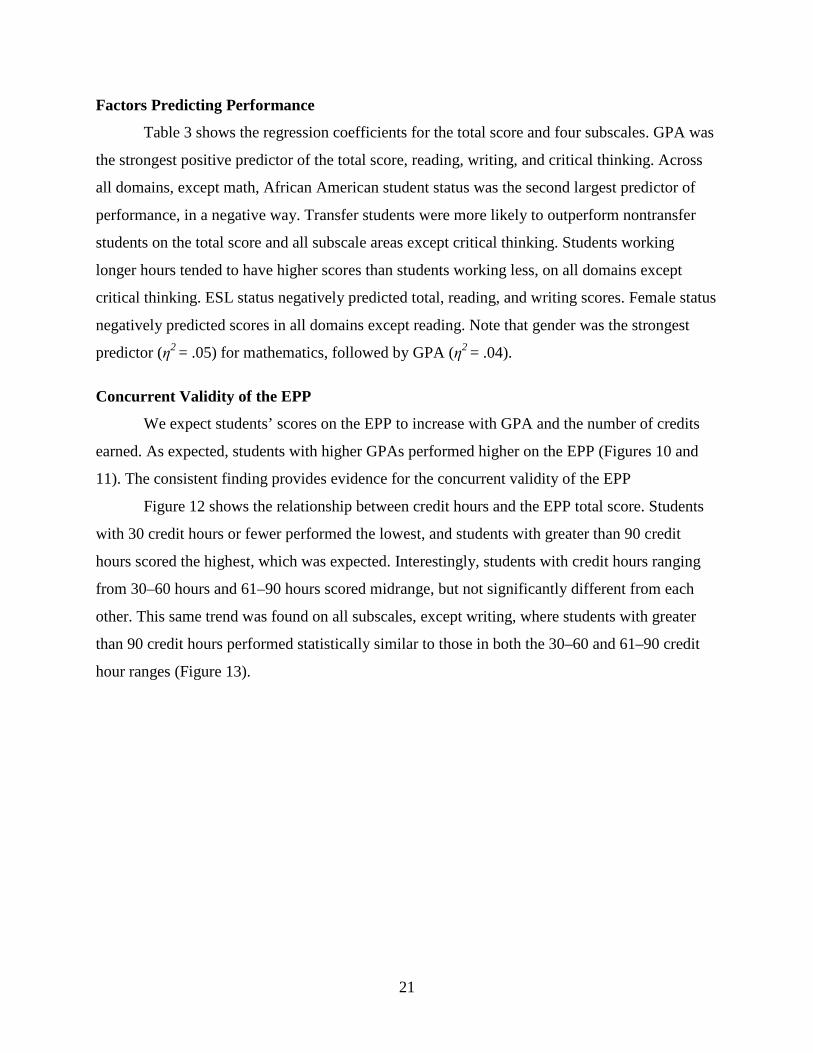
Changes in the racial/ethnic gap. Using White students as the reference group, African
American students performed the lowest on the total score (Figure 8) and on all four subscales
(Figure 9). On total score, both White and African American student performance remained
relatively stable, whereas Asian student performance decreased over the 10 years (d = -0.22) and
Hispanic/Latino student performance increased (d = 0.27). In 2010, the gap between African
American and White students was fairly large (d = -0.78), and the gap between Asian and White,
and Hispanic/Latino and White students was moderate (d = -0.41 and d = -0.46, respectively).
White and African American students’ performance remained relatively stable over the
10 years on reading and writing (Figure 9). However, White students and African American
students both showed small increases in performance on critical thinking (d = 0.18 and d = 0.21,
respectively). African American students also declined in performance on mathematics
(d = -0.23). Asian student performance declined in reading (d = -0.13), mathematics (d = -0.16),
and critical thinking (d = -0.28), but remained stable in writing. Hispanic/Latino students
increased in all four subscales, with the largest improvement in critical thinking (d = 0.36).
19
Figure 7. EPP subscale scores for 2001–2010 by language group. ESL = English as a Second Language.[a] Effect size between
2001 and 2010 within each language group.[b]Effect size between ESL and non-ESL in 2010. *p < .05. ** p < .001 between ESLs
and non-ESLs in specified year.
20
Figure 8. Total EPP scores for 2001–2010 by ethnicity. Hisp/Lat = Hispanic/Latino;
AfrAm = African American. [a]Effect size between 2001 and 2010 within each ethnic group. [b]Effect size of performance between White students and specified ethnic group in 2010.
**p < .001 in comparison between White students and specified ethnic group in specified
year.
In relation to the racial/ethnic performance gap on the four subscales, the largest gap
between African American and White students occurred in math (p < .001, d = -0.79). The gap
between White and Hispanic/Latino students narrowed in all four subscales due to the increase in
performance of the latter student group. The largest gap between Hispanic/Latino and White
students for 2010 was in math (d = -0.39). In both reading and writing, Asian students performed
significantly lower than White students. In math, Asian students outperformed White students in
2005 (p = .02, d = 0.24), but in 2001 and 2010 there was no significant difference between these
two groups. In critical thinking, Asian students and White students performed similarly in 2001
(p = .46), with Asian students declining in performance, resulting in a moderate gap in 2010
(p < .001, d = -0.39).
21
Factors Predicting Performance
Table 3 shows the regression coefficients for the total score and four subscales. GPA was
the strongest positive predictor of the total score, reading, writing, and critical thinking. Across
all domains, except math, African American student status was the second largest predictor of
performance, in a negative way. Transfer students were more likely to outperform nontransfer
students on the total score and all subscale areas except critical thinking. Students working
longer hours tended to have higher scores than students working less, on all domains except
critical thinking. ESL status negatively predicted total, reading, and writing scores. Female status
negatively predicted scores in all domains except reading. Note that gender was the strongest
predictor (η2 = .05) for mathematics, followed by GPA (η2 = .04).
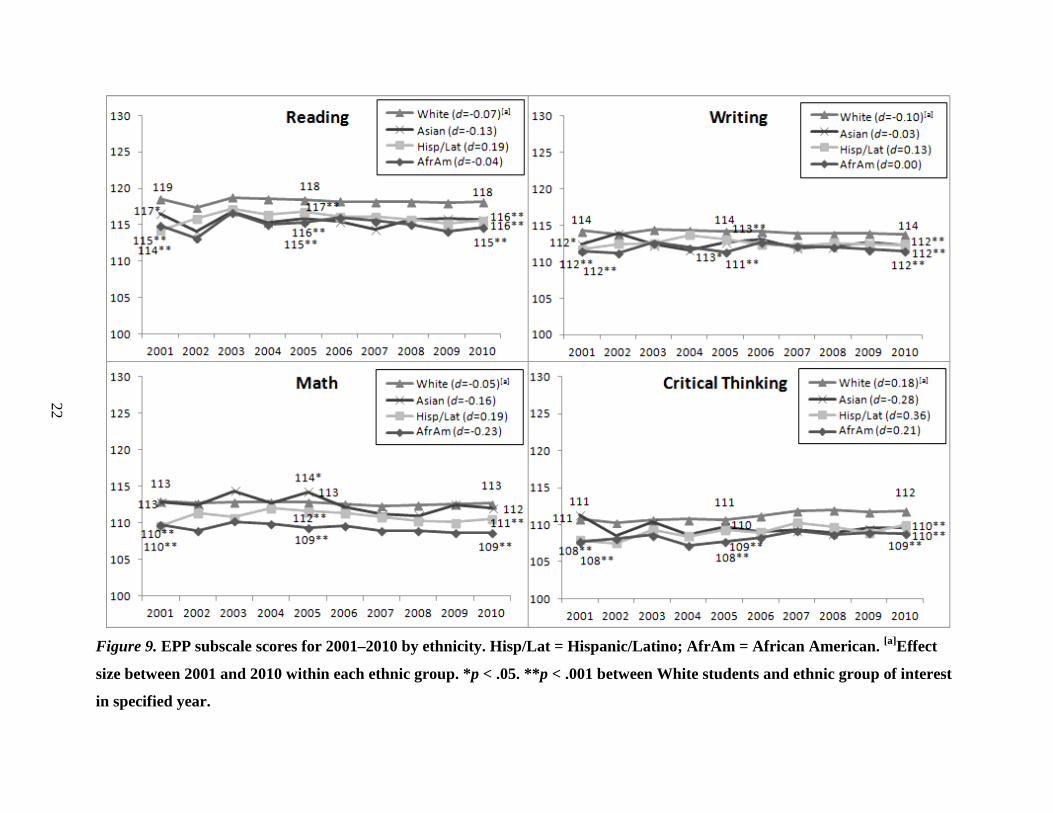
Concurrent Validity of the EPP
We expect students’ scores on the EPP to increase with GPA and the number of credits
earned. As expected, students with higher GPAs performed higher on the EPP (Figures 10 and
11). The consistent finding provides evidence for the concurrent validity of the EPP
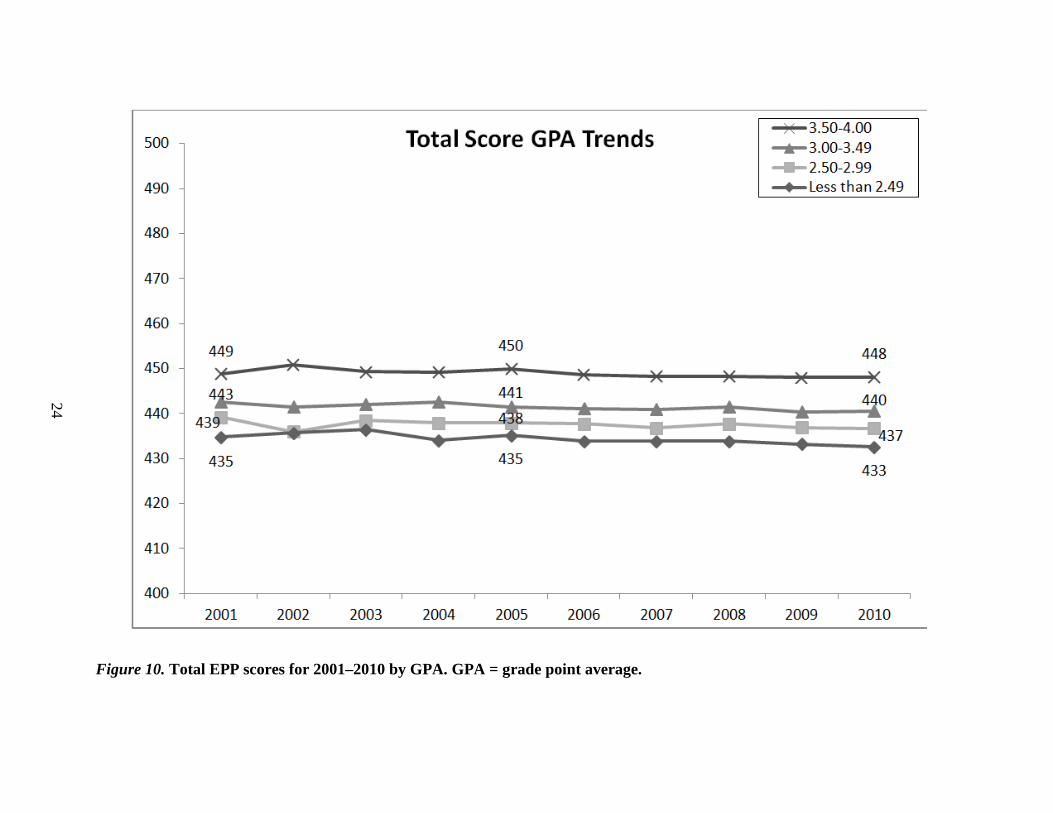
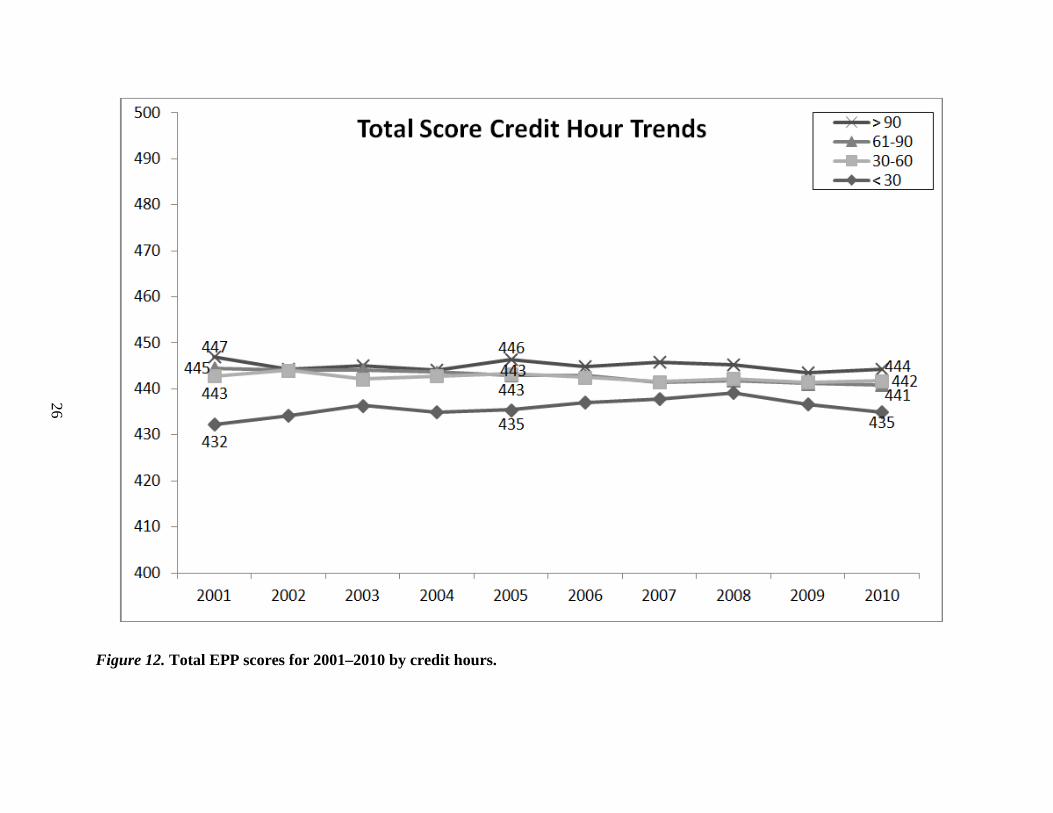
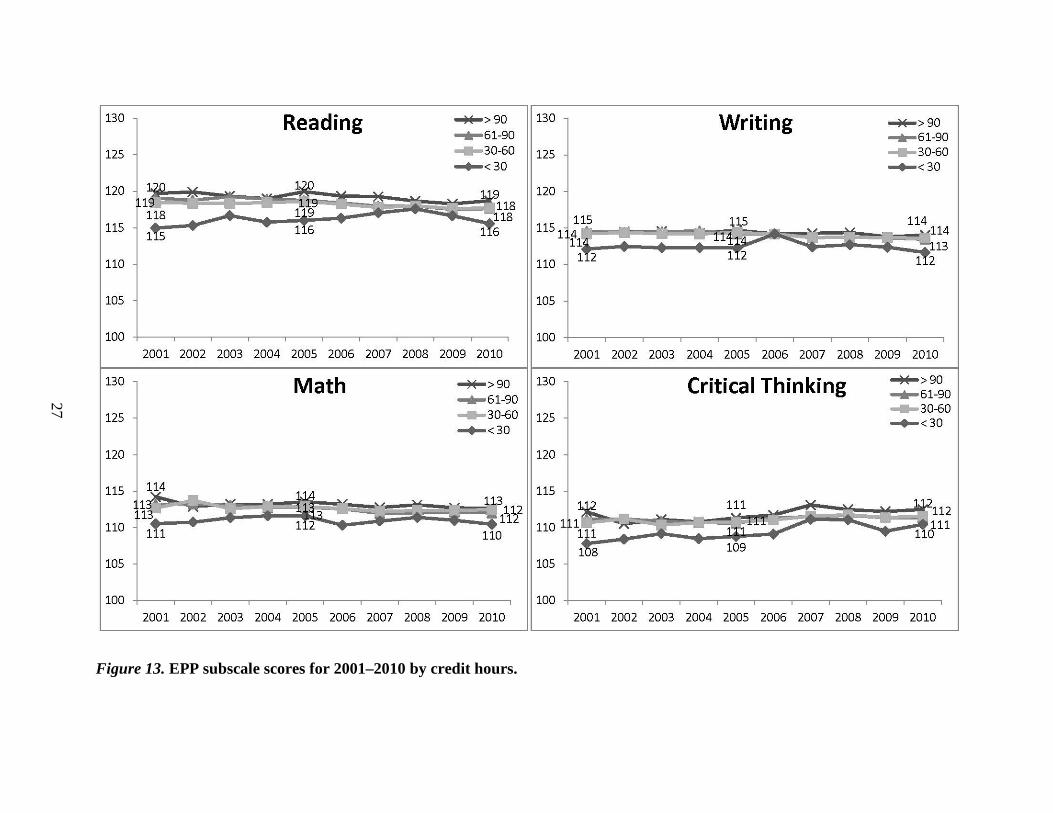
Figure 12 shows the relationship between credit hours and the EPP total score. Students
with 30 credit hours or fewer performed the lowest, and students with greater than 90 credit
hours scored the highest, which was expected. Interestingly, students with credit hours ranging
from 30–60 hours and 61–90 hours scored midrange, but not significantly different from each
other. This same trend was found on all subscales, except writing, where students with greater
than 90 credit hours performed statistically similar to those in both the 30–60 and 61–90 credit
hour ranges (Figure 13).
22
Figure 9. EPP subscale scores for 2001–2010 by ethnicity. Hisp/Lat = Hispanic/Latino; AfrAm = African American. [a]Effect
size between 2001 and 2010 within each ethnic group. *p < .05. **p < .001 between White students and ethnic group of interest
in specified year.

23
Table 3
Community College Regression Results
Total Reading Writing Math Critical thinking B β η 2 B β η 2 B β η 2 B β η 2 B β η 2
Intercept 430.83 .94 112.70 .89 111.39 .94 112.36 .92 107.42 .89
GPA 4.90 0.26 .07 1.49 0.21 .04 1.00 0.20 .04 1.18 0.20 .04 1.31 0.21 .04
CredHours 1.15 0.04 .00 0.36 0.04 .00 0.20 0.03 .00 0.28 0.03 .00 0.31 0.03 .00
AfrAmer -7.91 -0.11 .01 -2.12 -0.08 .01 -1.39 -0.07 .01 -2.44 -0.11 .01 -2.15 -0.09 .01
HispLat -5.71 -0.06 .00 -1.74 -0.05 .00 -1.26 -0.05 .00 -1.40 -0.04 .00 -1.54 -0.04 .00
Asian -5.34 -0.03 .00 -2.05 -0.03 .00 -1.47 -0.03 .00 -1.82 -0.03 .00
ESL -1.59 -0.02 .00 -0.71 -0.02 .00 -0.60 -0.03 .00 Female -2.72 -0.07 .01 0.36 0.04 .00 -2.53 -0.22 .05 -0.45 -0.04 .00
Age -0.06 -0.03 .00 0.03 0.04 .00 -0.03 -0.05 .00 -0.07 -0.12 .01 0.01 0.02 .00
NoTrans -2.94 -0.08 .01 -0.78 -0.06 .00 -0.45 -0.04 .00 -0.90 -0.08 .01 -0.81 -0.06 .00
HoursWork 0.36 0.02 .00 0.14 0.02 .00 0.09 0.02 .00 0.17 0.03 .00 Ra 0.32 0.27 0.24 0.35 0.26 R2a 0.11 0.07 0.06 0.12 0.07 Note. GPA = grade point average; CredHours = credit hours; AfrAmer = African American; HispLat = Hispanic/Latino; NoTrans =
not a transfer; HoursWorked = hours worked per week; ESL = English as a second language. Hours-worked-per-week categories:
(a) None, (b) 1–15 hours, (c) 16–30 hours, (d) > 30 hours; GPA categories: (a) < 2.49, (b) 2.50–2.99, (c) 3.00–3.49, (d) 3.50–4.00;
credit hour categories: (a) < 30 hours, (b) 30–60 hours, (c) 61–90 hours, (d) > 90 hours. aNonsignficant coefficients were removed to calculate R and R2.
24
Figure 10. Total EPP scores for 2001–2010 by GPA. GPA = grade point average.

25
Figure 11. EPP subscale scores for 2001–2010 by GPA. GPA = grade point average.
26
Figure 12. Total EPP scores for 2001–2010 by credit hours.
27
Figure 13. EPP subscale scores for 2001–2010 by credit hours.
28
The above findings suggest that GPA is a better indicator of content knowledge than the
number of credit hours, as GPA represents how well students have mastered content knowledge,
while the number of credit hours only provides information on whether students complete
courses or not. The criticism that the credit hour is an indicator of time, not of learning, was also
echoed in the report by Laitinen (2012), Cracking the Credit Hour. The author wrote that the
credit hour variable “…doesn’t actually represent learning in any kind of consistently meaningful
or discernible way” (p. 8). The findings from our study show that there was a relationship
between learning indicated by the scores on the EPP and an initial number of credit hours
(i.e., < 30). However, the relationship between learning and credit hours became blurred once
students went beyond the 30-credit-hour threshold, supporting Laitinen’s argument.
Discussion and Implications
Ensuring the quality of community college education is of critical importance to
achieving the goal set by President Obama that by 2020 America should become a global leader
in the concentration of citizens with postsecondary degrees. Through analyses of 10-year data on
a learning outcomes assessment, we examined the trends of performance at community colleges,
including comparisons to other types of institutions. In the following sections, we discuss the
results comparing community college performance to other institution types and the consistent
improvement in critical thinking. Specific to community colleges, we discuss the mathematics
performance gap between males and females, the overall performance gap disfavoring ethnic
minority and ESL students, and the declining trend in Asian student performance. Throughout
each of these sections we discuss the implications of these findings for community colleges.
Comparison of Community Colleges to Other Types of Institutions
Research universities had a predominant advantage when compared to institutions of
other types, and their advantage became more obvious from 2001 to 2010. Two reasons may
explain research universities’ superior performance: (a) research universities have done an
outstanding job educating their students, and/or (b) research universities have had academically
stronger students during the 10-year period. Unfortunately, as acknowledged in the limitations
section below, we will not be able to completely separate these two, as we do not have
information on the incoming ability of individual students. However, we analyzed the average
academic profile for incoming students in 2001 and 2010 (Table 2). While the percentage of
29
admitted students did decrease (probably due to a large number of applicants), the academic
preparation of the students in terms of SAT or ACT scores and high school GPA did not
consistently increase, which suggests no clear evidence that research universities’ outstanding
performance and growth were due to academically stronger students.
The comparison between community colleges and liberal arts colleges also showed some
interesting results. While significantly outperformed by liberal arts colleges in 2001, community
colleges caught up in 2005, and even outperformed liberal arts colleges in 2010. Community
college students’ performance had been stable over the 10 years, but liberal arts showed a slight
decrease (d = -0.09) in performance. One possible reason that may help explain the relative
advantage of community colleges over liberal arts colleges in 2010 was the enrollment surge
taken place at community colleges between 2008 and 2009 due to the U.S. economic recession.
According to an AACC report (Mullin & Phillippe, 2009), the number of students enrolled at
community colleges in 2009 increased by 11% from 2008 and by 24% from 2007. Students
enrolled at community colleges to receive further workforce training and to save on costs (Mullin
& Phillippe, 2009). It could be that because of the economic downturn, students who may have
typically attended liberal arts colleges chose to go to community colleges, and therefore the
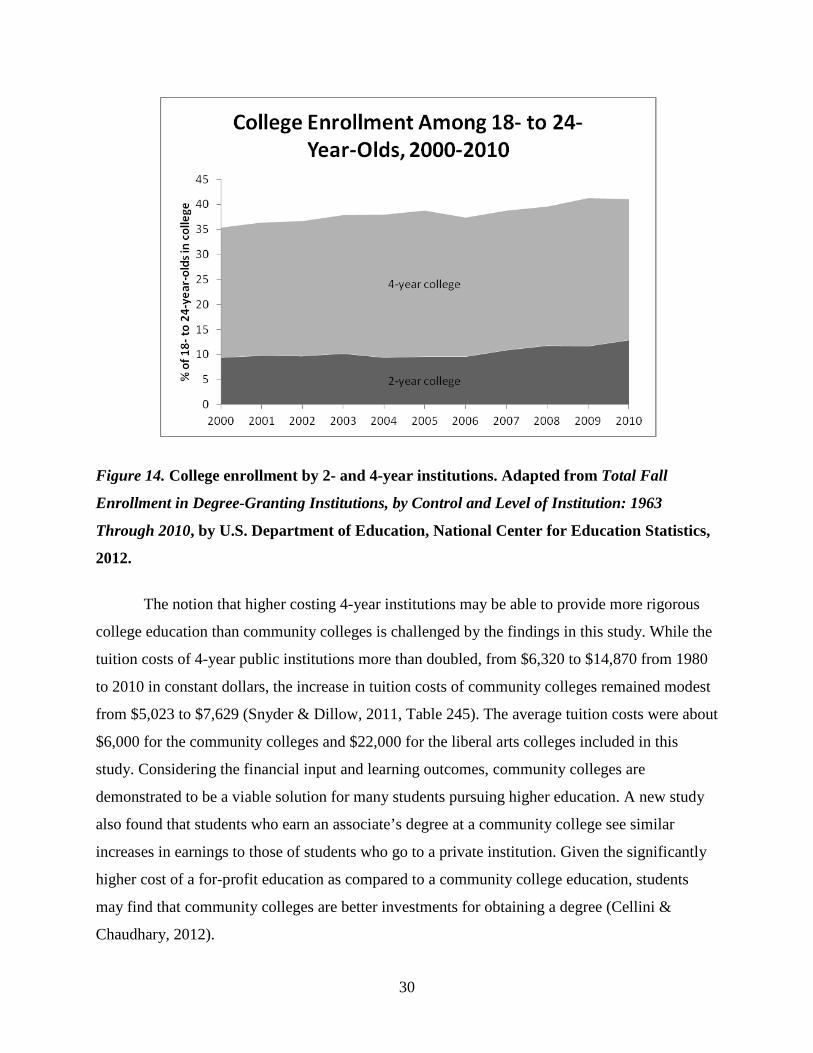
incoming ability of liberal arts students suffered an overall decline. Figure 14 shows that while
the enrollment rates of 18–24-year-olds attending 4-year institutions declined from 29.6% to
28.2% from 2009 to 2010, such rates increased from 11.7% to 12.9% for community colleges
(U.S. Department of Education, National Center for Education Statistics, 2011).
Even starting before the recession, there has been a reverse trend of transfer of students
transferring from 4-year institutions to community colleges. For example, 14.4% of the students
who started at a 4-year college in the fall of 2005 subsequently transferred to a 2-year college
(National Student Clearinghouse Research Center, 2012). While no individual data were
available, we looked at the institution-level data of incoming students at the liberal arts colleges
included in our analysis. Table 2 shows that the range of SAT and ACT scores narrowed from
2001 to 2010, with the lower bound increasing and the upper bound decreasing. The percentage
of students with higher GPA increased and the percentage with lower GPA decreased. Overall,
there is no consistent evidence suggesting that liberal arts colleges had lower incoming-ability
students in 2010 than in 2001.
30
Figure 14. College enrollment by 2- and 4-year institutions. Adapted from Total Fall
Enrollment in Degree-Granting Institutions, by Control and Level of Institution: 1963
Through 2010, by U.S. Department of Education, National Center for Education Statistics,
2012.
The notion that higher costing 4-year institutions may be able to provide more rigorous
college education than community colleges is challenged by the findings in this study. While the
tuition costs of 4-year public institutions more than doubled, from $6,320 to $14,870 from 1980
to 2010 in constant dollars, the increase in tuition costs of community colleges remained modest
from $5,023 to $7,629 (Snyder & Dillow, 2011, Table 245). The average tuition costs were about
$6,000 for the community colleges and $22,000 for the liberal arts colleges included in this
study. Considering the financial input and learning outcomes, community colleges are
demonstrated to be a viable solution for many students pursuing higher education. A new study
also found that students who earn an associate’s degree at a community college see similar
increases in earnings to those of students who go to a private institution. Given the significantly
higher cost of a for-profit education as compared to a community college education, students
may find that community colleges are better investments for obtaining a degree (Cellini &
Chaudhary, 2012).

31
Consistent Improvement in Critical Thinking
The finding that students made consistent improvement in critical thinking across types
of institutions over the last 10 years was also confirmed in the Wabash national study (Blaich &
Wise, 2011). The Wabash study was created by researchers from multiple institutions and
organizations to develop a longitudinal study that used measures of students’ preparation before
college entrance, experiences in college, and a range of learning outcomes. While students did
not grow on some of the outcomes, they gained 0.44 SD units on the critical thinking measure
developed by ACT. Both being a multiple-choice tests, the ACT critical thinking test and the
EPP critical thinking test used in this study are correlated at .75 (Klein et al., 2009). The Blaich
and Wise (2011) study, however, did not discuss the reasons responsible for the increase in
students’ critical thinking ability.
We speculate that students’ critical-thinking skills benefit from the development of
information technology over the last 10 years as students become more critical consumers of
information from all kinds of sources and on all types of technological platforms. Research also
identified factors that may contribute to students’ critical-thinking and problem-solving skills,
such as course content and curricula, pedagogical strategies, institutions’ hiring practices and
tenure requirements, and accountability systems (Saavedra & Saavedra, 2011). Another possible
reason could be that among the four skill areas measured by the EPP, critical thinking showed
the lowest scale score from 2001 to 2010 (Figure 2), which leaves room for students to improve.
Students’ self-reported engagement also supported the improvement in critical thinking.
CCSSE raised some questions related to critical-thinking skills under the academic challenge
benchmark on topics such as analyzing, synthesizing, making judgments, and applying theories
to ideas, theories, or concepts (for specific questions, see CCSSE, 2011). Students answered
those questions on a four-point scale from very little to very much. Examining those specific
questions from 2005 (Santa Fe Community College, 2005) to 2011 (CCSSE, 2011), we found
that the percent of students answering quite a bit or very much to these critical-thinking-related
questions has increased. Specifically, the percentage of students who answered quite a bit or very
much increased anywhere from 4% to 6%, depending on the question associated with critical-
thinking skills. These results also give insight into the improvement of student critical-thinking
skills over the past 10 years.
32
Gender Gap in Mathematics Performance
The female underperformance in mathematics at community colleges revealed in this
study is consistent with findings from the Grade 12 National Assessment for Educational
Progress (NAEP) in Mathematics. Results on Grade 12 NAEP Math revealed a consistent 3-point
(score scale 100–300) gender gap with males outperforming females from 2005 to 2009 (U.S.
Department of Education, National Center for Education Statistics, 2010). Female
underperformance also resonates with the general underrepresentation of women in STEM
(science, technology, engineering, and mathematics) fields at community colleges and in the
workforce (Azari, 2004; Lester, 2010). From 1997 to 2007, the percentage of baccalaureate
degrees (associate’s degrees and occupational certificates) awarded to females in mathematics
and science decreased from 53.1% to 49.7%, despite the increase in the proportion of female
students in college (Horn & Li, 2010). It is crucial to understand the challenges and barriers
females experience in mathematics at community colleges, and to develop strategies to help
female students overcome those barriers. Prior research has identified an array of social-
psychological, cultural, and institutional factors that may deter women from being successful in
the STEM fields at community colleges, including limited interest in STEM disciplines; low
confidence and self-efficacy levels in STEM fields; inaccurate perceptions of the usefulness of
mathematics and science; lack of support, or even bias, experienced in high school mathematics
and science courses; and lower levels of academic preparation in STEM fields (Lent et al., 2001;
Lester, 2010; Linn & Hyde, 1989; Liu & Wilson, 2009; Starobin & Laanan, 2005). Previous
studies have also revealed that faculty in STEM courses pay less attention to and have lower
expectations for female students as compared to their male counterparts (Warrington & Younger,
2000; Zitteman & Sadker, 2002).
As females comprise 57% of the community college population (AACC, 2012a),
achieving gender equality in mathematics at community colleges is essential. Going forward,
community colleges should focus on providing social and academic support to females, because
encouragement from college instructors, counselors, and female role models can significantly
influence females’ persistence in the STEM fields (Fennema & Peterson, 1985; Schaefers,
Epperson, & Nauta, 1997). Community colleges should also create programs to identify at-risk
females in mathematics, provide more information to female students about the career prospects
for STEM-related fields, and work with local high schools to increase female student college
33
readiness. Faculty could redesign curricula and instructional methods to accommodate female
students’ learning style, as research has shown that females benefit from collaboration,
teamwork, and real-world applications when learning mathematics and science (Osborne, Miller,
& Farabee-Siers, 2008). Community colleges have great potential to facilitate female student
transfer to STEM programs at 4-year institutions and to prepare them for high-paying jobs in
STEM careers, as the earnings of females in STEM-related jobs are 33% higher than those of
females in non-STEM-related jobs (Costello, 2012). The implication for policymakers is that
there is a compelling need to strengthen federal investment in community colleges in support of
women in the STEM fields. Many female students at community colleges need significant
financial support and/or child care services to stay focused and succeed (Costello, 2012).
Performance Gap Disfavoring Ethnic and Language Minority Students
Findings from this study confirmed the importance of attending to the performance of
ethnic and language minority students, as these students tend to be concentrated at community
colleges (Aud et al., 2010; Leinbach & Bailey, 2006). For example, the proportion of Hispanic
high school graduates who attended college increased from 39% to 44% from 2009 to 2010, and
46% of the Hispanic college students attended a community college while only 27% of the White
college students did so (Fry, 2011). Although the enrollment numbers surged for minority
students, the performance gap remains significant. Hispanic and African American students at
community colleges are more likely to take remedial courses than are their White student peers,
have a lower transfer rate to 4-year institutions, and have a lower 6-year completion rate
(Alexander, Garcia, Gonzalez, Grimes, & O’Brien, 2007; Bailey et al., 2005; Bailey et al., 2010).
The low performance of the African American students in the present study (i.e., 0.78 SDs lower
than White students) merits particular attention. Prior research has shown that compared to their
peers, African American students are less likely to progress through the sequences of remedial
courses, and thus they demonstrate disproportionately low performance on a range of outcomes,
such as cumulative GPA, retention, and degree attainment at community colleges (Bailey et al.,
2010; Bush & Bush, 2010).
Racial/ethnic gaps in performance are not new to the educational literature. On Grade 12
NAEP Reading, the African American-White gap was 27 points in 2009 and the Hispanic-White
gap was 22 points. From 2005 to 2009 these gaps remained stable. Similarly, on Grade 12 NAEP
Math, the African American-White gap was 30 points in 2009, and the Hispanic-White gap was
34
23 points. Although both African American and Hispanic students made significant score gains
from 2005 to 2009, White students also made significant improvements, thus resulting in a stable
gap (U.S. Department of Education, National Center for Education Statistics, 2010). Since gaps
in performance were found in Grade 12, it is not surprising that gaps remained in higher
education, especially at community colleges where the population of minority students exceeds
White students.
Language minority students face dual challenges at community colleges; as they struggle
to advance along their academic path, they need to simultaneously increase their English
language proficiency. Deficiencies in language proficiency have been shown to prevent students
from becoming efficient learners of content knowledge (August & Pease-Alvarez, 1996).
Realizing the urgent need to help ESL students, many community colleges have created
programs that provide special services to this group of students, which has resulted in the
creation of successful models for other colleges to adopt. For example, Chisman and Crandall
(2007) evaluated a number of community colleges that developed programs to help ESL learners
succeed and identified common effective strategies, such as integrating English language
learning with content learning, extending learning outside the classroom and adapting
instructional methods and curricula to diverse student needs. Many community college programs
also consider students’ work schedules and family responsibilities in order to tailor to the diverse
population they serve (Center for Applied Linguistics, 2010).
Declining Asian Student Performance
An unexpected finding from the analyses was the declining performance of Asian
students at community colleges. Asian students have been described as model minorities and
high-achieving students at the most selective institutions (Hagedorn, 2004; Suzuki, 2002;
Teranishi, 2002). However, in our analyses, Asian students declined on reading, math, and
critical thinking over the last 10 years despite the fact that all other ethnic groups made progress
on critical thinking (Figure 9). One possible explanation for the finding in this study is that there
have been an increasing number of first-generation Asian immigrants attending community
college over the last 10 years. According to a most recent report released by the Pew Research
Center (2012), Asians have surpassed Hispanic/Latinos in becoming the largest group of
immigrants in 2010. In 2000, about 20% of the immigrants were Asian and 60% were
Hispanic/Latino. By 2010, about 36% were Asian and 31% were Hispanic/Latino (Pew Research
35
Center, 2012). Compared to the second-generation Asian immigrants, the first-generation
immigrants face great financial and linguistic obstacles. While 92% and 55% of second-
generation Asian immigrants have a high-school diploma and attend 4-year institutions,
respectively, such percentages are significantly lower at 75% and 38%, respectively, for the first-
generation Asian immigrants (U.S. Department of Education, National Center for Education
Statistics, 2012). The increasing proportion of first-generation Asian immigrants may have
contributed to the overall decline in the performance of Asian students, as shown in our analysis.
In addition, as Asian students are not a homogeneous group, there could be considerably
large variations among students from different parts of Asia (e.g., East, South). For example,
Korean Asians were found to have higher GPAs, while Filipino Asians were found to have lower
GPAs (Chu, 1991, 1992). County of origin, parental education, and family expectations also
have significant impacts on Asian students’ academic aspirations and achievements (Wang,
Chang, & Lew, 2009). During the 10-year period, the Asian population in U.S. higher education
has gone through tremendous changes. In future research, Asian students should be
disaggregated for a closer examination of the differences among Asian subgroups. Findings from
this study suggest that Asians American students should not be ignored when we study
underperforming minority groups in U.S. higher education, as there is emerging evidence that
Asian students’ performance has been declining. In sum, community college leaders should pay
attention to Asian students’ performance because the percentage of Asian students in community
colleges will likely increase due to the overall increase in the Asian population in the United
States.
Limitations
One limitation of this study is that a convenience sample was used for analyses. Students
included in the analyses may not represent their institution, as they were likely volunteers to take
the test, which is commonly the case when institutions recruit students to take low-stakes
learning outcomes assessment (Liu, 2011a). The institutions included in this study may not also
be representative of their respective institution type. For example, no large, urban-setting
community colleges were included in our analyses. Having said that, based on the decent number
of institutions and the large number of students included in our analyses, our findings are able to
reveal some trends at community colleges over the last 10 years.
36
Another limitation of this study is the lack of information on individual students’ entering
ability. Our data did not include information on students’ college admission scores or high
school GPAs, which could have been used to determine if incoming students had been more
capable during the 10 years analyzed. To alleviate the problem, we included number of credit
hours as a control when analyzing the difference among the four types of institutions. In
addition, we looked at the average academic profile of the incoming students during the last 10
years for the research, comprehensive, and liberal arts universities/colleges.
Conclusions
Community colleges play an increasingly important role in expanding access in U.S.
higher education. Over the past several years, important initiatives such as the Lumina’s Degree
Qualifications Profile and the Association of American Colleges and Universities Valid
Assessment of Learning in Undergraduate Education (VALUE) have developed rubrics that
create a common framework for defining and measuring general competencies that students need
to master for various degrees, including the associate’s degree that community colleges tend to
grant. However, progress in translating the knowledge and skills described in such frameworks
to valid and reliable assessments has been limited (Ewell, 2013). Very little is known about the
psychometric quality of the in-house assessments that some colleges use to measure learning;
similarly, little is known about the degree to which these colleges use assessment practices that
comply with standardized procedures (Nunley et al., 2011). The lack of continuity of data is
another source of concern. In a recent survey conducted by the National Community College
Council for Research and Planning, only 55% of the participating faculty indicated agree or
strongly agree for the statement “My college has several years of student learning outcomes
assessment data” (Nunley et al., 2011). We hope that as colleges advance their assessment
agenda, greater attention will be paid to the quality and continuity of assessment so that
endeavors to assess student learning outcomes produce meaningful and sustainable benefits for
community colleges.
Through a 10-year analysis of 46,403 community college students’ performance on the
EPP, this study has produced a number of significant findings, including: (a) compared to
community colleges, research universities demonstrated predominant advantages in terms of
academic competency; however, students at community colleges significantly outperformed
peers at liberal arts colleges; (b) community college students made significant improvements in
37
critical thinking over the last 10 years; (c) the gender performance gap tended to enlarge at
community colleges, particularly in mathematics; (d) there was an overall performance gap
disfavoring ethnic minority and ESL students at community colleges; (e) the performance
difference between ESL and non-ESL students significantly narrowed at community colleges,
mostly due to ESL students’ increasing performance; (f) Asian students showed declining
performance in multiple domains, including critical thinking; and (g) students’ college GPA
consistently predicts their scores on learning-outcomes assessments. These findings provide
important information about students’ current learning at community colleges, provide
implications for community college administrators, faculty, researchers, and policymakers on
issues related to performance and equity regarding gender and ethnic groups and trends, and
point to the need for community colleges to utilize quality assessments to produce comparable
results for the purposes of program evaluation and improvement.

38
References
Agresti, A. (1990). Categorical data analysis. New York, NY: Wiley.
Alexander, B. C., Garcia, V., Gonzalez, L., Grimes, G., & O’Brien, D. (2007). Barriers in the
transfer process for Hispanic and Hispanic immigrant students. Journal of Hispanic
Higher Education, 6(2), 174–184.
Allen, J., Robbins, S., Casillas, A., & Oh, I. S. (2008). Third-year college retention and transfer:
Effects of academic performance, motivation, and social connectedness. Research in
Higher Education, 49(7), 647–664.
American Association of Community Colleges. (2012a). Community colleges fact sheet.
Retrieved from http: //www.aacc.nche.edu/AboutCC/Documents/FactSheet2012.pdf
American Association of Community Colleges. (2012b). Voluntary framework of accountability.
Retrieved from
http://vfa.aacc.nche.edu/Documents/VFAOutcomesReportWebFINAL.pdf
Astin, A. W. (1993). What matters in college? Four critical years revisited. San Francisco, CA:
Jossey-Bass.
Astin, A. W., Tsui, L., & Avalos, J. (1996). Degree attainment rates at American colleges and
universities: Effects on race, gender, and institutional type. Los Angeles: University of
California, Los Angeles, Higher Education Research Institute.
Aud, S., Hussar, W., Planty, M., Snyder, T., Bianco, K., Fox, M., … Drake, L. (2010). The
condition of education 2010 (NCES 2010–028). Washington, DC: U.S. Department of
Education, National Center for Education Statistics. Retrieved from
http://nces.ed.gov/pubs2010/2010028.pdf
August, D., & Pease-Alvarez, L. (1996). Attributes of effective programs and classrooms serving
English language learners. Santa Cruz, CA: National Center for Research on Cultural
Diversity and Second Language Learning.
Azari, C. E. (2004). Measuring student outcomes in postsecondary vocational education: Using
wage record data. Community College Review, 24, 37–51.
Bailey, T., Calcagno, J. C., Jenkins, D., Kienzl, G., & Leinbach, D. T. (2005). Community
college student outcomes: What institutional characteristics make a difference? New
York, NY: Columbia University, Teachers College, Community College Research
Center.
39
Bailey, T., Calcagno, J. C., Jenkins, D., Leinbach, D. T., & Kienzl, G. (2006). Is student-right-
to-know all you should know? An analysis of community college graduation rates.
Research in Higher Education, 47(5), 491–519.
Bailey, T., Jenkins, D., & Leinbach, D. (2005, September). Graduation rates, student goals, and
measuring community college effectiveness (Issue Brief No. 28). New York, NY:
Columbia University, Teachers College, Community College Research Center.
Bailey, T., Jeong, D. W., & Cho, S. W. (2010). Referral, enrollment, and completion in
developmental education sequences in community colleges. Economics of Education
Review, 29, 255–270.
Blaich, C. F., & Wise, K. S. (2011). From gathering to using assessment results: Lessons from
the Wabash national study (NILOA Occasional Paper No. 8). Urbana, IL: University of
Illinois and Indiana University, National Institute for Learning Outcomes Assessment.
Bush, E. C., & Bush, L. V. (2010). Calling out the elephant: An examination of African
American male achievement in community colleges. Journal of African American Males
in Education, 1(1), 40–62.
Calhoun Community College. (2012). Collegiate assessment of academic proficiency. Retrieved
from http://www.calhoun.edu/sites/www/Uploads/files/IR/CAAP12.pdf
Carnegie Foundation for the Advancement of Teaching. (2010). Basic classification. Retrieved
from http://classifications.carnegiefoundation.org/descriptions/basic.php
Cellini, S. R., & Chaudhary, L. (2012). The labor market returns to a for-profit college
education (NBER Working Paper No. 18343). Cambridge, MA: National Bureau of
Economic Research.
Center for Applied Linguistics. (2010). Education for adult English language learners in the
United States: Trends, research, and promising practices. Washington, DC: Author.
Retrieved from http://www.cal.org/caelanetwork/pdfs/education-for-adult-ells-with-new-
copyright.pdf
Chisman, F., & Crandall, J. (2007). Passing the torch: Strategies for innovation in community
college ESL. New York, NY: Council for Advancement of Adult Literacy. Retrieved
from http://www.caalusa.org/eslpassingtorch226.pdf
Chu, L. T. (1991). Who are the model minorities among the junior college Asian-American
subgroups? Unpublished manuscript. Retrieved from ERIC database. (ED363362)
40
Chu, L. T. (1992). Factors discriminating the academically high, average, and low achievers
among junior college Asian-American students. Dissertation Abstracts International,
52(09A), 3192.
Cofer, J., & Somers, P. (2000). Within-year persistence of students at two-year colleges.
Community College Journal of Research and Practice, 24(10), 785–807.
The College Board. (2001). College handbook 2002 (39th ed.). New York, NY: Author.
The College Board. (2010). College handbook 2012 (48th ed.). New York, NY: Author.
Community College Survey of Student Engagement. (2011). 2011 cohort frequency distributions
academic challenge benchmark. Retrieved from
http://www.ccsse.org/survey/national_benchmark_survey_results/ccsse_ir350_ACCHAL
L_freqs.pdf
Costello, C. B. (2012). Increasing opportunities for low-income women and student parents in
science, technology, engineering, and math at community colleges. Washington, DC:
Institute for Women’s Policy Research. Retrieved from
http://www.iwpr.org/initiatives/student-parent-success-initiative/increasing-opportunities-
for-low-income-women-and-student-parents-in-science-technology-engineering-and-
math-at-community-colleges/
ETS. (2010). ETS Proficiency Profile user’s guide. Princeton, NJ: Author.
Ewell, P. (2013, January). The Lumina degree qualifications profile (DQP): Implications for
assessment (NILOA Occasional Paper No. 16). Urbana, IL: University of Illinois and
Indiana University, National Institute for Learning Outcomes Assessment (NILOA).
Retrieved from http://www.learningoutcomesassessment.org/documents/EwellDQPop1.pdf
Fennema, R., & Peterson, P. (1985). Autonomous learning behavior: A possible explanation of
gender-related differences in mathematics. In L. C. Wilkinson & C. B. Marrett (Eds.),
Gender influences in classroom interaction (pp. 17–35). Orlando, FL: Academic Press.
Fischer, M. J. (2007). Settling into campus life: Differences by race/ethnicity in college
involvement and outcomes. The Journal of Higher Education, 78, 125–161.
Fry, R. (2011). Hispanic college enrollment spikes, narrowing gaps with other groups.
Washington, DC: Pew Hispanic Center. Retrieved from
http://www.pewhispanic.org/2011/08/25/hispanic-college-enrollment-spikes-narrowing-
gaps-with-other-groups/
41
Greene, T. G., Marti, C. N., & McClenney, K. (2008). The effort-outcome gap: Differences for
African American and Hispanic community college students in student engagement and
academic achievement. The Journal of Higher Education, 79, 513–539.
Hagedorn, L. S. (2004). The role of urban community colleges in educating diverse populations.
New Directions for Community Colleges, 127, 21–34.
Hagedorn, L. S., Maxwell W., & Hampton, P. (2001). Correlates of retention for African
American males in community colleges. Journal of College Student Retention Research,
Theory, and Practice, 3(3), 243–263.
Head, R. B., & Johnson, M. S. (2011). Accreditation and its influence on institutional
effectiveness. New Directions for Community Colleges, 153, 37–52.
Hendel, D. D. (1991). Evidence of convergent and discriminant validity in three measures of
college outcomes. Educational and Psychological Measurement, 51, 351–358.
Horn, L., & Li, X. (2010). Table 5: Percentage distribution of subbaccalaureate awards conferred
in Title IV postsecondary institutions by gender, award type, race/ethnicity, and field of
study: 1997, 2002, and 2007. In U.S. Department of Education, National Center for
Education Statistics (Ed.), Stats in brief: changes in postsecondary awards below the
bachelor’s degree: 1997–2007 (NCES 2010–167). Retrieved from
http://nces.ed.gov/pubs2010/2010167.pdf
Hyers, D. A., & Zimmerman, A. (2002). Using segmentation modeling to predict graduation at a
two-year technical college. Community College Review, 30(1), 1–26.
Kelly, P. J. (2010). Closing the college attainment gap between the U.S. and most educated
countries, and the contributions to be made by the States. Retrieved from
http://www.nchems.org/pubs/detail.php?id=129
Klein, S., Liu, O. L., Sconing, K., Bolus, R., Bridgeman, B., Kugelmass, H., … Steedle, J.
(2009). Test validity study (TVS) report. New York, NY: Collegiate Learning
Assessment.
Kuh, G. (2003). What we’re learning about student engagement from NSSE. Change, 35(2), 24–
32.
Kuh, G., & Ikenberry, S. (2009). More than you think, less than we need: Learning outcomes
assessment in American higher education. Urbana, IL: University of Illinois and Indiana
42
University, National Institute for Learning Outcomes Assessment (NILOA). Retrieved
from http://www.learningoutcomeassessment.org/documents/fullreportrevised-L.pdf
Laitinen, A. (2012). Cracking the credit hours. Washington, DC: New America Foundation and
Education Sector.
Lakin, J. M., Elliott, D. C., & Liu, O. L. (2012). Investigating ESL students’ performance on
outcomes assessments in higher education. Educational and Psychological Measurement.
doi: 10.1177/0013164412442376
Leinbach, D. T., & Bailey, T. R. (2006). Access and achievement of Hispanics and Hispanic
immigrants in the colleges of the City University of New York. New York, NY: Columbia
University, Teachers College, Community College Research Center.
Lent, R. W., Brown, S. D., Brenner, B., Chopra, S., Davis, T., Talleyrand, R., & Suthakaran, V.
(2001). The role of contextual supports and barriers in the choice of math/science
educational options: A test of social cognitive hypotheses. Journal of Counseling
Psychology, 48, 474–483.
Lester, J. (2010). Women in male-dominated career and technical education programs at
community colleges: Barriers to participation and success. Journal of Women and
Minorities in Science and Engineering, 16(1), 51–66.
Linn, M., & Hyde, J. (1989). Gender, mathematics, and science. Educational Researcher, 18(8),
17–27.
Liu, O. L. (2011a). Outcomes assessment in higher education: Challenges and future research in
the context of Voluntary System of Accountability. Educational Measurement: Issues
and Practice, 30(3), 2–9.
Liu, O. L. (2011b). Value-added assessment in higher education: A comparison of two methods.
Higher Education, 61(4), 445–461.
Liu, O. L. (2012, April). Measuring learning outcomes assessment in higher education:
Motivation matters. Paper presented at the 2012 annual conference of the National
Council on Measurement in Education, Vancouver, BC, Canada.
Liu, O. L., Bridgeman, B., & Adler, R. M. (2012). Measuring learning outcomes in higher
education: Motivation matters. Educational Researcher, 41, 352–362.
Liu, O. L., & Wilson, M. (2009). Gender differences in large-scale mathematics assessments:
PISA trend 2000 & 2003. Applied Measurement in Education, 22(2), 164–184.

43
Makuakane-Drechsel, T., & Hagedorn, L. S. (2000). Correlates of retention for Asian Pacific
Americans in community colleges. The case for Hawaiian students. Journal of Research
and Practice, 24(8), 639–656.
Marr, D. (1995). Validity of the academic profile. Princeton, NJ: ETS.
Marti, N. (2009). Dimensions of student engagement in American community colleges: Using
the community college student report in research and practice. Community College
Journal of Research and Practice, 33, 1–24.
McClenney, K. M. (2007). Research update: The community college survey of student
engagement. Community College Review, 35(2), 137–146.
Miller, K. K. (2006). The impact of remedial mathematics on the success of African American
and Latino male community college students (Doctoral dissertation). Retrieved from
ProQuest Dissertations and Theses database. (UMI No. 3257667)
Mortenson, T. (1997). Actual versus predicted institutional graduation rates for 1100 colleges
and universities. Oskaloosa, IA: Postsecondary Education Opportunity.
Mullin, C. M., & Phillippe, K. (2009, December). Community college enrollment surge: An
analysis of estimated fall 2009 headcount enrollments at community colleges (AACC
Policy Brief 2009-01PBL). Washington, DC: American Association of Community
Colleges.
Napoli, A. R., & Wortman, P. M. (1998). Psychosocial factors related to retention and early
departure of two-year community colleges students. Research in Higher Education,
39(4), 419–456.
National Student Clearinghouse Research Center. (2012). A reverse transfer: A national view of
student mobility from four-year to two-year institutions. Herndon, VA: Author.
Nunley, C., Bers, T., & Manning, T. (2011, July). Learning outcomes assessment in community
colleges (NILOA Occasional Paper No. 10). Urbana, IL: University of Illinois and
Indiana University, National Institute for Learning Outcomes Assessment (NILOA).
Retrieved from
http://www.learningoutcomeassessment.org/documents/CommunityCollege.pdf
Osborne, L., Miller, K., & Farabee-Siers, R. (2008). Pedagogical methods for improving
women’s participation and success in engineering education: A review of recent
44
literature. National Academy of Engineering/CASEE and Institute for Women’s Policy
Research: Washington, DC.
Pascarella, E. T., & Terenzini, P. T. (1991). How college affects students: Findings and insights
from twenty years of research. San Francisco, CA: Jossey-Bass.
Pascarella, E. T., & Terenzini, P. T. (2005). How college affects students: A third decade of
research. San Francisco, CA: Jossey-Bass.
Pew Research Center. (2012). The rise of Asian Americans. Washington, DC: Author.
Porchea, S. F., Allen, J., Robbins, S., & Phelps, R. P. (2010). Predictors of long-term enrollment
and degree outcomes for community college students: Integrating academic,
psychosocial, socio-demographic, and situational factors. The Journal of Higher
Education, 81(6), 750–778.
Provasnik, S., & Planty, M. (2008). Community colleges: Special supplement to the condition of
education 2008. Washington, DC: National Center for Education Statistics.
Provezis, S. (2010). Regional accreditation and student learning outcomes: Mapping the
territory (NILOA Occasional Paper No. 5). Urbana, IL: University of Illinois and Indiana
University, National Institute for Learning Outcomes Assessment (NILOA). Retrieved
from http://www.learningoutcomeassessment.org/documents/Provezis.pdf
Robbins, S., Allen, J., Casillas, A., Peterson, C. H., & Le, H. (2006). Unraveling the differential
effects of motivational and skills, social, and self-management measures from traditional
predictors of college outcomes. Journal of Educational Psychology, 98, 598–616.
Ryan, J. F. (2004). The relationship between institutional expenditures and degree attainment.
Research in Higher Education, 45, 97–114.
Saavedra, A. F., & Saavedra, J. E. (2011). Do colleges cultivate critical thinking, problem
solving, writing and interpersonal skills? Economics of Education Review, 30(6), 1516–
1526.
Santa Fe Community College. (2005). The community college student report 2005: All 2005
participants. Retrieved from http://www.sfcc.edu/sfcc/files/1125.pdf
Schaefers, K. G., Epperson, D. L., & Nauta, M. M. (1997). Women’s career development: Can
theoretically derived variables predict persistence in engineering majors? Journal of
Counseling Psychology, 44, 173–183.
45
Snyder, T., & Dillow, S. (2011). Digest of education statistics 2010. Retrieved from
http://nces.ed.gov/pubs2011/2011015.pdf
Starobin, S. S., & Laanan, F. S. (2005). Influence of precollege experience on self-concept
among community college students in science, mathematics, and engineering. Journal of
Women and Minorities in Science and Engineering, 11, 209–229.
Suzuki, B. H. (2002). Revisiting the model minority stereotype: Implications for student affairs
practice and higher education. New Directions for Student Services, 97, 21–32.
Teranishi, R. T. (2002, Winter). The myth of the super minority: Misconceptions about Asian
Americans. The College Board Review, 195, 16–21.
Tinto, V. (1993). Leaving college: Rethinking the causes and cures of student attrition (2nd ed.).
Chicago, IL: University of Chicago Press.
U.S. Department of Education, National Center for Education Statistics. (2010). The nation’s
report card: Grade 12 reading and mathematics 2009 national and pilot state results
(NCES 2011–455). Washington, DC: Author.
U.S. Department of Education, National Center for Education Statistics. (2011). Total fall
enrollment in degree-granting institutions, by control and level of institution: 1963
through 2010. Retrieved from
http://nces.ed.gov/programs/digest/d11/tables/dt11_199.asp
U.S. Department of Education, National Center for Education Statistics. (2012). New Americans
in postsecondary education. Washington, DC: Author.
Wang, W. W., Chang, J. C., & Lew, J. W. (2009). Reasons for attending, expected obstacles, and
degree aspirations of Asian Pacific American community college students. Community
College Journal of Research and Practice, 33, 571–593.
Warrington, M., & Younger, M. (2000). The other side of the gender gap. Gender and
Education, 12(4), 492–508.
Zeidenberg, M. (2012). Valuable learning or “spinning their wheels”? Understanding excess
credits earned by community college associate degree completers (CCRC Working Paper
No. 44). New York, NY: Community College Research Center, Teachers College,
Columbia University.
Zittleman, K., & Sadker, D. (2002). Gender bias in teacher education texts: New (and old)
lessons. Journal of Teacher Education, 53(2), 168–180.