Embed Size (px)
Citation preview

INVESTIGATING AND VISUALIZING MEASUREMENT ERROR
FOR NOVICE “STEM” LEARNERS
Scott A. Sinex [email protected]
Department of Physical Sciences and Engineering Prince George’s Community College
Largo, MD 20774-2199
Abstract: At some point students reach the course that addresses the propagation of errors after answering the question “What errors influence your results?” in umpteen different experiments plus maybe a few percent error calculations. Dealing with error is a mindset that requires developing over time. Why not start the process as soon as measurement occurs? This is in line with the Analyzing and Interpreting Data section of the Next Generation Science
Standards. To study errors, the novice learner needs to make experimental errors in relatively simple situations that allow comparison to near errorless situations. Now students can discover the influence of the error and study its behavior by further numerical experimentation.
Over the last decade as mathematical modeling of data has become a larger part of the scientific experience for students, more investigation of errors has been incorporated. The approach includes both actual experimentation with analysis and the use of simulations. The tool of choice for modeling data and constructing interactive animated simulations is the spreadsheet. A variety of discovery-learning tools to examine random and systematic errors have been developed. Students gain hands-on experience with a number of experiments and subsequent data analysis. Then they extend their experience using prebuilt interactive animated simulations to enhance their conceptual understanding and foster deeper learning of multivariable systems.
How do instructors change their pedagogical approach? They learn how the spreadsheet simulations can be used to explore and discover concepts, enhance science process, and foster higher-order thinking. Instructors can convert a classic lecture into a discussion using dynamic spreadsheet simulations and asking “what if” questions. Students experience a predict-test-analyze cycle where they must explain what they observe with instructor guidance. The simple computational mechanics of inducing the various errors and how they influence linear models are discussed. Students deal with errors in a large variety of situations including error simulations and analysis for numerous topics.
All materials and numerous other prebuilt spreadsheets plus instructions for developing interactive Excel spreadsheets available free to download are accessible at http://academic.pgcc.edu/~ssinex/excelets/matsci_excelets.htm.
Key words: discovery learning, spreadsheet simulations, random and systematic errors
222
Proceedings of the Spring 2013 Mid-Atlantic Section Conference of the American Society of Engineering Education
Introduction:
Getting students to deal with measurement error is not a trivial task, but is the hallmark of a good scientist and engineer. So many K-16 laboratory activities tend to explore a single dependent variable as the independent variable in changed. Then students address the question: “What errors influence your results?” This is an important question to address; however, novice learners need to investigate error not have it thrown in as an after thought to an experiment.
The NRC’s A Science Framework for K-12 Science Education [1] and the Next Generation
Science Standards [2] are setting the bar high to change how science and engineering are approached in K-12. Plus mathematical modeling is an important part of the Common Core Standards in Mathematics [3] in K-12, and at the college level, has been endorsed by AMATYC [4] and MAA [5]. Surely the college science, mathematics, and ASEE engineering [6] communities will need to respond as the 21st-century classroom evolves. We cannot just keep lecturing!
In this paper, readers will see how animated interactive learning tools can be constructed from an off-the-shelf piece of software, the spreadsheet, to get students to discover concepts involving error analysis. Underlying mathematics is at first camouflaged and then it surfaces as students explore concepts. Students explore multivariable simulations and see how mathematical models are influenced by both random and systematic errors. In general the approach given here increases the amount of mathematical modeling and computational thinking. Spreadsheets are ideal for data > model > simulation for beginning students.
Why use simulations in the classroom? Mathematical modeling and simulations are tools to create an engaging pedagogy and deeper learning [7]. Fan and Geelan [8] have reviewed the educational use of simulations and developed a four-fold framework for considering the impacts of interactive simulations in the classroom. There four key issues are summarized in Table 1 along with how the interactive Excel spreadsheets discussed here support this framework.
Hands-on Experimental Venue for Students:
To get students building mathematical models with no prior experience with linear regression, a number of simple experiments with easy measurements have been developed that use “just add data” prebuilt spreadsheets. The use of the coefficient of determination, r2, is introduced and used to judge goodness of fit of the best-fit line produced by linear regression. Table 2 describes three introductory experiments [9, 10, 11] and one more advanced follow-up experiment [12] for students to perform and begin dealing with experimental measurement error. These experiments yield linear models with high r2 values near one to assure there linear nature due to the consistent manufacturing of the materials used in each experiment. These experiments are suitable for any physical sciences, introductory engineering, and math classes and only require algebra I skills. Hence they could be done in middle-high school through undergraduate college classes.
Through experimentation, students derive simple well-behaved linear models where an understanding can be developed and they relate physical parameters to mathematical variables. A start to this is having students write the mathematical relationship or equation in terms of the actual measured variables and not x and y. The spreadsheet simulations include exploring the experimental variables as well. Then add variation to the physical parameters to investigate
223
Proceedings of the Spring 2013 Mid-Atlantic Section Conference of the American Society of Engineering Education

Table 1 – What do Interactive Excel Spreadsheets bring to the classroom?
Framework Element [8] How interactive Excel spreadsheets or
Excelets support
Sparking motivation to learn science Hands-on, minds-on, visual in nature Brings mathematics alive See what happens – rapid feedback
Developing conceptual understanding
Develop mathematical relationships using multivariable systems Scaffolding of learning Rule of Four in mathematics- numerical/graphical/equation/verbal Strengthens connection between math and science (algebraic and scientific thinking)
Promoting science process skills and understanding of the nature of science
Using a guided-inquiry approach – predictions, interpretation, conclusions Handling error and its analysis Investigating/experimenting to explore concepts Developing computational skills by modeling data
Developing students’ skills in scientific discourse and argumentation and
identification with science learning
Explanations of what happens when variables are adjusted Providing evidence of support Analysis of mathematical model behavior Goodness of fit – How good is the model? Class data comparisons in Google Drive
model behavior. More complicated models can be introduced and multivariable systems easily explored. This allows progression from simple to multivariable models and sets up exploring the propagation of errors at a much later time. Animated interactive spreadsheets to introduce linear regression [13], interpolation and extrapolation [13], and handling outliers [14] are provided and discussed as students progress in developing their mathematical modeling skills.
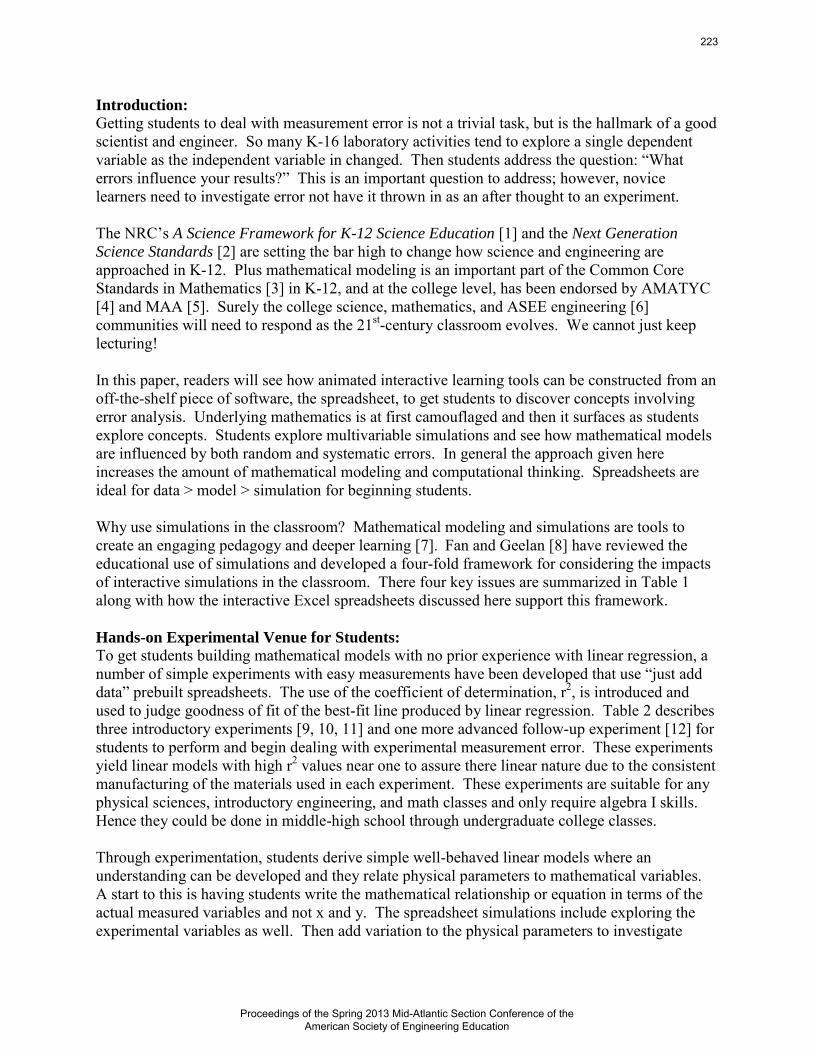
The “Investigating the Height of a Stack of Cookies” activity [15] illustrates the scientific process and use of modeling and simulation of the first three introductory experiments (see Figure 1). Using a “just add data” prebuilt spreadsheet, students place collected data into yellow cells and a mathematical model is displayed on the graph. Predictions can be made using the yellow cell (done by using the algebraic rearrangement of the model equation). The simulation box to the lower right, adds a green line with an adjusted slope to slow how average thickness of the cookies influences the model. Next, students investigate the addition of random error to discover how it adds scatter to the data points around the regression line and how it influences the value of r2 (lowers it). As this is a random process, it takes multiple trials by students (they must experiment) to see how it influences the slope and y-intercept in random fashion. This explores the addition of variation to the cookie thickness. Students should discover from the
224
Proceedings of the Spring 2013 Mid-Atlantic Section Conference of the American Society of Engineering Education

Table 2 – Hands-on Experiments for Investigating and Simulating Errors Experiment Measurement Linear Model* Possible Errors Simulation Follow-up
Investigating the Height of a Stack of
Cookies** [9]
Height by ruler to nearest
millimeter
H = tn where H is stack height, cm, n is number of cookies in stack, t is slope
(average thickness of cookies, cm/cookie)
-Influence of thickness variation
-Ruler error especially zero placement from end
-Variation of average cookie thickness
-Addition of random error & influence on scatter of data and r-squared value -Cause of y-intercept in
regression results
Measuring the Stack Height of Nested
Styrofoam Cups** [10]
Height by ruler to nearest
millimeter
H = hrimn + hbase where H is the stack height, cm, n is the number of nested cups, hrim
(rim height of cup) is the slope, hbase (base height of cup) is the
y-intercept
-A number of possible errors due to rim and base
height variations, plus how experiment is done -Ruler error especially
zero placement from end
-Rim & base heights are explored to relate to
model -Systematic & random
errors are explored
Nuts and Bolts of Extrapolation**
[11]
Mass by balance to
0.01g
Mtotal = mnutn + mbolt where Mtotal is the total mass, n is the number of nuts added, mnut is the average mass of the nuts
(slope) and mbolt is the y-intercept (The bolt mass, mbolt,
is found by extrapolation)
-Massing errors -Hand-drawn graph &
eye-ball line fit to derive equation algebraically
-Actually mass bolt and determine %error
-Best-fit line found by linear regression
(compared to hand-drawn graph values)
-Addition of random error -Can vary material density
Nuts and Bolts of Let’s Make an Error
(more advanced follow-up activity)
[12]
Mass by balance to
0.01g
-Same as above but add washers to cause positive
systematic errors -Calibrate balance with
standard masses (cheap set) to explore y = x comparison plot
-Graphing and linear regression analysis in Excel
-Constant & proportional systematic errors are
discovered & explored graphically compared to
“errorless” data -Errant nut (different
density) explored
-All aspects explored to allow students to verify
experimental results especially density & position of errant nut
-Explore balance errors -Addition of random error
* Students should get r-squared values of near one (consistent manufacturing) ** No prior modeling experience needed by students (all built into spreadsheet)
225
Proceedings of the Spring 2013 Mid-Atlantic Section Conference of the American Society of Engineering Education
model’s slope that the cookies have a relative constant thickness or uniformity of thickness in manufacturing.
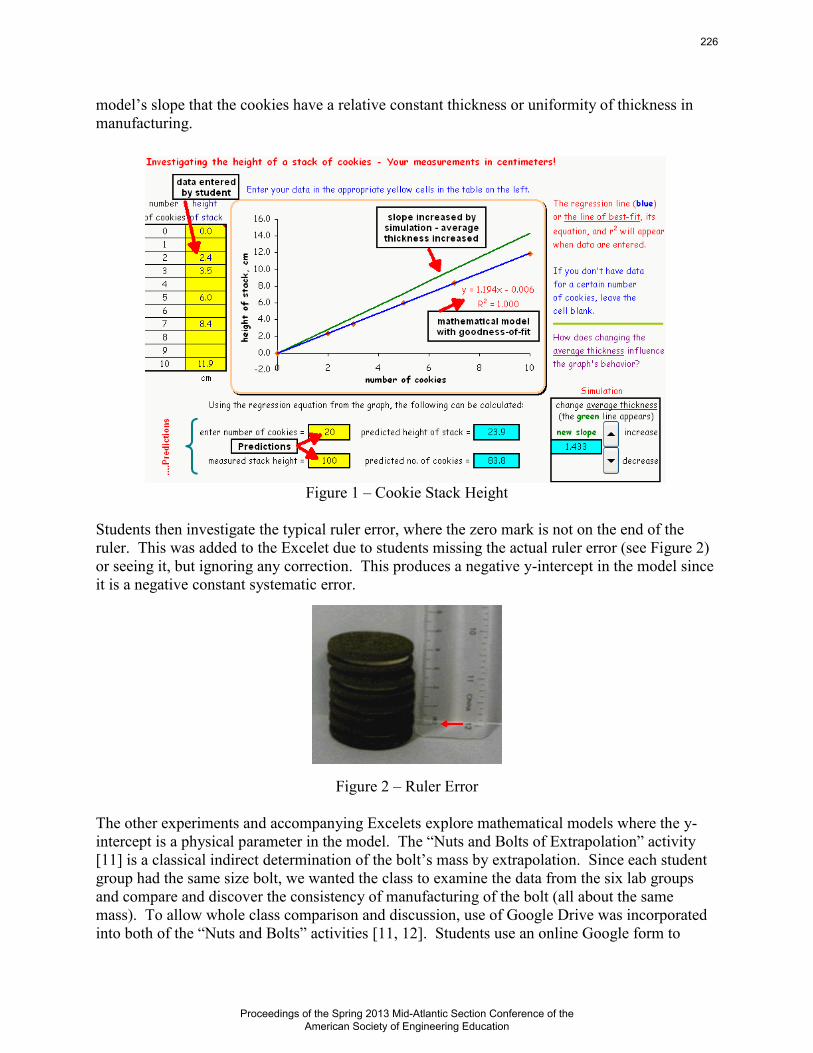
Figure 1 – Cookie Stack Height Students then investigate the typical ruler error, where the zero mark is not on the end of the ruler. This was added to the Excelet due to students missing the actual ruler error (see Figure 2) or seeing it, but ignoring any correction. This produces a negative y-intercept in the model since it is a negative constant systematic error.
Figure 2 – Ruler Error
The other experiments and accompanying Excelets explore mathematical models where the y-intercept is a physical parameter in the model. The “Nuts and Bolts of Extrapolation” activity [11] is a classical indirect determination of the bolt’s mass by extrapolation. Since each student group had the same size bolt, we wanted the class to examine the data from the six lab groups and compare and discover the consistency of manufacturing of the bolt (all about the same mass). To allow whole class comparison and discussion, use of Google Drive was incorporated into both of the “Nuts and Bolts” activities [11, 12]. Students use an online Google form to
226
Proceedings of the Spring 2013 Mid-Atlantic Section Conference of the American Society of Engineering Education

submit data, then open a Google spreadsheet to examine the data, and finally use the chat feature to discuss the data in an emulated online collaboration. This allowed for discourse [16] as the instructor guided the chat and students needed to provide evidence for any claim made [17]. Getting students to see consistency proved to be difficult (they equated consistency with constant, i.e. – no variation). To get them to view a small difference as consistent, we added a ringer bolt (noticeably higher mass by 6 grams). This got them to see the consistent mass of the other five bolts in the data. Students must plot and interpret a hand-drawn graph of their data and determine the bolt mass by extrapolation of the line to the y-intercept in the “Nuts and Bolts of Extrapolation” activity [11]. In Figure 3, the Google spreadsheet data is plotted as the extrapolated bolt mass as a function of the bolt mass by the balance for 53 groups of students performing the activity. The typical bolt mass is shown in blue, while the limited ringer bolt mass is shown in red. The plot shows the large variation in the y-axis of the graphically interpreted results by the students compared to the fairly consistent mass by balance data on the x-axis. The insert shows the expansion of the area where 74% of the results occur (37 of 50).
Figure 3 – Student Data for the “Nuts and Bolts of Extrapolation” Activity
227
Proceedings of the Spring 2013 Mid-Atlantic Section Conference of the American Society of Engineering Education
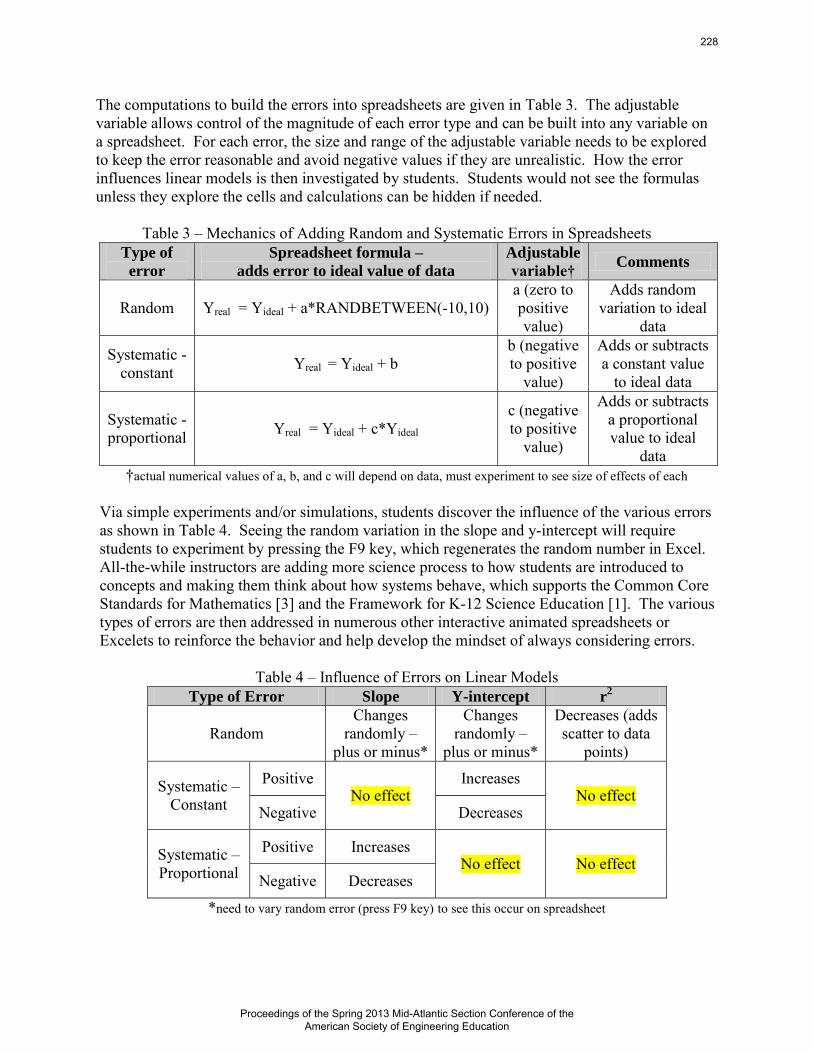
The computations to build the errors into spreadsheets are given in Table 3. The adjustable variable allows control of the magnitude of each error type and can be built into any variable on a spreadsheet. For each error, the size and range of the adjustable variable needs to be explored to keep the error reasonable and avoid negative values if they are unrealistic. How the error influences linear models is then investigated by students. Students would not see the formulas unless they explore the cells and calculations can be hidden if needed.
Table 3 – Mechanics of Adding Random and Systematic Errors in Spreadsheets
Type of
error
Spreadsheet formula –
adds error to ideal value of data
Adjustable
variable† Comments
Random Yreal = Yideal + a*RANDBETWEEN(-10,10) a (zero to positive value)
Adds random variation to ideal
data
Systematic - constant Yreal = Yideal + b
b (negative to positive
value)
Adds or subtracts a constant value
to ideal data
Systematic - proportional Yreal = Yideal + c*Yideal
c (negative to positive
value)
Adds or subtracts a proportional value to ideal
data †actual numerical values of a, b, and c will depend on data, must experiment to see size of effects of each
Via simple experiments and/or simulations, students discover the influence of the various errors as shown in Table 4. Seeing the random variation in the slope and y-intercept will require students to experiment by pressing the F9 key, which regenerates the random number in Excel. All-the-while instructors are adding more science process to how students are introduced to concepts and making them think about how systems behave, which supports the Common Core Standards for Mathematics [3] and the Framework for K-12 Science Education [1]. The various types of errors are then addressed in numerous other interactive animated spreadsheets or Excelets to reinforce the behavior and help develop the mindset of always considering errors.
Table 4 – Influence of Errors on Linear Models Type of Error Slope Y-intercept r
2
Random Changes
randomly – plus or minus*
Changes randomly –
plus or minus*
Decreases (adds scatter to data
points)
Systematic – Constant
Positive No effect
Increases No effect
Negative Decreases
Systematic – Proportional
Positive Increases No effect No effect
Negative Decreases
*need to vary random error (press F9 key) to see this occur on spreadsheet
228
Proceedings of the Spring 2013 Mid-Atlantic Section Conference of the American Society of Engineering Education

Exploring with Simulations: For students new to simulations, instructors may need to explain that only one variable at a time is changed and to explore this variable over the full range. Then set it back to its original value and explore another variable. In the “Nuts and Bolts of Extrapolation” activity, the density of both the nuts and bolt can be explored to see how material density influences the mathematical model. Before going to the simulation, ask students to predict what would happen to the model if the densities of the nuts were different. Would the mass determination of the original bolt be in error? Then allow the students to explore and address the same questions. Figure 4 shows that the use of magnesium nuts would decrease the slope of the model but not influence the mass of a stainless steel bolt. This is a nice step-up for the errant nut in the “Nuts and Bolts of Let’s Make an Error” activity.
Figure 4 – Nuts and Bolt Excelet – The Material Density tab As part of the MatSci Excelets collection of interactive animated spreadsheets [18], a section on “Materials and Measurement” has been added. This was the outgrowth of developing support material for students from the “Nuts and Bolts of Let’s Make an Error” experiment [12]. Here a variety of concepts are addressed in interactive fashion such as ruler and measurement error, minimizing random error, error bars, and balance calibration. How do you compare data from two difference sources? This could be two different methods or the same method and two different analysts. Figure 5 illustrates the comparison and difference plots where the student explores the three errors to examine the behavior of the data especially as it compares to the y = x line. An instructor could pose questions in a lecture and elicit discussion from students or assign exploration as an in-class activity or out-of-class project. The difference in the behavior of the absolute and relative (percentage) errors is also demonstrated in Figure 5.
229
Proceedings of the Spring 2013 Mid-Atlantic Section Conference of the American Society of Engineering Education
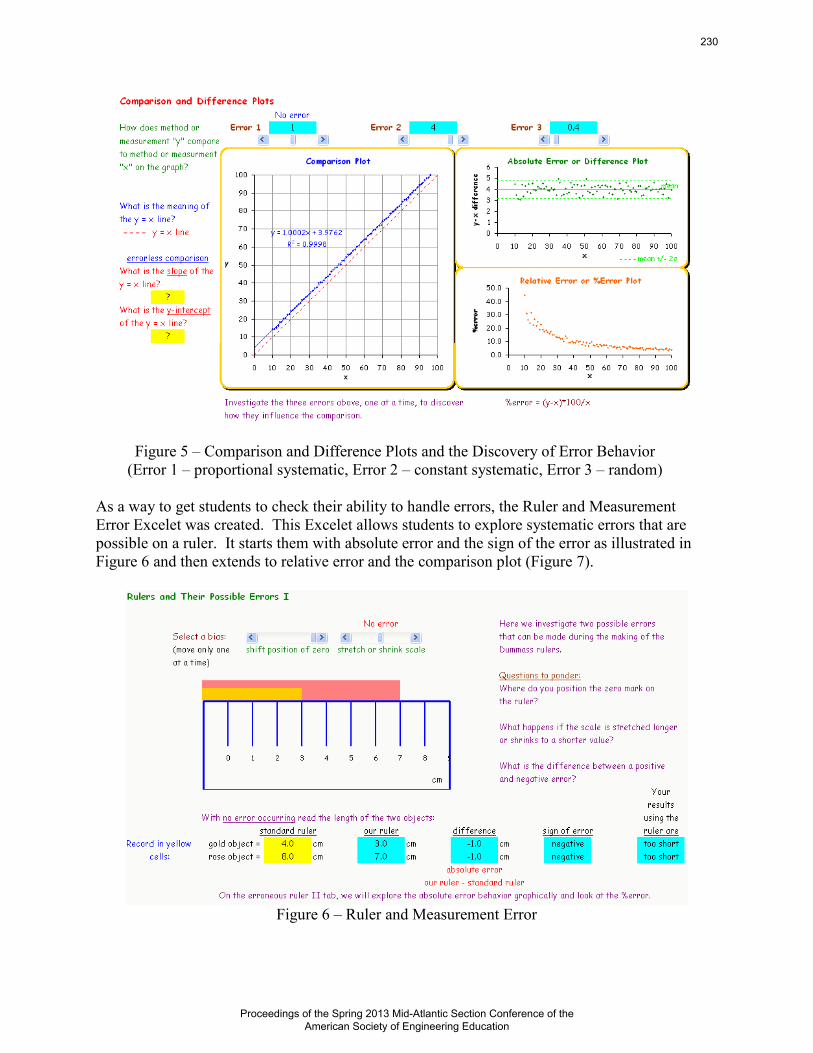
Figure 5 – Comparison and Difference Plots and the Discovery of Error Behavior
(Error 1 – proportional systematic, Error 2 – constant systematic, Error 3 – random) As a way to get students to check their ability to handle errors, the Ruler and Measurement Error Excelet was created. This Excelet allows students to explore systematic errors that are possible on a ruler. It starts them with absolute error and the sign of the error as illustrated in Figure 6 and then extends to relative error and the comparison plot (Figure 7).
Figure 6 – Ruler and Measurement Error
230
Proceedings of the Spring 2013 Mid-Atlantic Section Conference of the American Society of Engineering Education

Figure 7 – Ruler and Measurement Error – the next step The Ruler and Measurement Error Excelet then has students analyze data (containing a variety of bundlers in manufacturing) to see if they can address the various errors to develop an understanding of systematic errors. This also permits students to develop their computational skills with spreadsheets by modeling data with a variety of errors. Pedagogical Approach by Instructors:
In the classic scientific approach, students would collect data, derive a mathematical model, and then maybe build a simulation to explore further (ideal in a spreadsheet environment). The approach presented here (Figure 8) rearranges this classic view and gets students modeling by using “just add data” spreadsheets and using simulations faster. They get to do predictions, run the simulation and see what happens, and then explain things where the instructor can serve as a guide. This sets up a predict-test-analyze cycle that students go through as they investigate a number of variables plus gets them writing explanations as to what happens.
Figure 8 - The approach illustrated in the Table 2 experiments
231
Proceedings of the Spring 2013 Mid-Atlantic Section Conference of the American Society of Engineering Education
This adds science process and discourse to any activity using a simulation. It allows students to see they can do science! The simulations take a more multivariable approach to systems than usually explored in the laboratory. As more random error is added, students get to see how noise or scatter develops in the data to give a more realistic approach. Students often have trouble seeing trends in noisy data. Many other interactive animated spreadsheets or Excelets explore concepts starting with the multivariable simulation (no experimental data collection). These are easily used in class to drive concept discovery by students. Numerous other prebuilt spreadsheets and instructions for developing are available free to download from the MatSci Excelets website [18] including the new section on “Materials and Measurement.” Student Feedback:
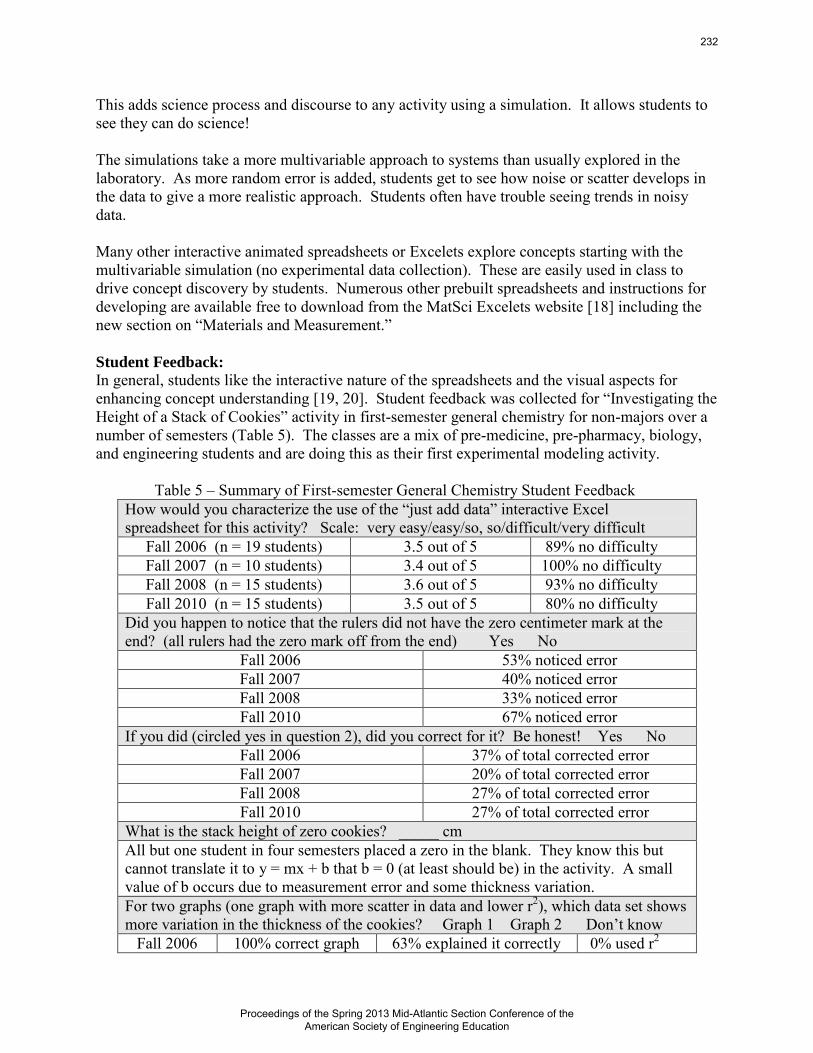
In general, students like the interactive nature of the spreadsheets and the visual aspects for enhancing concept understanding [19, 20]. Student feedback was collected for “Investigating the Height of a Stack of Cookies” activity in first-semester general chemistry for non-majors over a number of semesters (Table 5). The classes are a mix of pre-medicine, pre-pharmacy, biology, and engineering students and are doing this as their first experimental modeling activity.
Table 5 – Summary of First-semester General Chemistry Student Feedback How would you characterize the use of the “just add data” interactive Excel spreadsheet for this activity? Scale: very easy/easy/so, so/difficult/very difficult
Fall 2006 (n = 19 students) 3.5 out of 5 89% no difficulty Fall 2007 (n = 10 students) 3.4 out of 5 100% no difficulty Fall 2008 (n = 15 students) 3.6 out of 5 93% no difficulty Fall 2010 (n = 15 students) 3.5 out of 5 80% no difficulty
Did you happen to notice that the rulers did not have the zero centimeter mark at the end? (all rulers had the zero mark off from the end) Yes No
Fall 2006 53% noticed error Fall 2007 40% noticed error Fall 2008 33% noticed error Fall 2010 67% noticed error
If you did (circled yes in question 2), did you correct for it? Be honest! Yes No Fall 2006 37% of total corrected error Fall 2007 20% of total corrected error Fall 2008 27% of total corrected error Fall 2010 27% of total corrected error
What is the stack height of zero cookies? _____ cm All but one student in four semesters placed a zero in the blank. They know this but cannot translate it to y = mx + b that b = 0 (at least should be) in the activity. A small value of b occurs due to measurement error and some thickness variation. For two graphs (one graph with more scatter in data and lower r2), which data set shows more variation in the thickness of the cookies? Graph 1 Graph 2 Don’t know
Fall 2006 100% correct graph 63% explained it correctly 0% used r2
232
Proceedings of the Spring 2013 Mid-Atlantic Section Conference of the American Society of Engineering Education

Fall 2007 100% correct graph 80% explained it correctly 30% used r2
Fall 2008 93% correct graph 73% explained it correctly 8% used r2
Fall 2010 80% correct graph 73% explained it correctly 33% used r2
A majority of students do not find the activity and use of the interactive animated spreadsheet simulation difficult to use. For novice students, they do not notice the ruler error and for those students that do, many do not correct for the error. Trying to relate the model equation to the idea that it should have a zero y-intercept (or very small value) does not come through. Students grasp the concept of variation in the data and see the scatter on the graph, but are not yet using the r2 value to aid their interpretation. However, for a first experience with mathematical modeling it is not bad plus they got to eat the cookies on completion of the activity. The “Investigating the Height of a Stack of Cookies” activity [15] has been used for introducing middle and high school teachers to mathematical modeling and simulation as part of the Pittsburgh Supercomputing Center CAST Professional Development Program modules for Computational Reasoning in High School Science and Math [21]. It was very well received. In-service teachers noticed the ruler error and corrected the problem. A comment by a teacher: “Modeling in Excel can be used in all subjects, but this one on stacking cookies specifically math and science - asking models to relate a concept and make connections such as slope and linear regression.” Some Final Thoughts:
The use of interactive Excel spreadsheets or Excelets provides discovery learning tools for math, science, and engineering concepts using an off-the-shelf piece of software [13]. Error analysis can be approached from a simple experimental point of view to allow students first-hand experience and then extended further in other topics. Instructors can change their classroom presentation to enhance science process and engage students. Students in more advanced or honors classes could develop their own interactive Excel spreadsheets. Interactive Excel spreadsheets have proven to be valuable modeling tool for teacher training (see PSC CAST modules [21]). All materials and numerous other prebuilt spreadsheets plus instructions for developing interactive Excel spreadsheets available free to download are accessible at http://academic.pgcc.edu/~ssinex/excelets/matsci_excelets.htm. For anyone who wants to take Excel to high-powered computations, see [22]. This work was supported by the NSF Division of Materials Research Partnership for Research and Education in Materials (PREM) Grant Numbers DMR-0611595 and DMR-1205608.
References: [1] National Research Council (NRC). A Framework for K-12 Science Education: Practices, Crosscutting
Concepts, and Core Ideas (2012), http://www.nap.edu/catalog.php?record_id=13165. [2] Next Generation Science Standards, http://www.nextgenscience.org/. [3] Common Core Standards for Mathematics, http://www.corestandards.org/Math.
233
Proceedings of the Spring 2013 Mid-Atlantic Section Conference of the American Society of Engineering Education
[4] American Mathematical Association for Two-Year Colleges (AMATYC) Right Stuff Project, http://www.therightstuff.amatyc.org. [5] Mathematical Association of America’s (MAA) CRAFTY Guidelines for College Algebra, http://www.maa.org/cupm/crafty/CRAFTY-Coll-Alg-Guidelines.pdf. [6] American Society for Engineering Education, Innovation with Impact (2012), http://www.asee.org/about-us/the-organization/advisory-committees/Innovation-With-Impact/Innovation-With-Impact-Report.pdf. [7] M.A. Honey and M.L. Hilton, Eds., Learning Science through Computer Games and Simulations, National Research Council, National Academy Press (2011). [8] X. Fan and D.R.Geelan, Enhancing Students’ Scientific Literacy in Science Education using Interactive
Simulations: A Critical literature Review, J. Computer in Mathematics & Science Teaching 32 (2) (2013)125-171. [9] S.A. Sinex, B.A. Gage, and P.J. Beck, Exploring Measurement Error with Cookies: A Real and Virtual
Approach via Interactive Excel, The AMATYC Review 29 (1) (2007) 46-53. [10] S.A. Sinex, Scientific and Algebraic Thinking: Visualizing with Interactive Excel and Nested Styrofoam
Cups, On-Line Proceedings of the 34th Annual Conference of the American Mathematical Association of Two-Year Colleges in Washington, DC (2008). [11] S.A. Sinex, T.L. Chambers, and J.B. Halpern, Mass, Measurement, Materials, and Mathematical Modeling:
The Nuts and Bolts of Extrapolation, Spreadsheets in Education 5(1) (2011) Article 3. [12] S.A. Sinex, T.L. Chambers, and J.B. Halpern, Mass, Measurement, Materials, and More Mathematical
Modeling: The Nuts and Bolts of Let’s Make an Error, Spreadsheets in Education 6(1) (2012) Article 5. [13] S.A. Sinex, Developer's Guide to Excelets: Dynamic and Interactive Visualization with "Javaless" Applets or
Interactive Excel Spreadsheets, (2012), http://academic.pgcc.edu/~ssinex/excelets. [14] S.A. Sinex, Exploring the Goodness of Fit in Linear Models, Journal of Online Mathematics and its Application 5, (2005), http://www.joma.org/mathDL/4/?pa=content&sa=viewDocument&nodeId=559. [15] S.A. Sinex, Cookies, Spreadsheets, and Modeling: Dynamic, Interactive, Visual Science and Math - A
Preview of the PSC CAST Professional Development Modules using Excel, presented at Network Connections, Pittsburgh, PA, (2012), http://academic.pgcc.edu/~ssinex/excelets/NC. [16] J. Osborne, Arguing to Learn Science: The Role of Collaborative, Critical Discourse, Science 328 (2010) 463-466. [17] S.A. Sinex and T.L. Chambers, Developing Online Collaboration Skills in General Chemistry, J. Chem. Educ. 90 (2013) in press. [18] MatSci Excelets website, http://academic.pgcc.edu/~ssinex/excelets/matsci_excelets.htm. [19] S.A. Sinex and J.B. Halpern, Discovery learning tools in materials science: Concept visualization with
dynamic and interactive spreadsheets, in Mater. Res. Soc. Symp. Proc. Volume 1233 (2010) 91-96. [20] S.A. Sinex and J.B. Halpern Fostering a Conceptual Understanding in Undergraduate Materials Education:
A Multivariable Animated Spreadsheet Approach in Mater. Res. Soc. Symp. Proc. Volume 1320 (2011). [21] Pittsburgh Supercomputing Center CAST: Computation and Science for Teachers, http://www.psc.edu/index.php/cast/professional-development-program. [22] R. de Levie, Advanced Excel for Scientific Data Analysis, 3rd ed., Atlantic Academic (2012).
234
Proceedings of the Spring 2013 Mid-Atlantic Section Conference of the American Society of Engineering Education