Embed Size (px)
Citation preview

International Journal - VALLIS AUREA • Volume 4 • Number 1 • Croatia, June 2018 339.565; DOI 10.2507/IJVA.4.1.1.43
Category: original scientific paper
Dumičić, Ksenija1 Jošić, Hrvoje2
Žmuk, Berislav3
INVESTIGATING EXPORT MARKET CONCENTRATION FOR DEVELOPED,
DEVELOPING AND TRANSITION COUNTRIES
Abstract: Multilateral liberalisation of international trade started at the second half of the 20th century. Many, especially developing countries, benefited from trade liberalisation increasing their share of trade in global trade. This decrease in inequality of international trade between developed and developing countries can be measured by calculating market concentration indices. The emphasis is given to standardized Herfindahl-Hirschman index as the basic measure of trade concentration. Goal of this paper is to investigate concentration of global merchandise exports for developed, developing and transition countries using various concentration measures in the
period between 1948 and 2016 and testing the validity of Linder hypothesis. Results of the analysis has shown that there has been decrease in market concentration of global merchandise exports in the observed period, the importance of developing and transition countries increased while developed countries preferred mutual trade instead according to the Linder hypothesis.
Keywords: export market concentration; merchandise exports; concentration indices; Herfindahl-Hirschman index; globalisation; Linder hypothesis Author´s data: 1 Full Professor Ksenija Dumičić, PhD, Faculty of Economics and Business, University of Zagreb, Trg J. F. Kennedyja 6, HR-10000 Zagreb, Croatia, E-mail: [email protected] 2 Assistant Professor Hrvoje Jošić, PhD , Faculty of Economics and Business, University of Zagreb, Trg J. F. Kennedyja 6, HR-10000 Zagreb, Croatia, E-mail: [email protected] 3 Assistant Professor Berislav Žmuk, PhD, Faculty of Economics and Business, University of Zagreb, Trg J. F. Kennedyja 6, HR-10000 Zagreb, Croatia, E-mail: [email protected]

International Journal - VALLIS AUREA • Volume 4 • Number 1 • Croatia, June 2018 339.565; DOI 10.2507/IJVA.4.1.1.43
6
Introduction The growth of international trade has been larger than the growth of World gross domestic product after the Second World War. Multilateral liberalisation of international trade started at the second half of 20th century since the GATT creation. Free trade has been seen mutually beneficial for all countries included in the trade, or positive sum game, which is the essence of comparative advantage theory which is contrary to the teaching of mercantilists where only exporter country has gains while importer country has losses. Trade liberalisation led to reduction in trade barriers improving economic growth, development and raising living standards leading to globalisation as the final outcome of the liberalisation process. Many, especially developing countries, benefited from trade liberalisation increasing their share of trade in global trade. Trade among developing countries (often referred to as South–South trade) has more than tripled in the period from to 1980-2011 [18]. In order to measure and understand the structure and inequality of global world trade between developed, developing and transition countries, various measures of trade concentration have been used. Economies can be vulnerable to external economic shocks and it depends on degree of country’s export concentration. Export concentration or export partner concentration is a degree to which a country relies on a limited number of partners as markets for its exports. Country that exports only one product to other country has perfect export concentration. On the other hand, country that exports large number of products and trade with many trading partners has more diversified exports and lower export concentration ratios [25]. Export concentration can take several dimensions and can be analysed at different levels [23]. Two well known
forms of export diversification are horizontal and vertical diversification. Although the role and importance of developing and transition countries in global trade has increased, specialization and differentiation in production has led to a regularity in international trade patterns, known as Linder hypothesis according to which countries that have similar demand structures will trade more with each other [14]. According to Linder hypothesis developed economies therefore prefer trade themselves and not with the developing and transition countries. Goal of this paper is to investigate global concentration of merchandise exports for all countries of the World calculated by observing countries as groups of developing, transition and developed countries using various concentration measures in the period from 1948 and 2016. Accordingly the research hypotheses of the paper are the following ones: H1: Global export market concentration has globally decreased in the period after 1948 due to globalisation and liberalisation of free trade. H2: Developed countries prefer trade themselves and not with the developing and transition countries according to Linder hypothesis. In order to measure export market concentration the emphasis will be given to standardized Herfindahl-Hirschman index as the basic measure of trade concentration. In the analysis other concentration measures like concentration ratio, Gini’s concentration coefficient, Rosenbluth’s concentration index and Hall-Tideman’s concentration index will be used also. The importance of the paper is measurement of global export market levels of international trade between developed, developing and transition countries

International Journal - VALLIS AUREA • Volume 4 • Number 1 • Croatia, June 2018 339.565; DOI 10.2507/IJVA.4.1.1.43
7
using concentration indices. In this way the changing strucure of global trade is captured which is novelty in regard to the existing literature. Paper is organized in five chapters. After the introduction, the second chapter is consists of literature review including theoretical and empirical aspects of global export market concentration in various countries. In the third chapter methodology and data are presented while the fourth chapter displays empirical analysis, results and discussion. Final chapter exhibits concluding remarks. Literature review
In this chapter theoretical and empirical aspects of global export market concentration in various countries has been presented. [15] stated that globalization is not necessarily biased towards greater concentration in international trade and investment flows and empirical evidence at the world level tends to show the opposite. The term marginalization was often associated to the claim that globalization benefits only a small number of countries and that this leads to greater marginalization of excluded countries. Marginalization is more likely to be explained by domestic policies in relatively closed countries. On the sample of 127 developed and developing countries in the period from 1976 to 1995, results of the analysis has shown that concentration of trade has fallen among open economies, whereas it has increased among closed economies. [6] based on data for 56 countries in the period from 1962-2002 unveil a number of regularities regarding export diversification: export diversification increased for most of the countries, development-export diversification nexus appears to have U-shape pattern, primary products tend to have more focused export structures than exporters of manufactures,
good macroeconomic performance stimulate export concentration, etc. [12] explored development of export flows from Sweden during the years 1965-2000. The results of the analysis does not support the hypothesis of increasing trade globalisation, exports are becoming more concentrated to specific geographical areas that is becoming more internationally regionalised. [16] measure export concentration for goods, services and destinations through eight different export concentration measures. Export concentration exhibits a negative link with variable country size. Another relevant factor in determining export concentration is stage of economic development. Higher export concentration is measured in smaller and less developed countries. [1] investigate geographic and product diversification patterns across a group of developing nations for the period from 1990 to 2005. Key conclusions of the this paper are that geographic diversification is more important than product diversification, taking part in free trade agreements and trading with countries in the North have positive impacts on export diversification for developing countries. [22] investigate how different market concentration measures explain decisions of Mexican manufacturing firms. They use Dominance Index a as a competition measure used by Mexican regulators and Herfindahl-Hirschman index as a traditional measure of market structure concentration suggesting that DI index is a better determinant than the HHI. Developing econometric analysis that uses data from last Mexican census for 182 Mexican manufacturing firms, results suggest that market concentration reduces investment, firm size and investment opportunities have a direct relationship with investment while cash flows have

International Journal - VALLIS AUREA • Volume 4 • Number 1 • Croatia, June 2018 339.565; DOI 10.2507/IJVA.4.1.1.43
8
an inverse one. [2] explored trends in poor-country export partner concentration using IMF's Direction of Trade Statistics database. They computed export, import and total trade concentration levels on a sample of 127 countries that reported trade data continuously for the period from 1980 to 2006. Four measures of export partner concentration were calculated: 1-CON, 3-CON, 5-CON meaning top 1, top 3 and top 5 partner concentration respectively and Herfindahl index. Results of the analysis have shown that average export partner concentration among poor countries has barely changed since 1980, and has actually risen since the mid-1990s. On the contrary, already low levels of export partner concentration in rich countries were declining. The authors see this as evidence of „bifurcation in the effects of globalisation, with rich countries 'globalising' while poor countries are 'globalised' by others“. [8] explored the evolution of export diversification patterns along the economic development path using database with 156 countries over 19 years. They looked for a new product introduction as an indicator of “export-entrepreneurship founding a hump-shaped pattern of export diversification consistent with the conjecture that countries travel across diversification cones. First observation is that diversification occurs mostly at the extensive margin and the second observation is that middle to high levels diversification of income reflects a slow adjustment process between two equilibria. [3] report seven indices of export, import, and trade partner concentration for 183 countries for which data were available in the period 1980-2008. They also analysed the impact of CUSFTA and NAFTA on Canada, Mexico and United Stated mutual trade. Canada and Mexico are dependent on United States as a market
for their exports. The implementation of these trade agreements liberalised mutual trade, Canadian and Mexican export partner concentration has rose while US import partner concentration did not change. [24] carried out empirical analysis on export concentration in Bangladesh. Export diversification has a positive effect on export performance and economic growth reducing vulnerability in export performance. [19] examines the determinants of export performance of landlocked developing countries using standard gravity modelling framework. Results indicate that overall export performance of landlocked developing countries is poorer than that of other developing countries due to distance related trade costs. Landlocked developing countries should therefore improve the quality of trade-related infrastructure and logistics creating a more trade-friendly environment. [13] measure export market concentration in the oil and gas sector in Qatar. Using cross-sectional time series data from 2004 to 2013 they develop a measure of export market concentration and estimate the determinants of trade using a gravity model. Results suggest that Qatar should diversify the export market for oil and gas due to moderate concentration in the gas sector and extreme market concentration in the crude sector. [4] explore the impact of natural resources on non-resource export concentration using a variety of non-resource export concentration indices in the period from 1985 to 2010. They found that countries with high share of natural resources in exports tend to have less diversified non-resource export baskets. Another important founding is that capital intensive goods tend to have larger shares on the non-resource export basket when natural resources are high. The higher the technology scale, differentiated goods tend to make for a larger share of the non-resource export basket

International Journal - VALLIS AUREA • Volume 4 • Number 1 • Croatia, June 2018 339.565; DOI 10.2507/IJVA.4.1.1.43
9
while for the homogeneous goods is worth the opposite. Data and methods
In this paper, global export market concentration is observed on the case of all countries of the World from 1948 to 2016. However, it has to be emphasized that the number of countries was not the same in all observed period. The lowest number of observed countries, 142 of them, was in 1949 whereas since 2011 the highest number of countries, 218 of them, is observed. In 50% observed years the number of observed countries was 184 or less whereas in the other 50% observed years 184 or more countries were observed. In order to calculate global export market concentration, variable export given in US dollars at current prices in millions is used in the analysis. Data for the variable export are collected from the [27]. In the export value are included all goods leaving the economic territory of the observed country [26]. From wide variety of different concentration measures, it has been decided that the focus will be given to Herfindahl-Hirschman index as one of the most used concentration measure in economy [7] Herfindahl-Hirschman index is calculated by taking into account squared proportions of the observed units at chosen variable ([10]; [11]). So, Herfindahl-Hirschman index is calculated as:
N
i
ipHHI1
2 , (1)
where is the Herfindahl-Hirschman’s concentration index, is proportion or share of the -th unit in the total value of the observed variable. Unfortunately, Herfindahl-Hirschman index is not standardized or given in certain value interval. Therefore sometimes
conclusion about achieved concentration level by observing only unstandardized Herfindahl-Hirschman index could be misleading. If the number of observed units is taken into account, standardized Herfindahl-Hirschman index can be calculated as:
NNHHIHHI 111* , (2) where is the standardized Herfindahl-Hirschman’s concentration index, is the Herfindahl-Hirschman’s concentration index, is the total number of observed units. After the standardization is performed, standardized Herfindahl-Hirschman’s concentration index is bounded to interval from 0 to 1. The conclusion about achieved concentration level can be made according to standardized Herfindahl-Hirschman’s concentration index value as suggested in Table 1.
Herfindahl-Hirschman’s
concentration index
Concentration level
Lower than 0.01 Perfect equality 0.01 – 0.15 Low 0.15 – 0.25 Moderate
0.25 or higher High Table 1. Concentration level according to standardized Herfindahl-Hirschman’s concentration index value Except Herfindahl-Hirschman’s concentration index following concentration measures will be calculated also: concentration ratio [5] Gini’s concentration coefficient [17]; [20] Rosenbluth’s concentration index [21] and Hall-Tideman’s concentration index [9]. Those concentration measures will be used to confirm concentration level conclusion brought by
International Journal - VALLIS AUREA • Volume 4 • Number 1 • Croatia, June 2018 339.565; DOI 10.2507/IJVA.4.1.1.43
10
standardized Herfindahl-Hirschman’s concentration index. In order to avoid misleading conclusions the standardized versions of the concentration measures will be used. Still, for the sake of comparison the values of unstandardized concentration measures versions will be provided also. The standardized concentration measures are calculated as follows: i) standardized concentration ratio:
NrNNxxCRN
t
i
r
t
ir ,...,2,1,11111
*
(3)
where *
rCR is standardized concentration ratio for first r units with the highest value of the variable
considered,
r
i
ix1
is sum of values of the observed
variable for first r units,
N
i
ix1
is sum of values of
the observed variable for all N units, N is the total number of observed units;
ii) standardized Gini’s concentration coefficient:
112111
*
NNxNxNixGN
i
i
N
i
i
N
i
i (4)
where *G is standardized Gini’s concentration coefficient, N is the total number of observed units, i is rank of an unit, Ni ,...,2,1 , ix is the value of the observed variable for unit i;
iii) standardized Rosenbluth’s concentration index:
NNjpRIN
i
i 1111211
*
(5)
where *RI is the standardized Rosenbluth’s concentration index, j is rank of an unit,
1,2,...,2,1, NNNj , ip is proportion or share of the i -th unit in the total value of the
observed variable, N is the total number of observed units;
iv) standardized Hall-Tideman’s concentration index:
1211211211
*
NNNNipHTIN
i
i(6)
where *HTI is the standardized Hall-Tideman’s concentration index, i is rank of an unit,
NNNi ,1,2,...,2,1 , ip is proportion or share of the i -th unit in the total value of the observed variable, N is the total number of observed units. In order to make conclusion about achieved concentration level, at standardized concentration ratio, standardized Gini’s concentration coefficient, standardized Rosenbluth’s concentration index and at standardized Hall-Tideman’s concentration index different limits will be used as they are used at standardized Herfindahl-Hirschman’s concentration index. Here the concentration values lower than 0.25 points out that concentration level is low. If the concentration value is between 0.25 and 0.40, the conclusion about low to moderate concentration level can be brought. The concentration value between 0.40 and 0.60 shows that moderate concentration level is present whereas the concentration value between 0.60 and 0.75 suggests moderate to high concentration level. High concentration level is present if the concentration value is higher than 0.75. Global export market concentration will be first calculated by taking into account all countries of the World. Afterwards, the global export market concentration of the World will be observed by grouping countries according to their economic development level. Here three economic development levels are defined: developing, transition and developed countries.

International Journal - VALLIS AUREA • Volume 4 • Number 1 • Croatia, June 2018 339.565; DOI 10.2507/IJVA.4.1.1.43
11
Furthermore, global export market concentration levels will be estimated for developing, transition and developed countries separately also. Those analyses will be used to inspect the first research hypothesis in which global export market concentration decreasing trend since 1948 is assumed. In order to inspect validity of the Linder hypothesis, in which is stated that developed economies prefer trade themselves and not with the developing and transition countries, the distributions of exports among the groups of countries is observed. The share of export between these different groups of countries is observed in period from 1995 to 2016. However, before performing any concentration level analysis, descriptive statistics analysis will be made. By using descriptive statistics approach countries with the highest and the lowest export value will be emphasized. Furthermore, the discrepancy between these countries will be observed. The differences in export values between developed, transition and developing countries will be observed also.
Analysis and discussion
In section 4.1. export in the countries worldwide is observed by using descriptive statistics methods. Countries are observed according to their geographical position, economic development level and individually. In section 4.2. global export market concentration in period from 1948 to 2016 is inspected. Different concentration measures are used but emphasis was given to Herfindahl-Hirschman’s concentration indices. Here countries are observed individually, according to their economic development level and individually in each economic development level country group. In section 4.3. shares of export trade between developing, transitions and developed countries are analysed. Descriptive statistics of export in the World In this section, the export of countries is observed from 1948 to 2016. In Figure 1 export of countries grouped according to selected regions is shown.
Figure 1. Export of countries, in US dollars at current prices in trillions, countries according to selected geographical regions
0
1
2
3
4
5
6
7
8
US dollars at current prices in
trillions
YearAfrica America Asia Europe Oceania

International Journal - VALLIS AUREA • Volume 4 • Number 1 • Croatia, June 2018 339.565; DOI 10.2507/IJVA.4.1.1.43
12
According to Figure 1 it can be concluded that the World export levels were relatively low until the beginning of 1970s. In 1970s export started to rise and at the beginning of 2000s the rise became very large. However, that seems to be true only for countries from Europe and Asia. Countries from Africa and Oceania did not show so large increase in export values as countries from Europe and Asia. Consequently, the difference in export values
between those groups of countries is remarkable. In recent period countries from Europe and Asia have about 25 times larger export value than countries from Africa and Oceania. Somewhere in the middle of those two distanced groups of countries are placed countries from America which are mainly lead by the United States of America .
Figure 2. Export of countries, in US dollars at current prices in trillions, countries according to their economic development level In Figure 2 export of countries grouped according to their economic development level are observed. Again, the rise in export values are present since the beginning of the 1970s. In the whole observed period developed countries tend to have higher export value than developing countries. The difference in export values between the developed and developing countries does not seem to be very large. However, it has to be emphasized that overall there are 169 developing countries whereas only 48
countries are considered to be developed. Similar, only 20 countries can be found in the group of transition countries and that is one of the reasons why transition countries have so small export value in compare to developed and developing countries. In order to get better insight into the difference in export values between countries with different economic development level, in Figure 3 average export value per country in the observed groups of countries are shown.
0123456789
10
1948
1951
1954
1957
1960
1963
1966
1969
1972
1975
1978
1981
1984
1987
1990
1993
1996
1999
2002
2005
2008
2011
2014
US dollars at
current prices in
trillions
YearDeveloping countries Transition countries Developed countries

International Journal - VALLIS AUREA • Volume 4 • Number 1 • Croatia, June 2018 339.565; DOI 10.2507/IJVA.4.1.1.43
13
Figure 3. Average export value per included country in the group, in US dollars at current prices in billions, countries according to their economic development level Figure 3 reveals that transition countries had the highest export value per country included in the group in period from the middle of 1970s to the middle of 1980s. At the beginning of 1990s transition countries had very steep decrease in average export value per country. That can be attributed to the shift from the centrally planned to market system and structural changes in the transition
economies’ exports. So, since the beginning of 1990s transition and developing countries seem to have very similar average export values per country included in one of those two groups. On the other hand, developed countries have much larger average export value than both, transition and developing countries.
Statistics Year 1948 1950 1960 1970 1980 1990 2000 2010 2016
N 144 168 170 171 184 186 213 216 218 Mean 406 366 764 1,857 11,142 18,794 30,293 70,843 73,195 Std. Deviation 1,245 1,015 2,139 5,290 29,651 55,472 88,774 193,494 220,368 Coeff. of Var. 306 277 280 285 266 295 293 273 301 1st Quart. 11 6 13 34 117 147 267 431 446 Median 63 54 91 203 930 1,075 1,723 4,858 4,559 3rd Quart. 362 329 587 1,223 8,304 10,079 12,279 49,536 33,062 Range 12,652 9,993 19,626 43,224 225,566 421,100 781,918 1,577,754 2,098,161 Minimum 1.00 0.20 0.47 0.90 0.00 0.05 0.01 0.02 0.10 Maximum 12,653 9,993 19,626 43,225 225,566 421,100 781,918 1,577,754 2,098,161
Table 2. Basic descriptive statistics results, export values in countries of the World, given in US dollars at current prices in millions, in selected years
0
50
100
150
200
250
19
48
19
51
19
54
19
57
19
60
19
63
19
66
19
69
19
72
19
75
19
78
19
81
19
84
19
87
19
90
19
93
19
96
19
99
20
02
20
05
20
08
20
11
20
14
US dollars at current prices in billions
YearDeveloping countries Transition countries Developed countries

International Journal - VALLIS AUREA • Volume 4 • Number 1 • Croatia, June 2018 339.565; DOI 10.2507/IJVA.4.1.1.43
14
In Table 2 basic descriptive statistics results in selected nine years are given. Large coefficients of variation in all given years point out that there are large differences between countries regarding their export value. The same conclusion can be brought if the range, defined as difference between the highest and the lowest export value, is observed. Furthermore, if median and mean values are observed it can be concluded that the
distributions of export are positively skewed. In Figure 4 are shown countries which have the largest export values in the observed period in comparison to the other countries. In order to do the comparison, standardized values or z-scores are shown. So, in Figure 4 are shown countries which had export value above three standard deviations from the average of countries’ export values in particular years.
Figure 4. Countries with the highest export values, standardized values (z-scores)
Figure 4 reveals that the United States of America in the whole observed period had export value well above the export averages. Furthermore, in periods from 1948 to 1985, in 1989 and from 1991 to 2002 the United States of America had the highest export value in compare to all other countries of the World. Since the beginning of 1970s Germany had similar export values as the United States of America. In some years Germany had export value higher than the United States of America. Since 2007 China had the highest export value in the World. According to the export value, Japan
managed to be placed on the third position from the beginning of 1970s to the beginning of 2000s. Since then the relative position of Japan, considering the export, is decreasing. On the other hand, the impact of export value of the United Kingdom is slowly decreasing since the beginning of the observed period. As opposite to Japan and the United Kingdom, France managed to have relatively stable export value impact in the whole period. So, in the observed period export value of France was always around three standard deviations above the average export value. The
-1
0
1
2
3
4
5
6
7
8
9
10
1948
1951
1954
1957
1960
1963
1966
1969
1972
1975
1978
1981
1984
1987
1990
1993
1996
1999
2002
2005
2008
2011
2014
z-score
YearChina France Germany
Japan United Kingdom United States
International Journal - VALLIS AUREA • Volume 4 • Number 1 • Croatia, June 2018 339.565; DOI 10.2507/IJVA.4.1.1.43
15
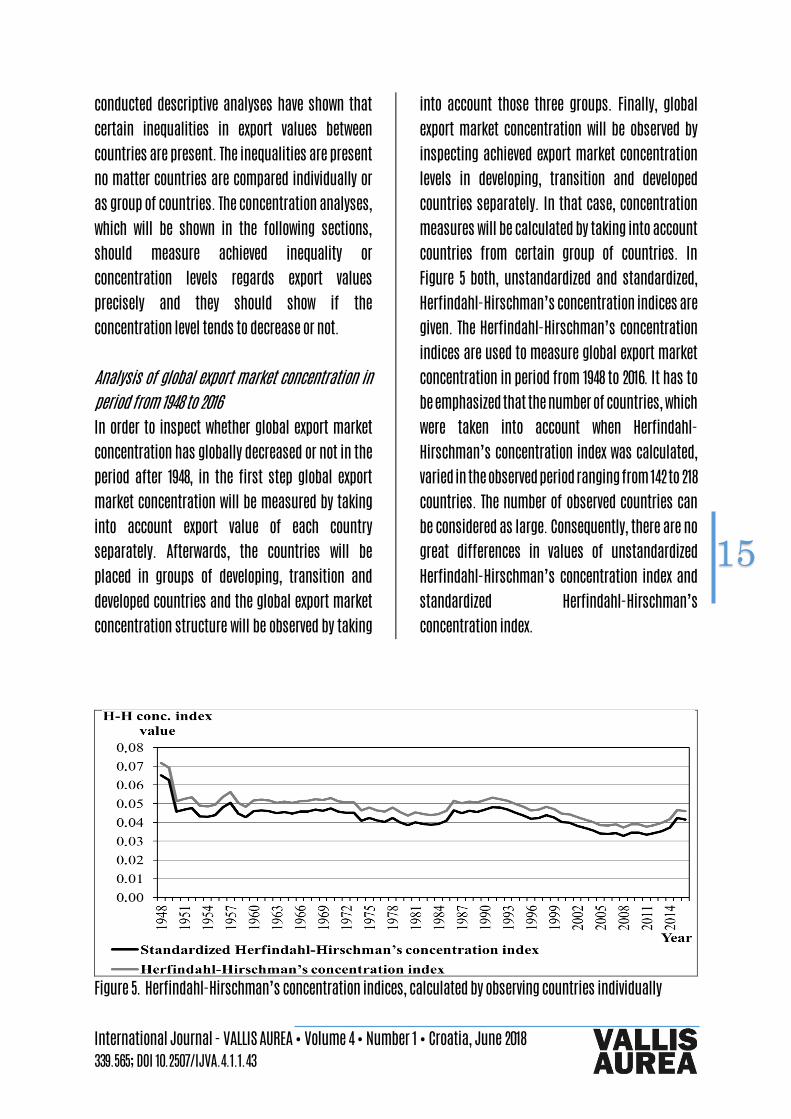
conducted descriptive analyses have shown that certain inequalities in export values between countries are present. The inequalities are present no matter countries are compared individually or as group of countries. The concentration analyses, which will be shown in the following sections, should measure achieved inequality or concentration levels regards export values precisely and they should show if the concentration level tends to decrease or not. Analysis of global export market concentration in period from 1948 to 2016 In order to inspect whether global export market concentration has globally decreased or not in the period after 1948, in the first step global export market concentration will be measured by taking into account export value of each country separately. Afterwards, the countries will be placed in groups of developing, transition and developed countries and the global export market concentration structure will be observed by taking
into account those three groups. Finally, global export market concentration will be observed by inspecting achieved export market concentration levels in developing, transition and developed countries separately. In that case, concentration measures will be calculated by taking into account countries from certain group of countries. In Figure 5 both, unstandardized and standardized, Herfindahl-Hirschman’s concentration indices are given. The Herfindahl-Hirschman’s concentration indices are used to measure global export market concentration in period from 1948 to 2016. It has to be emphasized that the number of countries, which were taken into account when Herfindahl-Hirschman’s concentration index was calculated, varied in the observed period ranging from 142 to 218 countries. The number of observed countries can be considered as large. Consequently, there are no great differences in values of unstandardized Herfindahl-Hirschman’s concentration index and standardized Herfindahl-Hirschman’s concentration index.
Figure 5. Herfindahl-Hirschman’s concentration indices, calculated by observing countries individually

International Journal - VALLIS AUREA • Volume 4 • Number 1 • Croatia, June 2018 339.565; DOI 10.2507/IJVA.4.1.1.43
16
According to Figure 5, lines of unstandardized Herfindahl-Hirschman’s concentration index and standardized Herfindahl-Hirschman’s concentration index are almost one top of another. Furthermore, both Herfindahl-Hirschman’s concentration indices show that there is present low concentration level in the whole observed period. After the drop of 0.02 points in the first observed years, the Herfindahl-Hirschman’s concentration indices were almost the same until the beginning of 1990s when global export
concentration levels appear to decrease. Due to the economic crisis global export concentration seems to rise from the beginning of 2010s. However, despite the recent changes in global export concentration levels, it can be concluded that the global export concentration level is lower now than it was at beginning of the observed period. This conclusion is supported by majority of other observed concentration measures, which are given in Table 3, also.
Concentration measures Years
1948 1950 1960 1970 1980 1990 2000 2010 2016 Number of countries 144 168 170 171 184 186 213 216 218 Unstandardized Concentration ratio 1 0.216 0.163 0.151 0.136 0.110 0.120 0.121 0.103 0.131 Concentration ratio 2 0.329 0.265 0.239 0.244 0.204 0.233 0.206 0.187 0.223 Concentration ratio 4 0.419 0.365 0.375 0.366 0.325 0.377 0.331 0.319 0.347 Concentration ratio 10 0.568 0.529 0.586 0.637 0.581 0.617 0.562 0.505 0.532 Gini’s 0.785 0.798 0.817 0.828 0.828 0.859 0.862 0.842 0.855 Herfindahl-Hirschman’s 0.072 0.051 0.052 0.053 0.044 0.052 0.045 0.039 0.046 Rosenbluth’s 0.032 0.030 0.032 0.034 0.032 0.038 0.034 0.029 0.032 Hall-Tideman’s 0.004 0.003 0.003 0.003 0.003 0.003 0.003 0.003 0.002 Standardized Standardized conc. ratio 1 0.211 0.157 0.146 0.131 0.105 0.116 0.117 0.099 0.127 Standardized conc. ratio 2 0.324 0.261 0.235 0.239 0.200 0.229 0.203 0.183 0.219 Standardized conc. ratio 4 0.415 0.362 0.371 0.362 0.321 0.374 0.328 0.316 0.344 Standardized conc. ratio 10 0.565 0.526 0.584 0.634 0.579 0.615 0.560 0.502 0.530 Standardized Gini’s 0.791 0.803 0.822 0.833 0.833 0.863 0.866 0.846 0.859 Stan. Herfindahl-Hirschman’s 0.065 0.046 0.046 0.047 0.038 0.047 0.040 0.035 0.042 Stan. Rosenbluth’s 0.026 0.024 0.026 0.028 0.026 0.033 0.029 0.025 0.027 Stan. Hall-Tideman’s 0.117 0.109 0.098 0.091 0.091 0.074 0.072 0.084 0.076
Table 3. Global export concentration, selected unstandardized and standardized concentration measures, calculated by observing countries individually, in selected years

International Journal - VALLIS AUREA • Volume 4 • Number 1 • Croatia, June 2018 339.565; DOI 10.2507/IJVA.4.1.1.43
17
In order to observe global export concentration level from other perspective, in the following analysis countries were not observed separately but they were placed into the three groups of countries. So, the countries were placed in the group of developing, transition or developed countries. Because only three values of export were taken into account in each observed year, larger differences between unstandardized and standardized concentration measures values are expected.
Figure 6. Herfindahl-Hirschman’s concentration indices, calculated by observing countries as groups of developing, transition and developed countries In Figure 6, unstandardized Herfindahl-Hirschman’s concentration index and standardized Herfindahl-Hirschman’s concentration index lines are shown. Because only three groups of countries are observed the differences between them are significant. According to unstandardized Herfindahl-Hirschman’s concentration index it could be concluded that global export concentration level between three groups of countries was high in the whole observed period. However, unstandardized Herfindahl-Hirschman’s concentration index does not take into account the number of units. Consequently, the conclusions brought by observing only unstandardized Herfindahl-Hirschman’s concentration index could be
misleading. Instead, more appropriate is to bring conclusions about achieved concentration levels by observing standardized Herfindahl-Hirschman’s concentration index. According to standardized Herfindahl-Hirschman’s concentration index global export concentration level was high until 2004 whereas since 2005 standardized Herfindahl-Hirschman’s concentration index was below 0.25, but above 0.15, meaning that global export concentration level is moderate. It seems that global export concentration level was increasing almost perfect linear in period from 1950 to 1972. In the 1972 the highest value of standardized Herfindahl-Hirschman’s concentration index (0.4437) was reached. However, the value of standardized Herfindahl-Hirschman’s concentration index was

International Journal - VALLIS AUREA • Volume 4 • Number 1 • Croatia, June 2018 339.565; DOI 10.2507/IJVA.4.1.1.43
18
considerably decreased to value of 0.2847 in 1981. After 1991 global export concentration level seems to have negative linear trend. Again, despite the increase of global export concentration level in the recent years, it can be concluded that global export
concentration level decreased in the observed period. Most of other observed concentration, given in Table 4, measured confirmed that global export concentration level decreased in the period from 1948 to 2016.
Concentration measures Years
1948 1950 1960 1970 1980 1990 2000 2010 2016 Number of groups 3 3 3 3 3 3 3 3 3 Unstandardized Concentration ratio 1 0.655 0.628 0.707 0.763 0.662 0.725 0.658 0.539 0.536 Concentration ratio 2 0.973 0.968 0.953 0.954 0.958 0.966 0.977 0.960 0.972 Gini’s 0.418 0.398 0.440 0.479 0.413 0.461 0.423 0.333 0.338 Herfindahl-Hirschman’s 0.531 0.511 0.562 0.621 0.527 0.585 0.535 0.470 0.478 Rosenbluth’s 0.573 0.553 0.595 0.639 0.568 0.618 0.578 0.500 0.504 Hall-Tideman’s 0.235 0.238 0.232 0.225 0.236 0.228 0.234 0.250 0.249 Standardized Standardized conc. ratio 1 0.482 0.442 0.560 0.645 0.492 0.587 0.486 0.309 0.303 Standardized conc. ratio 2 0.959 0.953 0.929 0.932 0.937 0.949 0.965 0.940 0.958 Standardized Gini’s 0.628 0.597 0.659 0.718 0.620 0.691 0.634 0.500 0.508 Stan. Herfindahl-Hirschman’s 0.296 0.267 0.343 0.432 0.291 0.377 0.302 0.204 0.217 Stan. Rosenbluth’s 0.360 0.330 0.392 0.459 0.352 0.427 0.366 0.250 0.256 Stan. Hall-Tideman’s 0.262 0.289 0.237 0.191 0.269 0.211 0.257 0.375 0.368
Table 4. Global export concentration, selected unstandardized and standardized concentration measures, calculated by observing countries as groups of developing, transition and developed countries, in selected years In the following analysis export concentration level will be inspecting by observing countries in each group separately. Therefore in Figure 7 development of standardized Herfindahl-Hirschman’s concentration index for developed, transition and developing countries in period from 1948 to 2016 is shown. The values of selected concentration measures are provided in Table 5 for developing countries, in Table 6 for transition countries and in Table 7 for developed countries.

International Journal - VALLIS AUREA • Volume 4 • Number 1 • Croatia, June 2018 339.565; DOI 10.2507/IJVA.4.1.1.43
19
Figure 7. Standardized Herfindahl-Hirschman’s concentration index, calculated by observing countries as groups of developing, transition and developed countries individually If standardized Herfindahl-Hirschman’s concentration index values for developing countries are observed, it can be concluded that all values are lower than 0.15 which suggest that export concentration level among developing countries is low. However, Figure 7 reveals that standardized Herfindahl-Hirschman’s concentration index for developing countries
exhibits positive trend. In other words, it seems that export concentration level among developing countries is increasing. All observed standardized measures, except Hall-Tideman’s concentration index, which are given in Table 5, confirmed that export concentration level at developing countries is becoming higher.
Concentration measures Years
1948 1950 1960 1970 1980 1990 2000 2010 2016 Number of countries 108 132 132 133 145 147 154 156 158 Unstandardized Concentration ratio 1 0.088 0.066 0.081 0.055 0.179 0.098 0.121 0.245 0.301 Concentration ratio 2 0.158 0.122 0.154 0.108 0.223 0.177 0.219 0.317 0.375 Concentration ratio 4 0.285 0.233 0.259 0.195 0.307 0.328 0.384 0.434 0.500 Concentration ratio 10 0.504 0.480 0.466 0.415 0.515 0.594 0.675 0.662 0.722 Gini’s 0.714 0.744 0.730 0.699 0.800 0.823 0.859 0.868 0.889 Herfindahl-Hirschman’s 0.036 0.032 0.032 0.026 0.053 0.046 0.057 0.086 0.116 Rosenbluth’s 0.032 0.030 0.028 0.025 0.034 0.038 0.046 0.048 0.057 Hall-Tideman’s 0.005 0.004 0.004 0.004 0.004 0.004 0.003 0.003 0.003

International Journal - VALLIS AUREA • Volume 4 • Number 1 • Croatia, June 2018 339.565; DOI 10.2507/IJVA.4.1.1.43
20
Concentration measures Years
1948 1950 1960 1970 1980 1990 2000 2010 2016 Number of countries 108 132 132 133 145 147 154 156 158 Standardized Standardized conc. ratio 1 0.079 0.058 0.074 0.048 0.174 0.092 0.115 0.240 0.297 Standardized conc. ratio 2 0.150 0.116 0.148 0.101 0.217 0.172 0.214 0.313 0.371 Standardized conc. ratio 4 0.278 0.227 0.254 0.189 0.302 0.324 0.380 0.431 0.497 Standardized conc. ratio 10 0.499 0.476 0.462 0.410 0.511 0.592 0.673 0.660 0.720 Standardized Gini’s 0.721 0.750 0.736 0.705 0.805 0.829 0.865 0.873 0.895 Stan. Herfindahl-Hirschman’s 0.027 0.024 0.025 0.019 0.047 0.039 0.051 0.080 0.111 Stan. Rosenbluth’s 0.023 0.022 0.021 0.018 0.028 0.032 0.040 0.042 0.051 Stan. Hall-Tideman’s 0.163 0.143 0.153 0.174 0.108 0.094 0.073 0.068 0.056
Table 5. Global export concentration, selected unstandardized and standardized concentration measures, calculated by observing countries in groups of developing countries, in selected years In compare to developing and developed countries, transition countries seem to have convincingly the highest export concentration level. One reason for this situation can be found in the fact that in the group of transition countries relatively small number of countries can be found. That is especially expressed between 1950 and 1990. Consequently, only the concentration measure values for period after 1990 should be observed. According to Figure7, after 1990 standardized Herfindahl-Hirschman’s concentration index can be found between 0.3764 (in 1992) and 0.5194 (in 1994). Furthermore, it seems that the standardized
Herfindahl-Hirschman’s concentration index shows negative trend since 1994. In the most recent year, in 2016 standardized Herfindahl-Hirschman’s concentration index had value of 0.3826 what is very close to the minimum value achieved in 1992. The detected negative trend of standardized Herfindahl-Hirschman’s concentration index and results from Table 6 lead to the conclusions that export concentration level among transition is being decreased. However, it has to be kept on mind that in all observed period export concentration level among transition countries is considered to be high.
International Journal - VALLIS AUREA • Volume 4 • Number 1 • Croatia, June 2018 339.565; DOI 10.2507/IJVA.4.1.1.43
21
Concentration measures Years
1948 1950 1960 1970 1980 1990 2000 2010 2016 Number of countries 2 3 3 2 2 3 16 17 17 Unstandardized Concentration ratio 1 0.810 0.918 0.900 0.884 0.895 0.877 0.702 0.658 0.632 Concentration ratio 2 1.000 0.997 0.992 1.000 1.000 0.998 0.800 0.756 0.715 Concentration ratio 4 - - - - - - 0.908 0.884 0.848 Concentration ratio 10 - - - - - - 0.982 0.985 0.976 Gini’s 0.310 0.610 0.595 0.384 0.395 0.583 0.810 0.808 0.771 Herfindahl-Hirschman’s 0.692 0.849 0.819 0.795 0.812 0.784 0.510 0.454 0.419 Rosenbluth’s 0.725 0.855 0.823 0.812 0.826 0.800 0.330 0.307 0.256 Hall-Tideman’s 0.382 0.207 0.209 0.361 0.358 0.211 0.035 0.033 0.033 Standardized Standardized conc. ratio 1 0.620 0.877 0.851 0.768 0.790 0.816 0.682 0.636 0.609 Standardized conc. ratio 2 1.000 0.995 0.988 1.000 1.000 0.997 0.786 0.741 0.697 Standardized conc. ratio 4 - - - - - - 0.901 0.877 0.839 Standardized conc. ratio 10 - - - - - - 0.981 0.984 0.974 Standardized Gini’s 0.620 0.915 0.893 0.768 0.790 0.875 0.864 0.859 0.819 Stan. Herfindahl-Hirschman’s 0.384 0.774 0.729 0.590 0.624 0.676 0.477 0.420 0.383 Stan. Rosenbluth’s 0.449 0.782 0.735 0.623 0.653 0.700 0.285 0.263 0.210 Stan. Hall-Tideman’s 0.290 0.053 0.067 0.168 0.151 0.079 0.075 0.078 0.102
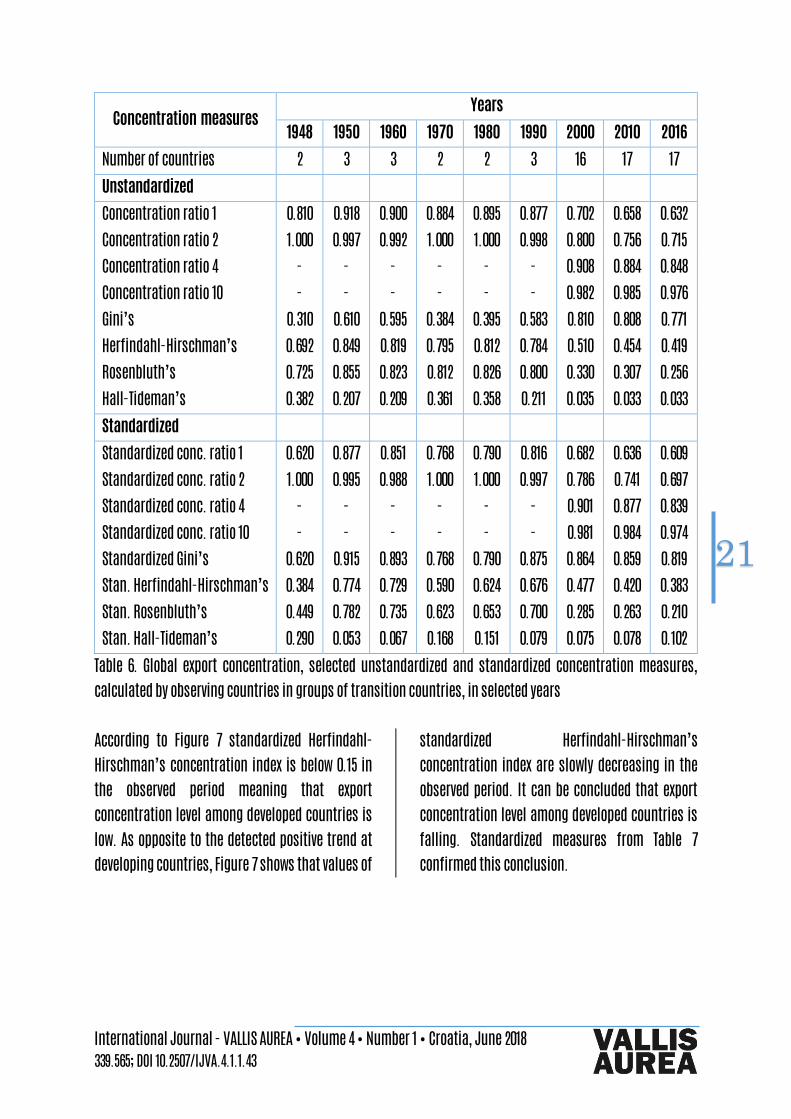
Table 6. Global export concentration, selected unstandardized and standardized concentration measures, calculated by observing countries in groups of transition countries, in selected years According to Figure 7 standardized Herfindahl-Hirschman’s concentration index is below 0.15 in the observed period meaning that export concentration level among developed countries is low. As opposite to the detected positive trend at developing countries, Figure 7 shows that values of
standardized Herfindahl-Hirschman’s concentration index are slowly decreasing in the observed period. It can be concluded that export concentration level among developed countries is falling. Standardized measures from Table 7 confirmed this conclusion.

International Journal - VALLIS AUREA • Volume 4 • Number 1 • Croatia, June 2018 339.565; DOI 10.2507/IJVA.4.1.1.43
22
Concentration measures Years
1948 1950 1960 1970 1980 1990 2000 2010 2016 Number of countries 34 33 35 36 37 36 43 43 43 Unstandardized Concentration ratio 1 0.330 0.257 0.213 0.178 0.166 0.166 0.184 0.155 0.170 Concentration ratio 2 0.502 0.420 0.337 0.319 0.308 0.321 0.314 0.307 0.327 Concentration ratio 4 0.639 0.579 0.528 0.478 0.491 0.521 0.504 0.470 0.469 Concentration ratio 10 0.834 0.816 0.794 0.808 0.812 0.835 0.819 0.765 0.757 Gini’s 0.720 0.679 0.662 0.660 0.672 0.693 0.726 0.687 0.685 Herfindahl-Hirschman’s 0.157 0.118 0.095 0.086 0.086 0.092 0.089 0.079 0.082 Rosenbluth’s 0.105 0.094 0.085 0.082 0.082 0.091 0.085 0.074 0.074 Hall-Tideman’s 0.017 0.018 0.017 0.017 0.016 0.016 0.013 0.014 0.014 Standardized Standardized conc. ratio 1 0.309 0.234 0.190 0.155 0.143 0.142 0.165 0.135 0.150 Standardized conc. ratio 2 0.487 0.402 0.318 0.299 0.289 0.302 0.298 0.291 0.311 Standardized conc. ratio 4 0.628 0.566 0.514 0.464 0.476 0.507 0.492 0.458 0.456 Standardized conc. ratio 10 0.829 0.811 0.788 0.802 0.807 0.830 0.815 0.760 0.751 Standardized Gini’s 0.742 0.700 0.681 0.679 0.690 0.713 0.743 0.703 0.702 Stan. Herfindahl-Hirschman’s 0.131 0.090 0.069 0.060 0.061 0.066 0.068 0.058 0.060 Stan. Rosenbluth’s 0.078 0.066 0.058 0.055 0.057 0.065 0.063 0.052 0.052 Stan. Hall-Tideman’s 0.150 0.178 0.192 0.194 0.185 0.169 0.149 0.176 0.177
Table 7. Global export concentration, selected unstandardized and standardized concentration measures, calculated by observing countries in groups of developed countries, in selected years In Figure 8 average values of Herfindahl-Hirschman’s concentration index for each of three observed groups of countries in period from 1988 (for transition countries from 1994) to 2015 is shown. The values of Herfindahl-Hirschman’s concentration index have been calculated by taking into account export products values of each country individually (World Bank, 2017). In the next step, all Herfindahl-Hirschman’s concentration index values of countries from the same group have
summed up and divided by the number of countries in that group. Figure 8 shows that developed countries reached low concentration level in 1994 and transition countries in 2005. On the other side, developing countries seems to have moderate concentration level. However, it can be concluded that in all three groups of countries export concentration level is lower than at the beginning of the observed period.

International Journal - VALLIS AUREA • Volume 4 • Number 1 • Croatia, June 2018 339.565; DOI 10.2507/IJVA.4.1.1.43
23
Source: World Bank (2017). Figure 8. Average Herfindahl-Hirschman’s concentration index, calculated by observing countries as groups of developing, transition and developed countries individually Results of the analysis indicate that the first hypothesis of the paper can be accepted. There is present low global export concentration level in the whole observed period when looking countries individually. Also, it can be concluded that the global export concentration level is lower now than it was at beginning of the observed period. When looking countries as groups, transition countries experience higher concentration levels or inequality while developing and developed countries have similar lower levels of concentration index. Furthermore, concentration index for developing countries exhibits positive trend. Analysis of shares of export trade between developing, transitions and developed countries
In order to inspect whether developed countries prefer to trade among them and not with the developing and transition countries and to test the second hypothesis of the paper, countries will be observed as groups of developing, transitions and developed countries. Focus is given to analysis of export trade shares. Namely, each group of countries has achieved certain total export value which has been calculated as sum of export values of all countries in the observed group. However, that export value is a result of trading with countries from other two groups but with countries in the same group also. In Figure 9 share of export trade between countries in the same group in period from 1995 to 2016 is given.

International Journal - VALLIS AUREA • Volume 4 • Number 1 • Croatia, June 2018 339.565; DOI 10.2507/IJVA.4.1.1.43
24
Figure 9. Share of export trade between countries in the same group, in percentages, in period from 1995 to 2016 According to Figure 9 developed countries had the highest share of export which is a result of trading between countries in the same group. So, it can be concluded that about 70% of export value of developed countries is achieved between countries which belong in that group. On the other side, transition countries have the lowest share of export value which is a result of trading between
countries in the same group. At the beginning of the observed period, the share of export trade between transition countries was about 30% whereas since 1999 it is about 20%. Developing countries have increased share of export trade achieved between them from 42% in 1995 to 57% in 2016.
Figure 10. Share of export trade between developed countries and other group of countries, in percentages, in period from 1995 to 2016
0%
10%
20%
30%
40%
50%
60%
70%
80%
1995
1996
1997
1998
1999
2000
2001
2002
2003
2004
2005
2006
2007
2008
2009
2010
2011
2012
2013
2014
2015
2016
Share
YearDeveloping countries with Developing countriesTransition countries with Transition countriesDeveloped countries with Developed countries
0%
10%
20%
30%
40%
50%
60%
70%
80%
1995
1996
1997
1998
1999
2000
2001
2002
2003
2004
2005
2006
2007
2008
2009
2010
2011
2012
2013
2014
2015
2016
Share
YearDeveloped countries with Developed countriesDeveloped countries with Transition countriesDeveloped countries with Developing countries
International Journal - VALLIS AUREA • Volume 4 • Number 1 • Croatia, June 2018 339.565; DOI 10.2507/IJVA.4.1.1.43
25
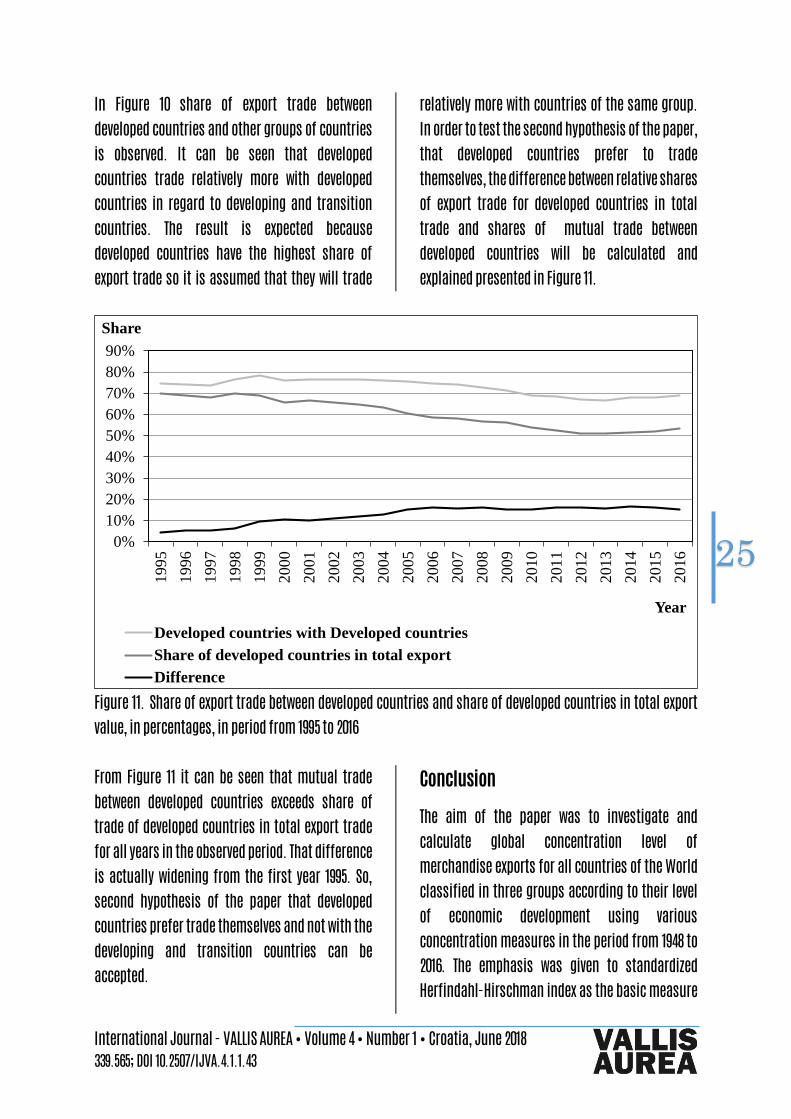
In Figure 10 share of export trade between developed countries and other groups of countries is observed. It can be seen that developed countries trade relatively more with developed countries in regard to developing and transition countries. The result is expected because developed countries have the highest share of export trade so it is assumed that they will trade
relatively more with countries of the same group. In order to test the second hypothesis of the paper, that developed countries prefer to trade themselves, the difference between relative shares of export trade for developed countries in total trade and shares of mutual trade between developed countries will be calculated and explained presented in Figure 11.
Figure 11. Share of export trade between developed countries and share of developed countries in total export value, in percentages, in period from 1995 to 2016 From Figure 11 it can be seen that mutual trade between developed countries exceeds share of trade of developed countries in total export trade for all years in the observed period. That difference is actually widening from the first year 1995. So, second hypothesis of the paper that developed countries prefer trade themselves and not with the developing and transition countries can be accepted.
Conclusion
The aim of the paper was to investigate and calculate global concentration level of merchandise exports for all countries of the World classified in three groups according to their level of economic development using various concentration measures in the period from 1948 to 2016. The emphasis was given to standardized Herfindahl-Hirschman index as the basic measure
0%
10%
20%
30%
40%
50%
60%
70%
80%
90%
1995
1996
1997
1998
1999
2000
2001
2002
2003
2004
2005
2006
2007
2008
2009
2010
2011
2012
2013
2014
2015
2016
Share
Year
Developed countries with Developed countries
Share of developed countries in total export
Difference

International Journal - VALLIS AUREA • Volume 4 • Number 1 • Croatia, June 2018 339.565; DOI 10.2507/IJVA.4.1.1.43
26
of trade concentration but other concentration measures were also used in the analysis like concentration ratio, Gini concentration coefficient, Rosenbluth’s concentration index and Hall-Tideman’s concentration index. This is significant because global trade structure has changed significantly since the trade liberalisation started after the Second World War. The importance of paper is analysis of global trade structure using various concentration measures, which is concept that has not used much in the previous researches in this field. Main strength of the methodology used is an explanation of inequality and changes in global trade structure. After descriptive statistics, countries were observed individually and according to their geographical position and economic development level. Two research hypotheses were tested. The results of the analysis indicate that first hypothesis of the paper that global export market concentration has globally decreased in the period after 1948 can be accepted. Global export concentration level is now lower than it was at the beginning of the observed period. Transition countries experience higher concentration levels in regard to developing and developed countries which have similar lower levels of concentration indexes. Second hypothesis of the paper which states that developed economies prefer to trade themselves can also be confirmed. In order to test second hypothesis of the paper difference between relative shares of export trade for developed countries in total trade and shares of mutual trade between developed countries was calculated and observed. The results show that this difference is actually widening pointing out to the conclusion that developed economies prefer mutual trade with
countries of the similar economic development level. Limitations of research are related to low number of countries in some samples, especially for transition countries, and therefore uneven pattern of countries. Also, data for mutual trade between groups of countries were available only for period after year 1994. Recommendations for future research can go in the way of analysing merchandise imports and total trade and not only merchandise exports. Furthermore, it would be interesting to investigate and measure market concentration levels for various regional economic integrations intended to promote intra-regional and global trade. References
[1] Amurgo-Pacheco, A. & Pierola, M. D. (2008). Patterns of Export Diversification in Developing Countries: Intensive and Extensive Margins, Policy Research Working Paper 4473, The World Bank International Trade Department January 2008. [2] Babones, S. & Farabee-Siers, R. M. (2010). Global Export Partner Concentration since 1980: Trends in Dependency and Globalisation, TASA 2010 Conference Proceedings: Social Causes, Private Lives, edited by S. Velayutham, N. Ebert, and S. Watkins. Hawthorn: The Australian Sociological Association. [3] Babones, S. & Farabee-Siers, R. M. (2012). Indices of Trade Partner Concentration for 183 Countries, 1980-2008, Journal of World-Systems Research, Vol. 18, No. 2, pp. 266-277. [4] Bahar, D. & Santos, M. A. (2016). Natural resources and export concentration: on the most likely casualties of Dutch disease, Working Papers

International Journal - VALLIS AUREA • Volume 4 • Number 1 • Croatia, June 2018 339.565; DOI 10.2507/IJVA.4.1.1.43
27
Center for International Development at Harvard University. [5] Barbezat, D. (2003). Concentration and entry, In Mokyr, J. (Ed.), The Oxford Encyclopedia of Economic History, Vol. 2, Oxford, Oxford University press, pp. 344-347. [6] Bebczuk, R. N. & Berrettoni, N. D. (2006). ‘Explaining Export Diversification: An Empirical Analysis’, CAF Research Program on Development Issues. [7] Bikker, J. A. & Haaf, K. (2002). Measures of Competition and Concentration in the Banking Industry: a Review of the Literature, Netherland: Central Bank of the Netherlands. [8] Carrere, C.; Cadot, O. & Strauss-Kahn, V. (2011). Export diversification: What’s behind the Hump?, Review of Economics and Statistics, 2011, Vol. 93, No. 2, pp. 590-605. [9] Hall, M. &Tideman, N. (1967). Measures of Concentration, Journal of the American Statistical Association, Vol. 62, No. 317, pp. 162-168. [10] Herfindahl, O. C. (1950). Concentration in the steel industry, Doctoral dissertation. Columbia University. [11] Hirschman, A. O. (1980). National Power and the Structure of Foreign Trade, Berkeley, University of California Press. [12] Johansson, B. & Nilsson, D. (2007). Globalization and distribution of exports, CESIS Electronic Paper Working Series, Paper No. 93. [13] Kaitibie, S.; Al Jaidah, M. I. & Masudul HAQ, M. (2016). Export Market Concentration And The Potential For Export Market Diversification In The Oil And Gas Sector In A Small Open Economy, International Journal of Economic Perspectives, 2016, Volume 10, Issue 1, 71-85.
[14] Linder, S. (1961). An essay on Trade and Transformation, Wiley, New York. [15] Low, P.; Olarreaga, M. & Suarez, J. (1998). Does globalization cause a higher concentration of international trade and investment flows?, Economic Research and Analysis Division. Staff Working Paper ERAD-98-08, World Trade Organisation. [16] Meilak, C. (2008). Measuring export concentration: The implications for small states, Bank of Valletta Review, No. 37, Spring 2008. [17] Needleman, L. (1978). On the approximation of the Gini coefficient of concentration, The Manchester School, Vol. 46, No. 2, pp. 105-122. [18] Ortiz-Ospina, E. & Roser, M. (2017). International trade, Our World in Data. [19] Paudel, R. C. (2014). Export Performance in Developing Countries: A Comparative Perspective, Working Paper No. 2014/26, Working Papers in Trade and Development. [20] Podder, N. (1995). On the relationship between the Gini coefficient and income elasticity, The Indian Journal of Statistics, Vol. 57, pp. 428-432. [21] Rosenbluth, G. (1955). Measures of Concentration, In Stigler, G. J. (Ed.), Business Concentration and Price Policy, Princeton, Princeton University Press, pp. 57-99. [22] Ruiz-Porras, A. & López-Mateo, C. (2010). Market concentration measures and investment decisions in Mexican manufacturing firms, Accounting & Taxation, Volume 2, Number 1, 2010. [23] Salomon, S. (2010). A primer on export diversification: key concepts, theoretical underpinnings and empirical evidence, Growth and Crisis Unit World Bank Institute May 2010. [24] Sattar, Z. & Sadiq A. (2012). ‘Reducing Vulnerability in Export Performance: The Export

International Journal - VALLIS AUREA • Volume 4 • Number 1 • Croatia, June 2018 339.565; DOI 10.2507/IJVA.4.1.1.43
28
Diversification Challenge in Bangladesh’, Working Paper March 2012. IGC International Growth Centre. [25] United Nations (2011). Export depandance and export concentration, United Nations Development Programme, Chapter 1, Towards human resilience: Sustaining MDG progress in an age of economic uncertainty. [26] United Nations Conference on Trade and Development. (2017a). Summary - Merchandise: Total trade and share, annual, 1948-2016. [27] United Nations Conference on Trade and Development. (2017b). UNCTAD Stat Database. World Bank (2017) HH Market Concentration Index.