Embed Size (px)
Citation preview
Investigating the effect of compression onthe permeability of fibrous porous media
by
Martha Catharina van Heyningen
Thesis presented in fulfilment of the requirements for thedegree of Master of Science in Applied Mathematicsin the Faculty of Science at Stellenbosch University
Supervisor: Dr. Sonia Woudberg
April 2014

Declaration
By submitting this thesis/dissertation electronically, I declare that the entirety of the workcontained therein is my own, original work, that I am the sole author thereof (save to theextent explicitly otherwise stated), that reproduction and publication thereof by Stellen-bosch University will not infringe any third party rights and that I have not previouslyin its entirety or in part submitted it for obtaining any qualification.
Date: April 2014
Copyright ©2014 Stellenbosch University
All rights reserved
i
Stellenbosch University http://scholar.sun.ac.za
Abstract
Fluid flow through porous media plays an important role in a variety of contexts of whichfiltration is one. Filtration efficiency of fibrous filters depends on the micro-structuralcharacterization of these porous materials and is reflected in the permeability there-of.Compression of fibrous porous media has a significant effect on the permeability. Exper-imental data indicate that the permeability varies generally with more than an order ofmagnitude over the narrow porosity range in which the compression takes place. Relativeto the amount of experimental studies regarding this phenomenon, there is a scarcity ofgeometric models in the literature that can account for the effect of compression on thepermeability of a fibrous porous medium. Within the context of existing geometric pore-scale models based on rectangular geometry, a new model is presented and an existingmodel improved to predict the effect of one-dimensional compression in the streamwisedirection. In addition, without compromising on a commitment to mathematical sim-plicity, empirical data of a non-woven fibrous porous medium was used to highlight theeffect of model geometry on its predictive capability. Different mathematical expressionsfor the relationship between compression and porosity were considered. The permeabilityis expressed explicitly in terms of the fibre diameter and the compression fraction andimplicitly in terms of the porosity. The porosity is incorporated through the relationshipbetween the linear dimensions of the geometric model. The general applicability of themodel(s) was validated by making use of data on airflow through a soft fibrous porousmaterial as well as through glass and nylon fibres. The permeability predictions fall withinthe same order of magnitude as the experimental data. Given the mathematical simplicityof the model(s), the prediction capability is satisfactory. Attention is drawn to assump-tions made and model restrictions within the analytical modelling procedure. A generalpredictive equation is presented for the permeability prediction in which a solid distribu-tion factor is introduced. The proposed models serve as basis for further adaptation andrefinement towards prediction capability.
ii
Stellenbosch University http://scholar.sun.ac.za
Opsomming
Vloei van vloeistowwe deur poreuse media speel ’n belangrike rol in ’n verskeidenheid kon-tekste waarvan filtrasie een is. Die filtrasie doeltreffendheid van vesel filters hang af vandie mikro-strukturele karakterisering van hierdie poreuse materiale en word gereflekteerin die permeabiliteit. Kompressie van veselagtige poreuse media het ’n beduidende effekop die permeabiliteit. Eksperimentele data dui aan dat die verandering in permeabiliteitgewoonlik oor meer as ’n orde grootte strek oor die klein porositeitsinterval waarin diekompressie plaasvind. Relatief tot die aantal eksperimentele studies rakende hierdie ver-skynsel, is daar ’n tekort aan geometriese modelle in die literatuur wat die effek vankompressie op die permeabiliteit van veselagtige poreuse media in ag kan neem. Binnedie konteks van bestaande geometriese kanaal-skaal modelle gebasseer op reghoekige ge-ometrie, is ’n nuwe model voorgestel en ’n bestaande model verbeter om die effek vaneen-dimensionele kompressie in die stroomsgewyse rigting te voorspel. Sonder om dieverbintenis tot wiskundige eenvoud prys te gee, is empiriese data van ’n nie-geweefdeveselagtige poreuse medium gebruik om die effek van die geometrie van ’n model op syvoorspellingsvermoe uit te lig. Verskillende wiskundige uitdrukkings is oorweeg vir dieverband tussen kompressie en porositeit. Die permeabiliteit is eksplisiet uitgedruk interme van die veseldiameter en die kompressie breukdeel en implisiet in terme van dieporositeit. Die porositeit is ge-inkorporeer deur die verhouding tussen die lineere dimen-sies van die geometriese model. Die algemene toepaslikheid van die model(le) is gestaafdeur gebruik te maak van data oor lugvloei deur ’n sagte veselagtige poreuse materiaalsowel as deur glas en nylon vesels. Die voorspellings van die permeabiliteit val binnedieselfde groote orde as die eksperimentele data. Gegee die wiskundige eenvoud van diemodel(le), is die voorspellingsvermoe bevredigend. Aandag is gevestig op aannames watgemaak is en modelbeperkings binne die analitiese modellerings prosedure. ’n Algemenevoorspellingsvergelyking is voorgestel vir die voorspelling van die permeabiliteit waarin’n vaste stof distribusie faktor ge-inkorporeer is. Die voorgestelde modelle dien as basisvir verdere aanpassing en verfyning van voorspellingsvermoe.
iii
Stellenbosch University http://scholar.sun.ac.za

Acknowledgements
The journey into unknown territory would not have been such a memorable experiencewere it not for:
• Ingrid Mostert and Willie Brink who brought me to the starting line.
• Sonia Woudberg who took on the challenge of a road less traveled by.
• My Mom, Rina van Heyningen, who prayed us through the journey and who sharesmy passion for trying to understand God’s works of art.
• Hardus Diedericks and his open door policy.
• Milton Maritz who helped me decode my ideas.
• Adrian, Daniek, Francois, Graaf Grobler, Hanno, Mapundi, Maretha, Maret andMarianne.
• Family and friends, you know who you are ... how boring any journey will be withoutyou...
Financial assistance from the National Research Foundation (NRF) towards this researchis hereby acknowledged. Opinions expressed and conclusions arrived at, are those of theauthor and are not necessarily to be attributed to the NRF.
iv
Stellenbosch University http://scholar.sun.ac.za
Contents
1 Introduction 1
2 Theoretical background 6
2.1 Assumptions . . . . . . . . . . . . . . . . . . . . . . . . . . . . . . . . . . . 6
2.2 Flow through porous media . . . . . . . . . . . . . . . . . . . . . . . . . . 8
2.2.1 Fundamental porous media concepts . . . . . . . . . . . . . . . . . 9
2.2.2 Volume averaging . . . . . . . . . . . . . . . . . . . . . . . . . . . . 11
2.2.3 Permeability . . . . . . . . . . . . . . . . . . . . . . . . . . . . . . . 15
3 Literature study 18
3.1 Studies from the literature . . . . . . . . . . . . . . . . . . . . . . . . . . . 19
3.1.1 Discussion . . . . . . . . . . . . . . . . . . . . . . . . . . . . . . . . 26
3.2 Literature regarding RRUCs . . . . . . . . . . . . . . . . . . . . . . . . . . 27
3.2.1 Foam RRUC model . . . . . . . . . . . . . . . . . . . . . . . . . . . 27
3.2.2 Granular RRUC model . . . . . . . . . . . . . . . . . . . . . . . . . 28
3.2.3 Fibre RRUC model . . . . . . . . . . . . . . . . . . . . . . . . . . . 29
3.3 Experiments pertaining to the present study . . . . . . . . . . . . . . . . . 36
3.3.1 Influence of structural parameters on permeability (Le Coq (2008)) 36
3.3.2 Permeability of soft porous media (Akaydin et al. (2011)) . . . . . . 39
4 Two-strut fibre RRUC model 42
4.1 Relationship between porosity and compression fraction . . . . . . . . . . 43
v
Stellenbosch University http://scholar.sun.ac.za
4.2 Geometric model . . . . . . . . . . . . . . . . . . . . . . . . . . . . . . . . 48
4.3 Modelling steps . . . . . . . . . . . . . . . . . . . . . . . . . . . . . . . . . 51
4.4 Permeability prediction based on different compression fraction - porosityrelationships . . . . . . . . . . . . . . . . . . . . . . . . . . . . . . . . . . 54
4.4.1 Linear (regression) relationship between compression fraction andporosity (equation (4.2)) . . . . . . . . . . . . . . . . . . . . . . . . 55
4.4.2 General non-linear relationship between compression fraction andporosity (equation (4.6)) . . . . . . . . . . . . . . . . . . . . . . . . 62
4.4.3 Specific non-linear relationship between compression fraction andporosity (equation (4.8)) . . . . . . . . . . . . . . . . . . . . . . . . 66
4.4.4 Summary . . . . . . . . . . . . . . . . . . . . . . . . . . . . . . . . 69
5 Modified two-strut fibre RRUC model 72
5.1 Solid-change in the two-strut fibre RRUC . . . . . . . . . . . . . . . . . . 72
5.1.1 Solid with side lengths d⊥, 1√2ds and
√2 ds . . . . . . . . . . . . . . 73
5.1.2 Solid with side lengths d⊥, 1√2eds and
√2e ds . . . . . . . . . . . . . 78
5.2 The choice of hydraulic diameter revisited . . . . . . . . . . . . . . . . . . 81
5.3 Alternative method for determining d∥0 . . . . . . . . . . . . . . . . . . . . 83
6 Model validation 88
6.1 Soft fibrous porous medium . . . . . . . . . . . . . . . . . . . . . . . . . . 88
6.2 Data sets from Jackson & James (1986) . . . . . . . . . . . . . . . . . . . . 91
7 Conclusions and future work 95
7.1 Conclusions . . . . . . . . . . . . . . . . . . . . . . . . . . . . . . . . . . . 95
7.2 Future work . . . . . . . . . . . . . . . . . . . . . . . . . . . . . . . . . . . 101
A General fluid flow concepts 102
vi
Stellenbosch University http://scholar.sun.ac.za
Nomenclature
Standard characters
d [m] linear dimension
ds [m] linear dimension of solid in RRUC
d∥ [m] linear dimension of solid in RRUC parallel to streamwisedirection
d∥0 [m] linear dimension of solid in RRUC parallel to streamwisedirection in uncompressed state
d⊥ [m] linear dimension of solid in RRUC perpendicular tostreamwise direction
Dh [m] hydraulic diameter
e [ ] compression fraction
eexp [ ] experimental compression fraction values
fb [N.kg−1] external body forces per unit mass
h [m] height of sample porous medium after compression
h0 [m] initial uncompressed height of sample porous medium
k [m2] Darcy permeability
kexp [m2] experimental permeability values
L [m] linear dimension
n [ ] outwardly directed unit normal vector for the fluid-phase on the solid surface
p [Pa] interstitial pressure
q [m.s−1] superficial velocity, Darcy velocity or specific discharge
Q [m3.s−1] volumetric flow rate
Rh [m] hydraulic radius
Re [ ] Reynolds number
vii
Stellenbosch University http://scholar.sun.ac.za
Sfs [m2] fluid-solid interface in RRUC
Sfs [m2] fluid-solid interface in REV
S|| [m2] surface area in RRUC adjacent to streamwisefluid volume
S⊥ [m2] surface area in RRUC adjacent to transversefluid volume
Uf [m3] total fluid volume in RRUC
Uf [m3] total fluid volume in REV
U0 [m3] total (fluid and solid) volume of RRUC
U0 [m3] total (fluid and solid) volume of REV
Us [m3] total solid volume in RRUC
Ut [m3] total transfer volume in RRUC
U|| [m3] total streamwise volume in RRUC
U⊥ [m3] total transverse volume in RRUC
u [m.s−1] drift velocity
v [m.s−1] interstitial fluid velocity
w∥ [m.s−1] streamwise average pore velocity
w⊥ [m.s−1] transverse average pore velocity
x, y, z [m] distance along Cartesian coordinate
Greek symbols
α [ ] solid distribution parameter
∆ [ ] change in streamwise property
ϵ [ ] porosity
ϵ0 [ ] porosity of the uncompressed state
µ [N.s.m−2] fluid dynamic viscosity
ρ [kg.m−3] fluid density
τ [N.m−2] local shear stress
τw [N.m−2] local wall shear stress
ϕ [ ] solid volume fraction
χ [ ] tortuosity factor
ψ [ ] property defined in fluid phase
viii
Stellenbosch University http://scholar.sun.ac.za
Miscellaneous
∇ del operator
⟨ ⟩ phase average operator
⟨ ⟩f intrinsic phase average operator
{ } deviation operator
vector (underlined)
diadic (doubly underlined)
Acronyms
REV Representative Elementary Volume
RRUC Rectangular Representative Unit Cell
Subscripts
f fluid matter
fs fluid-solid interface
h hydraulic
s solid matter
w wall
|| parallel to streamwise direction
⊥ perpendicular to streamwise direction
ix
Stellenbosch University http://scholar.sun.ac.za
List of Figures
3.1 Unit cell used by Tamayol & Bahrami (2009). [Source: Tamayol & Bahrami(2009)] . . . . . . . . . . . . . . . . . . . . . . . . . . . . . . . . . . . . . . 22
3.2 Original RRUC model proposed for flow through a rigid, isotropic andconsolidated porous medium. [Source: Du Plessis & Masliyah (1988)] . . . 28
3.3 Original RRUC model proposed for flow through rigid, isotropic granularporous media. [Source: Du Plessis & Masliyah (1991)] . . . . . . . . . . . . 29
3.4 Fibre RRUC model for predicting the permeability of a fibrous porousmedium. . . . . . . . . . . . . . . . . . . . . . . . . . . . . . . . . . . . . . 30
3.5 Three-strut fibre RRUC model (a) before and (b) after compression. [Source:Woudberg (2012a)] . . . . . . . . . . . . . . . . . . . . . . . . . . . . . . . 34
3.6 Glass fibre non-wovens. [Source: Le Coq (2008)] . . . . . . . . . . . . . . . 37
4.1 Different relationships between the compression fraction (filter thicknessrelative to its uncompressed state) and the compression induced porosity. . 47
4.2 Two-strut fibre RRUC model (a) before and (b) after compression. . . . . 49
4.3 Permeabilities predicted by the two-strut- and three-strut fibre RRUC mod-els, based on a linear relationship between e and ϵ (equation (4.2)). . . . . 57
4.4 RRUC side lengths parallel (top) and perpendicular (bottom) to the stream-wise direction, as a function of compression induced porosity. (Linear re-lationship between e and ϵ.) . . . . . . . . . . . . . . . . . . . . . . . . . . 58
4.5 RRUC side lengths parallel (top) and perpendicular (bottom) to the stream-wise direction, as a function of compression induced porosity, for the poros-ity domain [0.75; 0.95]. (Linear relationship between e and ϵ.) . . . . . . . 60
4.6 RRUC volumes as a function of compression induced porosity for the poros-ity domain [0.75; 0.95]. (Linear relationship between e and ϵ.) . . . . . . . 61
x
Stellenbosch University http://scholar.sun.ac.za
4.7 Permeabilities predicted by the two-strut- and three-strut fibre RRUC mod-els for the porosity domain [0.75; 0.95]. (Linear relationship between e andϵ.) . . . . . . . . . . . . . . . . . . . . . . . . . . . . . . . . . . . . . . . . 61
4.8 Permeabilities predicted by the two-strut- and three-strut fibre RRUC mod-els, based on the general non-linear relationship between e and ϵ (equation(4.6)). . . . . . . . . . . . . . . . . . . . . . . . . . . . . . . . . . . . . . . 63
4.9 RRUC side lengths parallel (top) and perpendicular (bottom) to the stream-wise direction as a function of compression induced porosity. (Generalnon-linear relationship between e and ϵ.) . . . . . . . . . . . . . . . . . . . 64
4.10 RRUC side length perpendicular to the streamwise direction as a func-tion of compression induced porosity for the porosity domain [0.75; 0.95].(General non-linear relationship between e and ϵ.) . . . . . . . . . . . . . . 65
4.11 Permeabilities predicted by the two-strut- and three-strut fibre RRUC mod-els for the porosity domain [0.75; 0.95]. (General non-linear relationshipbetween e and ϵ.) . . . . . . . . . . . . . . . . . . . . . . . . . . . . . . . . 65
4.12 Permeabilities predicted by the two-strut- and three-strut fibre RRUC mod-els based on a specific non-linear relationship between e and ϵ (equation(4.8)). . . . . . . . . . . . . . . . . . . . . . . . . . . . . . . . . . . . . . . 67
4.13 RRUC side lengths parallel (top) and perpendicular (bottom) to the stream-wise direction as a function of compression induced porosity. (Spesific non-linear relationship between e and ϵ.) . . . . . . . . . . . . . . . . . . . . . . 68
4.14 Influence of the relationship between e and ϵ on the permeability-predictionof the two-strut fibre RRUC model. . . . . . . . . . . . . . . . . . . . . . . 69
4.15 Influence of the relationship between e and ϵ on the permeability predictionof the three-strut fibre RRUC model. . . . . . . . . . . . . . . . . . . . . . 70
5.1 Solid with dimensions d⊥, 1√2ds and
√2 ds for two-strut fibre RRUC model. 74
5.2 Permeabilities predicted by the two-strut- and two-strut sqrt(2) fibre RRUCmodels. (Spesific non-linear relationship between e and ϵ.) . . . . . . . . . 77
5.3 Solid with dimensions d⊥, 1√2eds and
√2e ds for two-strut fibre RRUC model. 78
5.4 Permeabilities predicted by the two-strut-, the two-strut sqrt(2)- and thetwo-strut sqrt(2e) fibre RRUC models. (Spesific non-linear relationshipbetween e and ϵ.) . . . . . . . . . . . . . . . . . . . . . . . . . . . . . . . . 80
5.5 Two-strut fibre RRUC model (a) before and (b) after compression. . . . . 84
5.6 Top view (left) and side view (right) of the two-strut fibre RRUC for theuncompressed state (e=1). . . . . . . . . . . . . . . . . . . . . . . . . . . . 85
xi
Stellenbosch University http://scholar.sun.ac.za
5.7 Permeabilities predicted by the two-strut- and two-strut alternative d∥0fibre RRUC models. (General non-linear relationship between e and ϵ.) . . 87
6.1 Top view (left) and side view (right) of the two-strut sqrt(2e) fibre RRUCfor the uncompressed state (e=1). . . . . . . . . . . . . . . . . . . . . . . . 89
6.2 Permeabilities predicted by the two-strut alternative d∥0- and the two-strutsqrt(2e) alternative d∥0 fibre RRUC models for a soft porous medium. (Gen-eral non-linear relationship between e and ϵ.) . . . . . . . . . . . . . . . . . 90
6.3 Top view (left) and side view (right) of the two-strut general alternatived∥0 fibre RRUC. . . . . . . . . . . . . . . . . . . . . . . . . . . . . . . . . . 92
6.4 Permeability predictions of the three-strut- and two-strut general alterna-tive d∥0 fibre RRUC models for glass fibres with radius 0.082 mm. . . . . . 93
6.5 Permeability predictions of the three-strut- and two-strut general alterna-tive d∥0 fibre RRUC models for nylon fibres with radius 0.0965 mm. . . . . 93
7.1 Overview of the investigation into the effect of compression of a fibrousporous medium on the permeability there-of. . . . . . . . . . . . . . . . . . 97
7.2 Overview of the relative percentage difference between the permeabilitypredictions of the proposed models and the experimental values obtainedby Le Coq (2008). . . . . . . . . . . . . . . . . . . . . . . . . . . . . . . . . 98
7.3 Solid with dimensions d⊥, 1√αeds and
√αe ds for the general two-strut fibre
RRUC model. . . . . . . . . . . . . . . . . . . . . . . . . . . . . . . . . . . 99
7.4 Top view (left) and side view (right) of the general two-strut fibre RRUCfor the uncompressed state (e=1). . . . . . . . . . . . . . . . . . . . . . . . 100
xii
Stellenbosch University http://scholar.sun.ac.za
List of Tables
3.1 Volume and surface partitioning referring to the original fibre RRUC model. 31
3.2 Selection of data from Le Coq (2008) regarding glass fibre non-wovens(average diameter 2.7 µm; average length 0.9 mm). . . . . . . . . . . . . . 39
3.3 Selection of data from Akaydin et al. (2011) regarding regular polyesterpillow material (average diameter 10 µm). . . . . . . . . . . . . . . . . . . 41
4.1 Verification of the use of the non-linear relationship between e and ϵ. . . . 45
4.2 Values for the hydraulic diameter corresponding to the four stages of com-pression (experiment), based on a linear relationship between e and ϵ. . . . 55
4.3 Relative percentage error in the permeability prediction of the two-strut-and three-strut fibre RRUC models. (Linear relationship between e and ϵ.) 56
4.4 Relative percentage error in the permeability prediction of the two-strutand three-strut fibre RRUC models. (General non-linear relationship be-tween e and ϵ.) . . . . . . . . . . . . . . . . . . . . . . . . . . . . . . . . . 62
4.5 Relative percentage error in the permeability prediction of the two-strutand three-strut fibre RRUC models. (Specific non-linear relationship be-tween e and ϵ.) . . . . . . . . . . . . . . . . . . . . . . . . . . . . . . . . . 66
5.1 Relative percentage error in the permeability prediction of the two-strut-and two-strut sqrt(2) fibre RRUC models. (Spesific non-linear relationshipbetween e and ϵ.) . . . . . . . . . . . . . . . . . . . . . . . . . . . . . . . . 76
5.2 Relative percentage error in the permeability predictions of the two-strut-and two-strut sqrt(2e) fibre RRUC models. (Spesific non-linear relationshipbetween e and ϵ.) . . . . . . . . . . . . . . . . . . . . . . . . . . . . . . . . 79
5.3 Relative percentage error in the permeability prediction of the two-strut-and two-strut alternative d∥0 fibre RRUC models. (General non-linear re-lationship between e and ϵ.) . . . . . . . . . . . . . . . . . . . . . . . . . . 86
xiii
Stellenbosch University http://scholar.sun.ac.za
6.1 Relative percentage error in the permeability prediction of the two-strut al-ternative d∥0- and the two-strut sqrt(2e) alternative d∥0 fibre RRUC modelsfor a soft porous medium. (General non-linear relationship between e and ϵ.) 91
6.2 Relative percentage errors in the permeability prediction of the two-strutgeneral alternative d∥0 fibre RRUC model for anisotropic fibrous porousmedia of different radii. . . . . . . . . . . . . . . . . . . . . . . . . . . . . . 94
xiv
Stellenbosch University http://scholar.sun.ac.za
Chapter 1
Introduction
Fluid flow through porous media plays an important role in a variety of contexts of whichconstruction engineering, petroleum engineering, geosciences, soil and rock mechanics,biology, biophysics and material science are examples. Non-woven fibrous porous mediapossess the ability to form a stable structure even at very high porosities, and are usedin numerous applications such as filters, wipes, heat insulators, as well as automotive-,incontinence- and medical products. According to Jaganathan et al. (2009), understand-ing the morphological changes of a fibrous porous medium due to a compressive stress iscritically important in product development. The bulk behaviour of permeability undercompressive stress depends on the structure of the material as well as on the application inwhich it is used. This behaviour of permeability is very different in different contexts suchas biological tissues (e.g. articular cartilage), rock mechanics, and structural engineering(Akaydin et al. (2011)).
According to Nabovati et al. (2009) permeability prediction, and more generally, theinvestigation of the effect of pore structure on macroscopic properties of porous media,have posed a major challenge to researchers and engineers in industrial and academicdisciplines. Fluid flow simulation in porous media, on a macroscopic level, requires thepermeability as input while the analysis of the effect of pore-scale parameters on themacroscopic properties is a challenging task. Due to the complex structure (in general)of porous media, the flow patterns within the pores are complicated. Since permeabilityis highly medium-specific, the development of an accurate generic geometric model forpermeability, as a function of the bulk properties of the medium, is an ongoing process.
The determination of permeability for a specific material usually requires experimentalwork. As alternative approaches, analytical and numerical methods aim to predict thepermeability by solving equations representing fluid flow inside the pores of the porousmedium. Rapid increase in available computing power and the ongoing development of ad-vanced numerical algorithms imply that detailed numerical simulations of flow in/throughporous media are now feasible. Removing the constraints of the analytical approaches,more complex pore geometries, which resemble real porous media structures more closely,can be used in fluid flow simulations (Nabovati et al. (2009)).
Advances in nuclear magnetic resonance imaging and localized flow and velocity measure-
1
Stellenbosch University http://scholar.sun.ac.za
ments, make it possible to study flow processes in detail, either directly e.g. in bore cores,or, for example, in phantom systems comprising glass beads. Mansfield & Bencsik (2001),made use of these advanced techniques to measure the fluid velocity distribution and fluidflow of water passing through a porous material (phantom system of glass beads) in orderto determine the degree of causality between one steady-state flow condition and another.According to Mansfield & Bencsik (2001) there appears to be a randomness associatedwith the establishment and subsequent re-establishment of water flow through the beadpack. It was concluded that the use of a causal theory to predict the details of the flowvelocity distribution at different flow rates in porous media is not optimal. The currentstudy is based on causality between physical properties while acknowledging the fact thatinclusion of stochastic effects in further modelling processes is an option.
The importance of (pure) analytical models is not annihilated by the fact that available(and evolving) computing power makes simulations ever more effective and accurate insolving problems (although computationally expensive), but it does change the role thatanalytical investigation plays. This study will present a model that balances mathematicalsimplicity with a predictive capacity which is adequately accurate to serve as a verificationindicator for imaging, experiments and/or simulations.
The main aim of this study is to present a first order analytical mathematical modelfor predicting the effect of compression on the permeability of an unconsolidated fibrousporous medium. Parallel to this, there will be a focus on the effect of parameter changeon the prediction capability of a model. This will form a basis for conclusions regardingthe effectiveness of the model.
The premise underlying the aim of this study is that given the porosity of a fibrousporous medium in an uncompressed state, within the Darcy flow regime, the permeabilitycan be predicted by solely attributing pressure losses to shear stresses. A prerequisite isthat the geometry of the model represents the structure of the porous medium (beforeand after compression) sufficiently accurate. If the effect of compression on porosity canaccurately be expressed mathematically, the prediction capability will be enhanced. Itis expected that the permeability predictions obtained in this manner could provide firstorder predictions suitable for the exploratory phases of new applications.
The development of the model will be guided by the following questions:
• What should the geometric representation be for the prediction of the effect ofcompression on a fibrous porous medium?
• How can mathematical simplicity be balanced with prediction capability?
• Apart from the porosity in the uncompressed state, what other information regard-ing the porous medium can be employed to enhance the prediction capability of themodel?
• Which mathematical function should represent the relationship between porosityand compression to enhance the model?
The combination of the above mentioned aspects will also play a role and therefore theinvestigation will focus on the effect of parameter change whilst keeping other parameters
2
Stellenbosch University http://scholar.sun.ac.za
constant in order to find the combination of parameters which leads to a usable predictioncapability.
Often the underlying assumptions of experimental, analytical modelling and simulationresults are not explicit but represented with margins of errors. Discrepancies betweensets of results that are compared may be due to (subtle) differences in assumptions made(which includes the choice of formulas used). For instance, in a literature review, Steinke& Kandlikar (2006) found a common thread through articles that have reported someform of discrepancy between the experimental data and the predicted theoretical values.Implicitly assuming that entrance and exit losses and/or developing flow are negligible,the results of these studies seemed to question the conventional theory in micro-channelflows. Throughout the present study an explicit awareness of assumptions will be evidentin order to make sense of possible discrepancies with results of other studies and/or withconventional theory.
A single set of empirical data regarding glass fibre non-wovens will be employed to high-light the influence of model-parameter change on the predictive capability of the model.The rationale behind this is to improve the prediction power of a model within a cho-sen context, in the same way as determining the influence of one variable on a systemby keeping the other variables constant. Based on conclusions regarding the analyticalmodel developed as described, another set of empirical data (regarding soft fibrous porousmedia) will be employed for verification purposes, based on the available empirically de-termined parameters. A relevant summary of information regarding the two experiments,of which the data will be used in this study, will be given in Chapter 3. The predictioncapability of the model will also be evaluated through data regarding glass- and nylonfibres.
Through comparison of the modelling results for the different fibrous porous media, con-clusions will be drawn regarding the causality between parameter change and the per-meability prediction capability of the model. Also, conclusions will refer to assumptionsmade in the analytical and experimental contexts in order to determine whether theapplicability of the analytical model can be generalized to other fibrous porous media.Changing a model-parameter or a combination there-of also provides information on howthe difference in the output of the analytical mathematical model can be assigned to dif-ferent sources of uncertainty in its input values. A sensitivity analysis will therefore beimplicitly done in an unconventional manner and not through employing the estimatesfor experimental error ranges.
Without violating the essential characteristics of the system under investigation, the au-thor’s understanding and approximation of the actual system will be expressed througha set of assumptions. This will be done knowing that because any model is a subjective,simplified and idealized version of the actual system, no unique model exists for a given‘flow through (fibrous) porous medium’ system (Bear & Bachmat (1990)).
The mathematical modelling will be based on the continuum approach. In this approachthe actual multi-phase porous medium is replaced by a fictitious continuum and theinterstitial flow conditions are related to the measurable macroscopic flow behaviour usingvolume averaging of the transport equations over a Representative Elementary Volume(REV). According to Fung (1977), a material continuum is a material for which the
3
Stellenbosch University http://scholar.sun.ac.za
momentum, energy and mass densities exist in a mathematical sense and therefore thisconcept is in essence a mathematical idealization.
A pore-scale modelling procedure which aims to approximate a porous material by imbed-ding the average geometric characteristics of a REV within the smallest possible hypo-thetical Rectangular Representative Unit Cell (RRUC) was originally introduced by DuPlessis and Masliyah for isotropic foam-like media (Du Plessis & Masliyah (1988)). Thenew representative geometric model introduced in this study is based on selected RRUCconcepts. The link between the new model (to be proposed in this study) and volumeaveraging with closure modelling, will become evident in Sections 3.2 and 4.2. The ra-tionale behind the choice of the geometric model is to represent the average geometry ofthe porous medium in such a way that the dimensions there-of can be used to scale therelevant velocities and shear stresses.
The underlying question of whether the effect of compression on fibrous porous mediacan be predicted using rectangular geometry, has its origin in the point of view that thesimplicity of a model does not necessary imply un-usability. Keeping track of the (explicitand implicit) implications that follow from this reasoning will accentuate critical aspectsof a modelling process focused on simplicity.
Since all reasoning is based on, and expressed through, concepts and ideas, a theoreticalbackground, as well as assumptions regarding concepts pertaining to this study, will bepresented in Chapter 2. Although these concepts are often perceived as ‘general knowl-edge’ for academics in this field, the underlying assumptions of these modelling ‘buildingblocks’ are not always explicit. Giving a background of the scientific field in which thisstudy will take place, will highlight the combination of assumptions made in modellingprocesses in general and, more specific, in this study.
Compression changes the shape of the voids available for flow in a specific manner whichin effect creates a ‘different’ porous medium of which the structural properties can usuallybe related to the original porous medium. The modelling of flow through a fibrous porousmedium with the aim of predicting the permeability there-of still forms the core of anattempt to predict the effect of compression on the medium.
An in-depth literature study was performed regarding different modelling procedures and aselection there-of will be summarized in Chapter 3, thus providing a sufficient (althoughnot comprehensive) overview of the differences and similarities in modelling processes.Highlighting ‘what others have done’ based on different assumption frameworks, alsoemphasizes the fact that the analytical model development in this study has an overtfocus on balancing mathematical simplicity with accuracy.
Employing the concepts discussed in Chapter 2, an attempt will be made to develop amodel with reasonable predictive capability regarding the effect of compression on per-meability. Informed by different modelling procedures (Chapter 3) without compromisingthe author’s commitment to mathematical simplicity, a new model will be introduced inChapter 4. Throughout the development the results will be compared with those of amodel presented in Woudberg (2012a), and in the process enhancing not only the predic-tion capability of the new model, but also the existing model.
4
Stellenbosch University http://scholar.sun.ac.za

In Chapter 5 parameters of the newly introduced model will be changed and the influencethere-of on the permeability prediction investigated. This will be done based on a singleset of data regarding glass fibre non-wovens. In Chapter 6 the model will furthermore bevalidated by comparing the permeability prediction to experimental permeability data onsoft fibrous porous media as well as data on glass- and nylon fibres provided by Jackson& James (1986). Chapter 7 comprises of (summarizing) conclusions and consequentlyconcepts that may form part of future enhancements of the model.
5
Stellenbosch University http://scholar.sun.ac.za
Chapter 2
Theoretical background
2.1 Assumptions
In this study, the Eulerian description will be used in the modelling procedure. TheLagrangian description is ill suited for flowing and deforming matter since the boundaryof the material volume is itself a function of time. Reynolds’ transport theorem facilitatesthe use of a control volume fixed in space.
Under the assumption that the fluid density (ρ) is constant everywhere (homogeneous,incompressible fluid), the continuity equation (equation (A.1)) reduces to
∇ · v = 0 . (2.1)
This implies that isochoric flow (the material derivative of the density is zero i.e. in-compressible flow) is assumed. This assumption results in considerable simplification andvery little error (Bird et al. (2007)).
The assumption of incompressible flow for experiments where air, a compressible fluid, isused, can be justified as follows: For the modelling processes in this study, flow velocitiessignificantly less than the speed of sound is assumed. Since the maximum pressure changeassociated with motion is of the order (ρv2)/2, the Mach number is significantly less thanunity and this change in pressure is negligible (Fung (1977)) relative to the undisturbedpressure.
The modelling procedure in this study is based on the assumption that the fluid resemblesa Newtonian fluid (Appendix A). The Navier-Stokes (momentum) equations (equations(A.2), (A.3) and (A.4)), will therefore be employed with the shear stresses as functionsof (only) velocity gradients and viscosity. As will become clear in Chapter 4, the factthat the shear stresses can be expressed in terms of velocity gradients (equation (A.5)) isessential in the modelling process of this study.
In the present study the pressure is determined solely by the equations of motion and theaccompanying boundary conditions (Fung (1977)). (Thermodynamically, the pressure ofa fluid is a function of its density and temperature and in some applications it is also
6
Stellenbosch University http://scholar.sun.ac.za
necessary to solve an equation of state relating these thermodynamic variables.)
Although in most applications with homogeneous fluids the hydrostatic pressure plays norole in fluid motions and can be subtracted from the total pressure (Worster (2009)), itwill not be done in this investigation. The only body force that will be taken into accountin the modelling process is the one due to gravitation and it will be included (implicitly)in the pressure term.
When modelling flow through porous media the viscosity of the fluid and the permeabilityof the porous medium are important variables in the mathematical description of the exactrelationship between the pressure gradient and the fluid velocity gradient. Since the focusof this study is on the permeability of a porous medium, only a short general reference toviscosity (µ) is given in Appendix A. (Shear stress is an essential concept in the modellingof pressure losses in this study, therefore it is important to highlight core aspects of thisparameter.) The present study is based on the assumption that the properties of laminarflow may be employed, keeping in mind that this restricts the application of the model.This assumption implies that viscosity is an (implicit) intrinsic part of the modellingprocess.
The (Newtonian) fluid is assumed to be homogeneous and isotropic (no concentrationgradients) with uniform (constant) viscosity. The results of this analytical investigationare therefore only applicable in contexts where the temperature, pressure and compositionof the fluid justify the assumption of constant viscosity. When the word ‘viscosity’ is usedin this study, dynamic viscosity is implied.
In an incompressible viscous fluid the internal friction causes mechanical dissipation whichmay increase the internal energy and temperature of the fluid or may result in heat con-duction. This flow of heat is usually uncoupled from momentum transfer if the variationin viscosity with temperature is not considered or negligible (Hughes (1979)). In thisstudy, the analytical modelling of flow through fibrous porous media will be based on theassumption that the system is isothermal and consequently the energy equation will notbe employed.
Although assuming a no-slip condition at the fluid-solid interface generally implies thata development region will be present in the micro-channels of the porous medium, themodelling process will be based on the assumption that fully developed flow is appli-cable in the geometric model. The friction factor will not be employed in the presentstudy although in the models that will be discussed in Chapter 3 (including previousRRUC models) the friction factor (equation (A.7)) forms an essential part of the differentmodelling procedures.
In summary, the modelling process will incorporate the properties associated with a ho-mogeneous, isotropic Newtonian fluid (constant density and viscosity). No body forcesexcept gravitational forces (implicitly included in the pressure term) will be considered.Underlying the assumptions mentioned above is the assumption that conditions of isother-mal, isochoric, single phase, laminar and fully developed flow, with a no-slip condition atthe fluid-solid interfaces are justified for a first order modelling process.
7
Stellenbosch University http://scholar.sun.ac.za
2.2 Flow through porous media
In general a porous medium can be described as a continuous multiphase material wherethe persistent solid phase and the connected void space are both represented throughoutthe whole domain occupied by the medium. The porosity (ϵ) of a porous medium isin general defined as the fraction of void volume with respect to total volume of porousmedium (Bear (1988)) and can therefore also be expressed as a percentage. Accordingto Montillet & Le Coq (2003) porosity is one of the most determining parameters offlow through porous media and the bulk porosity is generally used in equations relatedto flow and mass transfer phenomena. The porosity variation along a given direction isgenerally not used in analytical flow models because of the mathematical complexity itintroduces. It may happen that there are voids in the material that are not available forfluid flow and therefore the effective porosity refers to the fraction of the total volume inwhich fluid flow is effectively taking place. The effective pore space includes caternary(inter-connected) and dead-end (cul-de-sac) pores and excludes closed (non-connected)pores. In the model of Woudberg (2012a) the dead-end pores are not included as partof the effective pore space, based on experimental data in literature showing a very lowpercentage contribution to effective pore volume by dead-end pores. For highly porousmedia the Solid Volume Fraction (SVF), defined as
ϕ ≡ 1 − ϵ , (2.2)
is mostly used to indicate the percentage solid in a porous matrix relative to the totalvolume of the matrix. For the purpose of this study the porosity of the porous medium willconsistently be used in predictive equations obtained through the analytical investigation.
Measurements of the pore volume and pore size distributions of a porous medium samplecan be performed using methods of which mercury porosimetry, liquid displacement andimage analysis are examples. Image analysis can eliminate the risk of destruction ofthe porous medium and for this Scanning Electron Microscopy, Light microscopy, X-raycomputed tomography (CT scan), computed axial tomography (CAT scan) or MagneticResonance Imaging (MRI) can be used. Information regarding the method(s) used tomeasure the pore volume (including the underlying assumptions) is important since themargin of error in the calculation of e.g. porosity, is experiment-dependent.
The Reynolds number (equation (A.6)) for flow through porous media is defined as
Re ≡ ρ q d
µ, (2.3)
with q the magnitude of the superficial velocity and d some length dimension of theporous matrix which should, in analogy to pipe flow, represent the average diameter ofthe elementary channels of the porous medium. For unconsolidated porous media it iscustomary to use a representative dimension of the grains or the fibres, due to the relativeease of determining it (Bear (1988)). This custom will be honored in this study.
For a porous medium, the hydraulic diameter is defined as four times the volume availablefor flow in the porous medium, divided by the area of the fluid-solid interface associatedwith the volume available for flow (Whitaker (1999)).
8
Stellenbosch University http://scholar.sun.ac.za
In the next section general fundamental porous media concepts and equations will bepresented which will be referred to in Chapter 3 when different modelling procedures(from the literature) are summarized.
2.2.1 Fundamental porous media concepts
Three different categories of porous media considered by Woudberg (2012a) are granularmedia, foamlike media and fibre beds. Although foamlike media are generally categorizedas consolidated fibrous porous media, these porous structures are not the focus of thisstudy. Foamlike media are classified as consolidated (or non-dispersed) porous mediasince the solid matrix is connected. Foams are used in practical applications e.g. forheat transfer enhancement (Woudberg (2012a)). The analytical model to be developedin this study will be based on an existing analytical model for foamlike media (Woudberg(2012a)) which was used to predict the effect of compression on the permeability of afibrous porous medium.
The term ‘fibrous porous medium’ will be used for a porous medium that is composedof unconsolidated rod-like particles or a complicated mesh of curving, intertwining fibres.Manufactured and natural fibrous media are essential in many processes of which filtration,biological transport and adsorption are examples (Thompson et al. (2002)). According toPradhan et al. (2012) fibrous porous media require much less material to form a stablestructure than granular porous media. This is mainly attributed to the relatively complexorganization as well as the characteristics of the basic fibres. The internal structure ofthe fibrous porous media is generally characterized by the fibre orientation and the fibrepacking density. When the assemblages consist of long, straight relatively closely spacedfibres it is referred to as a fibre bed (Woudberg (2012a)).
For the purpose of modelling, fibrous porous media can, according to Tamayol & Bahrami(2009), be categorized according to the orientation of the fibres relative to one another:
• One-dimensional: The fibres are all parallel to each other, independent of the plane.
• Two-dimensional: The fibres are located in parallel planes with random orientationwithin the plane.
• Three-dimensional: The fibres have random orientations in space.
The analytical model(s) developed in this study will be based only on three-dimensional fi-brous porous media (not foams) which, due to compression, resembles some two-dimensionalproperties. A detailed description of the applicable properties of the two types of porousmedia which are incorporated in the modelling process of this study, will be described ina subsequent chapter.
For the sake of completeness, and since the definition of permeability relates back to themodelling of fluid flow through granular porous media, a few important aspects in thehistorical development thereof are highlighted:
9
Stellenbosch University http://scholar.sun.ac.za
Granular porous media refer to relatively closely spaced granules (not necessary sphericaland/or uniform) in contact with each other and usually held immobile by a tube orother vessel of which it forms the packing material. These packed beds are also classifiedas unconsolidated (or dispersed) porous media since the solid matrix is not connected(Woudberg (2012a)). A packed column is a type of packed bed which is of interest inchemical engineering and is widely used to perform separation processes and heterogeneouscatalytic reactions.
The first significant attempt at addressing fluid discharge through porous media waspostulated by Darcy after conducting experiments to examine the factors that govern therate of water flow through vertical homogeneous sand filters. Darcy’s phenomenologicallyderived constitutive relation states that the volumetric flow rate (Q) is proportional tothe constant cross-sectional area of the column, inversely proportional to the length ofthe filter and proportional to the difference in piezometric head across the length of thefilter.
The superficial velocity (specific discharge, Darcy velocity or filter velocity), q, definedas the volumetric flow rate divided by the cross-sectional area normal to the directionof flow, is therefore (linearly) proportional to the hydraulic gradient (Bear (1988)). Thisexperimentally derived form of Darcy’s law (for a homogeneous, incompressible fluid) waslimited to one-dimensional flow but has been generalized to three-dimensional flow whereq and the hydraulic gradient are three-dimensional vectors. According to Nabovati et al.(2009) this relationship is valid in the creeping flow regime where (for porous media) theReynolds number is significantly less than unity, i.e. at low Reynolds numbers where fluidinertial effects are negligible (e.g. Du Plessis & Van der Westhuizen (1993)). Deviationsfrom Darcy’s law at Reynolds numbers larger than 10 are attributed to inertial forces(Skartsis et al. (1992)).
According to Du Plessis & Van der Westhuizen (1993), initial experimental observationsindicated that the pressure gradient is related to the square of the superficial velocity athigher Reynolds number flow (Re > 102). In 1901 Forchheimer postulated an improvedempirical relationship (first proposed by Dupoit in 1863) which consists of the Darcyequation with an additional term which is quadratic in superficial velocity.
The Blake-Kozeny equation for porous media consisting of solid particles through whichfluid flows, is based on the assumption that this fluid flow resembles flow through abundle of entangled tubes and that the hydraulic diameter of these tubes is linked to theeffective particle diameter of the solid particles. Experimental data was used to accountfor the non-cylindrical surfaces of the solid matrix and the tortuous flow paths in typicalpacked-columns. The assumption is implicitly made that the packing of solid particles isstatistically uniform so that there is no channeling.
According to Bear (1988), Carman described the effect of the tortuous nature of porousmedia on the velocity as well as on the driving force in a porous medium and this ledto the introduction of the tortuosity concept. This characteristic that fluid particlesfollow tortuous flow paths through a porous medium has been defined in different ways,depending on the assumptions made. The tortuosity (χ) reflects the effect of the geometryof the porous structure on the length of the flow paths and was defined as the dimensionless
10
Stellenbosch University http://scholar.sun.ac.za
number (Du Plessis (1991))
χ ≡ linear displacement
total tortuous pathlength, (2.4)
or (later) as (Du Plessis & Van der Westhuizen (1993)),
χ ≡ total tortuous pathlength
characteristic length. (2.5)
According to (for instance) Tamayol & Bahrami (2011) the tortuosity factor is definedas the ratio of the average distance that a particle should travel in a porous mediumto the direct distance covered. Several theoretical and empirical relationships for thedetermination of tortuosity have been proposed in the literature and according to Tamayol& Bahrami (2011) one of the most popular empirical models for the determination oftortuosity is Archie’s law, i.e.
χ =(
1
ϵ
)a
, (2.6)
where a is a tuning parameter that is determined through comparison of Archie’s empiricalcorrelation with experimental data for a specific porous medium. (A concise discussionon tortuosity is given by Woudberg (2012a).)
The above mentioned concepts will be referred to again when discussing information se-lected during the literature study and/or in the modelling process of the present study.Underlying many models of fluid flow (including the present one) is the continuum ap-proach. Since the geometric model(s) employed in this study are based on existing modelsdeveloped through closure modelling for volume averaged transport equations, importantaspects of volume averaging will be highlighted in a concise manner in the next section.
2.2.2 Volume averaging
Due to the complexity of actual pore structures and the length scales involved, fluidtransport in porous media is, (according to Thompson et al. (2002)), usually modelledusing the continuum approach. These methods are very effective when the necessaryaveraged parameters are known or predicted with a high degree of certainty. However,these parameters must often be determined through experiments, especially in cases wherethe macroscopic parameters of interest depend strongly on pore-scale behaviour. This canlimit the explicit incorporation of aspects such as pore structure, wettability variationsor interface behaviour into a model (Thompson et al. (2002)).
According to Whitaker (1999), the method of volume averaging can be used to rigorouslyderive continuum equations for porous media. Equations which are valid within a partic-ular phase of a multi-phase system, can be spatially smoothed to produce equations thatare valid everywhere in the continuum. In effect a change of scale can be accomplishedby the method of volume averaging which bridges the ‘gap’ between the velocity field inthe pore space and Darcy’s law which is valid everywhere in the porous medium.
11
Stellenbosch University http://scholar.sun.ac.za
Averaged parameters contain implicitly assumed length scales and therefore the properchoice of scales are of great importance. If the mean free path of a fluid molecule is com-parable to a length scale of its confinement the continuum assumption of fluid mechanicsis no longer a good approximation (Bear (1988)).
According to Bird et al. (2007), whenever the mean free path of gas molecules approachesthe dimensions of the flow conduit, the velocity of the individual gas molecules at thesolid-fluid interface has a finite value (not necessarily zero) and therefore contribute anadditional flux. This is called the slip phenomenon, Klinkenberg effect, free molecular flowor Knudsen flow. This effect is evident in flow of a gas at low pressure through a porousmedium. The slip-flow effect in micro-fluidic devices, where the no-slip assumption at thewalls breaks down, is a case where the Knudsen number (defined as the ratio of molecularmean-free-path to the characteristic length scale of the problem) can be used to estimatethe applicability of the continuum equations and whether free-molecular models shouldrather be employed (Zade et al. (2011)).
In this study it will be assumed that continuum equations are applicable, although, for ahigh level of compression, the slip phenomenon may play a role in the micro-channels.
According to the volume averaging theory, macroscopic balance equations for varioustransport phenomena may be obtained by averaging interstitial transport equations andfluid properties volumetrically over a Representative Elementary Volume (REV).In the case of single phase flow in porous media the velocity field in the pore spaceis determined by the Navier-Stokes equation, the continuity equation and the no-slipboundary condition. The change of scale from the microscopic pore space equations to themacroscopic equations (e.g. Darcy’s law), is performed in three steps, namely obtainingthe local volume average of the equations, developing a closure problem for the spatialdeviations in the pressure and velocity (which are contained in the averaged equations),and then solving the closure problem in order to make predictions (Whitaker (1999)).
A REV is defined as a volume U0 consisting of both fluid and solid parts which is sta-tistically representative of the properties of the porous medium. According to Bear &Bachmat (1990), the condition under which a porous medium can be treated as a contin-uum is the existence of a range of volumes for a REV that satisfy certain size constraints.It is important to note that the size of the REV is not a single constant value. A REV isa volume that may vary in size within a certain range, the limits of which are determinedon one end by the point where extreme fluctuations occur in the ratio of mass to volume,and on the other hand by some characteristic (macroscopic) length, such as the distancebetween two measuring points. According to Bear (1988), the REV volume should bemuch smaller than the size of the entire flow domain in order to represent what happensat a point inside this volume. The REV should also be significantly larger than the size ofa single pore to ensure that it includes a sufficient number of pores to permit a meaningfulstatistical average required for the continuum concept.
According to Whitaker (1986), the traditional restriction on length scales, i.e.
ls≪ r0 ≪ Ls , (2.7)
where ls is a characteristic length of the pore scale, r0 is the radius of the averaging volumeand Ls is a length scale of the macroscopic boundaries, is not an inherent restriction in the
12
Stellenbosch University http://scholar.sun.ac.za
averaging method itself. It is nothing more than a convenient restriction that is satisfiedby many systems of practical importance.
For a detailed description on how REVs are chosen and used to produce a continuummodel of a porous medium, the reader is referred to Bear & Bachmat (1990).
Conceptually a REV is defined for each and every point of the averaging domain andaccording to Du Plessis & Diedericks (1997) it is assumed to have a constant size, shapeand orientation at all times under consideration. Taking the volumetric centroid of theREV as the spatial point for which the (volumetric) average of a property ψ defined inthe fluid filled part, Uf , is determined, the phase average, ⟨ψ⟩, is defined as
⟨ψ⟩ ≡ 1
U0
∫∫∫Uf
ψ dU . (2.8)
According to Whitaker (1986), ⟨ψ⟩ is in general not the preferred average since it is notequal to ψ, when ψ is constant. The intrinsic phase average,
⟨ψ⟩f ≡ 1
Uf
∫∫∫Uf
ψ dU , (2.9)
is more representative of the conditions in the fluid phase. (Note that the definitionsexpress averages for single-phase flow.) The local (spatial) deviation is defined as
{ψ} ≡ ψ − ⟨ψ⟩f . (2.10)
The porosity at any point of the porous medium is defined as the fluid phase average of1 for the REV with centroid at that particular point:
ϵ ≡ Uf
U0
, (2.11)
and therefore the relationship between the phase and intrinsic phase averages is:
⟨ψ⟩ = ϵ ⟨ψ⟩f . (2.12)
According to Whitaker (1999), for a property ψ defined in the fluid phase, the spatialaveraging theorem for the fluid-solid system can be expressed as:
⟨∇ψ⟩ = ∇⟨ψ⟩ +1
U0
∫∫Sfs
n ψ dS , (2.13)
with n the outwardly directed unit normal vector for the fluid-phase on the differentialarea dS and Sfs the fluid-solid interface area contained within the averaging volume (DuPlessis & Diedericks (1997)).
For a viscous fluid (the velocity of the fluid-solid interface is equal to that of the fluidadjacent to it) the averaging of the time derivative of a property ψ leads to⟨
∂ ψ
∂t
⟩=
∂ ⟨ψ⟩∂t
− 1
U0
∫∫Sfs
n · v ψ dS , (2.14)
13
Stellenbosch University http://scholar.sun.ac.za
with v the interstitial fluid velocity.
The concepts of a REV and volume averaging lead to the introduction of various measur-able macroscopic quantities. The superficial velocity, q will be used as velocity variablein averaged equations (Du Plessis (1991)). Its relationship with the phase averaged ve-locities and the porosity ϵ is given by
q = ⟨v⟩ = ϵ ⟨v⟩f . (2.15)
The superficial velocity determines the streamwise direction which is therefore, at anypoint in the porous domain, the direction of the average of the interstitial velocity in theREV with centroid at that point. The drift velocity, u is defined as the intrinsic phaseaverage of the interstitial velocity v, which leads to
q = ϵ u , (2.16)
known as the Dupuit-Forchheimer relation. According to Nabovati et al. (2009) thecomplex structure of the pore-level geometry, especially in media of low porosity, producesnarrow flow passages in which, as a rule of thumb, the local flow velocity is proportionalto the volume-averaged flow velocity divided by the porosity.
The volumetric phase averaging of the continuity equation (2.1) under the assumptionsof incompressible flow as well as a no-slip condition on the fluid-solid interface, yields
∇ · q = 0 , (2.17)
which governs conservation of fluid mass in the presence of solid matter (Du Plessis(1991)).
The volumetric phase averaged Navier-Stokes equation for an incompressible Newtonianfluid (under a no-slip assumption) may be expressed as
−ϵ∇⟨p⟩f = ρ∂q
∂t+ ρ∇· (q q/ϵ) + ρ∇· ⟨{v}{v}⟩ − µ ∇2 q
+1
U0
∫∫Sfs
(n {p} − n · τ
)dS, (2.18)
where n is the outwardly (relative to the fluid) directed unit vector normal to the fluid-solid interface. The local shear stress tensor, τ , has components given by equation (A.5)with ∇· v = 0. As already mentioned, the gravitational (body) force is included in thepressure as a pressure head in equation (2.18).
Equation (2.18) is the governing equation for transport of momentum in porous mediaand the surface integral term contains all the information on the fluid-solid interaction(Du Plessis & Van der Westhuizen (1993)).
Assuming isothermal, time-independent, single phase flow, with no chemical or electricalinfluences, through a fully saturated unbounded porous medium, as well as assuming uni-form viscosity and superficial velocity, the expression for the (intrinsic) pressure gradient
14
Stellenbosch University http://scholar.sun.ac.za
simplifies to:
−ϵ∇⟨p⟩f =1
U0
∫∫Sfs
(n {p} − n · τ
)dS. (2.19)
In this investigation it is further assumed that ∇ϵ is negligible so that the followingequation forms the core of the closure modelling on which the method used in this study,is based:
−ϵ ∇⟨p⟩f =1
U0
∫∫Sfs
(n p − n · τ
)dS. (2.20)
Due to the fact that in actual porous media there are always gradients in the porosityand/or saturation and/or pressure on all scales, it is possible that the centroid of thefluid phase (pore space) and the centroid of the averaging volume (e.g. the manometeropening) do not coincide. This implies that the intrinsic phase average pressure and theaverage pressure over the opening of the manometer are not the same. Korteland et al.(2010) introduced and investigated other potentially plausible averaging operators. Theunderlying mathematics of these averaging operators is beyond the scope of this study.
The permeability concept will be concisely addressed in the next section in order toprovide the context in which the effect of compression of the porous medium is reflectedin the permeability there-of.
2.2.3 Permeability
According to Darcy’s law for unidirectional creeping flow through a porous medium thesuperficial fluid velocity is proportional to the pressure gradient. Hydraulic conductiv-ity is the proportionality constant in which the (intrinsic) permeability is incorporated,and which depends on the porosity as well as the micro-structural geometry e.g. fibrearrangement, void connectivity and inhomogeneity of the medium.
Different properties of a porous medium have an influence on the permeability of themedium. Based on fluid flow simulations (using the lattice Boltzmann method) Nabovatiet al. (2009) concluded that for straight cylindrical fibres of finite length the permeabilityincreases with increasing aspect ratio (length to diameter ratio) when this ratio is lessthan about 6. (At a certain porosity the fibre diameter was kept constant and the fibrelength changed.) This effect is negligible for values of the aspect ratio larger then 6. It wasalso found that fibre curvature has a negligible effect on the permeability of the medium(Nabovati et al. (2009)).
Pradhan et al. (2012) generated a series of virtual fibrous structures to determine theinfluence of three-dimensional fibre orientation on permeability and found that a fibrousstructure with higher preferential orientation of fibres along the flow direction displayhigher transverse (relative to the flow direction) permeability. The current investigationwill focus on the relationship between compression and permeability. The change inporosity due to compression and the consequent change in the diameters of the micro-flow channels, will explicitly be accounted for in the permeability prediction. Furthermore,
15
Stellenbosch University http://scholar.sun.ac.za
since it is reasonable to accept that compression causes changes in different properties(e.g. fibre orientation) of a porous medium, the effect of solid (re)distribution will also beinvestigated.
In many cases the relationship between permeability and porosity is qualitative and is notquantitative in any way. As in the case of pumice stone, clays and shales, it is possible tohave high porosity and little or no permeability. Permeability therefore depends implicitlyon the inter-connectedness of the pore spaces, and not just on the porosity itself, althoughpermeability is often expressed only as a function of porosity.
The SI unit for permeability is m2, but a more practical unit is the millidarcy (mD) with1 darcy ≈ 9.87×10⁻¹³ m2 or 0.987 µm2. In general, the magnitude of the permeability (k)of a porous medium depends on a direction. For instance in reservoir rocks the verticalpermeability is often much less than the horizontal permeability because of shale layersor other sedimentary structures.
According to Nabovati et al. (2009) it was proven analytically that the permeability ofa porous medium is in general (for anisotropic porous media) a symmetric second ordertensor which has six distinct components. (Since in general the pressure gradient as wellas the velocity are vectors and each component of the pressure gradient influences eachcomponent of the velocity, the permeability can be visualized as an operator turning thepressure gradient into velocity by linear modifications of components.) In the principalcoordinate space (since a symmetric second order tensor can always be diagonalized),Darcy’s law can be applied in three directions of which, for example, the one in thex-direction of a rectangular Cartesian coordinate system is given by
qx = −kxxµ
∂p
∂x. (2.21)
For isotropic materials the permeability can be represented as a single scalar value sincethe three principal diagonal elements are equal and non-zero and all off-diagonal compo-nents are zero (Akaydin et al. (2011)). Nabovati et al. (2009) report simulation resultsthat support the fact that it is valid to give a scalar value for permeability of randomporous media since the off-diagonal elements are significantly smaller than the diagonalelements which differ by about two orders of magnitude.
Ko lodziej et al. (1998) investigated an unidirectional fibre arrangement choosing one axis(z) of the coordinate system (x, y, z), parallel to the fibres’ axes. The permeability tensorthen have three non-zero entries on the principal diagonal with the other entries all equalto zero. For a homogeneous bundle of fibres the permeability is characterized by twoscalar quantities since it is usually assumed that the two components of the permeabilitytensor in the principal directions perpendicular to the fibres are equal. In their investi-gation regarding non-homogeneous (non-uniform fibre spacing) fibrous media, Ko lodziejet al. (1998) also assumed the permeabilities in the directions perpendicular to the uni-directional fibres to be equal.
When modelling, in this study, the effect of compression on the permeability of three-dimensional fibrous porous media, the porous medium is not assumed to be isotropic(before or after compression). For the modelling process the coordinate system will be
16
Stellenbosch University http://scholar.sun.ac.za
chosen in such a way that the pressure gradient and average streamwise velocity coincideswith a relevant principal direction (of the permeability tensor). The predicted permeabil-ity will in addition be expressed as a scalar.
Although permeability is regarded as dependent on the geometry of the porous medium,different permeabilities can become apparent when using different fluids, i.e. liquids versusgases. Difference in gas and water permeabilities for a specific porous medium can beanalyzed in view of the Klinkenberg effect which is due to slip flow of gas at pore wallswhich enhances gas flow when pore sizes are very small. Physically it means that thesignificant molecular collisions are with the pore wall rather than with other gas molecules.
According to Shou et al. (2011), for superfine fibres ranging from 50 nm to 5 µm, thecontinuum non-slip assumption is not strictly correct. After studying the effect of theKnudsen number on the dimensionless hydraulic permeability of fibrous porous media,Shou et al. (2011) concluded that the effect on the Darcy hydraulic permeability causedby the fibre radius is significantly larger than that of the accompanied slip influence. In thepresent study air is the fluid used in the two relevant experiments to measure permeabilityand the radius of the fibres in question are on average 2.7 µm and 10 µm, respectively.Nevertheless, for the modelling process to be employed in this study it will be assumedthat the conditions of no-slip at the surfaces of the fibres as well as the application ofthe continuum equations are reasonable. Viscous flow is assumed in this study and thecharacteristic length (hydraulic diameter) is more than two orders of magnitude that ofthe molecular mean-free-path of air at atmospheric pressure. The effect of slip-flow onpermeability will therefore not be incorporated in the present study.
It is important to note that in the mathematical description of the relationship between thesuperficial fluid velocity and the pressure gradient in a porous medium, inertial coefficientsalso play a role when flow in the Darcy regime is not assumed. Since this study will only beconcerned with flow in the Darcy regime, inertial coefficients such as the passability (whichrelates the pressure drop to the square of the superficial velocity for Reynolds numberssignificantly larger than unity (Woudberg (2012a))), will not be addressed. Adaptingthe model(s) developed in this study to incorporate the effect of developing flow may beconsidered as future work.
The bulk behaviour of permeability under compressive stress is different in different ap-plications e.g. biological tissues and rocks. Dynamic compression of the solid and fluidphases of a soft porous medium (e.g. soft snow) causes mutual interaction between thetwo phases which changes the flow resistance through the pores and therefore also thepermeability. It must therefore be kept in mind that techniques to measure permeabilityunder compression have often been developed with a specific application in mind (Akaydinet al. (2011)). For the purposes of this study a stationary porous medium after uni-axialcompression will be assumed. Thus, after each compression the porosity is measured orcalculated.
Experiments, simplifying assumptions, verification, reflection and adaptation are impor-tant aspects in a modelling procedure. A selection of information from the literature studywill highlight these and other aspects regarding the development of different models forfluid flow through fibrous porous media. Chapter 3 will be devoted to the different (andsimilar) ways in which modelling is done.
17
Stellenbosch University http://scholar.sun.ac.za
Chapter 3
Literature study
When developing a mathematical model, whether a financial, statistical, fluid flow or anyother model, the assumptions made as well as the modelling procedure itself should beinformed by what has been done by others regarding the chosen context.
This chapter is devoted to a concise (and subjective) summary of articles that were chosento represent the relevant information acquired during the literature study. This summarywill not reflect the effectiveness of different models but highlight the ‘ideas’ and ‘tools’used. Modelling processes in general are influenced by the perceptions (insights) of themodeller and therefore, when filtering information from the different sources, the ‘histor-ical development of ideas’ and the assumptions made, are the main focus.
Predicting the effect of compression on the permeability of a fibrous porous medium canbe done by employing models developed for uncompressed media. Given the porosityof a porous medium in a compressed state, a permeability prediction can be made. Formodels based on an assumption of isotropy the prediction will most probably be an over-estimation of the permeability e.g. the isotropic foam model referred to by Woudberg(2012a). Nevertheless, information regarding modelling processes not directly focussedon compression of fibrous porous media was (and is) considered just as important for theaim of the literature study as processes focused on the effect of compression. Experimentalwork and/or simulations, with accompanying assumptions and methods of processing andinterpretation of data, are also rich sources of information.
Since the literature study was also aimed at gathering (subtle) information regarding themodelling process itself with accompanying assumptions and reflections, the informationselected in the next sections are not limited to the assumptions made in the present study.
The first section will refer to general literature regarding fibrous porous media, the secondto literature regarding RRUCs and the last section will provide information regarding ex-periments of which the data was employed in the present study. A short general discussionregarding the information presented as well as its relevance to the present study will begiven after the different articles from the literature were discussed.
18
Stellenbosch University http://scholar.sun.ac.za
3.1 Studies from the literature
Information selected from relevant articles regarding the prediction of the permeabilityof fibrous porous media is presented. The choice was made to do this presentation usingthe minimum amount of equations and rather to describe the modelling processes inwords, since formulas do not always facilitate thinking about the principle behind it.The mathematics behind the modelling procedures will therefore be omitted. The mainaim is to highlight the different approaches and assumptions in the different permeabilityinvestigations.
Jackson & James (1986)
According to Jackson & James (1986), the permeability of a fibrous porous mediumdepends on the arrangement, concentration and size of the fibres. In this literature study,data and theories related to the dependency of the resistance of a fibrous medium on thestructure of the medium were filtered and comparisons were made. This was done on thebasis of the hydrodynamic permeability as defined by Darcy’s law. The permeability wasnon-dimensionalized by dividing it by the square of the fibre diameter or radius. Whennecessary, the permeability values were converted from parameters such as the fibre drag,the drag coefficient or the friction factor. The filtering of data was done according to thefollowing criteria: Reynolds numbers (based on fibre diameter and superficial velocity) lessthan 10, the Knudsen number (when applicable) less than 0.01 and known fibre diametersand solid volume fractions.
Based on the comparison of the chosen experimental data, it is concluded that the mostimportant factors of fibre arrangement, that have an effect on permeability, are fibrealignment and homogeneity of the porous medium. They found that when fibres arenormal to flow, the resistance could be double the resistance when fibres are aligned withthe flow. When all the fibres are normal to the flow, the alignment of fibres relative toone another (for instance parallel or not) also has an effect on the permeability. A moreuniform distribution of fibres in a medium leads to a lower permeability. Non-uniformitiesin the porous structure as well as channelling (due to an excessive pressure drop appliedto loose fibres) can cause a significant increase in permeability.
Comparison of the selected theoretical work (up until 1986), shows that the general ap-proach has been to idealize the porous medium as a matrix of rods and then to solveStokes’ equations for a particular problem. Three categories are apparent, namely flowparallel to an array of parallel rods, flow perpendicular to an array of parallel rods and flowthrough three-dimensional arrays of rods. The ‘unit cell’ approach (polygon with a rodat the center), where the rods are arranged in a periodic pattern e.g. square, triangular,hexagonal or rectangular arrays, reduces the problem to solving Stokes’ equations in theunit cell. A no-slip condition at the rod surface is employed and usually a zero velocitygradient at the edge of the cell. For flow through three-dimensional arrays, the problemof a rod oblique to the superficial velocity was solved by allowing the permeability to havedifferent values in the directions parallel and perpendicular to the flow. The permeabilityof the three-dimensional medium is then determined by averaging over the three principalrod directions. Power series techniques, Fourier series methods and other techniques wererespectively employed for solving Stokes’ equation in different models.
19
Stellenbosch University http://scholar.sun.ac.za
The conclusions of the literature study by Jackson & James (1986) are the following:(i) The scatter in the data for diverse fibrous materials is caused by inhomogeneity andby variations in fibre shape and arrangement. The data correlates reasonably well whenthe non-dimensional permeability and the solid volume fraction are used as parameters.(ii) The resistance of an array of fibres aligned to the flow can be predicted with someaccuracy (as shown by the agreement of the predictions of the analytical techniques).Such predictions have limited usefulness since actual media rarely consist of fibres alignedin the direction of flow. (iii) For arrays normal to the flow, the collective curve producedby the data represents the minimum permeability for uniform arrays of parallel circularfibres. Lower permeabilities can be produced through modelling only by non-parallelarrangements of fibres or by fibres which are highly non-circular. (iv) The prediction by athree-dimensional model can be satisfactory if it realistically combines the flow resistancesof rods parallel and perpendicular to the flow.
Skartsis et al. (1992)
Skartsis et al. (1992) reviewed theoretical and experimental studies focused on the flow ofNewtonian fluids through consolidated fibre beds within the context of the autoclave andother composite manufacturing processes, where the description of resin flow through afibre bed is critical.
It is evident from the review that Darcy’s law is the basic equation used for laminar flowthrough porous media which is fully saturated with a Newtonian fluid and that the Blake-Kozeny-Carman equation is applied for isotropic porous media with porosities between0.4 and 0.7. At higher and lower porosities the correction due to ‘increased path length’is not found to be sufficient and it is suggested that the additional pressure drops due tothe converging-diverging character of the flow channels should be included.
Despite objections against e.g. the constant diameter capillary assumption, it is statedthat when assuming slow Newtonian flow through porous media (as will be assumed inthe present study) the proportionality between flow rate and pressure drop is retainedwithin limited porosity ranges.
In general, non-uniformities in a random porous medium statistically eliminate one an-other. For aligned fibres, on the other hand, any non-uniformity will cause a biased flowwhich can not be accounted for only by tortuosity and therefore the Blake-Kozeny-Carmanequation can not be used as an explicit (general) relationship between permeability andporosity. According to Skartsis et al. (1992), a more accurate approach is to find analyti-cal and/or numerical solutions for each particular case by solving the complete equationsof motion for the porous medium in question and then compare the solution to Darcy’slaw to find a relationship between porosity and permeability.
When modelling random fibres, the proper representation of randomness is a criticalissue and one approach is to consider the resistance to flow as a weighted average of theresistance due to flow parallel and normal to cylinders. A key result for flow through actualfibre beds is (according to Skartsis et al. (1992)) that the resistance to transverse flowthrough aligned fibres was found to be twice that for axial flow in experiments conductedby Sullivan in the 1940’s.
20
Stellenbosch University http://scholar.sun.ac.za
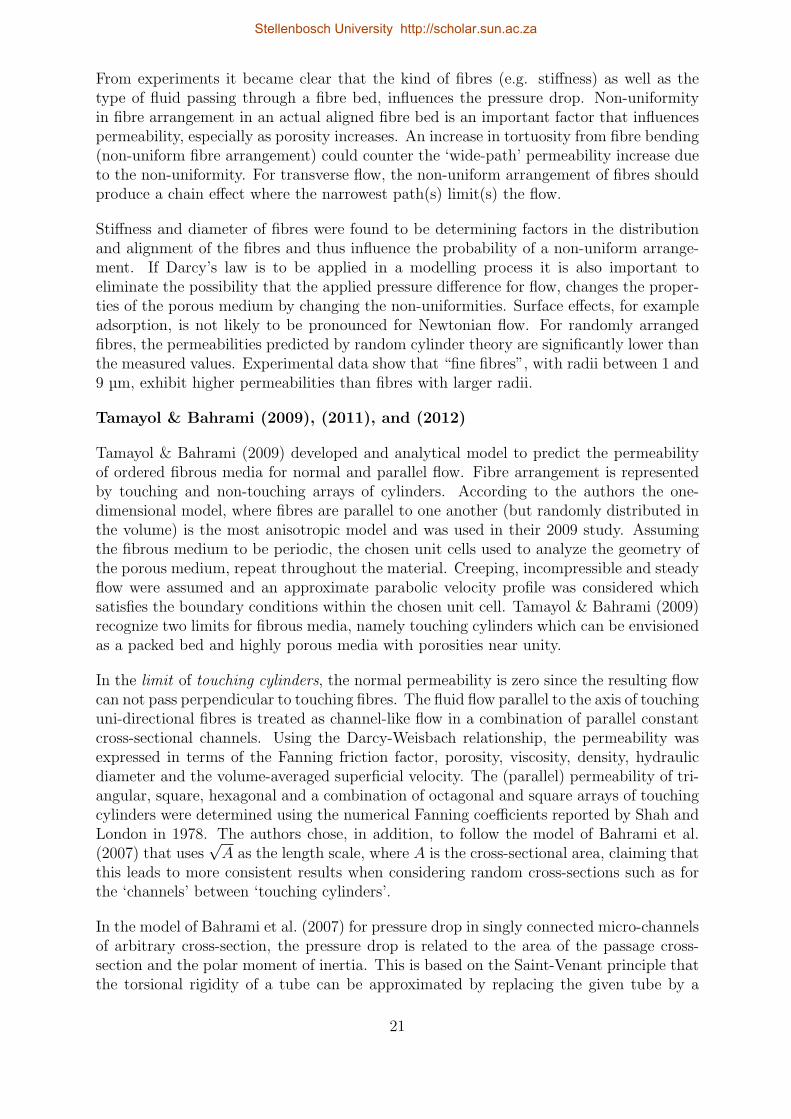
From experiments it became clear that the kind of fibres (e.g. stiffness) as well as thetype of fluid passing through a fibre bed, influences the pressure drop. Non-uniformityin fibre arrangement in an actual aligned fibre bed is an important factor that influencespermeability, especially as porosity increases. An increase in tortuosity from fibre bending(non-uniform fibre arrangement) could counter the ‘wide-path’ permeability increase dueto the non-uniformity. For transverse flow, the non-uniform arrangement of fibres shouldproduce a chain effect where the narrowest path(s) limit(s) the flow.
Stiffness and diameter of fibres were found to be determining factors in the distributionand alignment of the fibres and thus influence the probability of a non-uniform arrange-ment. If Darcy’s law is to be applied in a modelling process it is also important toeliminate the possibility that the applied pressure difference for flow, changes the proper-ties of the porous medium by changing the non-uniformities. Surface effects, for exampleadsorption, is not likely to be pronounced for Newtonian flow. For randomly arrangedfibres, the permeabilities predicted by random cylinder theory are significantly lower thanthe measured values. Experimental data show that “fine fibres”, with radii between 1 and9 µm, exhibit higher permeabilities than fibres with larger radii.
Tamayol & Bahrami (2009), (2011), and (2012)
Tamayol & Bahrami (2009) developed and analytical model to predict the permeabilityof ordered fibrous media for normal and parallel flow. Fibre arrangement is representedby touching and non-touching arrays of cylinders. According to the authors the one-dimensional model, where fibres are parallel to one another (but randomly distributed inthe volume) is the most anisotropic model and was used in their 2009 study. Assumingthe fibrous medium to be periodic, the chosen unit cells used to analyze the geometry ofthe porous medium, repeat throughout the material. Creeping, incompressible and steadyflow were assumed and an approximate parabolic velocity profile was considered whichsatisfies the boundary conditions within the chosen unit cell. Tamayol & Bahrami (2009)recognize two limits for fibrous media, namely touching cylinders which can be envisionedas a packed bed and highly porous media with porosities near unity.
In the limit of touching cylinders, the normal permeability is zero since the resulting flowcan not pass perpendicular to touching fibres. The fluid flow parallel to the axis of touchinguni-directional fibres is treated as channel-like flow in a combination of parallel constantcross-sectional channels. Using the Darcy-Weisbach relationship, the permeability wasexpressed in terms of the Fanning friction factor, porosity, viscosity, density, hydraulicdiameter and the volume-averaged superficial velocity. The (parallel) permeability of tri-angular, square, hexagonal and a combination of octagonal and square arrays of touchingcylinders were determined using the numerical Fanning coefficients reported by Shah andLondon in 1978. The authors chose, in addition, to follow the model of Bahrami et al.(2007) that uses
√A as the length scale, where A is the cross-sectional area, claiming that
this leads to more consistent results when considering random cross-sections such as forthe ‘channels’ between ‘touching cylinders’.
In the model of Bahrami et al. (2007) for pressure drop in singly connected micro-channelsof arbitrary cross-section, the pressure drop is related to the area of the passage cross-section and the polar moment of inertia. This is based on the Saint-Venant principle thatthe torsional rigidity of a tube can be approximated by replacing the given tube by a
21
Stellenbosch University http://scholar.sun.ac.za
tube with an elliptic cross-section which has the same cross-sectional area and the samepolar moment of inertia as the original shaft. According to Bahrami et al. (2007), thisprinciple can be used since torsion in beams and fully developed, laminar, single-phaseflow in ducts are similar in the sense that the governing equation for both problems isPoisson’s equation (i.e. −∇2 u = f).
Tamayol & Bahrami (2009) calculated the Fanning friction coefficient with√A as the
length scale and combined the model of Bahrami et al. (2007) with Darcy’s law to obtainan expression for the non-dimensional permeability of periodic touching fibrous media.
For fibrous media in the porosity limit near unity, the normal permeability of a squarearrangement of cylinders was calculated based on a square unit cell with the sides of thesquare connecting the midpoints of four (circular) cylindrical fibres. (The same approachcan be followed for the rectangular unit cell.) The porosity is expressed as the ratio ofthe difference between the area of the square and the cross-sectional area of a fibre (4quarters), and the area of the square.
Figure 3.1: Unit cell used by Tamayol & Bahrami (2009). [Source: Tamayol & Bahrami(2009)]
Applying Darcy’s law, the permeability is related to the total pressure drop throughthe unit cell as depicted in Figure 3.1. Creeping flow, negligible inertial terms, no-slipcondition on the surface of the cylindrical fibres and a zero velocity at the unit cell borderline were assumed. A parabolic velocity profile in terms of the ‘half thickness’ of theunit cell in the y-direction was assumed and dP/dx was obtained via the x-momentumequation. An expression for the total pressure drop over the chosen unit cell was obtainedby substituting this velocity-expression into the continuity equation and integrating.
Rewriting Darcy’s relation for just one unit cell and substituting the calculated cell pres-sure drop, the normal permeability is only a function of the geometrical parameters ofthe porous medium. This is based on the assumption that the ‘borderline’ velocity iszero everywhere along the boundaries of the unit cell that are parallel to the flow. In
22
Stellenbosch University http://scholar.sun.ac.za
general, this is not the case: It is zero on the edge of the cylinders (no-slip condition) andreaches its maximum value at half the side length (in the direction of flow) of the unitcell. Tamayol & Bahrami (2009) incorporated this in their model by assuming that themaximum border velocity is related to porosity through a linear function of porosity g(ϵ)with g(0.215) = 0 and g(1) = 1. This leads to an expression for the normal permeabilityof the square arrangement that accounts for the border velocity.
For fibrous media in the porosity limit near unity, an expression for the parallel perme-ability of a square arrangement of cylinders was also obtained. The same approach wasfollowed with the same unit cell as described above, but with flow parallel to the lengthof the cylinders.
The authors also investigated the effect of the unit cell aspect ratio, Sx : Sy, (refer toFigure 3.1) on the non-dimensional permeability of normal flow through a rectangularfibre-arrangement. The porosity and fibre-diameter were kept constant while the aspectratio was varied. As the unit cell aspect ratio was increased, the normal permeabilitydecreased considerably for relatively low porosities while for highly porous materials thisvariation was relatively small. The change of parallel permeability due to the variation ofthe aspect ratio of the unit cell was not as significant as those for normal flow. This canbe explained by the fact that since porosity is kept constant, the permeability is related tothe cross-section of the pores (which is also constant) although the aspect ratio is changed.(The one-dimensional fibres parallel to the flow are assumed to produce capillaries witha slip velocity boundary condition.)
According to Tamayol & Bahrami (2009), only the average fibre diameter and the mediumporosity are needed to predict the permeability with this model and no tuning parametersare required.
The same authors (Tamayol & Bahrami (2011)) developed a theoretical approach regard-ing transverse permeability that is applicable to one-, two- and three-dimensional fibrousmatrices. A scale analysis technique was applied to different arrangements of unidirec-tionally aligned fibres, simple two-directional mats and cubic structures. As a result,compact relationships were presented for permeability as a function of porosity and fibrediameter.
In this approach, the scale or the range of variation of the parameters in question weresubstituted into the governing (continuity- and Stokes’) equations. (The pressure dropwas assumed to be due to only frictional effects.) The length scale over which rapidchanges in velocity occur was chosen as half of the minimum width between two adjacentcylinders.
The average velocity in the section of the unit cell with minimum frontal area was usedas the characteristic velocity scale. It is approximately equal to the superficial velocitydivided by the ratio of the minimum to total frontal areas in the unit cell. This did notreflect the effect of tortuosity (defined by the authors as the ratio of the average tortuouspath length a fluid particle should travel in a porous medium to cover the length of theporous sample). Using Archie’s law (equation (2.6)), with applicable values for the tuningparameter, tortuosity was incorporated under the assumption that for a constant pressuredrop, the resulting velocity scale is inversely related to the tortuosity.
23
Stellenbosch University http://scholar.sun.ac.za
As a result, the permeability was expressed in terms of scale factors and compact modelswere developed using the geometrical properties of the one-, two-, and three-dimensionalmicro-structures.
Tamayol et al. (2012) investigated the effects of mechanical compression on the singlephase through-plane permeability of carbon paper gas diffusion layers (GDLs). Thiswas done in the context of proton exchange membrane (PEM) fuel stacks where the cellcomponents are compressed together to prevent gas leakage from the system. In generalthe GDLs are porous media made of carbon fibres with diameters ranging from 7 to10 µm. These carbon papers or cloths have a complex micro-structure with a randomdistribution of fibres. In the experimental approach, the carbon papers were cut intocircular samples, compressed and the variation in thickness measured with a micrometer.The airflow rate through the samples were measured and the Reynolds number based onthe fibre diameter was lower than 0.1. Therefore, to analyze the experimental results,Darcy’s law was applied with the pressure drop across the thickness of the GDL. Toaccount for minor pressure losses at the exit and entrance sections of the sample holder,the pressure drop in the test section was measured once without any GDL samples. Thiswas subtracted from the measured values of the pressure drop.
Based on the models developed for uncompressed fibrous porous media, (as already dis-cussed), a relationship for the dimensionless through-plane permeability for GDLs wasobtained in terms of the solid volume fraction. Assuming that during the compressionprocess, the volume of the solid carbon fibre remains constant, the solid volume fractionof a compressed sample was expressed in terms of the original value for an uncompressedcarbon paper and the ratio of the uncompressed GDL thickness to the compressed thick-ness.
As will be discussed in detail in Section 4.1, the relationship between compression and thesolid volume fraction is essential in the prediction of the permeability of a porous mediumsubject to a compressive load.
Shou et al. (2011)
In this study the hydraulic permeability for viscous flow through high porosity (ϵ > 0.7)fibrous porous media was presented. Repetitive unit cells, based on Voronoi tessellations,were employed as well as the volume averaging method. The modelling procedure wasbased on a geometrical simplification of the fibrous media to arrays of cylinders in one-,two- and three-dimensional structures respectively, in the same sense as the categoriza-tion according to Tamayol & Bahrami (2009). Starting from the regular one-dimensionalstructure and a square unit cell, assuming slip flow (the normal component of veloc-ity vanishes at surfaces but not the tangential component) and neglecting the effect ofcompressibility and rarefaction (since the Mach number was low enough), a formula forthe dimensionless hydraulic permeability was obtained. This was done by employing theKnudsen number, the continuity- as well as Stokes equations, the stream function (andassuming zero vorticity for flow perpendicular to the fibres) as well as Darcy’s law. Forrandomly placed fibres of one-dimensional media, the Voronoi tessellation was appliedand a Voronoi cell used as the unit cell.
For the two- and three-dimensional cases, closure modelling of volume averaging was done
24
Stellenbosch University http://scholar.sun.ac.za
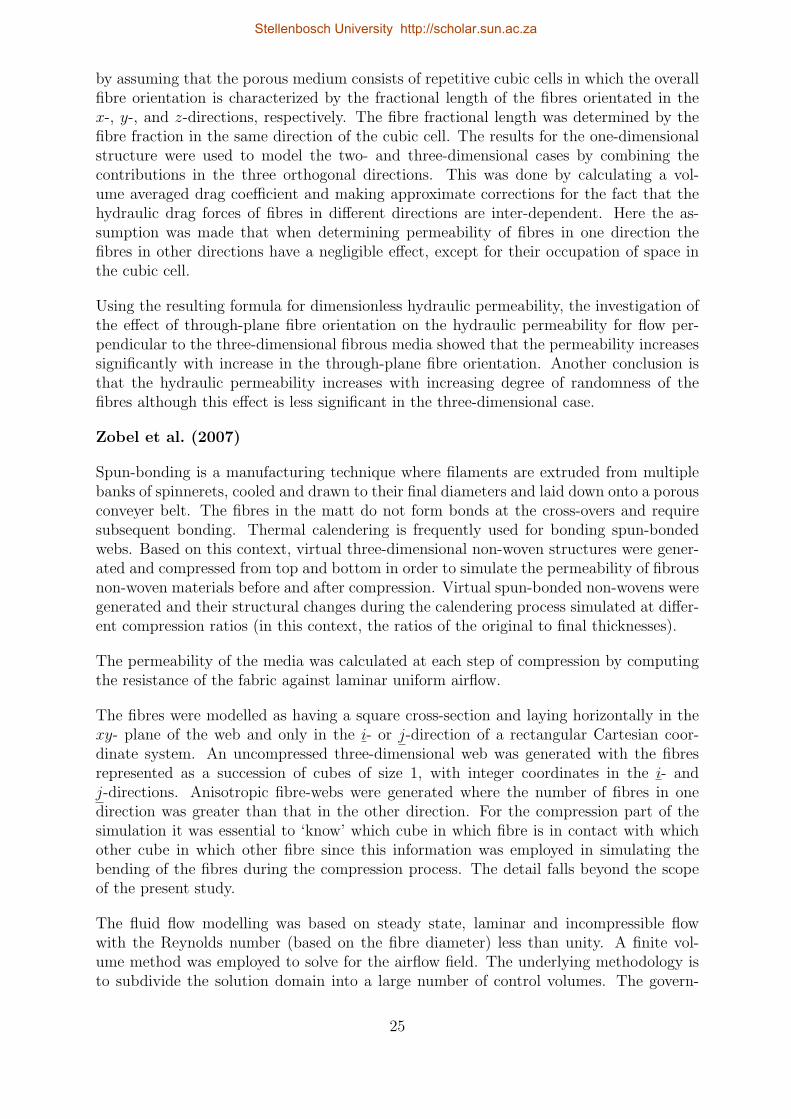
by assuming that the porous medium consists of repetitive cubic cells in which the overallfibre orientation is characterized by the fractional length of the fibres orientated in thex-, y-, and z-directions, respectively. The fibre fractional length was determined by thefibre fraction in the same direction of the cubic cell. The results for the one-dimensionalstructure were used to model the two- and three-dimensional cases by combining thecontributions in the three orthogonal directions. This was done by calculating a vol-ume averaged drag coefficient and making approximate corrections for the fact that thehydraulic drag forces of fibres in different directions are inter-dependent. Here the as-sumption was made that when determining permeability of fibres in one direction thefibres in other directions have a negligible effect, except for their occupation of space inthe cubic cell.
Using the resulting formula for dimensionless hydraulic permeability, the investigation ofthe effect of through-plane fibre orientation on the hydraulic permeability for flow per-pendicular to the three-dimensional fibrous media showed that the permeability increasessignificantly with increase in the through-plane fibre orientation. Another conclusion isthat the hydraulic permeability increases with increasing degree of randomness of thefibres although this effect is less significant in the three-dimensional case.
Zobel et al. (2007)
Spun-bonding is a manufacturing technique where filaments are extruded from multiplebanks of spinnerets, cooled and drawn to their final diameters and laid down onto a porousconveyer belt. The fibres in the matt do not form bonds at the cross-overs and requiresubsequent bonding. Thermal calendering is frequently used for bonding spun-bondedwebs. Based on this context, virtual three-dimensional non-woven structures were gener-ated and compressed from top and bottom in order to simulate the permeability of fibrousnon-woven materials before and after compression. Virtual spun-bonded non-wovens weregenerated and their structural changes during the calendering process simulated at differ-ent compression ratios (in this context, the ratios of the original to final thicknesses).
The permeability of the media was calculated at each step of compression by computingthe resistance of the fabric against laminar uniform airflow.
The fibres were modelled as having a square cross-section and laying horizontally in thexy- plane of the web and only in the i- or j-direction of a rectangular Cartesian coor-dinate system. An uncompressed three-dimensional web was generated with the fibresrepresented as a succession of cubes of size 1, with integer coordinates in the i- andj-directions. Anisotropic fibre-webs were generated where the number of fibres in onedirection was greater than that in the other direction. For the compression part of thesimulation it was essential to ‘know’ which cube in which fibre is in contact with whichother cube in which other fibre since this information was employed in simulating thebending of the fibres during the compression process. The detail falls beyond the scopeof the present study.
The fluid flow modelling was based on steady state, laminar and incompressible flowwith the Reynolds number (based on the fibre diameter) less than unity. A finite vol-ume method was employed to solve for the airflow field. The underlying methodology isto subdivide the solution domain into a large number of control volumes. The govern-
25
Stellenbosch University http://scholar.sun.ac.za
ing partial differential equations (in this case the continuity and conservation of linearmomentum) can, by integration over these control volumes, be converted into a set ofalgebraic equivalents which is then solved by iterative methods.
Details regarding the computational grid as well as the boundary conditions fall beyondthe scope of this study. Important to note is the assumption of a no-slip boundarycondition on the fibre surface since slip on the fibre surface was considered negligible.Therefore, at the standard temperature and pressure, the diameter of the fibres beingsimulated are assumed large enough (∼ 10 µm) so that a continuum approach is justified.
The permeability was calculated using Darcy’s law with the pressure drop across theporous medium’s thickness. The effects of fibre rigidity was also investigated throughsimulations and it was concluded that when fibres are rigid, the compression processpropagate deeper into the media resulting in a more uniform SVF across the thickness ofthe fabric.
3.1.1 Discussion
It is clear from the literature study that Darcy’s law is still central to most modellingprocesses in the lower Reynolds number flow regime. Cylindrical geometry is more oftenused than rectangular geometry to resemble the shape of the fibres and morphology ofthe porous medium. The assumption of no-slip at the fluid-solid interfaces is frequentlyemployed. Different forms of unit cells and arrays are used in the modelling procedures.The apparent friction factor and/or tortuosity were incorporated into the modelling pro-cedures by some authors. The solids were assumed to be impenetrable and the porousmedium fully saturated, the compression was uni-axial and the fibres itself were not com-pressed. Fully developed flow was assumed in some cases and developing flow in others.Laminar, steady state and incompressible flow (at low Reynolds numbers) are commonassumptions.
In the modelling procedure followed in the present study, the aim is to represent the flowresistance of fibres parallel and perpendicular to flow in a geometric model where the ratioof surface-areas parallel and perpendicular to the streamwise direction is derived from theporosity and the structure of the medium. A weighted average of the resistance to flowparallel and normal to the fibres will be implicitly incorporated through the geometry ofthe representative solid in the newly proposed model. The solid in the present study willnot reflect the fibre shape as such, but rather a minimal resultant distribution of solidsrepresented by a single solid. Also, a representative unit cell will be employed and due tothe fibrous porous media under consideration, the focus will be on high porosities. Thepresent study will also only take frictional effects into account.
In Chapter 4 detail regarding assumptions will be given which will highlight the similaritiesand differences with the modelling procedures referred to in this section.
It is clear that, given a certain physical concept (e.g. permeability), different geometries,mathematical concepts and assumptions can be (and are) employed in the modellingprocess there-of. Relevant concepts from previous models based on rectangular geometry
26
Stellenbosch University http://scholar.sun.ac.za
which serve as a cornerstone for the development of (a) model(s) for the prediction of theeffect of compression on the permeability of fibrous porous media will be discussed in thenext section.
3.2 Literature regarding RRUCs
Originally introduced by Du Plessis and Masliyah as the Representative Unit Cell forisotropic foam-like media, the RRUC (extra ‘R’ to emphasize the Rectangular geometry)is a geometric pore-scale model developed with focus on mathematical simplicity. Inorder to fulfil the basic requirements of the geometry of the actual porous structure thatit resembles, it respectively takes on different rectangular geometries for granular media,foamlike media and fibre beds (Woudberg (2012a)).
A short summary of earlier RRUC models, with an emphasis on the assumptions made,will be given in this section. The first models, that reflect the original trail of thought, areof special interest, although later refinements of these models will be incorporated whererelevant. (The comparative analysis of Woudberg (2012a) provides an extensive overviewof the existing RRUC models.)
Since the present study is only concerned with quantifying pressure loss in terms of shearstresses, the focus of the summary will be on how shear stresses were incorporated in themodels.
According to Du Plessis & Van der Westhuizen (1993), the RRUC is a schematic (rect-angular prism) representation of a hypothetical control volume containing a single solid,which captures the locally averaged essence of the micro-structural parameters in a phys-ically plausible manner. The REV contains several pores and solid parts over which anaverage is obtained. However, in the case of the RRUC the average geometry is obtainedbefore being embedded into the chosen geometric representation (Du Plessis (1991)).
The RRUC can not be regarded as a repetitive building block since it is practicallyimpossible to construct an isotropic array (Woudberg (2006)) since isotropy and eventransverse isotropy can not be justified in the unconsolidated RRUC models (Woudberg(2012a)). The emphasis in the ‘name’ RRUC should be on representative.
3.2.1 Foam RRUC model
Figure 3.2 is a visual representation of the original RRUC model proposed for flow througha rigid, isotropic and consolidated porous medium. Under the assumption of isotropy, themean pore cross-sectional area is the same in each of the three principal directions and thefluid enters and exits the RRUC in the streamwise direction. The three short mutuallyperpendicular square duct sections exhibit maximum possible inter-connectivity as wellas maximum possible staggering (Du Plessis & Masliyah (1988)).
In the modelling procedure followed by Du Plessis & Masliyah (1988), the tortuosity is
27
Stellenbosch University http://scholar.sun.ac.za
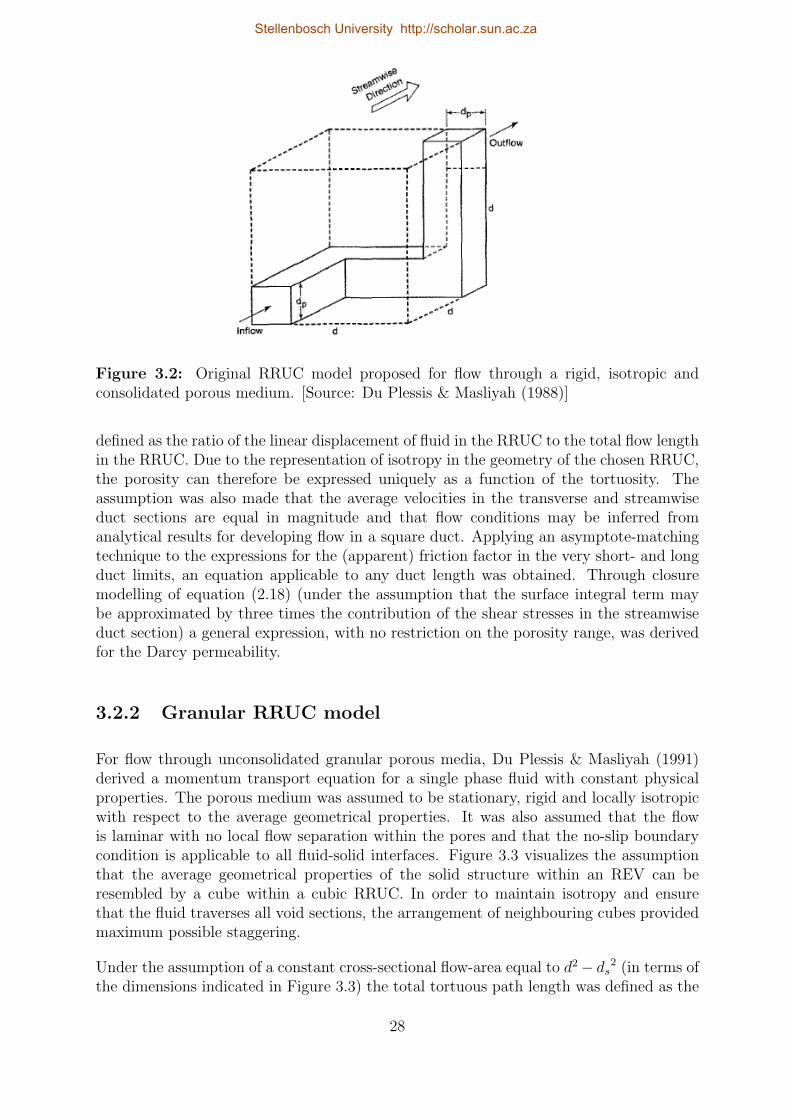
Figure 3.2: Original RRUC model proposed for flow through a rigid, isotropic andconsolidated porous medium. [Source: Du Plessis & Masliyah (1988)]
defined as the ratio of the linear displacement of fluid in the RRUC to the total flow lengthin the RRUC. Due to the representation of isotropy in the geometry of the chosen RRUC,the porosity can therefore be expressed uniquely as a function of the tortuosity. Theassumption was also made that the average velocities in the transverse and streamwiseduct sections are equal in magnitude and that flow conditions may be inferred fromanalytical results for developing flow in a square duct. Applying an asymptote-matchingtechnique to the expressions for the (apparent) friction factor in the very short- and longduct limits, an equation applicable to any duct length was obtained. Through closuremodelling of equation (2.18) (under the assumption that the surface integral term maybe approximated by three times the contribution of the shear stresses in the streamwiseduct section) a general expression, with no restriction on the porosity range, was derivedfor the Darcy permeability.
3.2.2 Granular RRUC model
For flow through unconsolidated granular porous media, Du Plessis & Masliyah (1991)derived a momentum transport equation for a single phase fluid with constant physicalproperties. The porous medium was assumed to be stationary, rigid and locally isotropicwith respect to the average geometrical properties. It was also assumed that the flowis laminar with no local flow separation within the pores and that the no-slip boundarycondition is applicable to all fluid-solid interfaces. Figure 3.3 visualizes the assumptionthat the average geometrical properties of the solid structure within an REV can beresembled by a cube within a cubic RRUC. In order to maintain isotropy and ensurethat the fluid traverses all void sections, the arrangement of neighbouring cubes providedmaximum possible staggering.
Under the assumption of a constant cross-sectional flow-area equal to d2 − ds2 (in terms of
the dimensions indicated in Figure 3.3) the total tortuous path length was defined as the
28
Stellenbosch University http://scholar.sun.ac.za
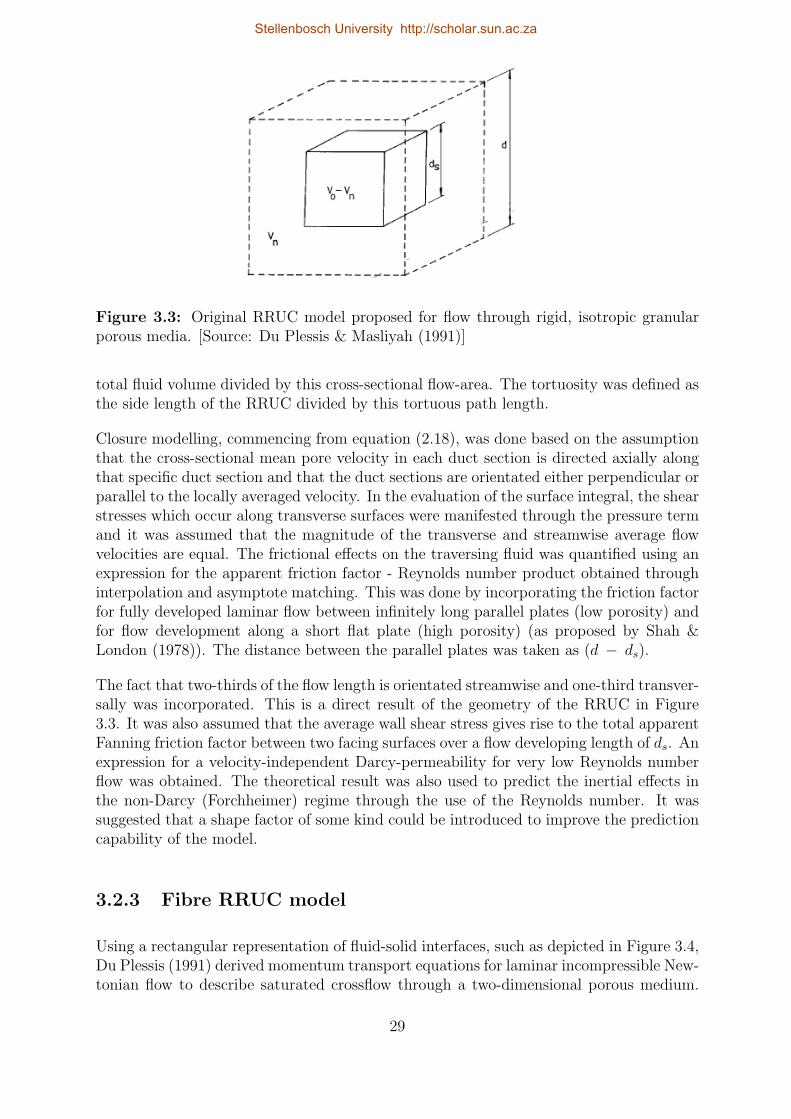
Figure 3.3: Original RRUC model proposed for flow through rigid, isotropic granularporous media. [Source: Du Plessis & Masliyah (1991)]
total fluid volume divided by this cross-sectional flow-area. The tortuosity was defined asthe side length of the RRUC divided by this tortuous path length.
Closure modelling, commencing from equation (2.18), was done based on the assumptionthat the cross-sectional mean pore velocity in each duct section is directed axially alongthat specific duct section and that the duct sections are orientated either perpendicular orparallel to the locally averaged velocity. In the evaluation of the surface integral, the shearstresses which occur along transverse surfaces were manifested through the pressure termand it was assumed that the magnitude of the transverse and streamwise average flowvelocities are equal. The frictional effects on the traversing fluid was quantified using anexpression for the apparent friction factor - Reynolds number product obtained throughinterpolation and asymptote matching. This was done by incorporating the friction factorfor fully developed laminar flow between infinitely long parallel plates (low porosity) andfor flow development along a short flat plate (high porosity) (as proposed by Shah &London (1978)). The distance between the parallel plates was taken as (d − ds).
The fact that two-thirds of the flow length is orientated streamwise and one-third transver-sally was incorporated. This is a direct result of the geometry of the RRUC in Figure3.3. It was also assumed that the average wall shear stress gives rise to the total apparentFanning friction factor between two facing surfaces over a flow developing length of ds. Anexpression for a velocity-independent Darcy-permeability for very low Reynolds numberflow was obtained. The theoretical result was also used to predict the inertial effects inthe non-Darcy (Forchheimer) regime through the use of the Reynolds number. It wassuggested that a shape factor of some kind could be introduced to improve the predictioncapability of the model.
3.2.3 Fibre RRUC model
Using a rectangular representation of fluid-solid interfaces, such as depicted in Figure 3.4,Du Plessis (1991) derived momentum transport equations for laminar incompressible New-tonian flow to describe saturated crossflow through a two-dimensional porous medium.
29
Stellenbosch University http://scholar.sun.ac.za
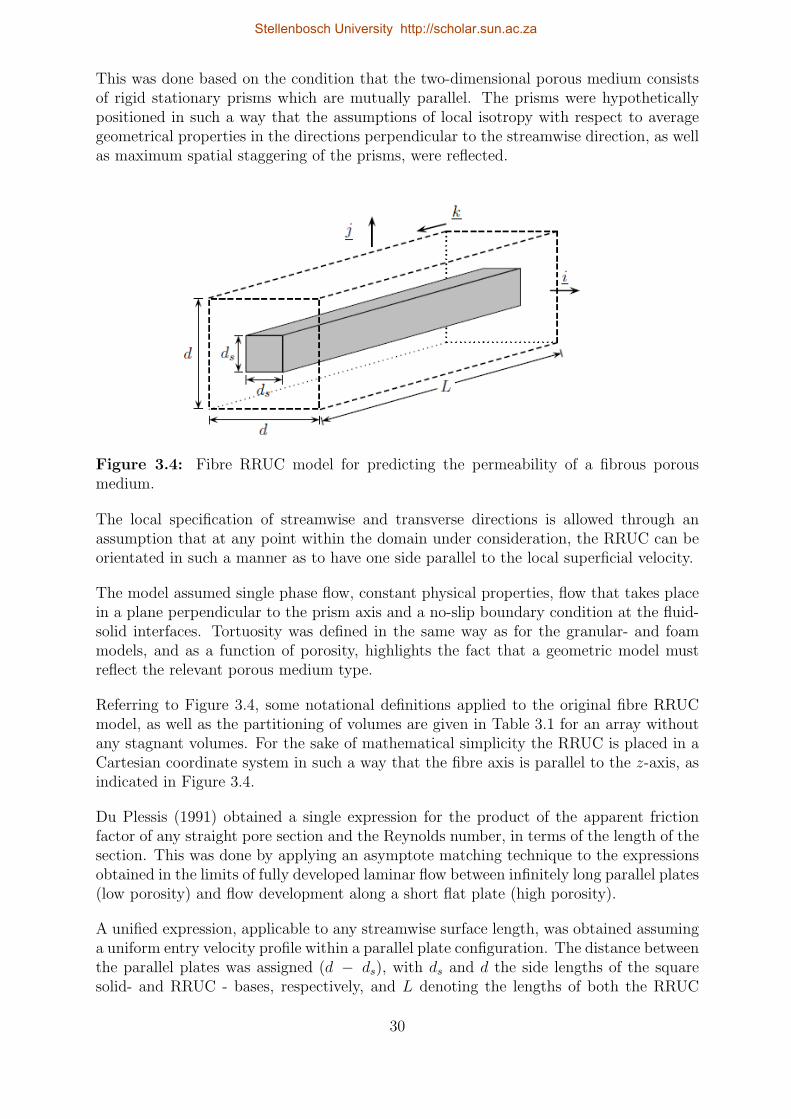
This was done based on the condition that the two-dimensional porous medium consistsof rigid stationary prisms which are mutually parallel. The prisms were hypotheticallypositioned in such a way that the assumptions of local isotropy with respect to averagegeometrical properties in the directions perpendicular to the streamwise direction, as wellas maximum spatial staggering of the prisms, were reflected.
Figure 3.4: Fibre RRUC model for predicting the permeability of a fibrous porousmedium.
The local specification of streamwise and transverse directions is allowed through anassumption that at any point within the domain under consideration, the RRUC can beorientated in such a manner as to have one side parallel to the local superficial velocity.
The model assumed single phase flow, constant physical properties, flow that takes placein a plane perpendicular to the prism axis and a no-slip boundary condition at the fluid-solid interfaces. Tortuosity was defined in the same way as for the granular- and foammodels, and as a function of porosity, highlights the fact that a geometric model mustreflect the relevant porous medium type.
Referring to Figure 3.4, some notational definitions applied to the original fibre RRUCmodel, as well as the partitioning of volumes are given in Table 3.1 for an array withoutany stagnant volumes. For the sake of mathematical simplicity the RRUC is placed in aCartesian coordinate system in such a way that the fibre axis is parallel to the z-axis, asindicated in Figure 3.4.
Du Plessis (1991) obtained a single expression for the product of the apparent frictionfactor of any straight pore section and the Reynolds number, in terms of the length of thesection. This was done by applying an asymptote matching technique to the expressionsobtained in the limits of fully developed laminar flow between infinitely long parallel plates(low porosity) and flow development along a short flat plate (high porosity).
A unified expression, applicable to any streamwise surface length, was obtained assuminga uniform entry velocity profile within a parallel plate configuration. The distance betweenthe parallel plates was assigned (d − ds), with ds and d the side lengths of the squaresolid- and RRUC - bases, respectively, and L denoting the lengths of both the RRUC
30
Stellenbosch University http://scholar.sun.ac.za
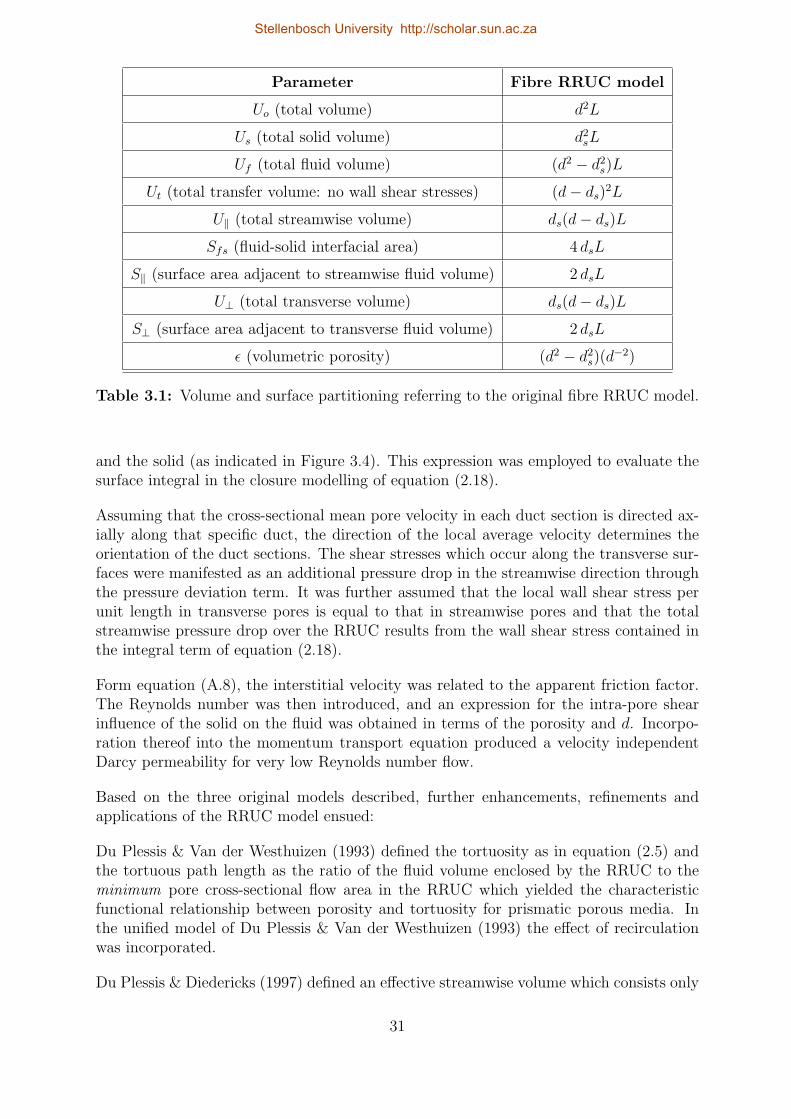
Parameter Fibre RRUC model
Uo (total volume) d2L
Us (total solid volume) d2sL
Uf (total fluid volume) (d2 − d2s)L
Ut (total transfer volume: no wall shear stresses) (d− ds)2L
U∥ (total streamwise volume) ds(d− ds)L
Sfs (fluid-solid interfacial area) 4 dsL
S∥ (surface area adjacent to streamwise fluid volume) 2 dsL
U⊥ (total transverse volume) ds(d− ds)L
S⊥ (surface area adjacent to transverse fluid volume) 2 dsL
ϵ (volumetric porosity) (d2 − d2s)(d−2)
Table 3.1: Volume and surface partitioning referring to the original fibre RRUC model.
and the solid (as indicated in Figure 3.4). This expression was employed to evaluate thesurface integral in the closure modelling of equation (2.18).
Assuming that the cross-sectional mean pore velocity in each duct section is directed ax-ially along that specific duct, the direction of the local average velocity determines theorientation of the duct sections. The shear stresses which occur along the transverse sur-faces were manifested as an additional pressure drop in the streamwise direction throughthe pressure deviation term. It was further assumed that the local wall shear stress perunit length in transverse pores is equal to that in streamwise pores and that the totalstreamwise pressure drop over the RRUC results from the wall shear stress contained inthe integral term of equation (2.18).
Form equation (A.8), the interstitial velocity was related to the apparent friction factor.The Reynolds number was then introduced, and an expression for the intra-pore shearinfluence of the solid on the fluid was obtained in terms of the porosity and d. Incorpo-ration thereof into the momentum transport equation produced a velocity independentDarcy permeability for very low Reynolds number flow.
Based on the three original models described, further enhancements, refinements andapplications of the RRUC model ensued:
Du Plessis & Van der Westhuizen (1993) defined the tortuosity as in equation (2.5) andthe tortuous path length as the ratio of the fluid volume enclosed by the RRUC to theminimum pore cross-sectional flow area in the RRUC which yielded the characteristicfunctional relationship between porosity and tortuosity for prismatic porous media. Inthe unified model of Du Plessis & Van der Westhuizen (1993) the effect of recirculationwas incorporated.
Du Plessis & Diedericks (1997) defined an effective streamwise volume which consists only
31
Stellenbosch University http://scholar.sun.ac.za
of that portion of the volume of a REV which contributes to the streamwise displacementof the particles of an extensive quantity. It was done as follows: An average pore velocitywas introduced in the REV having the same direction as the interstitial velocity at eachpoint, with restriction that it results in the same superficial velocity. From the methodof volume averaging and projection of the average pore velocity onto the streamwisedirection, an effective streamwise volume (U∥) within the REV was obtained and defined.The average flux in a streamwise channel was consequently regarded as the volume integralof the actual microscopic flux weighted over the effective streamwise volume. The ratiobetween the average streamwise pore velocity and the superficial velocity could then beexpressed in terms of the ratio between the total fluid volume and the effective streamwisevolume. After embedding the averages of the REV into the RRUC, the average streamwisepore velocity in the effective streamwise volume is represented by w∥.
Lloyd (2003) presented a result for the pressure integral evaluated over the total fluid solidinterfaces of staggered and non-staggered arrays of squares that includes, what becameknown as, the Lloyd correction. In principle it states that
1
U0
∫∫Sfs
n p dS =
(U∥ + Ut
Uf
− 1
)∇⟨p⟩ . (3.1)
Under the assumption that all the properties of the REV may be embedded into theRRUC, equation (2.20) has been expressed in general RRUC notation (i.e. no calligraphicfont) as:
−∇⟨p⟩f =1
Uf
∫∫Sfs
(n p − n · τ
)dS. (3.2)
In the closure modelling of volume averaged equations for flow through two-dimensionalarrays of squares, Lloyd et al. (2004) obtained
−∇⟨p⟩ =1
U0
∫∫S||
(− n · τ
)dS +
1
U0
∫∫S⊥
(n p) dS
+1
U0
∫∫S||
(n p) dS +1
U0
∫∫S⊥
(− n · τ
)dS, (3.3)
under the conditions of a stationary and uniform porous structure, uniform porosity anduniform averaged flow. The last two terms on the righthand side of the equality sign, whichcontribute to the transverse direction, were assumed to be zero since the macroscopic pres-sure gradient is in the streamwise direction. In evaluating the remaining surface integrals,a weighted average, of the contribution of all possible squares associated with differentstreamwise displacements for unconsolidated porous structures, was incorporated.
For each transverse channel section (in the Darcy regime) it was assumed that the inter-stitial pressure on the fluid-solid interface can be decomposed into an average channel wallpressure and a wall pressure deviation from this channel average (Lloyd et al. (2004)).It was further assumed that the pressure deviations are caused by shear stresses at the
32
Stellenbosch University http://scholar.sun.ac.za
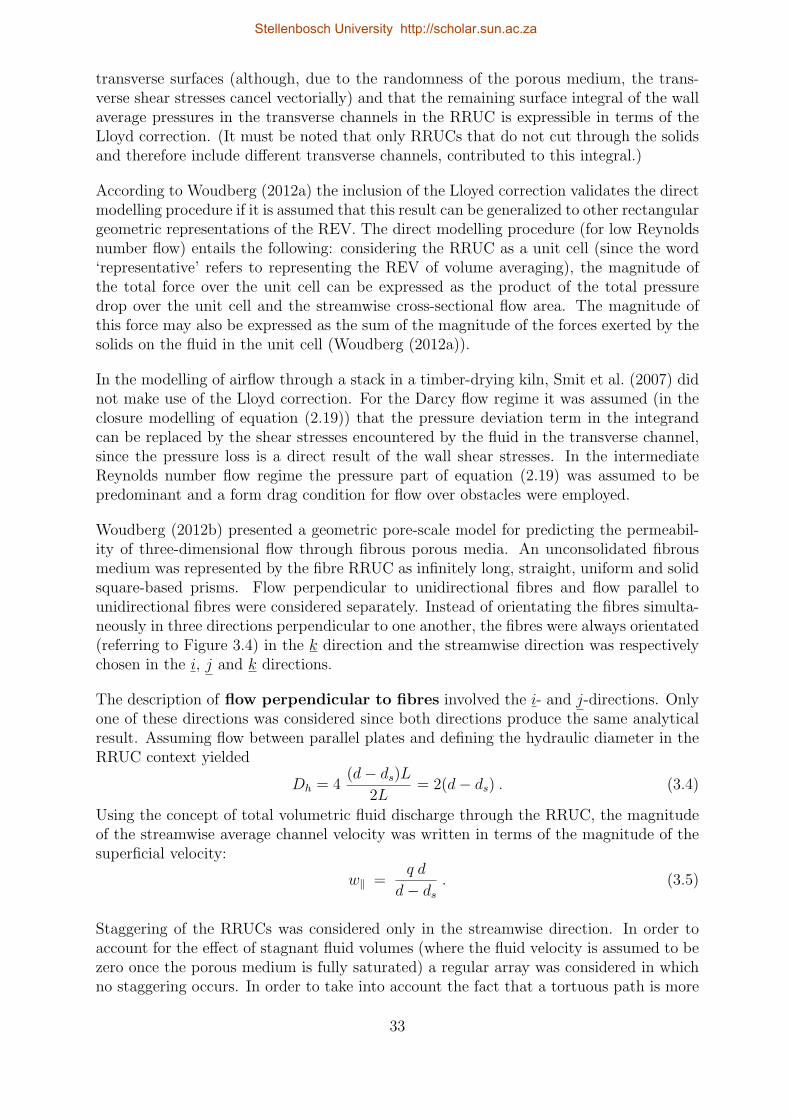
transverse surfaces (although, due to the randomness of the porous medium, the trans-verse shear stresses cancel vectorially) and that the remaining surface integral of the wallaverage pressures in the transverse channels in the RRUC is expressible in terms of theLloyd correction. (It must be noted that only RRUCs that do not cut through the solidsand therefore include different transverse channels, contributed to this integral.)
According to Woudberg (2012a) the inclusion of the Lloyed correction validates the directmodelling procedure if it is assumed that this result can be generalized to other rectangulargeometric representations of the REV. The direct modelling procedure (for low Reynoldsnumber flow) entails the following: considering the RRUC as a unit cell (since the word‘representative’ refers to representing the REV of volume averaging), the magnitude ofthe total force over the unit cell can be expressed as the product of the total pressuredrop over the unit cell and the streamwise cross-sectional flow area. The magnitude ofthis force may also be expressed as the sum of the magnitude of the forces exerted by thesolids on the fluid in the unit cell (Woudberg (2012a)).
In the modelling of airflow through a stack in a timber-drying kiln, Smit et al. (2007) didnot make use of the Lloyd correction. For the Darcy flow regime it was assumed (in theclosure modelling of equation (2.19)) that the pressure deviation term in the integrandcan be replaced by the shear stresses encountered by the fluid in the transverse channel,since the pressure loss is a direct result of the wall shear stresses. In the intermediateReynolds number flow regime the pressure part of equation (2.19) was assumed to bepredominant and a form drag condition for flow over obstacles were employed.
Woudberg (2012b) presented a geometric pore-scale model for predicting the permeabil-ity of three-dimensional flow through fibrous porous media. An unconsolidated fibrousmedium was represented by the fibre RRUC as infinitely long, straight, uniform and solidsquare-based prisms. Flow perpendicular to unidirectional fibres and flow parallel tounidirectional fibres were considered separately. Instead of orientating the fibres simulta-neously in three directions perpendicular to one another, the fibres were always orientated(referring to Figure 3.4) in the k direction and the streamwise direction was respectivelychosen in the i, j and k directions.
The description of flow perpendicular to fibres involved the i- and j-directions. Onlyone of these directions was considered since both directions produce the same analyticalresult. Assuming flow between parallel plates and defining the hydraulic diameter in theRRUC context yielded
Dh = 4(d− ds)L
2L= 2(d− ds) . (3.4)
Using the concept of total volumetric fluid discharge through the RRUC, the magnitudeof the streamwise average channel velocity was written in terms of the magnitude of thesuperficial velocity:
w∥ =q d
d− ds. (3.5)
Staggering of the RRUCs was considered only in the streamwise direction. In order toaccount for the effect of stagnant fluid volumes (where the fluid velocity is assumed to bezero once the porous medium is fully saturated) a regular array was considered in whichno staggering occurs. In order to take into account the fact that a tortuous path is more
33
Stellenbosch University http://scholar.sun.ac.za
probable than a straight one, a fully staggered array was considered. A geometric factorwas, in addition, introduced to account for the tortuous flow path.
For flow parallel to fibres a high porosity model, with the solid as indicated in Figure3.4, as well as a low porosity model, were considered. In the low porosity model the fluid(void) volume was represented by a duct with the same dimensions as that of the solidvolume in the high porosity model. For the high porosity model flow between parallelplates was once again assumed with a corresponding hydraulic diameter and magnitudeof the streamwise average channel velocity in terms of the superficial velocity. For thelow porosity model flow in a rectangular duct was assumed.
Assuming fully developed flow in the Darcy regime, the pressure drop was expressed interms of the shear stresses for each of the above cases and the corresponding permeabilitiesexpressed in terms of the solid volume fraction and ds. A unified parallel flow model wasobtained by application of a power addition technique to the permeabilities obtained forthe high- and low porosity parallel flow models. A three-dimensional model was obtainedby performing a weighted average over the models for flow parallel and perpendicularto the fibres. Assuming that two thirds of the flow in a fibrous porous medium has adirection perpendicular to the fibres and a third is directed parallel to the fibres, a weightof one third was given to the model prediction for (unified) parallel flow and a weight oftwo thirds to that for transverse flow. The effect of developing flow and pore blockagewere, in addition, incorporated into the model.
Woudberg (2012a) adapted a RRUC model that was originally developed for predictingthe permeability of metallic foams, and used it to predict the effect of compression onthe permeability of non-woven fibres. Figure 3.5 visualizes this anisotropic foam model ofwhich a detailed description can be found in Woudberg (2012a). Henceforth, this adaptedmodel (as depicted in Figure 3.5) will be referred to as the three-strut fibre RRUC model.
Uf
Uo
streamwise
streamwise
d⊥o
d||o
Us
d⊥o
ds
(a) Before compression
Uf
Uo
streamwise
streamwise
d⊥
d‖
Us
d⊥
ds
(b) After compression
Uf
Uo
streamwise
streamwise
d⊥o
d||o
Us
d⊥o
ds
(a) Before compression
Uf
Uo
streamwise
streamwise
d⊥
d‖
Us
d⊥
ds
(b) After compression
Figure 3.5: Three-strut fibre RRUC model (a) before and (b) after compression. [Source:Woudberg (2012a)]
34
Stellenbosch University http://scholar.sun.ac.za
Woudberg (2012a) used this model to predict the effect of compression on glass fibre non-wovens as well as soft fibrous porous media. The modelling steps applied for the abovementioned predictive model will form the basis of the modelling process in the presentstudy. Refinements to the model of Woudberg (2012a) will be suggested and the resultswill be compared to the results of this study.
The conceptualization of the RRUC in general includes the following:
• The RRUC is positioned with its volumetric centroid corresponding with that ofthe REV that it represents and it is restricted to rectangular geometry;
• The size of the RRUC is the minimum size into which the statistical average geom-etry of the corresponding REV can be imbedded;
• The orientation of the RRUC is always such that the normal vector of one of itsfaces is in the streamwise direction (as defined in the REV);
• It is assumed that the RRUC forms a streamtube associated with the RRUC’sdownstream face;
• The porosity of the porous medium is reflected within the RRUC;
• Arrays of RRUCs staggered in different ways are used to include effects of stagnantvolumes and tortuosity in the modelling.
• Neighbouring RRUC’s fit tightly, do not overlap and have no gaps between themand any flow section of a RRUC (or part there-of) is bordered by the solid materialof the adjacent RRUC;
• Directional priorities may be induced by choosing a particular arrangement of thesolid in a single RRUC and this is accounted for by considering the effect of com-plementary RRUC’s and using a relevant average;
• The solid material is rigid, smooth, impermeable and stationary;
• There is no staggering in the transverse directions: the solid surfaces parallel to thestreamwise direction are aligned in the transverse directions, and
• Piece-wise straight streamlines are applicable between and parallel to the solid sur-faces.
As is evident, an underlying assumption is that there is no channeling and that there areno external boundaries.
The following two articles to be discussed is of special importance since data from thesestudies will be employed to highlight the effect of changing variables on the predictioncapability of the new geometric model introduced in Chapter 4. The data from Le Coq(2008) will be referred to throughout Chapters 4 and 5 and the data from Akaydin et al.(2011) will be referred to in Chapter 6.
35
Stellenbosch University http://scholar.sun.ac.za
3.3 Experiments pertaining to the present study
3.3.1 Influence of structural parameters on permeability (LeCoq (2008))
The influence of the structural parameters of heterogeneous porous media on the per-meability was assessed by Le Coq (2008). For the micro-structural characterization offiltering fibrous media, the methods of mercury porosimetry and image analysis werecompared. A short reference to these methods will be sufficient for the purpose of dis-cussing possible discrepancies between the results obtained by Le Coq (2008) and thoseobtained through the analytical modelling process of this study.
Mercury porosimetry is, according to Giesche (2006), a very useful characterizationtechnique providing the pore size distribution, porosity, apparent and skeletal density aswell as the specific surface area of a porous medium sample. It must be kept in mindthat this technique determines the largest connection from the sample surface towards apore and not the actual inner size of a pore. Thus mercury porosimetry results will showsmaller pore sizes compared to those determined through Scanning Electron Microscopy(SEM).
All mercury porosimeters essentially work according to the assumption that the porousmedium can be characterized as a set of cylindrical, straight capillaries (through whichthe non-wetting liquid mercury must be forced). The modified Young-Laplace equation(referred to as the Washburn equation) relates the pressure difference across the curvedmercury interface to the corresponding pore size, using the surface tension of mercuryand the contact angle between the solid and mercury. (The cylinder pore assumption canlead to major differences between the analysis and reality.)
Giesche (2006) highlights different aspects to take into consideration in order to ensurethe correctness of readings for key measurement parameters, e.g.: the sample porousmedium must be well-defined and unambiguous; the creation of artificial pores due tothe packing of the sample should be minimized; pore size as well as pore volume canbe greatly influenced by the intrusion rate settings and the compressibility of the porousmedium.
When converting the pore volume data into the corresponding surface area (under theassumption of a reversible intrusion process) minor measurement errors, especially in thehigh pressure or small pore size range can affect the calculated surface area to a very largedegree. During mercury porosimetry measurements, hysteresis between the intrusion(increasing pressure) and extrusion (decreasing pressure) is observed in essentially allsamples (Giesche (2006)).
Image analysis requires preparation of a porous medium sample which usually involvesconsolidation of the medium with a resin that fills the pore space of the medium. Ac-quisition of images of media cross-sections is followed by image processing and imagemeasurement. Montillet & Le Coq (2003) present characteristic information that can bedetermined from image analysis as well as the procedure involved to obtain it. Le Coq
36
Stellenbosch University http://scholar.sun.ac.za
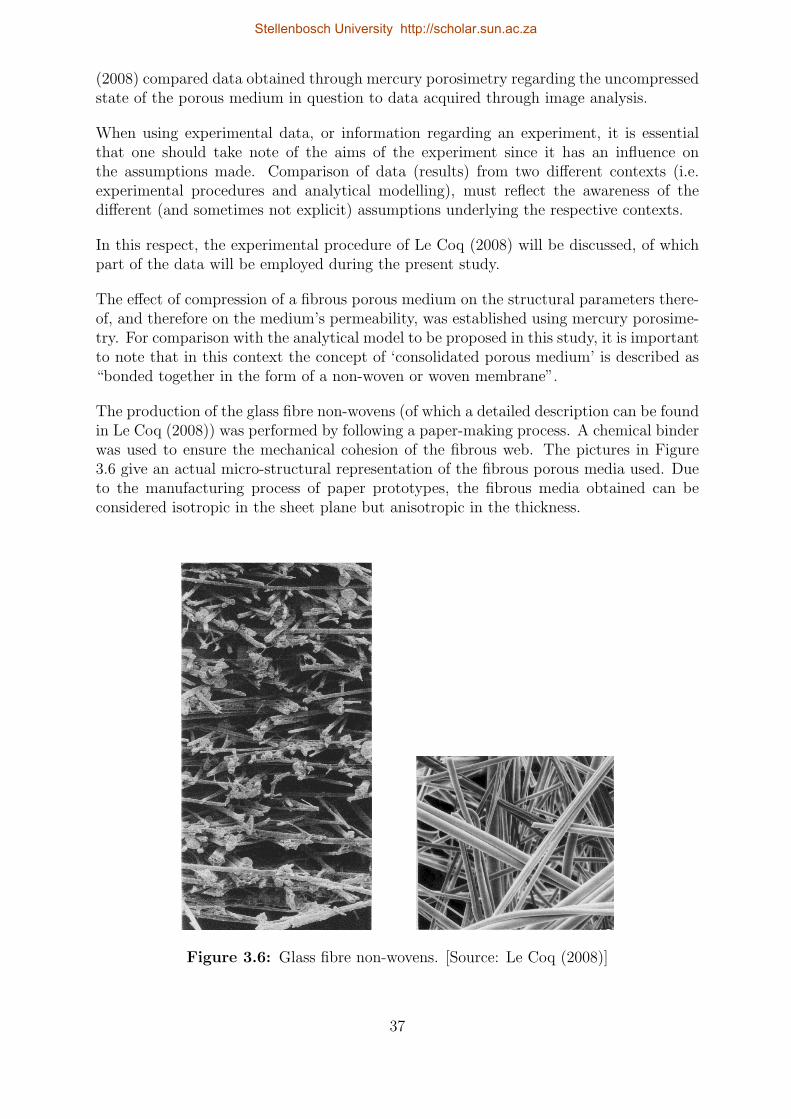
(2008) compared data obtained through mercury porosimetry regarding the uncompressedstate of the porous medium in question to data acquired through image analysis.
When using experimental data, or information regarding an experiment, it is essentialthat one should take note of the aims of the experiment since it has an influence onthe assumptions made. Comparison of data (results) from two different contexts (i.e.experimental procedures and analytical modelling), must reflect the awareness of thedifferent (and sometimes not explicit) assumptions underlying the respective contexts.
In this respect, the experimental procedure of Le Coq (2008) will be discussed, of whichpart of the data will be employed during the present study.
The effect of compression of a fibrous porous medium on the structural parameters there-of, and therefore on the medium’s permeability, was established using mercury porosime-try. For comparison with the analytical model to be proposed in this study, it is importantto note that in this context the concept of ‘consolidated porous medium’ is described as“bonded together in the form of a non-woven or woven membrane”.
The production of the glass fibre non-wovens (of which a detailed description can be foundin Le Coq (2008)) was performed by following a paper-making process. A chemical binderwas used to ensure the mechanical cohesion of the fibrous web. The pictures in Figure3.6 give an actual micro-structural representation of the fibrous porous media used. Dueto the manufacturing process of paper prototypes, the fibrous media obtained can beconsidered isotropic in the sheet plane but anisotropic in the thickness.
Figure 3.6: Glass fibre non-wovens. [Source: Le Coq (2008)]
37
Stellenbosch University http://scholar.sun.ac.za
In order to study the influence of fibre diameter and -length for media made of one or twogrades of fibres, eight different fibrous compositions of different lengths and diameterswere produced and their textural and mechanical parameters obtained. The apparentdensity of each fibrous medium was represented by the ratio of its specific weight to itsthickness. Although the latter ratio shows no significant variation with changes in fibrediameter, it showed an increase with decreasing fibre length.
Of interest for this study is the effect of compression on the permeability of a non-wovenfibrous porous medium consisting (only) of fibres with a mean diameter of 2.7 µm and amean length of 0.9 mm. Only information, which can be of value when comparing resultsregarding this porous medium (Le Coq (2008)) with the analytical results of the presentstudy, will be summarized.
The definition of the hydraulic diameter used to verify the experimental values reportedfor this parameter, i.e.
Dh =4ϵ
volume specific surface area=
4ϵ
(1 − ϵ)( fibre surfacefibre volume
), (3.6)
implies an unconsolidated fibrous porous medium since the whole surface area of eachfibre is used. The tortuosity was defined according to the mean flow path direction, i.e.according to medium thickness. The porosity, pore hydraulic diameter and tortuositywere determined by post-processing the mercury porosimetry results. This provided thestructural parameters of the overall medium at different levels of compression. (Stere-ological analysis of images obtained from media cross-sections provided local structuralparameters.) Three reproducibility experiments (mercury porosimetry measurements)were performed for each sample (including the one relevant for this study). The mercuryvolume penetrating the porous medium was measured at different pressures to obtaina porosity versus pore size curve based on the Washburn theory. The glass - mercurycontact angle of 153o and surface tension of 0.48 Nm−1 were used for data interpretation.
For the glass fibre prototypes, the experimental data of porosity versus pore size weremodelled, bearing in mind that there are two levels of pore size, namely surface roughnessand media internal pores. Details of the mathematics (e.g. iterative algorithm based ona Newton method used to solve a least squares problem) and theories (e.g. ‘equivalentpore’ theory) involved in determining the porosity, tortuosity and volume specific surfacearea fall beyond the scope of this study. It does, however, highlight the fact that behindthe percentage errors indicated, there are assumptions and calculations that indicate atrail of thought.
In estimating the permeability, the permeability coefficient was deduced in terms of poros-ity, tortuosity and volume specific surface area. The permeability was also determinedfrom the pressure drop measurements for airflow through the medium based on Darcy’slaw (referred to as permeametry). A summary of data which is utilized in the mod-elling processes in this study is given in Table 3.2. The data was deduced from mercuryporosimetry and permeametry measurements for a fibrous porous medium which wascompressed in the streamwise direction. Le Coq (2008) tabulated the relative variationin thickness and indicated it as positive numbers although the material is compressed.Traditionally, as in Case (1957), the strain (deformation), which is a purely geometricalconcept, is defined as the increase of length per unit length. This leads to a negative
38
Stellenbosch University http://scholar.sun.ac.za
number indicating that the material has been compressed. The experimental values forthe filter thickness relative to its uncompressed state, eexp, is calculated from the relativevariation in thickness given by Le Coq (2008). Incorporating the negative sign in, forexample, a relative variation of 15% e.g.,
h− h0h0
= −0.15, (3.7)
leads to eexp = 0.85. In equation (3.7) h is the height of the sample under compressionand h0 is the corresponding initial uncompressed height. It is important to clarify thatLe Coq (2008) indicates the thickness of the porous medium with the letter ‘e’, not to beconfused with the compression fraction to be introduced in Section 4.4.
Mercury porosimetry Permeametry
eexp ϵ Dh (µm) kexp (µm2) kexp (µm2)
1.00 0.94 28.0 8.20 10.0
0.85 0.92 17.0 2.00 2.1
0.75 0.89 16.5 1.40 -
0.55 0.86 16.0 0.17 -
Table 3.2: Selection of data from Le Coq (2008) regarding glass fibre non-wovens (averagediameter 2.7 µm; average length 0.9 mm).
In the modelling process, only the empirical data based on mercury porosimetry willbe used as input to determine the relationship between compression and porosity. Thedata based on permeametry will be compared with the results of the analytical model(s),without employing it as input variables.
3.3.2 Permeability of soft porous media (Akaydin et al. (2011))
Determining the permeability of a fibrous porous medium under variable longitudinalcompression was done with a novel (according to the author) experimental approach. Anew permeameter was fabricated and tested with this specific aim in mind. It consistsof an electrically driven piston which slides vertically with a controlled velocity inside along Plexiglas tube. The piston velocity was measured and assumed to be equal to thesuperficial (bulk) velocity.
The fibrous porous medium in this context was regular polyester pillow material composedof fibres with an average diameter of 10 µm and with low flexural rigidity. The compressionof the porous medium was done by sandwiching several circular cut-out layers betweentwo plastic holding grids and adjusting the distance between the two grids. Two samplesof material with initial uncompressed heights of 330 mm and 110 mm were tested todetermine whether the permeability of a medium after compression is a function of theinitial sample height of the medium.
39
Stellenbosch University http://scholar.sun.ac.za
The tests led to the assumption that the cylinder boundaries and holding grids did notcontribute to the pressure drop. The pressure measurements were facilitated by an arrayof 13 pressure ports placed within small intervals from one another. With four pres-sure transducers (connected to one of the pressure ports) the pressure within the porousmedium was measured at four different positions with which the pressure gradient withinthe medium was estimated.
The total volume of the uncompressed layers was obtained form the measured diame-ter and the height in the uncompressed state. The volume of the solid was measuredby immersing it into a solution of dishwashing liquid water. The material is classifiedas hydrophobic and therefore molecular diffusion of the solute into the solid structurewas assumed to be negligible. The initial volume was noted and the displaced volume(after immersion of the uncompressed layers and removal of bubbles) removed and itsvolume calculated from its density and weight. From the solid- and total volume val-ues corresponding to the uncompressed state, the porosity of the porous medium in theuncompressed state was calculated.
Akaydin et al. (2011) defined the compaction (or compression) ratio as
−∆h
h0=
−(h− h0)
h0, (3.8)
which is the negative of the strain that Case (1957) refers to in the context of materialsin general. As with the data regarding glass fibre non-wovens, the experimental valuesfor the filter thickness relative to its uncompressed state, eexp, were calculated from thecompression ratio given by Akaydin et al. (2011), which for a value of 0.85 leads to
−(h− h0)
h0= 0.85, (3.9)
yielding eexp = 0.15. The porosities associated with different levels of compression werecalculated from the relationship between the compression ratio and porosity, given theporosity in the uncompressed state. In Table 3.3 a selection of the data pertaining tothe soft porous medium sample with initial (uncompressed) sample height of 110 mm isprovided. The permeability is expressed in µm2.
The flow was assumed to be incompressible and the porous medium stationary, uniformand isotropic. Care was taken to have a uniform porosity sample and the measuredpressures through the sample did not show large deviations from linearity. Thereforethe porosity was assumed to be uniform, also due to the fact that the pressure gradientwas not strongly affected by changes in porosity due to compression. Darcy’s law wasemployed (assuming that the pressure gradient is always aligned with the flow direction)to determine the permeability with the measured pressure gradient since it was assumedthat inertial effects are negligible.
Experiments were performed to establish whether hysteresis of permeability was presentand whether the permeability was in any way dependent on the initial thickness of thesample. It was concluded that the effect of initial geometry of the porous sample on thepermeability (when compressed), is negligible. It was found that no hysteresis was presentin the pressure gradient between compression and decompression of the medium.
40
Stellenbosch University http://scholar.sun.ac.za
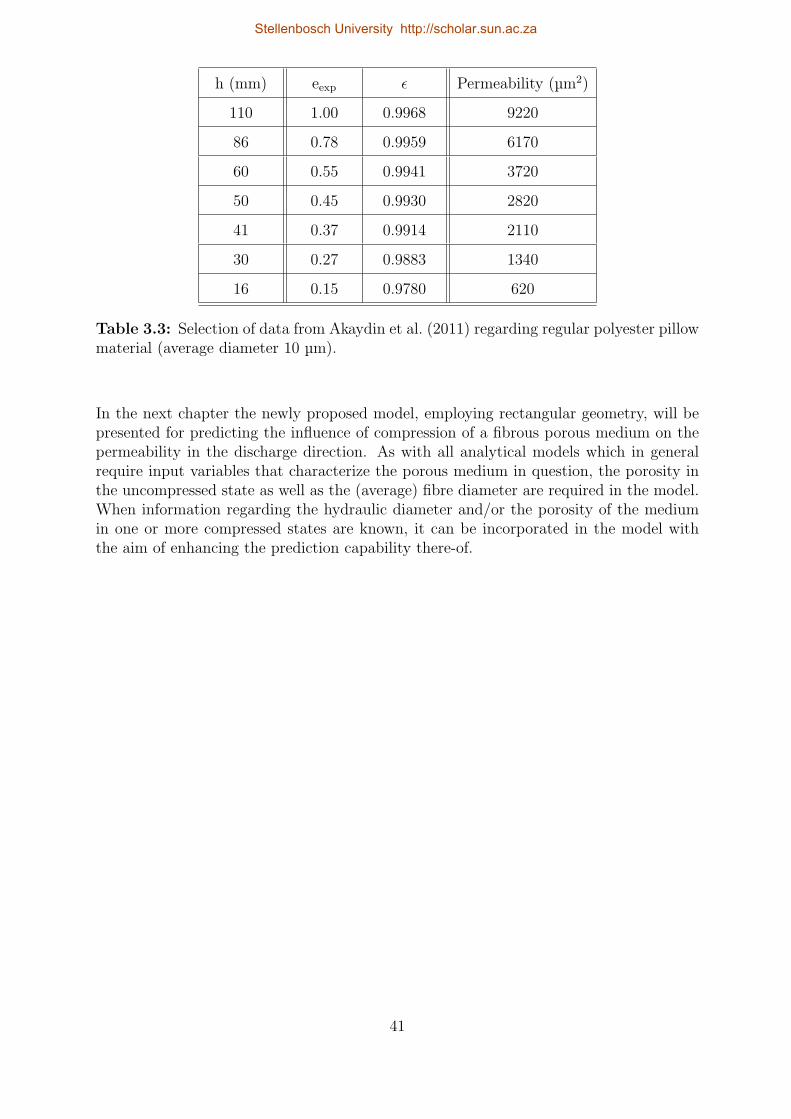
h (mm) eexp ϵ Permeability (µm2)
110 1.00 0.9968 9220
86 0.78 0.9959 6170
60 0.55 0.9941 3720
50 0.45 0.9930 2820
41 0.37 0.9914 2110
30 0.27 0.9883 1340
16 0.15 0.9780 620
Table 3.3: Selection of data from Akaydin et al. (2011) regarding regular polyester pillowmaterial (average diameter 10 µm).
In the next chapter the newly proposed model, employing rectangular geometry, will bepresented for predicting the influence of compression of a fibrous porous medium on thepermeability in the discharge direction. As with all analytical models which in generalrequire input variables that characterize the porous medium in question, the porosity inthe uncompressed state as well as the (average) fibre diameter are required in the model.When information regarding the hydraulic diameter and/or the porosity of the mediumin one or more compressed states are known, it can be incorporated in the model withthe aim of enhancing the prediction capability there-of.
41
Stellenbosch University http://scholar.sun.ac.za
Chapter 4
Two-strut fibre RRUC model
Given a certain fibrous porous medium with an empirically determined porosity in theuncompressed state, the aim is to predict the effect of one-dimensional compression (i.e.in the streamwise direction) on the porosity and consequently the permeability of thefibrous porous medium in question. For application purposes, it is therefore important tonote that the porosity of the material is altered in a very specific manner (via uniaxialcompression). Although the new fibre RRUC model presented in this chapter is based oncharacteristics of previous RRUC models, there are fundamental differences which will beemphasized throughout the chapter. This chapter will focus on the development of thenewly proposed RRUC model as well as on the comparison of the permeability predictioncapability with that of the three-strut fibre RRUC model.
Since the effect of perturbation of fibre micro-structure is particularly important in highporosity materials, the change in permeability due to a compressed state (relative to theoriginal structure), is of special interest for e.g. filters.
In this study the change in fibre micro-structure will be assumed to be only due to thecompression of the material itself (before fluid flow through the medium) and not becauseof the fluid flow through the medium in a (pre-determined) compressed state.
Three mathematical relationships, all describing the influence of compression on the poros-ity of a porous medium, will be obtained and used in the modelling steps referring to thenew geometric model. The model presented by Woudberg (2012a) is based only on alinear relationship between the level of compression (sample thickness relative to its un-compressed state) and porosity. The two other relationships will also respectively beemployed in the geometric model of Woudberg (2012a) and the results will be comparedto each other. This will highlight the effect that the choice of relationship has on thepermeability prediction of a specific geometric model. This comparison will also be donefor the new geometric model. Simultaneously, the effect of a specific choice of geometricmodel on the predictive capability there-of will be highlighted, by comparing results of thenewly proposed geometric model, for each compression-porosity relationship, with thoseof the geometric model proposed by Woudberg (2012a).
42
Stellenbosch University http://scholar.sun.ac.za
As already mentioned in Chapter 1, using the same empirical data in the different modelshighlights the effect(s) of changes in the model on the prediction capability of the model.This is done to improve the prediction capability of a model within a chosen (data) contextby making clear the causality between (for example) changes in geometry and predictionaccuracy. The data in Table 3.2 (Le Coq (2008)) will be used for this purpose.
In general, the deformation of a porous medium under compression may not be uniformand/or aligned with the compressive force. In the modelling process it is assumed thatincorporating an (on average) uniform compression will still render a prediction capabilityapplicable to porous media where the compression is not necessarily uniform.
The new geometric model is chosen with the specific aim of representing the pressurelosses in terms of the effect of shear stresses. During the development of the analyticalmodel through changes in parameters, conditions associated with the asymptotic limit oflow Reynolds number flow in the Darcy regime will be applied to predict the effect ofcompression on the permeability of the porous medium.
4.1 Relationship between porosity and compression
fraction
In this study the compression fraction (e) is defined as the ratio of the post-compressionfilter thickness to the uncompressed filter thickness. This definition highlights the fact thatthe post-compression filter thickness is a fraction of the uncompressed filter thickness.
In the experiments described by Dukhan (2006), an open-cell aluminum (or aluminium)foam is compressed in the flow direction to lower the porosity. Here the word strain isemployed to signify the ratio of the pre-compression to post-compression height of thefoam and is indicated by Dukhan (2006) as the compression factor in the table referringto the foam parameters. The porosity of the foam in the compressed state was calculatedwith the formula
h0h
=100 − ϵ
100 − ϵinitial, (4.1)
in which the porosity is expressed as a percentage. This clarifies the fact that equation(4.1) is the reciprocal of the relationship expressed in equation (4.6).
When using experimental data to establish a relationship between variables, linear re-gression (usually implying an assumption of normally distributed errors) is often applied.The reasons for this are that relationships between variables can often be described bya linear function if the domain (and range) are chosen appropriately, and because a lin-ear relationship between variables is the simplest non-trivial relationship to use. (In thepresent context, given certain data points, a linear function will not correctly representthe relationship between the compression fraction and porosity for the entire possibleporosity interval, i.e. (0, 1).)
43
Stellenbosch University http://scholar.sun.ac.za
Linear regression relationship
Modelling the relationship between the compression fraction (e) and the porosity (ϵ)with simple linear regression, (using the four data points (ϵ ; eexp) obtained throughmercury porosimetry in Table 3.2), results in the following equation with porosity as theexplanatory variable and the compression fraction as the response variable:
e = −4.03 + 5.34 ϵ . (4.2)
(If e is taken as the explanatory variable and ϵ as the response variable, a different equationwill be obtained which is not the re-arrangement of equation (4.2).)
The R2-value for the relationship expressed in equation (4.2) is 0.98. This means thatwithin a chosen porosity domain of [0.85; 0.95], equation (4.2) gives a reasonable predictionfor the deviation of the compression fraction from its mean, given the deviation of porosityfrom its mean.
However, taking into account information regarding the experiment with which the valuesof e and ϵ were obtained, as well as the physical properties that these mathematicalvariables represent, a different relationship between these variables is also valid.
General non-linear relationship
Assuming that the porous medium to be compressed is in a rigid container, i.e. theporous medium can not expand in the two ‘non-compressed’ directions, the theoreticalrelationship between the compression fraction and the porosity can be derived as follows:
Let the original total volume be denoted by V0 = A h0, with h0 the uncompressedheight of the porous medium. Let A denote the base-area of the porous medium (andcontainer) and let V = A h, with h the height of the medium after compression, denotethe subsequent total volume after compression.
The constant (in this context) solid volume (Vs) is given by the difference between theoriginal total volume and the original fluid volume (Vf 0) and can therefore be written as:
Vs = V0 − Vf 0 = V0 (1 − ϵ0) , (4.3)
with ϵ0 the porosity of the material in the uncompressed state. The fluid volume aftercompression is given by
Vf = A h − A h0 (1 − ϵ0) , (4.4)
which leads (after dividing by A h) to the following relationship between ϵ0, the compres-sion fraction (e = h/h0) and the subsequent porosity (ϵ):
ϵ = 1 − (1 − ϵ0)
e. (4.5)
Equation (4.5) will also be used in the following form:
e =(1 − ϵ0)
1 − ϵ, (4.6)
44
Stellenbosch University http://scholar.sun.ac.za
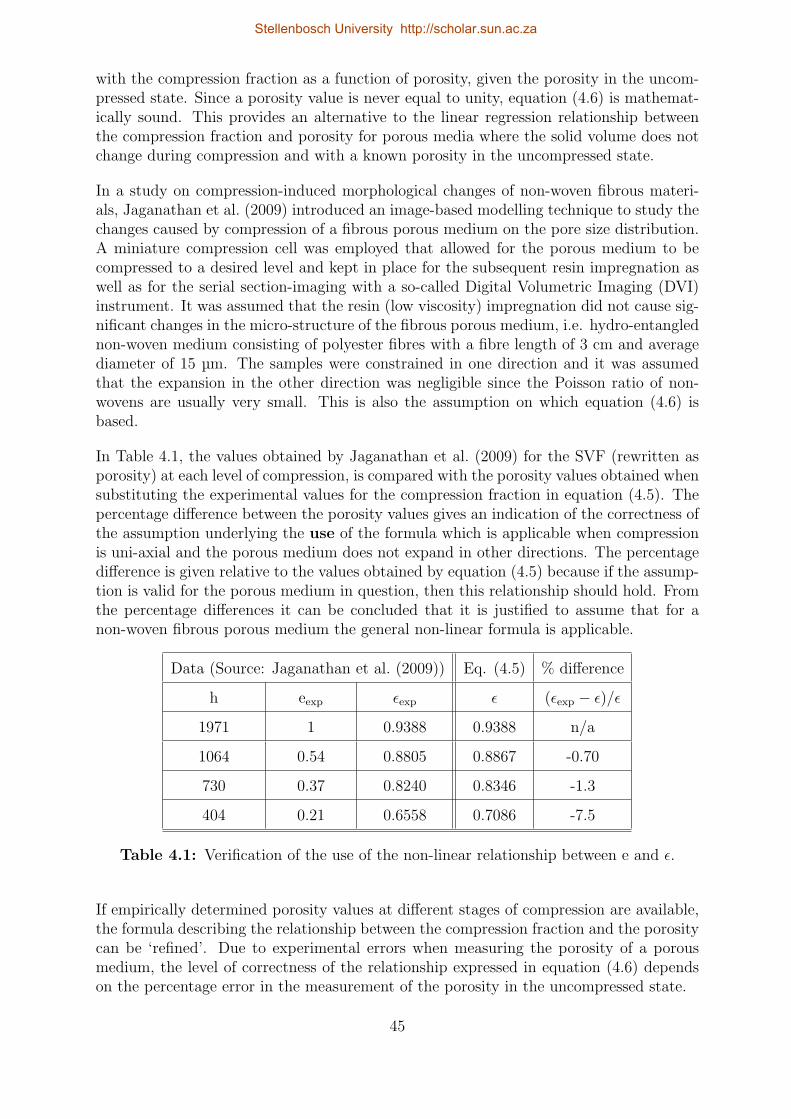
with the compression fraction as a function of porosity, given the porosity in the uncom-pressed state. Since a porosity value is never equal to unity, equation (4.6) is mathemat-ically sound. This provides an alternative to the linear regression relationship betweenthe compression fraction and porosity for porous media where the solid volume does notchange during compression and with a known porosity in the uncompressed state.
In a study on compression-induced morphological changes of non-woven fibrous materi-als, Jaganathan et al. (2009) introduced an image-based modelling technique to study thechanges caused by compression of a fibrous porous medium on the pore size distribution.A miniature compression cell was employed that allowed for the porous medium to becompressed to a desired level and kept in place for the subsequent resin impregnation aswell as for the serial section-imaging with a so-called Digital Volumetric Imaging (DVI)instrument. It was assumed that the resin (low viscosity) impregnation did not cause sig-nificant changes in the micro-structure of the fibrous porous medium, i.e. hydro-entanglednon-woven medium consisting of polyester fibres with a fibre length of 3 cm and averagediameter of 15 µm. The samples were constrained in one direction and it was assumedthat the expansion in the other direction was negligible since the Poisson ratio of non-wovens are usually very small. This is also the assumption on which equation (4.6) isbased.
In Table 4.1, the values obtained by Jaganathan et al. (2009) for the SVF (rewritten asporosity) at each level of compression, is compared with the porosity values obtained whensubstituting the experimental values for the compression fraction in equation (4.5). Thepercentage difference between the porosity values gives an indication of the correctness ofthe assumption underlying the use of the formula which is applicable when compressionis uni-axial and the porous medium does not expand in other directions. The percentagedifference is given relative to the values obtained by equation (4.5) because if the assump-tion is valid for the porous medium in question, then this relationship should hold. Fromthe percentage differences it can be concluded that it is justified to assume that for anon-woven fibrous porous medium the general non-linear formula is applicable.
Data (Source: Jaganathan et al. (2009)) Eq. (4.5) % difference
h eexp ϵexp ϵ (ϵexp − ϵ)/ϵ
1971 1 0.9388 0.9388 n/a
1064 0.54 0.8805 0.8867 -0.70
730 0.37 0.8240 0.8346 -1.3
404 0.21 0.6558 0.7086 -7.5
Table 4.1: Verification of the use of the non-linear relationship between e and ϵ.
If empirically determined porosity values at different stages of compression are available,the formula describing the relationship between the compression fraction and the porositycan be ‘refined’. Due to experimental errors when measuring the porosity of a porousmedium, the level of correctness of the relationship expressed in equation (4.6) dependson the percentage error in the measurement of the porosity in the uncompressed state.
45
Stellenbosch University http://scholar.sun.ac.za
Although different measurements of a certain property fall within an interval determinedby the percentage error, the individual measurements do not each include exactly the sameerror. Based on this fact that some data points were possibly measured with more accuracythan others, yet another relationship between the compression fraction and porosity canbe obtained for media for which measured data regarding porosity at different stages ofcompression is available.
Specific non-linear relationship
Assuming that the relationship takes on the form
e =C
1 − ϵ, (4.7)
the data from a specific experiment can be used to determine the value of C which isvalid for the porous medium in question. Substituting the data points (ϵ ; eexp) from theexperiment used in this study (Le Coq (2008)), into equation (4.7), the constant C can becalculated by taking the average of the different values for C obtained for each data point.This ‘averaged’ value is based on more than one measurement and therefore captures thepossible different errors within a percentage error range in a simple but representativeway. This leads to the relationship
e =0.07
1 − ϵ, (4.8)
which is valid for the porous medium considered with a porosity of 0.94 in the uncom-pressed state and with three additional empirically obtained data points with which therelationship was established: (0.92 ; 0.85), (0.89 ; 0.75) and (0.86 ; 0.55). For this rela-tionship the compression fraction will be larger than unity when the measured porosityfor the uncompressed state is substituted since the obtained average constant leads to aformula representing a porous medium with a smaller uncompressed porosity than themeasured value.
In Figure 4.1 a graphical comparison between the three relationships expressed in equa-tions (4.2), (4.6) and (4.8) are shown. Equation (4.2) will be referred to as the linearregression relationship; equation (4.6) as the general non-linear relationship and equation(4.8) as the specific non-linear relationship. The latter three relationships will respectivelybe used in the prediction of permeability employing the same geometrical model, empir-ical data and modelling steps. The results will be compared to those of the geometricmodel presented by Woudberg (2012a).
In Figure 4.1 a visual comparison of the three relationships and the actual data points arepresented. The linear regression relationship produces the ‘best fit’ for the data pointson a restricted domain. It does not, however, reflect the actual non-linear relationshipbetween the variables or the fact that the compression fraction can not be negative. Thegeneral non-linear relationship provides a more accurate reflection of the relationship overthe whole (porosity) domain and is theoretically correct assuming that the porosity in theuncompressed state was measured with 100% accuracy. It is clear from Figure 4.1 that(except for the porosity in the uncompressed state) the general non-linear relationship
46
Stellenbosch University http://scholar.sun.ac.za
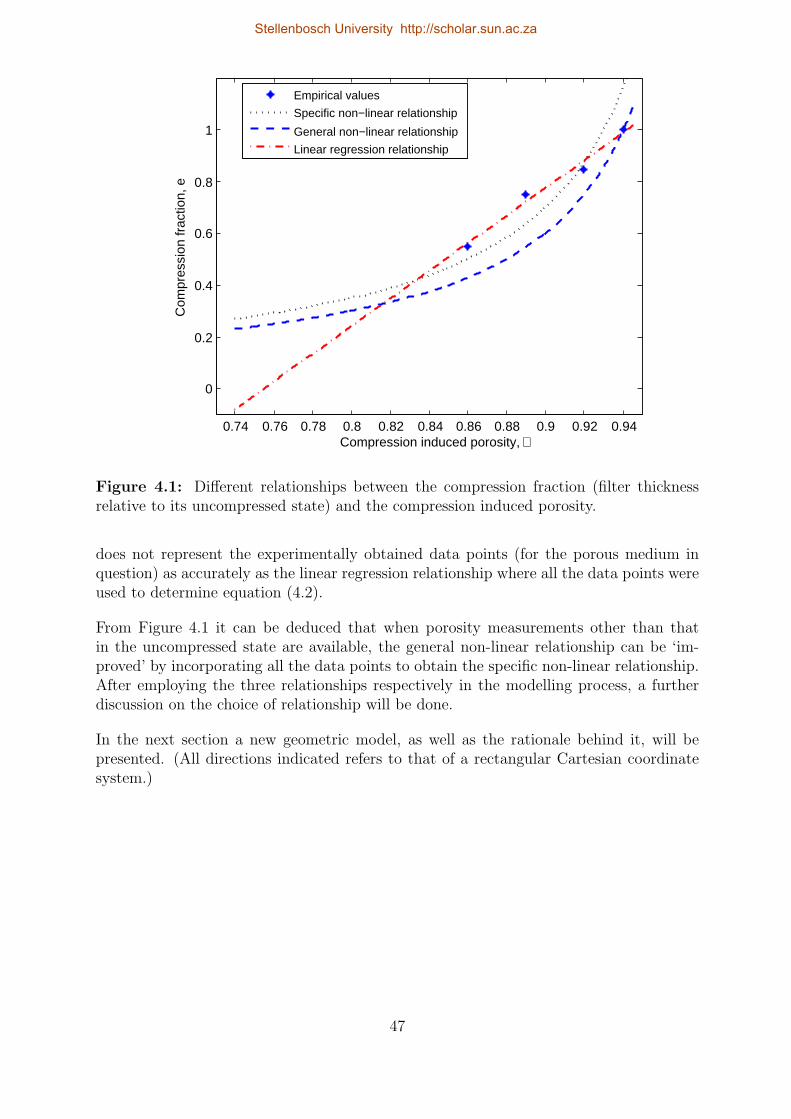
0.74 0.76 0.78 0.8 0.82 0.84 0.86 0.88 0.9 0.92 0.94
0
0.2
0.4
0.6
0.8
1
Compression induced porosity, ∈
Com
pres
sion
frac
tion,
e
Empirical values
Specific non−linear relationship
General non−linear relationship
Linear regression relationship
Figure 4.1: Different relationships between the compression fraction (filter thicknessrelative to its uncompressed state) and the compression induced porosity.
does not represent the experimentally obtained data points (for the porous medium inquestion) as accurately as the linear regression relationship where all the data points wereused to determine equation (4.2).
From Figure 4.1 it can be deduced that when porosity measurements other than thatin the uncompressed state are available, the general non-linear relationship can be ‘im-proved’ by incorporating all the data points to obtain the specific non-linear relationship.After employing the three relationships respectively in the modelling process, a furtherdiscussion on the choice of relationship will be done.
In the next section a new geometric model, as well as the rationale behind it, will bepresented. (All directions indicated refers to that of a rectangular Cartesian coordinatesystem.)
47
Stellenbosch University http://scholar.sun.ac.za
4.2 Geometric model
The word geometry originates from the Greek words geos (meaning earth) and metron(meaning measure). In line with this, the geometry of the proposed mathematical modelis chosen with the explicit aim of ‘measuring’ the permeability via the ‘measuring’ ofshear stresses. The choice of geometry must also be in line with the definition of a RRUC,which, according to Du Plessis (1991), is “a minimal volumetric body into which the locallyaveraged porosity, characteristic length scale and porous medium type can be embedded”.The shape of the solid, representing the morphology of the porous medium, reflects theidea that the solids (fibres) in filters are more aligned in the directions perpendicular tothe nett flow than parallel to the nett flow (as can be seen in Figure 3.6). This meansthat the minimal solid length in the RRUC, representing fibre-solids parallel to the flow,is assumed to be more closely related to the fibre diameter than to the fibre length.
The newly proposed model is visualized in Figure 4.2 and will be employed with thepurpose of modelling the effect of compression on the permeability of an unconsolidatedfibrous medium. Representing porosity geometrically, this choice of model reflects theeffect of compression as a narrowing of the spaces through which fluid has to flow. Thismodel will be referred to as the two-strut fibre RRUC model to distinguish it from thethree-strut fibre RRUC model (Figure 3.5) presented by Woudberg (2012a). The (Carte-sian) reference frame is chosen in such a way that the streamwise direction and the pressuregradient (Darcy regime) coincide, as indicated by the bold arrows in Figure 4.2.
When embedding the (vector) averages obtained from the REV into a RRUC, the specificchoice of geometry means that the directions of the (vector) averages can not be repre-sented in a single RRUC. This influence the way in which closure modelling is done forthe volume-averaged equations. Since the corresponding REV contains different solidswhile the RRUC contains only one (minimal) representative solid with corresponding di-rectional ‘preference’, care has to be taken when quantifying the vector equation (3.2).In previous RRUC closure modelling, the flow in the porous medium was representedwith piecewise straight (equal length) streamlines and it became clear that using a singleRRUC leads to induced directional priorities by the particular channels in the chosenRRUC. Conceptually this means, as suggested by Du Plessis & Diedericks (1997), thatit is necessary to use a set of complimentary RRUCs in the modelling procedure. Bytaking weighted averages over these complimentary RRUCs, account is taken of the effectof induced directional preference.
The new two-strut fibre RRUC model should be seen as a rectangular geometric min-imal representation of the averages obtained for the corresponding REV and not asa representation of the actual solids and (possible) streamlines of the fluid in the porousmedium itself. The geometric model is used to provide the scope of proportions which,through the reflection of porosity, length scale and medium type, in a rectangular prism,can be employed to determine relevant areas, velocities and shear stresses. This choice ofrepresentation also lends itself to (the aim of) predicting pressure losses only in terms ofshear stresses. It highlights the fact that uni-axial compression of a fibrous porous mediumhas a large impact on the void space available for flow perpendicular to the streamwisedirection which in turn affects the permeability. The fact that the channels in a (com-pressed) fibrous porous medium are not of equal cross-sectional area, is represented by the
48
Stellenbosch University http://scholar.sun.ac.za
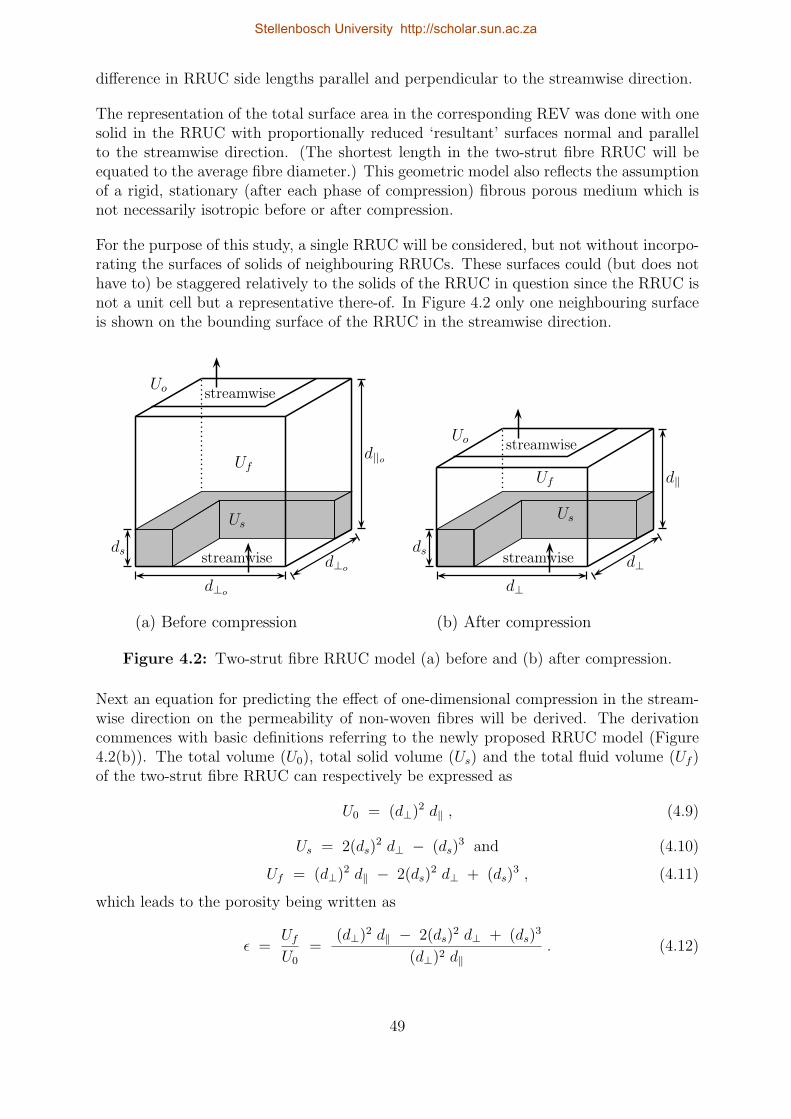
difference in RRUC side lengths parallel and perpendicular to the streamwise direction.
The representation of the total surface area in the corresponding REV was done with onesolid in the RRUC with proportionally reduced ‘resultant’ surfaces normal and parallelto the streamwise direction. (The shortest length in the two-strut fibre RRUC will beequated to the average fibre diameter.) This geometric model also reflects the assumptionof a rigid, stationary (after each phase of compression) fibrous porous medium which isnot necessarily isotropic before or after compression.
For the purpose of this study, a single RRUC will be considered, but not without incorpo-rating the surfaces of solids of neighbouring RRUCs. These surfaces could (but does nothave to) be staggered relatively to the solids of the RRUC in question since the RRUC isnot a unit cell but a representative there-of. In Figure 4.2 only one neighbouring surfaceis shown on the bounding surface of the RRUC in the streamwise direction.
Uf
Uo
streamwise
streamwise
d⊥o
d||o
Us
d⊥o
ds
(a) Before compression
Uf
Uo
streamwise
streamwise
d⊥
d‖
Us
d⊥
ds
(b) After compression
Uf
Uo
streamwise
streamwise
d⊥o
d||o
Us
d⊥o
ds
(a) Before compression
Uf
Uo
streamwise
streamwise
d⊥
d‖
Us
d⊥
ds
(b) After compression
Figure 4.2: Two-strut fibre RRUC model (a) before and (b) after compression.
Next an equation for predicting the effect of one-dimensional compression in the stream-wise direction on the permeability of non-woven fibres will be derived. The derivationcommences with basic definitions referring to the newly proposed RRUC model (Figure4.2(b)). The total volume (U0), total solid volume (Us) and the total fluid volume (Uf )of the two-strut fibre RRUC can respectively be expressed as
U0 = (d⊥)2 d∥ , (4.9)
Us = 2(ds)2 d⊥ − (ds)
3 and (4.10)
Uf = (d⊥)2 d∥ − 2(ds)2 d⊥ + (ds)
3 , (4.11)
which leads to the porosity being written as
ϵ =Uf
U0
=(d⊥)2 d∥ − 2(ds)
2 d⊥ + (ds)3
(d⊥)2 d∥. (4.12)
49
Stellenbosch University http://scholar.sun.ac.za
(For clarification: The value for d∥ (or d⊥) in the uncompressed state is d∥0 (or d⊥0) andU0 refers to the total volume in any state.) The hydraulic pore diameter associated withthe corresponding REV will be represented in RRUC notation by
Dh = d⊥ − ds , (4.13)
which can be visualized in Figure 4.2 as the minimal streamwise opening width of theRRUC. The rationale behind this choice of a ‘streamwise direction’ hydraulic diameteris mathematical simplicity and also because it coincides with the hydraulic diameter forflow in a square duct of dimension d⊥ − ds. This complies with the choice of hydraulicdiameter in previous RRUC models based on the assumption of isotropy. Even thoughthe compression of a fibrous porous medium excludes the assumption of isotropy, theabove mentioned hydraulic diameter is employed with the awareness that this choice ofdefinition must be revisited (which will be done in Section 5.2).
Referring to the two-strut fibre RRUC (Figure 4.2), the representation of the pressureloss in the corresponding REV will be done as follows: It is assumed that the validationof the direct modelling procedure, through the Lloyd correction and closure modellingregarding the RRUCs discussed in Section 3.2, can be extended to the present two-strutfibre model without introducing a significant margin of error.
Almost invariably, according to Korteland et al. (2010), it is (implicitly) assumed thatthe intrinsic phase-volume average pressure corresponds to the pressure that is actuallymeasured (macroscale pressure). Expressing the gradient of the intrinsic phase-volumeaverage pressure as the negative of the pressure drop across the streamwise length of theRRUC divided by the streamwise length, leads to
(d⊥ − ds)2 ∆p = S|| τw∥ + S⊥ τw⊥ , (4.14)
which corresponds to the ‘direct modelling procedure’ as described by Woudberg (2012a)for other RRUC types. Here S|| and S⊥ represent the total surface areas available for shearstresses in the streamwise and transverse directions, respectively, and τw∥ and τw⊥ repre-sent the magnitude of the wall shear stresses in the two respective directions. Equation(4.14) will be employed in the modelling steps described in the following section.
According to Shah & London (1978) the pressure drop in fully developed flow is causedby the wall shear stresses and therefore equation (4.14) does not reflect developing flowand accompanying inertial effects. Equation (4.14) also supports the fact that when it isassumed that the flow in each pore channel is in dynamic equilibrium, the net force shouldbe zero and since only shear forces are considered, the force exerted by the pressure overthe inlet and outlet areas of a channel section and the shear forces are in balance. Formdrag for flow over obstacles will not be employed since the assumption is made that flow ina compressed fibrous porous medium resembles more closely flow through a conduit thanflow over an obstacle. The above described geometric model will now be used to ‘scale’the velocities, surface areas and shear stresses according to the geometric representationof the porosity and hydraulic diameter of the porous medium in question.
The steps in the modelling procedure (to be presented in Section 4.3) are similar to thesteps used by Woudberg (2012a), but will refer to the two-strut geometric model depictedin Figure 4.2. The procedure will be described (using the data of Le Coq (2008) given in
50
Stellenbosch University http://scholar.sun.ac.za
Table 3.2) in order to highlight corresponding assumptions and the rationale behind it.The modelling steps to be presented in Section 4.3 are applicable when the fibre diameter,the porosity in the uncompressed state and the different compression fractions are known.These steps also rely on the availability of data regarding the hydraulic diameter andporosity at different stages of compression for the determination of the streamwise lengthrepresenting the uncompressed state of the porous medium.
4.3 Modelling steps
The permeability will be written in terms of the compression fraction (explicitly) andthe porosity (implicitly through the dimensions of the two-strut fibre RRUC). For thegeometrical representation of the porosity in the uncompressed state it is necessary todetermine an applicable uncompressed streamwise side length of the RRUC. From thisthe streamwise side lengths corresponding to different compressed states will be derived. Ifempirically determined values of the hydraulic diameter for different stages of compressionare available, as is the case for the porous medium modelled in this chapter, it will beemployed as follows:
Incorporating the representative hydraulic diameter, Dh = d⊥ − ds, equation (4.12) canbe expressed as:
ϵ =Uf
U0
=(Dh + ds)
2 d∥ − 2(ds)2 (Dh + ds) + (ds)
3
(Dh + ds)2 d∥, (4.15)
from which it follows that
d∥ =2(ds)
2 (Dh + ds) − (ds)3
(1 − ϵ)(Dh + ds)2. (4.16)
The assumption is made that the effect of compression is spread homogeneously through-out the porous medium. Therefore the filter thickness after compression relative to itsuncompressed state (i.e. the compression fraction), is taken as the percentage with whichthe side length of the RRUC in the streamwise direction will shorten relative to its un-compressed length. With d∥0 denoting the uncompressed streamwise length of the RRUC,this assumption can be expressed mathematically as:
e =d∥d∥0
. (4.17)
A value for d∥0 may be obtained in the following way: Substituting the data from theexperiments of Le Coq (2008) in Table 3.2 into equation (4.16), the streamwise length ofthe two-strut fibre RRUC for the four stages of compression is determined. The valueused for ds is 2.7 µm, which is the fibre diameter of the porous medium referred to in themodelling process.
Corresponding values for d∥0 are obtained from equation (4.17), yielding an average valueof d∥0 = 8.9 µm. This value will be used as the streamwise length of the RRUC in the
51
Stellenbosch University http://scholar.sun.ac.za
uncompressed state. Therefore, based on the empirical data used,
d∥ = 8.9 e . (4.18)
It must be noted that the value of d∥0 depends on the choice of definition for the hydraulicdiameter as well as on the empirically determined values for this structural parameter.
The side length of the RRUC perpendicular to the streamwise direction (d⊥), can beobtained from equation (4.12) for a specific porosity, using the corresponding value ford∥, given by equation (4.18):
0 = ϵ (d⊥)2 d∥ − (d⊥)2 d∥ + 2(ds)2 d⊥ − (ds)
3 , (4.19)
with roots
d⊥ =ds(ds ∓
√(ds)2 + d∥ ds (ϵ − 1)
)d∥(1 − ϵ)
. (4.20)
Since ds + d∥(ϵ − 1) ≥ 0, it follows that:
ds ≥ (1 − ϵ) d∥ = (1 − ϵ) d∥0 e. (4.21)
This restriction follows from the reflection of the choice of geometric model in the definitionof porosity. For the different relationships between the compression fraction and porosityto be implemented, based on the choice of ds = 2.7 µm as well as d∥0 = 8.9 µm, thisrestriction will be used to show for which porosities the different relationships are valid.
Only the addition of the square root in equation (4.20) is considered since the subtractionthere-of leads to impractical small values for d⊥. (Since in practice the porosity is never100%, the equation is valid over the whole porosity range.) Therefore,
d⊥ =ds(ds +
√(ds)2 + d∥ ds (ϵ − 1)
)d∥(1 − ϵ)
. (4.22)
Although there is no macroscopic nett flow in the directions perpendicular to the stream-wise direction, the shear stresses due to velocity gradients in the micro-channels per-pendicular to the streamwise direction also contribute to pressure loss in the streamwisedirection. Flow in the directions perpendicular to the streamwise direction is representedin the RRUC by an average transverse velocity, w⊥, of which the magnitude is assumedto be the same in both transverse directions, as is reflected in the geometric model.The relationships between the magnitudes of the velocities w∥ (representing the averagestreamwise pore velocity in the effective streamwise volume in the corresponding REV),w⊥ and q are written in terms of the dimensions of the RRUC. This is done based on thedefinition of the superficial velocity within the volume averaging context (i.e. equation(2.15)), as well as on the principle of mass conservation.
Using the dimensions of the two-strut fibre RRUC (Figure 4.2(b)) as ‘prescribed’ by theporosity, the mathematical expressions of these relationships are:
w∥ =q (d⊥)2
(d⊥ − ds)2, (4.23)
52
Stellenbosch University http://scholar.sun.ac.za
andw⊥
w∥=
(d⊥ − ds)2
(d∥ − ds) (d⊥). (4.24)
As a result, the magnitude of the average transverse velocity can be expressed as:
w⊥ =
(q (d⊥)2
(d⊥ − ds)2
) ((d⊥ − ds)
2
(d∥ − ds) (d⊥)
)=
q d⊥(d∥ − ds)
. (4.25)
In general, for two infinitely wide (e.g. in the k-direction) parallel plates, stationaryrelative to each other, a distance d (in the j-direction) apart, with flow in the i-direction,the velocity profile for fully developed plane Poiseuille flow is given by:
u(y) =y
2µ
(− dp
dx
)(d− y) . (4.26)
The mean velocity between the plates is then expressed as
um =d2
12µ
(− dp
dx
), (4.27)
and the wall shear stress is given by:
τwall =6 µ umd
. (4.28)
In the context of the two strut fibre RRUC model, equation (4.28) is used to approximatethe magnitude of the total wall shear stresses represented via the chosen geometry of theRRUC. The underlying assumption is therefore that a formula, that refers to uniform andconstant wall shear stresses with fully developed flow between parallel plates, will producean approximation of which the margin of error falls within the same order of magnitudeas that of other approximations made in the modelling process. This is done althoughthe ‘parallel plates’ (note that the one plate is always part of a neighbouring RRUC) arenot infinitely wide (or long) and can be ‘shifted’ relative to each other.
The use of equation (4.28) also highlights the assumption of steady (velocity, pressureand cross-section may differ from point to point but do not change with time at a specificpoint), laminar flow. This is despite the fact that in practise there are usually slightvariations in velocity and pressure over time at a specific point.
Four sets of equal area parallel plates (of which the two sets parallel to the streamwisedirection are not shifted in the transverse directions) will be employed to quantify theshear stresses. Based on the above mentioned assumptions, the wall shear stresses in thestreamwise and two transverse directions can respectively be expressed as:
τw∥ =6 µ w∥
d⊥ − dsand τw⊥ =
6 µ w⊥
d∥ − ds. (4.29)
The relationship between the total pressure drop over the RRUC and the shear stresses(equation (4.14)) then becomes:
(d⊥ − ds)2 ∆p = [4 ds (d⊥ − ds)] τw∥ +
[4 ds (d⊥ − ds) + 2(ds)
2]τw⊥ . (4.30)
53
Stellenbosch University http://scholar.sun.ac.za
Incorporating equation (4.29) and then equations (4.23) and (4.25) into equation (4.30),lead to an expression for the total pressure drop over the RRUC in terms of the magnitudeof the superficial velocity, viscosity and the dimensions of the RRUC:
∆p = µ q
[24 ds (d⊥)2
(d⊥ − ds)4 +
24 ds (d⊥)2 − 12 (ds)2 d⊥
(d⊥ − ds)2 (d∥ − ds)
2
]
= µ q
[24 ds (d⊥)2 (d∥ − ds)
2 + 12 ds d⊥ (2 d⊥ − ds) (d⊥ − ds)2
(d⊥ − ds)4 (d∥ − ds)
2
]. (4.31)
Assuming that the pressure drop across the streamwise length of the RRUC (d∥) is thesame as the pressure gradient across the length of the filter and that Darcy’s law isapplicable in this low Reynolds number flow regime, it follows that
∆p
d∥=
µ q
k, (4.32)
with k the (hydrodynamic) permeability of the fibrous porous medium. From equations(4.31) and (4.32) the permeability can be expressed as
k =d∥(d⊥ − ds)
4 (d∥ − ds)2
24 ds (d⊥)2 (d∥ − ds)2 + 12 ds d⊥ (2 d⊥ − ds) (d⊥ − ds)2. (4.33)
Based on the choice of compression fraction - porosity relationship, equation (4.33) canbe re-written in terms of the uncompressed length of the RRUC, the compression fractionand the fibre diameter. In the next section the different relationships and the influencethere-of on the prediction efficiency of the geometric model will be compared. The threerelationships will also be applied in the three-strut fibre model (Woudberg (2012a)) andin each case the permeability predictions will be compared to that of the two-strut fibremodel.
Although during comparison of results the word ‘error’ will be used, it should rather (inthe context of this study) be regarded as a percentage difference. As is evident from theliterature study, experiments also involve calculations and manipulations with measuredvalues - all based on assumptions. In the context of this study the use of the word ‘error’does not imply that the experimental values (relative to which the percentage differencesare calculated) are assumed to be ‘correct’ in the absolute sense.
4.4 Permeability prediction based on different com-
pression fraction - porosity relationships
In this section the three different relationships for the inter-dependence of the compressionfraction and porosity, discussed in Section 4.1, will be incorporated in the modellingsteps outlined in Section 4.3 pertaining to the two-strut fibre RRUC model depicted inFigure 4.2. Woudberg (2012a) discussed the three-strut fibre RRUC model using only thelinear regression relationship. The two non-linear relationships will also be applied to thethree-strut model (without showing all the steps and restrictions) and the results will becompared to that of the two-strut model.
54
Stellenbosch University http://scholar.sun.ac.za
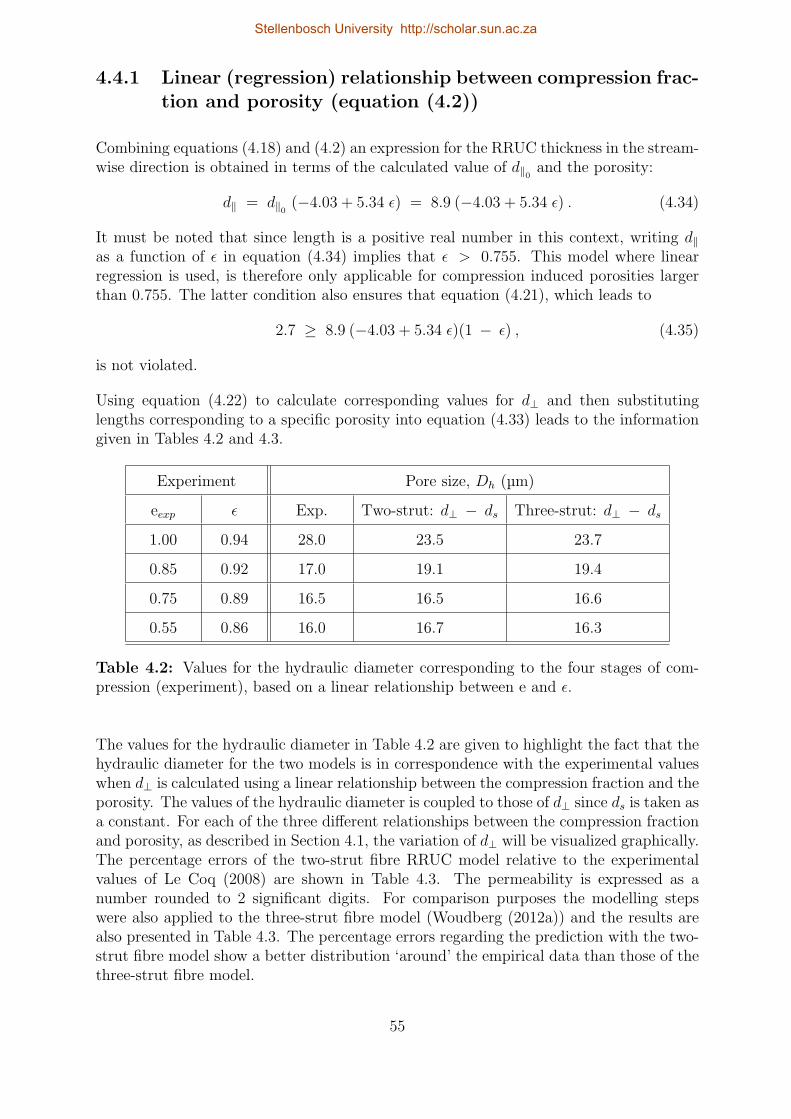
4.4.1 Linear (regression) relationship between compression frac-tion and porosity (equation (4.2))
Combining equations (4.18) and (4.2) an expression for the RRUC thickness in the stream-wise direction is obtained in terms of the calculated value of d∥0 and the porosity:
d∥ = d∥0 (−4.03 + 5.34 ϵ) = 8.9 (−4.03 + 5.34 ϵ) . (4.34)
It must be noted that since length is a positive real number in this context, writing d∥as a function of ϵ in equation (4.34) implies that ϵ > 0.755. This model where linearregression is used, is therefore only applicable for compression induced porosities largerthan 0.755. The latter condition also ensures that equation (4.21), which leads to
2.7 ≥ 8.9 (−4.03 + 5.34 ϵ)(1 − ϵ) , (4.35)
is not violated.
Using equation (4.22) to calculate corresponding values for d⊥ and then substitutinglengths corresponding to a specific porosity into equation (4.33) leads to the informationgiven in Tables 4.2 and 4.3.
Experiment Pore size, Dh (µm)
eexp ϵ Exp. Two-strut: d⊥ − ds Three-strut: d⊥ − ds
1.00 0.94 28.0 23.5 23.7
0.85 0.92 17.0 19.1 19.4
0.75 0.89 16.5 16.5 16.6
0.55 0.86 16.0 16.7 16.3
Table 4.2: Values for the hydraulic diameter corresponding to the four stages of com-pression (experiment), based on a linear relationship between e and ϵ.
The values for the hydraulic diameter in Table 4.2 are given to highlight the fact that thehydraulic diameter for the two models is in correspondence with the experimental valueswhen d⊥ is calculated using a linear relationship between the compression fraction and theporosity. The values of the hydraulic diameter is coupled to those of d⊥ since ds is taken asa constant. For each of the three different relationships between the compression fractionand porosity, as described in Section 4.1, the variation of d⊥ will be visualized graphically.The percentage errors of the two-strut fibre RRUC model relative to the experimentalvalues of Le Coq (2008) are shown in Table 4.3. The permeability is expressed as anumber rounded to 2 significant digits. For comparison purposes the modelling stepswere also applied to the three-strut fibre model (Woudberg (2012a)) and the results arealso presented in Table 4.3. The percentage errors regarding the prediction with the two-strut fibre model show a better distribution ‘around’ the empirical data than those of thethree-strut fibre model.
55
Stellenbosch University http://scholar.sun.ac.za
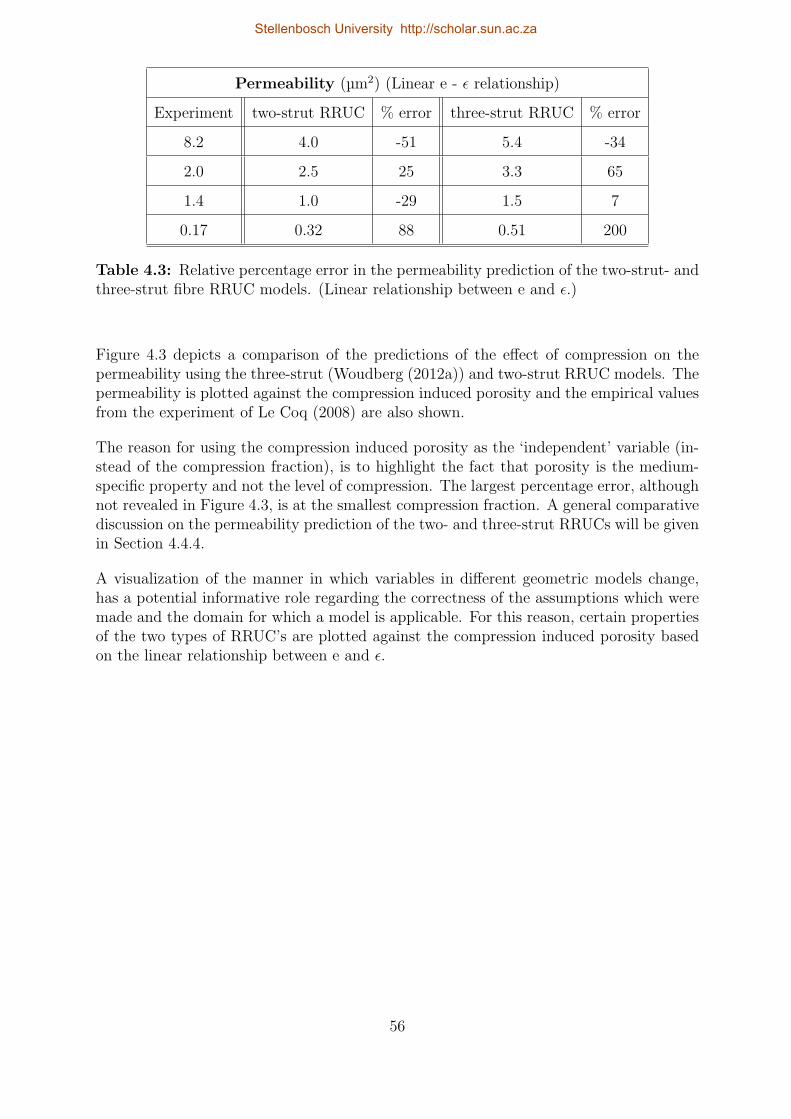
Permeability (µm2) (Linear e - ϵ relationship)
Experiment two-strut RRUC % error three-strut RRUC % error
8.2 4.0 -51 5.4 -34
2.0 2.5 25 3.3 65
1.4 1.0 -29 1.5 7
0.17 0.32 88 0.51 200
Table 4.3: Relative percentage error in the permeability prediction of the two-strut- andthree-strut fibre RRUC models. (Linear relationship between e and ϵ.)
Figure 4.3 depicts a comparison of the predictions of the effect of compression on thepermeability using the three-strut (Woudberg (2012a)) and two-strut RRUC models. Thepermeability is plotted against the compression induced porosity and the empirical valuesfrom the experiment of Le Coq (2008) are also shown.
The reason for using the compression induced porosity as the ‘independent’ variable (in-stead of the compression fraction), is to highlight the fact that porosity is the medium-specific property and not the level of compression. The largest percentage error, althoughnot revealed in Figure 4.3, is at the smallest compression fraction. A general comparativediscussion on the permeability prediction of the two- and three-strut RRUCs will be givenin Section 4.4.4.
A visualization of the manner in which variables in different geometric models change,has a potential informative role regarding the correctness of the assumptions which weremade and the domain for which a model is applicable. For this reason, certain propertiesof the two types of RRUC’s are plotted against the compression induced porosity basedon the linear relationship between e and ϵ.
56
Stellenbosch University http://scholar.sun.ac.za
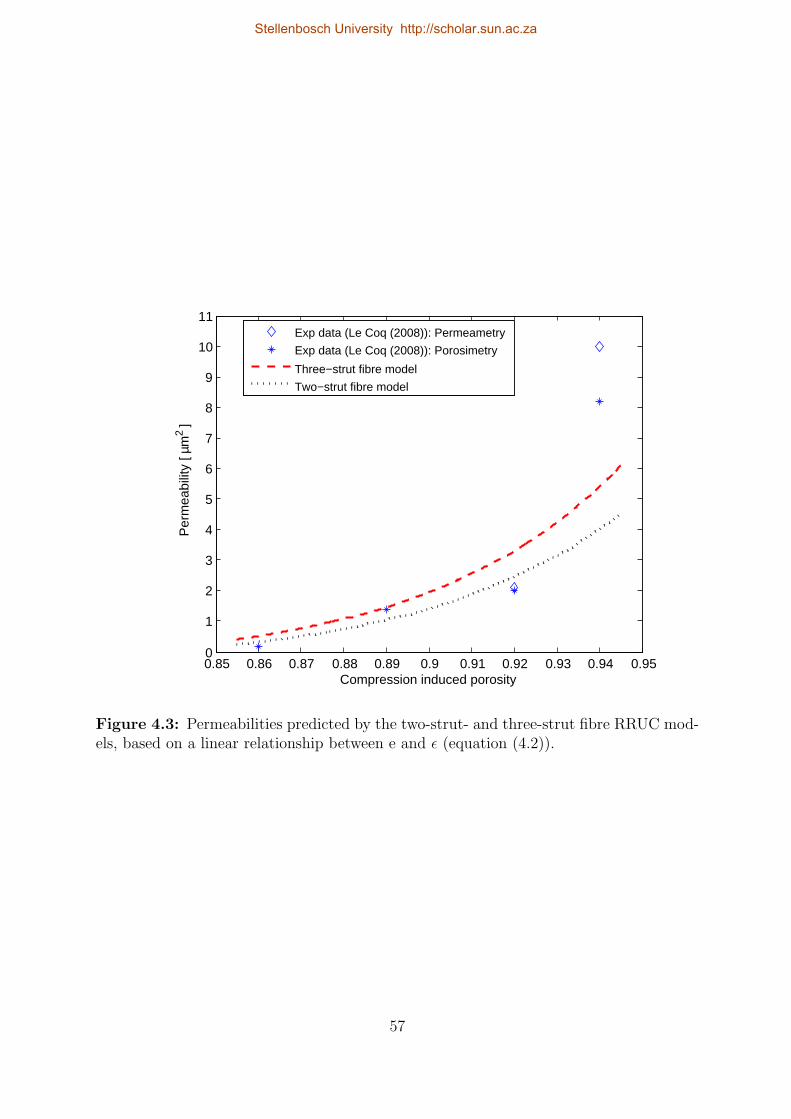
0.85 0.86 0.87 0.88 0.89 0.9 0.91 0.92 0.93 0.94 0.950
1
2
3
4
5
6
7
8
9
10
11
Compression induced porosity
Per
mea
bilit
y [ µ
m2 ]
Exp data (Le Coq (2008)): Permeametry
Exp data (Le Coq (2008)): Porosimetry
Three−strut fibre model
Two−strut fibre model
Figure 4.3: Permeabilities predicted by the two-strut- and three-strut fibre RRUC mod-els, based on a linear relationship between e and ϵ (equation (4.2)).
57
Stellenbosch University http://scholar.sun.ac.za
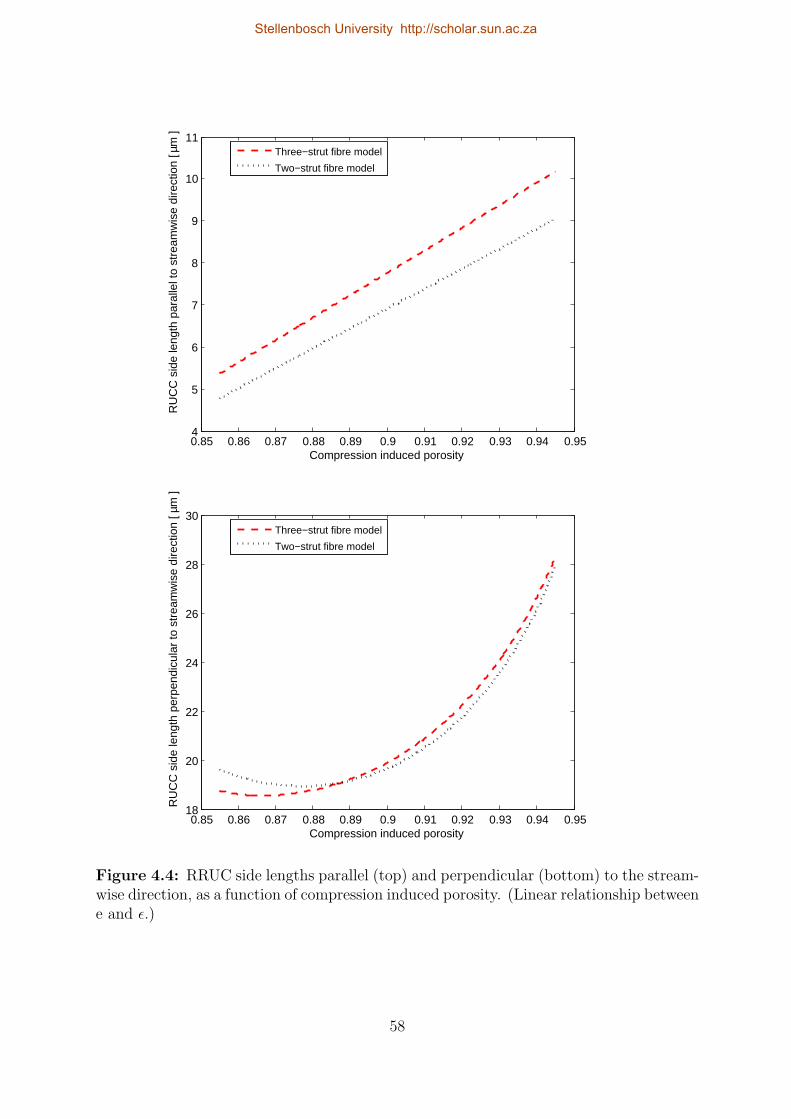
0.85 0.86 0.87 0.88 0.89 0.9 0.91 0.92 0.93 0.94 0.954
5
6
7
8
9
10
11
Compression induced porosity
RU
CC
sid
e le
ngth
par
alle
l to
stre
amw
ise
dire
ctio
n [ µ
m ]
Three−strut fibre model
Two−strut fibre model
0.85 0.86 0.87 0.88 0.89 0.9 0.91 0.92 0.93 0.94 0.9518
20
22
24
26
28
30
Compression induced porosity
RU
CC
sid
e le
ngth
per
pend
icul
ar to
str
eam
wis
e di
rect
ion
[ µm
]
Three−strut fibre model
Two−strut fibre model
Figure 4.4: RRUC side lengths parallel (top) and perpendicular (bottom) to the stream-wise direction, as a function of compression induced porosity. (Linear relationship betweene and ϵ.)
58
Stellenbosch University http://scholar.sun.ac.za
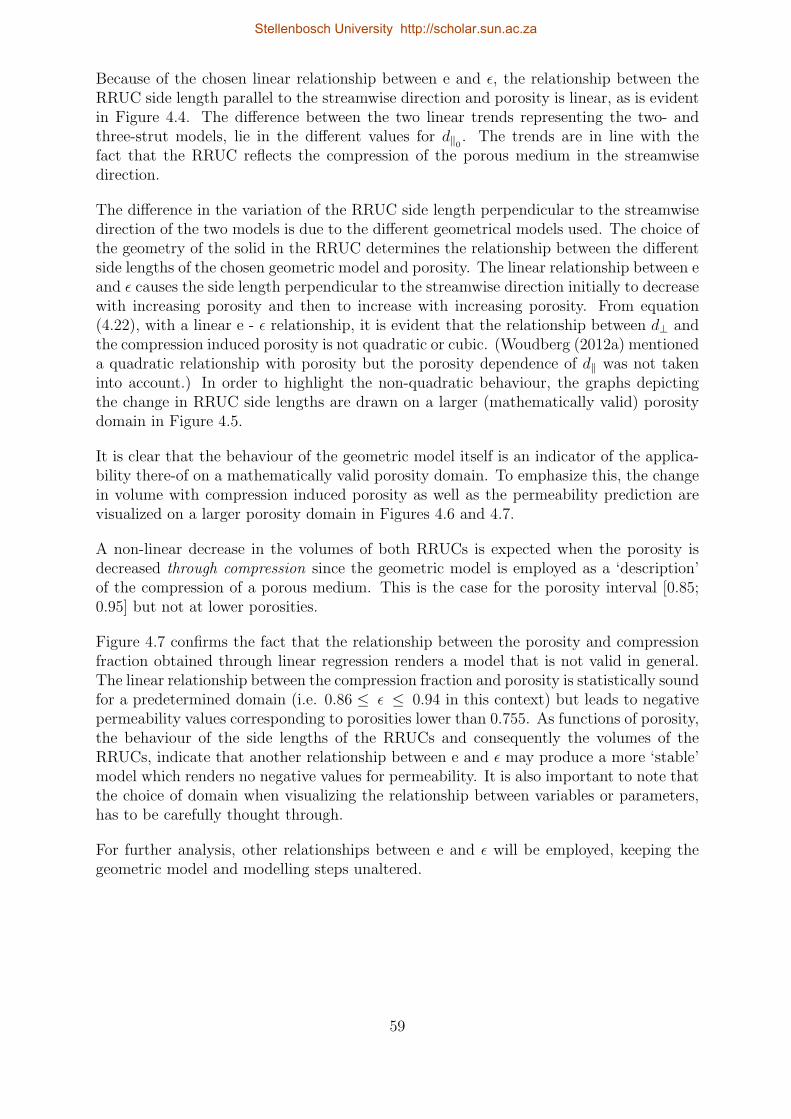
Because of the chosen linear relationship between e and ϵ, the relationship between theRRUC side length parallel to the streamwise direction and porosity is linear, as is evidentin Figure 4.4. The difference between the two linear trends representing the two- andthree-strut models, lie in the different values for d∥0 . The trends are in line with thefact that the RRUC reflects the compression of the porous medium in the streamwisedirection.
The difference in the variation of the RRUC side length perpendicular to the streamwisedirection of the two models is due to the different geometrical models used. The choice ofthe geometry of the solid in the RRUC determines the relationship between the differentside lengths of the chosen geometric model and porosity. The linear relationship between eand ϵ causes the side length perpendicular to the streamwise direction initially to decreasewith increasing porosity and then to increase with increasing porosity. From equation(4.22), with a linear e - ϵ relationship, it is evident that the relationship between d⊥ andthe compression induced porosity is not quadratic or cubic. (Woudberg (2012a) mentioneda quadratic relationship with porosity but the porosity dependence of d∥ was not takeninto account.) In order to highlight the non-quadratic behaviour, the graphs depictingthe change in RRUC side lengths are drawn on a larger (mathematically valid) porositydomain in Figure 4.5.
It is clear that the behaviour of the geometric model itself is an indicator of the applica-bility there-of on a mathematically valid porosity domain. To emphasize this, the changein volume with compression induced porosity as well as the permeability prediction arevisualized on a larger porosity domain in Figures 4.6 and 4.7.
A non-linear decrease in the volumes of both RRUCs is expected when the porosity isdecreased through compression since the geometric model is employed as a ‘description’of the compression of a porous medium. This is the case for the porosity interval [0.85;0.95] but not at lower porosities.
Figure 4.7 confirms the fact that the relationship between the porosity and compressionfraction obtained through linear regression renders a model that is not valid in general.The linear relationship between the compression fraction and porosity is statistically soundfor a predetermined domain (i.e. 0.86 ≤ ϵ ≤ 0.94 in this context) but leads to negativepermeability values corresponding to porosities lower than 0.755. As functions of porosity,the behaviour of the side lengths of the RRUCs and consequently the volumes of theRRUCs, indicate that another relationship between e and ϵ may produce a more ‘stable’model which renders no negative values for permeability. It is also important to note thatthe choice of domain when visualizing the relationship between variables or parameters,has to be carefully thought through.
For further analysis, other relationships between e and ϵ will be employed, keeping thegeometric model and modelling steps unaltered.
59
Stellenbosch University http://scholar.sun.ac.za
0.75 0.8 0.85 0.9 0.95
0
2
4
6
8
10
Compression induced porosity
RU
CC
sid
e le
ngth
par
alle
l to
stre
amw
ise
dire
ctio
n [ µ
m ]
Three−strut fibre model
Two−strut fibre model
0.75 0.8 0.85 0.9 0.950
500
1000
1500
2000
2500
3000
3500
4000
Compression induced porosity
RU
CC
sid
e le
ngth
per
pend
icul
ar to
str
eam
wis
e di
rect
ion
[ µm
]
Three−strut fibre model
Two−strut fibre model
Figure 4.5: RRUC side lengths parallel (top) and perpendicular (bottom) to the stream-wise direction, as a function of compression induced porosity, for the porosity domain[0.75; 0.95]. (Linear relationship between e and ϵ.)
60
Stellenbosch University http://scholar.sun.ac.za
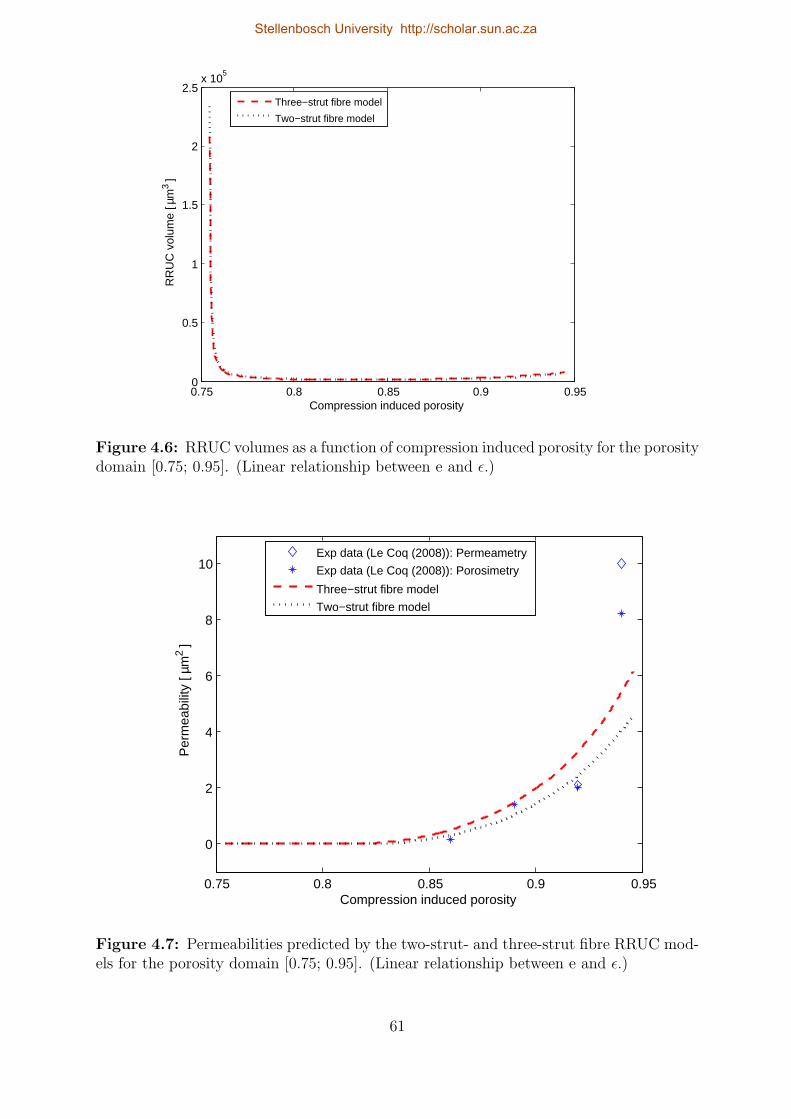
0.75 0.8 0.85 0.9 0.950
0.5
1
1.5
2
2.5x 10
5
Compression induced porosity
RR
UC
vol
ume
[ µm
3 ]
Three−strut fibre model
Two−strut fibre model
Figure 4.6: RRUC volumes as a function of compression induced porosity for the porositydomain [0.75; 0.95]. (Linear relationship between e and ϵ.)
0.75 0.8 0.85 0.9 0.95
0
2
4
6
8
10
Compression induced porosity
Per
mea
bilit
y [ µ
m2 ]
Exp data (Le Coq (2008)): Permeametry
Exp data (Le Coq (2008)): Porosimetry
Three−strut fibre model
Two−strut fibre model
Figure 4.7: Permeabilities predicted by the two-strut- and three-strut fibre RRUC mod-els for the porosity domain [0.75; 0.95]. (Linear relationship between e and ϵ.)
61
Stellenbosch University http://scholar.sun.ac.za
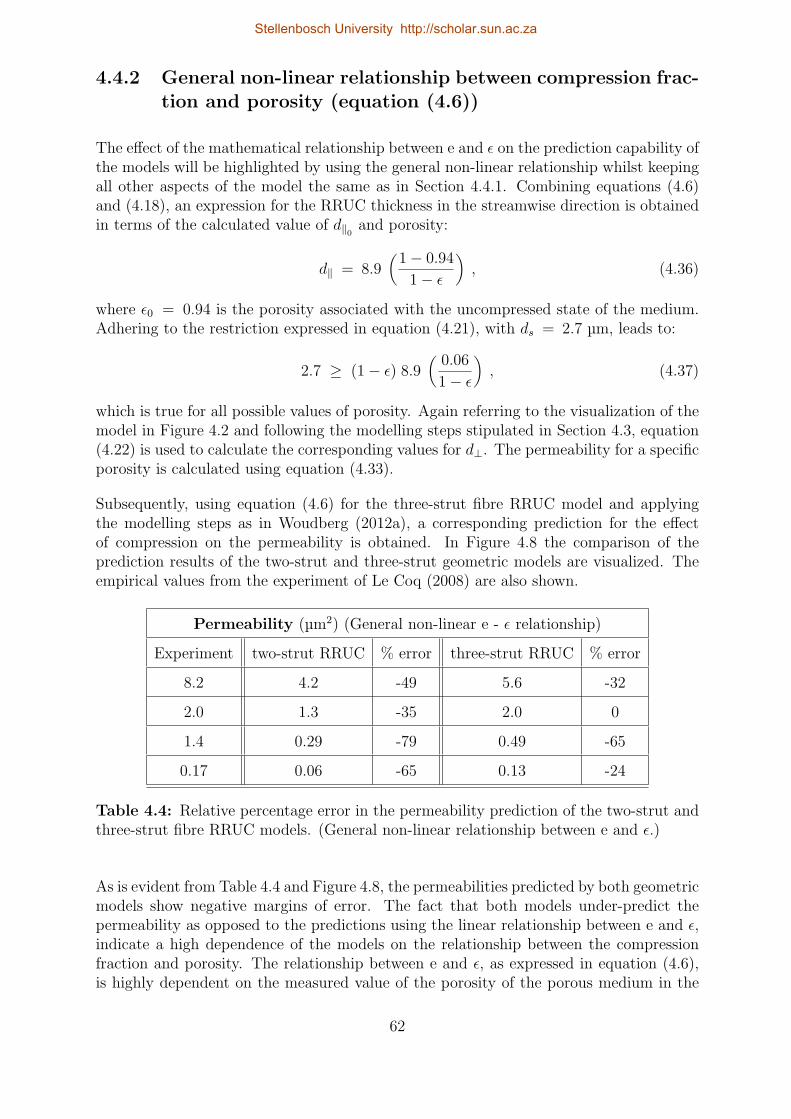
4.4.2 General non-linear relationship between compression frac-tion and porosity (equation (4.6))
The effect of the mathematical relationship between e and ϵ on the prediction capability ofthe models will be highlighted by using the general non-linear relationship whilst keepingall other aspects of the model the same as in Section 4.4.1. Combining equations (4.6)and (4.18), an expression for the RRUC thickness in the streamwise direction is obtainedin terms of the calculated value of d∥0 and porosity:
d∥ = 8.9(
1 − 0.94
1 − ϵ
), (4.36)
where ϵ0 = 0.94 is the porosity associated with the uncompressed state of the medium.Adhering to the restriction expressed in equation (4.21), with ds = 2.7 µm, leads to:
2.7 ≥ (1 − ϵ) 8.9(
0.06
1 − ϵ
), (4.37)
which is true for all possible values of porosity. Again referring to the visualization of themodel in Figure 4.2 and following the modelling steps stipulated in Section 4.3, equation(4.22) is used to calculate the corresponding values for d⊥. The permeability for a specificporosity is calculated using equation (4.33).
Subsequently, using equation (4.6) for the three-strut fibre RRUC model and applyingthe modelling steps as in Woudberg (2012a), a corresponding prediction for the effectof compression on the permeability is obtained. In Figure 4.8 the comparison of theprediction results of the two-strut and three-strut geometric models are visualized. Theempirical values from the experiment of Le Coq (2008) are also shown.
Permeability (µm2) (General non-linear e - ϵ relationship)
Experiment two-strut RRUC % error three-strut RRUC % error
8.2 4.2 -49 5.6 -32
2.0 1.3 -35 2.0 0
1.4 0.29 -79 0.49 -65
0.17 0.06 -65 0.13 -24
Table 4.4: Relative percentage error in the permeability prediction of the two-strut andthree-strut fibre RRUC models. (General non-linear relationship between e and ϵ.)
As is evident from Table 4.4 and Figure 4.8, the permeabilities predicted by both geometricmodels show negative margins of error. The fact that both models under-predict thepermeability as opposed to the predictions using the linear relationship between e and ϵ,indicate a high dependence of the models on the relationship between the compressionfraction and porosity. The relationship between e and ϵ, as expressed in equation (4.6),is highly dependent on the measured value of the porosity of the porous medium in the
62
Stellenbosch University http://scholar.sun.ac.za
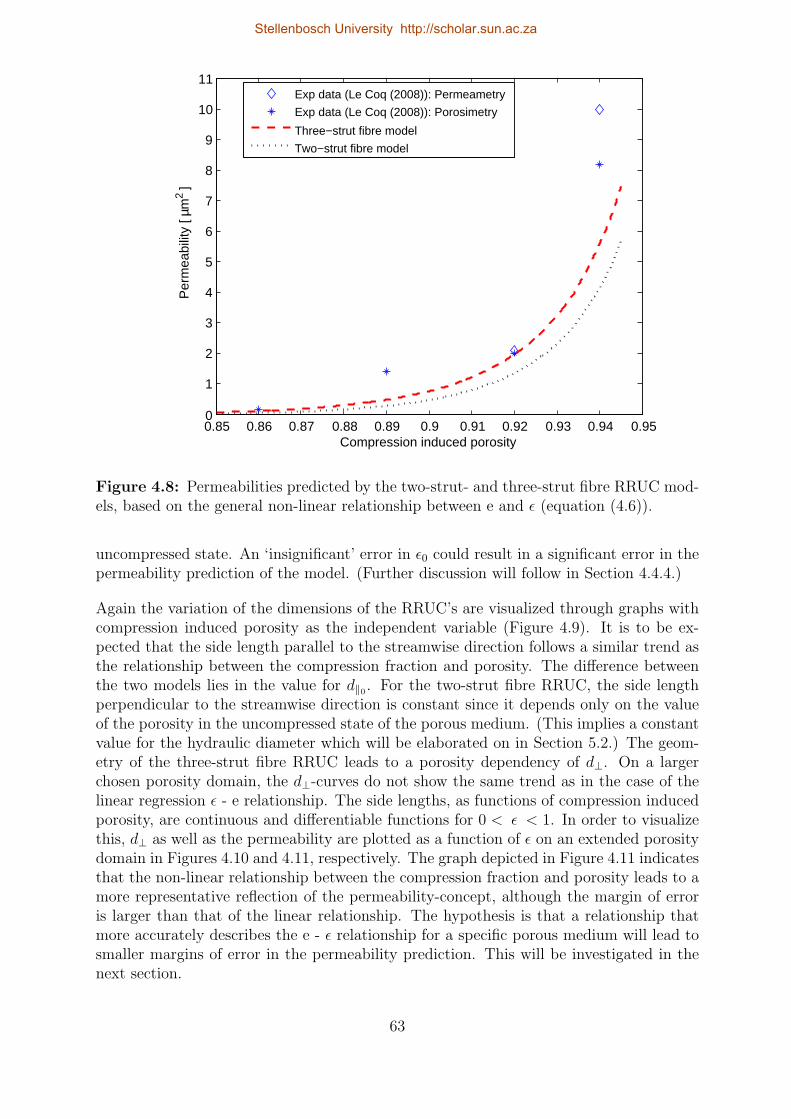
0.85 0.86 0.87 0.88 0.89 0.9 0.91 0.92 0.93 0.94 0.950
1
2
3
4
5
6
7
8
9
10
11
Compression induced porosity
Per
mea
bilit
y [ µ
m2 ]
Exp data (Le Coq (2008)): Permeametry
Exp data (Le Coq (2008)): Porosimetry
Three−strut fibre model
Two−strut fibre model
Figure 4.8: Permeabilities predicted by the two-strut- and three-strut fibre RRUC mod-els, based on the general non-linear relationship between e and ϵ (equation (4.6)).
uncompressed state. An ‘insignificant’ error in ϵ0 could result in a significant error in thepermeability prediction of the model. (Further discussion will follow in Section 4.4.4.)
Again the variation of the dimensions of the RRUC’s are visualized through graphs withcompression induced porosity as the independent variable (Figure 4.9). It is to be ex-pected that the side length parallel to the streamwise direction follows a similar trend asthe relationship between the compression fraction and porosity. The difference betweenthe two models lies in the value for d∥0 . For the two-strut fibre RRUC, the side lengthperpendicular to the streamwise direction is constant since it depends only on the valueof the porosity in the uncompressed state of the porous medium. (This implies a constantvalue for the hydraulic diameter which will be elaborated on in Section 5.2.) The geom-etry of the three-strut fibre RRUC leads to a porosity dependency of d⊥. On a largerchosen porosity domain, the d⊥-curves do not show the same trend as in the case of thelinear regression ϵ - e relationship. The side lengths, as functions of compression inducedporosity, are continuous and differentiable functions for 0 < ϵ < 1. In order to visualizethis, d⊥ as well as the permeability are plotted as a function of ϵ on an extended porositydomain in Figures 4.10 and 4.11, respectively. The graph depicted in Figure 4.11 indicatesthat the non-linear relationship between the compression fraction and porosity leads to amore representative reflection of the permeability-concept, although the margin of erroris larger than that of the linear relationship. The hypothesis is that a relationship thatmore accurately describes the e - ϵ relationship for a specific porous medium will lead tosmaller margins of error in the permeability prediction. This will be investigated in thenext section.
63
Stellenbosch University http://scholar.sun.ac.za
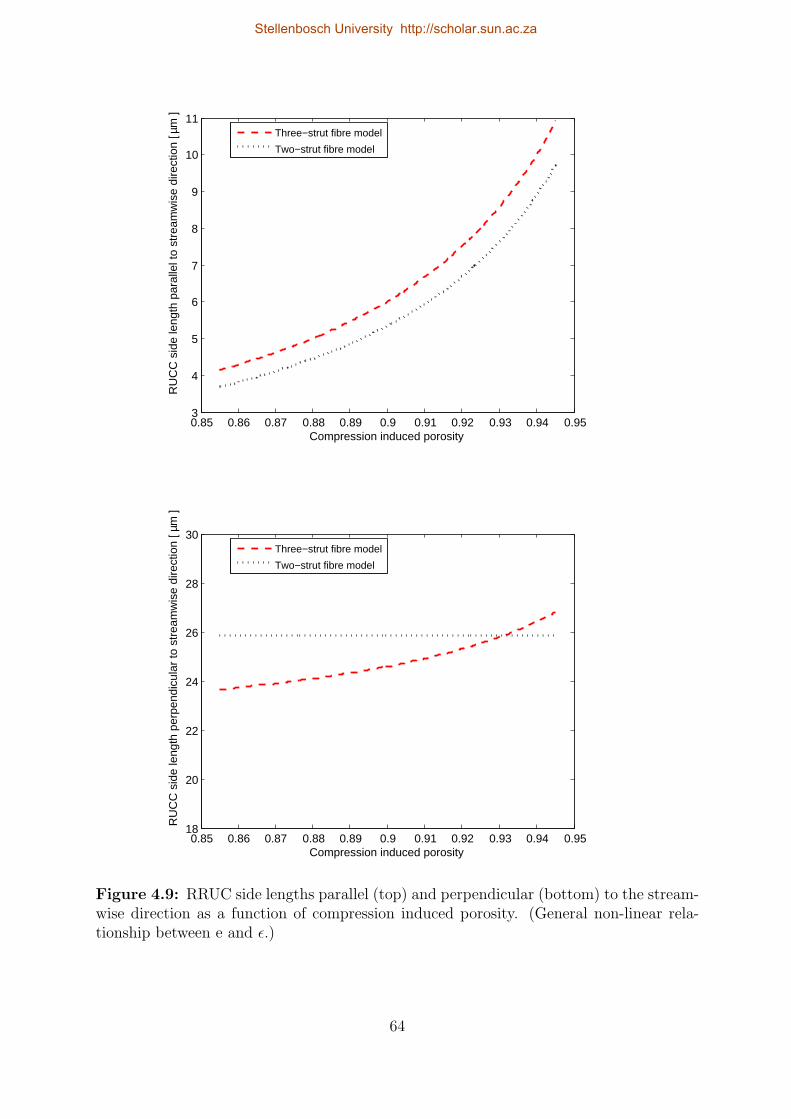
0.85 0.86 0.87 0.88 0.89 0.9 0.91 0.92 0.93 0.94 0.953
4
5
6
7
8
9
10
11
Compression induced porosity
RU
CC
sid
e le
ngth
par
alle
l to
stre
amw
ise
dire
ctio
n [ µ
m ]
Three−strut fibre model
Two−strut fibre model
0.85 0.86 0.87 0.88 0.89 0.9 0.91 0.92 0.93 0.94 0.9518
20
22
24
26
28
30
Compression induced porosity
RU
CC
sid
e le
ngth
per
pend
icul
ar to
str
eam
wis
e di
rect
ion
[ µm
]
Three−strut fibre model
Two−strut fibre model
Figure 4.9: RRUC side lengths parallel (top) and perpendicular (bottom) to the stream-wise direction as a function of compression induced porosity. (General non-linear rela-tionship between e and ϵ.)
64
Stellenbosch University http://scholar.sun.ac.za
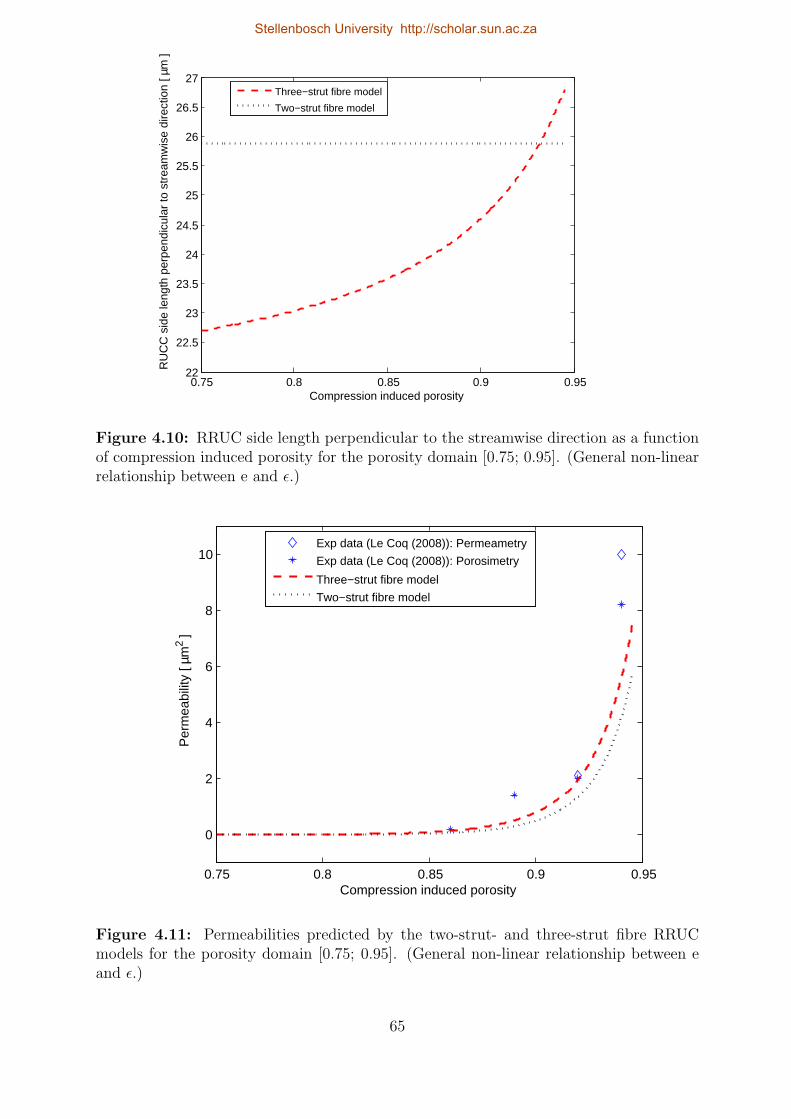
0.75 0.8 0.85 0.9 0.9522
22.5
23
23.5
24
24.5
25
25.5
26
26.5
27
Compression induced porosity
RU
CC
sid
e le
ngth
per
pend
icul
ar to
str
eam
wis
e di
rect
ion
[ µm
]
Three−strut fibre model
Two−strut fibre model
Figure 4.10: RRUC side length perpendicular to the streamwise direction as a functionof compression induced porosity for the porosity domain [0.75; 0.95]. (General non-linearrelationship between e and ϵ.)
0.75 0.8 0.85 0.9 0.95
0
2
4
6
8
10
Compression induced porosity
Per
mea
bilit
y [ µ
m2 ]
Exp data (Le Coq (2008)): Permeametry
Exp data (Le Coq (2008)): Porosimetry
Three−strut fibre model
Two−strut fibre model
Figure 4.11: Permeabilities predicted by the two-strut- and three-strut fibre RRUCmodels for the porosity domain [0.75; 0.95]. (General non-linear relationship between eand ϵ.)
65
Stellenbosch University http://scholar.sun.ac.za
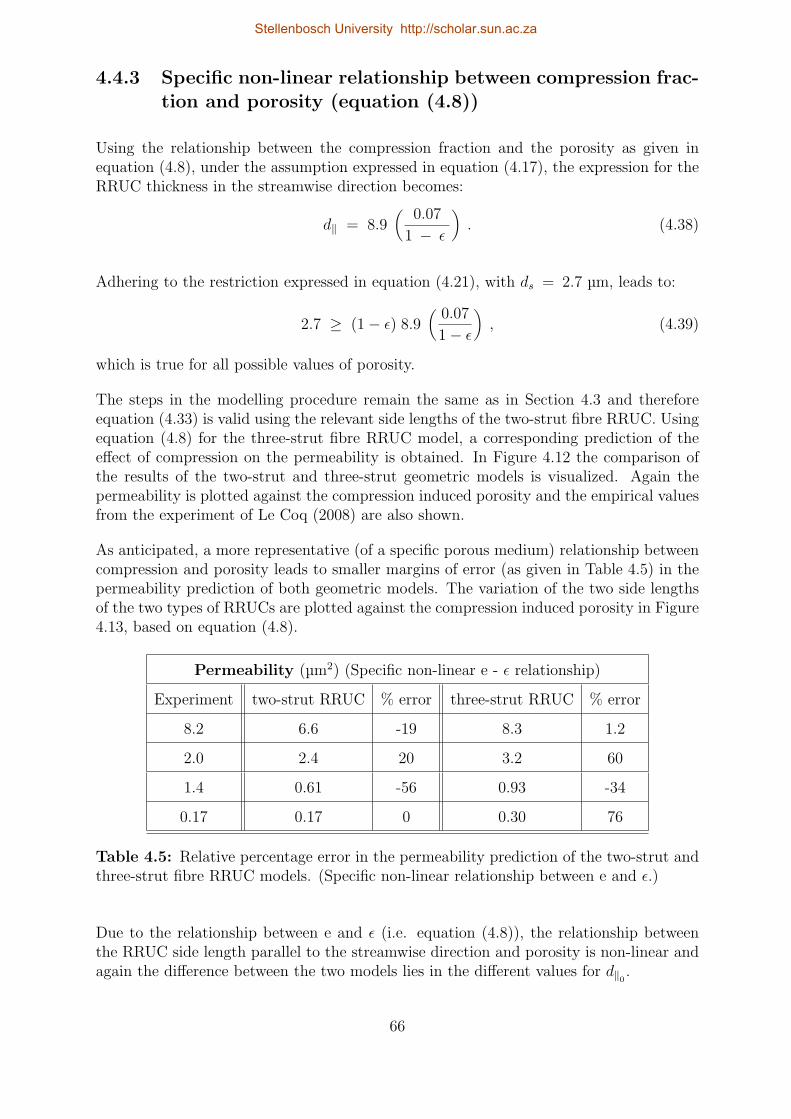
4.4.3 Specific non-linear relationship between compression frac-tion and porosity (equation (4.8))
Using the relationship between the compression fraction and the porosity as given inequation (4.8), under the assumption expressed in equation (4.17), the expression for theRRUC thickness in the streamwise direction becomes:
d∥ = 8.9(
0.07
1 − ϵ
). (4.38)
Adhering to the restriction expressed in equation (4.21), with ds = 2.7 µm, leads to:
2.7 ≥ (1 − ϵ) 8.9(
0.07
1 − ϵ
), (4.39)
which is true for all possible values of porosity.
The steps in the modelling procedure remain the same as in Section 4.3 and thereforeequation (4.33) is valid using the relevant side lengths of the two-strut fibre RRUC. Usingequation (4.8) for the three-strut fibre RRUC model, a corresponding prediction of theeffect of compression on the permeability is obtained. In Figure 4.12 the comparison ofthe results of the two-strut and three-strut geometric models is visualized. Again thepermeability is plotted against the compression induced porosity and the empirical valuesfrom the experiment of Le Coq (2008) are also shown.
As anticipated, a more representative (of a specific porous medium) relationship betweencompression and porosity leads to smaller margins of error (as given in Table 4.5) in thepermeability prediction of both geometric models. The variation of the two side lengthsof the two types of RRUCs are plotted against the compression induced porosity in Figure4.13, based on equation (4.8).
Permeability (µm2) (Specific non-linear e - ϵ relationship)
Experiment two-strut RRUC % error three-strut RRUC % error
8.2 6.6 -19 8.3 1.2
2.0 2.4 20 3.2 60
1.4 0.61 -56 0.93 -34
0.17 0.17 0 0.30 76
Table 4.5: Relative percentage error in the permeability prediction of the two-strut andthree-strut fibre RRUC models. (Specific non-linear relationship between e and ϵ.)
Due to the relationship between e and ϵ (i.e. equation (4.8)), the relationship betweenthe RRUC side length parallel to the streamwise direction and porosity is non-linear andagain the difference between the two models lies in the different values for d∥0 .
66
Stellenbosch University http://scholar.sun.ac.za
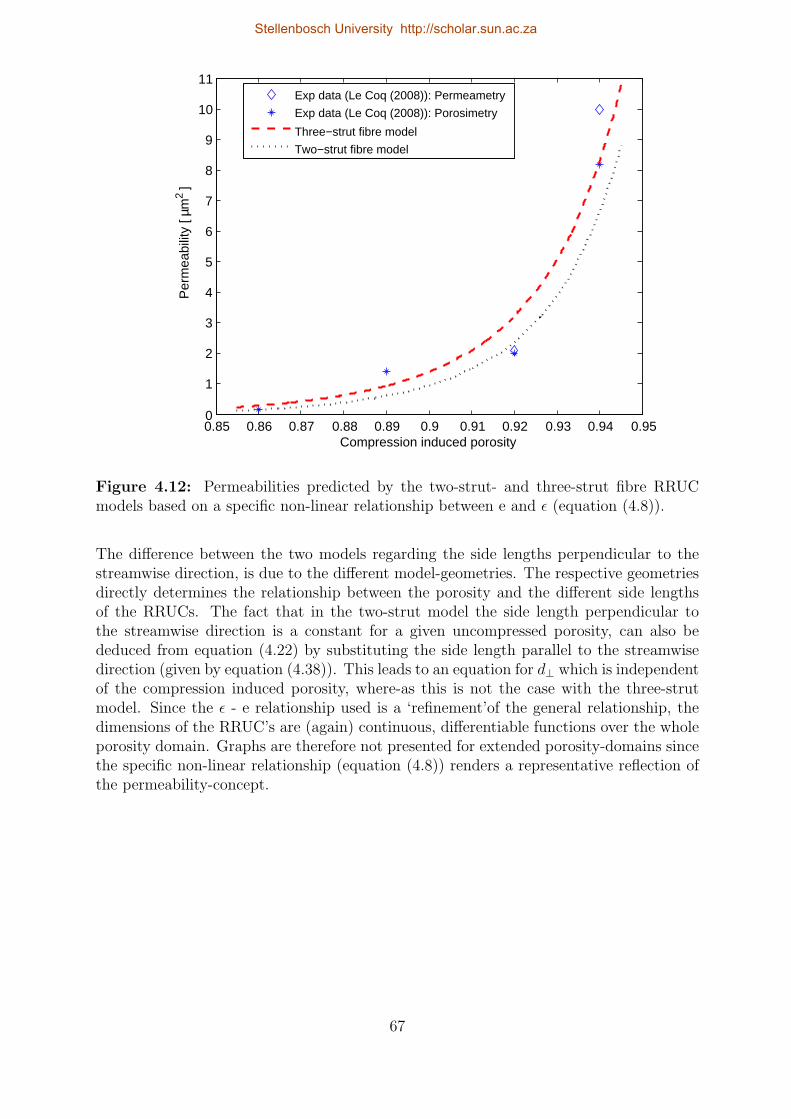
0.85 0.86 0.87 0.88 0.89 0.9 0.91 0.92 0.93 0.94 0.950
1
2
3
4
5
6
7
8
9
10
11
Compression induced porosity
Per
mea
bilit
y [ µ
m2 ]
Exp data (Le Coq (2008)): Permeametry
Exp data (Le Coq (2008)): Porosimetry
Three−strut fibre model
Two−strut fibre model
Figure 4.12: Permeabilities predicted by the two-strut- and three-strut fibre RRUCmodels based on a specific non-linear relationship between e and ϵ (equation (4.8)).
The difference between the two models regarding the side lengths perpendicular to thestreamwise direction, is due to the different model-geometries. The respective geometriesdirectly determines the relationship between the porosity and the different side lengthsof the RRUCs. The fact that in the two-strut model the side length perpendicular tothe streamwise direction is a constant for a given uncompressed porosity, can also bededuced from equation (4.22) by substituting the side length parallel to the streamwisedirection (given by equation (4.38)). This leads to an equation for d⊥ which is independentof the compression induced porosity, where-as this is not the case with the three-strutmodel. Since the ϵ - e relationship used is a ‘refinement’of the general relationship, thedimensions of the RRUC’s are (again) continuous, differentiable functions over the wholeporosity domain. Graphs are therefore not presented for extended porosity-domains sincethe specific non-linear relationship (equation (4.8)) renders a representative reflection ofthe permeability-concept.
67
Stellenbosch University http://scholar.sun.ac.za
0.85 0.86 0.87 0.88 0.89 0.9 0.91 0.92 0.93 0.94 0.954
5
6
7
8
9
10
11
12
13
Compression induced porosity
RU
CC
sid
e le
ngth
par
alle
l to
stre
amw
ise
dire
ctio
n [ µ
m ]
Three−strut fibre model
Two−strut fibre model
0.85 0.86 0.87 0.88 0.89 0.9 0.91 0.92 0.93 0.94 0.9518
20
22
24
26
28
30
Compression induced porosity
RU
CC
sid
e le
ngth
per
pend
icul
ar to
str
eam
wis
e di
rect
ion
[ µm
]
Three−strut fibre model
Two−strut fibre model
Figure 4.13: RRUC side lengths parallel (top) and perpendicular (bottom) to thestreamwise direction as a function of compression induced porosity. (Spesific non-linearrelationship between e and ϵ.)
68
Stellenbosch University http://scholar.sun.ac.za
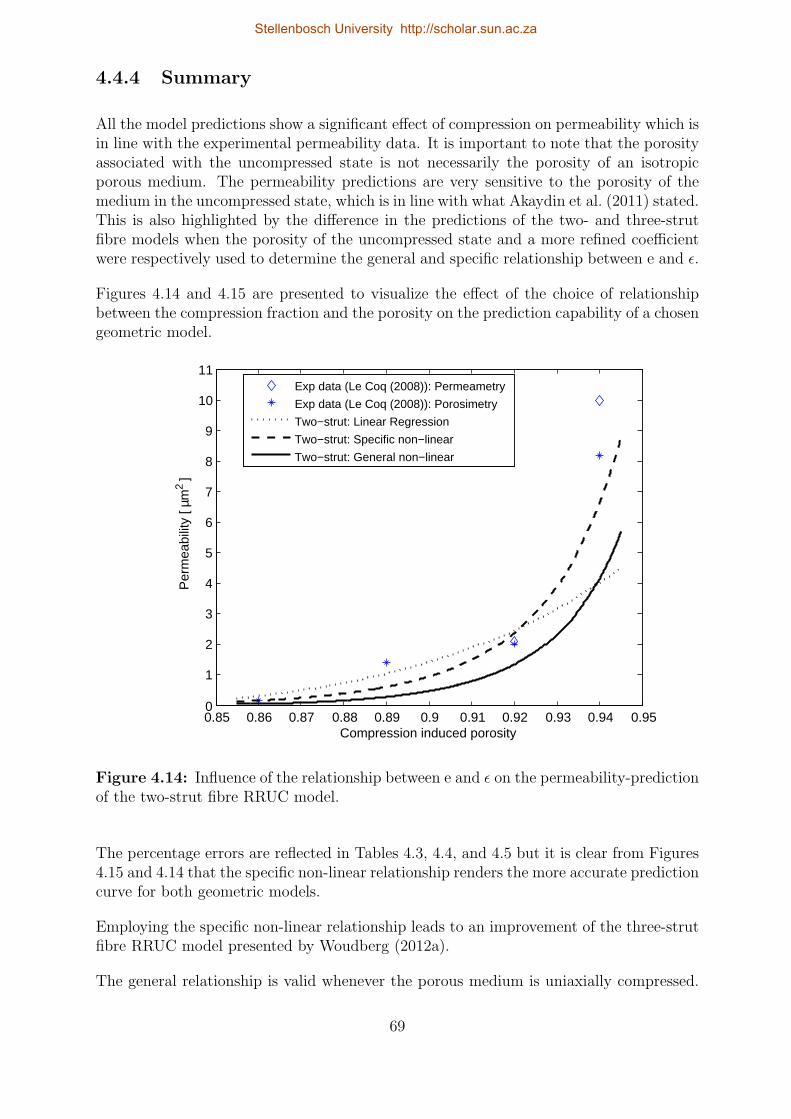
4.4.4 Summary
All the model predictions show a significant effect of compression on permeability which isin line with the experimental permeability data. It is important to note that the porosityassociated with the uncompressed state is not necessarily the porosity of an isotropicporous medium. The permeability predictions are very sensitive to the porosity of themedium in the uncompressed state, which is in line with what Akaydin et al. (2011) stated.This is also highlighted by the difference in the predictions of the two- and three-strutfibre models when the porosity of the uncompressed state and a more refined coefficientwere respectively used to determine the general and specific relationship between e and ϵ.
Figures 4.14 and 4.15 are presented to visualize the effect of the choice of relationshipbetween the compression fraction and the porosity on the prediction capability of a chosengeometric model.
0.85 0.86 0.87 0.88 0.89 0.9 0.91 0.92 0.93 0.94 0.950
1
2
3
4
5
6
7
8
9
10
11
Compression induced porosity
Per
mea
bilit
y [ µ
m2 ]
Exp data (Le Coq (2008)): Permeametry
Exp data (Le Coq (2008)): Porosimetry
Two−strut: Linear Regression
Two−strut: Specific non−linear
Two−strut: General non−linear
Figure 4.14: Influence of the relationship between e and ϵ on the permeability-predictionof the two-strut fibre RRUC model.
The percentage errors are reflected in Tables 4.3, 4.4, and 4.5 but it is clear from Figures4.15 and 4.14 that the specific non-linear relationship renders the more accurate predictioncurve for both geometric models.
Employing the specific non-linear relationship leads to an improvement of the three-strutfibre RRUC model presented by Woudberg (2012a).
The general relationship is valid whenever the porous medium is uniaxially compressed.
69
Stellenbosch University http://scholar.sun.ac.za
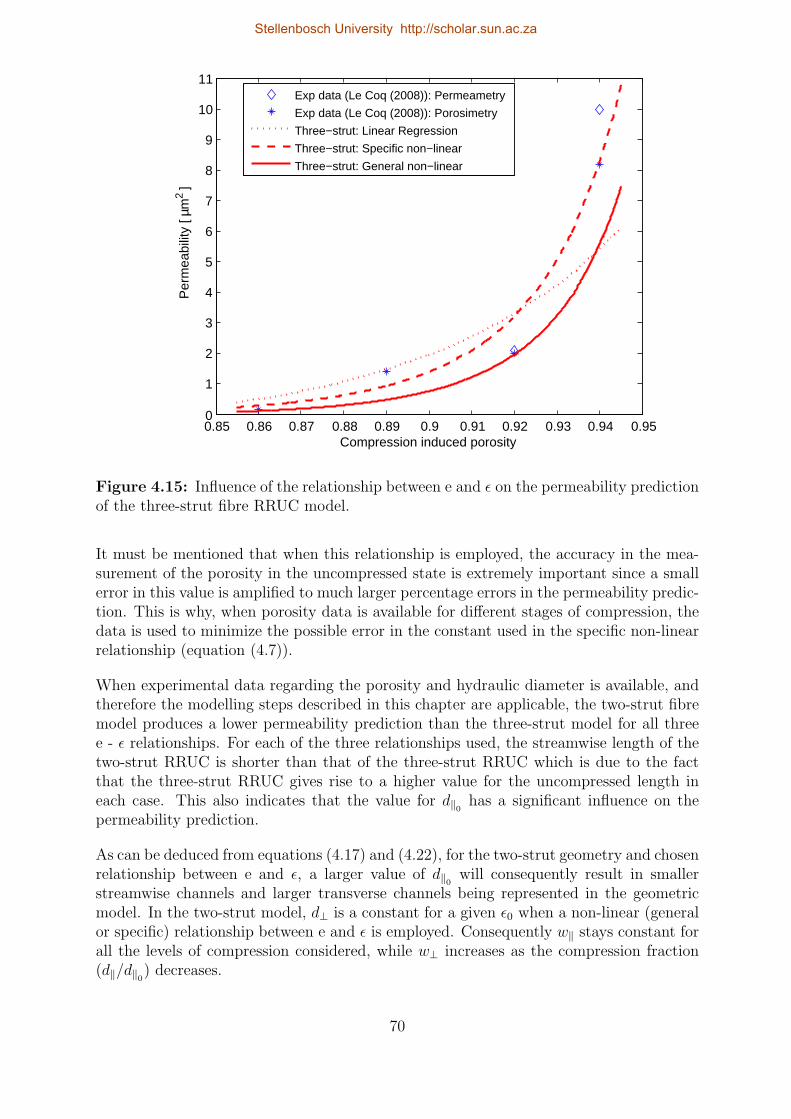
0.85 0.86 0.87 0.88 0.89 0.9 0.91 0.92 0.93 0.94 0.950
1
2
3
4
5
6
7
8
9
10
11
Compression induced porosity
Per
mea
bilit
y [ µ
m2 ]
Exp data (Le Coq (2008)): Permeametry
Exp data (Le Coq (2008)): Porosimetry
Three−strut: Linear Regression
Three−strut: Specific non−linear
Three−strut: General non−linear
Figure 4.15: Influence of the relationship between e and ϵ on the permeability predictionof the three-strut fibre RRUC model.
It must be mentioned that when this relationship is employed, the accuracy in the mea-surement of the porosity in the uncompressed state is extremely important since a smallerror in this value is amplified to much larger percentage errors in the permeability predic-tion. This is why, when porosity data is available for different stages of compression, thedata is used to minimize the possible error in the constant used in the specific non-linearrelationship (equation (4.7)).
When experimental data regarding the porosity and hydraulic diameter is available, andtherefore the modelling steps described in this chapter are applicable, the two-strut fibremodel produces a lower permeability prediction than the three-strut model for all threee - ϵ relationships. For each of the three relationships used, the streamwise length of thetwo-strut RRUC is shorter than that of the three-strut RRUC which is due to the factthat the three-strut RRUC gives rise to a higher value for the uncompressed length ineach case. This also indicates that the value for d∥0 has a significant influence on thepermeability prediction.
As can be deduced from equations (4.17) and (4.22), for the two-strut geometry and chosenrelationship between e and ϵ, a larger value of d∥0 will consequently result in smallerstreamwise channels and larger transverse channels being represented in the geometricmodel. In the two-strut model, d⊥ is a constant for a given ϵ0 when a non-linear (generalor specific) relationship between e and ϵ is employed. Consequently w∥ stays constant forall the levels of compression considered, while w⊥ increases as the compression fraction(d∥/d∥0) decreases.
70
Stellenbosch University http://scholar.sun.ac.za
Since the hydraulic diameter was employed to determine d∥0 , the underlying assumptionsand corresponding formulas used for the hydraulic diameter in the modelling as well asexperimental procedures will influence the margin of difference between the analyticalmodel predictions and the experimentally obtained data.
In the modelling steps, the experimental values for the hydraulic diameter were employedto obtain initial values for d⊥ with which d∥0 was calculated using the experimental datapertaining to the porosity and corresponding compression fraction. The obtained valuefor d∥0 was then employed to determine the side lengths of the RRUC for each levelof compression in order to predict the corresponding permeability. An alternative toemploying the hydraulic diameter for determining d∥0 will be investigated in Section 5.3,referring only to the two-strut fibre RRUC introduced in this study.
The constant value for d⊥ in the two-strut model (with a non-linear relationship between eand ϵ) has, as consequence, the fact that the hydraulic diameter is constant for all phasesof compression in this model. In the three-strut fibre RRUC model the hydraulic diameterdoes change with compression. The hydraulic diameter will be revisited in Section 5.2.
The comparison done between the two-strut and three-strut models for each of the threedifferent relationships, highlights the fact that the prediction capability of the models arealso influenced by the choice of geometry for the RRUC solid. The visualization of thiseffect in Figures 4.4, 4.5, 4.6, 4.9, 4.10 and 4.13, comparing the dimensions of the RRUCs,emphasize this influence. It is therefore evident that the solid geometry which determinesthe expression for porosity, is a crucial factor influencing the other dimensions of theRRUC. In Chapter 5, this will be investigated further, referring only to the two-strutfibre model.
71
Stellenbosch University http://scholar.sun.ac.za
Chapter 5
Modified two-strut fibre RRUCmodel
The porosity is an indicator of the volume available for flow in a porous medium. Asis evident from Chapter 4, the porosity can be modelled with the aid of different solidgeometries. When the porous medium is compressed, not only does the volume availablefor flow decreases, but the geometry of this volume changes. In modelling the effect ofcompression on the permeability of a porous medium, special attention must be givento the effect of change of solid geometry on the prediction capability of a model. It ispossible that one type of geometry is a better representation of the morphology of themedium than another geometry. To investigate this, the experimental data of Le Coq(2008), presented in Table 3.2, as well as the two-strut model, will be used throughoutthis chapter. An alternative strategy for obtaining the value of d∥0 will also be presented.
5.1 Solid-change in the two-strut fibre RRUC
In general the availability of porosity data at different stages of compression will influencethe choice of relationship between the compression fraction and porosity to be used. Sinceexperimental porosity data for different compressed states of the porous medium in ques-tion is available (through mercury porosimetry), the optimal option for the relationshipbetween e and ϵ in this context, is the specific relationship given by equation (4.8), asdiscussed in Chapter 4. The specific relationship will therefore be used through-out thissection in order to determine the effect of solid-geometry on permeability prediction.
In the two-strut RRUC model the cross-sectional area (parallel to streamwise direction)of the solid part, was chosen as (ds)
2, with ds set equal to the mean average diameter ofthe fibres in question. This implies that the compression had no effect on the distributionof solids in the two-strut RRUC model. The change in porosity due to compression wasreflected by a change in the volume available for fluid flow.
The RRUC is a representation of the geometry (morphology) of the porous medium inquestion and the aim is to enhance this representation. This can be investigated by
72
Stellenbosch University http://scholar.sun.ac.za
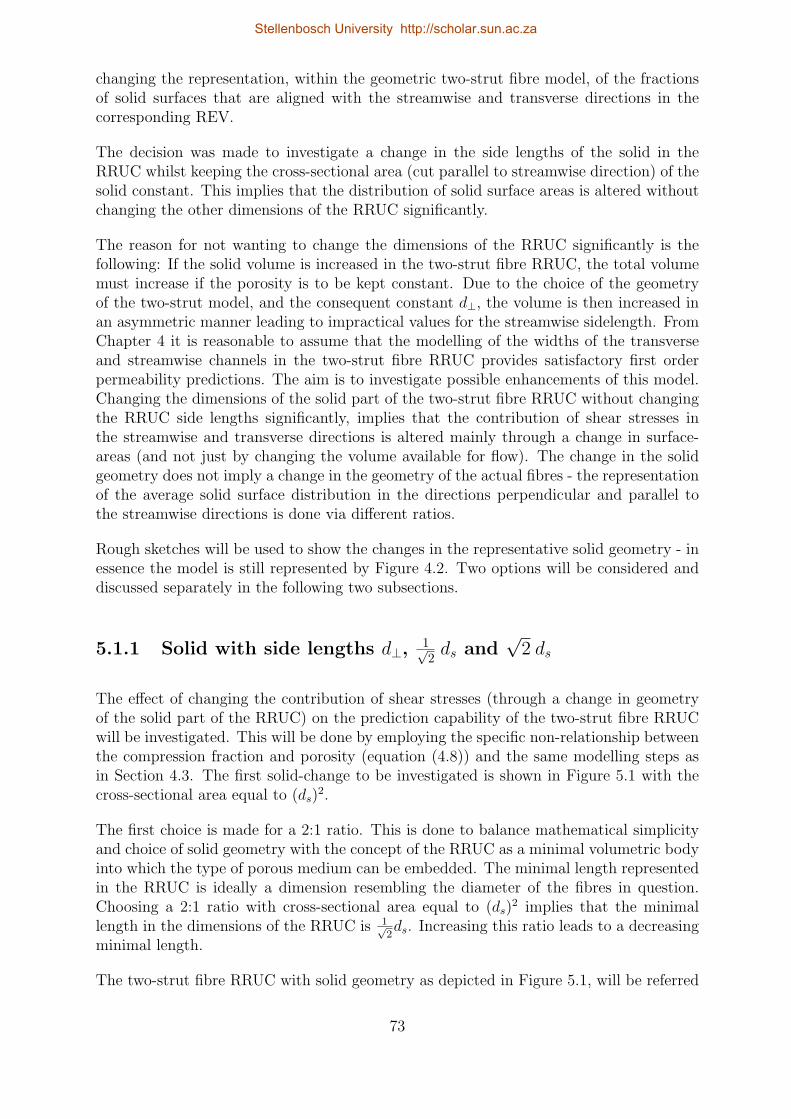
changing the representation, within the geometric two-strut fibre model, of the fractionsof solid surfaces that are aligned with the streamwise and transverse directions in thecorresponding REV.
The decision was made to investigate a change in the side lengths of the solid in theRRUC whilst keeping the cross-sectional area (cut parallel to streamwise direction) of thesolid constant. This implies that the distribution of solid surface areas is altered withoutchanging the other dimensions of the RRUC significantly.
The reason for not wanting to change the dimensions of the RRUC significantly is thefollowing: If the solid volume is increased in the two-strut fibre RRUC, the total volumemust increase if the porosity is to be kept constant. Due to the choice of the geometryof the two-strut model, and the consequent constant d⊥, the volume is then increased inan asymmetric manner leading to impractical values for the streamwise sidelength. FromChapter 4 it is reasonable to assume that the modelling of the widths of the transverseand streamwise channels in the two-strut fibre RRUC provides satisfactory first orderpermeability predictions. The aim is to investigate possible enhancements of this model.Changing the dimensions of the solid part of the two-strut fibre RRUC without changingthe RRUC side lengths significantly, implies that the contribution of shear stresses inthe streamwise and transverse directions is altered mainly through a change in surface-areas (and not just by changing the volume available for flow). The change in the solidgeometry does not imply a change in the geometry of the actual fibres - the representationof the average solid surface distribution in the directions perpendicular and parallel tothe streamwise directions is done via different ratios.
Rough sketches will be used to show the changes in the representative solid geometry - inessence the model is still represented by Figure 4.2. Two options will be considered anddiscussed separately in the following two subsections.
5.1.1 Solid with side lengths d⊥,1√2ds and
√2 ds
The effect of changing the contribution of shear stresses (through a change in geometryof the solid part of the RRUC) on the prediction capability of the two-strut fibre RRUCwill be investigated. This will be done by employing the specific non-relationship betweenthe compression fraction and porosity (equation (4.8)) and the same modelling steps asin Section 4.3. The first solid-change to be investigated is shown in Figure 5.1 with thecross-sectional area equal to (ds)
2.
The first choice is made for a 2:1 ratio. This is done to balance mathematical simplicityand choice of solid geometry with the concept of the RRUC as a minimal volumetric bodyinto which the type of porous medium can be embedded. The minimal length representedin the RRUC is ideally a dimension resembling the diameter of the fibres in question.Choosing a 2:1 ratio with cross-sectional area equal to (ds)
2 implies that the minimallength in the dimensions of the RRUC is 1√
2ds. Increasing this ratio leads to a decreasing
minimal length.
The two-strut fibre RRUC with solid geometry as depicted in Figure 5.1, will be referred
73
Stellenbosch University http://scholar.sun.ac.za
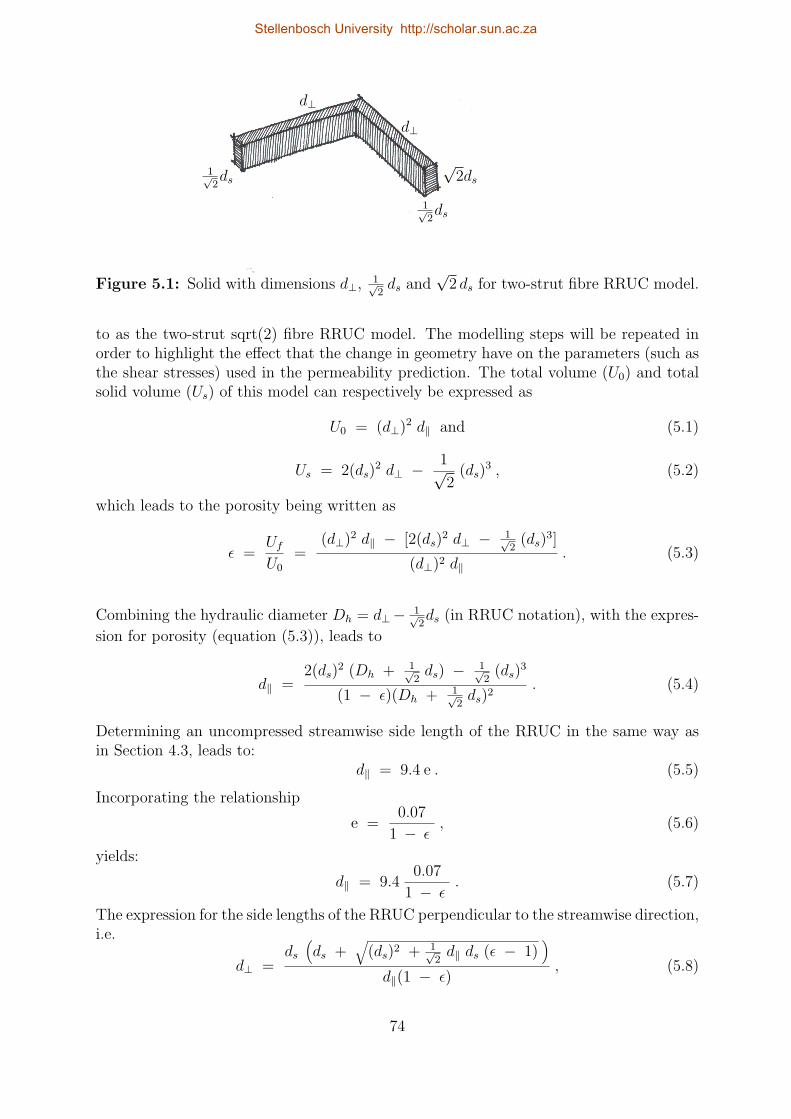
1√2ds
d⊥
d⊥
1√2ds
√2ds
Figure 5.1: Solid with dimensions d⊥, 1√2ds and
√2 ds for two-strut fibre RRUC model.
to as the two-strut sqrt(2) fibre RRUC model. The modelling steps will be repeated inorder to highlight the effect that the change in geometry have on the parameters (such asthe shear stresses) used in the permeability prediction. The total volume (U0) and totalsolid volume (Us) of this model can respectively be expressed as
U0 = (d⊥)2 d∥ and (5.1)
Us = 2(ds)2 d⊥ − 1√
2(ds)
3 , (5.2)
which leads to the porosity being written as
ϵ =Uf
U0
=(d⊥)2 d∥ − [2(ds)
2 d⊥ − 1√2
(ds)3]
(d⊥)2 d∥. (5.3)
Combining the hydraulic diameter Dh = d⊥− 1√2ds (in RRUC notation), with the expres-
sion for porosity (equation (5.3)), leads to
d∥ =2(ds)
2 (Dh + 1√2ds) − 1√
2(ds)
3
(1 − ϵ)(Dh + 1√2ds)2
. (5.4)
Determining an uncompressed streamwise side length of the RRUC in the same way asin Section 4.3, leads to:
d∥ = 9.4 e . (5.5)
Incorporating the relationship
e =0.07
1 − ϵ, (5.6)
yields:
d∥ = 9.40.07
1 − ϵ. (5.7)
The expression for the side lengths of the RRUC perpendicular to the streamwise direction,i.e.
d⊥ =ds(ds +
√(ds)2 + 1√
2d∥ ds (ϵ − 1)
)d∥(1 − ϵ)
, (5.8)
74
Stellenbosch University http://scholar.sun.ac.za
can thus be written as:
d⊥ =ds(ds +
√(ds)2 − ( 1√
2) (9.4) (0.07) ds
)(9.4) (0.07)
. (5.9)
The constant values are not multiplied in order to keep the assumptions explicit.
Under the same assumptions as in Section 4.3, the magnitudes of the velocities can re-spectively be expressed as
w∥ =q (d⊥)2
(d⊥ − 1√2ds)2
, (5.10)
and
w⊥ =
q (d⊥)2
(d⊥ − 1√2ds)2
(d⊥ − 1√2ds)
2
(d∥ −√
2 ds) (d⊥)
=q d⊥
(d∥ −√
2 ds). (5.11)
Again it is assumed that, for dynamic equilibrium, the shear stresses can be utilized toapproximate the pressure loss in a porous medium and that the formulas associated withparallel plates may be employed. In terms of the dimensions of the two-strut sqrt(2) fibreRRUC with the solid as in Figure 5.1, the assumptions lead to:(
d⊥ − ds√2
)2
∆p =
[4√
2 ds (d⊥ − ds√2
)
]τw∥ +
[4ds√
2(d⊥ − ds√
2) + (ds)
2
]τw⊥ ,
(5.12)
with
τw∥ =6 µ w∥
d⊥ − 1√2ds
and τw⊥ =6 µ w⊥
d∥ −√
2 ds. (5.13)
Therefore: (d⊥ − ds√
2
)2
∆p =[4√
2 ds]
6 µ w∥ +[2√
2 ds d⊥ − (ds)2] 6 µ w⊥
d∥ −√
2 ds
∆p =[4√
2 ds] 6 µ q (d⊥)2
(d⊥ − 1√2ds)4
+[2√
2 ds d⊥ − (ds)2] 6 µ q d⊥
(d∥ −√
2 ds)2(d⊥ − 1√
2ds)2
∆p =6 µ q
[4√
2 ds (d⊥)2 (d∥ −√
2 ds)2 +
(2√
2 ds (d⊥)2 − (ds)2 d⊥
) (d⊥ − 1√
2ds)2]
(d∥ −√
2 ds)2(d⊥ − 1√
2ds)4
(5.14)
As previously, based on the assumptions expressed in equation (4.32), the permeabilityin this context can be written as:
k =d∥ (d∥ −
√2 ds)
2(d⊥ − 1√
2ds)4
24√
2 ds (d⊥)2 (d∥ −√
2 ds)2 + 6(2√
2 ds (d⊥)2 − (ds)2 d⊥) (d⊥ − 1√
2ds)2 .
(5.15)
75
Stellenbosch University http://scholar.sun.ac.za
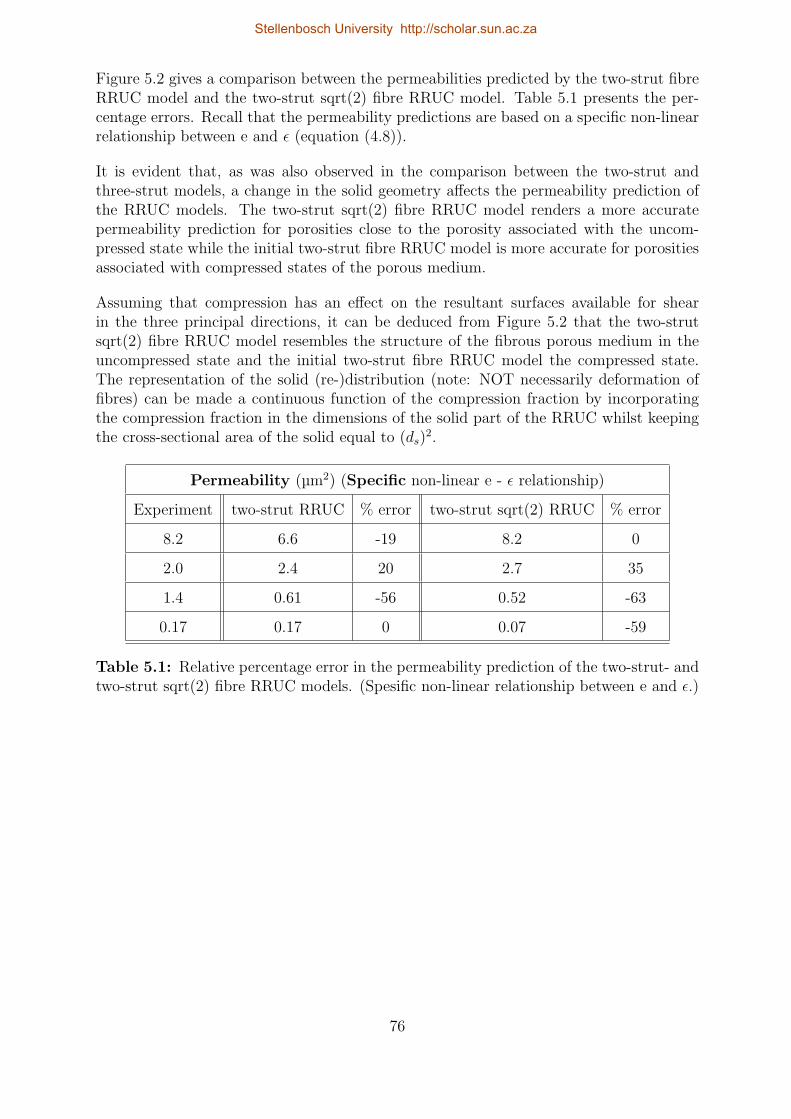
Figure 5.2 gives a comparison between the permeabilities predicted by the two-strut fibreRRUC model and the two-strut sqrt(2) fibre RRUC model. Table 5.1 presents the per-centage errors. Recall that the permeability predictions are based on a specific non-linearrelationship between e and ϵ (equation (4.8)).
It is evident that, as was also observed in the comparison between the two-strut andthree-strut models, a change in the solid geometry affects the permeability prediction ofthe RRUC models. The two-strut sqrt(2) fibre RRUC model renders a more accuratepermeability prediction for porosities close to the porosity associated with the uncom-pressed state while the initial two-strut fibre RRUC model is more accurate for porositiesassociated with compressed states of the porous medium.
Assuming that compression has an effect on the resultant surfaces available for shearin the three principal directions, it can be deduced from Figure 5.2 that the two-strutsqrt(2) fibre RRUC model resembles the structure of the fibrous porous medium in theuncompressed state and the initial two-strut fibre RRUC model the compressed state.The representation of the solid (re-)distribution (note: NOT necessarily deformation offibres) can be made a continuous function of the compression fraction by incorporatingthe compression fraction in the dimensions of the solid part of the RRUC whilst keepingthe cross-sectional area of the solid equal to (ds)
2.
Permeability (µm2) (Specific non-linear e - ϵ relationship)
Experiment two-strut RRUC % error two-strut sqrt(2) RRUC % error
8.2 6.6 -19 8.2 0
2.0 2.4 20 2.7 35
1.4 0.61 -56 0.52 -63
0.17 0.17 0 0.07 -59
Table 5.1: Relative percentage error in the permeability prediction of the two-strut- andtwo-strut sqrt(2) fibre RRUC models. (Spesific non-linear relationship between e and ϵ.)
76
Stellenbosch University http://scholar.sun.ac.za
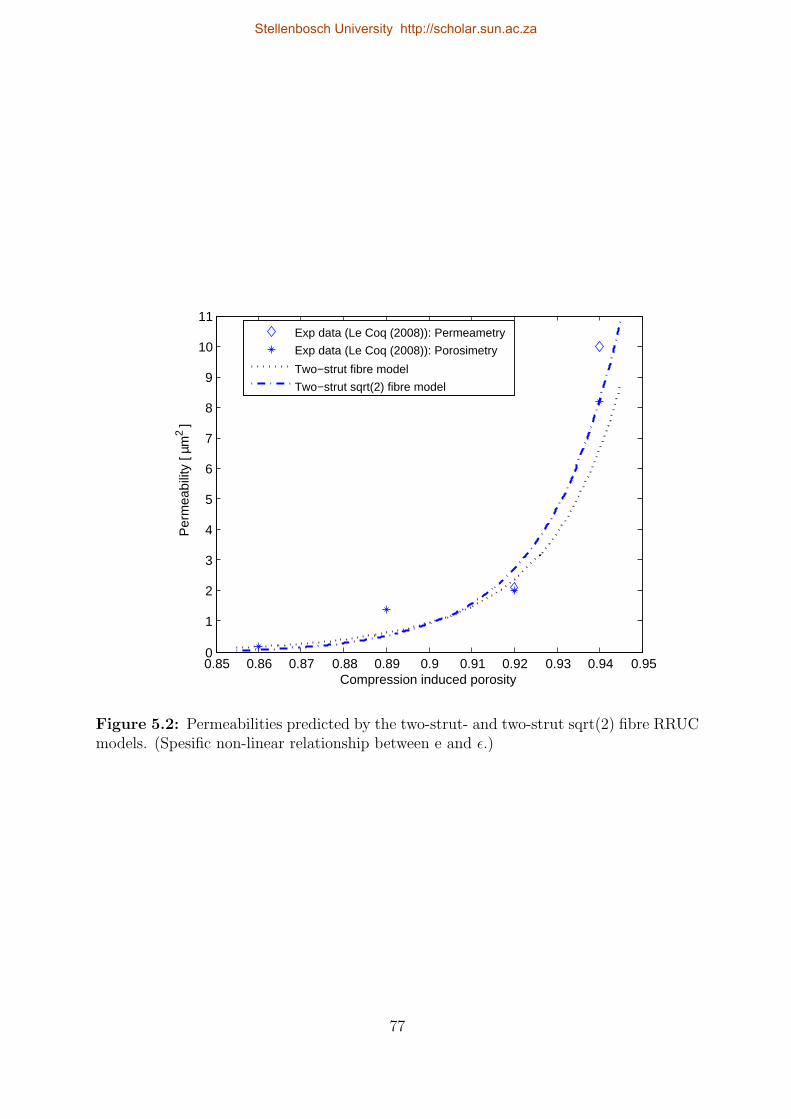
0.85 0.86 0.87 0.88 0.89 0.9 0.91 0.92 0.93 0.94 0.950
1
2
3
4
5
6
7
8
9
10
11
Compression induced porosity
Per
mea
bilit
y [ µ
m2 ]
Exp data (Le Coq (2008)): Permeametry
Exp data (Le Coq (2008)): Porosimetry
Two−strut fibre model
Two−strut sqrt(2) fibre model
Figure 5.2: Permeabilities predicted by the two-strut- and two-strut sqrt(2) fibre RRUCmodels. (Spesific non-linear relationship between e and ϵ.)
77
Stellenbosch University http://scholar.sun.ac.za
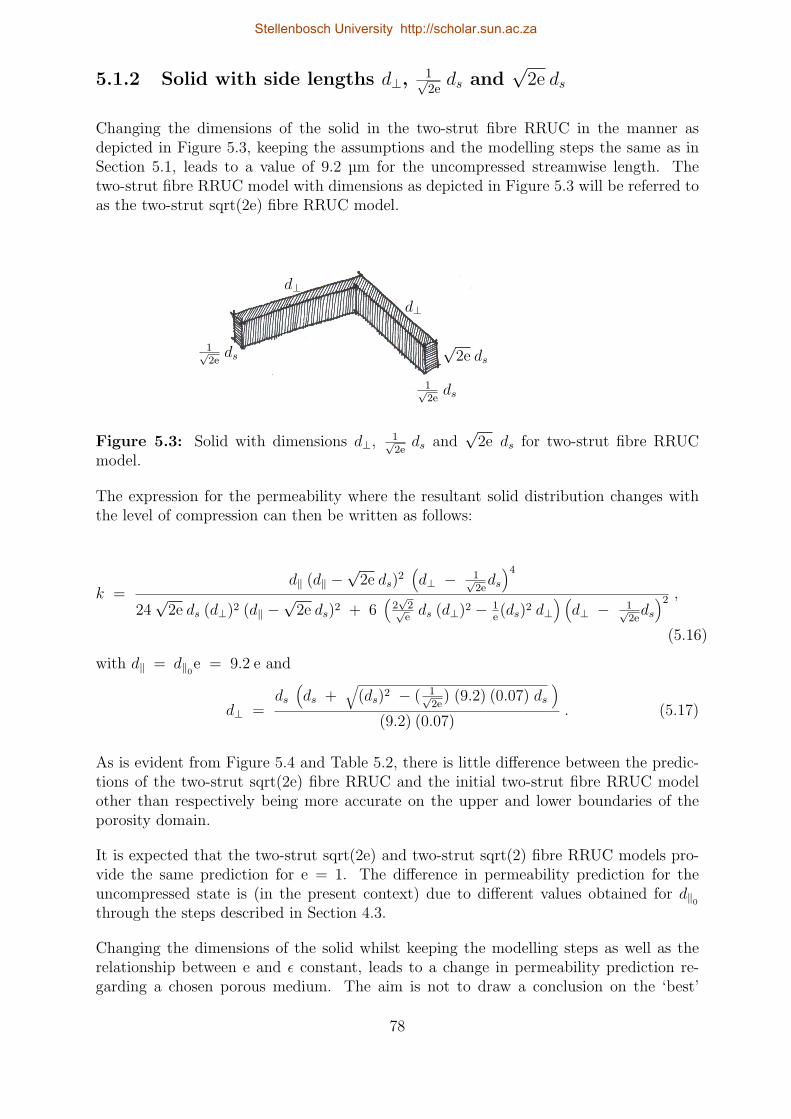
5.1.2 Solid with side lengths d⊥,1√2eds and
√2e ds
Changing the dimensions of the solid in the two-strut fibre RRUC in the manner asdepicted in Figure 5.3, keeping the assumptions and the modelling steps the same as inSection 5.1, leads to a value of 9.2 µm for the uncompressed streamwise length. Thetwo-strut fibre RRUC model with dimensions as depicted in Figure 5.3 will be referred toas the two-strut sqrt(2e) fibre RRUC model.
1√2eds
d⊥
d⊥
1√2eds
√2e ds
Figure 5.3: Solid with dimensions d⊥, 1√2eds and
√2e ds for two-strut fibre RRUC
model.
The expression for the permeability where the resultant solid distribution changes withthe level of compression can then be written as follows:
k =d∥ (d∥ −
√2e ds)
2(d⊥ − 1√
2eds)4
24√
2e ds (d⊥)2 (d∥ −√
2e ds)2 + 6(2√2√eds (d⊥)2 − 1
e(ds)2 d⊥
) (d⊥ − 1√
2eds)2 ,
(5.16)
with d∥ = d∥0e = 9.2 e and
d⊥ =ds(ds +
√(ds)2 − ( 1√
2e) (9.2) (0.07) ds
)(9.2) (0.07)
. (5.17)
As is evident from Figure 5.4 and Table 5.2, there is little difference between the predic-tions of the two-strut sqrt(2e) fibre RRUC and the initial two-strut fibre RRUC modelother than respectively being more accurate on the upper and lower boundaries of theporosity domain.
It is expected that the two-strut sqrt(2e) and two-strut sqrt(2) fibre RRUC models pro-vide the same prediction for e = 1. The difference in permeability prediction for theuncompressed state is (in the present context) due to different values obtained for d∥0through the steps described in Section 4.3.
Changing the dimensions of the solid whilst keeping the modelling steps as well as therelationship between e and ϵ constant, leads to a change in permeability prediction re-garding a chosen porous medium. The aim is not to draw a conclusion on the ‘best’
78
Stellenbosch University http://scholar.sun.ac.za
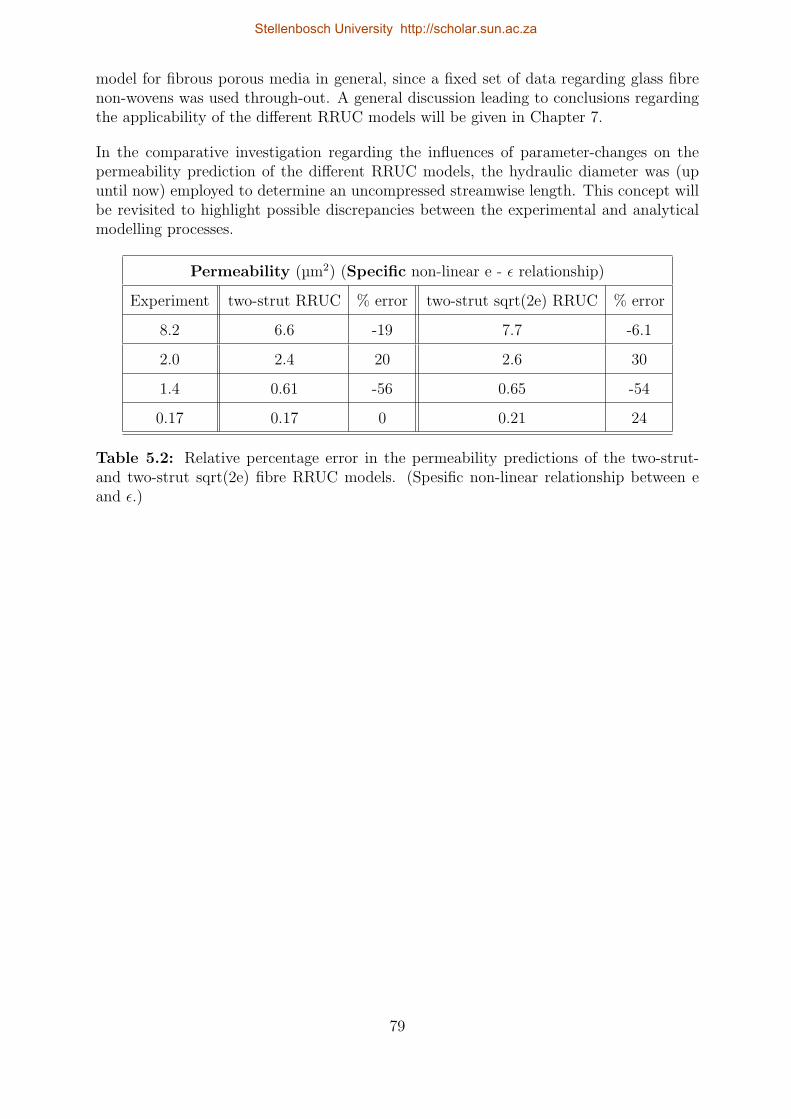
model for fibrous porous media in general, since a fixed set of data regarding glass fibrenon-wovens was used through-out. A general discussion leading to conclusions regardingthe applicability of the different RRUC models will be given in Chapter 7.
In the comparative investigation regarding the influences of parameter-changes on thepermeability prediction of the different RRUC models, the hydraulic diameter was (upuntil now) employed to determine an uncompressed streamwise length. This concept willbe revisited to highlight possible discrepancies between the experimental and analyticalmodelling processes.
Permeability (µm2) (Specific non-linear e - ϵ relationship)
Experiment two-strut RRUC % error two-strut sqrt(2e) RRUC % error
8.2 6.6 -19 7.7 -6.1
2.0 2.4 20 2.6 30
1.4 0.61 -56 0.65 -54
0.17 0.17 0 0.21 24
Table 5.2: Relative percentage error in the permeability predictions of the two-strut-and two-strut sqrt(2e) fibre RRUC models. (Spesific non-linear relationship between eand ϵ.)
79
Stellenbosch University http://scholar.sun.ac.za
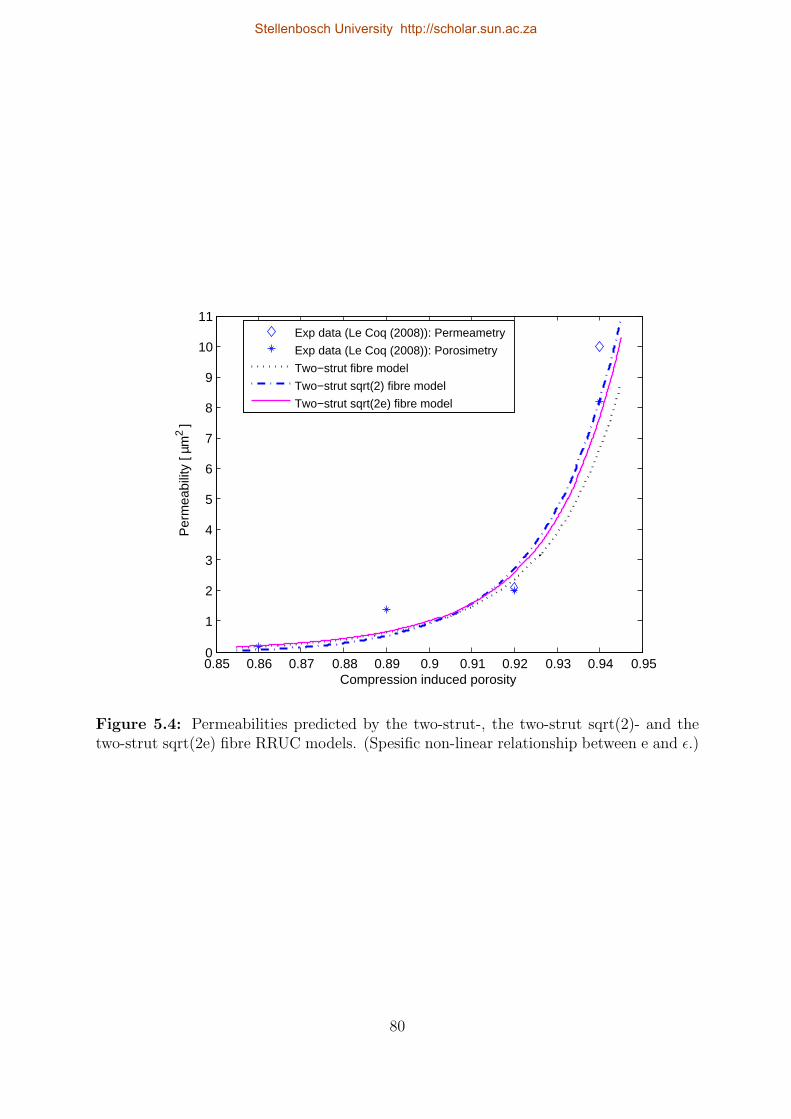
0.85 0.86 0.87 0.88 0.89 0.9 0.91 0.92 0.93 0.94 0.950
1
2
3
4
5
6
7
8
9
10
11
Compression induced porosity
Per
mea
bilit
y [ µ
m2 ]
Exp data (Le Coq (2008)): Permeametry
Exp data (Le Coq (2008)): Porosimetry
Two−strut fibre model
Two−strut sqrt(2) fibre model
Two−strut sqrt(2e) fibre model
Figure 5.4: Permeabilities predicted by the two-strut-, the two-strut sqrt(2)- and thetwo-strut sqrt(2e) fibre RRUC models. (Spesific non-linear relationship between e and ϵ.)
80
Stellenbosch University http://scholar.sun.ac.za
5.2 The choice of hydraulic diameter revisited
Since the hydraulic diameter forms an essential part of the modelling process, the choicethere-of should be a subject of reflection. For flow in a fully filled circular pipe of constantcross-sectional area, the pressure loss per unit length can be written as the average (if thewall surface is not uniform) wall shear stress multiplied by the ratio of the circumferenceto the cross-sectional area of the pipe. In this case the latter ratio is equal to four dividedby the diameter of the pipe. For fully filled non-circular pipes of constant cross-sectionalarea, the above mentioned equality leads to the definition of the hydraulic diameter:
Dh = 4
(cross−sectional area
perimeter
). (5.18)
This means that a non-circular pipe can be replaced with a circular pipe with diameterDh for the same pressure loss per unit length.
The hydraulic diameter is often used as characteristic length when considering flow innon-circular tubes and channels. For example, assuming flow in a straight duct, Shah &London (1978) express the Reynolds number in terms of the hydraulic diameter.
It is clear that when the numerator and denominator in equation (5.18) are both multipliedwith a constant cross-sectional length, the definition becomes:
Dh = 4
(total fluid volume
wetted surface area
), (5.19)
which is the formula used in the context of porous media (although the channels/poresin general do not have a constant cross-sectional area).
Since pore size distributions are often employed in obtaining values for the hydraulicdiameter, it is important to clarify that the definition of pore size depends on the appli-cation of the porous medium in question. As previously mentioned, in liquid porosimetry,a pore is assumed to be a cylindrical capillary with its diameter calculated through themeasurement of the pressure required to intrude (or extract) a non-wetting (or wetting)fluid into (from) the porous medium. This concept of pore-size is often used to char-acterize unsaturated media where two immiscible fluids simultaneously occupy the voidspaces in the porous medium. When, however, the porous medium is applied in a filteringprocess (e.g. removing solid particles from a liquid), the pore size definition is based onthe size of the particles that can traverse through the medium without getting trapped.In the case of a saturated fibrous porous medium (as assumed in the present analyticalmodelling process), the pore size depends only on the internal structure of the materialwhile in porosimetry it also depends on the paths with which the different void spacescan be accessed (Jaganathan et al. (2009)).
According to Le Coq (2008) the fibrous media used in the characterization process showa pore size gradient in the thickness, although in the case of the 100% 2.7 µm samples(of which the data was employed in this study) only a slight pore gradient was recorded.Jaganathan et al. (2009) states that most of the theoretical pore size distribution modelsare obtained for homogenous structures and could not be applied in predicting the pore
81
Stellenbosch University http://scholar.sun.ac.za
size distribution of a typical hydro-entangled fabric since there is a SVF gradient in thethickness direction. By increasing the compression, the porous medium tends to becomemore uniform in this regard.
Based on an image analysis technique, known as the full-morphology method, Jaganathanet al. (2009) obtained a geometric pore size distribution via a modified full-morphologyalgorithm. This approach is based on the assumption that all pores are spherical andthat a continuous void domain can be approximated by a number of discrete sphericalvolumes. It was concluded that the geometric pore size distribution narrows and the tailof the distribution reduces with increased compression.
It is therefore evident that the underlying assumptions are not always explicit and thatdiscrepancies between experimental and analytical results may be a consequence there-of.
In the context of the RRUC the hydraulic diameter is taken as the side length of the square(normal vector in the streamwise direction) associated with the smallest entrance to theRRUC in the streamwise direction. This is in line with the hydraulic diameter of a squareduct as well as with the notion of the average pore hydraulic diameter obtained throughmercury porosimetry (where the smallest opening towards a pore is measured). Thehydraulic diameter obtained through mercury porosimetry or image analysis representsthe average pore diameter in any direction. In line with previous RRUC models (discussedin Section 3.2) the choice is made to represent this average by equating it to the sidelengthof the square face of the RRUC that is associated with the smallest streamwise entranceto the RRUC.
The hydraulic diameter does not change in the two-strut (with cross-sectional area ds×ds)and the two-strut sqrt(2) ((
√2 ds) × ( 1√
2ds)) fibre models (with a non-linear relationship
between e and ϵ) since both d⊥ and ds are constant for a specific porous medium. Thetwo-strut sqrt(2e) fibre model, with the cross-sectional area given by (
√2e ds) × ( 1√
2eds)
(non-linear relationship between e and ϵ), reflects small changes in the hydraulic diametersince the compression fraction is incorporated into the dimensions of the solid in theRRUC. The constant hydraulic diameter of the two-strut- and two-strut sqrt(2) fibremodels should be seen as an average of the experimentally obtained hydraulic diametersassociated with each level of compression.
As can be seen from experimental data, e.g. Le Coq (2008), it is possible that the percent-age change in permeability is much more profound than the change in hydraulic diameter.The change in hydraulic diameter and porosity are not proportional to the change in per-meability. The manner in which the hydraulic diameter is experimentally obtained canobscure the actual change in the geometry of the porous medium. If, due to compression,the pore-size of the smaller pores decrease, it doesn’t reflect in the average pore hydraulicdiameter or in the porosity with the same significance as in the permeability.
It is very important to note that the change in the solid geometry (two-strut sqrt(2e) fibreRRUC model) does not necessary imply fibre deformation. It reflects a change in soliddistribution in the corresponding REV due to compression and the ratios of solid surfacesin different directions are reflected by a change in solid in the RRUC. The fibre diameteris chosen as the fixed length relative to which the rest of the dimensions are scaled torepresent the averages of the corresponding REV in the RRUC.
82
Stellenbosch University http://scholar.sun.ac.za
As mentioned by Woudberg (2012a), the anisotropic foam (and fibre) RRUC model(s)distinguishes between the hydraulic diameter associated with the streamwise and trans-verse directions. Since the hydraulic diameter presented by Le Coq (2008) represents thestreamwise and transverse pores, there could be a discrepancy between the experimentalvalues and the choice of a ‘streamwise’ hydraulic diameter for the two-strut fibre RRUCmodel. Based on the original concept of the hydraulic diameter, an average of streamwiseand transverse hydraulic diameters is not meaningful. In the two-strut fibre RRUC con-text the choice of hydraulic diameter is associated with streamwise flow, being aware thatthis choice influences the percentage error of the permeability predictions of this model.
It is clear that the difference between the permeability prediction of the analytical model(s)and the permeability values presented by Le Coq (2008) could be assigned to differencesin the application of the hydraulic diameter concept.
When experimental values for the hydraulic diameter are not available a different strategyfor obtaining d∥0 is necessary. This will be discussed in the next section.
5.3 Alternative method for determining d∥0
Referring to the two-strut fibre RRUC, as visualized in Figure 4.2, a different strategy fordetermining d∥0 will be introduced in this section (as opposed to employing the hydraulicdiameter).
This is important since porosity and hydraulic diameter data regarding one or morecompressed states of a fibrous porous medium are not necessarily available to characterizethe medium in question. Furthermore, if there is no available data with which to obtain alinear regression or specific non-linear relationship, only the general non-linear relationshipbetween the compression fraction and the porosity is applicable.
In the event that porosity data at different levels of compression were not obtained em-pirically, but calculated using equation (4.5), as was done by e.g. Akaydin et al. (2011),both the permeability as well as the porosity can be regarded as functions of the com-pression fraction. All the porosity values, each corresponding to a compression fraction,are dependent on the measured value of the porosity of the medium in the uncompressedstate:
ϵ =e − (1 − ϵ0)
e. (5.20)
For convenience, Figure 4.2 is duplicated in Figure 5.5 for the purpose of quick referencefor the reader. (For clarification: as discussed in Chapter 4, for the general non-linearrelationship between ϵ and e, the side length perpendicular to the streamwise direction,d⊥, has the same value for the uncompressed state as well as all phases of compression.)
Following the same modelling steps as in Section 4.3, apart from the method used to obtaina value for d∥0 , again leads to equation (4.33) as an expression of the permeability in termsof the dimensions of the two-strut fibre RRUC. The crucial choice of the dimensions ofthe RRUC is as previously discussed: The side length parallel to the streamwise direction
83
Stellenbosch University http://scholar.sun.ac.za
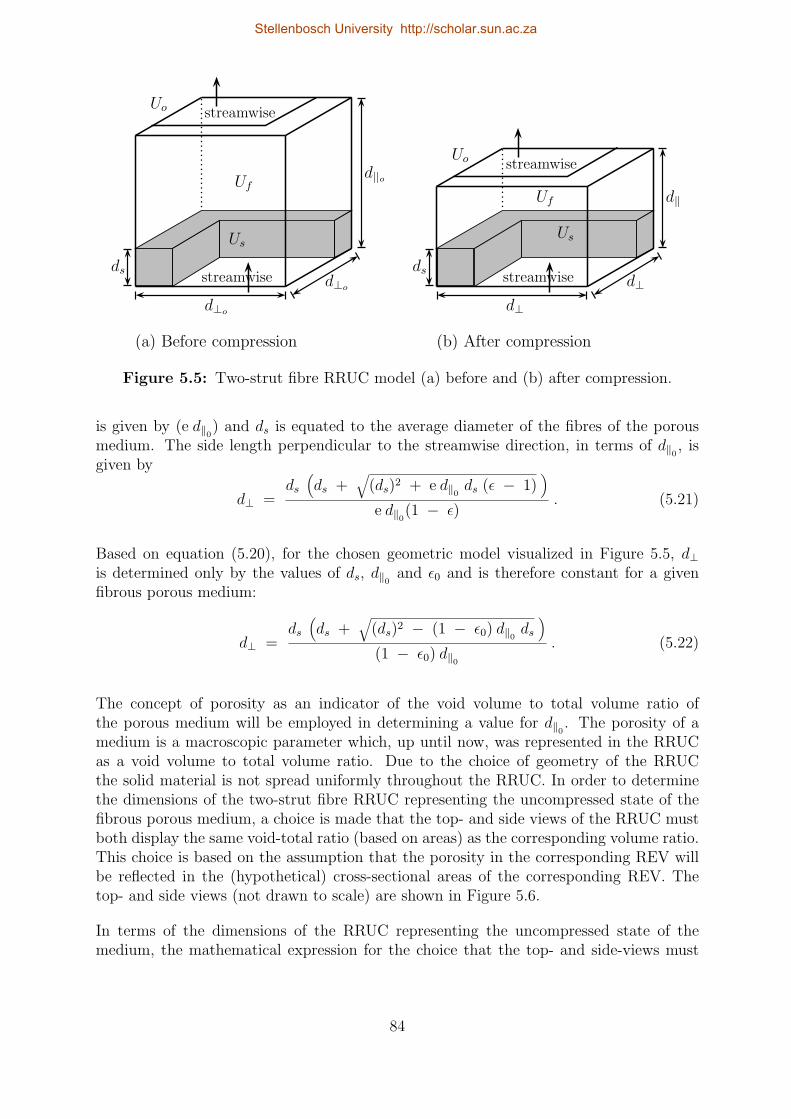
Uf
Uo
streamwise
streamwise
d⊥o
d||o
Us
d⊥o
ds
(a) Before compression
Uf
Uo
streamwise
streamwise
d⊥
d‖
Us
d⊥
ds
(b) After compression
Uf
Uo
streamwise
streamwise
d⊥o
d||o
Us
d⊥o
ds
(a) Before compression
Uf
Uo
streamwise
streamwise
d⊥
d‖
Us
d⊥
ds
(b) After compression
Figure 5.5: Two-strut fibre RRUC model (a) before and (b) after compression.
is given by (e d∥0) and ds is equated to the average diameter of the fibres of the porousmedium. The side length perpendicular to the streamwise direction, in terms of d∥0 , isgiven by
d⊥ =ds(ds +
√(ds)2 + e d∥0 ds (ϵ − 1)
)e d∥0(1 − ϵ)
. (5.21)
Based on equation (5.20), for the chosen geometric model visualized in Figure 5.5, d⊥is determined only by the values of ds, d∥0 and ϵ0 and is therefore constant for a givenfibrous porous medium:
d⊥ =ds(ds +
√(ds)2 − (1 − ϵ0) d∥0 ds
)(1 − ϵ0) d∥0
. (5.22)
The concept of porosity as an indicator of the void volume to total volume ratio ofthe porous medium will be employed in determining a value for d∥0 . The porosity of amedium is a macroscopic parameter which, up until now, was represented in the RRUCas a void volume to total volume ratio. Due to the choice of geometry of the RRUCthe solid material is not spread uniformly throughout the RRUC. In order to determinethe dimensions of the two-strut fibre RRUC representing the uncompressed state of thefibrous porous medium, a choice is made that the top- and side views of the RRUC mustboth display the same void-total ratio (based on areas) as the corresponding volume ratio.This choice is based on the assumption that the porosity in the corresponding REV willbe reflected in the (hypothetical) cross-sectional areas of the corresponding REV. Thetop- and side views (not drawn to scale) are shown in Figure 5.6.
In terms of the dimensions of the RRUC representing the uncompressed state of themedium, the mathematical expression for the choice that the top- and side-views must
84
Stellenbosch University http://scholar.sun.ac.za
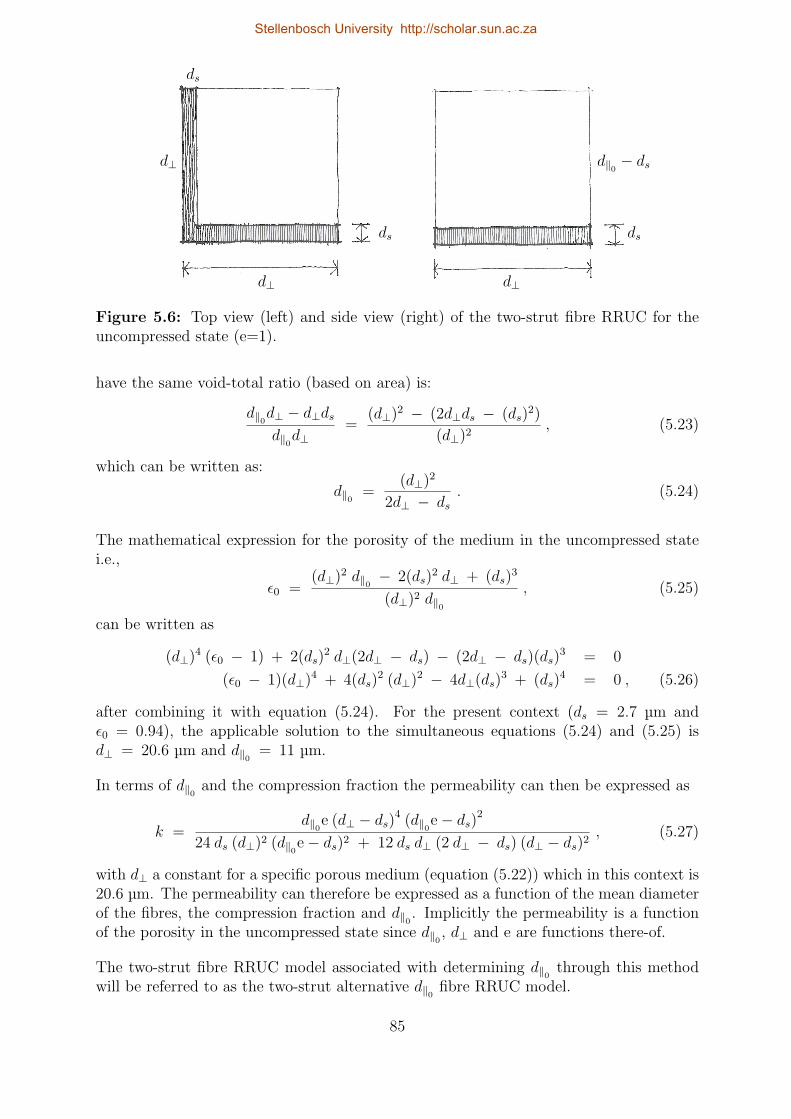
ds
d⊥
d⊥ d⊥
dsds
d∥0 − ds
Figure 5.6: Top view (left) and side view (right) of the two-strut fibre RRUC for theuncompressed state (e=1).
have the same void-total ratio (based on area) is:
d∥0d⊥ − d⊥ds
d∥0d⊥=
(d⊥)2 − (2d⊥ds − (ds)2)
(d⊥)2, (5.23)
which can be written as:
d∥0 =(d⊥)2
2d⊥ − ds. (5.24)
The mathematical expression for the porosity of the medium in the uncompressed statei.e.,
ϵ0 =(d⊥)2 d∥0 − 2(ds)
2 d⊥ + (ds)3
(d⊥)2 d∥0, (5.25)
can be written as
(d⊥)4 (ϵ0 − 1) + 2(ds)2 d⊥(2d⊥ − ds) − (2d⊥ − ds)(ds)
3 = 0
(ϵ0 − 1)(d⊥)4 + 4(ds)2 (d⊥)2 − 4d⊥(ds)
3 + (ds)4 = 0 , (5.26)
after combining it with equation (5.24). For the present context (ds = 2.7 µm andϵ0 = 0.94), the applicable solution to the simultaneous equations (5.24) and (5.25) isd⊥ = 20.6 µm and d∥0 = 11 µm.
In terms of d∥0 and the compression fraction the permeability can then be expressed as
k =d∥0e (d⊥ − ds)
4 (d∥0e − ds)2
24 ds (d⊥)2 (d∥0e − ds)2 + 12 ds d⊥ (2 d⊥ − ds) (d⊥ − ds)2, (5.27)
with d⊥ a constant for a specific porous medium (equation (5.22)) which in this context is20.6 µm. The permeability can therefore be expressed as a function of the mean diameterof the fibres, the compression fraction and d∥0 . Implicitly the permeability is a functionof the porosity in the uncompressed state since d∥0 , d⊥ and e are functions there-of.
The two-strut fibre RRUC model associated with determining d∥0 through this methodwill be referred to as the two-strut alternative d∥0 fibre RRUC model.
85
Stellenbosch University http://scholar.sun.ac.za
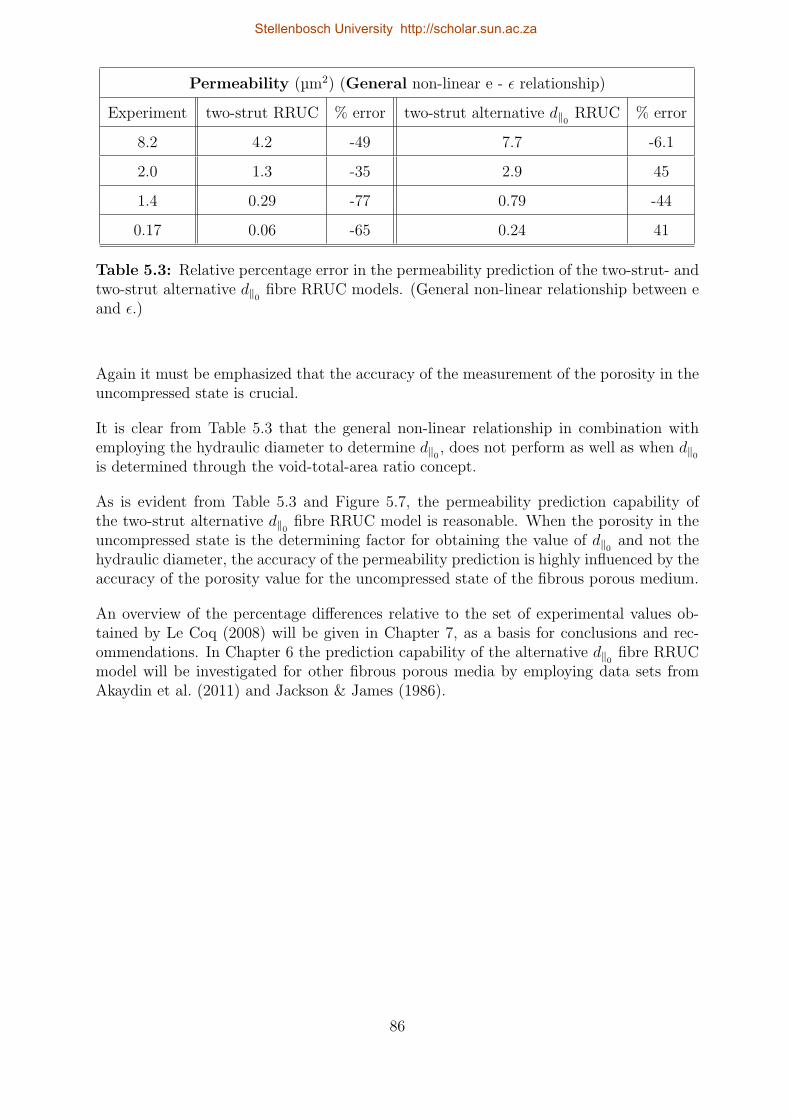
Permeability (µm2) (General non-linear e - ϵ relationship)
Experiment two-strut RRUC % error two-strut alternative d∥0 RRUC % error
8.2 4.2 -49 7.7 -6.1
2.0 1.3 -35 2.9 45
1.4 0.29 -77 0.79 -44
0.17 0.06 -65 0.24 41
Table 5.3: Relative percentage error in the permeability prediction of the two-strut- andtwo-strut alternative d∥0 fibre RRUC models. (General non-linear relationship between eand ϵ.)
Again it must be emphasized that the accuracy of the measurement of the porosity in theuncompressed state is crucial.
It is clear from Table 5.3 that the general non-linear relationship in combination withemploying the hydraulic diameter to determine d∥0 , does not perform as well as when d∥0is determined through the void-total-area ratio concept.
As is evident from Table 5.3 and Figure 5.7, the permeability prediction capability ofthe two-strut alternative d∥0 fibre RRUC model is reasonable. When the porosity in theuncompressed state is the determining factor for obtaining the value of d∥0 and not thehydraulic diameter, the accuracy of the permeability prediction is highly influenced by theaccuracy of the porosity value for the uncompressed state of the fibrous porous medium.
An overview of the percentage differences relative to the set of experimental values ob-tained by Le Coq (2008) will be given in Chapter 7, as a basis for conclusions and rec-ommendations. In Chapter 6 the prediction capability of the alternative d∥0 fibre RRUCmodel will be investigated for other fibrous porous media by employing data sets fromAkaydin et al. (2011) and Jackson & James (1986).
86
Stellenbosch University http://scholar.sun.ac.za
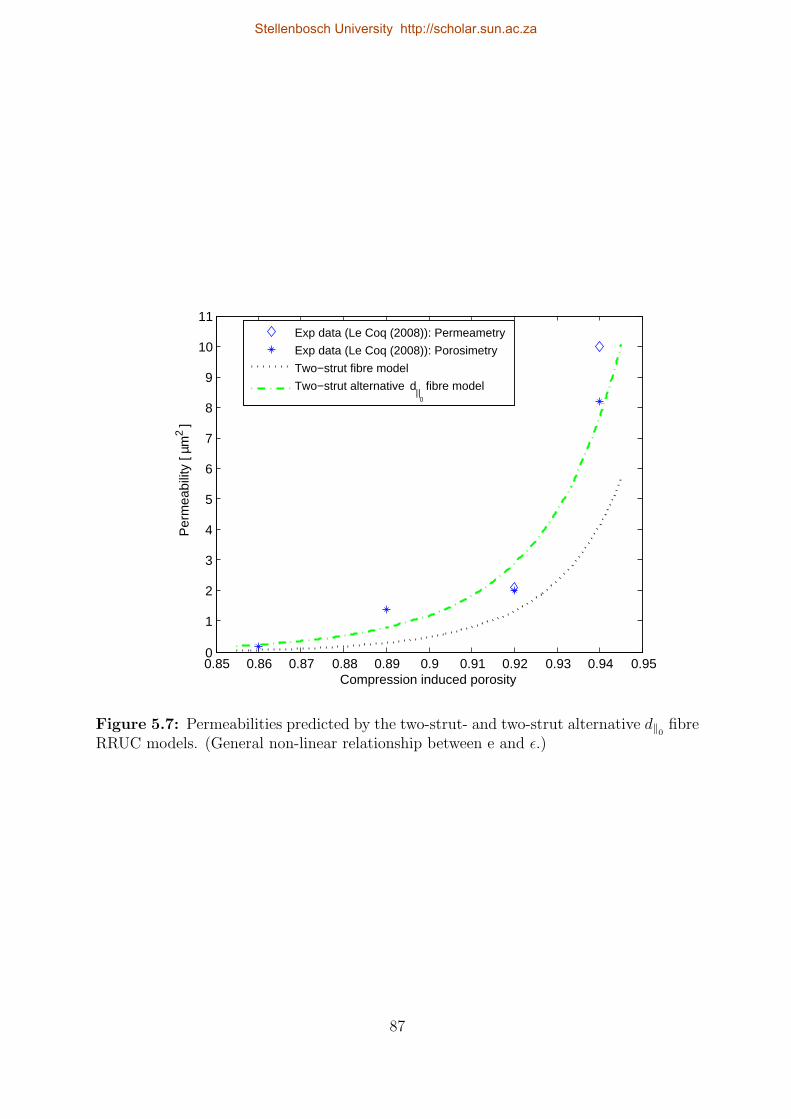
0.85 0.86 0.87 0.88 0.89 0.9 0.91 0.92 0.93 0.94 0.950
1
2
3
4
5
6
7
8
9
10
11
Compression induced porosity
Per
mea
bilit
y [ µ
m2 ]
Exp data (Le Coq (2008)): Permeametry
Exp data (Le Coq (2008)): Porosimetry
Two−strut fibre model
Two−strut alternative d||
0
fibre model
Figure 5.7: Permeabilities predicted by the two-strut- and two-strut alternative d∥0 fibreRRUC models. (General non-linear relationship between e and ϵ.)
87
Stellenbosch University http://scholar.sun.ac.za
Chapter 6
Model validation
Data regarding the hydraulic diameter and porosity values for compressed states of thefibrous porous medium, formed an essential part of the modelling process discussed thusfar. An alternative method for determining the dimensions of the two-strut fibre RRUCwas introduced in Section 5.3 and will be employed in the permeability prediction processfor soft porous media. Although the model is developed with the specific aim of predictingthe influence of compression on the permeability of a fibrous porous medium, evidence willbe provided that the model has, in addition, the potential for predicting the permeabilityof anisotropic fibrous porous media.
6.1 Soft fibrous porous medium
The characterization of the structural parameters for the soft fibrous porous medium,investigated by Akaydin et al. (2011), was not done with the aid of mercury porosimetryor image analysis. In addition, experimental data regarding the hydraulic diameter andporosities corresponding to different levels of compression were also not provided. Aswas discussed in Section 3.3.2, the porosity of the medium in the uncompressed statewas determined (ϵ0 = 0.9968) and the porosities at different levels of compression werecalculated from the relationship between the compression ratio and porosity. The averagefibre diameter in this context is 10 µm.
Therefore, an analytical model prediction for the permeability must be obtained withoutemploying the hydraulic diameter of the porous medium in question. The general non-linear relationship has to be employed, which, for the porous medium in question (Akaydinet al. (2011)) is given by:
ϵ =e − (1 − 0.9968)
e. (6.1)
Based on the same set of assumptions and constraints regarding the fluid and the flowregime made explicit thus far, the two-strut alternative d∥0 fibre RRUC model will beused in predicting the effect of compression on the permeability of a soft fibrous porousmedium.
88
Stellenbosch University http://scholar.sun.ac.za
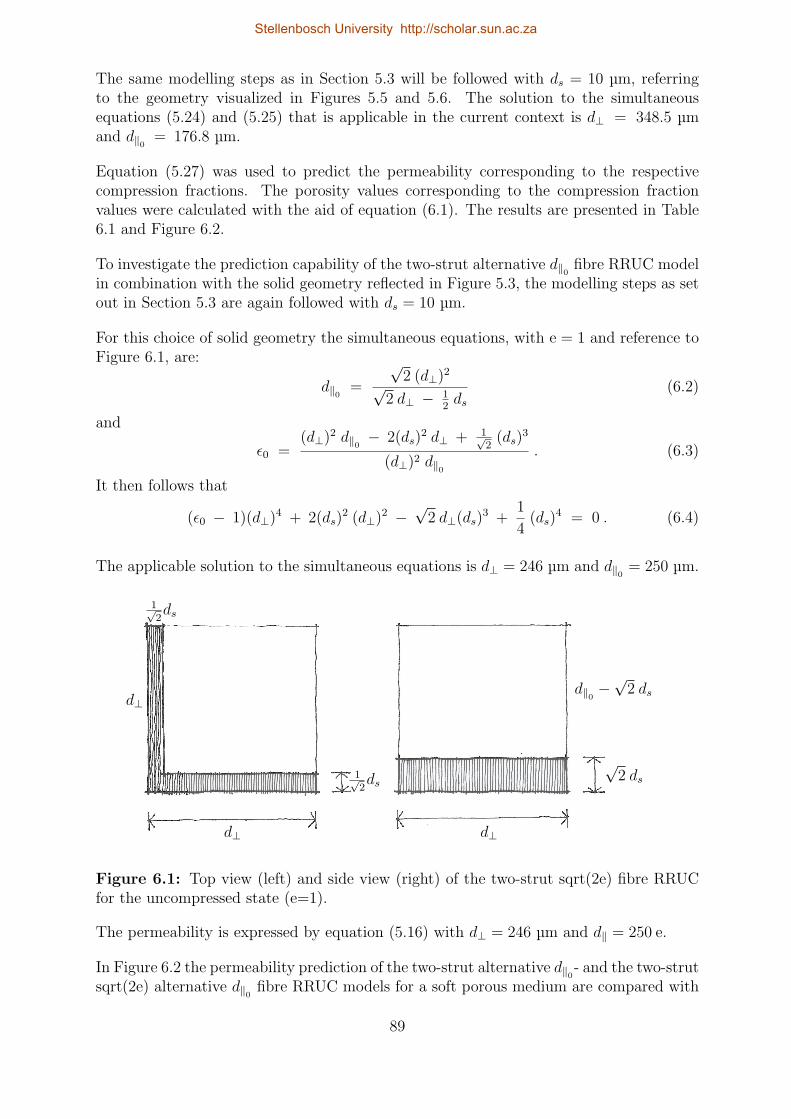
The same modelling steps as in Section 5.3 will be followed with ds = 10 µm, referringto the geometry visualized in Figures 5.5 and 5.6. The solution to the simultaneousequations (5.24) and (5.25) that is applicable in the current context is d⊥ = 348.5 µmand d∥0 = 176.8 µm.
Equation (5.27) was used to predict the permeability corresponding to the respectivecompression fractions. The porosity values corresponding to the compression fractionvalues were calculated with the aid of equation (6.1). The results are presented in Table6.1 and Figure 6.2.
To investigate the prediction capability of the two-strut alternative d∥0 fibre RRUC modelin combination with the solid geometry reflected in Figure 5.3, the modelling steps as setout in Section 5.3 are again followed with ds = 10 µm.
For this choice of solid geometry the simultaneous equations, with e = 1 and reference toFigure 6.1, are:
d∥0 =
√2 (d⊥)2√
2 d⊥ − 12ds
(6.2)
and
ϵ0 =(d⊥)2 d∥0 − 2(ds)
2 d⊥ + 1√2
(ds)3
(d⊥)2 d∥0. (6.3)
It then follows that
(ϵ0 − 1)(d⊥)4 + 2(ds)2 (d⊥)2 −
√2 d⊥(ds)
3 +1
4(ds)
4 = 0 . (6.4)
The applicable solution to the simultaneous equations is d⊥ = 246 µm and d∥0 = 250 µm.
1√2ds
d⊥
d⊥ d⊥
1√2ds
√2 ds
d∥0 −√
2 ds
Figure 6.1: Top view (left) and side view (right) of the two-strut sqrt(2e) fibre RRUCfor the uncompressed state (e=1).
The permeability is expressed by equation (5.16) with d⊥ = 246 µm and d∥ = 250 e.
In Figure 6.2 the permeability prediction of the two-strut alternative d∥0- and the two-strutsqrt(2e) alternative d∥0 fibre RRUC models for a soft porous medium are compared with
89
Stellenbosch University http://scholar.sun.ac.za
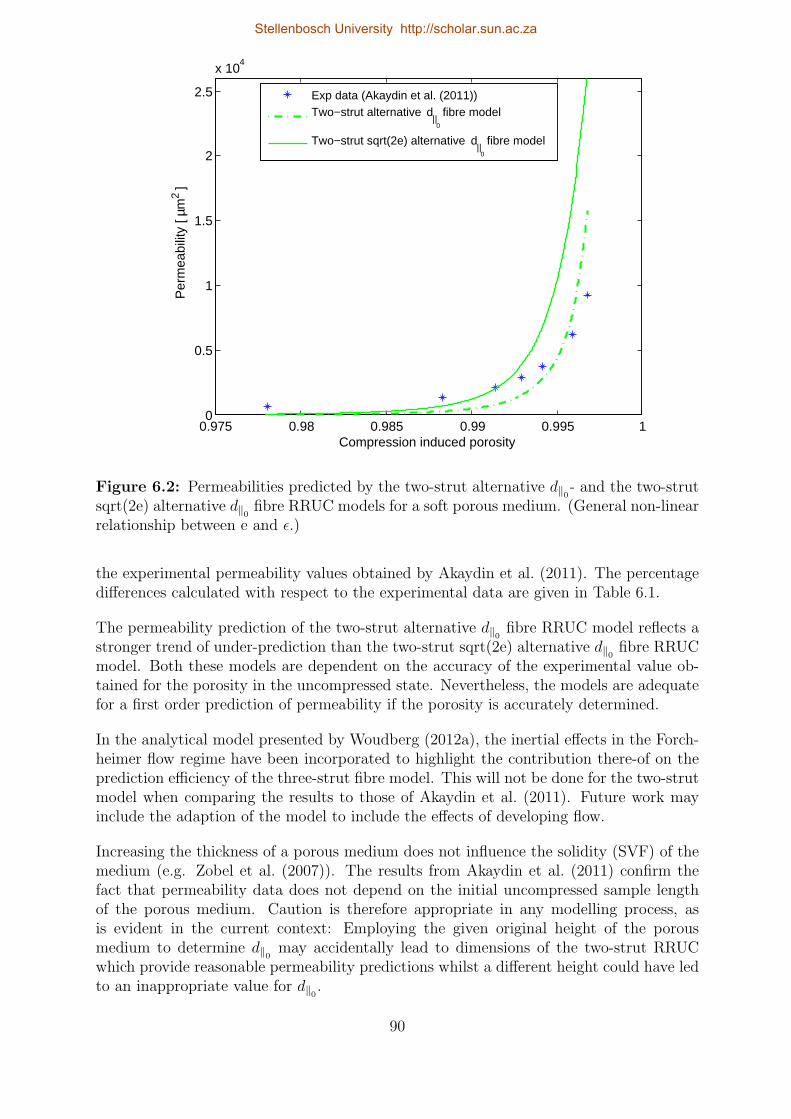
0.975 0.98 0.985 0.99 0.995 10
0.5
1
1.5
2
2.5
x 104
Compression induced porosity
Per
mea
bilit
y [ µ
m2 ]
Exp data (Akaydin et al. (2011))Two−strut alternative d
||0
fibre model
Two−strut sqrt(2e) alternative d||
0
fibre model
Figure 6.2: Permeabilities predicted by the two-strut alternative d∥0- and the two-strutsqrt(2e) alternative d∥0 fibre RRUC models for a soft porous medium. (General non-linearrelationship between e and ϵ.)
the experimental permeability values obtained by Akaydin et al. (2011). The percentagedifferences calculated with respect to the experimental data are given in Table 6.1.
The permeability prediction of the two-strut alternative d∥0 fibre RRUC model reflects astronger trend of under-prediction than the two-strut sqrt(2e) alternative d∥0 fibre RRUCmodel. Both these models are dependent on the accuracy of the experimental value ob-tained for the porosity in the uncompressed state. Nevertheless, the models are adequatefor a first order prediction of permeability if the porosity is accurately determined.
In the analytical model presented by Woudberg (2012a), the inertial effects in the Forch-heimer flow regime have been incorporated to highlight the contribution there-of on theprediction efficiency of the three-strut fibre model. This will not be done for the two-strutmodel when comparing the results to those of Akaydin et al. (2011). Future work mayinclude the adaption of the model to include the effects of developing flow.
Increasing the thickness of a porous medium does not influence the solidity (SVF) of themedium (e.g. Zobel et al. (2007)). The results from Akaydin et al. (2011) confirm thefact that permeability data does not depend on the initial uncompressed sample lengthof the porous medium. Caution is therefore appropriate in any modelling process, asis evident in the current context: Employing the given original height of the porousmedium to determine d∥0 may accidentally lead to dimensions of the two-strut RRUCwhich provide reasonable permeability predictions whilst a different height could have ledto an inappropriate value for d∥0 .
90
Stellenbosch University http://scholar.sun.ac.za
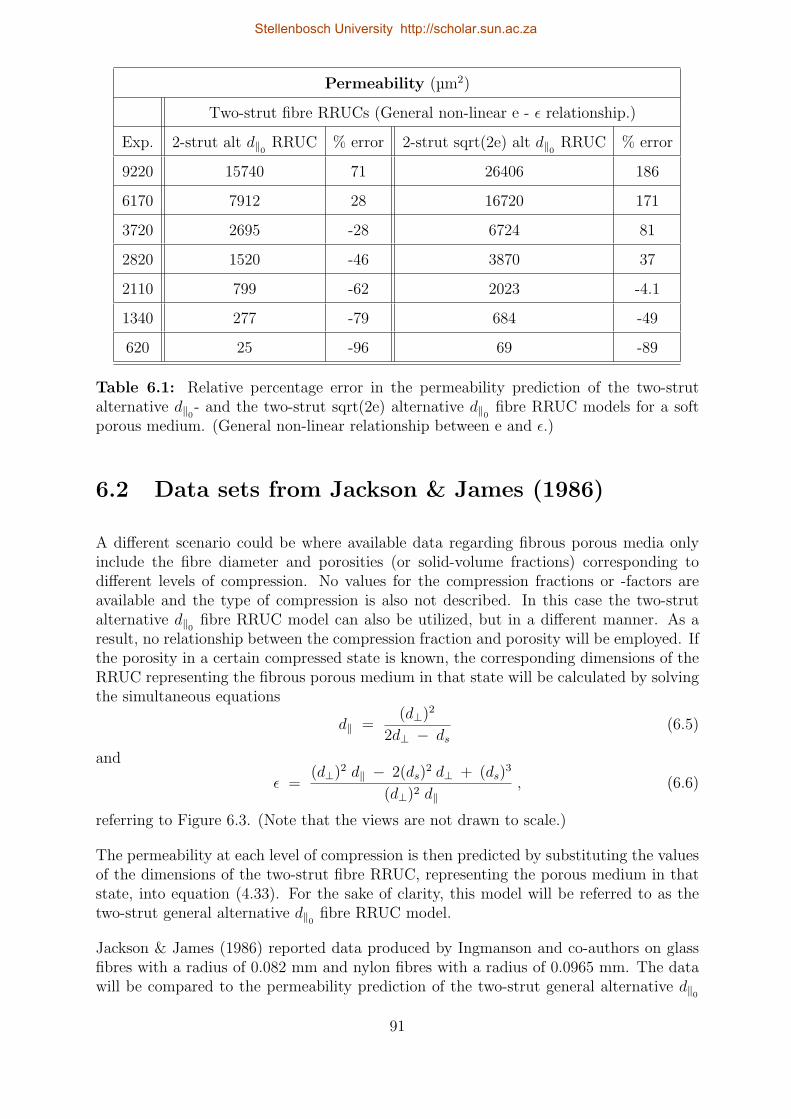
Permeability (µm2)
Two-strut fibre RRUCs (General non-linear e - ϵ relationship.)
Exp. 2-strut alt d∥0 RRUC % error 2-strut sqrt(2e) alt d∥0 RRUC % error
9220 15740 71 26406 186
6170 7912 28 16720 171
3720 2695 -28 6724 81
2820 1520 -46 3870 37
2110 799 -62 2023 -4.1
1340 277 -79 684 -49
620 25 -96 69 -89
Table 6.1: Relative percentage error in the permeability prediction of the two-strutalternative d∥0- and the two-strut sqrt(2e) alternative d∥0 fibre RRUC models for a softporous medium. (General non-linear relationship between e and ϵ.)
6.2 Data sets from Jackson & James (1986)
A different scenario could be where available data regarding fibrous porous media onlyinclude the fibre diameter and porosities (or solid-volume fractions) corresponding todifferent levels of compression. No values for the compression fractions or -factors areavailable and the type of compression is also not described. In this case the two-strutalternative d∥0 fibre RRUC model can also be utilized, but in a different manner. As aresult, no relationship between the compression fraction and porosity will be employed. Ifthe porosity in a certain compressed state is known, the corresponding dimensions of theRRUC representing the fibrous porous medium in that state will be calculated by solvingthe simultaneous equations
d∥ =(d⊥)2
2d⊥ − ds(6.5)
and
ϵ =(d⊥)2 d∥ − 2(ds)
2 d⊥ + (ds)3
(d⊥)2 d∥, (6.6)
referring to Figure 6.3. (Note that the views are not drawn to scale.)
The permeability at each level of compression is then predicted by substituting the valuesof the dimensions of the two-strut fibre RRUC, representing the porous medium in thatstate, into equation (4.33). For the sake of clarity, this model will be referred to as thetwo-strut general alternative d∥0 fibre RRUC model.
Jackson & James (1986) reported data produced by Ingmanson and co-authors on glassfibres with a radius of 0.082 mm and nylon fibres with a radius of 0.0965 mm. The datawill be compared to the permeability prediction of the two-strut general alternative d∥0
91
Stellenbosch University http://scholar.sun.ac.za
ds
d⊥
d⊥ d⊥
dsds
d∥ − ds
Figure 6.3: Top view (left) and side view (right) of the two-strut general alternative d∥0fibre RRUC.
fibre RRUC model. The dimensionless permeability provided by Jackson & James (1986)is multiplied by the square of the given radius to obtain permeability dimensions in mm2.Since the choice was made in the modelling process to equate the length ds to the fibrediameter, the corresponding values for ds were calculated by multiplying the given radiiby 2.
For the sake of completeness and comparison between the two-strut- and three-strut fibremodels, the permeability prediction of the three-strut fibre model is also shown in Figures6.4 and 6.5. For comparison purposes the porosity range on the horizontal axis is thesame in both graphs (glass- and nylon fibres).
Predictions within the correct order of magnitude were obtained via the two-strut generalalternative d∥0 fibre RRUC model. The percentage difference between the experimentalvalues and the values predicted by the analytical model ranges from -8.5% to -52%. Forthe nylon fibres the percentage difference ranges from -22% to -51%. The permeabilityprediction of the two-strut general alternative d∥0 fibre RRUC model shows a trend ofunder-prediction.
92
Stellenbosch University http://scholar.sun.ac.za
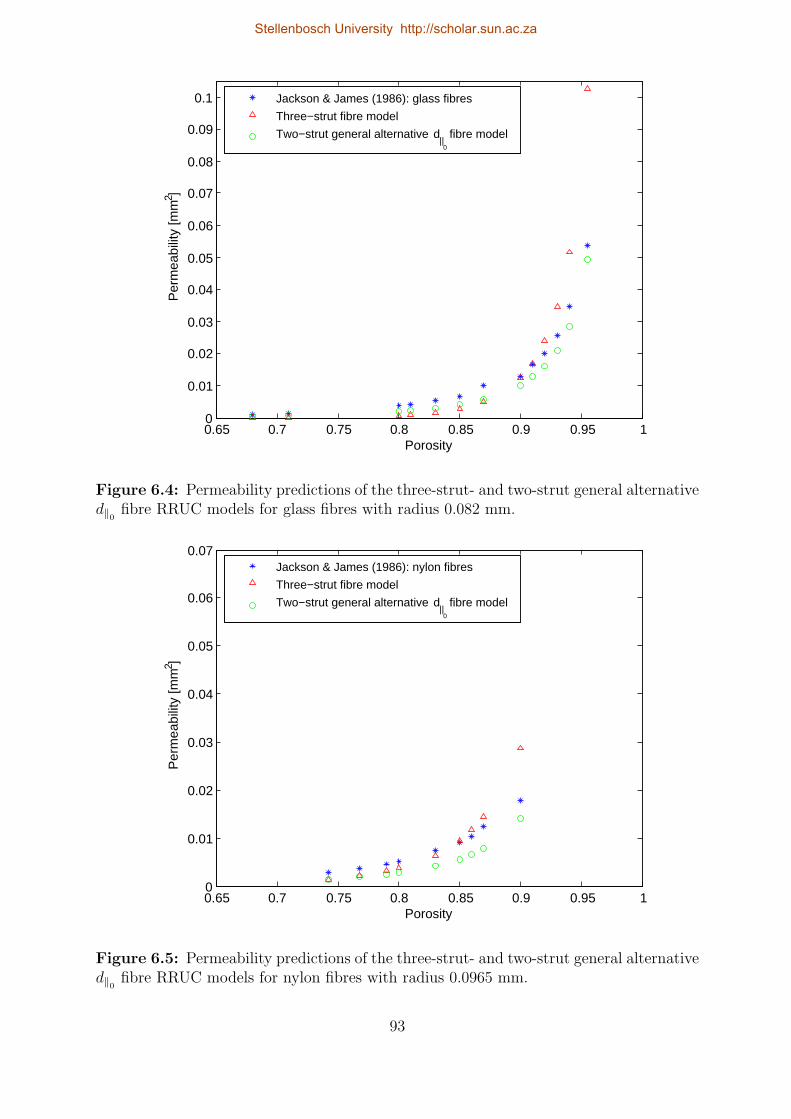
0.65 0.7 0.75 0.8 0.85 0.9 0.95 10
0.01
0.02
0.03
0.04
0.05
0.06
0.07
0.08
0.09
0.1
Porosity
Per
mea
bilit
y [m
m2 ]
Jackson & James (1986): glass fibres
Three−strut fibre model
Two−strut general alternative d||
0
fibre model
Figure 6.4: Permeability predictions of the three-strut- and two-strut general alternatived∥0 fibre RRUC models for glass fibres with radius 0.082 mm.
0.65 0.7 0.75 0.8 0.85 0.9 0.95 10
0.01
0.02
0.03
0.04
0.05
0.06
0.07
Porosity
Per
mea
bilit
y [m
m2 ]
Jackson & James (1986): nylon fibres
Three−strut fibre model
Two−strut general alternative d||
0
fibre model
Figure 6.5: Permeability predictions of the three-strut- and two-strut general alternatived∥0 fibre RRUC models for nylon fibres with radius 0.0965 mm.
93
Stellenbosch University http://scholar.sun.ac.za
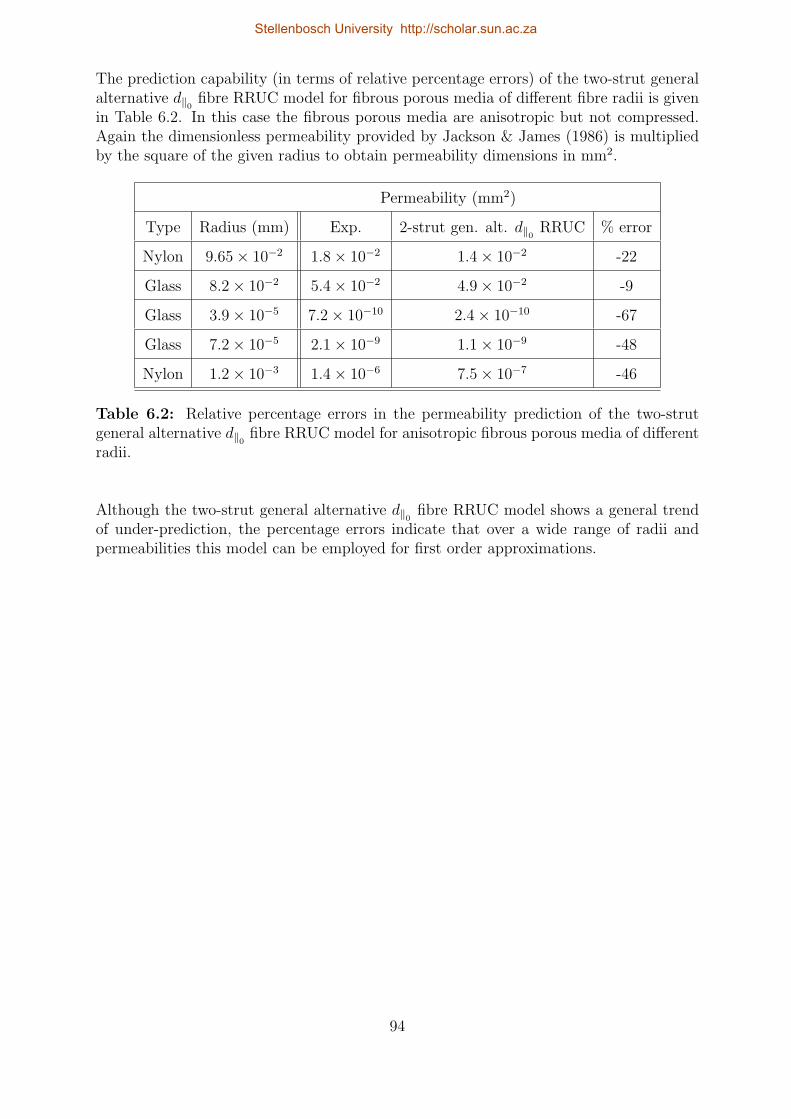
The prediction capability (in terms of relative percentage errors) of the two-strut generalalternative d∥0 fibre RRUC model for fibrous porous media of different fibre radii is givenin Table 6.2. In this case the fibrous porous media are anisotropic but not compressed.Again the dimensionless permeability provided by Jackson & James (1986) is multipliedby the square of the given radius to obtain permeability dimensions in mm2.
Permeability (mm2)
Type Radius (mm) Exp. 2-strut gen. alt. d∥0 RRUC % error
Nylon 9.65 × 10⁻² 1.8 × 10⁻² 1.4 × 10⁻² -22
Glass 8.2 × 10⁻² 5.4 × 10⁻² 4.9 × 10⁻² -9
Glass 3.9 × 10⁻⁵ 7.2 × 10⁻¹⁰ 2.4 × 10⁻¹⁰ -67
Glass 7.2 × 10⁻⁵ 2.1 × 10⁻⁹ 1.1 × 10⁻⁹ -48
Nylon 1.2 × 10⁻³ 1.4 × 10⁻⁶ 7.5 × 10⁻⁷ -46
Table 6.2: Relative percentage errors in the permeability prediction of the two-strutgeneral alternative d∥0 fibre RRUC model for anisotropic fibrous porous media of differentradii.
Although the two-strut general alternative d∥0 fibre RRUC model shows a general trendof under-prediction, the percentage errors indicate that over a wide range of radii andpermeabilities this model can be employed for first order approximations.
94
Stellenbosch University http://scholar.sun.ac.za
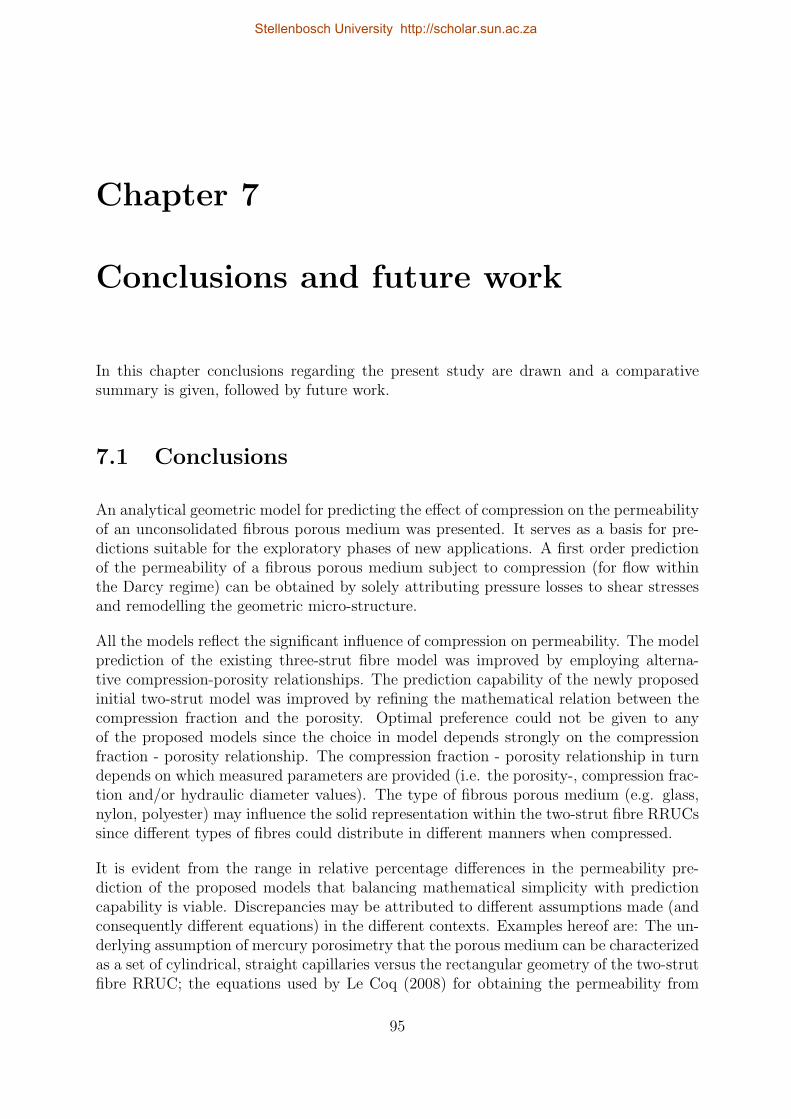
Chapter 7
Conclusions and future work
In this chapter conclusions regarding the present study are drawn and a comparativesummary is given, followed by future work.
7.1 Conclusions
An analytical geometric model for predicting the effect of compression on the permeabilityof an unconsolidated fibrous porous medium was presented. It serves as a basis for pre-dictions suitable for the exploratory phases of new applications. A first order predictionof the permeability of a fibrous porous medium subject to compression (for flow withinthe Darcy regime) can be obtained by solely attributing pressure losses to shear stressesand remodelling the geometric micro-structure.
All the models reflect the significant influence of compression on permeability. The modelprediction of the existing three-strut fibre model was improved by employing alterna-tive compression-porosity relationships. The prediction capability of the newly proposedinitial two-strut model was improved by refining the mathematical relation between thecompression fraction and the porosity. Optimal preference could not be given to anyof the proposed models since the choice in model depends strongly on the compressionfraction - porosity relationship. The compression fraction - porosity relationship in turndepends on which measured parameters are provided (i.e. the porosity-, compression frac-tion and/or hydraulic diameter values). The type of fibrous porous medium (e.g. glass,nylon, polyester) may influence the solid representation within the two-strut fibre RRUCssince different types of fibres could distribute in different manners when compressed.
It is evident from the range in relative percentage differences in the permeability pre-diction of the proposed models that balancing mathematical simplicity with predictioncapability is viable. Discrepancies may be attributed to different assumptions made (andconsequently different equations) in the different contexts. Examples hereof are: The un-derlying assumption of mercury porosimetry that the porous medium can be characterizedas a set of cylindrical, straight capillaries versus the rectangular geometry of the two-strutfibre RRUC; the equations used by Le Coq (2008) for obtaining the permeability from
95
Stellenbosch University http://scholar.sun.ac.za
the structural data differs from those employed in the analytical models of the presentstudy and, the experimental methods used to determine the porosity versus the valuesobtained via a chosen relationship (as was done in the present modelling procedure). Crit-ical aspects thus include the method with which the hydraulic diameter is experimentallyobtained in combination with the definition there-of in the RRUC context; the mathe-matical approaches applied in determining the permeability as well as the accuracy of theporosity measurements.
Further discrepancies may be a result of comparing variables that were obtained in dif-ferent manners and are in a sense not ‘the same’ variable. For instance, to obtain perme-ability values related to different compression ratios, Akaydin et al. (2011) measured thepressure and velocities at different points in the medium and calculated the permeabilitywith Darcy’s law. The permeability values to be compared with these values must thenalso be obtained under the assumptions related to Darcy’s law (velocity independent per-meability) otherwise two ‘different’ permeability definitions are compared. Le Coq (2008),on the other hand, determined the permeability coefficient from structural parameters.
The prediction capability is highly sensitive to the accuracy of the porosity in the uncom-pressed state, as was also observed by e.g. Akaydin et al. (2011). It is also significantlyinfluenced by the representation of the porosity of the porous material in the uncompressedstate through the dimensions of the geometric model (e.g. the value of d∥0).
Figure 7.1 gives an outline of the structure of the thesis. The effect of parameter changeon the prediction capability of the proposed models is summarized in Figure 7.2 throughcomparison of the percentage difference relative to the experimental values obtained byLe Coq (2008) i.e. a single data set.
96
Stellenbosch University http://scholar.sun.ac.za
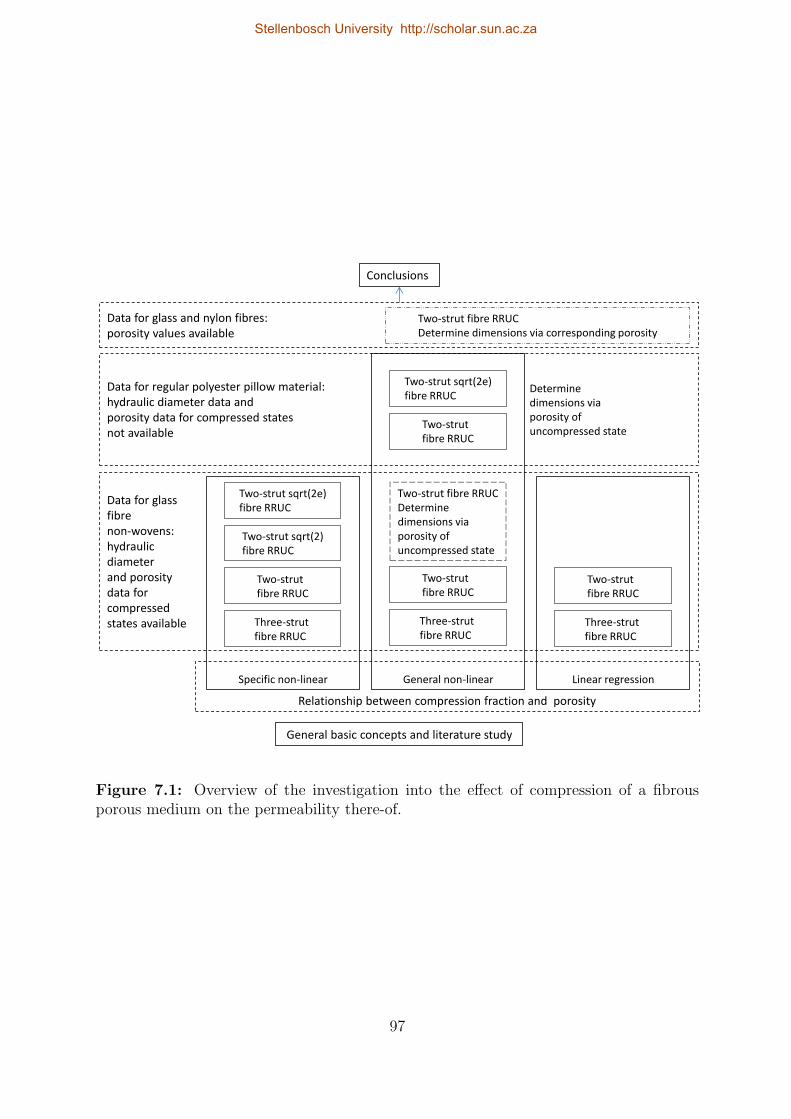
Data for glass
fibre
non-wovens:
hydraulic
diameter
and porosity
data for
compressed
states available
Data for regular polyester pillow material:
hydraulic diameter data and
porosity data for compressed states
not available
Relationship between compression fraction and porosity
General basic concepts and literature study
Conclusions
Specific non-linear
Two-strut
fibre RRUC
Three-strut
fibre RRUC
Two-strut sqrt(2)
fibre RRUC
Two-strut sqrt(2e)
fibre RRUC
Linear regression
Two-strut
fibre RRUC
Three-strut
fibre RRUC
General non-linear
Two-strut
fibre RRUC
Two-strut sqrt(2e)
fibre RRUC
Two-strut
fibre RRUC
Three-strut
fibre RRUC
Two-strut fibre RRUC
Determine
dimensions via
porosity of
uncompressed state
Data for glass and nylon fibres:
porosity values available
Two-strut fibre RRUC
Determine dimensions via corresponding porosity
Determine
dimensions via
porosity of
uncompressed state
Figure 7.1: Overview of the investigation into the effect of compression of a fibrousporous medium on the permeability there-of.
97
Stellenbosch University http://scholar.sun.ac.za
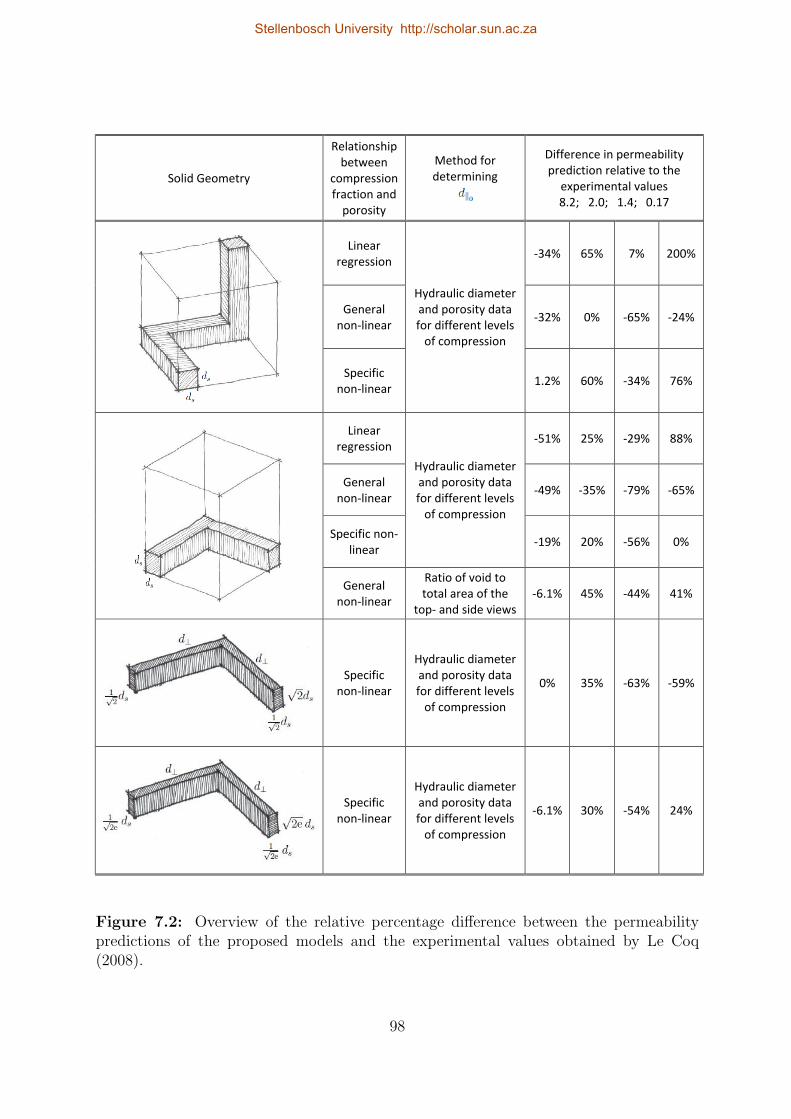
Solid Geometry
Relationship
between
compression
fraction and
porosity
Method for
determining
Difference in permeability
prediction relative to the
experimental values
8.2; 2.0; 1.4; 0.17
Linear
regression
Hydraulic diameter
and porosity data
for different levels
of compression
-34% 65% 7% 200%
General
non-linear -32% 0% -65% -24%
Specific
non-linear 1.2% 60% -34% 76%
Linear
regression
Hydraulic diameter
and porosity data
for different levels
of compression
-51% 25% -29% 88%
General
non-linear -49% -35% -79% -65%
Specific non-
linear -19% 20% -56% 0%
General
non-linear
Ratio of void to
total area of the
top- and side views
-6.1% 45% -44% 41%
Specific
non-linear
Hydraulic diameter
and porosity data
for different levels
of compression
0% 35% -63% -59%
Specific
non-linear
Hydraulic diameter
and porosity data
for different levels
of compression
-6.1% 30% -54% 24%
Figure 7.2: Overview of the relative percentage difference between the permeabilitypredictions of the proposed models and the experimental values obtained by Le Coq(2008).
98
Stellenbosch University http://scholar.sun.ac.za
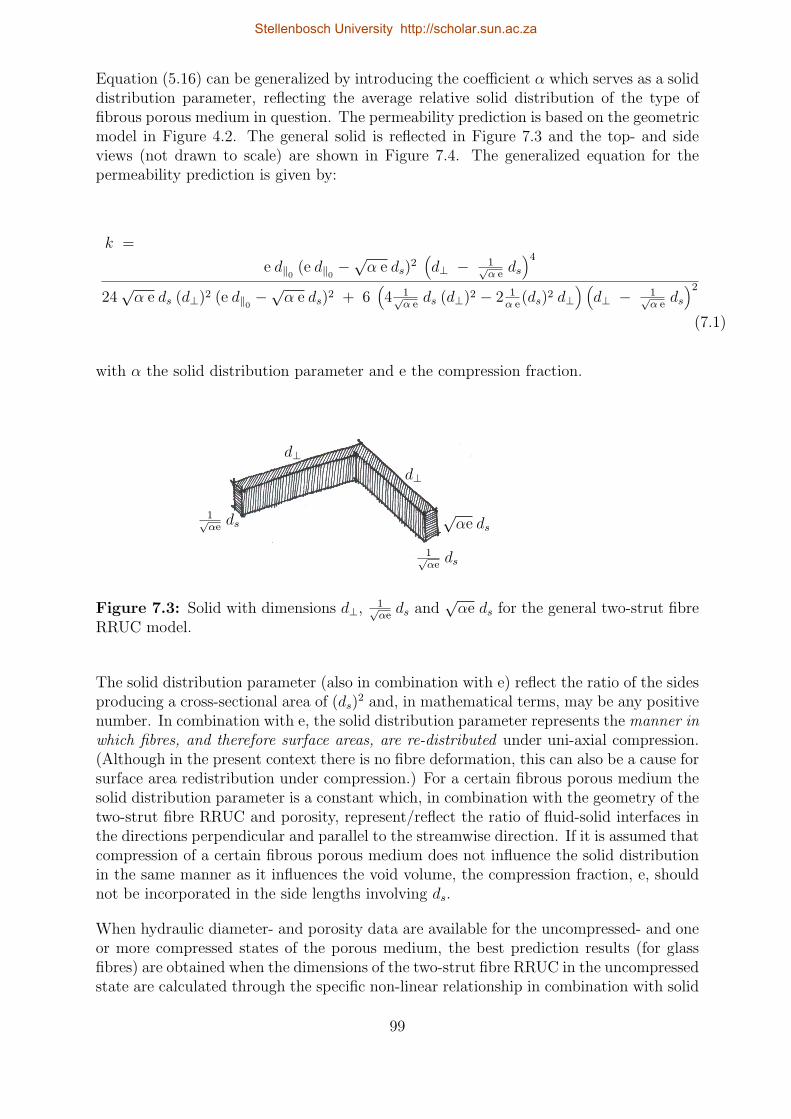
Equation (5.16) can be generalized by introducing the coefficient α which serves as a soliddistribution parameter, reflecting the average relative solid distribution of the type offibrous porous medium in question. The permeability prediction is based on the geometricmodel in Figure 4.2. The general solid is reflected in Figure 7.3 and the top- and sideviews (not drawn to scale) are shown in Figure 7.4. The generalized equation for thepermeability prediction is given by:
k =
e d∥0 (e d∥0 −√α e ds)
2(d⊥ − 1√
α eds)4
24√α e ds (d⊥)2 (e d∥0 −
√α e ds)2 + 6
(4 1√
α eds (d⊥)2 − 2 1
α e(ds)2 d⊥
) (d⊥ − 1√
α eds)2
(7.1)
with α the solid distribution parameter and e the compression fraction.
1√αeds
d⊥
d⊥
1√αeds
√αe ds
Figure 7.3: Solid with dimensions d⊥, 1√αeds and
√αe ds for the general two-strut fibre
RRUC model.
The solid distribution parameter (also in combination with e) reflect the ratio of the sidesproducing a cross-sectional area of (ds)
2 and, in mathematical terms, may be any positivenumber. In combination with e, the solid distribution parameter represents the manner inwhich fibres, and therefore surface areas, are re-distributed under uni-axial compression.(Although in the present context there is no fibre deformation, this can also be a cause forsurface area redistribution under compression.) For a certain fibrous porous medium thesolid distribution parameter is a constant which, in combination with the geometry of thetwo-strut fibre RRUC and porosity, represent/reflect the ratio of fluid-solid interfaces inthe directions perpendicular and parallel to the streamwise direction. If it is assumed thatcompression of a certain fibrous porous medium does not influence the solid distributionin the same manner as it influences the void volume, the compression fraction, e, shouldnot be incorporated in the side lengths involving ds.
When hydraulic diameter- and porosity data are available for the uncompressed- and oneor more compressed states of the porous medium, the best prediction results (for glassfibres) are obtained when the dimensions of the two-strut fibre RRUC in the uncompressedstate are calculated through the specific non-linear relationship in combination with solid
99
Stellenbosch University http://scholar.sun.ac.za
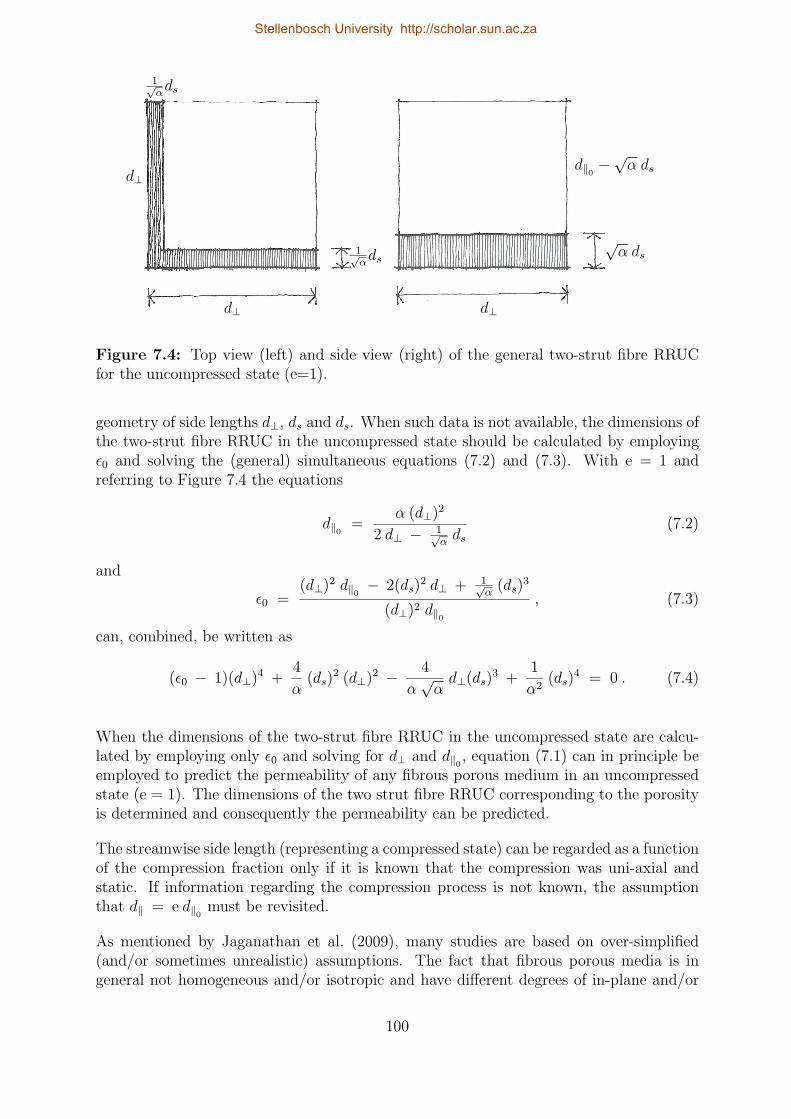
1√αds
d⊥
d⊥ d⊥
1√αds
√α ds
d∥0 −√α ds
Figure 7.4: Top view (left) and side view (right) of the general two-strut fibre RRUCfor the uncompressed state (e=1).
geometry of side lengths d⊥, ds and ds. When such data is not available, the dimensions ofthe two-strut fibre RRUC in the uncompressed state should be calculated by employingϵ0 and solving the (general) simultaneous equations (7.2) and (7.3). With e = 1 andreferring to Figure 7.4 the equations
d∥0 =α (d⊥)2
2 d⊥ − 1√αds
(7.2)
and
ϵ0 =(d⊥)2 d∥0 − 2(ds)
2 d⊥ + 1√α
(ds)3
(d⊥)2 d∥0, (7.3)
can, combined, be written as
(ϵ0 − 1)(d⊥)4 +4
α(ds)
2 (d⊥)2 − 4
α√αd⊥(ds)
3 +1
α2(ds)
4 = 0 . (7.4)
When the dimensions of the two-strut fibre RRUC in the uncompressed state are calcu-lated by employing only ϵ0 and solving for d⊥ and d∥0 , equation (7.1) can in principle beemployed to predict the permeability of any fibrous porous medium in an uncompressedstate (e = 1). The dimensions of the two strut fibre RRUC corresponding to the porosityis determined and consequently the permeability can be predicted.
The streamwise side length (representing a compressed state) can be regarded as a functionof the compression fraction only if it is known that the compression was uni-axial andstatic. If information regarding the compression process is not known, the assumptionthat d∥ = e d∥0 must be revisited.
As mentioned by Jaganathan et al. (2009), many studies are based on over-simplified(and/or sometimes unrealistic) assumptions. The fact that fibrous porous media is ingeneral not homogeneous and/or isotropic and have different degrees of in-plane and/or
100
Stellenbosch University http://scholar.sun.ac.za

through plane inhomogeneities are often put aside for the sake of simplicity. In line withthis, it is evident from the present study that mathematical simplicity has its place inanalytical modelling processes if the awareness of the consequences of assumptions isevident.
7.2 Future work
It was shown in this study that the proposed models are geometrically as well as math-ematically adaptable. The models may thus furthermore be adapted and refined in thefollowing manners:
• Inclusion of the application of the general definition of the hydraulic diameter forporous media in the two-strut fibre RRUC model.
• Incorporation of the effect of developing flow could be investigated by introducingappropriate apparent friction factors in the pressure drop prediction of the proposedanalytical model.
• Accounting for anisotropy is an essential new feature of the two-strut fibre RRUCand could be refined. Although the model was developed with the aim of investi-gating the effect of compression on a fibrous porous medium, it shows a reasonablefirst order permeability prediction capability for anisotropic fibrous porous media.
• The model was developed for a fibrous porous medium but it could be investigatedwhether the solid geometry in combination with the idea of a solid distributionvariable could not be extended to other unconsolidated porous structures.
• Tortuosity was not explicitly incorporated in the present two-strut fibre RRUCmodel (and its modifications) and may be investigated in the future.
• Accounting for slip-flow in combination with a stochastic approach may also be asubject for further study.
• Applying the newly developed two-strut model, in combination with the solid dis-tribution parameter, to liquid flow through fibrous porous media.
• Combining the solid distribution parameter with the compression fraction providesa parameter for solid re-distribution. This may be extended to contexts of fibredeformation under compression.
101
Stellenbosch University http://scholar.sun.ac.za
Appendix A
General fluid flow concepts
The fundamental governing equations of fluid dynamics, namely the continuity, mo-mentum and energy equations can be obtained in various different forms. Anderson, Jr(1995) states the importance of the difference between the finite control volume approachwhich directly leads to fluid-flow equations in integral form and the infinitesimally smallelement approach which directly leads to fluid-flow equations in partial differential equa-tion form. When describing fluid flow using a control volume or an infinitesimally smallelement (which is fixed in space with the fluid moving through it), the so-called conser-vation form of the governing equations are obtained. The non-conservation form of thegoverning equations are obtained when the control volume move with the fluid (then oftenreferred to as a material volume), or when the infinitesimal fluid element moves along astreamline with the velocity equal to the local flow velocity at each point. Worster (2009)refers to the conservation form of the governing equations as an Eulerian description offluid flow and to the non-conservation form as a Lagrangian description of fluid flow.
The continuity equation,
∂ ρ
∂t+ ∇ · (ρ v) =
∂ ρ
∂t+ v · ∇ρ + ρ ∇ · v = 0 , (A.1)
expresses the physical principle that mass is conserved.
The Navier-Stokes (momentum) equations, expressing the conservation of momen-tum (representing Newton’s second law not for a fixed-mass system, but a fixed finitevolume), in terms of the x-, y-, and z-components within a rectangular Cartesian coordi-nate system (Anderson, Jr (1995)) are respectively given by:
∂ (ρ u)
∂t+ ∇ · (ρ u v) = ρfx − ∂p
∂x+
∂ τxx∂x
+∂ τyx∂y
+∂ τzx∂z
, (A.2)
∂ (ρ v)
∂t+ ∇ · (ρ v v) = ρfy − ∂p
∂y+
∂ τxy∂x
+∂ τyy∂y
+∂ τzy∂z
, (A.3)
∂ (ρ w)
∂t+ ∇ · (ρ w v) = ρfz − ∂p
∂z+
∂ τxz∂x
+∂ τyz∂y
+∂ τzz∂z
, (A.4)
102
Stellenbosch University http://scholar.sun.ac.za
where the velocity field may be expressed as
v = u(x, y, z, t) i+ v(x, y, z, t) j + w(x, y, z, t) k,
fx, fy, fz, are the components of the total body force per unit mass (examples aregravitational, electric and magnetic forces),
p is the thermodynamic pressure acting on the surface of a fluid element (Bird et al.(2007)), and
τyx, τzx, τxy, τzy, τxz, τyz, τzz, τxx, τyy are the shear and normal viscous stress com-ponents acting on the surface of a fluid element. (The following convention is used: τyxindicates the stress in the x-direction on a unit area with normal vector in the y-direction.)
In the late seventeenth century, Isaac Newton stated that the shear stress in a fluid isproportional to the time rate of strain, i.e. velocity gradients. In 1845 Stokes found thatfor these Newtonian fluids the following hold:
τxx = λ (∇ · v) + 2µ∂u
∂x, τyy = λ (∇ · v) + 2µ
∂v
∂y, τzz = λ (∇ · v) + 2µ
∂w
∂z,
τxy = τyx = µ
[∂v
∂x+
∂u
∂y
],
τxz = τzx = µ
[∂u
∂z+
∂w
∂x
],
τzy = τyz = µ
[∂w
∂y+
∂v
∂z
], (A.5)
where µ is the molecular (or dynamic) viscosity coefficient and λ is the second viscosity co-efficient (dilatational viscosity). Stokes made the hypothesis that λ = − 2
3µ. (Assuming
that the mean normal stress is independent of the rate of dilation (Fung (1977)).)
The assumption that the volume (bulk) viscosity λ + 23µ is zero is frequently used but
has still not been definitely confirmed (Anderson, Jr (1995)). It has some basis in theoryonly in the case of ideal monatomic gases but has been carried over implicitly to bothliquids and gases of all degrees of complexity. One might therefore expect some differencesbetween theoretical predictions and experimental results due to this over-simplification.In most viscous flows the normal stresses, τxx, τyy and τzz, are significantly less than theshear stresses and are therefore often neglected.
Viscosity
Being a measure of a fluid’s resistance to flow, viscosity is an important parameter in anyinvestigation regarding fluids in motion. Viscosity is a major factor in determining theprevalent forces during liquid flow e.g. in spraying, injection molding, and surface coating.Barnes (2002) also relates the importance of viscosity to the importance of satisfying andeven delighting the end consumer in the areas of foods, personal products as well ashousehold commodities ranging from detergent liquids through paints to greases and oils.Technical requirements such as the clean application of ink in printing need careful controlof viscosity. Knowledge of the viscosity is also crucial for sizing pumps, choosing the speedof mixers, etc.
103
Stellenbosch University http://scholar.sun.ac.za
As opposed to non-Newtonian fluids where the viscosity is also a function of the shearrate, the viscosity of Newtonian fluids (stress and strain rate tensors are linearly related(Hughes (1979))) is only a function of temperature and pressure.
The viscosity of simple liquids such as water and many oils is a function of the averagedistance between the constituent molecules, and this in turn depends on the tempera-ture via Brownian thermal energy. The higher the temperature, the greater the distancebetween molecules; it is therefore easier for them to move past one another and hencethe viscosity is lower. The rate at which viscosity decreases with increasing temperatureusually depends on the actual viscosity level, such that the viscosity of higher-viscosityliquids decreases faster with increase in temperature than that of lower-viscosity liquids.Large changes in pressure are required to produce significant changes in viscosity in thesesimple liquids. Viscosity normally rises exponentially with pressure, but very large pres-sures are required to produce any sensible changes. The higher the actual viscosity level,the greater the dependence of viscosity on pressure (Barnes (2002)). Important to men-tion is the anomaly that the viscosity of water initially decreases with increasing pressure(at temperatures below 33 degrees Celsius). (The generally accepted explanation is thatpressure reduces the hydrogen-bonded network, which, with the size of the voids betweenmolecules, is responsible for the viscosity. This effect more than compensates for thereduced average inter-molecular distance with increase in pressure.) Although water be-haves as a “normal” liquid at even higher pressures, no measurable effect of pressure onthe viscosity of water is evident up to about 100 bar. The viscosity of water in the shearrate range of about 0.01 − 20000 s−1 is independent of shear rate (Barnes (2002)).
Considering the ways in which viscosity can be manipulated for optimum flow properties,it is important to realize that it is usually possible to identify a continuous liquid phaseof which the viscosity forms the basis of any subsequent overall viscosity. According toBarnes (2002) this continuous-phase viscosity becomes progressively modified as differentmaterials are dispersed or dissolved into it. Sometimes chemical additives can decrease theviscosity of water by interfering with the hydrogen bonding. Adding ethyl alcohol to water(miscible liquids with almost the same viscosity) produces complex mixture properties andconsequently a mixture viscosity very different from the original viscosities. Barnes (2002)gives a detailed description of how viscosity can be manipulated and the role that shearrate (or shear stress) plays in different contexts.
The viscosity of gases has a different temperature dependence than that of liquids becausegases and liquids have different frictional mechanisms at the molecular level. Intermolec-ular forces in gases are not as important a factor in viscosity as collisions between themolecules. An increase in temperature increases the number of collisions, thus increasingthe viscosity. A striking result of the kinetic theory of gases is that the viscosity of a gas is(roughly) independent of the density of a gas (Fung (1977)). The density does, however,influence the type of dependency of viscosity on temperature.
Viscosity is the principal factor resisting motion in laminar flow. However, when thevelocity has increased to the point at which the flow becomes turbulent, pressure differ-ences resulting from eddy currents, rather than viscosity, provide the major resistance tomotion. Shah & London (1978) state that flow is laminar when the velocities are freeof macroscopic fluctuations at any point in the flow field. The terms viscous flow and
104
Stellenbosch University http://scholar.sun.ac.za
laminar flow are often used as synonyms but under certain conditions viscous flow maybecome turbulent.
Reynolds number
By a procedure of dimensional analysis (based on Fourier’s principle of dimensional ho-mogeneity) a phenomenon may be expressed as a relationship amongst a set of variablesthat forms a dimensionless group (Bear (1988)). A system (experimental or analytical)can be scaled up (or down) in such a way that exactly the same flow patterns occur inthe original system and the scaled system, by maintaining geometric as well as dynamicsimilarity between the two systems. Dynamic similarity is maintained if the dimension-less groups in the differential equations and boundary conditions are the same for bothsystems. Characteristic length, characteristic velocity, etc. are typical ‘scaling factors’used to define dimensionless groups for each system (Bird et al. (2007)).
The Reynolds number is an essential non-dimensional (physical) parameter for viscousflows. The same Reynolds number in a model and the (geometrically similar) full-scaleprototype, ensures dynamic similarity if only inertial- and frictional forces are assumedto be present (Fung (1977)). The magnitude of the dimensionless group
Re ≡ ρ u0 l0µ
, (A.6)
with u0 a characteristic velocity (average system velocity), ρ the fluid density, µ theviscosity of the fluid and l0 a characteristic length, indicates the relative importance ofinertial- and viscous forces in a specific fluid system (Bird et al. (2007)). According toHughes (1979), for given flow configurations and fluid properties, the Reynolds numberdepends directly on the magnitude of the fluid velocity.
Friction factor
In the modelling processes where the influence of developing flow is incorporated, thefriction factor - Reynolds number product (Poiseuille number) is usually employed.The (dimensionless) friction factor, f , is in general a function of the pipe roughness,pipe diameter, fluid kinematic viscosity, and velocity of flow.
Assuming laminar fully developed flow in a a straight conduit of uniform cross section,with a pressure difference ∆p over length L, a mean velocity of um, a hydraulic radius Rh
and constant fluid density ρ, the definition of the Fanning friction factor is given by
f ≡ ∆p
L
Rh12ρu2m
. (A.7)
According to Shah & London (1978), the Fanning friction factor for laminar flow in ductsis defined as the ratio of the wall shear stress τw to the flow kinetic energy per unit volume:
f ≡ τw12ρu2m
. (A.8)
(The ≡ is used to indicate a choice of definition.)
105
Stellenbosch University http://scholar.sun.ac.za

The value of the Darcy-Weisbach friction factor is 4 times that of the Fanning frictionfactor since the hydraulic diameter is employed and not the hydraulic radius as in theFanning friction factor.
When considering developing flow, the pressure drop is related to an apparent frictionfactor which accounts for the pressure drop due to friction as well as the developingregion effects. According to Steinke & Kandlikar (2006), the apparent friction factorconsists of two components: the friction factor from the theory for fully developed flowand an incremental pressure defect.
106
Stellenbosch University http://scholar.sun.ac.za
Bibliography
Akaydin, H., Pierides, A., Weinbaum, S., & Andreopoulos, Y. (2011). Permeability ofsoft porous media under one-dimensional compaction. Chemical Engineering science,66, 1–14.
Anderson, Jr, J. D. (1995). Computational Fluid Dynamics: The basics with applications.McGraw-Hill, Inc.
Bahrami, M., Yovanovich, M., & Culham, J. (2007). A novel solution for pressure dropin singly connected microchannels of arbitrary cross-section. International Journal ofHeat and Mass Transfer, 50, 2492–2502.
Barnes, H. A. (2002). Viscosity. The University of Wales Institute of Non-NewtonianFluid Mechanics.
Bear, J. (1988). Dynamics of Fluids in Porous Media. Dover Publications Inc.
Bear, J. & Bachmat, Y. (1990). Introduction to Modelling of Transport Phenomena inPorous Media. Kluwer Academic Publishers.
Bird, R. B., Steward, W. E., & Lightfoot, E. N. (2007). Transport Phenomena. JohnWiley and Sons, Inc.
Case, J. (1957). The Strength of Materials. Edward Arnold Ltd.
Du Plessis, J. P. (1991). Saturated crossflow through a two-dimensional porous medium.Adv. Water Resources, 14 (3), 131–137.
Du Plessis, J. P. & Diedericks, G. P. J. (1997). Advances in Fluid Mechanics: FluidTransport in Porous Media, chapter 2, (pp. 61–104). 13. Computational MechanicsPublications.
Du Plessis, J. P. & Masliyah, J. H. (1988). Mathematical modelling of flow throughconsolidated isotropic porous media. Transport in Porous Media, 3, 145–161.
Du Plessis, J. P. & Masliyah, J. H. (1991). Flow through isotropic granular porous media.Transport in Porous Media, 6, 207–221.
Du Plessis, J. P. & Van der Westhuizen, J. (1993). Laminar Crossflow Through PrismaticPorous Domains. R&D Journal, 9 (2), 18–24.
Dukhan, N. (2006). Correlations for the pressure drop for flow through metal foam.Experiments in Fluids, 41, 665–672.
107
Stellenbosch University http://scholar.sun.ac.za
Fung, Y. C. (1977). A First Course in Continuum Mechanics. Prentice Hall, Inc.
Giesche, H. (2006). Mercury porosimetry: A general (practical) overview. Particle andParticle Systems Characterization, 23, 1–11.
Hughes, W. F. (1979). An Introduction to Viscous Flow. Hemisphere Publishing Corpo-ration.
Jackson, G. W. & James, D. F. (1986). The permeability of fibrous porous media. TheCanadian Journal of Chemical Engineering, 64, 364–374.
Jaganathan, S., Vahedi Tafreshi, H., Shim, E., & Pourdeyhimi, B. (2009). A study oncompression-induced morphological changes of non-woven fibrous materials. Colloidsand Surfaces A: Physicochemical and Engineering Aspects, 337, 173–179.
Ko lodziej, J. A., Dziecielak, R., & Konczak, Z. (1998). Permeability tensor for heteroge-neous porous medium of fibre type. Transport in Porous Media, 32, 1–19.
Korteland, S., Bottero, S., & Hassanizadeh, S. M. (2010). What is the correct definitionof average pressure? Transport in Porous Media, 84, 153–175.
Le Coq, L. (2008). Influence on permeability of the structural parameters of heterogeneousporous media. Environmental Technology, 29, 141–149.
Lloyd, C. (2003). Hydrodynamic permeability of staggered and non-staggered regular arraysof squares. MSc(Eng) thesis, Stellenbosch University, South Africa.
Lloyd, C. A., Du Plessis, J. P., & Halvorsen, B. M. (2004). On closure modelling of volumeaveraged equations for flow through two-dimensional arrays of squares. Proceedings ofthe Fith International Conference on Advances in Fluid Mechanics, Advances in FluidMechanics V (Editors: Brebbia, C.A., Mendes, A.C., and Rahman, M.), 85–93.
Mansfield, P. & Bencsik, M. (2001). Stochastic effects on single phase fluid flow in porousmedia. Magnetic Resonance Imaging, 19, 333–337.
Montillet, A. & Le Coq, L. (2003). Image analysis: A useful tool for porous mediacharacterization. Chemical Engineering and Technology, 26(12), 1285 – 1289.
Nabovati, A., Llewellin, E. W., & Sousa, A. C. M. (2009). A general model for thepermeability of fibrous porous media based on fluid flow simulations using the latticeBoltzmann method. Composites Part A: Applied Science and Manufacturing, 40, 860–869.
Pradhan, A. K., Das, D., Chattopadhyay, R., & Singh, S. N. (2012). Effect of 3D fiberorientation distribution on transverse air permeability of fibrous porous media. PowderTechnology, 221, 101–104.
Shah, R. K. & London, A. L. (1978). Laminar Flow Forced Convection in Ducts. AcademicPress.
Shou, D., Fan, J., & Ding, F. (2011). Hydraulic permeability of fibrous porous media.International Journal of Heat and Mass Transfer, 54, 4009–4018.
108
Stellenbosch University http://scholar.sun.ac.za
Skartsis, L., Kardos, J. L., & Khomami, B. (1992). Resin flow through fibre beds duringcomposite manufacturing processes. Part 1: Review of Newtonian flow through fiberbeds. Polymer Engineering and Science, 32, 221–230.
Smit, G. J. F., Du Plessis, J. P., & Du Plessis Sr., J. P. (2007). Modelling of airflowthrough a stack in a timber-drying kiln. Applied Mathematical Modelling, 31, 270 –282.
Steinke, M. E. & Kandlikar, S. G. (2006). Single-phase liquid friction factors in microchan-nels. International Journal of Thermal Sciences, 45, 1073–1083.
Tamayol, A. & Bahrami, M. (2009). Analytical determination of viscous permeability offibrous porous media. International Journal of Heat and Mass Transfer, 52, 2407–2414.
Tamayol, A. & Bahrami, M. (2011). Transverse permeability of fibrous porous media.Physical Review E, 83, (046314)1–9.
Tamayol, A., McGregor, F., & Bahrami, M. (2012). Single phase through-plane perme-ability of carbon paper gas diffusion layers. Journal of Power Sources, 204, 94–99.
Thompson, K. E., Gordon, A., & Cain, M. (2002). Pore-Scale Modeling of fluid transportin disordered fibrous materials. AIChE Journal, 48, 1369–1389.
Whitaker, S. (1986). Flow in Porous Media I: A theoretical derivation of Darcy’s law.Transport in Porous Media, 1, 3–25.
Whitaker, S. (1999). The Method of Volume Averaging. Kluwer Academic Publishers.
Worster, G. (2009). Understanding fluid flow. Cambridge University Press.
Woudberg, S. (2006). Laminar Flow through Isotropic Granular Porous Media. MSc(Eng)thesis, Stellenbosch University, South Africa.
Woudberg, S. (2012a). Comparative analysis of predictive equations for transfer processesin different porous structures. PhD thesis, Stellenbosch University, South Africa.
Woudberg, S. (2012b). A Geometric Pore-Scale Model for Predicting the Permeabilityof 3D Flow through Fibrous Porous Media. Proceedings of the Fourth InternationalConference on Porous media and its applications in Science, Engineering and Industry(Editor: Kambiz Vafai), 1453, 327–332.
Zade, A. Q., Renksizbulut, M., & Friedman, J. (2011). Heat transfer characteristics ofdeveloping gaseous slip-flow in rectangular microchannels with variable physical prop-erties. International Journal of Heat and Fluid Flow, 32, 117–127.
Zobel, S., Maze, B., Vahedi Tafreshi, H., Wang, Q., & Pourdeyhimi, B. (2007). Simulatingpermeability of 3-D calendered fibrous structures. Chemical Engineering Science, 62,6285–6296.
109
Stellenbosch University http://scholar.sun.ac.za

![Prediction of the Permeability of Fibrous Porous … the flow through fibrous porous media (e.g. [4-6]). The LBM does not directly solve for the governing macroscopic transport equations](https://img.pdfslide.net/doc/110x75/5cdb68f688c993a6778cad57/prediction-of-the-permeability-of-fibrous-porous-the-flow-through-fibrous-porous.jpg)