Embed Size (px)
Citation preview
Investigating the structure and function
of
the FtsH protease family in
Synechocystis sp. PCC 6803
Jianfeng Yu
Thesis submitted for the Degree of
Doctor of Philosophy
2013
Department of Life Science, Imperial College London
I hereby declare that this thesis, submitted in fulfilment of the requirement for the
degree of Doctor of Philosophy of Imperial College London, represents my own work
and that all else is appropriately referenced.
The copyright of this thesis rests with the author and is made available under a
Creative Commons Attribution Non-Commercial No Derivatives licence. Researchers
are free to copy, distribute or transmit the thesis on the condition that they attribute it,
that they do not use it for commercial purposes and that they do not alter, transform or
build upon it. For any reuse or redistribution, researchers must make clear to others
the licence terms of this work.
2
Abstract
FtsH proteases are found throughout nature and contain a conserved ATPase domain,
flanked by an N-terminal transmembrane domain and a Zn2+
-binding protease domain.
They play diverse roles in maintaining cellular activity. In the case of oxygenic
photosynthetic organisms, FtsH-mediated degradation of damaged D1 protein is
crucial for the operation of the photosystem II repair cycle needed to prevent
photoinhibition. Four FtsH homologues are present in the model cyanobacterium
Synechocystis sp. PCC 6803. One of these, FtsH2 (Slr0228), is known to be important
for D1 degradation. However the structure of the FtsH2 complex is unknown and little
is known about the structure and function of the other FtsH homologues. In this work,
all four FtsH homologues were isolated via C-terminal GST tagging in tandem with
affinity chromatography. Analysis of the purified FtsH complexes revealed the
presence of FtsH1(Slr1390)/FtsH3(Slr1604) and FtsH2/FtsH3 heterocomplexes,
whereas FtsH4 (Sll1463) appeared to form homocomplexes. Single particle analysis
using electron microscopy revealed that the FtsH2-GST/FtsH3 complex was a
hexameric particle of diameter ~120 Å with the two types of protomer alternately
arranged around the central pore. Inactivation of the protease activity of FtsH2 did not
abolish the function of the FtsH2/FtsH3 complex. FtsH2 and FtsH4 are mainly
localised in the thylakoid membranes, whereas FtsH3 is dual targeted to both
thylakoid and cytoplasmic membranes. FtsH1 is likely to be present in the
cytoplasmic membrane. In vitro studies of E. coli over-expressed cytosolic domains of
FtsH from Thermosynechococcus elongatus confirmed that the FtsH2, FtsH3 and
FtsH4 homologues exhibited both ATPase and CTPase activity but that only FtsH4
could degrade casein. Homologues of E.coli YccA (Sll1150) and Arabidopsis EGY2
(Sll0862) were co-purified with the FtsH2-GST/FtsH3 complex. However,
preliminary studies suggest neither is critical for FtsH-mediated D1 degradation.
Strikingly, Psb29 (Sll1414) was found to be important for accumulation of
FtsH2/FtsH3 complex, but further work is required to determine the mechanism.

3
Acknowledgements
Firstly, I would like to thank our collaborators, in particular Dr Jon Nield at Queen
Mary University of London for solving the protein structure works, and Prof. Michael
Hippler at University of Munster for processing the mass spectrometry samples. Their
support and contribution are invaluable.
Secondly, I would like to thank Prof. Conrad Mullineaux and his team at Queen Mary
University of London for helping us with fluorescence microscopy. I especially thank
Dr Samantha Bryan and Miss Joanna Sarchaz for their kind support.
It was a pleasure to have worked along with Dr Marko Boehm at the beginning of this
project, his guidance and support, both as friend and colleague has been inspirational.
I would also like to thank Dr Myles Barker for his contribution in the preliminary
work, of which paved way to the smooth progress of this project. I would like to offer
special thanks to Dr Franck Michoux, who has been mentoring me when I first came
to this lab as a master student, and equipped me with the essential skills I use daily in
the lab. I am also grateful to the rest members in the photosynthesis groups, the
friendly and active atmosphere is enjoyable, keep it up!
Finally, I sincerely thank my supervisor Prof. Peter Nixon for offering me such a great
and unusual opportunity to become a PhD student. The past four years have been a
life changing experience; I have learnt so much knowledge and improved logical
thinking, though still not quite there yet. I really appreciate all the help and guidance
from him.
Also, I acknowledge the funding body BBSRC and Imperial College London for
supporting my study.
4
Contents
Abstract ............................................................................................................................................. 2
Acknowledgements ........................................................................................................................... 3
Contents ............................................................................................................................................ 4
List of figures .................................................................................................................................... 7
List of tables ...................................................................................................................................... 8
Abbreviations .................................................................................................................................... 9
Chapter 1: General introduction ................................................................................................... 12
1.1 The evolutionary and global impact of photosynthesis .................................................... 12
1.2 The molecular mechanisms of photosynthesis ................................................................. 14
1.2.1 Linear electron transport chain of oxygenic photosynthesis ................................ 16
1.2.2 Major differences between cyanobacterial and chloroplastic systems ................. 19
1.2.3 Insight into the structure and function of cyanobacterial PS II ............................ 21
1.3 Cyanobacteria as model organisms in photosynthesis research ....................................... 24
1.4 The current model of PSII de novo assembly .................................................................. 26
1.4.1 The assembly of PSII ........................................................................................... 26
1.4.2 The localisation of PSII assembly ........................................................................ 31
1.5 Photoinhibition and PSII repair ........................................................................................ 32
1.5.1 Molecular mechanisms for photoinhibition of PSII ............................................. 32
1.5.2 Photodamage and repair ....................................................................................... 34
1.5.3 Putative protective mechanisms against photoinhibition ..................................... 34
1.5.4 PSII repair cycle ................................................................................................... 42
1.5.5 FtsH-mediated D1 degradation ............................................................................ 44
1.6 General introduction to the FtsH family of proteases ...................................................... 45
1.6.1 The AAA+ superfamily of proteases.................................................................... 46
1.6.2 Structure of FtsH proteases .................................................................................. 47
1.6.3 Structure of the cytosolic domains of FtsH and proposed mechanism of action . 49
1.6.4 General functions of FtsH proteases in bacteria .................................................. 50
1.7 Evolutionary conservation and diversity of FtsH proteases in plastids and mitochondria
............................................................................................................................................... 51
1.8 FtsH homologues in cyanobacteria Synechocystis sp. PCC6803 ..................................... 52
1.9 Project aims ...................................................................................................................... 53
Chapter 2: Materials and Methods ............................................................................................... 55
2.1 Bioinformatic tools .......................................................................................................... 55
2.2 Standard solutions and buffers ......................................................................................... 56
2.3 E. coli strains and growth conditions ............................................................................... 56
2.3.1 E. coli strains ........................................................................................................ 56
2.3.2 E. coli growth conditions ..................................................................................... 56
2.4 Cyanobacterial strains and growth conditions ................................................................. 57
2.4.1 Cyanobacterial strains .......................................................................................... 57
2.4.2 Cyanobacterial growth conditions ....................................................................... 57
5
2.5 Estimation of cell concentration of liquid E. coli and cyanobacterial cultures ................ 58
2.6 DNA associated techniques .............................................................................................. 59
2.6.1Vectors and recombinant plasmids ........................................................................ 59
2.6.2 Agarose gel electrophoresis ................................................................................. 59
2.6.3 DNA purification from agarose gels .................................................................... 60
2.6.4 DNA amplification by polymerase chain reaction (PCR) .................................... 60
2.6.5 Restriction endonuclease digestion ...................................................................... 66
2.6.6 DNA ligation ........................................................................................................ 67
2.6.7 DNA transformation of cells ................................................................................ 67
2.6.8 DNA extraction and purification .......................................................................... 69
2.6.9 Estimation of DNA concentration and quality ..................................................... 70
2.6.10 DNA sequencing ................................................................................................ 71
2.6.11 Construction of the C-terminal tagging cassettes ............................................... 71
2.7 Protein biochemistry techniques ...................................................................................... 79
2.7.1 Small-scale crude membrane preparation ............................................................ 79
2.7.2 Protein purification techniques ............................................................................ 80
2.7.3 Polyacrylamide gel electrophoresis (PAGE) ........................................................ 83
2.7.4 Detection of the FtsH homologues, immunoblotting analysis ............................. 84
2.7.5 Assay for nucleoside triphosphatase activity ....................................................... 87
2.7.6 Assay for proteolytic activity ............................................................................... 88
2.7.7 Protein N-terminal sequencing............................................................................. 88
2.7.8 Confocal fluorescence microscopy ...................................................................... 89
2.7.9 Single-particle analysis ........................................................................................ 89
2.7.10 Protein identification via mass spectrometry analysis ....................................... 90
Chapter 3: FtsH complexes in Synechocystis, composition, localisation and structure .............. 92
3.1 Probing the composition of FtsH proteases ..................................................................... 92
3.1.1 Construction of ftsH::gst mutants ........................................................................ 93
3.1.2 Genotyping of the SynFtsHxGSTery mutants ...................................................... 93
3.1.3 Phenotype analysis of SynFtsHxGSTery mutants ................................................ 95
3.1.4 Isolation of the GST-tagged FtsH complexes ...................................................... 96
3.1.5 N-terminal sequence analysis of purified FtsH proteases .................................... 98
3.2 Probing the localisation of FtsH complexes ................................................................... 100
3.2.1 Construction of ftsH::gfp mutants...................................................................... 100
3.2.2 Genotyping of the SynFtsHxGFPcam mutants .................................................. 101
3.2.3 Immunochemical detection of the FtsH(x)-GFP recombinant proteins ............. 103
3.2.4 Phenotype analysis of SynFtsHxGFPcam mutants ............................................ 106
3.2.5 Localisation of FtsH complexes in situ .............................................................. 108
3.2.6 Localisation of FtsH via immunoblotting analysis ............................................ 110
3.3 Structure of an FtsH2GST/FtsH3 complex .................................................................... 111
3.3.1 Characterisation of the SynFtsH2GST mutant ................................................... 112
3.3.2 Isolation of the FtsH2-GST/FtsH3 complexes ................................................... 114
3.3.3 EM structure of the FtsH2-GST/FtsH3 complex ............................................... 115
3.4 Discussion ...................................................................................................................... 117
6
3.4.1 Composition of FtsH complexes in Synechocystis ............................................. 117
3.4.2 Membrane targeting system ............................................................................... 118
3.4.3 Localisation of FtsH proteases in Synechocystis ................................................ 121
3.4.4 Structure of hetero-oligomeric FtsH complexes ................................................ 122
Chapter 4: Functional characterisation of FtsH proteases in vivo and in vitro .......................... 124
4.1 Functional analysis of FtsH-deficient mutants ............................................................... 124
4.1.1 Defining the functional domains of each cyanobacterial FtsH. ......................... 124
4.1.2 Construction of deletion strains ......................................................................... 126
4.1.3 Genotyping of the ftsH2 and ftsH4 deletion mutants ......................................... 128
4.1.4 Immunochemical detection of FtsH2 and FtsH4 in the deletion mutants .......... 130
4.1.5 Phenotype analysis of the deletion strains ......................................................... 132
4.2 Construction of FtsH site-directed mutants .................................................................... 134
4.2.1 Construction of site-directed mutagenesis transformation vectors .................... 135
4.2.2 Generation of tag-free protease inactive mutants of FtsH2 ................................ 138
4.2.3 Generation of GST-tagged FtsH mutants ........................................................... 140
4.3 Physiological influence of the C-terminal GST tag on FtsH protease activity .............. 142
4.3.1 Construction and phenotype analysis of the mutants ......................................... 142
4.3.2 Isolation of FtsH4 complexes from SynFtsH4GSTΔ2 ....................................... 144
4.4 In vitro characterisation of FtsH homologues ................................................................ 145
4.4.1 Defining the FtsH homologues from Thermosynechococcus elongatus ............ 146
4.4.2 Construction of the expression vectors and transformation of the E. coli
expression strain ......................................................................................................... 147
4.4.3 Expression and purification FtsH2, 3 and 4 fragments from E. coli .................. 149
4.4.4 NTPase activity of Δ(tm)FtsH4, Δ(tm)FtsH2strep and Δ(tm)FtsH3 .................. 151
4.4.5 Proteolytic activity of Δ(tm)FtsH2, Δ(tm)FtsH3 and Δ(tm)FtsH4 ..................... 152
4.5 Discussion ...................................................................................................................... 153
4.5.1 The dispensability of subunits within FtsH hetero-complex .............................. 153
4.5.2 Effect of C-terminal GST tag on FtsH function ................................................. 154
4.5.3 Types of FtsH complex in the thylakoid membranes ......................................... 156
4.5.3 Nucleotides hydrolysis and proteolytic activity of Δ(tm)FtsH4, Δ(tm)FtsH2 and
Δ(tm)FtsH3 ................................................................................................................. 157
Chapter 5: Probing physiological function and regulatory mechanisms of FtsH in Synechocystis
159
5.1 Identification of potential substrates and auxiliary proteins .......................................... 159
5.1.1 Potential substrates/auxiliary proteins co-purified with FtsH proteases ............ 159
5.1.2 Probing the function of Sll0862 and Sll1150 ..................................................... 161
5.2 Role of Psb29 in accumulation of the FtsH2/3 complex ................................................ 167
5.2.1 Construction of the Psb29 defective mutants ..................................................... 167
5.2.2 Probing the FtsH level in Psb29 defective mutants ........................................... 168
5.2.3 Phenotype analysis of the Psb29 defective mutant ............................................ 170
5.3 Discussion ...................................................................................................................... 172
5.3.1 Identification of co-purifying proteins ............................................................... 172
5.3.2 A role for Psb29 in controlling levels of the FtsH2/3 complex .......................... 176
7
Chapter 6: Conclusions and future work .................................................................................... 178
6.1 FtsH complexes in Synechocystis, composition, localisation and structure ................... 178
6.2 Functional characterisation of FtsH proteases in vivo and in vitro................................. 181
6.3 Probing physiological function and regulatory mechanisms of FtsH in Synechocystis . 184
6.4 Future work .................................................................................................................... 186
References ..................................................................................................................................... 189
Appendix ....................................................................................................................................... 214
List of figures
Figure 1.1: Schematic representation of oxygenic photosynthesis. ............................. 15
Figure 1.2: Higher plant photosynthetic electron transport. ........................................ 18
Figure 1.3: Schematic representation of subunit composition of PSII.. ...................... 21
Figure 1.4: Structural details of cyanobacterial PSII. .................................................. 22
Figure 1.5: Membrane systems in a Synechocystis cell. .............................................. 24
Figure 1.6: De novo assembly of PSII in (a) cyanobacteria and (b) chloroplasts. ...... 30
Figure 1.7: Model for the PSII repair cycle of cyanobacteria. ..................................... 43
Figure 1.8: Schematic maps of the FtsH complex-mediated photosystem II repair
cycle model. ................................................................................................................. 45
Figure 1.9: Schematic representation of bacterial FtsH proteases. .............................. 48
Figure 2.1: Cloning strategy and construct scheme. .................................................... 72
Figure 2.2: Construction of the backbone vector carrying ftsH flanking sequences. .. 73
Figure 2.3: Construction of GST tagging vectors. ....................................................... 75
Figure 2.4: Schematic representation of GST tagging cassettes. ................................. 76
Figure 2.5: Construction of GFP tagging vectors. ....................................................... 78
Figure 2.6: Construction of GFP tagging cassettes. ..................................................... 79
Figure 3.1: Construction of the pFtsHxGSTery transformation vectors. ..................... 93
Figure 3.2: Genotyping of the SynFtsHxGSTery mutants. .......................................... 94
Figure 3.3: Growth experiment of SynFtsHxGSTery mutants. ................................... 95
Figure 3.4: Affinity purification of GST-tagged FtsH complexes from each of the
SynFtsHGSTery mutants.............................................................................................. 97
Figure 3.5: N-terminal sequence of mature FtsH proteases. ........................................ 99
Figure 3.6: Construction of the pFtsHxGFPcam transformation vectors. ................. 101
Figure 3.7: Genotyping of the SynFtsHxGFPcam mutants. ...................................... 102
Figure 3.8: Immunoblotting analysis on ftsH::gfp mutants. ...................................... 104
Figure 3.9: Immunochemical detection of FtsH(x)-GFP recombinant proteins. ....... 105
Figure 3.10: Growth experiment of SynFtsHxGFPcam mutants. .............................. 107
Figure 3.11: Wild type cells (WT-G) under fluorescence microscopy. ...................... 108
Figure 3.12: ftsH::gfp mutants under fluorescence microscopy. ............................... 109
Figure 3.13: Localisation of FtsH via immunoblotting analysis. ............................... 111
Figure 3.14: SynFtsH2GST expressing FtsH2-GST behaves like WT-G. ................. 113
8
Figure 3.15: Affinity purification of FtsH2-GST. ...................................................... 115
Figure 3.16: Three-Dimensional Modeling of the GST-Tagged FtsH2/FtsH3 complex.
.................................................................................................................................... 116
Figure 4.1: Alignment of the cyanobacterial FtsH homologues. ............................... 126
Figure 4.2: Construction of the FtsH2 and FtsH4 knockout vectors. ........................ 127
Figure 4.3: Genotyping of the ftsH2 and ftsH4 deletion mutants. ............................. 129
Figure 4.4: Immunochemical detection of FtsH2 and FtsH4. .................................... 131
Figure 4.5: Growth experiment of ftsH knock out mutants. ...................................... 133
Figure 4.6: Construction of the FtsH mutagenesis vectors. ....................................... 137
Figure 4.7: Growth experiment of FtsH2 mutants. .................................................... 139
Figure 4.8: Immunochemical detection of FtsH4(R)-GST recombinant proteins. .... 141
Figure 4.9: Growth experiment of SynFtsH1GSTΔ24, SynFtsH2GSTΔ4 and
SynFtsH4GSTΔ2 mutants. ......................................................................................... 143
Figure 4.10: Isolation of FtsH4 complexes from SynFtsH4GSTΔ2. ......................... 145
Figure 4.11: Phylogeny of FtsH orthologs between Synechocystis sp. PCC 6803 and T.
elongatus. ................................................................................................................... 147
Figure 4.12: Construction of the cytosolic-FtsH expression vectors. ........................ 149
Figure 4.13: Over-expression and purification of Δ(tm)FtsH4, Δ(tm)FtsH2strep and
Δ(tm)FtsH3. ............................................................................................................... 150
Figure 4.14: Preliminary test on the nucleotide specificity of Δ(tm)FtsH2, 3 and 4. 152
Figure 4.15: A fluorescence-based quantitative protease assay trial. ......................... 153
Figure 5.1: Proteins co-purified with FtsH2GST/FtsH3 complex. ............................ 160
Figure 5.2: Construction of Sll0862 defective mutants. ............................................ 163
Figure 5.3: Construction of Sll1150 defective mutants. ............................................ 164
Figure 5.4: Growth experiment of Sll0862 and Sll1150 defective mutants. .............. 166
Figure 5.5: Construction and characterisation of Psb29 defective mutants. .............. 168
Figure 5.6: Probing the FtsH level in a psb29 null mutant. ....................................... 169
Figure 5.7: Growth experiment of Psb29 defective mutant. ...................................... 171
List of tables
Table 2.1: List of E. coli strains ................................................................................... 56
Table 2.2: Illumination intensities in growth experiments ........................................... 58
Table 2.3: Commercial plasmid vectors used in this study. ......................................... 59
Table 2.4: Antibiotic resistance cassettes used to construct mutants. .......................... 59
Table 2.5: List of PCR primers used in this project. .................................................... 62
Table 2.6: Design of the short-peptide FtsH antibodies. .............................................. 86
Table 4.1: List of candidate residues targeted for site-directed mutagenesis and the
supporting references. ................................................................................................ 135
Table 4.2: List of the site-directed mutants chosen for construction in this work. .... 136
Table 4.3: List of mutants obtained. ........................................................................... 140
9
Table 4.4: Fragments of FtsH chosen for expression in E. coli ................................. 148
Abbreviations
ADP adenosine diphosphate
APS ammonium persulphate
APX ascorbate peroxidase
ATP adenosine-5’-triphosphate
β-DM n-dodecyl-β-D-maltoside
bp base pairs
BSA bovine serum albumin
cab chlorophyll a/b binding
CET cyclic electron transport chain
Chl chlorophyll
CtpA C-terminal processing protease
CTP cytosine-5’-triphosphate
Cx X-fold symmetry
Cyt b559 cytochrome b559
Cyt b6f cytochrome b6f complex
DCMU 3-(3,4-dichlorophenyl)-1,1-dimethylurea
dNTP 2’deoxyribonucleoside triphosphate
ΔpH proton gradient
EDTA ethylenediaminetetraacetic acid
EF-G elongation factor G
EM electron microscopy
FNR ferredoxin-NADP+ reductase
FRP fluorescence recovery protein
FtsH filament temperature sensitive H
GFP green fluorescent protein
GST glutathione S-transferase
GTP guanosine-5’-triphosphate
GWP global warming potential
HEPES 4-(2-hydroxyethyl)-1-piperazineethanesulfonic acid
Hv light
i-AAA inter-membrane space facing mitochondrial FtsH family protease
iD1 intermediate D1
IPTG isopropyl-ß-D-thiogalactopyranoside
kb kilo base pairs
kDa kilo Dalton
LB Luria-Bertani medium
LET linear electron transport chain
LHCI/II light-harvesting complex on photosystem I or photosystem II
10
LPS lipopolysaccharide
m-AAA matrix facing mitochondrial FtsH family protease
MOPS 3-(N-morpholino)propanesulfonic acid
NADP+ oxidised β-nicotinamide adenine dinucleotide phosphate
NADPH reduced β-nicotinamide adenine dinucleotide phosphate
NPQ non-photochemical chlorophyll fluorescence quenching
NrtA nitrate/nitrite transport system substrate-binding protein
OCP orange carotenoid binding protein
ODX( nm) optical density at X (nm) wavelength
OEC oxygen-evolving complex
P680 primary electron donor of photosystem II
P700 primary electron donor of photosystem I
PAA polyacrylamide
PAGE polyacrylamide gel electrophoresis
PBS phosphate buffered saline
PC plastocyanin
PCR polymerase chain reaction
PD protease domain
pD1 precursor D1 protein
PDM PratA-defined membrane
Phe pheophytin
PQ plastoquinone
PSI photosystem I
PSII photosystem II
QA plastoquinone molecule bound to D2
QB plastoquinone molecule bound to D1
qE energy-dependent non-photochemical chlorophyll fluorescence quenching
qI photoinhibitory non-photochemical chlorophyll fluorescence quenching
qT state-transition non-photochemical chlorophyll fluorescence quenching
RC reaction-centre complex
RNA ribonucleic acid
RO reverse osmosis
ROS reactive oxygen species
rpm rounds per minute
Rubisco ribulose 1,5-biphosphate carboxylase/oxygenase
S0-4 manganese cluster water oxidation centre S-states 0-4
SbtA sodium bicarbonate transporter A
SDS sodium dodecyl sulphate
SRH second region of homology
TAE tris-acetate-EDTA buffer
TE tris-EDTA buffer
TEM transmission electron microscopy
TEMED N-N-N’-N’-tetramethylethylenediamine
11
TES N-tris[hydroxymethyl]methyl-2-aminoethanesulfonic acid
Tg teragram
TM transmembrane domain
TPR tetratricopeptide repeat protein
Tris 2-amino-2-hydroxy-methylpropane-1,3-diol
TW terra (1012
) Watts
Tween-20 polyoxyethylene sorbitan monolaurate
UTP uridine-5’-triphosphate
UTR untranslated region
UV-B ultraviolet light
v/v volume per volume
w/v weight per volume
WT wild-type
WT-G glucose-tolerant wild-type
X-Gal 5-bromo-4-chloro-3-indolyl-β-D-galactopyranoside
YD redox active tyrosine on D2
YZ redox active tyrosine on D1
12
Chapter 1: General introduction
1.1 The evolutionary and global impact of photosynthesis
Photosynthesis is the process that converts light energy into chemical energy; it
captures light energy and stores it in chemical bonds by converting carbon dioxide
from the atmosphere into organic compounds such as sugar (Arnon 1971). This
process provides food, fuel and materials that are essential to daily life (Barber and
Tran 2013). The release of dioxygen through oxygenic photosynthesis has had a great
evolutionary impact on directing the evolution of life forms on earth (Kerr 2005). Free
oxygen did not exist in the earth atmosphere until ~2 billion years ago, at which point
oxygen produced by photosynthesis gradually accumulated and shifted the reducing
atmosphere of earth to an oxidizing form; oxygen-breathing life forms did not appear
until the oxygen level stabilized at ~20 % of atmospheric composition (Brimblecombe
and Davies, 1981).
Nowadays, mankind is facing great challenges from food shortages,
over-consumption of fossil fuels and climate change caused by excessive emission of
CO2 (Harries et al. 2001). Understanding photosynthesis could potentially help to
tackle these problems by improving crop yields, producing renewable energy and
more efficiently capturing CO2 from the atmosphere.
According to figures released in the “Global Environment Outlook environment for
development (GEO-4)”, released by the end of 2007 by United Nations, the world
population in 2007 was 6.7 billion, three times larger since the beginning of the 20th
century. Moreover, the increase between 1987 and 2007 was 1.7 billion, a 34 % rise
of population within the past 20 years; in other words, the growth of population has
accelerated. The UN predicted the world population will hit 8 billion in the year 2025,
which is another 20 % increase; the consequent demand for food and energy has been
13
listed as one of the top priorities by officials. Meanwhile, the land suitable for
agriculture is limited and so to prevent environmental degradation and loss of
biodiversity, therefore, it is crucial to increase yields on existing cropland (Cassman
1999; Tilman et al. 2002).
How to power 8 billion people through the 21st century is another problem. Certainly
the reliance on fossil fuel is unsustainable and catastrophic, not only because the fossil
fuel sources are depleting rapidly, but also the release of CO2 into the atmosphere
directly promotes global warming (Harries et al. 2001). The global surface
temperature has increased 0.74 ± 0.18 oC between the start and the end of the 20
th
century (IPCC); further climate warming may reduce the stability of marine dissolved
methane hydrate, and hence increase the methane seepage rate from 30 Tg to 90 Tg
per year (Hill et al. 2006). Methane is a greenhouse gas which has a global warming
potential (GWP) value of 25, whereas for carbon dioxide it is 1. The large emission of
methane is likely to worsen the current climate change issues. Therefore, exploring
alternative, carbon-neutral energy sources is essential and urgent for mankind before
ecosystems get irreversibly damaged.
To generate the 20 TW of power that mankind requires per year, solar energy with a
theoretical annual availability of 100,000 TW (Barber 2007) out competes others like
water hydroelectric (~ 4.6 TW) and wind (50 TW) (de Winter and Swenson, 2006).
On the other hand, the conversion of solar energy into biomass by photosynthesis is
rather inefficient, currently between 0.1 and 1 % (Barber 2007). Storing 20 TW of
power into biomass would mean that 30 % of the entire land area on Earth needs to be
cultivated (Barber 2007). Therefore, there is a necessity and a huge potential to
increase the efficiency of solar energy conversion. One possible route is to reduce the
impact of photoinhibition on photoautotrophs when exposed to excessive light
illumination, so as to help keep the photosynthetic system operating under stressful
14
conditions. As part of this goal, this thesis aims to characterise the FtsH family of
proteases which play a major role in protecting photosynthetic organisms against light
damage.
1.2 The molecular mechanisms of photosynthesis
Photosynthesis has been investigated over centuries so that the major chemical
reactions and many of the molecular machineries participating in photosynthesis are
now known in detail. To review the progress towards understanding photosynthesis,
important milestones achieved in the history of photosynthesis research are described
in the following paragraphs.
The foundation of photosynthesis research was established by Jan Ingenhousz in 1779,
when he discovered that light plays an important physiological role in plants. Since
then, it took almost a century to formulate the first minimal balanced chemical
equation of photosynthesis (See Equation 1.1).
CO2 + H2O → (CH2O) + O2 (Equation 1.1)
However, the equation was formulated based on oxygenic photosynthesis, which is
performed by cyanobacteria, algae and plants, and cannot apply to anoxygenic
photosynthetic organisms, e.g. green sulphur and purple bacteria. With a deeper
understanding of both oxygenic and anoxygenic pathways, in 1931, Cornelis van Niel
formulated a refined photosynthesis equation that is adaptable to both pathways (See
Equation 1.2).
2H2A + CO2 → (CH2O) + 2A + H2O (Equation 1.2)
van Niel’s equation was proposed based on the hypothesis that both oxygenic and
anoxygenic photosynthesis share similar metabolic pathways in which a hydrogen
donor (H2A) was photodissociated and the released proton is used in the
light-independent reaction to catalyse the reduction of CO2 to form carbohydrates.
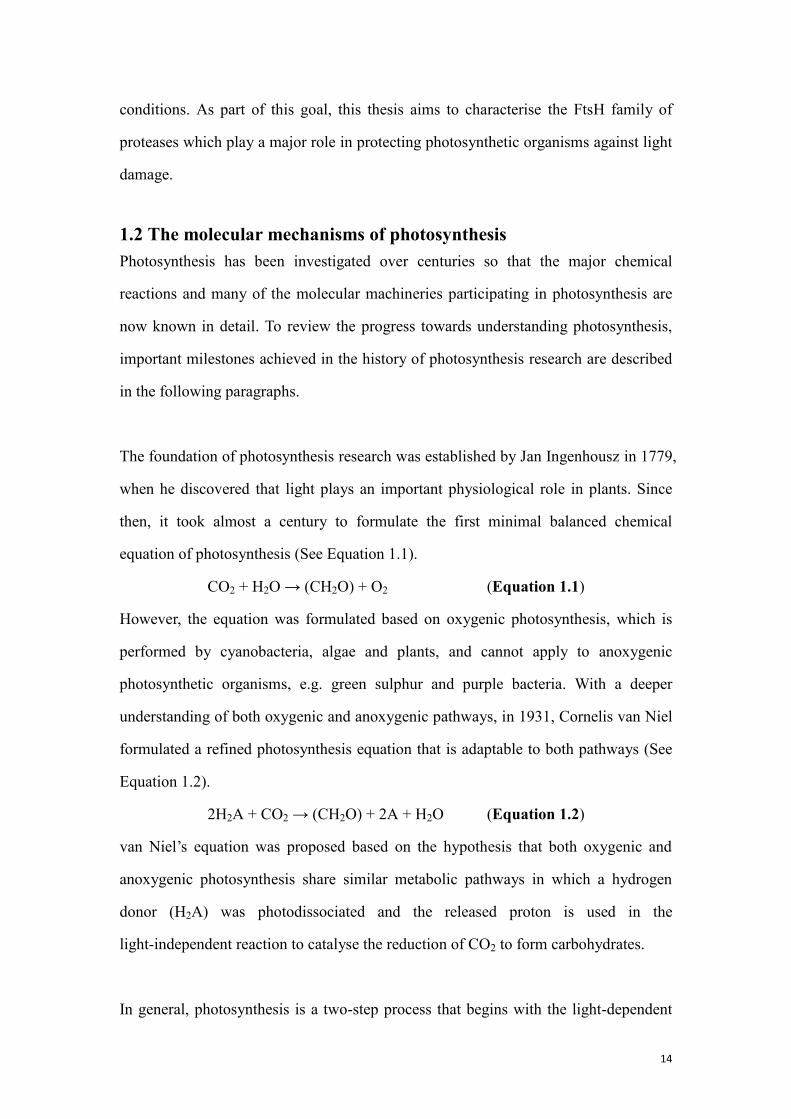
In general, photosynthesis is a two-step process that begins with the light-dependent
15
reaction, where light energy is used to initiate electron flow across photosynthetic
complexes, which subsequently drives the light-independent reactions, also known as
Calvin-Benson cycle, by supplying ATP to aid the fixation of CO2 into carbohydrates
(Arnon 1971). The key feature that differentiates oxygenic photosynthesis from the
anoxygenic pathway lies in the light-dependent reaction, where H2O is split inside
photosystem II to produce electrons, protons and O2 molecules. Notably, unlike
electrons and protons, which immediately participate in subsequent reactions, the
molecular oxygen released from water splitting is a by-product of oxygenic
photosynthesis which does not contribute to downstream reactions (Figure 1.1). In
contrast, organisms performing anoxygenic photosynthesis are lacking photosystem II,
hence unable to catalyse H2O as the electron donor.
Figure 1.1: Schematic representation of oxygenic photosynthesis.
The key reactants involved in the light-dependent and light-independent reactions of
oxygenic photosynthesis are represented in this cartoon. For further details refer to
text.
Over the past centuries, photosynthesis has always been considered an important topic
and has been studied extensively. Benefiting from recent technologies, a number of
breakthroughs, especially in the field of structural biology, have been made in the last
16
decade. The major events in photosynthesis are now mostly understood, including the
structures of many photosynthetic complexes (see section 1.2.2 and 1.2.3), the nature
of the linear electron transport chain (LET) and the CO2 fixation pathway (see section
1.2.1). On the other hand, there are still important gaps in knowledge that need to be
filled, including the regulatory mechanisms underpinning the assembly and turnover
of photosynthetic protein complexes, and the control and mechanisms of cyclic
electron flow (CET).
1.2.1 Linear electron transport chain of oxygenic photosynthesis
Unlike the anoxygenic pathway that is only adopted by a limited number of
photosynthetic bacteria, oxygenic photosynthesis is a highly conserved process
performed by the majority of photosynthetic organisms, including cyanobacteria,
algae and plants. Four protein complexes, photosystem II (PSII), cytochrome b6f (Cyt
b6f), photosystem I (PSI) and ATP synthase, participate in the light-dependent reaction
of oxygenic photosynthesis (Figure 1.2). Notably, PSII is unique to oxygenic
photosynthesis, and also it is where the linear electron transport chain (LET) begins.
When light energy is captured by the light-harvesting antenna of PSII, excitation
energy is passed to the primary electron donor P680 (P for pigment, 680 for maximum
absorption at 680nm) which triggers electron flow. The oxidising potential of
P680+/P680 is sufficient to drive the splitting of water at the oxygen-evolving
complex (OEC), a Mn4Ca cluster located on the lumenal side of PSII. The generated
electrons are transferred to Cyt b6f, a plastoquinol:plastocyanin oxidoreductase, via
the plastoquinone pool, and then passed to PSI via plastocyanin. Notably, the passage
of electrons within Cyt b6f further increases the proton concentration in the lumen.
The pH gradient (ΔpH) across the thylakoid membrane drives the ATP synthase and
ATP is produced when protons in the lumen pass through the transmembrane channel
of the ATP synthase. Similar to PSII, PSI uses photons to elevate the energy of
electrons on the electron donor P700, with the released electron ultimately passed to
17
ferredoxin, which subsequently produces NADPH via the ferredoxin-NADP+
reductase (FNR). NADPH is the main reducing molecule used in the Calvin-Benson
cycle to produce carbohydrates. Oxidised P700+ is subsequently reduced by an
electron donated by reduced plastocyanin. Therefore, electrons from the oxidation of
water are passed between PSII, Cyt b6f and PSI in series, where the product of one
becomes the substrate of the other (Hill and Bendall, 1960; Hill and Rich, 1983). The
electron energy is elevated in PSII and PSI to enable electron flow through the LET,
which is plotted as the Z-scheme of oxygenic photosynthesis (Figure 1.2 A).
18
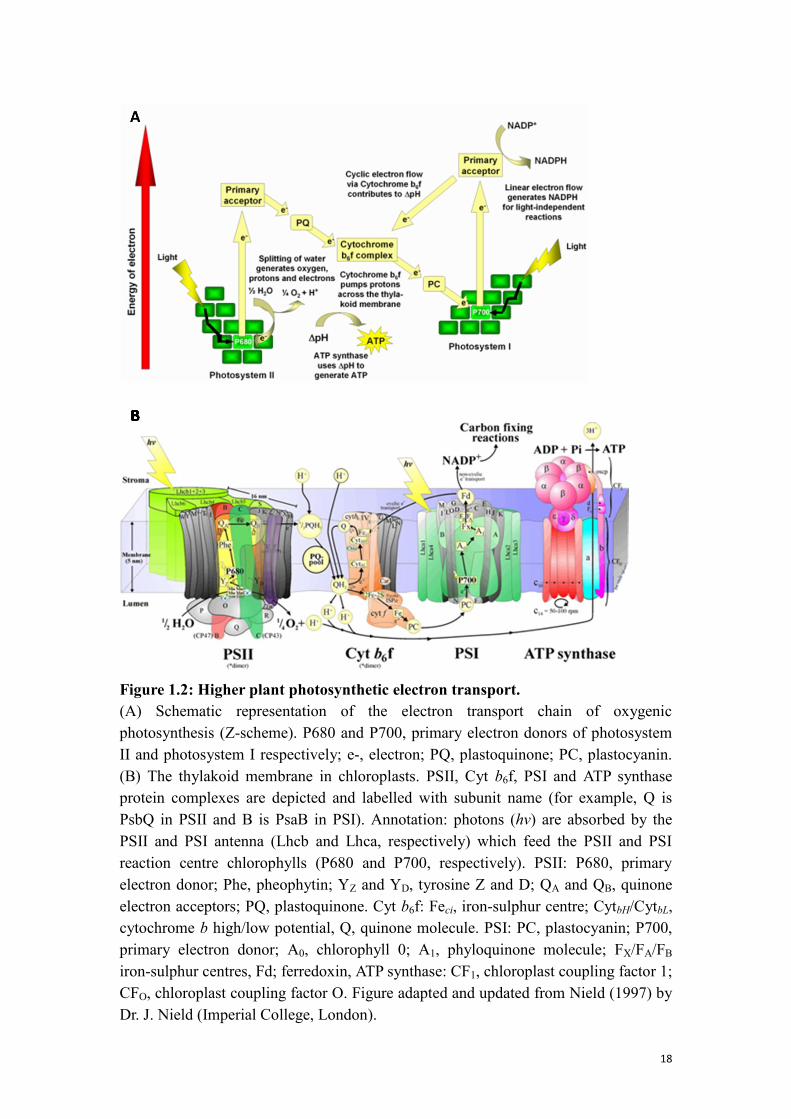
Figure 1.2: Higher plant photosynthetic electron transport.
(A) Schematic representation of the electron transport chain of oxygenic
photosynthesis (Z-scheme). P680 and P700, primary electron donors of photosystem
II and photosystem I respectively; e-, electron; PQ, plastoquinone; PC, plastocyanin.
(B) The thylakoid membrane in chloroplasts. PSII, Cyt b6f, PSI and ATP synthase
protein complexes are depicted and labelled with subunit name (for example, Q is
PsbQ in PSII and B is PsaB in PSI). Annotation: photons (hv) are absorbed by the
PSII and PSI antenna (Lhcb and Lhca, respectively) which feed the PSII and PSI
reaction centre chlorophylls (P680 and P700, respectively). PSII: P680, primary
electron donor; Phe, pheophytin; YZ and YD, tyrosine Z and D; QA and QB, quinone
electron acceptors; PQ, plastoquinone. Cyt b6f: Feci, iron-sulphur centre; CytbH/CytbL,
cytochrome b high/low potential, Q, quinone molecule. PSI: PC, plastocyanin; P700,
primary electron donor; A0, chlorophyll 0; A1, phyloquinone molecule; FX/FA/FB
iron-sulphur centres, Fd; ferredoxin, ATP synthase: CF1, chloroplast coupling factor 1;
CFO, chloroplast coupling factor O. Figure adapted and updated from Nield (1997) by
Dr. J. Nield (Imperial College, London).
19
1.2.2 Major differences between cyanobacterial and chloroplastic systems
Both cyanobacteria and chloroplasts perform oxygenic photosynthesis. Although there
are many features exclusively adapted to each system, the major photosynthetic
machineries inside cyanobacteria and chloroplasts share significant similarities that
have been retained through evolution. The light-dependent reactions in both systems
occur within the thylakoid membrane via LET through PSII, Cyt b6f, and PSI with
ATP made at the ATP synthase. Overall the structure and function of the four protein
complexes are highly conserved. The major differences that distinguish the two
systems are the dynamic arrangement of the thylakoid membrane (Andersson and
Anderson 1980; Mullineaux 1999) in chloroplasts and the different light-harvesting
antenna complexes attached to the photosystems (Grossman et al. 1995; Grossman et
al. 1993).
In chloroplasts, the shape of thylakoid membranes can switch between stacked
disk-shape cylinders (grana or appressed lamellae) and interconnecting membranes
sheets (stroma or non-appressed lamellae), depending on the light intensity
(Andersson and Anderson 1980). The dynamic membrane system is believed to be a
regulatory mechanism that controls the reception of light-energy into the system. PSII
and the respective light-harvesting antenna complexes are mainly located in the grana
lamellae, whereas PSI and its antenna, along with ATP synthase are only located in
the stroma lamellae (Dekker and Boekema 2005). Moreover, the Cyt b6f protein
complex is evenly distributed across thylakoid membranes (Allred and Staehelin
1986). On the other hand, thylakoid membranes in the cyanobacterium Synechocystis
sp. PCC 6803 (hereafter Synechocystis) are present as three to ten concentric circular
sheets near the cytoplasmic membrane (Figure 1.5), and the protein distribution is
rather homogeneous, although more PSI complexes have been found in the outermost
layers (Sherman et al. 1994).
20
Light-harvesting antennae are membrane protein complexes that interact with the
photosystems. Their role is to capture additional light-energy and feed it to the
photosynthetic electron transport chain (Grossman et al. 1995). The antennae in
chloroplasts are termed light-harvesting complexes (LHCI for PSI and LHCII for
PSII), containing both chlorophyll a and b. The antennae in cyanobacteria on the other
hand, are phycobilisomes, in which biliprotein-rods are arranged in a fanlike-fashion
around a biliprotein-core. Unlike light-harvesting complexes in chloroplasts,
phycobilisomes are peripheral membrane proteins (Grossman et al. 1993; Hankamer
et al. 2001).
It is also worth noting that the composition of PSII in chloroplasts is very similar, but
not identical, to that in cyanobacteria. The major difference occurs in the identity of
the peripheral subunits: PSII in chloroplasts contains PsbP and PsbQ, instead of PsbU
and PsbV in cyanobacterial PSII, bound to the lumenal side of the complex. However,
distant homologues of PsbP and PsbQ are found in cyanobacteria but their role
remains unresolved (Nixon et al. 2010). In addition, PsbR and PsbTn, which have no
cyanobacterial counterpart, also appear to be extrinsically attached to the OEC of
chloroplast PSII (Barber et al. 1997). Nevertheless, the core structure of PSII from
both eukaryotic and prokaryotic organisms, which includes D1, D2, CP43, CP47 and
the oxygen-evolving complex, is highly conserved (Fig 1.3).
21
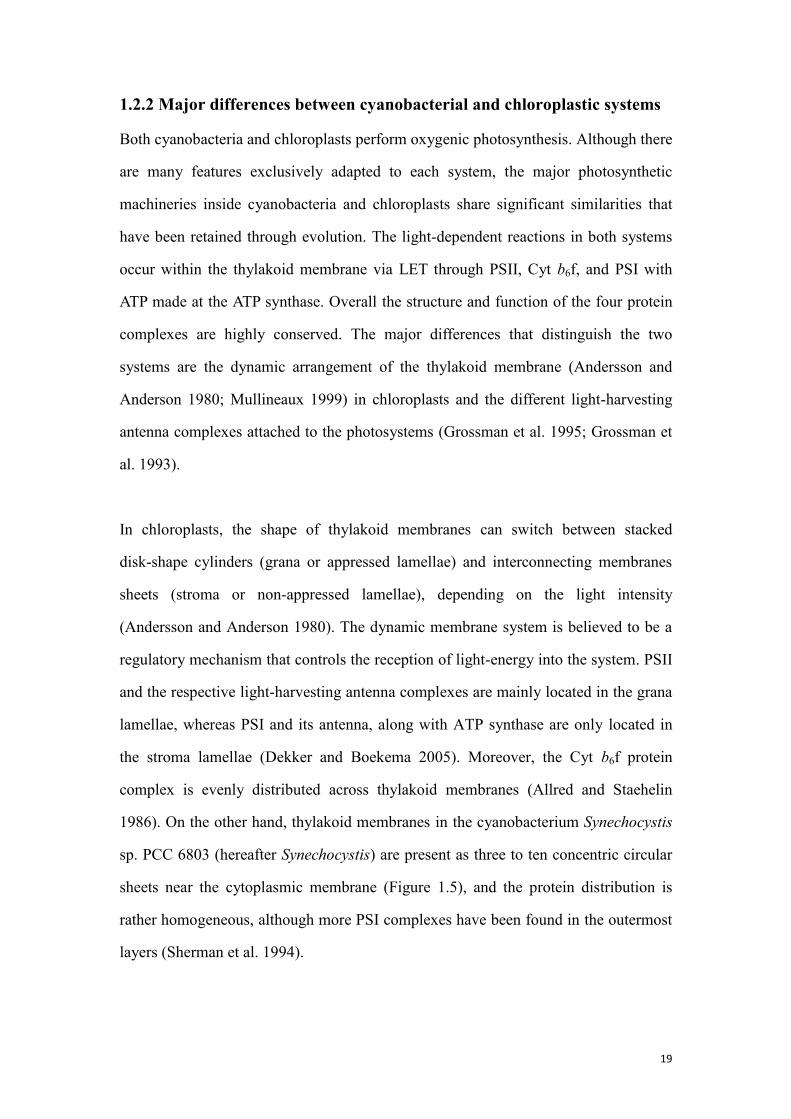
Figure 1.3: Schematic representation of subunit composition of PSII..
Homologous proteins from cyanobacteria (A) and chloroplasts (B) are labelled in
identical colours. PSII subunits represented in gray boxes are proteins designated as
Psb*, where * is the letter labelled in the box (e.g. “I” for PsbI). The dark yellow
boxes labelled E and F represent cytochrome b559 (Cyt b559), and the extrinsic subunits
are plotted as pink circles. The large, fan-shape structure in blue represents the
light-harvesting antenna complex on top of the cyanobacterial PSII, whereas, its
counterpart in chloroplast is labelled LHCII and presented as a dark-green box
flanking the subunits. This figure is adapted from (Nickelsen and Rengstl 2013).
1.2.3 Insight into the structure and function of cyanobacterial PS II
PSII is a light-driven water:plastoquinone oxidoreductase, which catalyses oxygen
evolution at the OEC (Nixon et al. 2010b). In the past 10 years there has been
dramatic progress in understanding the structure of PSII from cyanobacteria (Ferreira
et al. 2004; Liu et al. 2004; Umena et al. 2011; Zouni et al. 2001).
Overall, PSII is a large protein-pigment complex that resides in the thylakoid
membrane. The latest crystal structure revealed that each monomer in dimeric
cyanobacterial PSII consists of 17 transmembrane subunits and 3 peripheral subunits,
35 chlorophylls, two pheophytins, 11 β-carotenes, more than 20 lipids, two
plastoquinones, two haem irons, one non-haem iron, four manganese atoms, three or
four calcium atoms, three Cl- ions and one bicarbonate ion, with a total molecular
mass of 350 kDa (Umena et al. 2011).
22
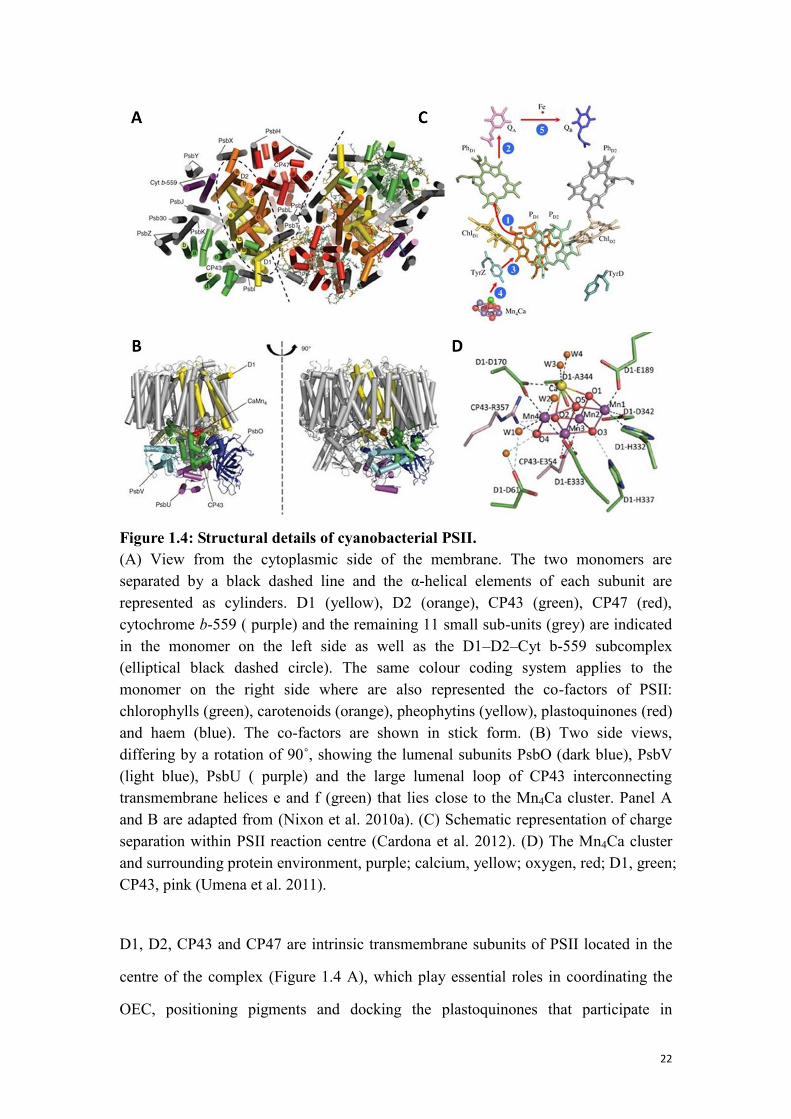
Figure 1.4: Structural details of cyanobacterial PSII.
(A) View from the cytoplasmic side of the membrane. The two monomers are
separated by a black dashed line and the α-helical elements of each subunit are
represented as cylinders. D1 (yellow), D2 (orange), CP43 (green), CP47 (red),
cytochrome b-559 ( purple) and the remaining 11 small sub-units (grey) are indicated
in the monomer on the left side as well as the D1–D2–Cyt b-559 subcomplex
(elliptical black dashed circle). The same colour coding system applies to the
monomer on the right side where are also represented the co-factors of PSII:
chlorophylls (green), carotenoids (orange), pheophytins (yellow), plastoquinones (red)
and haem (blue). The co-factors are shown in stick form. (B) Two side views,
differing by a rotation of 90˚, showing the lumenal subunits PsbO (dark blue), PsbV
(light blue), PsbU ( purple) and the large lumenal loop of CP43 interconnecting
transmembrane helices e and f (green) that lies close to the Mn4Ca cluster. Panel A
and B are adapted from (Nixon et al. 2010a). (C) Schematic representation of charge
separation within PSII reaction centre (Cardona et al. 2012). (D) The Mn4Ca cluster
and surrounding protein environment, purple; calcium, yellow; oxygen, red; D1, green;
CP43, pink (Umena et al. 2011).
D1, D2, CP43 and CP47 are intrinsic transmembrane subunits of PSII located in the
centre of the complex (Figure 1.4 A), which play essential roles in coordinating the
OEC, positioning pigments and docking the plastoquinones that participate in
23
light-induced electron transport within the complex (Figure 1.4 B). The initial
light-induced charge-separation is driven by P680, which is a cluster of pigments
composed of four chlorophyll a (PD1/PD2 and ChlD1/ChlD2) and two pheophytin a
molecules (PhD1/PhD2) that absorb around 680 nm (Figure 1.4 C). Shortly after
excitation, the excited state of P680 is stabilised by initiating electron transfer among
the co-factors. Firstly, P680 donates an electron to pheophytin, PhD1, thence to the
first quinone, QA, which acts as a one electron redox couple linking PhD1 to the
second quinone, QB. After electron donation, P680+ is subsequently reduced by
electron transfer from OEC via a tyrosine residue on D1, called Tyrz or Yz.
The detailed structure of OEC, the catalytic centre where water is split to produce
electrons and molecular oxygen, from T. vulcanus was solved via X-ray
crystallography (Umena et al. 2011). It is a cubic Mn4CaO5 cluster that is
progressively oxidised by Yz to enable substrate water molecules to be oxidised
(Figure1.4 D). The detailed water oxidation process is still not fully understood,
however, the model proposed by Kok et al. in 1970 (Kok et al. 1970), also known as
the Kok cycle, is largely consistent with the available experimental evidence.
According to the Kok cycle model, the OEC exists in 5 different S-states or oxidation
states. Stepwise oxidation of the S-states occurs upon each turnover of the PSII
reaction centre with oxidation of water triggered by formation of the S4 state. Even
though the structure of the OEC has been solved, and artificial oxygen-evolving
catalysts inspired by and sharing structural similarities with the OEC have been
successfully developed (Rivalta et al. 2012; Symes et al. 2013), the mechanism of
water splitting is unknown. The X-ray crystal structure of PSII identified 4 water
molecules within hydrogen bonding distance of the Mn4CaO5 cluster, of which two
(W2 and W3) (Figure 1.4 D) may be possible substrates of the reaction. However, it
still cannot be excluded that one of the oxo-bridges in the OEC, at O5, is involved in
forming molecular oxygen (Umena et al. 2011). Furthermore, protons released from
24
water oxidation are likely to be channelled out of the complex via a hydrogen-bond
network (Umena et al. 2011).
1.3 Cyanobacteria as model organisms in photosynthesis research
Cyanobacteria are related to the most ancient prokaryotes that able to perform
oxygenic photosynthesis, and are closely related to the organisms that gave rise to
chloroplasts in plants and eukaryotic algae via endosymbiosis (Gould et al. 2008).
Like chloroplasts, cyanobacteria perform photosynthesis via protein complexes
embedded in a thylakoid membrane system (Figure 1.3). Because of the strong
structural and genetic similarities between photosynthetic systems in cyanobacteria
and chloroplasts, cyanobacteria are often used as model organisms to study
photosynthesis.
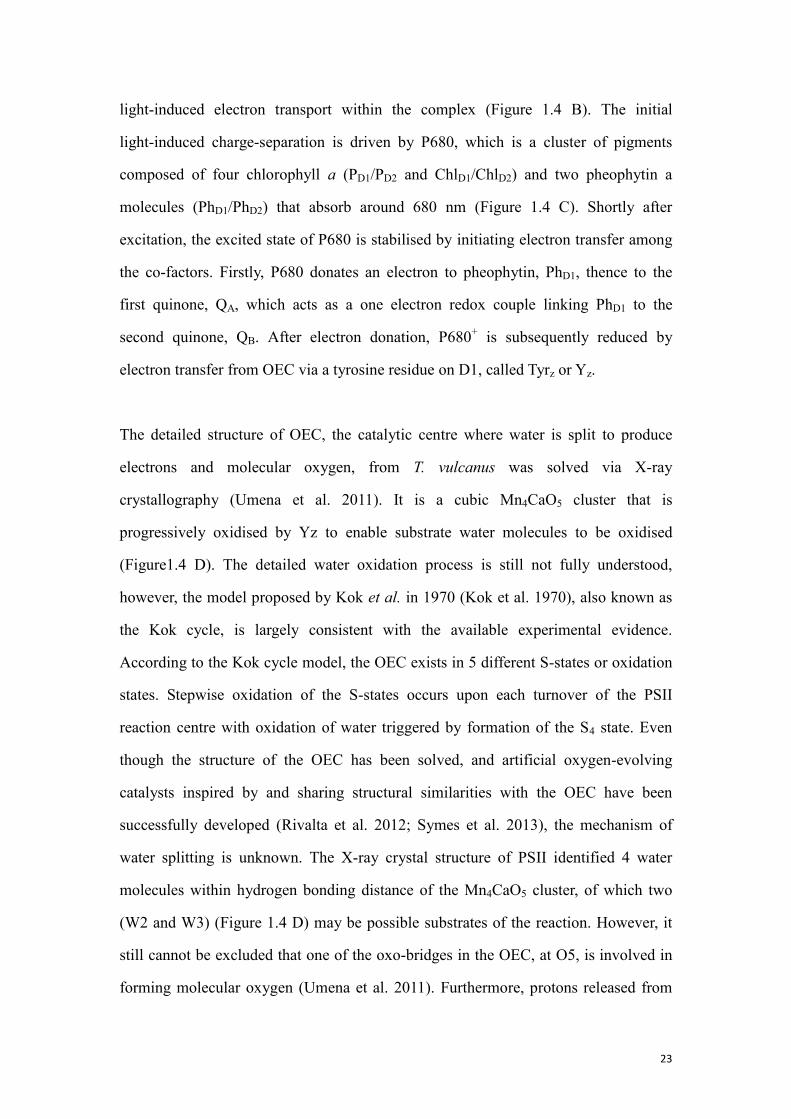
Figure 1.5: Membrane systems in a Synechocystis cell.
(A) Transmission electron micrograph of a dividing Synechocystis cell illustrating
thylakoid membranes (arrowheads) that occur along the periphery of the cytoplasm.
Scale bar = 400 nm. (B) Schematic overview of a cyanobacterial cell. Indicated are:
thylakoid membranes (green) that contain photosynthetic and respiratory complexes
and that separate the cytoplasm from the lumen; the cytoplasmic membrane (yellow)
that separates the cytoplasm from the periplasm; and the outer membrane and cell
wall. (Adapted from Vermaas 2001).
The cyanobacterium Synechocystis sp. PCC 6803 (hereafter Synechocystis) is one of
the model strains used in photosynthetic research. It can grow both
25
photoautotrophically and photoheterophically (Okamoto et al. 1999; Williams 1988a);
it is naturally transformable (Adami et al. 2005; Williams 1988a) and its genome has
been fully sequenced.
Synechocystis is a great tool to study the function of genes in vivo, as it is very easy to
transform and fast growing, which means obtaining a mutant is usually possible
within a time-frame of 1-2 months. More importantly, a natural mutant of
Synechocystis, namely the glucose-tolerant wild-type strain (hereafter WT-G), is
capable of using glucose as an alternative carbon source in the absence of PSII
activity, hence inactivation of photosynthesis in this strain does not result in lethality
in the presence of low concentrations of glucose (Williams 1988b). Furthermore,
Synechocystis cells can be easily stored under cryo-conditions to reduce the chance of
incurring spontaneous mutations during long periods of maintenance.
On the other hand, for protein structural studies, another cyanobacterium, namely
Thermosynechococcus elongatus, has proven more advantageous. T. elongatus is a
thermophilic strain, originally found in a hot spring, which has an optimal growth rate
at 55oC, hence the proteins in this strain are more thermo-stable which offers a better
chance to yield structural data. Structures of many cyanobacterial proteins, including
PSII (Ferreira et al. 2004), were solved using native or E. coli over-expressed
recombinant protein of T. elongatus, e.g. Psb27 (Michoux et al. 2012). Although many
mutants have been made in this organism in the past decade, transformation of T.
elongatus is still a great challenge. Although T. elongatus has been shown to be
naturally transformable in some labs (Onai et al. 2004), most transformation protocols
require a combination of electroporation and a delicate recovery growth period (Iwai
et al. 2004), which is difficult to reproduce under different laboratory environments.
Also, unlike strain WT-G of Synechocystis, none of the T. elongatus strains has been
found capable of using an alternative carbon source, therefore, it is difficult to study
26
genes encoding essential photosynthetic proteins via mutagenesis. Overall,
Synechocystis is a preferred strain to study the physiological functions of proteins in
vivo, whereas proteins of T. elongatus are more desirable for in vitro applications.
1.4 The current model of PSII de novo assembly
PSII is a large protein-pigment complex consisting of at least 20 subunits and
localised in the thylakoid membrane (see section 1.2.2 and 1.2.3). The assembly of
PSII is a highly organised event involving auxiliary proteins (see section 1.4.1). In
both cyanobacteria and chloroplasts, the de novo assembly of PSII is spatially
organised (see section 1.4.2).
1.4.1 The assembly of PSII
Currently, the assembly of PSII is considered to occur by two distinctive pathways
(reviewed by (Nickelsen and Rengstl 2013)): (1) the de novo assembly of PSII and (2)
the PSII repair cycle (see section 1.5.4). The investigation of PSII assembly has been
mostly based on analysing the subunit composition of intermediate complexes that are
blocked at different stages of assembly either in mutants lacking essential PSII
subunits or lacking auxiliary proteins assisting the assembly process (Nickelsen and
Rengstl 2013). PSII is a massive complex consisting of at least 20 subunits and there
are still many gaps in the model to be filled. Nevertheless, a few key stages of PSII
assembly have now been elucidated. It is thought that assembly of PSII requires
coordination of protein synthesis, translocation, post-translational modification and
the biosynthesis of co-factors and the lipid bilayer membrane. In the case of
eukaryotic cells, in which many photosynthesis-related proteins are encoded by the
nuclear genome, gene expression is also regulated between the nuclear and
chloroplast genomes (Zhang et al. 2009). As would be expected from their close
evolutionary relationship, many aspects of PSII assembly are rather conserved in
cyanobacteria, green algae and higher plants.
27
The assembly of PSII begins with the formation of reaction-centre complex (RC),
where the D1 and D2 subunits form a hetero-dimeric complex. The integration of D1
requires assistance from several auxiliary protein assembly factors. The precursor D1
subunit (pD1) requires Alb3/Oxa1/YidC family insertases (Slr1471, Alb3) to aid
folding and integration into the thylakoid membrane (Ossenbuhl et al. 2004;
Ossenbuhl et al. 2006), CtpA (C-terminal processing protease) is also required to
cleave the C-terminal extension of pD1 leaving space to dock the OEC and extrinsic
proteins (Roose and Pakrasi 2004). Interestingly, unlike in plants, where the 9 residues
at the C-terminal extension is removed by CtpA in a single step, the 16 residues at the
C-terminus of cyanobacterial D1 is cleaved in two steps, giving rise to an intermediate
form of D1 (iD1) which is mainly detected in the RC (Komenda et al. 2007a).
Although the C-terminal extension is not essential for the assembly of PSII, mutants
lacking the extension region exhibit decreased fitness (Ivleva et al. 2000; Kuvikova et
al. 2005), indicating the D1 processing step contributes towards correct assembly.
PratA, a periplasmic, tetratricopeptide repeat (TPR) protein, is another assembly
factor found associated with formation of the RC complex in cyanobacteria. PratA is
thought to act as a molecular scaffold for the assembly process and is potentially
involved in the C-terminal processing of pD1. More importantly, it has been shown to
deliver Mn2+
to D1, providing hints that the formation of OEC begins at very early
stage of PSII de novo assembly (Klinkert et al. 2004; Schottkowski et al. 2009a;
Stengel et al. 2012). D2 plays a dominant role in accumulation of chlorophyll a
(Komenda et al. 2004), which raises the possibility that the D2 sub-complex might act
as an anchor for enzymes involved in chlorophyll biosynthesis and subsequent loading
of the pigments into the RC (Komenda et al. 2012b). An early integration of
co-factors is generally believed to be beneficial as the co-factors would no longer
require carriers to translocate through membrane interfaces and also potential toxicity
is minimised. From the protein point of view, efficient integration of co-factors can
also stabilise the apoproteins and avoid unnecessary degradation (Eichacker et al.
28
1996; Komenda et al. 2012b).
Formation of the RCII complex is thought to be aided by the Ycf48 assembly factor
(HCF136 in Arabidopsis thaliana). Ycf48 is a seven-bladed beta-propeller that is
believed to play a scaffolding role to stabilise the complex (Nixon et al. 2010b).
Notably, although evidence of direct interaction between Ycf48 and D1 is still lacking,
data from yeast two-hybrid analysis showed that Ycf48 interacts with pD1 but not
with mature D1 (Komenda et al. 2008). The RC complex is then attached to one of the
two inner antenna-proteins CP47 to form the RC47 complex (Boehm et al. 2011). The
PAM68 auxiliary protein appears to play an important role in assembly of larger PSII
complexes derived from the RC, and is currently thought to play a bridging role
between PSII core proteins in the assembly process. Psb28 is another assembly
protein identified at this stage (Kashino et al. 2002; Shi et al. 2012). Although the
structure of Psb28 has been solved, little is known about its function (Yang et al.
2011). Physiological analysis showed that Psb28 might play a role in chlorophyll
biosynthesis and/or be associated with the biosynthesis of the inner-antenna protein
CP47, and the PSI subunits PsaA and PsaB (Dobakova et al. 2009).
Some PSII assembly factors display more diverse cellular functions, in particular,
exhibiting interactions with multiple proteins and even PSI subunits, e.g. Psb28.
Assembly factor Psb27 is a lumenal lipoprotein that binds transiently to CP43,
monomeric PSII and even dimeric PSII and PSI (Komenda et al. 2012a; Nowaczyk et
al. 2006; Roose and Pakrasi 2008). The major function of Psb27 might be to prevent
premature binding of extrinsic subunits to enable post-translational processing at the
lumenal side of the complexes (Roose and Pakrasi 2008). Strikingly, deletion of
LPA19, the homologue of Psb27 in A. thaliana, results in impaired C-terminal
processing of pD1, and disruption of the second homologue Psb27-H1 leads to
decreased PSII repair efficiency (Chen et al. 2006). Therefore, in plants, the functions
29
of the two homologues of Psb27 seem to have diverged (Nickelsen and Rengstl 2013).
Available data suggest Sll0606 (in Synechocystis), LPA2 and LPA3 (in A. thaliana)
are auxiliary proteins involved in assembly of CP43, the second inner-antenna.
Surprisingly, the three proteins share no homology, suggesting that PSII assembly at
this stage diverged between prokaryotes and eukaryotes.
Upon attachment of the CP43 sub-complex, the extrinsic subunits dock onto the
lumenal side of PSII. Two assembly factors from A. thaliana have been implicated to
assist the process, CYP38 and LTO1. CYP38 is a member of the immunophilin family
that mediates immune suppression (Nickelsen and Rengstl 2013), and is believed to
bind to the E-loop of CP47 and assist D1 folding (Vasudevan et al. 2012), whereas,
LTO1 is a lumenal thiol oxidoreductase that catalyzes the formation of disulphide
bonds in PsbO (Karamoko et al. 2011). Several proteins have been suggested to
involve in the dimerization of PSII, including Alb3 insertase and FKBP20-2 in A.
thaliana.
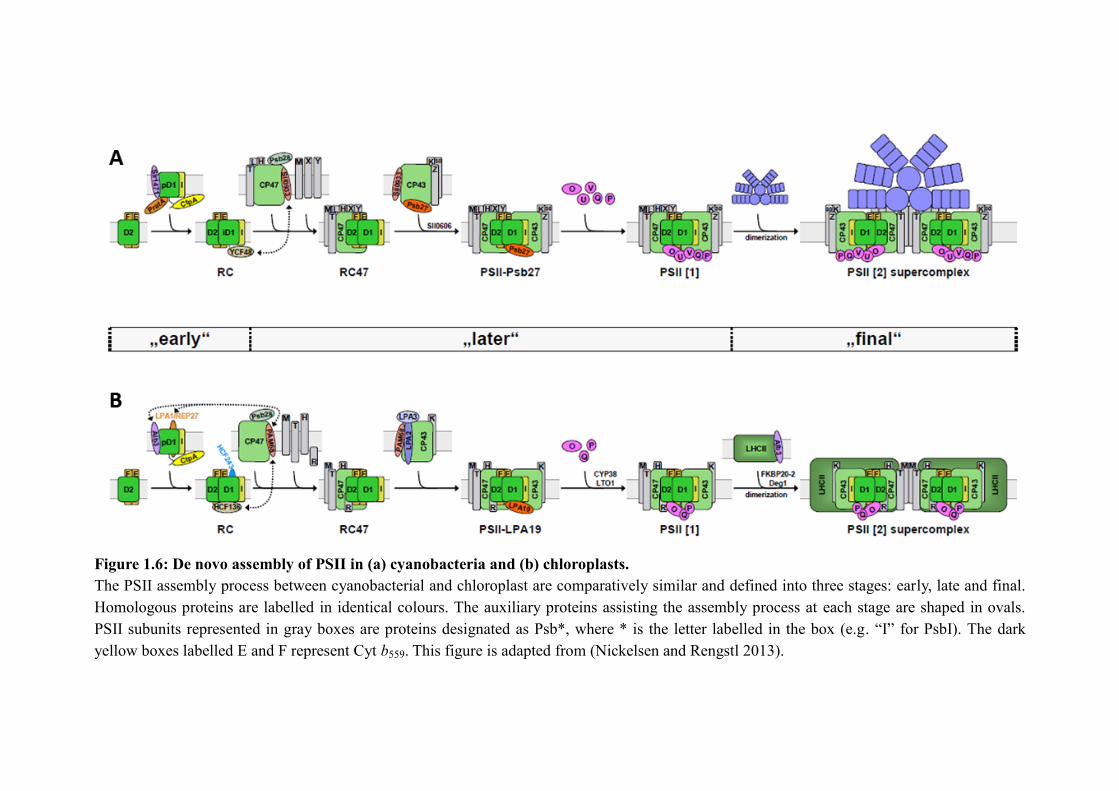
Figure 1.6: De novo assembly of PSII in (a) cyanobacteria and (b) chloroplasts.
The PSII assembly process between cyanobacterial and chloroplast are comparatively similar and defined into three stages: early, late and final.
Homologous proteins are labelled in identical colours. The auxiliary proteins assisting the assembly process at each stage are shaped in ovals.
PSII subunits represented in gray boxes are proteins designated as Psb*, where * is the letter labelled in the box (e.g. “I” for PsbI). The dark
yellow boxes labelled E and F represent Cyt b559. This figure is adapted from (Nickelsen and Rengstl 2013).
1.4.2 The localisation of PSII assembly
Assembly of PSII appears to be a highly organised event occurring at distinctive
regions of the membrane (Stengel et al. 2012). In the case of the cyanobacterium
Synechocystis, the de novo assembly of the D1/D2 reaction centre is located in
specific membrane regions termed the PratA-defined membrane (PDM) due to the
enriched accumulation of membrane-associated PratA (Schottkowski et al. 2009a).
PratA is an auxiliary protein of PSII assembly involved in the maturation of pD1 (see
section 1.4.1). Localisation studies showed PratA is also required for correct
localisation of some PSII assembly factors such as Ycf48 and Slr1471, indicating
PratA is not only a resident, but also involved in the development of the PDM region
(Rengstl et al. 2011). Interestingly, PratA is a periplasmic protein, which does not
have direct contact with the internal thylakoid membrane system. Therefore, PDM is
believed to be localised at the junctions where thylakoid and cytoplasmic membranes
make contact (Figure 1.5), so that assembled RC can be transported to thylakoid
membranes for the subsequent assembly steps. It is worth noting that the composition
of PDM has been experimentally confirmed to have both cytoplasmic and thylakoid
membranes (Schottkowski et al. 2009a), and a recent structural study suggested PDMs
are attached to the thylakoid centre, a rod-like structure connecting both membranes
(Nickelsen and Rengstl 2013). Moreover, enzymes and precursor products associated
with chlorophyll biosynthesis have also been identified in PDMs (Rengstl et al. 2011;
Schottkowski et al. 2009b), indicating that a pipeline of biosynthesis and integration
of co-factors might spatially be organised in the same region to coordinate the
assembly process.
Chloroplasts in plants are considered to have originated from cyanobacteria via
endosymbiosis, and have outer and inner chloroplast envelope membranes instead of
outer and cytoplasmic membranes. The thylakoid system in higher plant chloroplasts
is more complex than that of cyanobacteria, the localisation of photosynthetic
32
complexes is stringently partitioned in grana and stroma lamellae (see section 1.2.2).
The highly organised and dynamic membrane system enables efficient energy
harvesting and stress protection. However, the compact granal stacks restrict the
access of ribosomes, hence it has been proposed that protein synthesis in chloroplasts
occurs exclusively on the stroma lamellae (Yamamoto et al. 1981). This model is
further backed by protein analysis, which showed the distribution of PSII
subcomplexes is directly correlated to the height of the grana stacks (Danielsson et al.
2006).
1.5 Photoinhibition and PSII repair
The chemistry involved in light-driven water oxidation process eventually leads to
damage to the PSII protein complex (Mattoo et al. 1984). In both chloroplasts and
cyanobacteria, an effective mechanism is available to repair inactivated PSII (see
section 1.5.4). Under illumination at moderate and low light intensities, the repair rate
of PSII is able to match the rate of photodamage to maintain photosynthetic activity.
However, when the repair rate fails to keep up with that of the damage, the overall
photosynthesis rate will decline in a phenomenon termed chronic photoinhibition
(Ohad et al. 1984). Although the molecular mechanism of photoinhibition is still
under intense debate (see section 1.5.1), the consequent result of photoinhibition is the
irreversible damage to PSII proteins and mainly the reaction centre protein D1.
1.5.1 Molecular mechanisms for photoinhibition of PSII
Beyond the phenomenon of photoinhibition, it is widely agreed that photoinhibition
occurs at the reaction centre of PSII, especially the D1 subunit, which undergo rapid
turnover under strong light illumination (Aro et al. 1993b; Ohad et al. 1994; Prasil et
al. 1992). However, the details regarding the mechanisms of photodamage are still
under intense debate (Murata et al. 2012). Two distinctive routes of photoinhibition
have been proposed on the basis of the available data from both in vitro and in vivo
studies.
33
The classic acceptor-side model (Aro et al. 1993a; Barber and Andersson 1992; Long
et al. 1994; Vass et al. 1992), established on the basis that reactive oxygen species
(ROS) are responsible for photoinhibition, suggests that under continuous strong
illumination, the constant electron flow from PSII can lead to an over-reduced
plastoquinone-pool, which might lead to a double reduction of QA and consequently
causing its dissociation from D2 (Styring et al. 1990; Vass et al. 1992). As an essential
element for electron transfer, dissociation of QA blocks electron flow within PSII,
leading to enhanced accumulation of P680 triplet states (3P680) which will then react
with triplet oxygen (3O2), eventually resulting in the production of reactive oxygen
species (ROS) (Vass et al. 1992). Other than dissociation of QA under strong
illumination, ROS might also be produced via charge-recombination between QB- and
the S-states under low-light conditions (Keren et al. 2005a; Mattoo et al. 1984).
In contrast to the acceptor-side model which requires the presence of ROS, the
donor-side model for photoinhibition is oxygen independent. It has been shown that
the action spectrum of photodamage to PSII resembled the absorption spectra of
manganese compounds (Hakala et al. 2005; Ohnishi et al. 2005; Sarvikas et al. 2006).
Indeed various manganese compounds are also susceptible to light-induced damage
(Antal et al. 2009; Hakala et al. 2006; Wei et al. 2011). Hence it is possible that the
inactivation of PSII begins with damage and dissociation of the OEC. Consequently,
without the supply of electrons from OEC, the cofactors at the reaction centre of PSII
might form highly oxidizing radicals that are capable of extracting electrons from the
surrounding protein moiety or PSII as a whole (Chen et al. 1992; Klimov et al. 1990).
The key evidence supporting the donor-side inhibition theory is based on in vivo
studies showing manganese ions from OEC are the primary target of photodamage
(Hakala et al. 2005; Ohnishi et al. 2005), hence electrons from donor-side are the
limiting factors in photoinhibition. Although recent evidence suggests that ROS are
34
not directly causing damage to PSII, but rather inhibiting the repairing process (see
section 1.5.3.1), it does not rule out the possibility that QA dissociation and charge
recombination might contribute to photoinhibition.
1.5.2 Photodamage and repair
The phenomenon of photoinhibition as a whole is the result of imbalance in the rates
of damage and repair. Hence studies on photoinhibition require consideration of both
photodamage and PSII repair. With well-established experimental procedures in both
plants (Moon et al. 1995) and cyanobacteria (Gombos et al. 1994; Murata et al. 2012;
Wada et al. 1994), photodamage can be analysed separately from PSII repair by
blocking the biosynthesis of D1 using antibiotics that inhibit protein synthesis, e.g.
lincomycin. The separate analysis of photodamage and repair has shown that the rate
of photodamage to PSII has a clear linear correlation with light intensity, whereas the
repair rate reaches its maximum at a light intensity of 200 to 400 µE.m-2
.s-1
white
light (Allakhverdiev and Murata 2004). Hence repair of PSII is indeed the rate
limiting step that leads to photoinhibition. Several mechanisms have been found to
participate in the protection of PSII against photoinhibition, including the expression
of various genes associated with ROS scavenging enzymes (Asada 1999; Di Mascio
et al. 1990; Neely et al. 1988), non-photochemical quenching (NPQ) (Bugos and
Yamamoto 1996; Lindahl et al. 2000) and dissipation of energy into other electron
transport pathways (Murata et al. 2012).
1.5.3 Putative protective mechanisms against photoinhibition
Photosynthetic organisms have evolved a range of protective mechanisms to prevent
photoinhibition. In this section, a few putative protective mechanisms used by
cyanobacteria and higher plants are described, including the mediation of reactive
oxygen species (see section 1.5.3.1), non-photochemical quenching (see section
1.5.3.2) and energy dissipation though alternative pathways (see section 1.5.3.3).
35
1.5.3.1 Protection against reactive oxygen species (ROS)
In general, ROS present in cells are the by-product of aberrant energy transfer from
the photosystems to molecular oxygen (3O2). It could be singlet oxygen (
1O2), which
might be the result of energy transfer from chlorophyll molecules to 3O2 (Knox and
Dodge 1985; Zolla and Rinalducci 2002), or superoxide radicals (O2·- ) formed when
electrons at the acceptor-side of PSI are transferred to 3O2, which could further be
converted to hydrogen peroxide (H2O2) and into hydroxyl radicals (·OH) (Asada
1999). In the initial acceptor-side model of photoinhibition, ROS was proposed to
have a direct role in photodamage to PSII reaction centre, however, by separately
assessing photodamage when PSII repair process is blocked, it seems that the rate of
photodamage to PSII is not accelerated drastically by the presence of ROS
(Allakhverdiev and Murata 2004; Nishiyama et al. 2004; Nishiyama et al. 2001).
Rather the main effect of ROS is to reduce global protein translation by primarily
targeting the redox-controlled elongation factor G (EF-G), which leads to insufficient
D1 synthesis (Ejima et al. 2012; Nishiyama et al. 2004; Nishiyama et al. 2001).
Several genes involved in the production of ROS-scavenging enzymes and
antioxidants protect cells from oxidative stress. Bacterial catalase which is a
scavenger of H2O2 has been shown to improve tolerance to photoinhibition
(Miyagawa et al. 2000; Nishiyama et al. 2001; Shikanai et al. 1998). Interestingly,
ascorbate peroxidase (APX) is the predominant scavenger of H2O2 in the chloroplasts
of higher plants, however, it is rather unstable comparing to catalase (Asada 1999),
which might contribute to the fact that higher plants have lower tolerance to H2O2
comparing to cyanobacteria and algae (Badger et al. 2000; Takeda et al. 1995; Tamoi
et al. 1998). Antioxidants such as α-tocopherol, which is an effective scavenger of
intracellular 1O2 (Di Mascio et al. 1990; Neely et al. 1988), also aids to reduce the
oxidative suppression on PSII repair (Hakala-Yatkin et al. 2011; Havaux et al. 2005).
36
1.5.3.2 Non-photochemical quenching
Non-photochemical quenching (NPQ) refers to the preventative mechanisms that
restrict excessive light energy from passing through to the photochemical reactions.
This process has been assessed by monitoring the reduction of chlorophyll
fluorescence yields, and categorised into three groups according to the relaxation
kinetics, namely energy-dependent quenching (qE), state-transition quenching (qT)
and photoinhibitory quenching (qI) (Muller et al. 2001).
Among the three types of NPQ, qE is the major contributor as it respond to light stress
on a timescale of seconds (Demmig-Adams and Adams III 1996; Horton and Ruban
1992; Kanervo et al. 2005; Long et al. 1994; Muller et al. 2001), and results in the
relatively harmless thermal dissipation of absorbed light energy (Niyogi and Truong
2013). The molecular details of qE quenching are still largely unclear, and the
quenching mechanisms vary among cyanobacteria, algae and plants, however, a few
proteins and cofactors involved in qE-mediated heat dissipation have been identified.
In principle, qE quenching occurs in the light-harvesting antenna protein complexes,
which is believed to redirect energy transfer from chlorophyll to carotenoid, and
consequently, carotenoid will dissipate energy in the form of heat (Demmig-Adams
and Adams III 1996). The basis of qE quenching among cyanobacteria, algae and
plants are similar, however, the quenching mechanisms between them are quite
different. As cyanobacteria harvest light via phycobilisome antenna (see section 1.2.2),
qE quenching is reliant on the orange carotenoid protein (OCP), which binds a single
xanthophyll molecule (Kerfeld et al. 2003). Upon absorption of blue-green light via a
xanthophyll pigment, OCP is switched from an inactive orange form (OCPo) into an
active red form (OCPr), which is able to bind to the phycobilisome (Gwizdala et al.
2011). The structural details of binding and energy transfer are still unclear. The
current hypothesis is that energy from excited bilin pigment at the core of
phycobilisome is passed to the xanthophyll in OCPr (Niyogi and Truong 2013).
Moreover, qE quenching can be switched off via up-regulation of the Fluorescence
37
Recovery Protein (FRP), which promotes both dissociation of OCPr from
phycobilisome and reversion of OCPr to OCP
o (Gwizdala et al. 2011).
Unlike cyanobacteria, qE quenching in green algae is performed via production of a
specific type of LHC complex, namely LHCSR (or LI818 or LHCX1) (Bailleul et al.
2010; Niyogi and Truong 2013; Peers et al. 2009). Unlike regular LHC, chlorophylls
inside LHCSR have an unusually short fluorescence lifetime that is even shorter at
low pH conditions in vitro (Bonente et al. 2011). Beside up-regulation of LHCSR
genes, LHC genes are typically down-regulated under high light, which shifts the
equilibrium between the two types of light harvesting complexes towards enhanced
qE quenching. Furthermore, LHCSR might also induce quenching in other LHC
proteins in PSII (Elrad et al. 2002; Ferrante et al. 2012), and it is also implied to play a
protective role for detached LHC proteins migrating between photosystems
(Amarnath et al. 2012). It is worth mentioning that qE quenching in both green algae
and plants is triggered via increased ΔpH across the thylakoid membrane, which
initiates the xanthophyll cycle by activation of violaxanthin de-epoxidase which
converts violaxanthin to zeaxanthin (Demmig-Adams and Adams III 1996).
Although both algae and plants harvest light energy via LHC complexes and qE
quenching in both organisms is ΔpH-dependent and xanthophyll-dependent, the
quenching mechanisms in plants seem to have evolved separately (Niyogi and Truong
2013). It has been shown that LHC complexes in plants have an intrinsic ability to
switch between an efficient light-harvesting state to a photoprotective state in which
excitation energy is dissipated (Kruger et al. 2012). The precise regulation mechanism
is still to be unveiled, however, mutagenesis analysis have shown that the PsbS
protein plays an essential role in this process (Lindahl et al. 2000). Protonation of
PsbS promotes a rearrangement of the PSII complexes in the grana lamellae (Betterle
et al. 2009; Goral et al. 2012) and has been implied to cause conformational changes
38
in the LHC complexes (Li et al. 2000; Ruban et al. 1993). PsbS is an integral
membrane protein that belongs to the chlorophyll a/b binding (cab) protein
superfamily, however, PsbS does not appear to bind pigments (Bonente et al. 2008).
Surprisingly, although conserved genes encoding PsbS are also found in the green
alga Chlamydomonas reinhardtii, the expression of which is also induced by light
stress, there is presently no evidence that PsbS is translated or involved in NPQ in C.
reinhardtii (Niyogi and Truong 2013). However, it remains a possibility that green
algae might have both LHCSR and PsbS quenching mechanisms. Moreover, despite
being essential to qE quenching in plants, thylakoid membranes isolated from the
psbS mutant was able to perform qE quenching in the presence of high ΔpH (Johnson
and Ruban 2011), which provides a hint that there might be other sensors to drive the
conformational change of LHC.
When oxygenic photoautotrophs are under continuous strong illumination over a
period of minutes, state transition quenching (qT) is initiated (Anderson 1986;
Kanervo et al. 2005; Melis 1999; Reuter and Muller 1993). Unlike qE quenching,
which mediates the energy flow from the light-harvesting antenna to photosystems,
qT quenching adjusts the size and positioning of the antennae to acclimate the
environment by fine-tuning the energy reception and the electron flow between
photosystems (Escoubas et al. 1995; Lindahl et al. 1995; Reuter and Muller 1993).
The size of the light-harvesting antennae is modified to cope with long-term
illumination via regulation of both biosynthesis (Escoubas et al. 1995) and
degradation (Lindahl et al. 1995) of the antenna proteins. Antenna proteins also
migrate between photosystem I and photosystem II, during so-called state transitions,
to regulate electron flow chain on thylakoid membrane as a short-term acclimation
response (Murata and Sugahara 1969). In plant and green algae, the state transition
response is regulated by the redox state of the plastoquinone pool, coupled with
phosphorylation of the antenna. Under reducing conditions, this leads to the migration
39
of antenna complexes from PSII to PSI (Allen 2003; Bellafiore et al. 2005; Bonardi et
al. 2005; Rochaix 2007; Tikkanen et al. 2006). The transfer of antenna from PSII to
PSI is termed state 2, whereas the reverse process, regulated by phosphatase (Pribil et
al. 2010; Shapiguzov et al. 2010), is termed state 1 (Allen and Forsberg 2001; Gal et
al. 1997; Kanervo et al. 2005; Mullineaux and Emlyn-Jones 2005). Interestingly, the
movement of phycobilisomes in cyanobacteria does not seem to involve
phosphorylation, and the control mechanism is yet to be unveiled (Mullineaux and
Emlyn-Jones 2005). qT quenching is associated with photoprotection, however, its
impact is still debatable. In plants, only 15 to 20 % of the LHC complexes are
involved in state transitions, whereas, up to 80 % of the LHC antenna in C. reinhardtti
participate in state transitions (Kanervo et al. 2005). In the case of cyanobacteria,
NPQ is closely correlated with state 2 transition (Campbell and Öquist 1996),
however, there is no direct evidence that qT mediates photoprotection (Mullineaux
and Emlyn-Jones 2005).
Photoinhibitory quenching (qI) is the slowest forming and relaxing NPQ among the
three, with sustained quenching able to persist for several hours in the dark following
illumination (Ruban et al. 2012). PSII undergoes rapid turnover under strong light
illumination and it is suggested that qI quenching might be achieved by using inactive
PSII complexes as energy sinks to reduce energy flux towards their functional
neighbours (Aro et al. 1993a; Kanervo et al. 2005; Kettunen et al. 1997; Lee et al.
2001; Matsubara and Chow 2004). Typically, the repair rate of damaged PSII
complexes is restricted by the de novo synthesis rate of D1 protein subunit encoded by
the psbA gene (Figure 1.4). Interestingly, unlike most plants and algae which only
have one copy of psbA (Zurawski et al. 1982), most cyanobacteria contain three
copies of psbA (Golden et al. 1986). The expression level of each psbA gene is
associated with both the quantity and quality of light (Campbell et al. 1998; Clarke et
al. 1995; Clarke et al. 1993; Golden et al. 1986). Further studies on D1 homologues
40
suggest that the turnover rate of each homologue varies under strong illumination,
hence qI quenching could be enhanced in cyanobacteria via altering the proportion of
each D1 homologue (Campbell et al. 1998; Komenda et al. 2000; Sippola and Aro
2000).
The physiological role of NPQ in photoprotection was originally thought to be mainly
at the level of reducing the rate of photodamage to PSII. However, using methods to
monitor photodamage and repair separately has since revealed that defects in NPQ
largely lead to impaired repair of PSII, rather than enhanced rates of photodamage
(Murata et al. 2012; Sarvikas et al. 2006; Sarvikas et al. 2010; Takahashi et al. 2009).
As described before (see section 1.5.3.1), the de novo synthesis of D1 in the PSII
repair cycle is strongly inhibited by the level of ROS, which provides a hint that NPQ
might aid the repair process by preventing generation of ROS.
1.5.3.3 Dissipation of energy via alternative electron transport pathways
Beside the primary electron transfer route within PSII (see section 1.2.3), secondary
electron transfer pathways are proposed to protect PSII from oxidative damage in
situations where electron transfer to P680+ from the OEC is either absent or impaired
(Stewart and Brudvig 1998). Under such circumstances, oxidation of the redox-active
tyrosine in D2 (YD), β-carotene, Chlorophyll and Cyt b559 has been observed
(Shinopoulos and Brudvig 2012). Further analysis on the secondary electron flow in
PSII suggests that the β-carotene (CarD2), coordinated by the D2 subunit, is likely to
be the initial electron donor to P680 when electron transfer from OEC is restricted
(Shinopoulos et al. 2013). Subsequently, the oxidised CarD2 is reduced by electron
transfer from the terminal electron donor Cyt b559, via a network of cofactors
(Shinopoulos and Brudvig 2012). Moreover, Cyt b559 may be reduced by the
plastoquinone pool which is ultimately reduced by the acceptor-side of PSII, thereby
forming a cyclic electron pathway connecting the donor and acceptor side of PSII
(Shinopoulos and Brudvig 2012).
41
In plants, cyclic electron transport around PSI (CET) is accelerated under various
stress conditions, including strong illumination (Clarke and Johnson 2001; DalCorso
et al. 2008; Miyake et al. 2004). It has been shown that CET plays an important role
in counteracting photoinhibition in plants (Munekage et al. 2004; Takahashi et al.
2009). CET enables PSI to pass electrons back to the plastoquinone pool via reduced
ferredoxin or NADPH, which consequently contributes to formation of ΔpH across
thylakoid membrane (Figure 1.2 lower panel) and down-regulation of PSII activity by
the qE mechanism (Kanervo et al. 2005; Munekage et al. 2004; Shikanai et al. 2002).
Further studies on A. thaliana mutants with impaired CET suggest that CET
contribute largely to the generation of ΔpH, which seems not only to enhance repair
via protonation of PsbS and consequent NPQ, but also reduce the sensitivity of PSII
to photodamage (Takahashi et al. 2009).
Photorespiration is another metabolic pathway that can be used to dissipate excess
energy from LET (Badger et al. 2000; Niyogi 1999; Wingler et al. 2000). In general,
photorespiration is a process which fixes O2, instead of CO2, at the level of
ribulose-bisphosphate carboxylase/oxygenase (rubisco), to then form
2-phosphoglycolate and 3-phosphoglyceric acid (Wingler et al. 2000). This process is
generally considered wasteful, however, blocking it leads to greater sensitivity to
photoinhibition and oxidative damage (Niyogi 1999; Wingler et al. 2000).
Interestingly, photorespiration in plants is partly due to the fact that rubisco is
relatively unspecific for CO2 and there might be a limitation of CO2 supply to the cell.
Hence it is probably less relevant to photoprotection in cyanobacteria due to the
different kinetic properties of rubisco and the efficient carbon concentrating systems
that most cyanobacteria possess (Badger et al. 2000).
The water-water cycle (also known as the Mehler-ascorbate peroxidase reaction or
pseudocyclic electron transport) is another alternative electron pathway that is used in
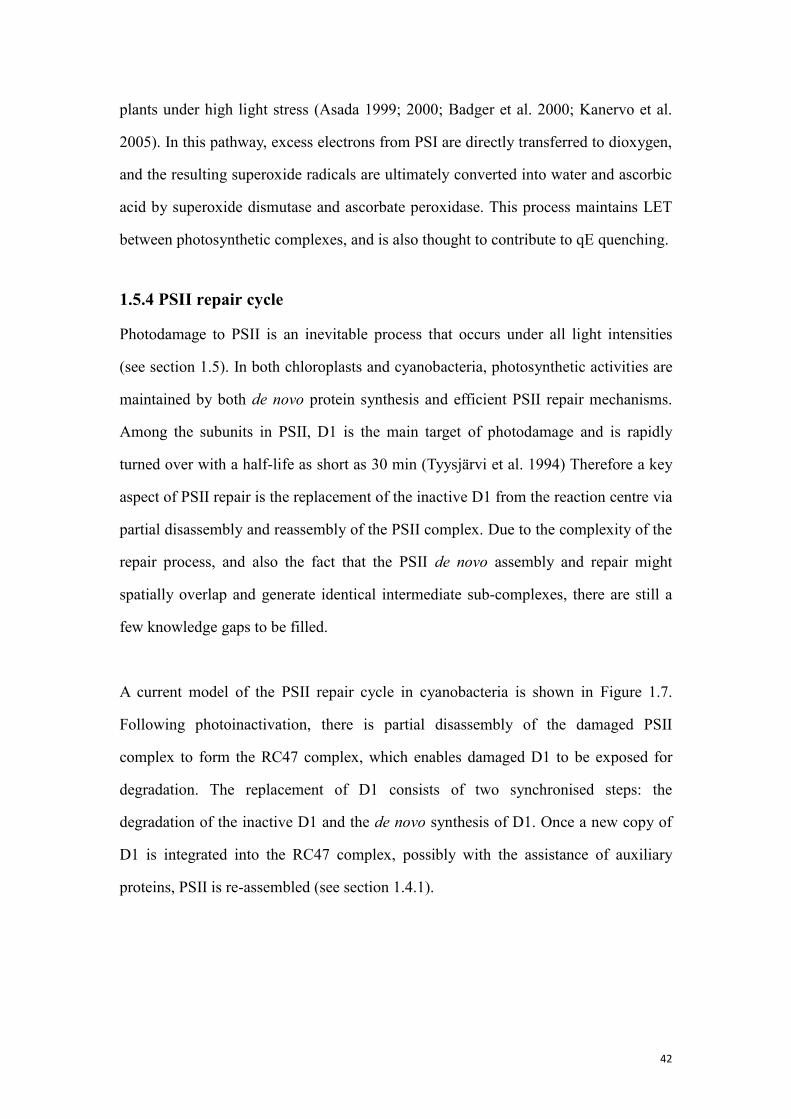
42
plants under high light stress (Asada 1999; 2000; Badger et al. 2000; Kanervo et al.
2005). In this pathway, excess electrons from PSI are directly transferred to dioxygen,
and the resulting superoxide radicals are ultimately converted into water and ascorbic
acid by superoxide dismutase and ascorbate peroxidase. This process maintains LET
between photosynthetic complexes, and is also thought to contribute to qE quenching.
1.5.4 PSII repair cycle
Photodamage to PSII is an inevitable process that occurs under all light intensities
(see section 1.5). In both chloroplasts and cyanobacteria, photosynthetic activities are
maintained by both de novo protein synthesis and efficient PSII repair mechanisms.
Among the subunits in PSII, D1 is the main target of photodamage and is rapidly
turned over with a half-life as short as 30 min (Tyysjärvi et al. 1994) Therefore a key
aspect of PSII repair is the replacement of the inactive D1 from the reaction centre via
partial disassembly and reassembly of the PSII complex. Due to the complexity of the
repair process, and also the fact that the PSII de novo assembly and repair might
spatially overlap and generate identical intermediate sub-complexes, there are still a
few knowledge gaps to be filled.
A current model of the PSII repair cycle in cyanobacteria is shown in Figure 1.7.
Following photoinactivation, there is partial disassembly of the damaged PSII
complex to form the RC47 complex, which enables damaged D1 to be exposed for
degradation. The replacement of D1 consists of two synchronised steps: the
degradation of the inactive D1 and the de novo synthesis of D1. Once a new copy of
D1 is integrated into the RC47 complex, possibly with the assistance of auxiliary
proteins, PSII is re-assembled (see section 1.4.1).
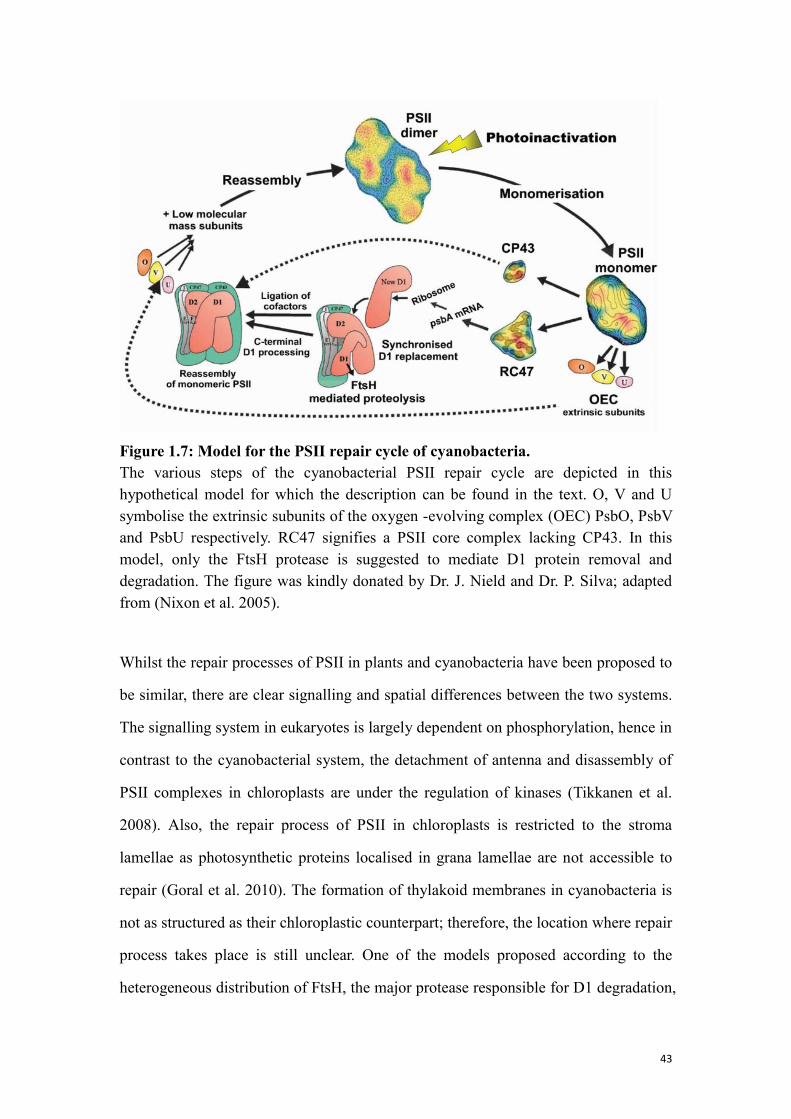
43
Figure 1.7: Model for the PSII repair cycle of cyanobacteria.
The various steps of the cyanobacterial PSII repair cycle are depicted in this
hypothetical model for which the description can be found in the text. O, V and U
symbolise the extrinsic subunits of the oxygen -evolving complex (OEC) PsbO, PsbV
and PsbU respectively. RC47 signifies a PSII core complex lacking CP43. In this
model, only the FtsH protease is suggested to mediate D1 protein removal and
degradation. The figure was kindly donated by Dr. J. Nield and Dr. P. Silva; adapted
from (Nixon et al. 2005).
Whilst the repair processes of PSII in plants and cyanobacteria have been proposed to
be similar, there are clear signalling and spatial differences between the two systems.
The signalling system in eukaryotes is largely dependent on phosphorylation, hence in
contrast to the cyanobacterial system, the detachment of antenna and disassembly of
PSII complexes in chloroplasts are under the regulation of kinases (Tikkanen et al.
2008). Also, the repair process of PSII in chloroplasts is restricted to the stroma
lamellae as photosynthetic proteins localised in grana lamellae are not accessible to
repair (Goral et al. 2010). The formation of thylakoid membranes in cyanobacteria is
not as structured as their chloroplastic counterpart; therefore, the location where repair
process takes place is still unclear. One of the models proposed according to the
heterogeneous distribution of FtsH, the major protease responsible for D1 degradation,
44
suggests that D1 replacement might take place in defined “repair zones” where FtsH
is available (Komenda et al. 2006a; Komenda et al. 2012b). Moreover, pD1 is found
not only in PDM but also in thylakoid membranes, which raises the speculation that
the sub-fraction of pD1 in the thylakoid membrane might be associated with PSII
repair rather than de-novo assembly (Schottkowski et al. 2009a).
1.5.5 FtsH-mediated D1 degradation
Early studies based on in vitro experiments suggested that degradation of D1 in higher
plant thylakoids required the involvement of members of both the DegP and FtsH
family of proteases (Spetea et al. 1999). A two-protease model was proposed in which
damaged D1 was initially cleaved by Deg2 in a GTP-dependent manner, and then the
remaining 23-kDa N-terminal D1 fragment was degraded by FtsH, an ATP-dependent,
Zn2+
-binding metalloprotease (Adam and Clarke 2002; Haussuhl et al. 2001; Lindahl
et al. 2000). However, later studies using Deg2 protease-deficient mutants showed
that D1 turnover was not affected in vivo. In contrast inactivation of FtsH resulted in
impaired D1 degradation. Furthermore, the accumulation of the 23-kDa D1 cleavage
product observed previously in vitro was not detected in the in vivo experiments
(Bailey et al. 2002). Instead, full-length D1 was found stably accumulated in the FtsH
null mutant, suggesting that the previously described degradation of D1 by Deg2 is
not a physiologically relevant event, or only contributes under stress conditions
(Barker et al. 2006; Huesgen et al. 2006).
Studies in Synechocystis provided the first evidence that FtsH played a major role in
the initial steps of D1 degradation (Silva et al. 2003). FtsH is an important class of
protease involved in diverse cellular activities, with interestingly, multiple FtsH
homologues present in chloroplasts and cyanobacteria. In the plant A. thaliana, 4 FtsH
homologues present in the thylakoid membranes can be divided into two groups based
on functional and structural similarities: Type A (FtsH1 and FtsH5) and Type B
45
(FtsH2 and FtsH8) (Wagner et al. 2012). Both Type A and Type B proteases are
involved in PSII repair, and interestingly, the two types of proteases were always
co-purified in the immunoprecipitation experiments, which raised the speculation that
the proteases might function as complexes (Garcia-Lorenzo et al. 2006; Zaltsman et al.
2005). Four FtsH homologues are present in the cyanobacterium Synechocystis.
Among the 4 members, FtsH2 is associated with D1 degradation (Silva et al. 2003).
Further work on understanding the molecular interaction between FtsH2 and D1
demonstrated that the N-terminal tail of D1 is essential for the degradation process
(Komenda et al. 2007b). Therefore, upon photoinactivation, conformation changes in
this N-terminal tail of D1 might contribute to the disassembly of PSII and allow
docking with the FtsH protease to initiate degradation. Given that the Synechocystis
mutant lacking FtsH2 is still able to grow photoautotrophically under low-light
conditions, it is plausible that an alternative D1 degradation pathway exists which is
capable of low level PSII repair.
Figure 1.8: Schematic maps of the FtsH complex-mediated photosystem II repair
cycle model.
The figure represents the three states during the repair cycle, details are described in
text. D1, D2, CP43 and CP47 are four subunits of PS II (Umena et al. 2011). RCCII
means dimeric PS II complex. SCPs means small CAB-like proteins. For clarity,
assembly factors are not included. This figure is adapted from (Nixon et al. 2010b).
1.6 General introduction to the FtsH family of proteases
FtsH is a member of the AAA+ protease superfamily and plays an important role in
46
the PSII repair cycle (see section 1.5.4), and also it is to be the main focus of this
thesis. FtsH is universally conserved in eubacteria, chloroplasts and mitochondria,
with bacterial FtsH the one studied to greatest depth. In this section, a brief
introduction to bacterial FtsH will be described, covering the basic features of the
AAA+ superfamily (see section 1.6.1) and the proposed structure (see section 1.6.2)
and mechanism (see section 1.6.3) of bacterial FtsH complexes. Moreover, some of
the cellular functions involving bacterial FtsH are also described (see section 1.6.4).
1.6.1 The AAA+ superfamily of proteases
All members of the AAA+ superfamily of proteases contain at least one subunit that
belongs to ATPase associated with diverse cellular activities (Neuwald et al. 1999),
which utilises the energy released from ATP hydrolysis to drive degradation of
substrate proteins. Five distinctive families of AAA+ proteases have been defined
based upon the topology of the ATPase and auxiliary domains, namely FtsH, Lon,
ClpXP, ClpAP/ClpCP and PAN (Neuwald et al. 1999; Schirmer et al. 1996). The
common feature of the AAA+ family is the presence of the AAA+ domain, which
interacts with, unfolds and translocates the substrates towards the peptidase domain.
The translocation process requires either ATP binding or hydrolysis to initiate the
conformational change of the AAA+ domain. The crystal structure of several AAA+
rings have been resolved to atomic resolution, a conserved large and a small domain
are observed in all structures, where ATP or ADP is coordinated between the large
domain of one protomer and the small domain of the neighbouring protomer
(Erzberger and Berger 2006). On the other hand, information on the native FtsH
protease complex is sparse, the relationship between subunits can also vary between
families or even between homologous proteins in different species. For example,
HslU and FtsH have been crystallised with C6, C3 and C2 symmetry, therefore, it is
still not clear how the AAA+ domain functions in vivo (Sauer and Baker 2011). Other
than FtsH and Lon, which have both AAA+ and protease domain on the same
47
polypeptide chain, HslU, ClpX/ClpA/ClpC and PAN form complexes with a separate
auxiliary peptidase HslV, ClpP and 20S. Despite the differences in the proteolytic sites,
a common architectural feature of the protease domain in AAA+ proteases is the
barrel-shape chamber that only allows entry of unfolded peptides (Sauer and Baker
2011).
1.6.2 Structure of FtsH proteases
FtsH proteases are universally conserved in eubacteria and endosymbiosis-derived
organelles of eukaryotes, namely chloroplasts and mitochondria (Arnold and Langer
2002; Wagner et al. 2012). Among all five classes of AAA+ proteases in Escherichia
coli, FtsH is the only one that is anchored on the cytoplasmic membrane and is
essential for cell viability (Gottesman 2003). Most FtsH proteases identified to date
carry two N-terminal transmembrane (TM) helices, yet, variants carrying only one or
lacking TM also appear to exist (Langklotz et al. 2012). The highly conserved AAA+
domain, which defines FtsH as a member of AAA+ family, is located behind the TM
region. The AAA+ domain is composed of three motifs, Walker A, Walker B and
second region of homology (SRH), where Walker A and B motifs form a structural
pocket docking ATP and the SRH is proposed to catalyse the hydrolysis of the
nucleotide (Suno et al. 2006). The protease domain (PD), which features a Zn2+
binding motif HEXXH (X represents mostly uncharged residues), is located towards
the C-terminus of the peptide chain, and is connected to the AAA+ module via a short
linker region (see section 4.1). Besides the common “zincin” motif, the protease
domains between FtsH proteases are less conserved and vary in length, which might
reflect differences in substrate recognition (Graef et al. 2007). Interestingly, FtsH in E.
coli exhibits self-cleavage property, which leads to the removal of seven residues from
the C-terminus (Akiyama 1999). The self-cleavage process is reproducible in vitro in
an ATP-hydrolysis dependent manner, however, its physiological influence is obscure
as both full-length and cleaved proteases are active (Ito and Akiyama 2005).
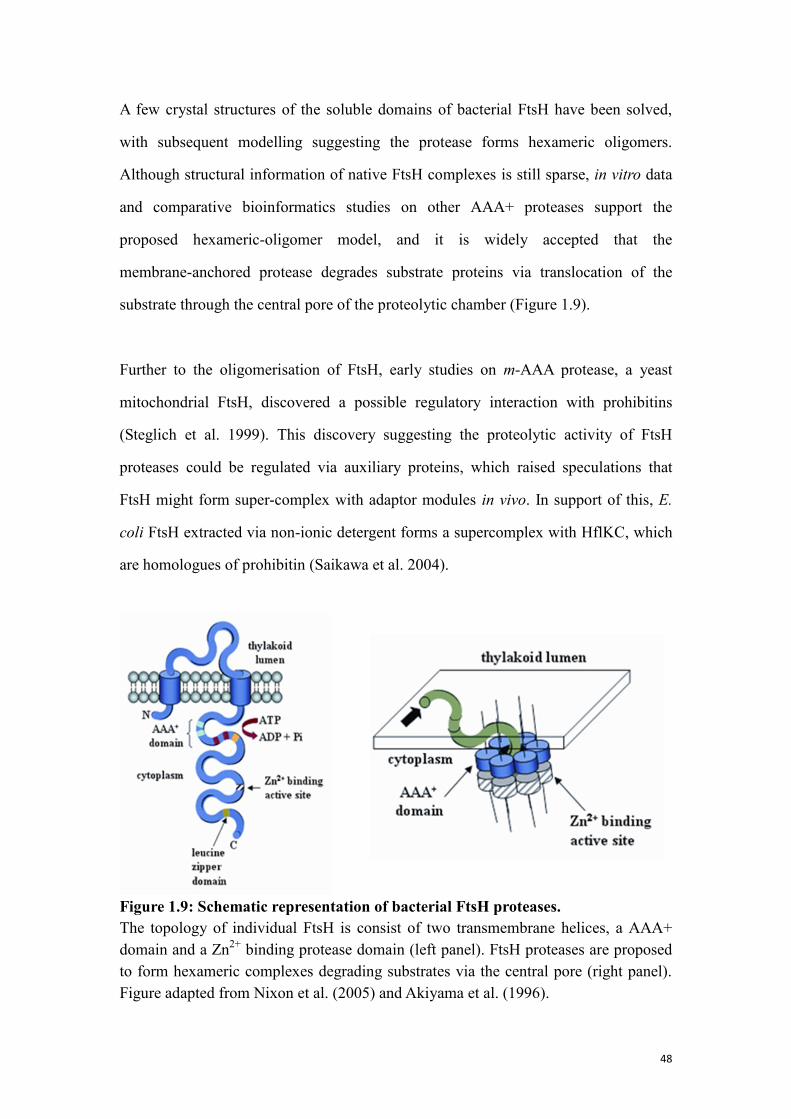
48
A few crystal structures of the soluble domains of bacterial FtsH have been solved,
with subsequent modelling suggesting the protease forms hexameric oligomers.
Although structural information of native FtsH complexes is still sparse, in vitro data
and comparative bioinformatics studies on other AAA+ proteases support the
proposed hexameric-oligomer model, and it is widely accepted that the
membrane-anchored protease degrades substrate proteins via translocation of the
substrate through the central pore of the proteolytic chamber (Figure 1.9).
Further to the oligomerisation of FtsH, early studies on m-AAA protease, a yeast
mitochondrial FtsH, discovered a possible regulatory interaction with prohibitins
(Steglich et al. 1999). This discovery suggesting the proteolytic activity of FtsH
proteases could be regulated via auxiliary proteins, which raised speculations that
FtsH might form super-complex with adaptor modules in vivo. In support of this, E.
coli FtsH extracted via non-ionic detergent forms a supercomplex with HflKC, which
are homologues of prohibitin (Saikawa et al. 2004).
Figure 1.9: Schematic representation of bacterial FtsH proteases.
The topology of individual FtsH is consist of two transmembrane helices, a AAA+
domain and a Zn2+
binding protease domain (left panel). FtsH proteases are proposed
to form hexameric complexes degrading substrates via the central pore (right panel).
Figure adapted from Nixon et al. (2005) and Akiyama et al. (1996).
49
1.6.3 Structure of the cytosolic domains of FtsH and proposed mechanism
of action
The high-resolution structure of an intact FtsH complex isolated from its native
environment has still not been achieved. However, several X-ray crystal structures of
bacterial FtsH proteases lacking the trans-membrane region have been determined
(Bieniossek et al. 2009; Suno et al. 2006). Overall, the structures indicate a hexameric
assembly of FtsH complexes in all cases. The dimensions of the FtsH complex from
Thermus thermophilus are ~120 Å in diameter and 65 Å in height. The structures of
the protease domains between species are highly similar, and all exhibit 6-fold
symmetry. However, the arrangement of AAA+ module between structures is largely
different between species. Although both structures of T. thermophilus and
Thermotoga maritima support a conformational change of the AAA+ domain during
ATP hydrolysis, with the “knick” motion driving substrates through the central pore to
the proteolytic site. However, the structure of the AAA+ domain from T. maritima
displays two-fold symmetry, whereas T. thermophilus FtsH shows three-fold
symmetry. It is unclear whether the variation is naturally present, or due to an
intentionally designed mutation in the flexible linker region of the T. thermophilus
sequence that was aimed to improve crystal quality (Bieniossek et al. 2009; Langklotz
et al. 2012). Other than FtsH, structures of other AAA+ proteases display 6-fold,
3-fold and 2-fold symmetries in the nucleotide-bound state. Consequently, it is still
puzzling how the protomers within the hexameric complex coordinate during ATP
hydrolysis.
One model proposed by (Suno et al. 2006), based on 3-fold symmetric structure of T.
thermophilus, is that ATP hydrolysis is a synchronised process between neighbouring
protomers. After three ATP molecules are docked in the pocket of “open” protomers,
the three ATP-bound AAA+ domains close, enabling the “arginine finger” from the
neighboring protomers to interact with the γ-phosphate of ATP molecules. Then the
hydrolysis of ATP drives the adjacent protomer “open”, and sequentially, ATP
50
molecules dock into the open pocket and drive the subsequent reactions.
1.6.4 General functions of FtsH proteases in bacteria
FtsH family proteases play diverse house-keeping roles in bacteria, including quality
control of membrane proteins by removing damaged/unassembled proteins and
degradation of short-lived soluble proteins that often associate with the stress response
(Ito and Akiyama 2005). As the only AAA+ protease essential to cell viability in E.
coli, the vital role that FtsH plays is maintaining the balance between
lipopolysaccharide (LPS) and phospholipids. R-3-hydroxymyristoyl-ACP is a
common precursor to the biosynthesis of LPS and phospholipids, supply of which is
the rate limiting factor to the two competing pathways (Ogura et al. 1999). FtsH is
responsible for the efficient degradation of LpxC deacetylase, a short-lived (half-life,
~ 4 min) enzyme involved in the synthesis of lipid A in the LPS pathway. Disruption
of FtsH leads to the lethal over-accumulation of LPS, which can be rescued by
up-regulating the fatty acid biosynthetic pathway (Ogura et al. 1999).
E. coli FtsH was also found to interact with YccA, a distant homologue of Bax
Inhibitor-1 (BI-1) in the organelles of eukaryotes (Huckelhoven 2004), however, little
is known about its function in prokaryotes (Ito and Akiyama 2005). YccA is subject to
FtsH-mediated degradation (Kihara et al. 1998), however, its abundance and stability
also negatively inhibit the activity of FtsH (van Stelten et al. 2009). As a membrane
protein containing 7 transmembrane helices, the N-terminal cytosolic region of YccA
is crucial to FtsH mediated degradation (Ito and Akiyama 2005), however, the
N-terminal truncated protein can still bind to the FtsH complex and inhibit its function
(Kihara et al. 1998). In summary, YccA displays both substrate and inhibitor roles for
the FtsH complex.
Another important cellular function of FtsH in E. coli is the removal of the inactive
51
SecY translocon (van Stelten et al. 2009). SecY and secDF form a stable membrane
complex which regulates the translocation of proteins cross the cytoplasmic
membranes in an ATP-dependent manner (Nouwen et al. 2005; Tsukazaki et al. 2011).
Aberrant Sec translocons disturb the permeability of the cytoplasmic membranes and
hence compromise cellular activities. FtsH is the only protease known to degrade
SecY, as unassembled SecY stably accumulates in the ftsH null mutant. In contrast,
unassembled SecY is efficiently removed from the membrane, with a half-life of ~2
min in normal cells.
Another well characterised function of FtsH in E. coli is its role in stress responses,
including rapid degradation of the heat shock sigma factor in the absence of heat
shock (Herman et al. 1995; Tomoyasu et al. 1995) and bacteriophage encoded CII,
CIII and Xis (Herman et al. 1997; Leffers and Gottesman 1998; Shotland et al.
2000). Noteworthy, other members of AAA+ family may also be involved in the
degradation process (Kanemori et al. 1997; Leffers and Gottesman 1998), suggesting
functional overlap between AAA+ proteases. In summary, FtsH is a universal protease
involved in various cellular activities, which balances the lipid ratio, maintains the
activity of membrane proteins, regulates gene expressions to cope the changing
environment and prohibits pathogenic invasions.
1.7 Evolutionary conservation and diversity of FtsH proteases in
plastids and mitochondria
In eukaryotic cells, FtsH are exclusively localised to chloroplasts and mitochondria. In
contrast to most bacteria which only contain one ftsH gene, multiple genes encoding
FtsH homologues are found in eukaryotes and cyanobacteria. In yeast and human, 3
FtsH homologues were identified in the mitochondria (Arlt et al. 1996), 4 FtsH
homologues were found in most cyanobacteria, and 12 genes encoding FtsH and
another 5 encoding iFtsH, a sub-family of variant FtsH homologues lacking the Zn2+
binding motif, were identified in plant A. thaliana (Wagner et al. 2012). Noteworthy,
52
all FtsH proteases in eukaryotic cells are localised in organelles and are encoded by
nuclear genes. The translocation of the proteins to a particular membrane is directed
by a signal peptide sequence at the N-terminus (Atorino et al. 2003; Rodrigues et al.
2011).
FtsH proteases play important and diverse roles in eukaryotic cells. One of the best
characterised functions of mitochondrial FtsH is its involvement in maintaining the
respiratory pathway. MrpL32 is a small protein subunit that activates the ribosomal
large subunit to enable the consequent docking of the 37S small subunit (Nolden et al.
2005). A sub-group of mitochondrial FtsH, namely m-AAA, is responsible for the
maturation of MrpL32 by removing the N-terminal tail from the precursor protein.
Unprocessed MrpL32 is unable to bind with the 54S large subunit which consequently
compromises protein biosynthesis in mitochondria, eventually leading to respiratory
defects.
Chloroplastic FtsH proteases are located either in the thylakoid membrane or in the
chloroplast envelope. In A. thaliana, several FtsH homologues localised in the
thylakoid membranes are involved in D1 degradation in the PSII repair cycle (see
section 1.5.4), whereas, the FtsH proteases residing in the chloroplast envelope are
essential for embryogenesis (Wagner et al. 2012).
Interestingly, some FtsH homologues are found to interact with each other and
possibly form complexes (Garcia-Lorenzo et al. 2006; Zaltsman et al. 2005), which
leads to the speculation that apart from possible auxiliary proteins, the diverse
functions of FtsH proteases in eukaryotes might also be related to the composition of
FtsH isomers in the FtsH protease complex.
1.8 FtsH homologues in cyanobacteria Synechocystis sp. PCC6803
Cyanobacteria are photosynthetic bacteria that perform photosynthesis using a similar,
53
but more primitive system than that of chloroplasts (see section 1.2.2). With all the
benefits described (see section 1.3), they have been used extensively as model
organisms to study photosynthesis, photoinhibition and PSII repair process (see
section 1.5). Early bioinformatic studies identified four putative FtsH homologues in
the cyanobacterium Synechocystis sp. PCC 6803: FtsH1 (Cyanobase designation
Slr1390), FtsH2 (Slr0228), FtsH3 (Slr1604) and FtsH4 (Sll1463) (Mann et al. 2000)
(Sokolenko et al. 2002). FtsH1 and 3 are essential for cell viability whereas cells
lacking FtsH4 display a wild-type like phenotype (Mann et al. 2000). Similar to the
var2 mutant of A. thaliana, FtsH2 in Synechocystis is involved in the degradation of
damaged D1 protein, as well as the removal of unassembled and misassembled PSII
sub-units in vivo (Komenda et al. 2006a; Silva et al. 2003). More extended studies
also showed that FtsH2 is involved in the resistance to various abiotic stresses,
including low level of inorganic carbon (Zhang et al. 2007), heat stress (Kamata et al.
2005) ultraviolet light (UV-B) stress (Cheregi et al. 2007) and osmotic stress
(Stirnberg et al. 2007). Therefore, like the FtsH protease in E. coli, FtsH2 in
Synechocystis appears to play diverse physiological roles in degrading both soluble
and membrane-anchored substrates. The functions of the other 3 homologues remain
unclear as mutagenesis on these proteases either resulted in lethality or lack of a
distinguishable phenotype under the tested conditions.
1.9 Project aims
The background theme of this study was to investigate the molecular mechanisms of
FtsH-mediated D1 degradation, hence the key focus of this work was to elucidate the
structure, localisation and physiological functions of the FtsH proteases. Given that
none of the four members of FtsH protease family in Synechocystis had been
subjected to in-depth analysis, and more importantly, that the cyanobacterial FtsH
isomers might be structurally and/or functionally related, the aim of this work was to
characterise all four FtsH homologues in Synechocystis. The work presented in this
thesis focused on three areas: (1) the structural characterisation of FtsH complexes in
54
Synechocystis (see Chapter 3), (2) the functional characterisation of FtsH proteases
both in vivo and in vitro (see Chapter 4) and (3) the physiological characterisation of
the substrates and the potential regulatory mechanisms of FtsH proteases in
Synechocystis (see Chapter 5).
In order to achieve these aims, the following objectives were defined:
C-terminal glutathione-S-transferase (GST) tagging to each FtsH homologue
in Synechocystis to enable isolation of FtsH proteases for:
composition analysis via antibodies specific to each FtsH homologue.
structural analysis via transmission electron microscopy (TEM).
identification of substrate/auxiliary proteins via mass spectrometry.
C-terminal green fluorescent protein (GFP) tagging to each FtsH homologue
in Synechocystis to determine the localisation of each FtsH isomer via
fluorescence microscopy.
Generation of FtsH null and domain-inactive mutants to:
examine functional overlaps among FtsH complexes .
examine dispensability of domains within FtsH hetero-complexes.
enable further mutagenesis to analyse the functional interference of the
C-terminal GST/GFP tag under reduced overall FtsH activity in vivo.
Expression of the cytosolic region of FtsH isomers in E. coli to elucidate the
NTPase and protease activities in vitro.
Generation of Synechocystis mutants deficient of potential auxiliary proteins
of FtsH complexes to explore the regulation mechanisms of FtsH proteases in
vivo.
55
Chapter 2: Materials and Methods
2.1 Bioinformatic tools
The programs, internet-based servers and databases that were used for the
bioinformatics analyses of the FtsH homologues in this study are listed below.
Protein and gene databases:
BLAST (Release 2.2.14; Altschul et al. 1990) (http://www.ncbi.nlm.nih.gov/BLAST/)
CyanoBase (Version 2006.9.12; Nakamura et al. 1998)
(http://www.kazusa.or.jp/cyanobase/)
NCBI database (http://www.ncbi.nlm.nih.gov/)
Protein properties prediction servers:
EXPASY (Wilkins et al. 1999) (http://us.expasy.org/tools/)
SOSUI engine (http://bp.nuap.nagoya-u.ac.jp/sosui/sosui_submit.html)
Multiple sequence alignment and phylogenetic tree generation:
CLUSTALW (WorkBench 3.2 environment) (Thompson et al. 1994; Gonnet et al.
1992)
Montpellier (Guindon et al. 2010) (http://www.atgc-montpellier.fr/phyml/)
DNA sequence restriction mapping:
NEB cutter V2.0 (http://tools.neb.com/NEBcutter2/index.php)
ApE V2.0.45 (http://biologylabs.utah.edu/jorgensen/wayned/ape/)
56
2.2 Standard solutions and buffers
Buffers and standard solutions were prepared according to Sambrook et al. (1989)
unless otherwise stated. Reverse Osmosis (RO) filtered water (Neptune model
L993162, Purite Limited, UK) was used to prepare all buffers and solutions.
Chemicals and organic solvents were analytical grade reagents and purchased from
Bioline UK Limited; Fisher Scientific Limited, UK; Melford UK Limited; Merck
Chemicals Limited, UK; Sigma-Aldrich Limited, UK and VWR International Limited,
UK. Necessary solutions, media and other materials were sterilised by autoclaving at
121 oC (130 kPa) for ≥ 25 min. Thermo labile reagents were sterilized by filtration
through 0.2-μm syringe tip or bottle top filters (Schleicher & Schuell MicroScience
GmbH, Germany).
2.3 E. coli strains and growth conditions
2.3.1 E. coli strains
The E. coli 10-beta strain was used for cloning and plasmid DNA propagation, the
DCM- strain was used to produce un-methylated plasmid vectors and The KRX strain
was used to over-express recombinant protein (see table 2.1).
Table 2.1: List of E. coli strains
Strain Description Reference/Supplier
10-beta High efficiency cloning strain NEB
DCM- Dam/Dcm methyltransferase free NEB
KRX Expression strain Promega
2.3.2 E. coli growth conditions
E. coli cells were grown in liquid Luria-Bertani (LB) medium (1 % (w/v)
bacto-tryptone, 0.5 % (w/v) yeast extract and 0.5 % (w/v) NaCl) (Sambrook et al.
1989) on an orbital shaker (Innova 4400 incubator-shaker, New Brunswick Scientific,
UK) at 37 oC, 225 rpm. Cells grown on solid LB 1.5 % (w/v) agar plates were
57
incubated on the static shelf of the incubator at 37 oC overnight. For selective growth
of the transformants, antibiotics were used at the following concentration: ampicillin
(100 μg ml-1
), chloramphenicol (30 μg ml-1
), erythromycin (200 μg ml-1
) and
kanamycin (50 μg ml-1
).
2.4 Cyanobacterial strains and growth conditions
2.4.1 Cyanobacterial strains
All cyanobacterial mutants created in this work were derived from the wild-type
glucose-tolerant Synechocystis sp. PCC 6803 (WT-G and hereafter) strain, which was
a gift from Dr. J. K. Williams (Dupont, Delaware, USA). The genomic DNA template
of Thermosynechococcus elongatus, used to construct FtsH over-expression vectors in
E. coli, were extracted from a cell culture provided by Prof. James Barber’s group
(Imperial College London, London, UK).
2.4.2 Cyanobacterial growth conditions
2.4.2.1 Routine growth conditions
WT-G strain was cultivated on BG-11 plates (BG-11 basic mineral medium (Stanier
et al. 1971), with 0.3 % (w/v) sodium thiosulphate, 10 mM N-tris
[hydroxymenthyl]methyl-2-aminoethanesulfonic acid (TES-KOH) pH = 8.2 (Hihara
and Ikeuchi 1997) and 1.5 % (w/v) bacto agar (Becton Dickinson Biosciences Limited,
UK), added separately after autoclaving; 5 mM of glucose and 10 µM
3-(3,4-dichlorophenyl)-1,1-dimethylurea (DCMU) were added where applicable
(Williams 1988a). Plates were restreaked every one to two weeks. Liquid BG-11
cultures (5 mM N-tris[hydroxymenthyl]methyl-2-aminoethanesulfonic acid
(TES-KOH) pH = 8.2; 5 mM of glucose was added where applicable) were grown in
sterile, air-filter capped tissue culture flasks on an orbital shaker incubator (Innova
2100 shaker, New Brunswick Scientific, UK) at 100 rpm. Large volume cultures were
58
grown in glass vessels on a magnetic stirrer constantly bubbled with sterile air filtered
through 0.2-µm pore filter (Midisart 2000, Sartorius Limitied, UK). The strains were
incubated in the growth room set at 30 oC and illuminated with an incident fluorescent
white light intensity of ~10 µE m-2
S-1
( on plates) and 20 to 70 µE m-2
S-1
(in liquid).
Antibiotics were used for selective growth at the following concentration:
chloramphenicol (30 μg ml-1
), erythromycin (15 μg ml-1
) and kanamycin (25 μg ml-1
).
For long term storage, cells harvested from 30 to 50 ml cultures were resuspended in
1 ml BG-11, supplemented with 5 mM glucose and 15 % (v/v) glycerol, flash frozen
in liquid nitrogen and kept at -80 oC.
2.4.2.2 Growth experiment under light stress
Synechocystis cells on plates were incubated in a temperature-controlled room set at
29 oC and illuminated with an incident fluorescent white light. The illumination
intensities used in this work are listed in Table 2.2.
Table 2.2: Illumination intensities in growth experiments
Conditions Intensity
High light ~132 µmol m-2
s-1
Medium light ~24 µmol m-2
s-1
Low light ~5 µmol m-2
s-1
The experiments were performed with freshly restreaked cells on BG-11 plates and
BG-11 plus 5mM glucose plates. After a 7-10 day growing period, plates were
photographed (Canon Power Shot Pro 1, Canon, UK).
2.5 Estimation of cell concentration of liquid E. coli and
cyanobacterial cultures
The optical density of E. coli cultures was determined by measuring the absorbance at
59
600 nm (OD600nm), whereas the optical density of cyanobacterial cultures was
measured at 730 nm (OD730nm). In both cases, cell cultures were transferred into a 1
ml disposable cuvette and read under a Shimadzu spectrophotometer (UV-1601,
Shimadzu, Japan).
2.6 DNA associated techniques
2.6.1Vectors and recombinant plasmids
Parental plasmid vector systems that formed the basis of this work were listed in Table
2.3. The origins of the antibiotic-resistance markers that were used to enable selective
growth of the transformants were listed in Table 2.4.
Table 2.3: Commercial plasmid vectors used in this study.
Vector Purpose Supplier Reference
pGEM-T Easy Cloning Promega Corporation Marcus et al. (1996)
pRSET A Expression Gift from Dr E. Cota Douse et al. (2012)
Table 2.4: Antibiotic resistance cassettes used to construct mutants.
Vector Antibiotic-resistance cassette Accession # Reference
pDC039 Chloramphenicol (catI) from pACYC184 X06403 Rose (1988)
pRL425 Erythromycin (ermC) from pE194 NC_005908 Elhai and Wolk (1988)
pDC057 Kanamycin (aphI) from pUC4K X06404 Taylor and Rose (1988)
2.6.2 Agarose gel electrophoresis
Agarose gel electrophoresis is a method to separate DNA fragments according to their
length. The method was applied to identify the molecular weight of linear DNA and
purify certain DNA fragments from a mixture. An agarose gel was prepared with
molecular grade agarose (Bioline, UK; final [0.5-1 % (w/v)]) dissolved in
Tris-acetate-EDTA buffer (TAE; 40 mM Tris-acetate, 1 mM EDTA pH = 8.0) and
SYBR® safe stain (Life technologies, USA; final [1μg ml-1
]). A DNA sample was
mixed with 6x DNA loading buffer (40 % (w/v) sucrose, 0.25 % (w/v) Orange G),
60
and then loaded in a well. The molecular marker that used to determine the DNA
fragments size is 2-log DNA marker ladder (New England BioLabs Limited, UK)
which contained fragments of the following sizes (in Kb) : 10.0, 8.0, 6.0, 5.0, 4.0, 3.0,
2.0, 1.5, 1.2, 1.0, 0.9, 0.8, 0.7, 0.6, 0.5, 0.4, 0.3, 0.2 and 0.1. The DNA marker was
diluted 25 times in RO water and mixed with 6x DNA loading buffer before use.
Approximately 0.2 μg DNA marker was used to label the gel. The gel electrophoresis
was carried out in TAE buffer at 100-130 V in a horizontal mini gel system
(PerfectBlueTM
Mini Gel system; Peqlab Limited, Germany). DNA was visualised by
using a UV illuminator and photos were taken (BioDoc-ITTM
System, UVP; CA,
USA).
2.6.3 DNA purification from agarose gels
Purification of DNA fragments from agarose gels was performed using the Qiagen gel
extraction kit (Qiagen Limited, UK) according to the manufacturer’s protocol hand
book. In the final DNA elution step, DNA bound to the column was eluted with 30 μl
EB buffer and stored at -20 oC.
2.6.4 DNA amplification by polymerase chain reaction (PCR)
2.6.4.1 DNA polymerase enzymes
There were two types of DNA polymerase enzymes used in this project: Taq
polymerase (New England BioLabs Limited, UK) and Phusion polymerase (New
England BioLabs Limited, UK). The Taq polymerase was very economical and robust
to amplify DNA samples prepared from phenol-chloroform extraction procedure,
which makes it a good tool for detection of mutant segregation in cyanobacteria.
Beside, Taq polymerase was also used to add an A-overhang to the 3’ end of
blunt-end DNA fragments to enable T-A cloning with pGEM-T Easy vector system.
The Phusion polymerase is fast and accurate, with the error rate 50-fold lower than
61
that of Taq, which makes it ideal to produce DNA fragments for cloning or production
of samples for sequencing. However, due to the 3’-5’ proofreading function, DNA
products amplified by Phusion polymerase were blunt ended. Therefore, Taq
polymerase was required to aid T-A cloning after Phusion PCR.
2.6.4.2 Phusion polymerase reaction conditions
A standard 20 μl Phusion PCR reaction mix contained 0.4 units of polymerase, 4 μl of
5x Phusion HF buffer (as supplied by New England BioLabs Limited, UK; no
information about its composition available), 0.8 μl of 20 mM dNTP mixture
(ABgene, UK; final [0.2 mM] for each nucleotide: dATP, dCTP, dGTP, dTTP), 1 μl
of 10 μM (Sigma-Aldrich Limited, UK; final [0.5 μM]) of each forward and reverse
primer and ~100 ng template DNA. The reaction mixture was made up to 20 μl with
sterile RO water and well mixed. A 50 μl reaction mix contained the same
concentration of each component was used to produce large quantity of PCR
fragments for downstream cloning purpose. The PCR reaction mix can also be
prepared with FailsafeTM
PCR buffer (Cam-bio Limited, UK) to enhance
amplification with difficult-to-amplify DNA templates. The reaction mix contained
50 % (v/v) 2x Failsafe buffer, 1 unit polymerase, 5 μM of each primer and ~250 ng
DNA template. The PCR reaction was performed in a thermocycler (PeqSTAR,
Peqlab Limited, Germany). The PCR program consisted of an initial denaturation step
at 98 oC for 30 s and 25-30 subsequent cycles of 98
oC for 7 s (denaturation), 55-60
oC
for 15 s (primer annealing) and 72 oC for 30 s to 2 min (primer extension; 15-30 s per
1 kb). The final extension step was performed at 72 oC for 7 min.
2.6.4.3 Taq polymerase reaction conditions
Taq DNA polymerase produced sticky-ended PCR fragments and relatively
economical to use when high fidelity is not required. By using FailsafeTM
PCR buffer
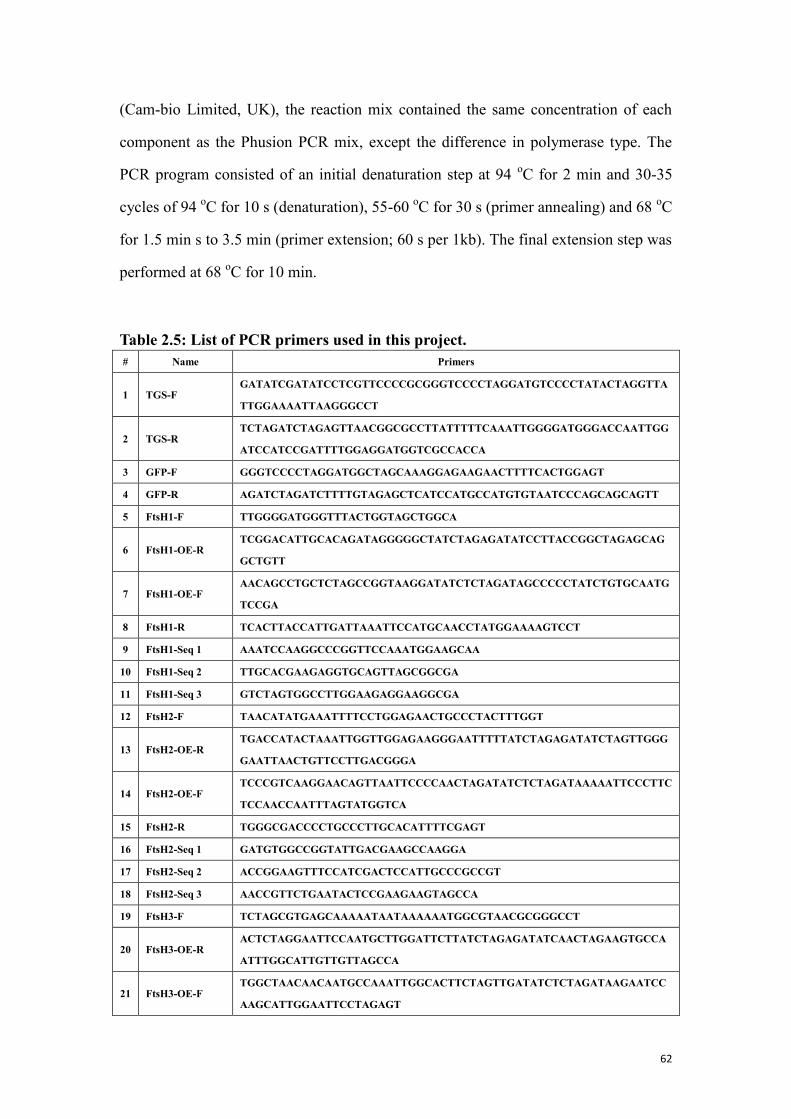
62
(Cam-bio Limited, UK), the reaction mix contained the same concentration of each
component as the Phusion PCR mix, except the difference in polymerase type. The
PCR program consisted of an initial denaturation step at 94 oC for 2 min and 30-35
cycles of 94 oC for 10 s (denaturation), 55-60
oC for 30 s (primer annealing) and 68
oC
for 1.5 min s to 3.5 min (primer extension; 60 s per 1kb). The final extension step was
performed at 68 oC for 10 min.
Table 2.5: List of PCR primers used in this project.
# Name Primers
1 TGS-F GATATCGATATCCTCGTTCCCCGCGGGTCCCCTAGGATGTCCCCTATACTAGGTTA
TTGGAAAATTAAGGGCCT
2 TGS-R TCTAGATCTAGAGTTAACGGCGCCTTATTTTTCAAATTGGGGATGGGACCAATTGG
ATCCATCCGATTTTGGAGGATGGTCGCCACCA
3 GFP-F GGGTCCCCTAGGATGGCTAGCAAAGGAGAAGAACTTTTCACTGGAGT
4 GFP-R AGATCTAGATCTTTTGTAGAGCTCATCCATGCCATGTGTAATCCCAGCAGCAGTT
5 FtsH1-F TTGGGGATGGGTTTACTGGTAGCTGGCA
6 FtsH1-OE-R TCGGACATTGCACAGATAGGGGGCTATCTAGAGATATCCTTACCGGCTAGAGCAG
GCTGTT
7 FtsH1-OE-F AACAGCCTGCTCTAGCCGGTAAGGATATCTCTAGATAGCCCCCTATCTGTGCAATG
TCCGA
8 FtsH1-R TCACTTACCATTGATTAAATTCCATGCAACCTATGGAAAAGTCCT
9 FtsH1-Seq 1 AAATCCAAGGCCCGGTTCCAAATGGAAGCAA
10 FtsH1-Seq 2 TTGCACGAAGAGGTGCAGTTAGCGGCGA
11 FtsH1-Seq 3 GTCTAGTGGCCTTGGAAGAGGAAGGCGA
12 FtsH2-F TAACATATGAAATTTTCCTGGAGAACTGCCCTACTTTGGT
13 FtsH2-OE-R TGACCATACTAAATTGGTTGGAGAAGGGAATTTTTATCTAGAGATATCTAGTTGGG
GAATTAACTGTTCCTTGACGGGA
14 FtsH2-OE-F TCCCGTCAAGGAACAGTTAATTCCCCAACTAGATATCTCTAGATAAAAATTCCCTTC
TCCAACCAATTTAGTATGGTCA
15 FtsH2-R TGGGCGACCCCTGCCCTTGCACATTTTCGAGT
16 FtsH2-Seq 1 GATGTGGCCGGTATTGACGAAGCCAAGGA
17 FtsH2-Seq 2 ACCGGAAGTTTCCATCGACTCCATTGCCCGCCGT
18 FtsH2-Seq 3 AACCGTTCTGAATACTCCGAAGAAGTAGCCA
19 FtsH3-F TCTAGCGTGAGCAAAAATAATAAAAAATGGCGTAACGCGGGCCT
20 FtsH3-OE-R ACTCTAGGAATTCCAATGCTTGGATTCTTATCTAGAGATATCAACTAGAAGTGCCA
ATTTGGCATTGTTGTTAGCCA
21 FtsH3-OE-F TGGCTAACAACAATGCCAAATTGGCACTTCTAGTTGATATCTCTAGATAAGAATCC
AAGCATTGGAATTCCTAGAGT
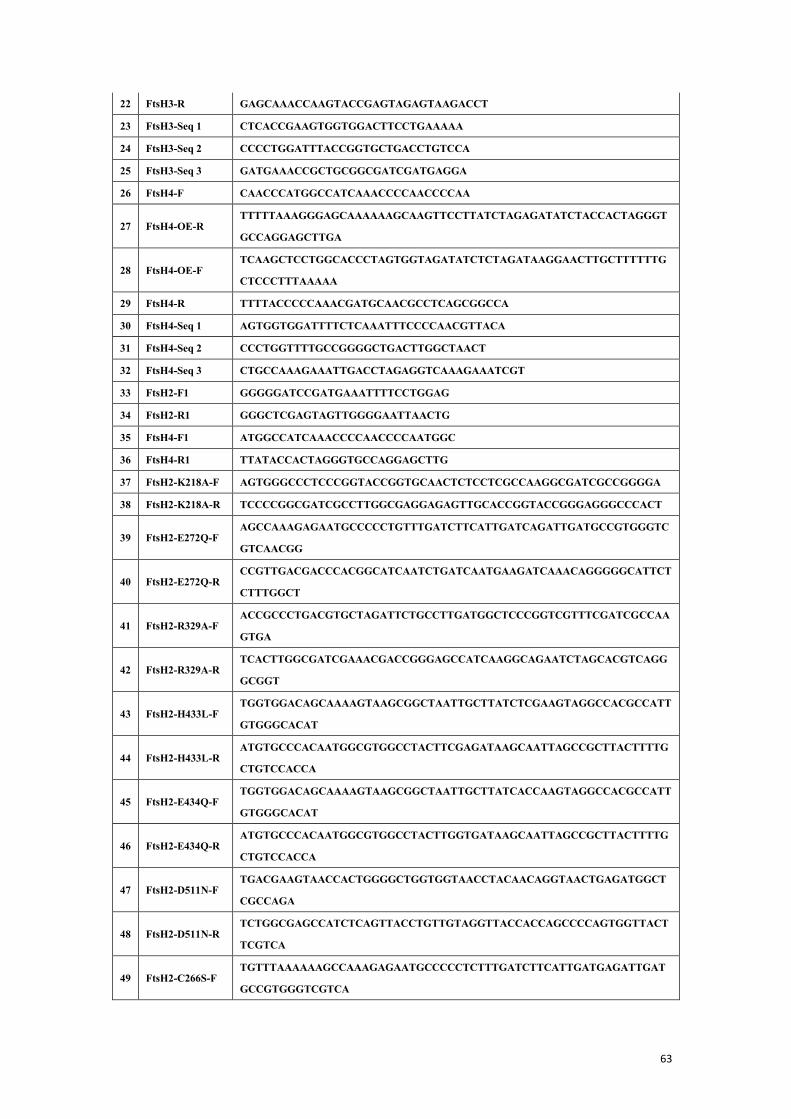
63
22 FtsH3-R GAGCAAACCAAGTACCGAGTAGAGTAAGACCT
23 FtsH3-Seq 1 CTCACCGAAGTGGTGGACTTCCTGAAAAA
24 FtsH3-Seq 2 CCCCTGGATTTACCGGTGCTGACCTGTCCA
25 FtsH3-Seq 3 GATGAAACCGCTGCGGCGATCGATGAGGA
26 FtsH4-F CAACCCATGGCCATCAAACCCCAACCCCAA
27 FtsH4-OE-R TTTTTAAAGGGAGCAAAAAAGCAAGTTCCTTATCTAGAGATATCTACCACTAGGGT
GCCAGGAGCTTGA
28 FtsH4-OE-F TCAAGCTCCTGGCACCCTAGTGGTAGATATCTCTAGATAAGGAACTTGCTTTTTTG
CTCCCTTTAAAAA
29 FtsH4-R TTTTACCCCCAAACGATGCAACGCCTCAGCGGCCA
30 FtsH4-Seq 1 AGTGGTGGATTTTCTCAAATTTCCCCAACGTTACA
31 FtsH4-Seq 2 CCCTGGTTTTGCCGGGGCTGACTTGGCTAACT
32 FtsH4-Seq 3 CTGCCAAAGAAATTGACCTAGAGGTCAAAGAAATCGT
33 FtsH2-F1 GGGGGATCCGATGAAATTTTCCTGGAG
34 FtsH2-R1 GGGCTCGAGTAGTTGGGGAATTAACTG
35 FtsH4-F1 ATGGCCATCAAACCCCAACCCCAATGGC
36 FtsH4-R1 TTATACCACTAGGGTGCCAGGAGCTTG
37 FtsH2-K218A-F AGTGGGCCCTCCCGGTACCGGTGCAACTCTCCTCGCCAAGGCGATCGCCGGGGA
38 FtsH2-K218A-R TCCCCGGCGATCGCCTTGGCGAGGAGAGTTGCACCGGTACCGGGAGGGCCCACT
39 FtsH2-E272Q-F AGCCAAAGAGAATGCCCCCTGTTTGATCTTCATTGATCAGATTGATGCCGTGGGTC
GTCAACGG
40 FtsH2-E272Q-R CCGTTGACGACCCACGGCATCAATCTGATCAATGAAGATCAAACAGGGGGCATTCT
CTTTGGCT
41 FtsH2-R329A-F ACCGCCCTGACGTGCTAGATTCTGCCTTGATGGCTCCCGGTCGTTTCGATCGCCAA
GTGA
42 FtsH2-R329A-R TCACTTGGCGATCGAAACGACCGGGAGCCATCAAGGCAGAATCTAGCACGTCAGG
GCGGT
43 FtsH2-H433L-F TGGTGGACAGCAAAAGTAAGCGGCTAATTGCTTATCTCGAAGTAGGCCACGCCATT
GTGGGCACAT
44 FtsH2-H433L-R ATGTGCCCACAATGGCGTGGCCTACTTCGAGATAAGCAATTAGCCGCTTACTTTTG
CTGTCCACCA
45 FtsH2-E434Q-F TGGTGGACAGCAAAAGTAAGCGGCTAATTGCTTATCACCAAGTAGGCCACGCCATT
GTGGGCACAT
46 FtsH2-E434Q-R ATGTGCCCACAATGGCGTGGCCTACTTGGTGATAAGCAATTAGCCGCTTACTTTTG
CTGTCCACCA
47 FtsH2-D511N-F TGACGAAGTAACCACTGGGGCTGGTGGTAACCTACAACAGGTAACTGAGATGGCT
CGCCAGA
48 FtsH2-D511N-R TCTGGCGAGCCATCTCAGTTACCTGTTGTAGGTTACCACCAGCCCCAGTGGTTACT
TCGTCA
49 FtsH2-C266S-F TGTTTAAAAAAGCCAAAGAGAATGCCCCCTCTTTGATCTTCATTGATGAGATTGAT
GCCGTGGGTCGTCA
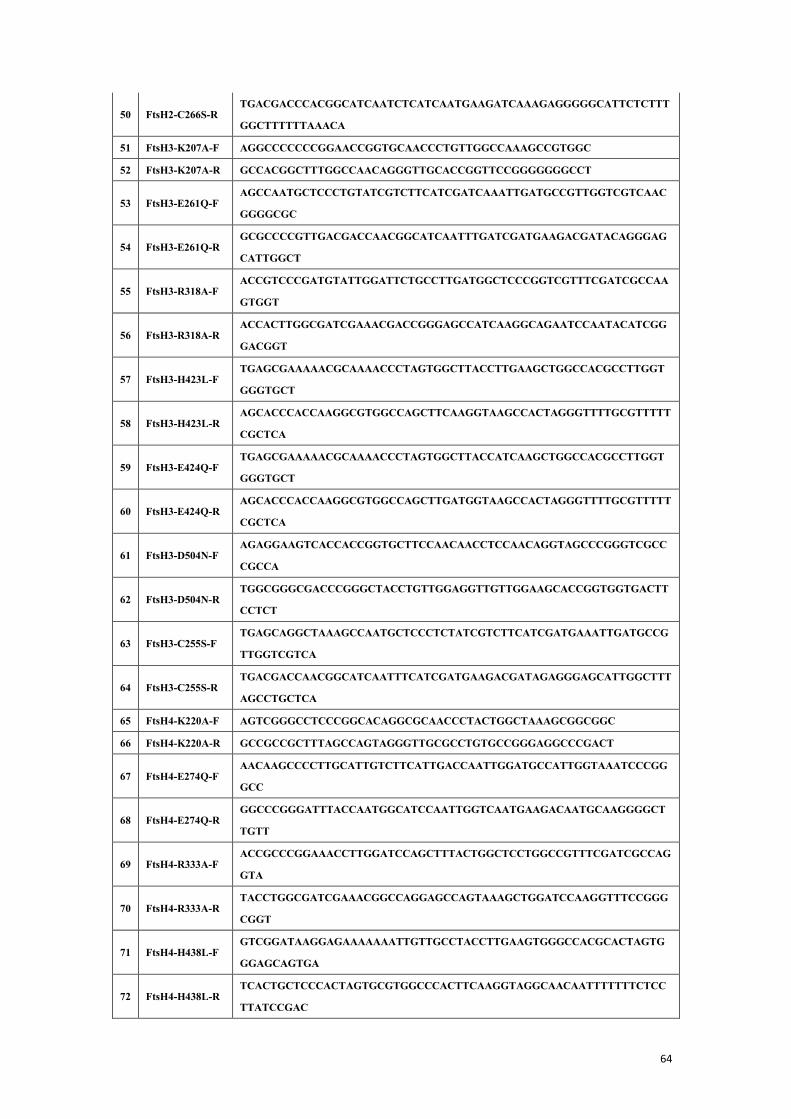
64
50 FtsH2-C266S-R TGACGACCCACGGCATCAATCTCATCAATGAAGATCAAAGAGGGGGCATTCTCTTT
GGCTTTTTTAAACA
51 FtsH3-K207A-F AGGCCCCCCCGGAACCGGTGCAACCCTGTTGGCCAAAGCCGTGGC
52 FtsH3-K207A-R GCCACGGCTTTGGCCAACAGGGTTGCACCGGTTCCGGGGGGGCCT
53 FtsH3-E261Q-F AGCCAATGCTCCCTGTATCGTCTTCATCGATCAAATTGATGCCGTTGGTCGTCAAC
GGGGCGC
54 FtsH3-E261Q-R GCGCCCCGTTGACGACCAACGGCATCAATTTGATCGATGAAGACGATACAGGGAG
CATTGGCT
55 FtsH3-R318A-F ACCGTCCCGATGTATTGGATTCTGCCTTGATGGCTCCCGGTCGTTTCGATCGCCAA
GTGGT
56 FtsH3-R318A-R ACCACTTGGCGATCGAAACGACCGGGAGCCATCAAGGCAGAATCCAATACATCGG
GACGGT
57 FtsH3-H423L-F TGAGCGAAAAACGCAAAACCCTAGTGGCTTACCTTGAAGCTGGCCACGCCTTGGT
GGGTGCT
58 FtsH3-H423L-R AGCACCCACCAAGGCGTGGCCAGCTTCAAGGTAAGCCACTAGGGTTTTGCGTTTTT
CGCTCA
59 FtsH3-E424Q-F TGAGCGAAAAACGCAAAACCCTAGTGGCTTACCATCAAGCTGGCCACGCCTTGGT
GGGTGCT
60 FtsH3-E424Q-R AGCACCCACCAAGGCGTGGCCAGCTTGATGGTAAGCCACTAGGGTTTTGCGTTTTT
CGCTCA
61 FtsH3-D504N-F AGAGGAAGTCACCACCGGTGCTTCCAACAACCTCCAACAGGTAGCCCGGGTCGCC
CGCCA
62 FtsH3-D504N-R TGGCGGGCGACCCGGGCTACCTGTTGGAGGTTGTTGGAAGCACCGGTGGTGACTT
CCTCT
63 FtsH3-C255S-F TGAGCAGGCTAAAGCCAATGCTCCCTCTATCGTCTTCATCGATGAAATTGATGCCG
TTGGTCGTCA
64 FtsH3-C255S-R TGACGACCAACGGCATCAATTTCATCGATGAAGACGATAGAGGGAGCATTGGCTTT
AGCCTGCTCA
65 FtsH4-K220A-F AGTCGGGCCTCCCGGCACAGGCGCAACCCTACTGGCTAAAGCGGCGGC
66 FtsH4-K220A-R GCCGCCGCTTTAGCCAGTAGGGTTGCGCCTGTGCCGGGAGGCCCGACT
67 FtsH4-E274Q-F AACAAGCCCCTTGCATTGTCTTCATTGACCAATTGGATGCCATTGGTAAATCCCGG
GCC
68 FtsH4-E274Q-R GGCCCGGGATTTACCAATGGCATCCAATTGGTCAATGAAGACAATGCAAGGGGCT
TGTT
69 FtsH4-R333A-F ACCGCCCGGAAACCTTGGATCCAGCTTTACTGGCTCCTGGCCGTTTCGATCGCCAG
GTA
70 FtsH4-R333A-R TACCTGGCGATCGAAACGGCCAGGAGCCAGTAAAGCTGGATCCAAGGTTTCCGGG
CGGT
71 FtsH4-H438L-F GTCGGATAAGGAGAAAAAAATTGTTGCCTACCTTGAAGTGGGCCACGCACTAGTG
GGAGCAGTGA
72 FtsH4-H438L-R TCACTGCTCCCACTAGTGCGTGGCCCACTTCAAGGTAGGCAACAATTTTTTTCTCC
TTATCCGAC
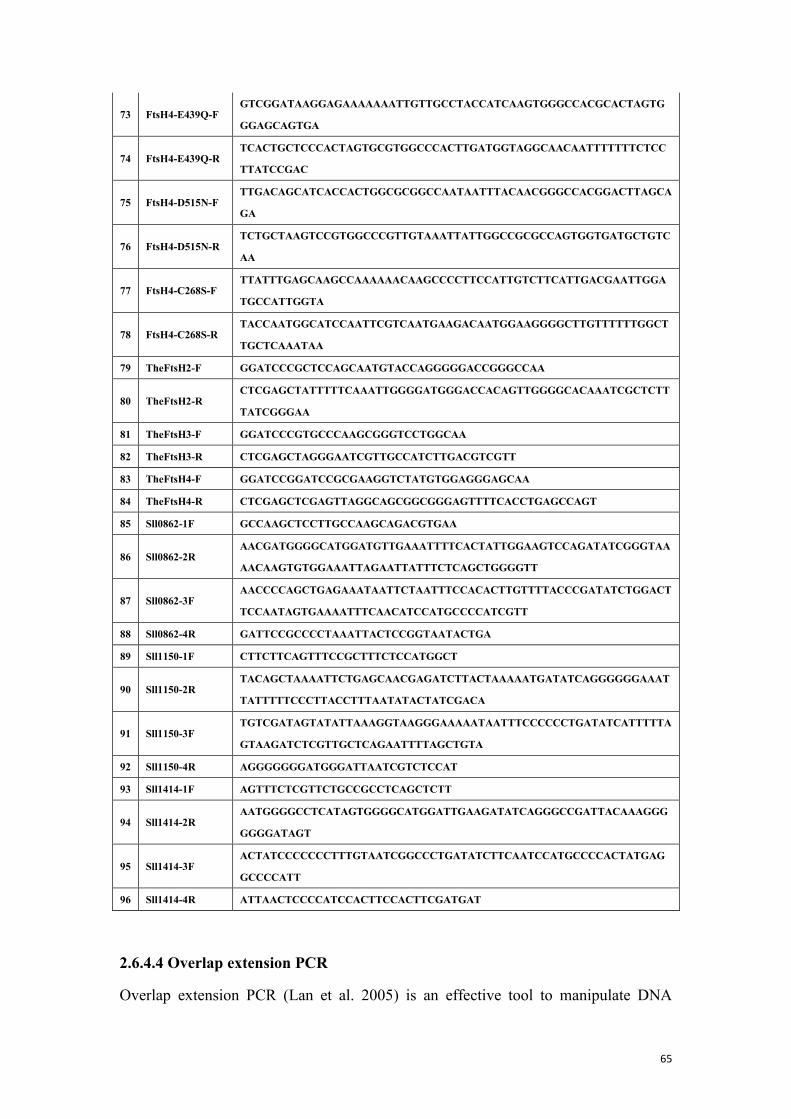
65
73 FtsH4-E439Q-F GTCGGATAAGGAGAAAAAAATTGTTGCCTACCATCAAGTGGGCCACGCACTAGTG
GGAGCAGTGA
74 FtsH4-E439Q-R TCACTGCTCCCACTAGTGCGTGGCCCACTTGATGGTAGGCAACAATTTTTTTCTCC
TTATCCGAC
75 FtsH4-D515N-F TTGACAGCATCACCACTGGCGCGGCCAATAATTTACAACGGGCCACGGACTTAGCA
GA
76 FtsH4-D515N-R TCTGCTAAGTCCGTGGCCCGTTGTAAATTATTGGCCGCGCCAGTGGTGATGCTGTC
AA
77 FtsH4-C268S-F TTATTTGAGCAAGCCAAAAAACAAGCCCCTTCCATTGTCTTCATTGACGAATTGGA
TGCCATTGGTA
78 FtsH4-C268S-R TACCAATGGCATCCAATTCGTCAATGAAGACAATGGAAGGGGCTTGTTTTTTGGCT
TGCTCAAATAA
79 TheFtsH2-F GGATCCCGCTCCAGCAATGTACCAGGGGGACCGGGCCAA
80 TheFtsH2-R CTCGAGCTATTTTTCAAATTGGGGATGGGACCACAGTTGGGGCACAAATCGCTCTT
TATCGGGAA
81 TheFtsH3-F GGATCCCGTGCCCAAGCGGGTCCTGGCAA
82 TheFtsH3-R CTCGAGCTAGGGAATCGTTGCCATCTTGACGTCGTT
83 TheFtsH4-F GGATCCGGATCCGCGAAGGTCTATGTGGAGGGAGCAA
84 TheFtsH4-R CTCGAGCTCGAGTTAGGCAGCGGCGGGAGTTTTCACCTGAGCCAGT
85 Sll0862-1F GCCAAGCTCCTTGCCAAGCAGACGTGAA
86 Sll0862-2R AACGATGGGGCATGGATGTTGAAATTTTCACTATTGGAAGTCCAGATATCGGGTAA
AACAAGTGTGGAAATTAGAATTATTTCTCAGCTGGGGTT
87 Sll0862-3F AACCCCAGCTGAGAAATAATTCTAATTTCCACACTTGTTTTACCCGATATCTGGACT
TCCAATAGTGAAAATTTCAACATCCATGCCCCATCGTT
88 Sll0862-4R GATTCCGCCCCTAAATTACTCCGGTAATACTGA
89 Sll1150-1F CTTCTTCAGTTTCCGCTTTCTCCATGGCT
90 Sll1150-2R TACAGCTAAAATTCTGAGCAACGAGATCTTACTAAAAATGATATCAGGGGGGAAAT
TATTTTTCCCTTACCTTTAATATACTATCGACA
91 Sll1150-3F TGTCGATAGTATATTAAAGGTAAGGGAAAAATAATTTCCCCCCTGATATCATTTTTA
GTAAGATCTCGTTGCTCAGAATTTTAGCTGTA
92 Sll1150-4R AGGGGGGGATGGGATTAATCGTCTCCAT
93 Sll1414-1F AGTTTCTCGTTCTGCCGCCTCAGCTCTT
94 Sll1414-2R AATGGGGCCTCATAGTGGGGCATGGATTGAAGATATCAGGGCCGATTACAAAGGG
GGGGATAGT
95 Sll1414-3F ACTATCCCCCCCTTTGTAATCGGCCCTGATATCTTCAATCCATGCCCCACTATGAG
GCCCCATT
96 Sll1414-4R ATTAACTCCCCATCCACTTCCACTTCGATGAT
2.6.4.4 Overlap extension PCR
Overlap extension PCR (Lan et al. 2005) is an effective tool to manipulate DNA
66
sequences. In this project, it was used to insert/remove DNA sequences to/from the
original templates, to enable addition of affinity-tag coding sequences, insertion of an
antibiotic resistance marker or deletion of an entire ORF to create knockout mutants.
The initial reactions (PCR 1 and PCR 2) were performed using the wild-type DNA
templates, 50 μl Phusion PCR reactions were performed according to the standard
settings. PCR 1 contained a forward primer that carrying identical sequence as the 5’
end of the target sequence. The reverse primer in PCR 1 was designed to anneal to the
3’ end of the target region but with the EcoRV and XbaI restriction sites inserted right
at the upstream position of the STOP codon, and ~ 30 bp downstream sequences was
also contained in the reverse primer. PCR 2 contained the forward primer that was
complimentary to the reverse primer in PCR1. The reverse primer was
complementary to the sequence 650 bp downstream the FtsH gene. PCR program
setting is described in previous paragraphs. The resulting PCR fragments were
separated by agarose gel electrophoresis and gel extracted to be used as DNA
templates in a final PCR (PCR 3). PCR 3 was prepared as for a 50 μl standard
reaction, but with a few alterations as listed below. The forward primer in PCR 3 is
the forward primer used in PCR 1 and the other one is the reverse primer used in PCR
2. Approximately 2 μl of each PCR fragment from PCR 1and 2 were used as the
template DNA, the amount of each template in the reaction mix is estimated equal.
2.6.5 Restriction endonuclease digestion
Restriction endonuclease digestions were performed under suitable conditions as
recommended by the enzyme manufacturer’s instructions (New England BioLabs
Limited, UK). Approximately 1 μg of DNA was digested in 10 μl reaction mix, with
10 to 20 units of restriction endonuclease in the recommended buffer. Acetylated
bovine serum albumin (BSA; supplied with enzymes by New England BioLabs
Limited, UK; final [100 μg ml-1
]) was applied when necessary. Digestion took 40 min
to 1 h to complete.
67
2.6.6 DNA ligation
DNA fragments were inserted into various recipient vectors using T4 DNA ligase
according to the manufacturer’s instruction (New England BioLabs Limited, UK).
The molar ratio between the insert and vector was 3:1. The reaction mixtures were
incubated at room temperature for 30 min.
2.6.7 DNA transformation of cells
2.6.7.1 Preparation of chemically competent E. coli cells
A single E. coli colony or 50 μl of the stock culture was inoculated into 10 ml LB
medium and incubated at 37 oC under consistent sharking. After overnight incubation,
the optical cell density was determined at 600 nm (OD600nm), and then the culture was
used to inoculate 500 ml LB medium supplemented with 20 mM [final] MgSO4 to a
starting concentration of OD600nm = 0.1. The culture was incubated on an orbital
shaker at 225 rpm, 37 oC until the optical density reach OD600nm of 0.4-0.6. The cells
were then harvested via centrifugation in a rotor (JA-14) pre-chilled to 4 oC, for 10
min at 4,500 g. The cell pellets were then gently resuspended by shaking in 200 ml
ice-cold TFB1 buffer (100 mM RbCl, 50 ml MnCl2, 10 mM CaCl2, 15 % (v/v)
glycerol, 30 mM potassium acetate, pH = 5.8, filter sterile). The cell suspension was
kept on ice for 5 min and pelleted again via centrifugation (JA-14; 4,500 g, 10 min, 4
oC). The cell pellets were then carefully resuspended in ice-cold TFB2 buffer (10 mM
RbCl, 75 mM CaCl2, 15 % (v/v) glycerol, 10 mM MOPS pH = 6.5, filter sterile) and
incubated on ice for 60 min. The cells were then aliquotted at 4 oC and flash frozen in
liquid nitrogen and stored at -80 oC.
2.6.7.2 Transformation of chemically competent E. coli cells
In each transformation reaction, 50 μl of chemically competent E. coli cells was
thawed on ice for ~10 min and then, approximately 0.2 μg of plasmid DNA or ligation
68
mixture was mixed with cells by gently pipetting up and down with an ice-cold
pipette tip. After 30 min incubation on ice, cells were heat shocked at 37 oC for 2 min
and incubated for 10 min on ice. 450 μl of liquid LB medium were added and cells
incubated for 1 hour under vigorous shaking at 37 oC. Then 250 μl of the mix were
directly plated onto LB 1.5 % (w/v) agar plates contains a suitable antibiotic selection
and if applicable 0.5 mM isopropyl-β-D-thiogalactopyranoside (IPTG) and 80 μg ml-1
5-bromo-4-chloro-3-indolyl-β-D-galactoside (X-Gal). The plates were incubated at 37
oC overnight.
2.6.7.3 Transformation of Synechocystis sp. PCC 6803
Synechocystis cells were transformed with recombinant plasmid DNA according to
the protocol described by Williams (1988) and Nixon et al. (1992). Recipient cells
that were grown in liquid BG-11 medium with 5 mM glucose were harvested in
exponential growth phase (OD730nm < 1) by centrifugation (centrifuge model Allegra
6R, Beckman Coulter Limited, UK; GH-3.8 rotor; 2,000 g, 15 min, 29 °C) and
resuspended in fresh BG-11 medium yielding a cell suspension with a final OD730nm
of ~5.0. For each transformation reaction, 100 μl of the concentrated cell suspension
were mixed with 1 to 10 μg of recombinant plasmid DNA. The mixture was incubated
at 30 °C, supplied with continuous white light illumination at ~ 5 μmol m-2
s-1
for 4 to
6 h and occasional agitation. The transformation mixture was plated onto 4-μm
cellulose nitrate membrane filters (Schleicher & Schuell MicroScience GmbH,
Germany) placed on a BG-11 1.5 % (w/v) agar plate (5 mM glucose where
applicable). After 24 h under continuous white light illumination at ~10 μmol m-2
s-1
the filter was transferred to a new plate containing suitable antibiotic(s). Resistant
colonies appeared after seven to ten days. Transformants were restreaked at least three
times, until PCR analyses were performed to test for segregation.
69
2.6.8 DNA extraction and purification
2.6.8.1 Mini plasmid DNA preparation from E. coli
The mini plasmid DNA preparation procedure is described in Birnoim and Doly
(1979). A single colony was picked up from a plate and inoculated 3 ml LB liquid
medium containing the appropriate antibiotic(s). The E. coli culture was incubated
overnight on the shaker at 37 oC, 225 rpm. Cells were harvested from 1.5 ml culture
by centrifugation in a microfuge (model 5410, Eppendorf AG, Germany) at 1,300 rpm
for 1min. The cell pellet was resuspended in 50 μl P1 buffer (Plasmid-Midi-Kit,
Qiagen Limited, UK). After 50 μl P2 buffer (Plasmid-Midi-Kit, Qiagen Limited, UK)
was added, the sample was gently inverted 6 times immediately to lyse the cells
efficiently without disturbing the genomic DNA. The mixture was then left at room
temperature for 5 min and 50 μl ice-cold P3 buffer (Plasmid-Midi-Kit, Qiagen
Limited, UK) was added. After 6 time gentle inversion, it was left on ice for 5 min.
Then the precipitate was spun down in the microfuge at 1,300 rpm for 5 min.
Supernatant was transferred to a new tube and 1 ml 100 % ethanol was added to
precipitate plasmid DNA. The sample was incubated at room temperature for 5 min
and then, DNA was pelleted in the microfuge at 1,300 rpm for 10 min. The
supernatant was removed and 200 μl of 70 % ethanol was added to wash the DNA.
1min later, the ethanol was removed and the DNA sample was air dried until all the
ethanol had evaporated. Finally, 50 μl autoclaved RO water was added to dissolve the
plasmid DNA. The sample was stored at -20 oC.
2.6.8.2 Midi plasmid DNA preparation from E. coli
Midi plasmid DNA preparations were performed using Plasmid–Midi-Kit (Qiagen
Limited, UK) according to the manufacturer’s protocol (see Qiagen Plasmid
purification Handbook. 11/1998, p. 13ff). The air-dried plasmid DNA pellet was
resuspended in 400 μl elution buffer (EB) which is from Qiagen gel extraction kit
(Qiagen Limited, UK).
70
2.6.8.3 Total cellular DNA extraction from Synechocystis sp. PCC6803
Total cellular DNA extractions from Synechocystis were performed according to the
phenol-chloroform extraction method devised by Dr. Josef Komenda (Institute of
Microbiology, Trebon, Czech Republic). A loopful Synechocystis cells from a BG-11
agar plate were resuspended in 200 μl of TE buffer (10 mM Tris/HCl pH = 8.0, 1 mM
EDTA) and 200 μl of phenol (saturated with 10 mM Tris/HCl pH = 8.0, 1 mM EDTA)
were added. The suspension was hand-extracted twice for 20 s and centrifuged in a
microfuge (Denville 2600, Denville Scientific Inc. USA) at maximum speed for 5 min
at 4 oC. The aqueous phase was transferred to a new tube and one volume of
chloroform was added. The mix was hand extracted for 30 s and centrifuged in a
microfuge at maximum speed for 5 min. The aqueous phase was transferred to a new
tube and a tenth sample volume of 3 M sodium acetate (pH = 4.8) together with two
volumes of 100 % (v/v) ethanol were added and mixed by gentle inversions. To allow
DNA precipitation the sample was incubated at RT for 10 min, and then the DNA was
pelleted in a microfuge at maximum speed for 30 min and the obtained pellet was
washed with 70 % (v/v) ethanol, resuspended in 100 μl nuclease-free RO water and
stored at –20 °C.
To extract high quality genomic DNA free of phenol contamination and suitable to be
used as template DNA in Phusion PCR reactions, ZR Fungal/Bacterial DNA MiniPrep
(Zymo Research Co. USA) Kit was used according to the manufacturer’s protocol.
2.6.9 Estimation of DNA concentration and quality
The DNA concentrations were measured with a Shimadzu spectrophotometer
(UV-1601, Shimadzu, Japan) at a wavelength of 260 nm. An absorbance value of 1 at
260 nm wavelength is equivalent to a concentration of ~50 μg ml-1
of double strand
DNA (Sambrook et al. 1989). The quality of plasmid DNA was estimated visually
71
after agrose gel electrophoresis and UV illumination (BioDoc-ITTM
System, UVP; CA,
USA) (Video Graphic Printer UP-890CE; Sony, Japan)
2.6.10 DNA sequencing
The sequencing of plasmid and PCR fragment DNA was performed by Beckman
Coulter Genomics Limited, UK. Samples were prepared according to the instruction
from the service provider.
2.6.11 Construction of the C-terminal tagging cassettes
Isolation and in situ localisation of FtsH complexes was based on C-terminal tagging
approach, which has either a GST tag that enable affinity purification, or a GFP tag
that is fluorescent in confocal microscopy, fused to the C-terminus of each
Synechocystis FtsH protease. In this section, the construction of the FtsH gst/gfp
tagging system was described.
2.6.11.1 Outline of the C-terminal gst/gfp tagging strategy
As multiple proteins were to be fused with a GST tag, we decided to create a universal
tagging cassette (Figure 2.1) that starts with a thrombin cleavage site (to enable tag
removal after purification), following by the cDNA sequence of
glutathione-S-transferase (GST) from Schistosoma japonicum, and then a strep II tag
before the STOP codon. Three endonuclease restriction sites, KasI, HpaI and XbaI
were designed 3’ to the STOP codon; the HpaI site will be used as the insertion site
for selectable markers. The whole tagging cassette was designed to be released by
EcoRV and XbaI digestion; the AvrII, BamHI and KasI sites enable further
modifications such as addition, removal or replacement of each module in the cassette,
e.g. replacing the gst with the coding sequence of green fluorescent protein (GFP).
Once the desirable selectable marker was integrated into the cassette (erythromycin in
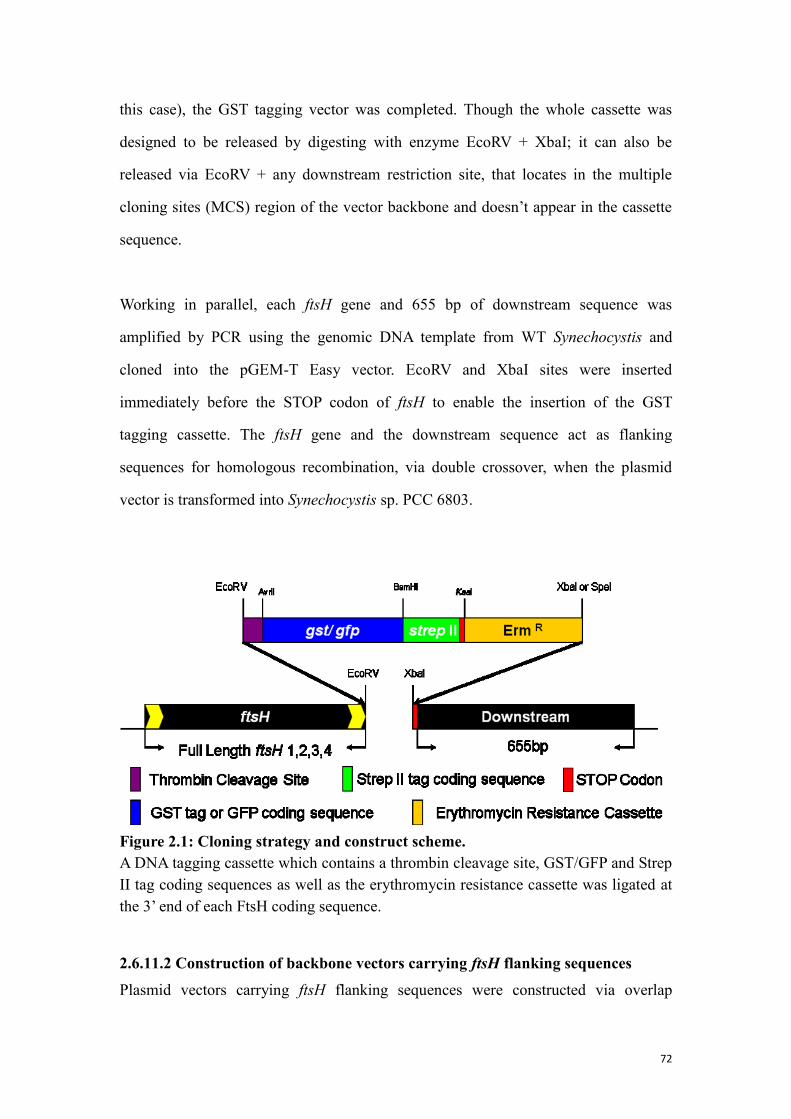
72
this case), the GST tagging vector was completed. Though the whole cassette was
designed to be released by digesting with enzyme EcoRV + XbaI; it can also be
released via EcoRV + any downstream restriction site, that locates in the multiple
cloning sites (MCS) region of the vector backbone and doesn’t appear in the cassette
sequence.
Working in parallel, each ftsH gene and 655 bp of downstream sequence was
amplified by PCR using the genomic DNA template from WT Synechocystis and
cloned into the pGEM-T Easy vector. EcoRV and XbaI sites were inserted
immediately before the STOP codon of ftsH to enable the insertion of the GST
tagging cassette. The ftsH gene and the downstream sequence act as flanking
sequences for homologous recombination, via double crossover, when the plasmid
vector is transformed into Synechocystis sp. PCC 6803.
Figure 2.1: Cloning strategy and construct scheme.
A DNA tagging cassette which contains a thrombin cleavage site, GST/GFP and Strep
II tag coding sequences as well as the erythromycin resistance cassette was ligated at
the 3’ end of each FtsH coding sequence.
2.6.11.2 Construction of backbone vectors carrying ftsH flanking sequences
Plasmid vectors carrying ftsH flanking sequences were constructed via overlap
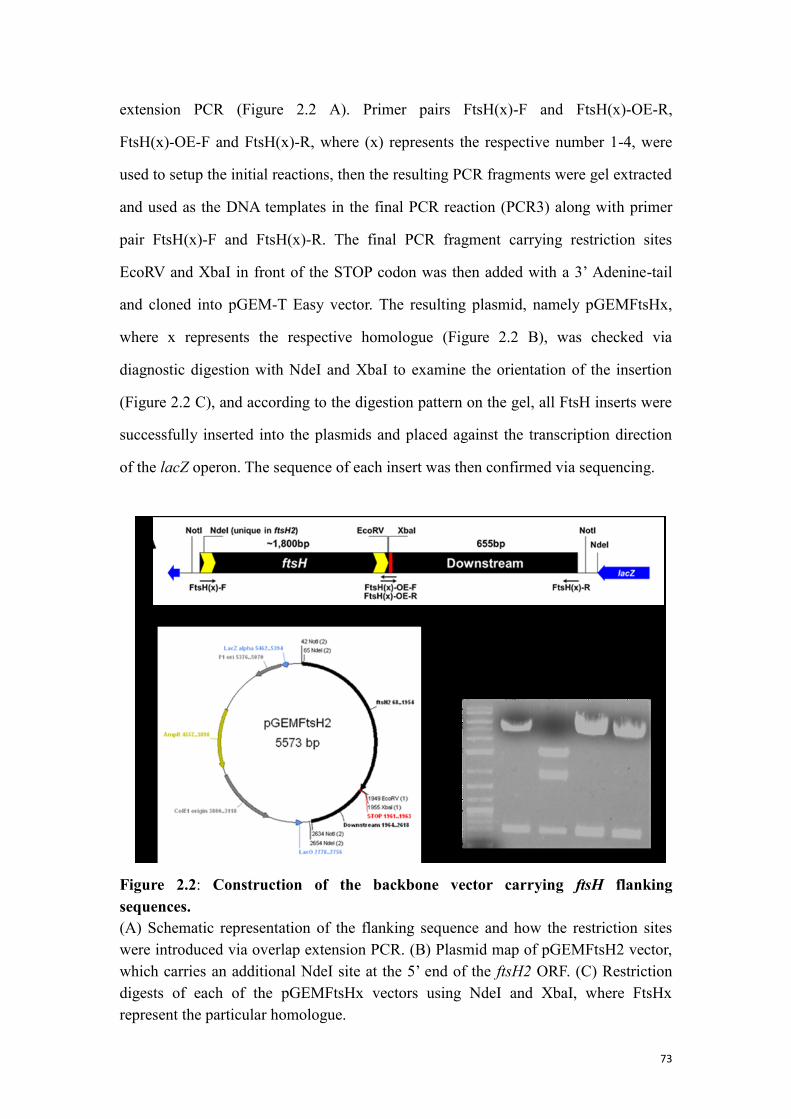
73
extension PCR (Figure 2.2 A). Primer pairs FtsH(x)-F and FtsH(x)-OE-R,
FtsH(x)-OE-F and FtsH(x)-R, where (x) represents the respective number 1-4, were
used to setup the initial reactions, then the resulting PCR fragments were gel extracted
and used as the DNA templates in the final PCR reaction (PCR3) along with primer
pair FtsH(x)-F and FtsH(x)-R. The final PCR fragment carrying restriction sites
EcoRV and XbaI in front of the STOP codon was then added with a 3’ Adenine-tail
and cloned into pGEM-T Easy vector. The resulting plasmid, namely pGEMFtsHx,
where x represents the respective homologue (Figure 2.2 B), was checked via
diagnostic digestion with NdeI and XbaI to examine the orientation of the insertion
(Figure 2.2 C), and according to the digestion pattern on the gel, all FtsH inserts were
successfully inserted into the plasmids and placed against the transcription direction
of the lacZ operon. The sequence of each insert was then confirmed via sequencing.
Figure 2.2: Construction of the backbone vector carrying ftsH flanking
sequences.
(A) Schematic representation of the flanking sequence and how the restriction sites
were introduced via overlap extension PCR. (B) Plasmid map of pGEMFtsH2 vector,
which carries an additional NdeI site at the 5’ end of the ftsH2 ORF. (C) Restriction
digests of each of the pGEMFtsHx vectors using NdeI and XbaI, where FtsHx
represent the particular homologue.
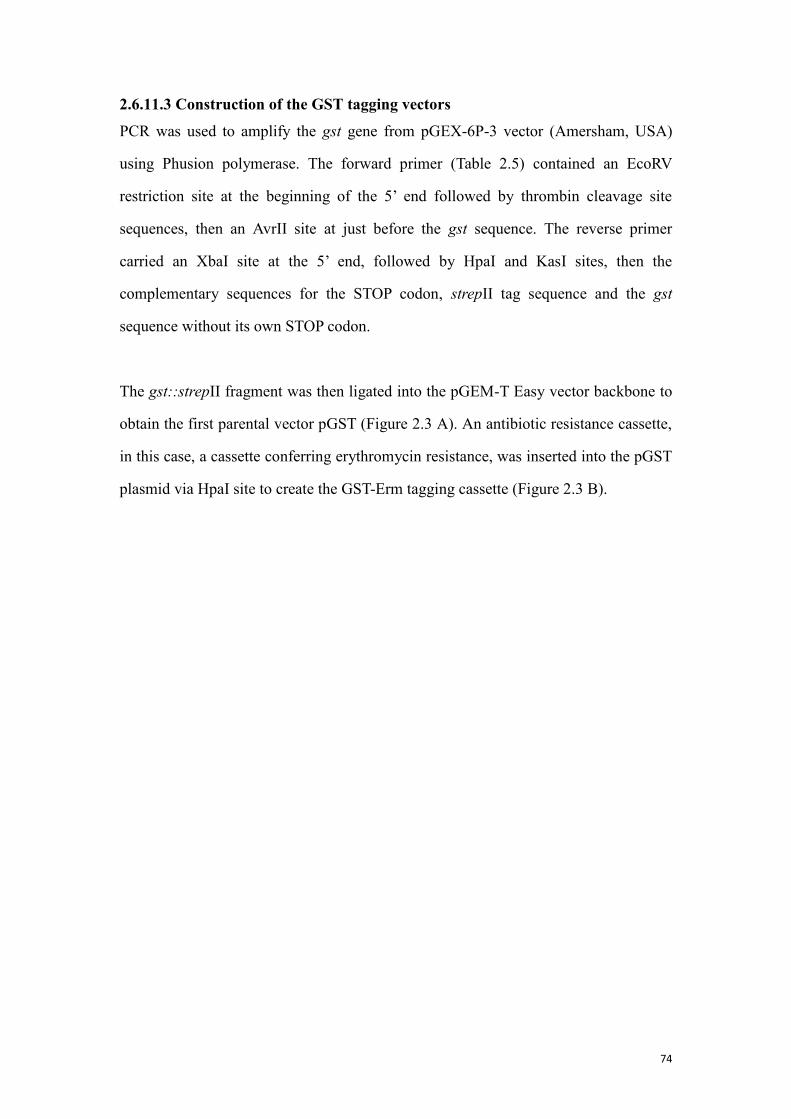
74
2.6.11.3 Construction of the GST tagging vectors
PCR was used to amplify the gst gene from pGEX-6P-3 vector (Amersham, USA)
using Phusion polymerase. The forward primer (Table 2.5) contained an EcoRV
restriction site at the beginning of the 5’ end followed by thrombin cleavage site
sequences, then an AvrII site at just before the gst sequence. The reverse primer
carried an XbaI site at the 5’ end, followed by HpaI and KasI sites, then the
complementary sequences for the STOP codon, strepII tag sequence and the gst
sequence without its own STOP codon.
The gst::strepII fragment was then ligated into the pGEM-T Easy vector backbone to
obtain the first parental vector pGST (Figure 2.3 A). An antibiotic resistance cassette,
in this case, a cassette conferring erythromycin resistance, was inserted into the pGST
plasmid via HpaI site to create the GST-Erm tagging cassette (Figure 2.3 B).
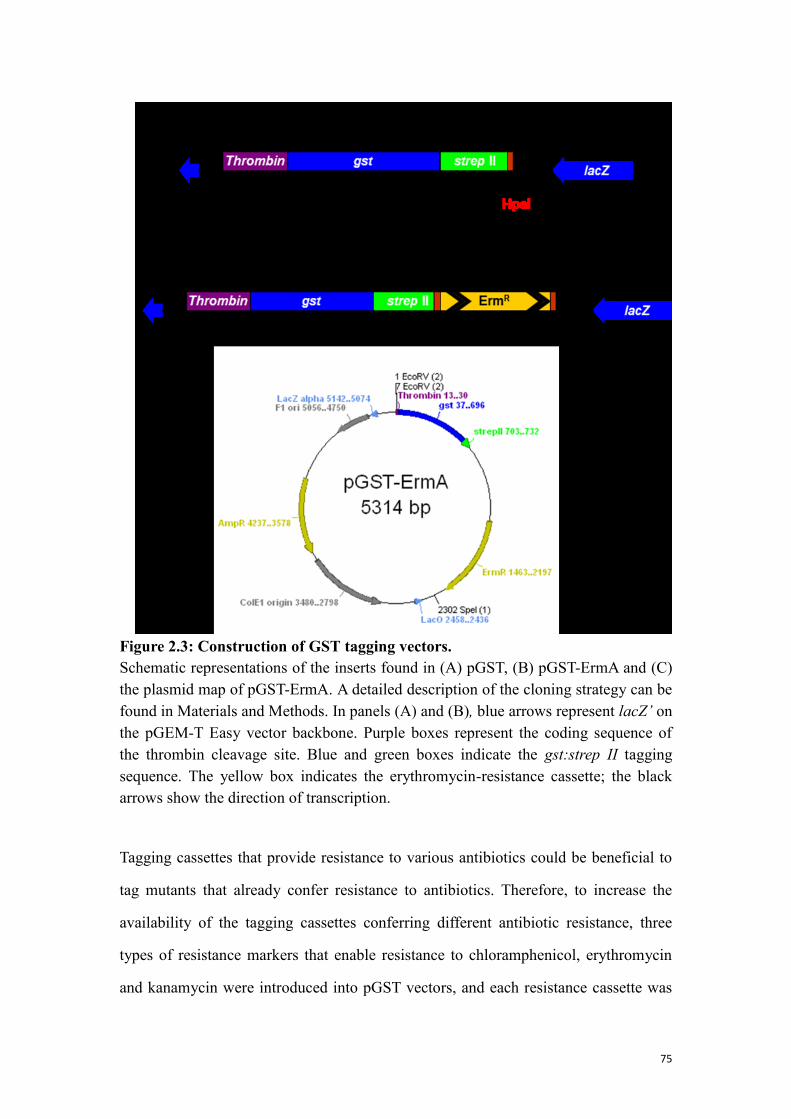
75
Figure 2.3: Construction of GST tagging vectors.
Schematic representations of the inserts found in (A) pGST, (B) pGST-ErmA and (C)
the plasmid map of pGST-ErmA. A detailed description of the cloning strategy can be
found in Materials and Methods. In panels (A) and (B), blue arrows represent lacZ’ on
the pGEM-T Easy vector backbone. Purple boxes represent the coding sequence of
the thrombin cleavage site. Blue and green boxes indicate the gst:strep II tagging
sequence. The yellow box indicates the erythromycin-resistance cassette; the black
arrows show the direction of transcription.
Tagging cassettes that provide resistance to various antibiotics could be beneficial to
tag mutants that already confer resistance to antibiotics. Therefore, to increase the
availability of the tagging cassettes conferring different antibiotic resistance, three
types of resistance markers that enable resistance to chloramphenicol, erythromycin
and kanamycin were introduced into pGST vectors, and each resistance cassette was
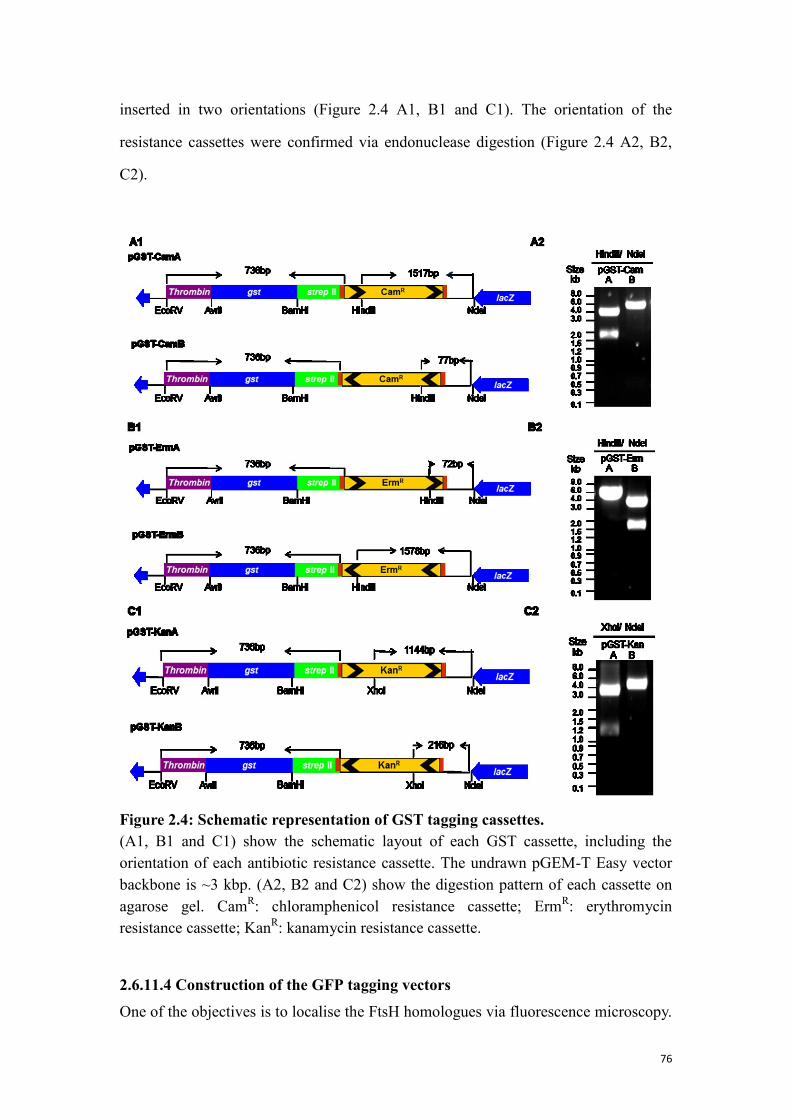
76
inserted in two orientations (Figure 2.4 A1, B1 and C1). The orientation of the
resistance cassettes were confirmed via endonuclease digestion (Figure 2.4 A2, B2,
C2).
Figure 2.4: Schematic representation of GST tagging cassettes.
(A1, B1 and C1) show the schematic layout of each GST cassette, including the
orientation of each antibiotic resistance cassette. The undrawn pGEM-T Easy vector
backbone is ~3 kbp. (A2, B2 and C2) show the digestion pattern of each cassette on
agarose gel. CamR: chloramphenicol resistance cassette; Erm
R: erythromycin
resistance cassette; KanR: kanamycin resistance cassette.
2.6.11.4 Construction of the GFP tagging vectors
One of the objectives is to localise the FtsH homologues via fluorescence microscopy.
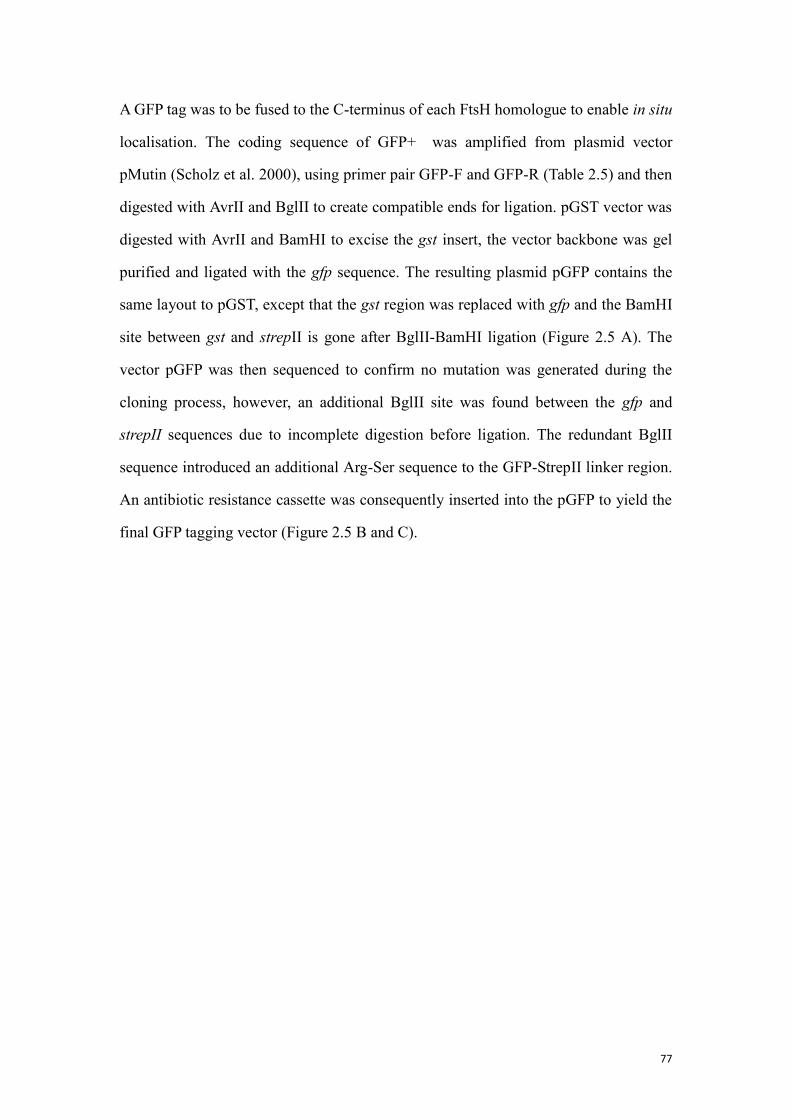
77
A GFP tag was to be fused to the C-terminus of each FtsH homologue to enable in situ
localisation. The coding sequence of GFP+ was amplified from plasmid vector
pMutin (Scholz et al. 2000), using primer pair GFP-F and GFP-R (Table 2.5) and then
digested with AvrII and BglII to create compatible ends for ligation. pGST vector was
digested with AvrII and BamHI to excise the gst insert, the vector backbone was gel
purified and ligated with the gfp sequence. The resulting plasmid pGFP contains the
same layout to pGST, except that the gst region was replaced with gfp and the BamHI
site between gst and strepII is gone after BglII-BamHI ligation (Figure 2.5 A). The
vector pGFP was then sequenced to confirm no mutation was generated during the
cloning process, however, an additional BglII site was found between the gfp and
strepII sequences due to incomplete digestion before ligation. The redundant BglII
sequence introduced an additional Arg-Ser sequence to the GFP-StrepII linker region.
An antibiotic resistance cassette was consequently inserted into the pGFP to yield the
final GFP tagging vector (Figure 2.5 B and C).
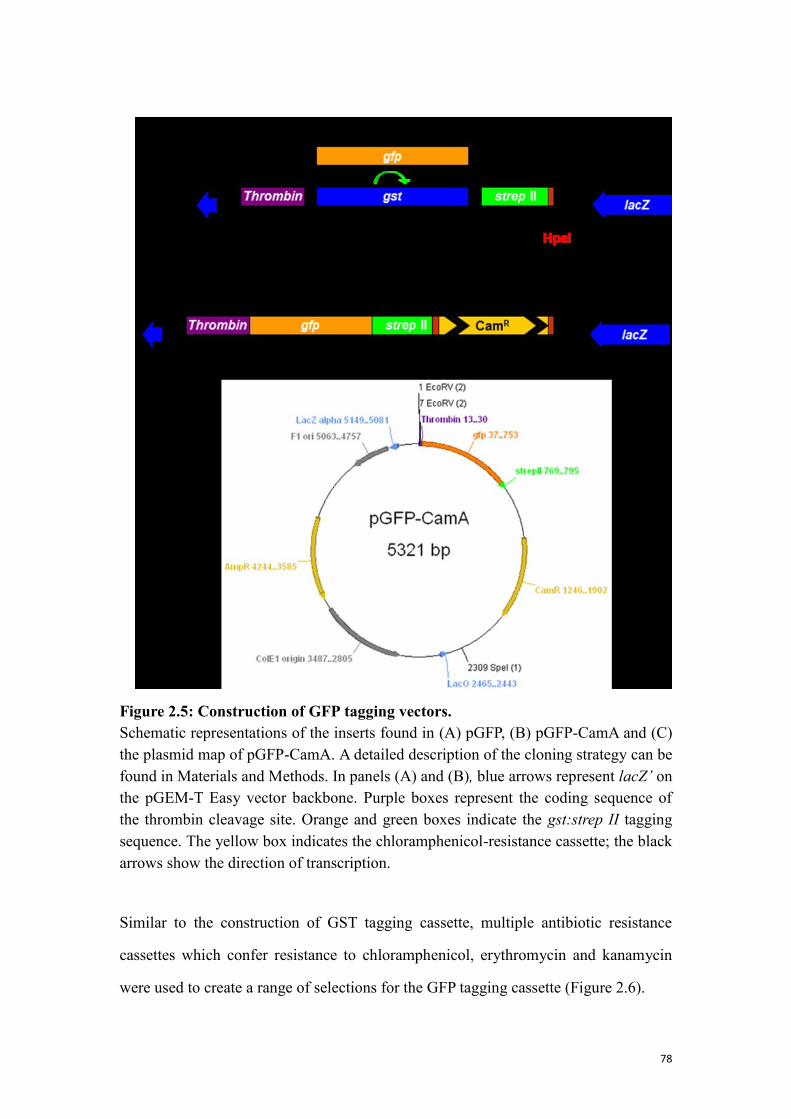
78
Figure 2.5: Construction of GFP tagging vectors.
Schematic representations of the inserts found in (A) pGFP, (B) pGFP-CamA and (C)
the plasmid map of pGFP-CamA. A detailed description of the cloning strategy can be
found in Materials and Methods. In panels (A) and (B), blue arrows represent lacZ’ on
the pGEM-T Easy vector backbone. Purple boxes represent the coding sequence of
the thrombin cleavage site. Orange and green boxes indicate the gst:strep II tagging
sequence. The yellow box indicates the chloramphenicol-resistance cassette; the black
arrows show the direction of transcription.
Similar to the construction of GST tagging cassette, multiple antibiotic resistance
cassettes which confer resistance to chloramphenicol, erythromycin and kanamycin
were used to create a range of selections for the GFP tagging cassette (Figure 2.6).
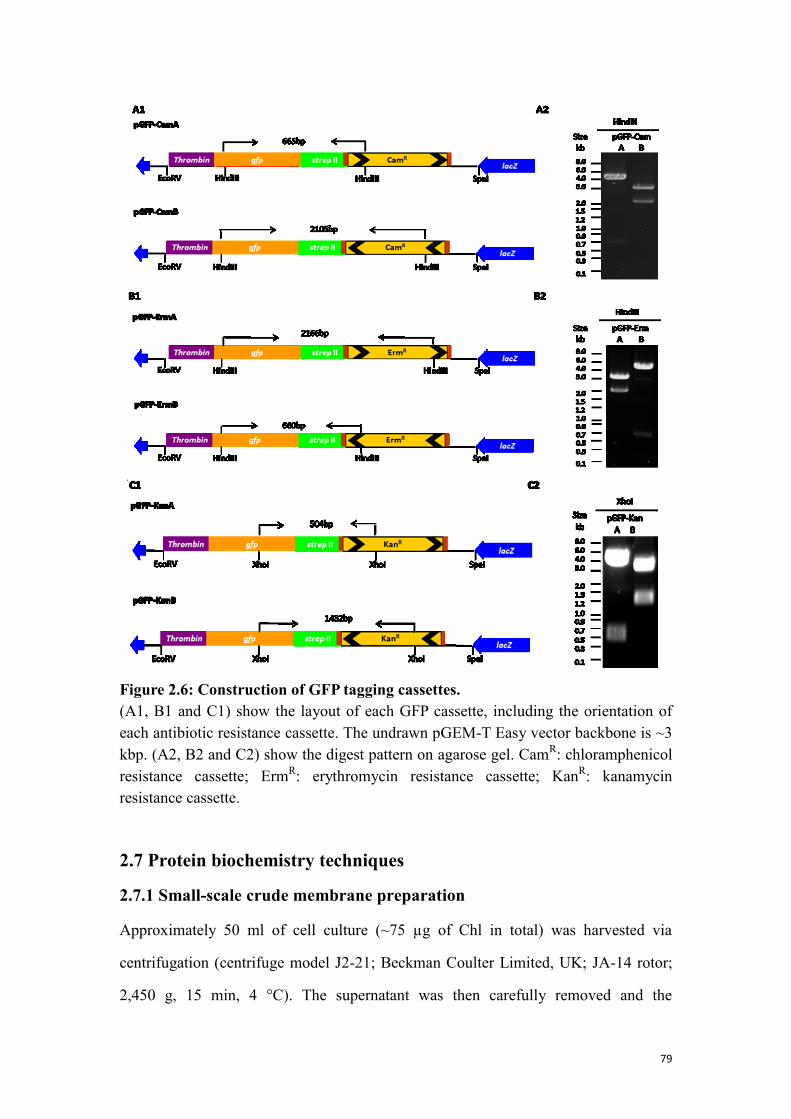
79
Figure 2.6: Construction of GFP tagging cassettes.
(A1, B1 and C1) show the layout of each GFP cassette, including the orientation of
each antibiotic resistance cassette. The undrawn pGEM-T Easy vector backbone is ~3
kbp. (A2, B2 and C2) show the digest pattern on agarose gel. CamR: chloramphenicol
resistance cassette; ErmR: erythromycin resistance cassette; Kan
R: kanamycin
resistance cassette.
2.7 Protein biochemistry techniques
2.7.1 Small-scale crude membrane preparation
Approximately 50 ml of cell culture (~75 µg of Chl in total) was harvested via
centrifugation (centrifuge model J2-21; Beckman Coulter Limited, UK; JA-14 rotor;
2,450 g, 15 min, 4 °C). The supernatant was then carefully removed and the
80
remaining pellet was resuspended in 500 µl KPN buffer (40 mM K-phosphate, pH =
8.0, 100 mM NaCl), appropriate amount of EDTA-free protease inhibitor cocktail
tablets (Roche, UK) was also supplemented to the KPN buffer prior to application.
The resulting cell suspension was then transferred to a 2 ml centrifugation tube
(Eppendorf, Germany) containing ~200 µl glass beads, the size of which was 212 to
300 µm (Sigma Aldrich, UK). The mixture was then pre-chilled on ice and then
vortexed (Vortex-Genie 2, Scientific Industries, Inc. USA) under green light at the
maximum speed for 1 minute. The mixture was then chilled on ice for 1 minute to
reduce the heat generated in the vortexing step. Depending on the breakage efficiency,
the cells were disrupted multiple times via the vortex-chill cycle, typically the
breakage was performed 3 times per sample. After breakage, the supernatant was
carefully transferred into a new 1.5 ml centrifuge tube and membrane fragments stuck
in glass beads was rinsed with 800 µl KPN buffer containing protease inhibitor, and
combined with the previously retrieved fraction. Unbroken cells in the lysate were
span down in the microcentrifuge (Denville 2600, Denville Scientific Inc. USA) at
6,600 g for 1 min at 4 oC. The supernatant containing membrane fragments were
carefully transferred to a new 1.5 ml centrifuge tube and further spun twice to remove
as much unbroken cells as possible. Noteworthy, the colour of the supernatant should
be dark-green and transparent at this stage. The supernatant was then span at 16,000 g
for 40 min to harvest the membrane fraction. After the centrifugation, the blue
supernatant containing soluble proteins was removed, and the membrane pellet was
resuspended in 50 µl KPN buffer without protease inhibitor. The chlorophyll a
concentration of the membrane sample was then measured and adjusted to desirable
level, typically 0.4 µg µl-1
.
2.7.2 Protein purification techniques
2.7.2.1 Purification of FtsH-GST from Synechocystis sp. PCC6803
Approximately 10 litre of Synechocystis sp. PCC 6803 cell culture was initially
81
concentrated to ~2 litres using a tangential flow filtration system (Millipore Limited,
UK) and then pelleted via centrifugation (centrifuge model J2-21; Beckman Coulter
Limited, UK; JA-14 rotor; 9,600 g, 10 min, 4 °C). Then the pellet was washed with
~500 ml ice-cold KPN buffer (40 mM K-phosphate, pH = 8.0, 100 mM NaCl). Cells
were pelleted again by centrifugation, and then resuspended with KPN buffer and a
protease inhibitor cocktail tablet (Roche, UK) to a final volume of 50 ml. The cell
suspension was then fractionated in a cell disruptor (Constant System Limited, UK) at
25 kPsi, 4 oC. After breakage, the suspension was centrifuged (centrifuge model
Allegra 6R, Beckman Coulter Limited, UK; GH-3.8; 2,000 g, 15 min, 4 °C) to pellet
unbroken cells. The supernatant was transferred into two type Ti45 ultracentrifugation
tubes and centrifuged (ultracentrifuge model L-70; Beckman Coulter Limited, UK;
Ti45 rotor; 100,000 g, 60 min, 4 °C). The pellet containing the thylakoid membrane
was resuspended in 45 ml of Buffer A (50 mM HEPES, pH=7.2, 1.2 M Betaine, 10 %
(v/v) Glycerol, 100 mM NaCl, 5 mM MgCl2, 10 µM ZnCl2). 5 ml of 10 % (w/v)
n-dodecyl-β-maltoside (β-DM) was added to the thylakoid suspension to solubilise the
membrane proteins. The Mixture was then kept on a rotating wheel in the dark for 30
min at 4 o
C. Insoluble components were then pelleted by centrifugation
(ultracentrifuge model L-70; Beckman Coulter Limited, UK; Ti70 rotor; 100,000 g,
30 min, 4 °C), and the soluble fraction was applied to 5 ml pre-equilibrated
GST-Agarose resin. After 2 h incubation in the dark, on a rotating wheel at 4 °C, the
resin was washed by ~200 ml of washing buffer (50 mM HEPES, pH=7.2, 5 % (v/v)
Glycerol,100 mM NaCl, 5 mM MgCl2, 10 µM ZnCl2, 0.03 % (w/v) β-DM). Then the
FtsH sample was either eluted with 10 ml of elution buffer (50 mM Tris/HCl, pH=8.0,
80 mM NaCl, 5 mM MgCl2, 12.5 µM ZnCl2, 0.005 % (w/v) β-DM, 1.4 mM
2-mercaptoethanol, 25 mM Reduced Glutathione ), or a thrombin on column cleavage
was performed by applying 5 ml cleavage buffer (50 mM Tris/HCl, pH=8.0, 80 mM
NaCl, 5 mM MgCl2, 12.5 µM ZnCl2, 0.005 % (w/v) β-DM, 1.4 mM
2-mercaptoethanol, 50 unit thrombin). For on column cleavage, the resin was
82
incubated with cleavage buffer on a rotating wheel for 1.5 h at room temperature.
Then the resin was pelleted by centrifugation (centrifuge model Allegra 6R, Beckman
Coulter Limited, UK; GH-3.8; 2,000 g, 1 min, 4 °C). The supernatant contains
GST-free FtsH sample, and the undigested samples were eluted with elution buffer.
2.7.2.2 Purification of recombinant protein from E. coli
The expression E. coli strain KRX (Promega) was firstly transformed with the
targeting expression vector, then the transformants were grown overnight in advance.
A 10 ml starting culture was prepared by inoculating a single colony from the
transformation plate into 10 ml LB medium containing 100 µg ml-1
ampicillin, and
then incubated at 37 oC overnight, 200 rpm. On the following day, the cell culture was
then used to inoculate 1 L LB medium to a starting OD600nm of 0.1. The scaled up
culture was then grown at 37 oC, 200 rpm until the OD600nm reach 0.4-0.5. The
culture was then chilled to room temperature and induced with 0.1 % (w/v)
L-rhamnose. The culture was then incubated at 18 oC overnight. On the following day,
cells were harvested via centrifugation (JA-14 rotor; 4,000 g, 10 min, 4 °C) The
resulting cell pellet was resuspended in 25 ml lysis buffer (50 mM Tris-HCl buffer pH
= 7.9, 500 mM NaCl and 10 mM Imidazole) containing appropriate amount of
EDTA-free protease inhibitor cOmplete (Roche) and disrupted via ultrasonication
(Sonic Vibra-Cell VCX 130). The disruption was performed on ice bath with the cycle
and strength setting of 5 sec on, 5 sec off, 75% amplitude. The insoluble fraction was
then removed from the disrupted cell lysate via centrifugation (JA-14 rotor; 4,000 g,
40 min, 4 °C), and the resulting soluble fraction was further filtered with a 0.45 µm
filter Minisart (Sartorius Stedim Biotech) and used for consequent purifications.
The consequent purification steps were conducted at 4 °C. The soluble fraction of cell
lysate was applied to ~ 10 ml of Ni-NTA resin (Thermo Scientific), which was
pre-equilibrated with lysis buffer. The mixture was then transferred to a rotating wheel
83
and incubated for 30 min. The supernatant was then removed and the resin was
washed 3 times with 1 column volume of washing buffers (50 mM Tris-HCl pH=7.9
and 500 mM NaCl) containing a gradient of imidazole concentration (10 mM, 30 mM
and 60 mM). After washing, the resin-bound protein was eluted with elution buffer
(50 mM Tris-HCl pH=7.9, 500 mM NaCl and 500 mM imidazole).
2.7.3 Polyacrylamide gel electrophoresis (PAGE)
2.7.3.1 Sodium dodecyl sulphate gel electrophoresis (SDS-PAGE)
The SDS-PAGE gels were self-cast, 0.75 mm thick and run in the Bio-Rad
Mini-PROTEAN III vertical gel system (Bio-Rad Laboratories Limited, UK). The
separation gel was typically a 12.5 % (w/v) continuous polyacrylamide (PAA; from a
40 % acylamide/bisacrylamide = 37.5g l-1
stock solution), 6 M urea, 0.375 M
Tris/HCl pH = 8.9, 0.01 % (v/v) N,N,N’,N’ tetramethylenediamine (TEMED); 0.1 %
(w/v) ammonium persulphate (APS) SDS-PAGE gel. A 5 % (w/v) PAA (from a 40 %
arylamide/bisacrylamide = 37.5/l stock solution) stacking gel containing 0.125 M
Tris/HCl pH = 6.8, 0.01% (v/v) TEMED and 0.1% (w/v) APS was poured on top of
the separation gel. Samples for SDS-PAGE analyses were mixed with 2x SDS sample
buffer (2x concentrate: 125 mM Tris/HCl pH 6.8, 4 % (w/v) SDS, 20 % (v/v) glycerol,
0.1 % (w/v) bromophenol blue and 10% 2-mercaptoethanol added freshly before each
use; final [1x]) and then incubated for 5 min at 95 oC to achieve quick solubilisation.
Importantly, membrane proteins prepared from crude membrane preparation (see
section 2.7.1) are not suitable for heat denaturation as extensive aggregation has been
observed before. The alternative approach is to solubilise protein with SDS sample
buffer at room temperature for 40 min. After solubilisation, insoluble materials were
pelleted in a microcentrifuge at maximum speed for 10 min at room temperature. 10
μl samples were loaded in each well. The gels were run at room temperature with
constant voltage of 125 V for 2-3 hours using a Bio-Rad PowerPac Basic (Bio-Rad
Laboratories Limited, UK) in the Tris-glycine running buffer (25 mM Tris, 190 mM
84
glycine, 0.1 % (w/v) SDS, pH = 8.3).
2.7.3.2 Coomassie staining
The obtained gels were either stained with Coomassie (40 % (v/v) methanol, 10 %
(v/v) acetic acid and 0.25 % (w/v) Coomassie-brilliant-blue-R-250) overnight a
rocking shaker and destained with destain buffer (40 % (v/v) methanol, 10 % (v/v)
acetic acid) for ~2 hours at room temperature to remove background strain; or used
for immunoblotting (see 4.9.3)
2.7.3.3 Silver staining
After electrophoresis, the SDS-PAGE gel was incubated with fixation buffer (40 %
(v/v) ethanol and 10 % (v/v) acetic acid) for 15 min, and then transferred into fresh
fixation buffer for another 15 min. The gel was then washed with ddH2O 3x 5 min,
then transferred into sensitisation buffer (30 % (v/v) ethanol, 0.2 % (w/v) sodium
thiosulfate and 6.8 % (w/v) sodium acetate) for 30 min. Then again, the gel was
washed with ddH2O 3x 5 min, prior to staining ( 0.25 % (w/v) silver nitrate) for 20
min. Excessive stains were washed away with ddH2O 2x 1 min, and then the gel was
incubated with development buffer (2.5 % (w/v) sodium carbonate and 0.04 % (v/v)
formaldehyde (freshly added)). The gentle agitation was applied during the
development period until the intensity of protein bands was satisfactory. Stop buffer
(1.46 % (w/v) EDTA) was applied to mediated the reaction, and after 10 min
incubation, the gel was washed with ddH2O 3x 5 min.
2.7.4 Detection of the FtsH homologues, immunoblotting analysis
2.7.4.1 Design of FtsH-specific antibodies
Immunoblotting is a versatile tool to detect the presence/absence of the targeting
antigen in the samples, and it was used in many experiments in this study to detect the
protein level, to elucidate the association between FtsH homologues, to clarify the
85
location of FtsH complexes and so on. Hence the main focus of this study was to
characterise the four FtsH homologues in Synechocystis, short-peptide antibodies
specific to each homologue was needed. To ensure the specificity of each antibody, a
short-peptide sequence, approximately 15-20 amino acid in length, from
less-conserved regions and unique to each homologue was synthesised and used as the
antigen to raise antibodies in rabbits (Table 2.6). In addition, another FtsH antibody
(αFtsH global) that specific to a conserved sequence presents in all cyanobacterial
FtsH homologues, and therefore detects all four homologues with equal sensitivity,
was also raised to quantify the ratio of abundance among homologues.
There are three major domains present in FtsH: the transmembrane domain (TM), the
AAA+ domain and the protease domain (PD), of which, only the AAA+ domain is
highly conserved. Therefore, the sequence region for αFtsH global antibody was
selected from the AAA+ domain according to the alignment. The PD domain is less
conserved due to its functional variations (Lee et al. 2011), moreover, it is a soluble
domain, which is an ideal location to search for soluble peptide sequences. The
antigen sequences for FtsH1 and FtsH4 antibodies were selected from the PD region.
Finally, although the TM is among the least conserved domain in FtsH, most of its
sequences form hydrophobic helices spanning across lipid bilayer of membranes. The
only soluble region in TM is the loop connecting the two helices, thus the sequences
in the loop region of FtsH2 and FtsH3 were the targeting region for the respective
antibodies.
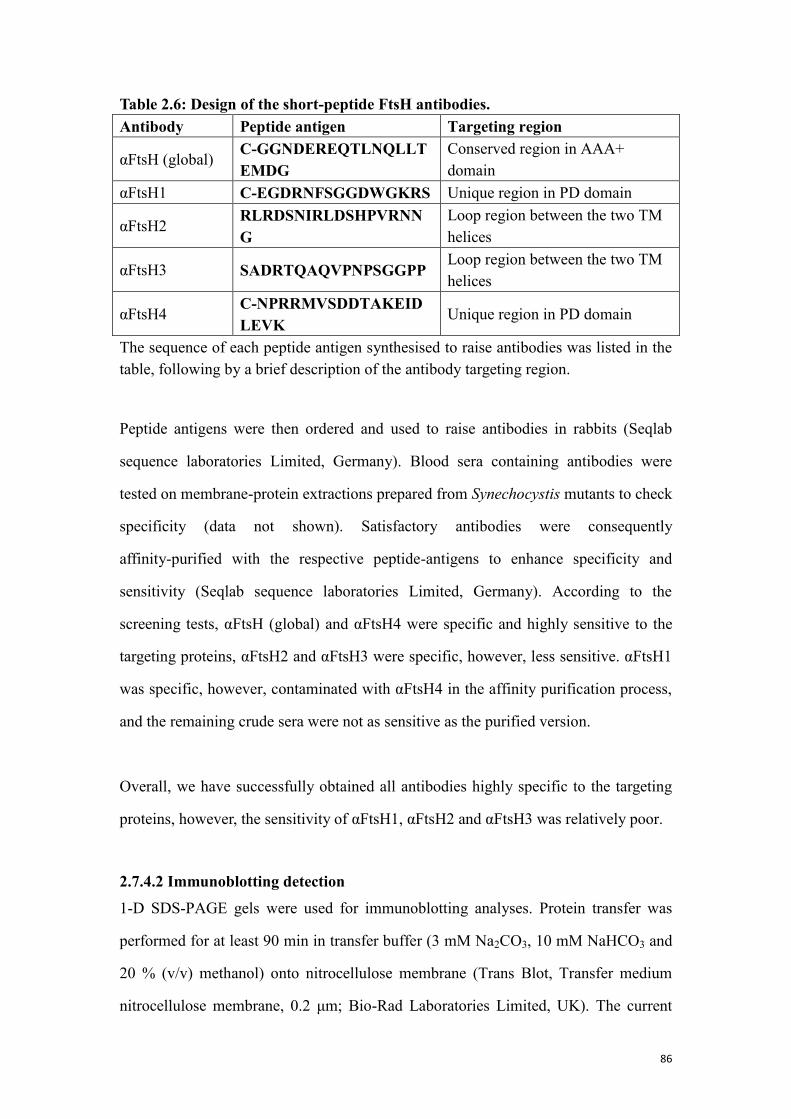
86
Table 2.6: Design of the short-peptide FtsH antibodies.
Antibody Peptide antigen Targeting region
αFtsH (global) C-GGNDEREQTLNQLLT
EMDG
Conserved region in AAA+
domain
αFtsH1 C-EGDRNFSGGDWGKRS Unique region in PD domain
αFtsH2 RLRDSNIRLDSHPVRNN
G
Loop region between the two TM
helices
αFtsH3 SADRTQAQVPNPSGGPP Loop region between the two TM
helices
αFtsH4 C-NPRRMVSDDTAKEID
LEVK Unique region in PD domain
The sequence of each peptide antigen synthesised to raise antibodies was listed in the
table, following by a brief description of the antibody targeting region.
Peptide antigens were then ordered and used to raise antibodies in rabbits (Seqlab
sequence laboratories Limited, Germany). Blood sera containing antibodies were
tested on membrane-protein extractions prepared from Synechocystis mutants to check
specificity (data not shown). Satisfactory antibodies were consequently
affinity-purified with the respective peptide-antigens to enhance specificity and
sensitivity (Seqlab sequence laboratories Limited, Germany). According to the
screening tests, αFtsH (global) and αFtsH4 were specific and highly sensitive to the
targeting proteins, αFtsH2 and αFtsH3 were specific, however, less sensitive. αFtsH1
was specific, however, contaminated with αFtsH4 in the affinity purification process,
and the remaining crude sera were not as sensitive as the purified version.
Overall, we have successfully obtained all antibodies highly specific to the targeting
proteins, however, the sensitivity of αFtsH1, αFtsH2 and αFtsH3 was relatively poor.
2.7.4.2 Immunoblotting detection
1-D SDS-PAGE gels were used for immunoblotting analyses. Protein transfer was
performed for at least 90 min in transfer buffer (3 mM Na2CO3, 10 mM NaHCO3 and
20 % (v/v) methanol) onto nitrocellulose membrane (Trans Blot, Transfer medium
nitrocellulose membrane, 0.2 μm; Bio-Rad Laboratories Limited, UK). The current
87
was set up constantly at 400mA. After the proteins were blotted, the nitrocellulose
membrane was blocked for 1 hour with 1x PBS-T (150mM NaCl. 7.5 mM Na2HPO4,
2.5 mM NaH2PO4 and 0.1% (v/v) Tween 20) supplemented with 5 % (w/v) milk
powder. The membrane was then briefly washed with 1x PBS-T and incubated
overnight at 4 oC on a rocking shaker with a primary antibody of choice. On the next
day the membrane was washed three times for 20 min with 1x PBS-T and
subsequently incubated for 1 hour at room temperature with the appropriate secondary
antibody (anti-rabbit IgG, horseradish peroxidase conjugate or anti-mouse IgG,
horseradish peroxidase conjugate, 1:10,000 dilution in 1x PBS-T; Amersham
Pharmacia, UK). Unbound secondary antibody was removed by washing the
membrane three times for 10 min with 1x PBS-T and two times for 10 min with 1x
PBS. The secondary antibody was detected by the enhanced chemiluminescence
procedure. The membrane was incubated for 1 min in a 1:1 mixture of ECL reagent A
(100 mM Tris/HCl pH = 8.3, 0.4 mM p-coumaric acid (90 mM stock solution in
DMSO), 2.5 mM luminol (250 mM stock solution in DMSO)) and ECL reagent B
(100 mM Tris/HCl pH = 8.3, 100 mM H2O2). The membrane was then enveloped into
an A4 reinforced pocket and exposed to an X-Ray film (SuperRX, X-Ray film, 100
NIF, 18x24 cm; Fuji medical, UK) for 1 sec to 10 min. The film was developed
according to the manufacturer’s instructions.
2.7.5 Assay for nucleoside triphosphatase activity
The nucleoside triphosphatase activity was measured according to the liberation of
phosphate from nucleoside triphosphates ATP, GTP, CTP and UTP (NTP).
Appropriate amount of the testing protein was preloaded to the reaction buffer (50
mM Tris-Acetate, 5 mM magnesium chloride, 1.5 mM β-mercaptoethanol), and the
mixture was heated to 55 °C (the optimal temperature for FtsH). Then, the reaction
was initiated by adding 0.5 mM NTP, and was terminated by adding 6 % perchloric
acid. Upon termination, malachite green solution (0.1 % (w/v) malachite green, 1.1 %
88
(w/v) ammonium molybdate, 1.5 % (w/v) Bismuth (III) citrate and 8.4 % (v/v)
concentrated HCl) was added to the reaction mixture at 1:1 ratio. After 3 to 15 min of
incubation, absorbance at 650 nm was measured. Four measurements were taken at 20,
40, 60 and 80 min. Serial diluted phosphate standards (0, 0.1, 0.4, 1.2, 3.7, 11.1, 33.3
and 100 µM of KH2PO4) were prepared and parallel treated for calibration.
2.7.6 Assay for proteolytic activity
The proteolytic activity of protease was examined using a fluorescence-based
quantitative casein degradation assay (EnzChek Protease Assay Kits (Invitrogen)).
Prior to the assay, the protease was firstly normalised to a concentration of 10 µg µl-1
,
and then diluted to a concentration of 40 µg ml-1
with the reaction buffer supplied in
the kit. To start the reaction, 100 µl of the reaction buffer containing protease was
mixed with equal volume of the casein substrate according to the manufacturer’s
instruction menu. 1 µl of 100 mM ATP was added to the reaction mixture, and plate
was immediately incubated at 55°C. Protease activity was determined by measuring
the fluorescence with the filter excitation/emission = 485/530. Fluorescence reading
was performed at 5 min, 30 min and 45 min.
2.7.7 Protein N-terminal sequencing
Purified protein samples (see section 2.7) were loaded on an SDS gel which was
prepared one day in advance, and run with the Tris-glycine running buffer (see section
2.7.3.1), which is supplemented with 2mM-mercaptoacetic acid in addition to prevent
N-terminal blockage. Consequently, separated proteins were transferred to PVDF
membrane via blotting (see section 2.7.4.2), with a specific transfer buffer (10mM
CAPS, 5mM DTT, 10 % Methanol, pH = 11). After blotting, the membrane was then
stained (0.1 % Coomassie Blue R in 50 % MeOH, 1 % acetic acid) for 5min and
destained in 50 % MeOH with several changes of 2-5min until the protein bands were
clearly visible. The membrane was then air-dried and stored at 4 oC. To determine the
89
N-terminal sequence, Edman degradation was performed on the protein band of
interest, and its sequence was analysed via ABI procise 494HT protein sequencer, this
service was provided by PNAC facility (Cambridge).
2.7.8 Confocal fluorescence microscopy
The cells to be investigated were immobilised by drying a droplet of cell culture on
the surface of a BG11 agar plate. A block of agar carrying cells was excised and
covered with a microscopic coverslip, with the cells reside between agar and glass.
Laser scanning confocal microscope (Leica TCS-S5) with a 63x immersion oil
objective (NA 1.4) was used to examine the localisation of the GFP tagged fusion
proteins. Samples were excited by 488nm argon laser (30% power) with confocal
pinhole set to give resolution in the z-direction of 1μm. Fluorescent emission of GFP
was selected with interference band pass filter at 502-512 nm. The fluorescence from
the chlorophyll a was detected by long pass filter in range 670-720 nm. All images
were recorded in 12-bit, with 512 x 512 pixels, scanned at 400 Hz and with line
average of n = 2. The two images of fluorescence from GFP and chlorophyll a were
then merged and smoothed for localisation analysis.
2.7.9 Single-particle analysis
Freshly isolated proteins samples were immediately applied to copper grids and
negatively stained with 2 % (w/v) uranyl acetate. The prepared samples were then
examined and analysed by Dr Jon Nield at Queen Mary University of London
according to the following procedure. The grids carrying protein samples were
examined using a Philips CM100 transmission electron microscope, operating at 80
kV and 350,850 magnification at room temperature. Micrographs were chosen for
minimal astigmatism/drift and scanned using a Nikon LS9000 densitometer. 3400
particles was compiled using “boxer” of the EMAN software package (Ludtke et al.,
2004). Further processing was performed using Imagic-5 (Image Science) at a
90
sampling frequency of 2.5 Å/pixel on the specimen scale. Reference-free alignment,
multivariate statistical analysis, and iterative refinement resulted in two-dimensional
class averages (Ruprecht and Nield, 2001). Eulerian angles were then assigned a
priori by angular reconstitution (Van Heel, 1987) and iterative refinements
implemented. The resolution of the final three-dimensional map, which comprised
263 class averages, merged from a broad range of relative orientation subpopulations
representing 2964 particles, was estimated conservatively (0.5 correlation coefficient)
by Fourier shell correlation (Van Heel and Schatz, 2005). Reprojections were taken
from the final three-dimensional model and used to identify atypical views and further
refine averages. Coordinate data sets were obtained from the Research Collaboratory
Structural Bioinformatics Data Bank (www.rcsb.org) for 3KDS.pdb (structure of the
cytosolic region of the Thermotoga maritima FtsH protease at 2.60 Å; Bieniossek et
al., 2009) and 1GTA.pdb (structure of GST at 2.4 Å; McTigue et al., 1995). Structures
were modeled into the final calculated three-dimensional map using PyMol (DeLano,
2008). Surfacerenderedviews are shown with a threshold of 2.5 s.
2.7.10 Protein identification via mass spectrometry analysis
Protein samples for mass spectrometry analysis were separated on SDS-PAGE and
stained with silver. The candidate protein band was excised with a clean scalpel from
the gel and transfer to a 1.5 ml centrifuge tube. Then the gel was destained in 15 mM
potassium hexacyanoferrate (III) and 50 mM sodium thiosulfate for 8 min. Then the
solution was removed and the colourless gel was stored at – 80 oC until departure. For
sequence identity analysis, the collected protein samples were shipped to Prof.
Michael Hippler, University of Münster, and analysed by co-workers using liquid
chromatography-mass spectrometry according to the following procedure. Upon
arrival, the protein gel band was digested with trypsin overnight. The tryptic peptides
were then diluted in 10 μl of buffer A (0.1% (v/v) formic acid in 5% (v/v) acetonitrile,
95% (v/v) water) and centrifuged for 5 min at 12,000 × g. The peptide containing
91
supernatant fraction was then used for Liquid Chromatography-Mass Spectrometry
analysis. The peptides were fractioned on an LC-Packings PepMap C18 column
(75-μm [inner diameter] by 150 mm) with a 3-μm particle size and a 100-Å-pore
diameter (NAN-75-15-03-PM) with the flow rate set at 250 nl/min. The column eluent
was monitored at 214 and 280 nm with a rapid-scanning spectrophotometer equipped
with a 3-nl flow cell (LC-Packings UZ-N10 160015). A LCQ Deca XP ion trap mass
spectrometer (Thermofinnigan, USA) was used for MS/MS analysis. The tolerance
for the selection of the MS-MS precursor ranged from 1.5 to 3.0 m/z (low to high m/z).
The resulting data were then evaluated by comparing to the Synechocystis data base
(cyanobase).
92
Chapter 3: FtsH complexes in Synechocystis,
composition, localisation and structure
3.1 Probing the composition of FtsH proteases
FtsH proteases have been found to form large membrane-anchored complexes in both
E. coli (see section 1.6.2) and in eukaryotic cells, where multiple FtsH-encoding
genes are present. In the latter case, FtsH complexes might contain multiple types of
FtsH isomers (see section 1.7). One of the major objectives of this work is to
determine the composition of each type of FtsH complex found in the cyanobacterium
Synechocystis 6803; hence a method for specifically isolating each of the target FtsH
homologues was required. Affinity chromatography is a method commonly employed
to isolate target proteins for in vitro characterisation; therefore, an affinity tag,
glutathione-S-transferase (GST), was fused to the C-terminus of each FtsH homologue
to enable isolation (see section 3.1.1). The resulting mutants were then selected for
segregation and their genotypes were analysed (see section 3.1.2). Affinity tagging is
a powerful tool to study protein architecture, however, it could potentially provide
misleading information should the tag perturb the properties of the target protein. In
fact, the C-terminal tagging applied in this work was based on the consideration that a
N-terminal fusion of GST tag might disrupt membrane insertion of FtsH. Disruption
of ftsH genes in Synechocystis leads to distinguishable growth defects, with the
exception of ftsH4 (see section 1.8), therefore, the phenotypes of the mutants
generated in this work were assessed by growth assays (see section 3.1.3). Then the
FtsH complexes were isolated from each mutant, the composition of which was
probed with antibodies specific to each homologue (see section 3.1.4). Moreover, the
N-termini of transmembrane proteins often carries a cleavable signalling peptide for
membrane specific targeting, in this work, the N-terminal sequence of each FtsH
homologue was analysed to examine the integrity of the mature proteins (see section
3.1.5).
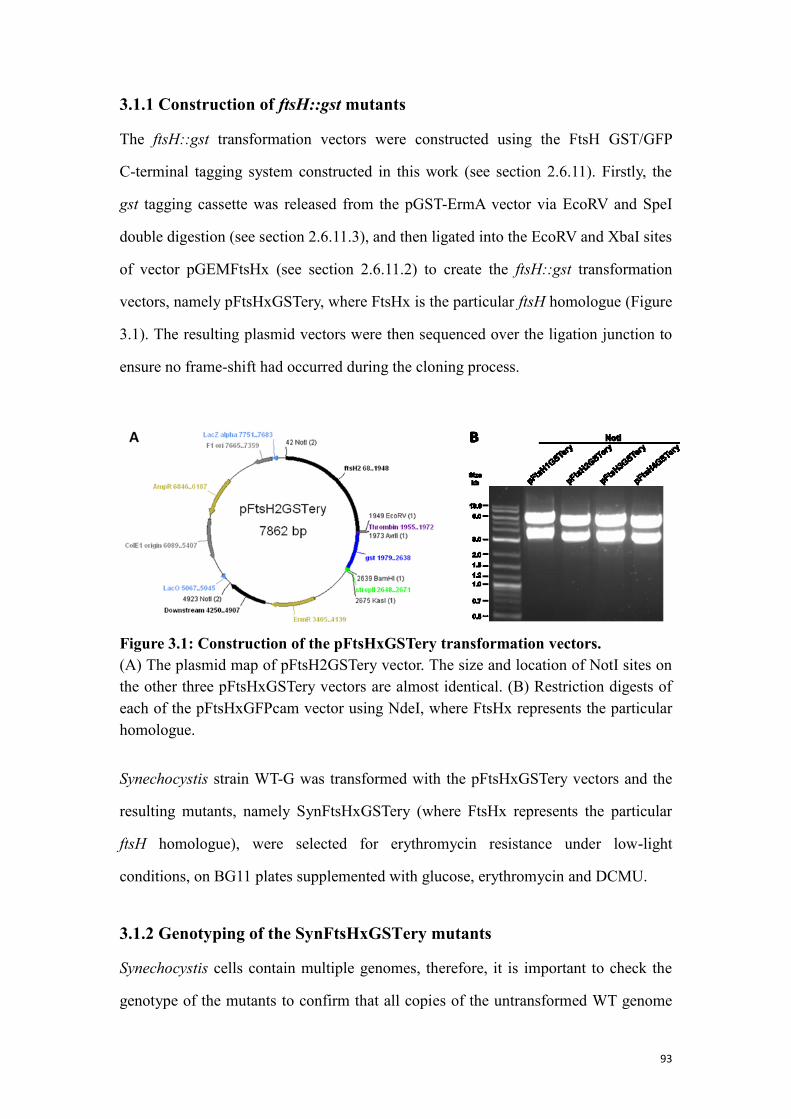
93
3.1.1 Construction of ftsH::gst mutants
The ftsH::gst transformation vectors were constructed using the FtsH GST/GFP
C-terminal tagging system constructed in this work (see section 2.6.11). Firstly, the
gst tagging cassette was released from the pGST-ErmA vector via EcoRV and SpeI
double digestion (see section 2.6.11.3), and then ligated into the EcoRV and XbaI sites
of vector pGEMFtsHx (see section 2.6.11.2) to create the ftsH::gst transformation
vectors, namely pFtsHxGSTery, where FtsHx is the particular ftsH homologue (Figure
3.1). The resulting plasmid vectors were then sequenced over the ligation junction to
ensure no frame-shift had occurred during the cloning process.
Figure 3.1: Construction of the pFtsHxGSTery transformation vectors.
(A) The plasmid map of pFtsH2GSTery vector. The size and location of NotI sites on
the other three pFtsHxGSTery vectors are almost identical. (B) Restriction digests of
each of the pFtsHxGFPcam vector using NdeI, where FtsHx represents the particular
homologue.
Synechocystis strain WT-G was transformed with the pFtsHxGSTery vectors and the
resulting mutants, namely SynFtsHxGSTery (where FtsHx represents the particular
ftsH homologue), were selected for erythromycin resistance under low-light
conditions, on BG11 plates supplemented with glucose, erythromycin and DCMU.
3.1.2 Genotyping of the SynFtsHxGSTery mutants
Synechocystis cells contain multiple genomes, therefore, it is important to check the
genotype of the mutants to confirm that all copies of the untransformed WT genome
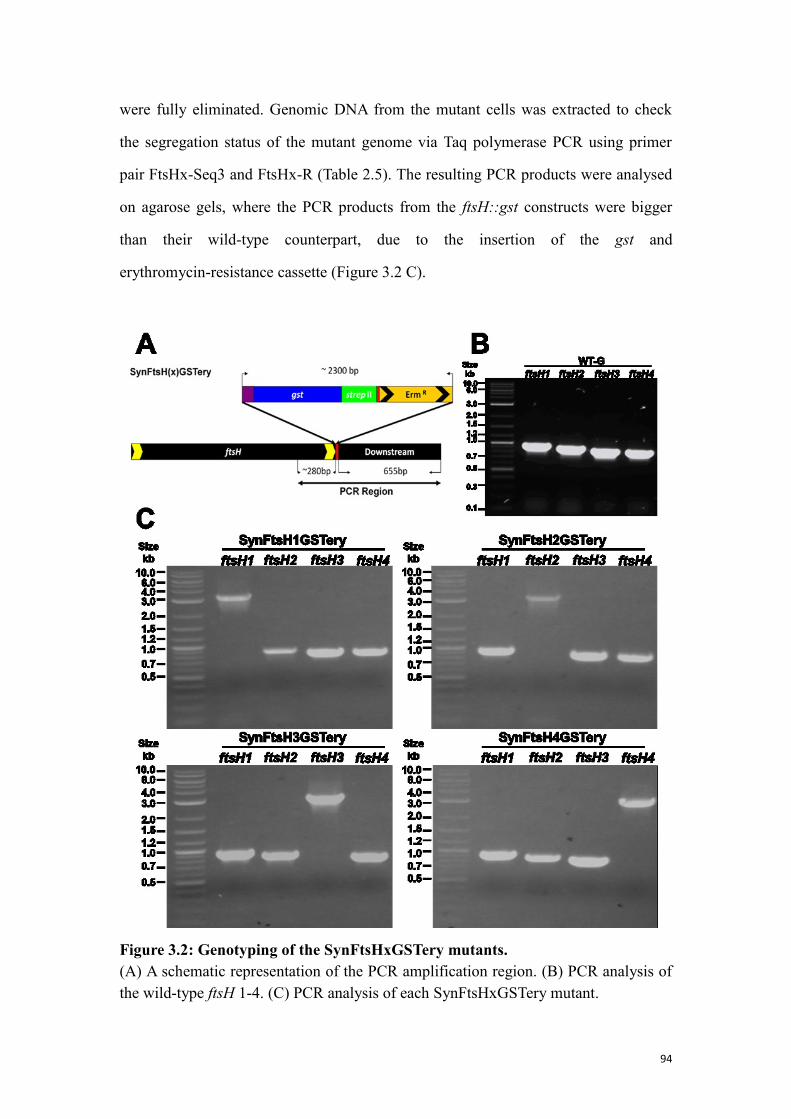
94
were fully eliminated. Genomic DNA from the mutant cells was extracted to check
the segregation status of the mutant genome via Taq polymerase PCR using primer
pair FtsHx-Seq3 and FtsHx-R (Table 2.5). The resulting PCR products were analysed
on agarose gels, where the PCR products from the ftsH::gst constructs were bigger
than their wild-type counterpart, due to the insertion of the gst and
erythromycin-resistance cassette (Figure 3.2 C).
Figure 3.2: Genotyping of the SynFtsHxGSTery mutants.
(A) A schematic representation of the PCR amplification region. (B) PCR analysis of
the wild-type ftsH 1-4. (C) PCR analysis of each SynFtsHxGSTery mutant.
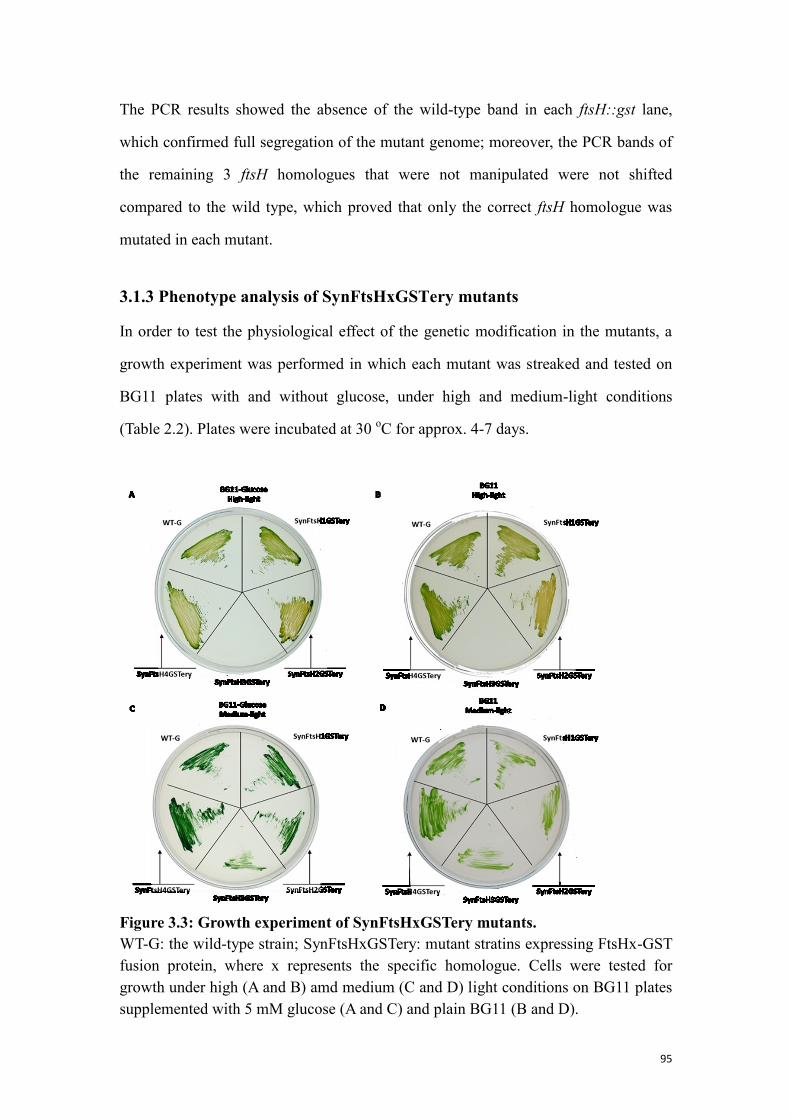
95
The PCR results showed the absence of the wild-type band in each ftsH::gst lane,
which confirmed full segregation of the mutant genome; moreover, the PCR bands of
the remaining 3 ftsH homologues that were not manipulated were not shifted
compared to the wild type, which proved that only the correct ftsH homologue was
mutated in each mutant.
3.1.3 Phenotype analysis of SynFtsHxGSTery mutants
In order to test the physiological effect of the genetic modification in the mutants, a
growth experiment was performed in which each mutant was streaked and tested on
BG11 plates with and without glucose, under high and medium-light conditions
(Table 2.2). Plates were incubated at 30 oC for approx. 4-7 days.
Figure 3.3: Growth experiment of SynFtsHxGSTery mutants.
WT-G: the wild-type strain; SynFtsHxGSTery: mutant stratins expressing FtsHx-GST
fusion protein, where x represents the specific homologue. Cells were tested for
growth under high (A and B) amd medium (C and D) light conditions on BG11 plates
supplemented with 5 mM glucose (A and C) and plain BG11 (B and D).
96
All mutants grew well under low (data not shown) and medium light conditions, but
under high light stress, SynFtsH3GSTery strain failed to grow. The results proved that
the FtsH1-GST and FtsH2-GST fusion proteins retained the major functions compared
to their wild-type counterpart. The SynFtsH3GSTery mutant was much more sensitive
to high light stress than any other gst tagged mutants, suggesting its function might
have been interfered with by the GST tag. On the other hand, cells cannot survive if
ftsH3 is disrupted (Mann et al. 2000); therefore, FtsH3-GST must have retained some
degree of activity which rescued the mutant from lethality. The growth experiment
could not provide clues about whether the function of FtsH4 was disrupted by the
C-terminal GST tag as functional disruption of FtsH4 yields no distinguishable
phenotype under these growth conditions (Mann et al. 2000).
3.1.4 Isolation of the GST-tagged FtsH complexes
To isolate the respective FtsH complexes, 1 L culture of each SynFtsHxGSTery
mutant was prepared for this experiment. The cells were harvested when the optical
density at 730 nm reached ~ 1.5, and cells broken for sequential purification steps.
Purified FtsH-GST samples were then concentrated and analysed on 10 % SDS-PAGE
gels, followed by immunoblotting with antibodies specific to GST, E. coli FtsH and
each FtsH homologue (Figure 3.4).
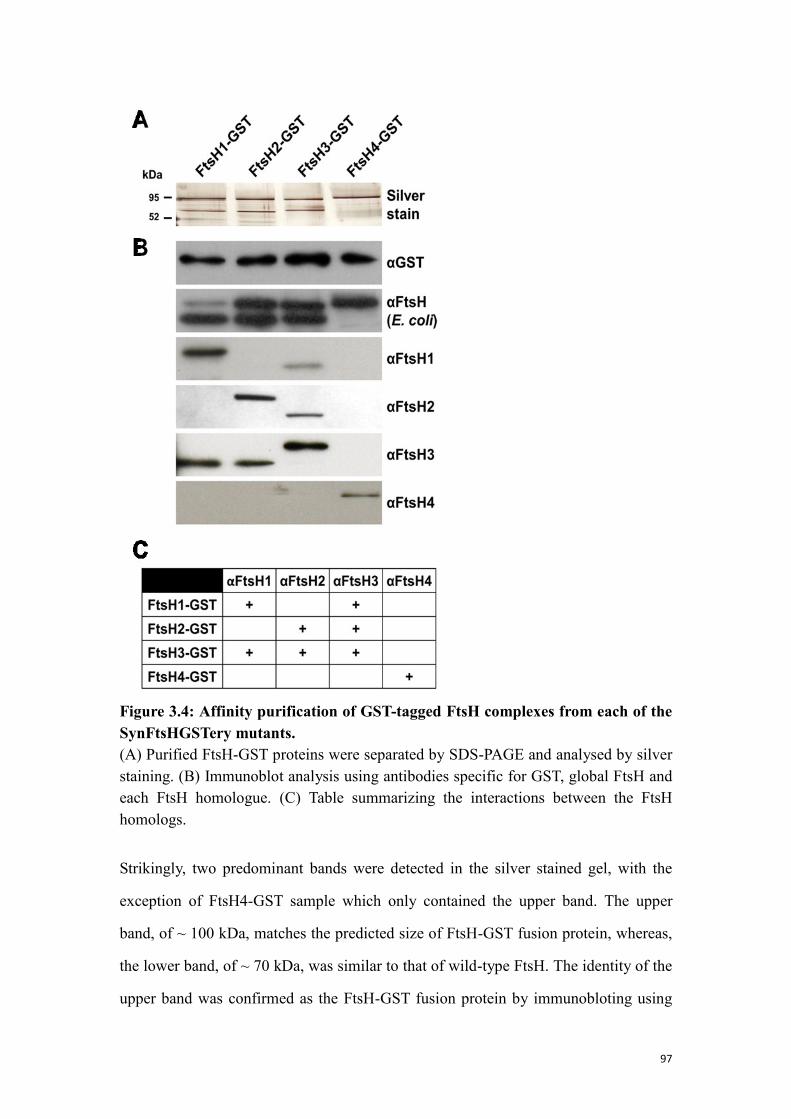
97
Figure 3.4: Affinity purification of GST-tagged FtsH complexes from each of the
SynFtsHGSTery mutants.
(A) Purified FtsH-GST proteins were separated by SDS-PAGE and analysed by silver
staining. (B) Immunoblot analysis using antibodies specific for GST, global FtsH and
each FtsH homologue. (C) Table summarizing the interactions between the FtsH
homologs.
Strikingly, two predominant bands were detected in the silver stained gel, with the
exception of FtsH4-GST sample which only contained the upper band. The upper
band, of ~ 100 kDa, matches the predicted size of FtsH-GST fusion protein, whereas,
the lower band, of ~ 70 kDa, was similar to that of wild-type FtsH. The identity of the
upper band was confirmed as the FtsH-GST fusion protein by immunobloting using
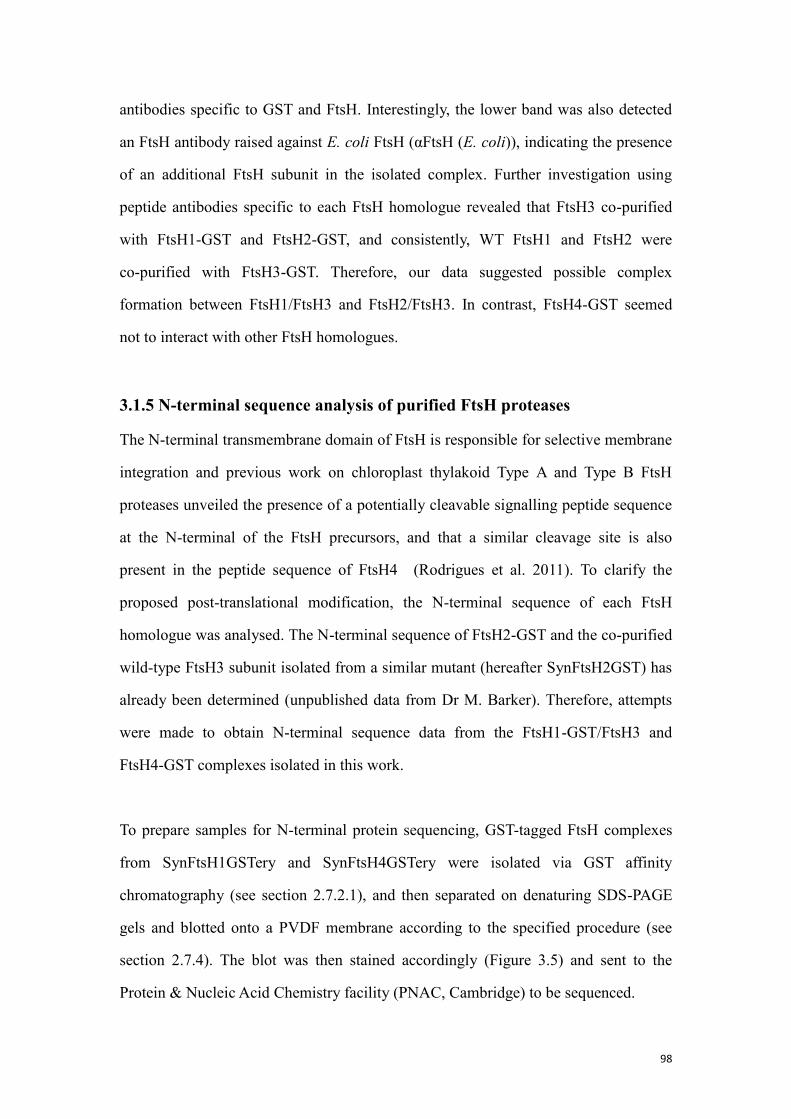
98
antibodies specific to GST and FtsH. Interestingly, the lower band was also detected
an FtsH antibody raised against E. coli FtsH (αFtsH (E. coli)), indicating the presence
of an additional FtsH subunit in the isolated complex. Further investigation using
peptide antibodies specific to each FtsH homologue revealed that FtsH3 co-purified
with FtsH1-GST and FtsH2-GST, and consistently, WT FtsH1 and FtsH2 were
co-purified with FtsH3-GST. Therefore, our data suggested possible complex
formation between FtsH1/FtsH3 and FtsH2/FtsH3. In contrast, FtsH4-GST seemed
not to interact with other FtsH homologues.
3.1.5 N-terminal sequence analysis of purified FtsH proteases
The N-terminal transmembrane domain of FtsH is responsible for selective membrane
integration and previous work on chloroplast thylakoid Type A and Type B FtsH
proteases unveiled the presence of a potentially cleavable signalling peptide sequence
at the N-terminal of the FtsH precursors, and that a similar cleavage site is also
present in the peptide sequence of FtsH4 (Rodrigues et al. 2011). To clarify the
proposed post-translational modification, the N-terminal sequence of each FtsH
homologue was analysed. The N-terminal sequence of FtsH2-GST and the co-purified
wild-type FtsH3 subunit isolated from a similar mutant (hereafter SynFtsH2GST) has
already been determined (unpublished data from Dr M. Barker). Therefore, attempts
were made to obtain N-terminal sequence data from the FtsH1-GST/FtsH3 and
FtsH4-GST complexes isolated in this work.
To prepare samples for N-terminal protein sequencing, GST-tagged FtsH complexes
from SynFtsH1GSTery and SynFtsH4GSTery were isolated via GST affinity
chromatography (see section 2.7.2.1), and then separated on denaturing SDS-PAGE
gels and blotted onto a PVDF membrane according to the specified procedure (see
section 2.7.4). The blot was then stained accordingly (Figure 3.5) and sent to the
Protein & Nucleic Acid Chemistry facility (PNAC, Cambridge) to be sequenced.
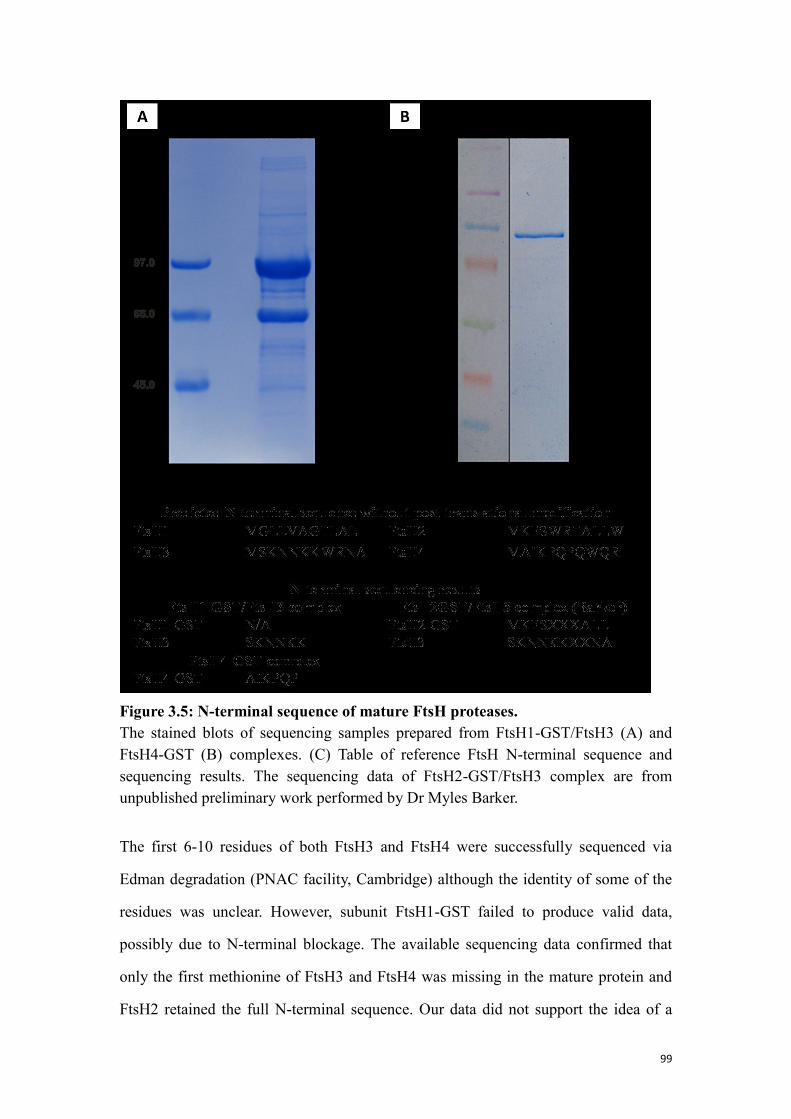
99
Figure 3.5: N-terminal sequence of mature FtsH proteases.
The stained blots of sequencing samples prepared from FtsH1-GST/FtsH3 (A) and
FtsH4-GST (B) complexes. (C) Table of reference FtsH N-terminal sequence and
sequencing results. The sequencing data of FtsH2-GST/FtsH3 complex are from
unpublished preliminary work performed by Dr Myles Barker.
The first 6-10 residues of both FtsH3 and FtsH4 were successfully sequenced via
Edman degradation (PNAC facility, Cambridge) although the identity of some of the
residues was unclear. However, subunit FtsH1-GST failed to produce valid data,
possibly due to N-terminal blockage. The available sequencing data confirmed that
only the first methionine of FtsH3 and FtsH4 was missing in the mature protein and
FtsH2 retained the full N-terminal sequence. Our data did not support the idea of a
100
post-translational removal of a signal peptide in the N-terminal region of
Synechocystis FtsH. Moreover, the N-terminal sequences of FtsH3 co-purified with
FtsH1-GST and FtsH2-GST were identical. Taking into account that FtsH1 and FtsH2
are separate complexes, the FtsH3 in both complexes seemed to be the same.
3.2 Probing the localisation of FtsH complexes
As membrane-anchored proteases, FtsH complexes are associated with proteolysis of
membrane protein substrates. Therefore, probing the localisation of FtsH is an
important step towards understanding the function of the proteases. Confocal
fluorescence microscopy is one of the commonly used techniques to study the
localisation of proteins in situ. In order to track the fluorescence signal of FtsH
complexes, mutants expressing a C-terminal GFP-tagged FtsH homologue were
analysed by fluorescence microscopy, in collaboration with Prof Conrad Mullineaux.
In this section, the mutagenesis (see section 3.2.1), characterisation of mutants (see
section 3.2.2-3.2.4) and localisation of each FtsH-GFP homologue (see section 3.2.5)
are described. In addition to fluorescence microscopy, an independent approach to
study the localisation of FtsH homologues in the wild-type strain by biochemical
fractionation is also described (see section 3.2.6).
3.2.1 Construction of ftsH::gfp mutants
Benefitting from the GST/GFP C-terminal tagging system (see section 2.6.11), the
ftsH::gfp transformation vectors were constructed by a simple one-step cloning.
Firstly, the gfp tagging cassette was released from the pGFP-CamA vector via EcoRV
and SpeI double digestion (see section 2.6.11.4), and then ligated into the EcoRV and
XbaI sites of vector pGEMFtsHx (see section 2.6.11.2) to create the ftsH::gfp
transformation vectors, namely pFtsHxGFPcam, where FtsHx is the particular ftsH
homologue (Figure 3.6). The resulting plasmid vectors were then sequenced over the
ligation junction to ensure no frame-shift occurred during the cloning process.
101
Figure 3.6: Construction of the pFtsHxGFPcam transformation vectors.
(A) The plasmid map of pFtsH2GFPcam vector. This vector contains an additional
NdeI at the beginning of the ftsH2 ORF comparing to the other three vectors. (B)
Restriction digests of each of the pFtsHxGFPcam vector using NdeI, where FtsHx
represents the particular homologue.
Wild-type Synechocystis strain WT-G was transformed with the pFtsHxGFPcam
vectors and the resulting mutants, namely SynFtsHxGFPcam (where FtsHx represents
the particular ftsH homologue), were selected for chloramphenicol resistance under
low-light, on BG11 plates supplemented with glucose, chloramphenicol and DCMU.
3.2.2 Genotyping of the SynFtsHxGFPcam mutants
Genomic DNA from the mutant cells was extracted to check the mutant genome
segregation status via Taq polymerase PCR using primer pair FtsHx-Seq3 and
FtsHx-R (Table 2.5). The resulting PCR products were analysed on agarose gels,
where the PCR products from the ftsH::gfp constructs were separated from the
wild-type due to the integration of the gfp sequence and chloramphenicol resistance
cassette (Figure 3.7).
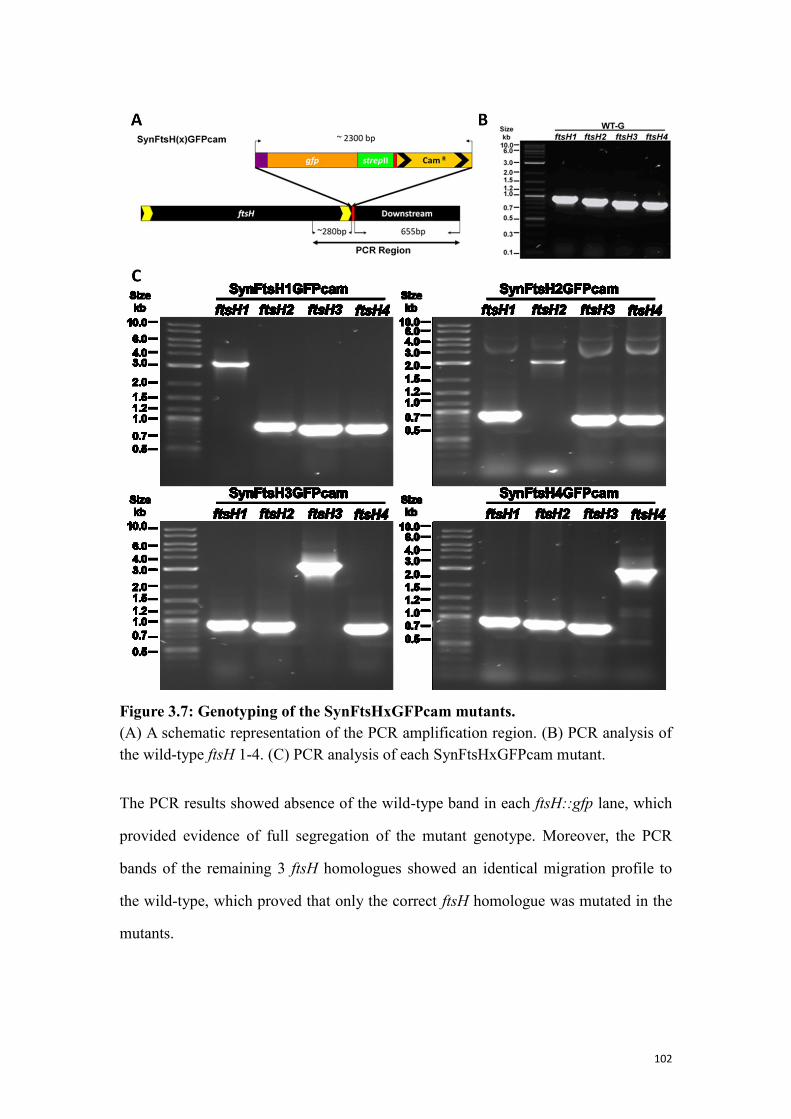
102
Figure 3.7: Genotyping of the SynFtsHxGFPcam mutants.
(A) A schematic representation of the PCR amplification region. (B) PCR analysis of
the wild-type ftsH 1-4. (C) PCR analysis of each SynFtsHxGFPcam mutant.
The PCR results showed absence of the wild-type band in each ftsH::gfp lane, which
provided evidence of full segregation of the mutant genotype. Moreover, the PCR
bands of the remaining 3 ftsH homologues showed an identical migration profile to
the wild-type, which proved that only the correct ftsH homologue was mutated in the
mutants.
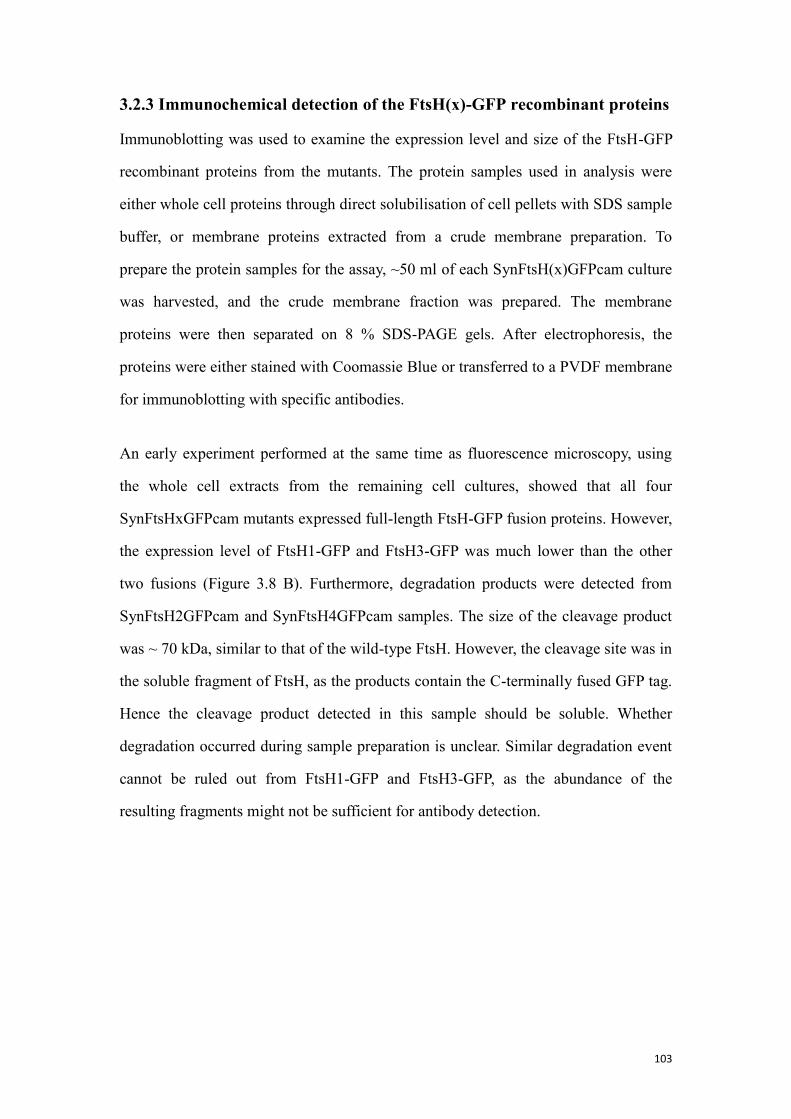
103
3.2.3 Immunochemical detection of the FtsH(x)-GFP recombinant proteins
Immunoblotting was used to examine the expression level and size of the FtsH-GFP
recombinant proteins from the mutants. The protein samples used in analysis were
either whole cell proteins through direct solubilisation of cell pellets with SDS sample
buffer, or membrane proteins extracted from a crude membrane preparation. To
prepare the protein samples for the assay, ~50 ml of each SynFtsH(x)GFPcam culture
was harvested, and the crude membrane fraction was prepared. The membrane
proteins were then separated on 8 % SDS-PAGE gels. After electrophoresis, the
proteins were either stained with Coomassie Blue or transferred to a PVDF membrane
for immunoblotting with specific antibodies.
An early experiment performed at the same time as fluorescence microscopy, using
the whole cell extracts from the remaining cell cultures, showed that all four
SynFtsHxGFPcam mutants expressed full-length FtsH-GFP fusion proteins. However,
the expression level of FtsH1-GFP and FtsH3-GFP was much lower than the other
two fusions (Figure 3.8 B). Furthermore, degradation products were detected from
SynFtsH2GFPcam and SynFtsH4GFPcam samples. The size of the cleavage product
was ~ 70 kDa, similar to that of the wild-type FtsH. However, the cleavage site was in
the soluble fragment of FtsH, as the products contain the C-terminally fused GFP tag.
Hence the cleavage product detected in this sample should be soluble. Whether
degradation occurred during sample preparation is unclear. Similar degradation event
cannot be ruled out from FtsH1-GFP and FtsH3-GFP, as the abundance of the
resulting fragments might not be sufficient for antibody detection.
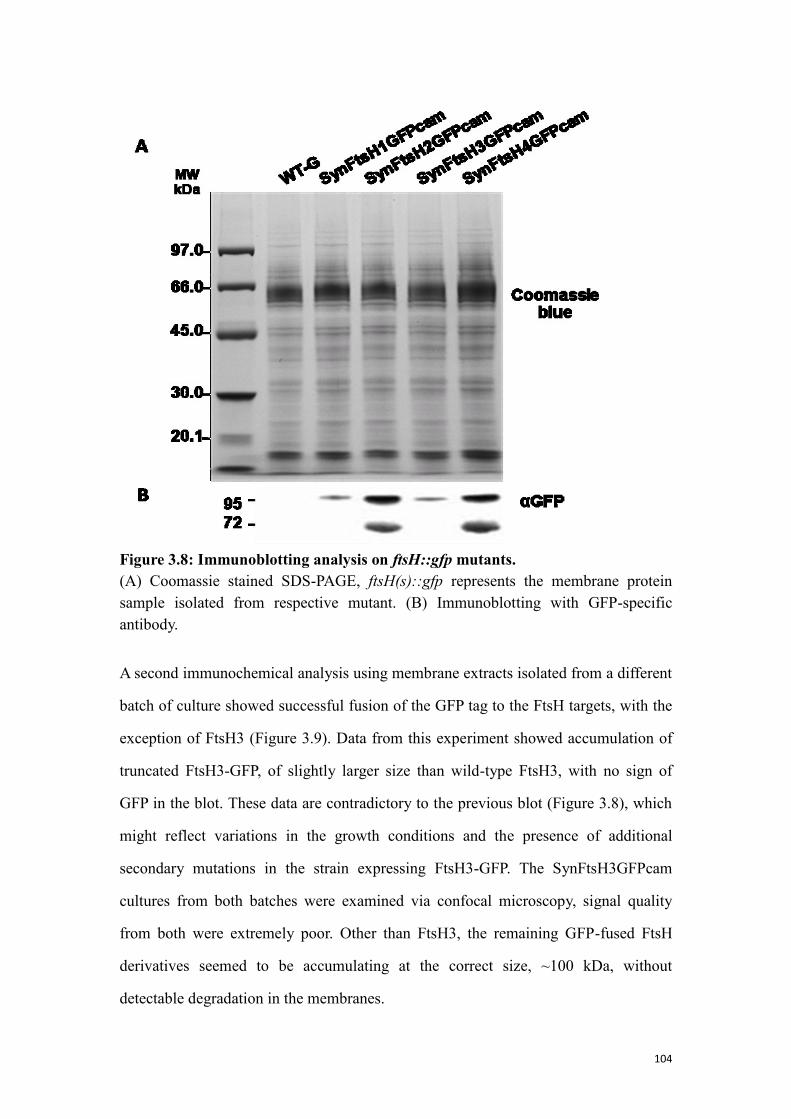
104
Figure 3.8: Immunoblotting analysis on ftsH::gfp mutants.
(A) Coomassie stained SDS-PAGE, ftsH(s)::gfp represents the membrane protein
sample isolated from respective mutant. (B) Immunoblotting with GFP-specific
antibody.
A second immunochemical analysis using membrane extracts isolated from a different
batch of culture showed successful fusion of the GFP tag to the FtsH targets, with the
exception of FtsH3 (Figure 3.9). Data from this experiment showed accumulation of
truncated FtsH3-GFP, of slightly larger size than wild-type FtsH3, with no sign of
GFP in the blot. These data are contradictory to the previous blot (Figure 3.8), which
might reflect variations in the growth conditions and the presence of additional
secondary mutations in the strain expressing FtsH3-GFP. The SynFtsH3GFPcam
cultures from both batches were examined via confocal microscopy, signal quality
from both were extremely poor. Other than FtsH3, the remaining GFP-fused FtsH
derivatives seemed to be accumulating at the correct size, ~100 kDa, without
detectable degradation in the membranes.
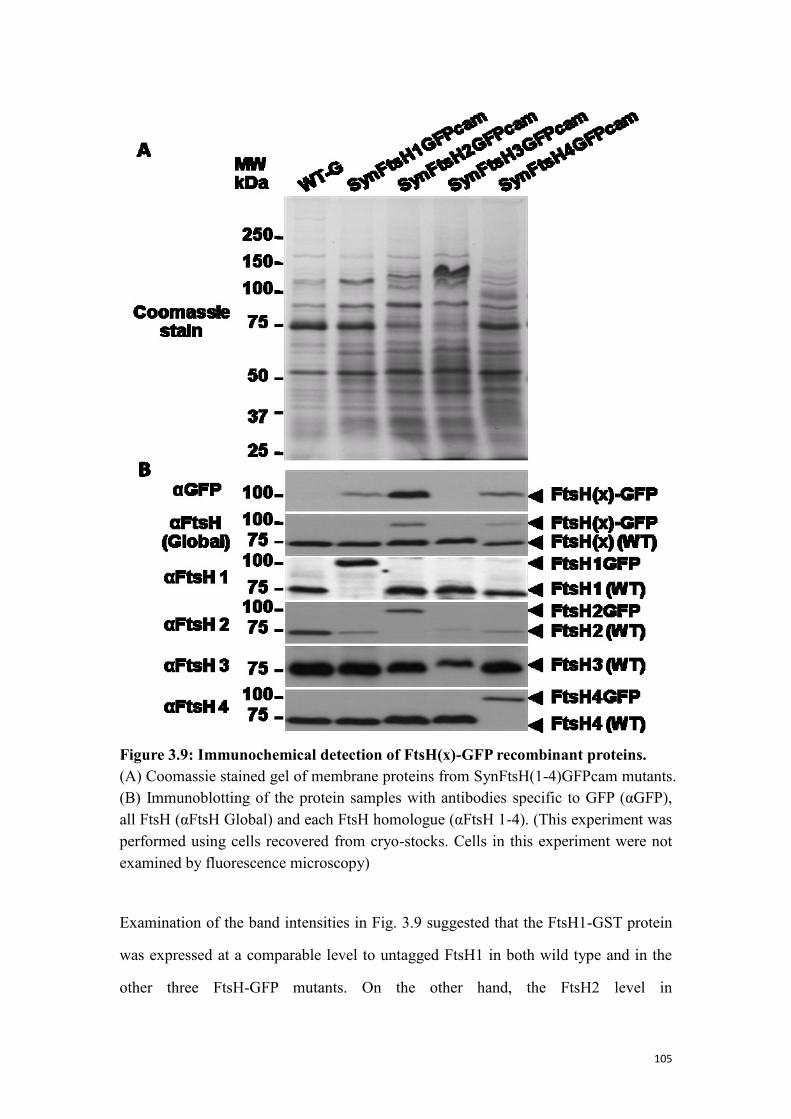
105
Figure 3.9: Immunochemical detection of FtsH(x)-GFP recombinant proteins.
(A) Coomassie stained gel of membrane proteins from SynFtsH(1-4)GFPcam mutants.
(B) Immunoblotting of the protein samples with antibodies specific to GFP (αGFP),
all FtsH (αFtsH Global) and each FtsH homologue (αFtsH 1-4). (This experiment was
performed using cells recovered from cryo-stocks. Cells in this experiment were not
examined by fluorescence microscopy)
Examination of the band intensities in Fig. 3.9 suggested that the FtsH1-GST protein
was expressed at a comparable level to untagged FtsH1 in both wild type and in the
other three FtsH-GFP mutants. On the other hand, the FtsH2 level in
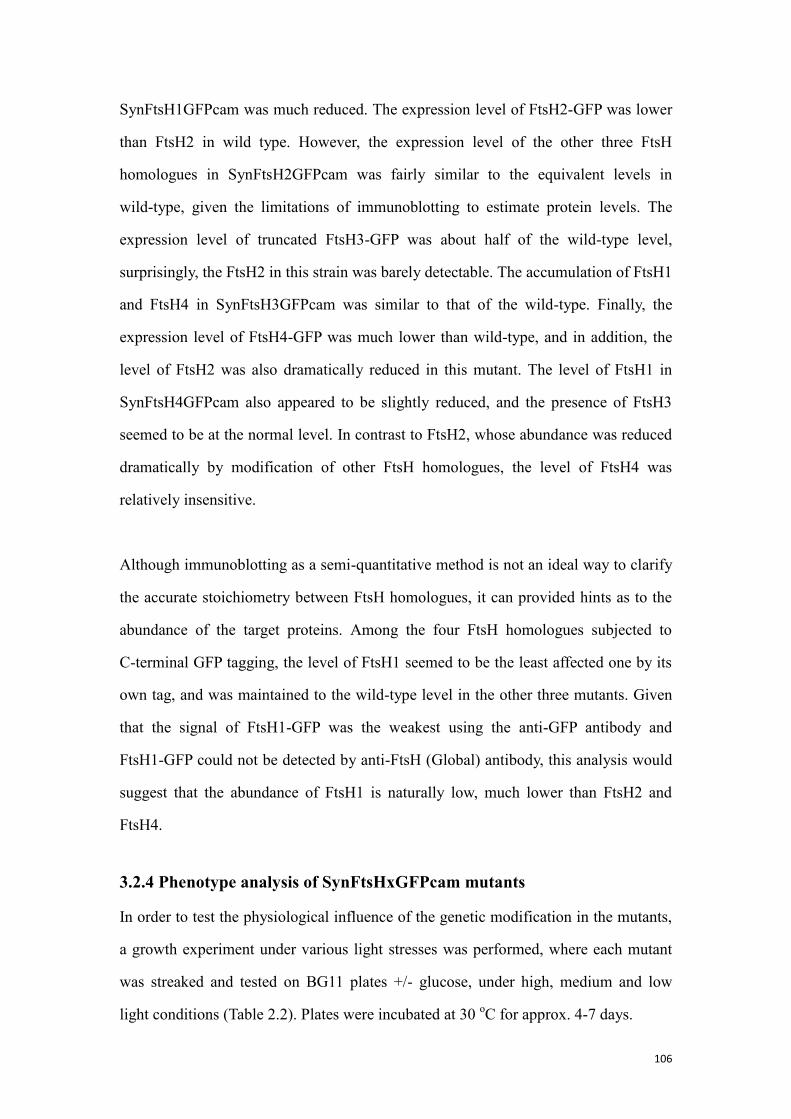
106
SynFtsH1GFPcam was much reduced. The expression level of FtsH2-GFP was lower
than FtsH2 in wild type. However, the expression level of the other three FtsH
homologues in SynFtsH2GFPcam was fairly similar to the equivalent levels in
wild-type, given the limitations of immunoblotting to estimate protein levels. The
expression level of truncated FtsH3-GFP was about half of the wild-type level,
surprisingly, the FtsH2 in this strain was barely detectable. The accumulation of FtsH1
and FtsH4 in SynFtsH3GFPcam was similar to that of the wild-type. Finally, the
expression level of FtsH4-GFP was much lower than wild-type, and in addition, the
level of FtsH2 was also dramatically reduced in this mutant. The level of FtsH1 in
SynFtsH4GFPcam also appeared to be slightly reduced, and the presence of FtsH3
seemed to be at the normal level. In contrast to FtsH2, whose abundance was reduced
dramatically by modification of other FtsH homologues, the level of FtsH4 was
relatively insensitive.
Although immunoblotting as a semi-quantitative method is not an ideal way to clarify
the accurate stoichiometry between FtsH homologues, it can provided hints as to the
abundance of the target proteins. Among the four FtsH homologues subjected to
C-terminal GFP tagging, the level of FtsH1 seemed to be the least affected one by its
own tag, and was maintained to the wild-type level in the other three mutants. Given
that the signal of FtsH1-GFP was the weakest using the anti-GFP antibody and
FtsH1-GFP could not be detected by anti-FtsH (Global) antibody, this analysis would
suggest that the abundance of FtsH1 is naturally low, much lower than FtsH2 and
FtsH4.
3.2.4 Phenotype analysis of SynFtsHxGFPcam mutants
In order to test the physiological influence of the genetic modification in the mutants,
a growth experiment under various light stresses was performed, where each mutant
was streaked and tested on BG11 plates +/- glucose, under high, medium and low
light conditions (Table 2.2). Plates were incubated at 30 oC for approx. 4-7 days.
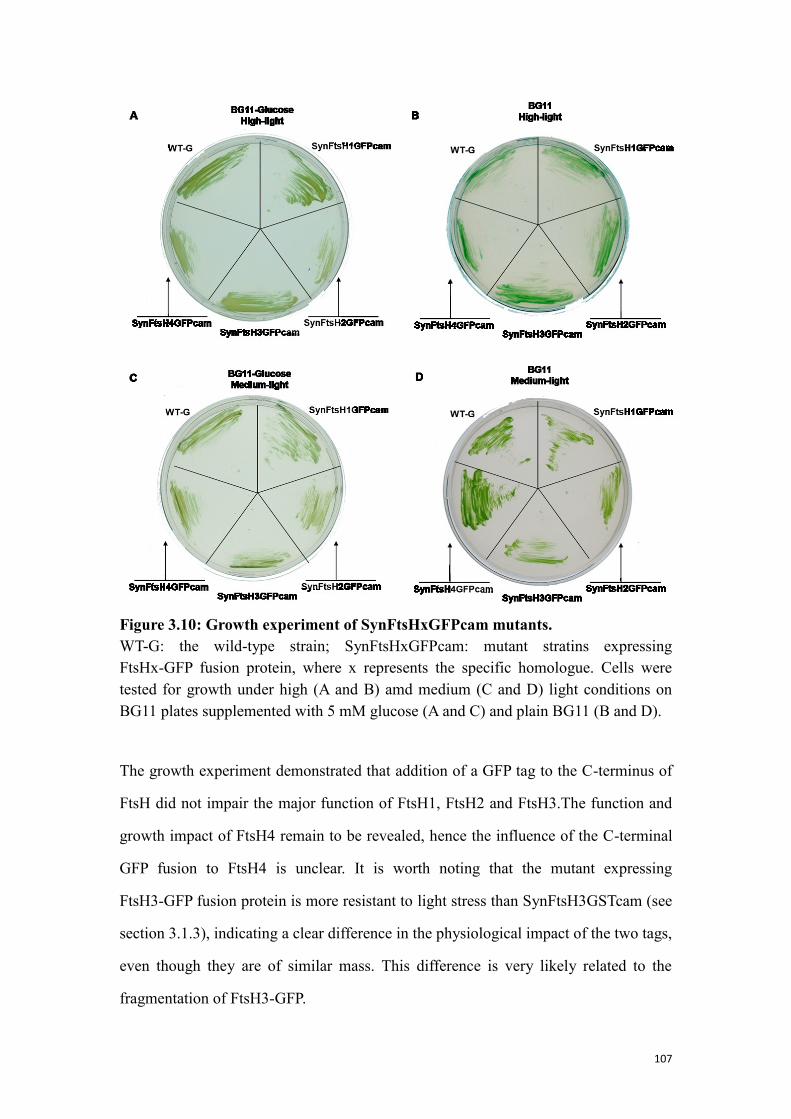
107
Figure 3.10: Growth experiment of SynFtsHxGFPcam mutants.
WT-G: the wild-type strain; SynFtsHxGFPcam: mutant stratins expressing
FtsHx-GFP fusion protein, where x represents the specific homologue. Cells were
tested for growth under high (A and B) amd medium (C and D) light conditions on
BG11 plates supplemented with 5 mM glucose (A and C) and plain BG11 (B and D).
The growth experiment demonstrated that addition of a GFP tag to the C-terminus of
FtsH did not impair the major function of FtsH1, FtsH2 and FtsH3.The function and
growth impact of FtsH4 remain to be revealed, hence the influence of the C-terminal
GFP fusion to FtsH4 is unclear. It is worth noting that the mutant expressing
FtsH3-GFP fusion protein is more resistant to light stress than SynFtsH3GSTcam (see
section 3.1.3), indicating a clear difference in the physiological impact of the two tags,
even though they are of similar mass. This difference is very likely related to the
fragmentation of FtsH3-GFP.
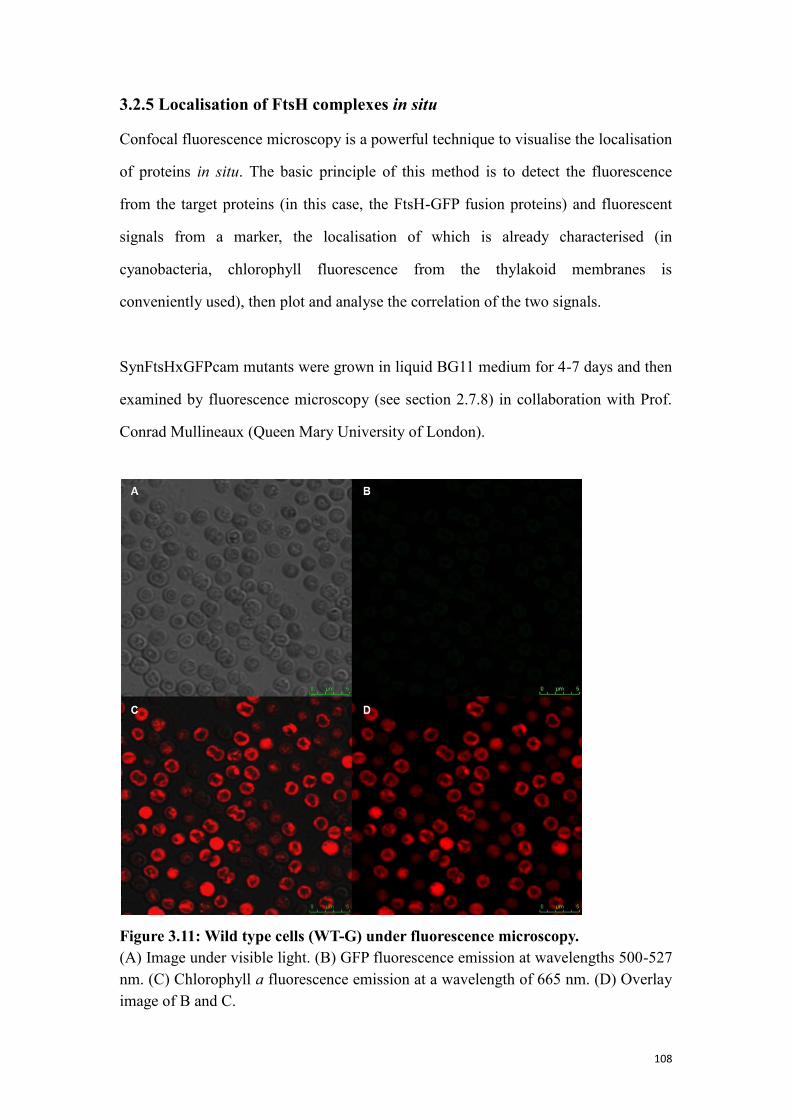
108
3.2.5 Localisation of FtsH complexes in situ
Confocal fluorescence microscopy is a powerful technique to visualise the localisation
of proteins in situ. The basic principle of this method is to detect the fluorescence
from the target proteins (in this case, the FtsH-GFP fusion proteins) and fluorescent
signals from a marker, the localisation of which is already characterised (in
cyanobacteria, chlorophyll fluorescence from the thylakoid membranes is
conveniently used), then plot and analyse the correlation of the two signals.
SynFtsHxGFPcam mutants were grown in liquid BG11 medium for 4-7 days and then
examined by fluorescence microscopy (see section 2.7.8) in collaboration with Prof.
Conrad Mullineaux (Queen Mary University of London).
Figure 3.11: Wild type cells (WT-G) under fluorescence microscopy.
(A) Image under visible light. (B) GFP fluorescence emission at wavelengths 500-527
nm. (C) Chlorophyll a fluorescence emission at a wavelength of 665 nm. (D) Overlay
image of B and C.
109
The WT-G cells were screened as the background control. Under the microscope,
Synechocystis cells showed a “blood cell” appearance, as the fluorescence of
chlorophyll marks the boundary of thylakoid membranes and the cytoplasmic
membranes localised around the outer surface of the thylakoid membranes were not
visible in the scanning channels. Although some green signals unrelated to GFP were
detected during the imaging, the gain was adjusted so that the signal did not show in
the final image (Figure 3.11 D). Further analysis of the SynFtsHxGFPcam mutants
were carried out under the same condition, and GFP signals were detected in all four
mutants, however, the accumulation level of FtsH2-GFP and FtsH4-GFP was much
higher than that of FtsH1-GFP and FtsH3-GFP (Figure 3.12).
Figure 3.12: ftsH::gfp mutants under fluorescence microscopy.
Cells of SynFtsH1GFPcam (A); SynFtsH2GFPcam (B); SynFtsH3GFPcam (C) and
SynFtsH4GFPcam (D) were imaged and presented in the figure. White scale bar = 2
µm. All images are the results of green (500-527 nm) and red (665 nm) channel
overlay.
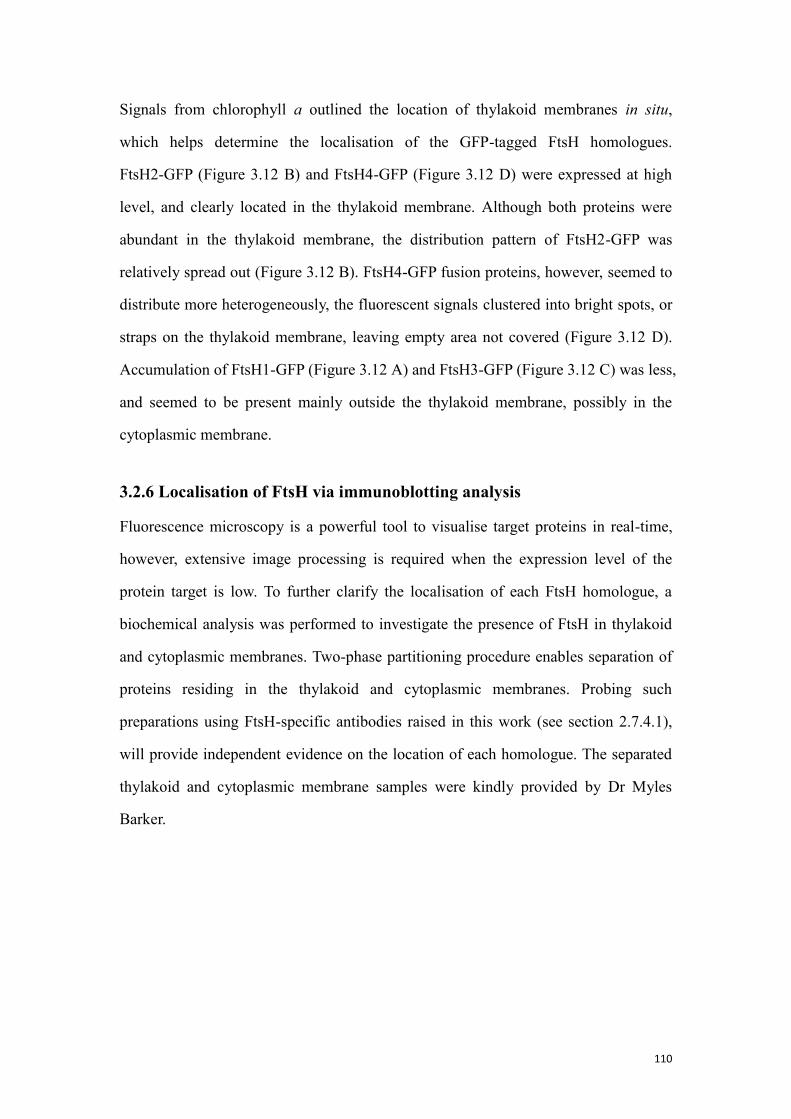
110
Signals from chlorophyll a outlined the location of thylakoid membranes in situ,
which helps determine the localisation of the GFP-tagged FtsH homologues.
FtsH2-GFP (Figure 3.12 B) and FtsH4-GFP (Figure 3.12 D) were expressed at high
level, and clearly located in the thylakoid membrane. Although both proteins were
abundant in the thylakoid membrane, the distribution pattern of FtsH2-GFP was
relatively spread out (Figure 3.12 B). FtsH4-GFP fusion proteins, however, seemed to
distribute more heterogeneously, the fluorescent signals clustered into bright spots, or
straps on the thylakoid membrane, leaving empty area not covered (Figure 3.12 D).
Accumulation of FtsH1-GFP (Figure 3.12 A) and FtsH3-GFP (Figure 3.12 C) was less,
and seemed to be present mainly outside the thylakoid membrane, possibly in the
cytoplasmic membrane.
3.2.6 Localisation of FtsH via immunoblotting analysis
Fluorescence microscopy is a powerful tool to visualise target proteins in real-time,
however, extensive image processing is required when the expression level of the
protein target is low. To further clarify the localisation of each FtsH homologue, a
biochemical analysis was performed to investigate the presence of FtsH in thylakoid
and cytoplasmic membranes. Two-phase partitioning procedure enables separation of
proteins residing in the thylakoid and cytoplasmic membranes. Probing such
preparations using FtsH-specific antibodies raised in this work (see section 2.7.4.1),
will provide independent evidence on the location of each homologue. The separated
thylakoid and cytoplasmic membrane samples were kindly provided by Dr Myles
Barker.
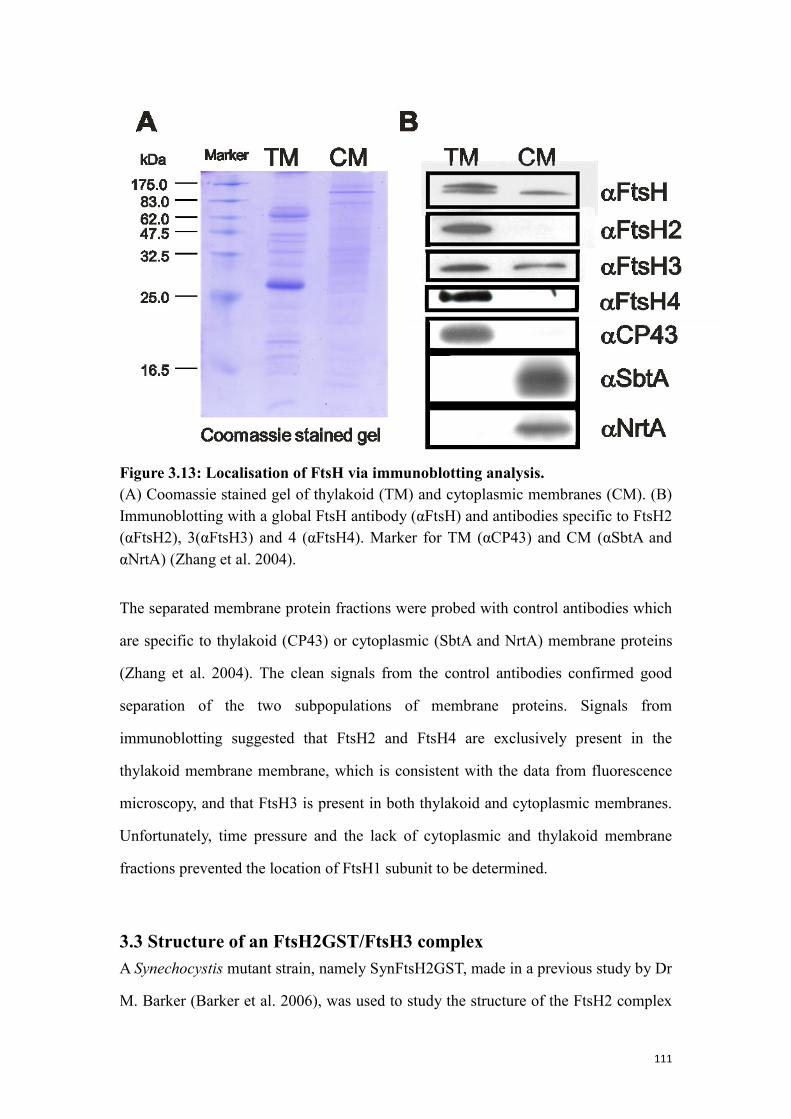
111
Figure 3.13: Localisation of FtsH via immunoblotting analysis.
(A) Coomassie stained gel of thylakoid (TM) and cytoplasmic membranes (CM). (B)
Immunoblotting with a global FtsH antibody (αFtsH) and antibodies specific to FtsH2
(αFtsH2), 3(αFtsH3) and 4 (αFtsH4). Marker for TM (αCP43) and CM (αSbtA and
αNrtA) (Zhang et al. 2004).
The separated membrane protein fractions were probed with control antibodies which
are specific to thylakoid (CP43) or cytoplasmic (SbtA and NrtA) membrane proteins
(Zhang et al. 2004). The clean signals from the control antibodies confirmed good
separation of the two subpopulations of membrane proteins. Signals from
immunoblotting suggested that FtsH2 and FtsH4 are exclusively present in the
thylakoid membrane membrane, which is consistent with the data from fluorescence
microscopy, and that FtsH3 is present in both thylakoid and cytoplasmic membranes.
Unfortunately, time pressure and the lack of cytoplasmic and thylakoid membrane
fractions prevented the location of FtsH1 subunit to be determined.
3.3 Structure of an FtsH2GST/FtsH3 complex
A Synechocystis mutant strain, namely SynFtsH2GST, made in a previous study by Dr
M. Barker (Barker et al. 2006), was used to study the structure of the FtsH2 complex
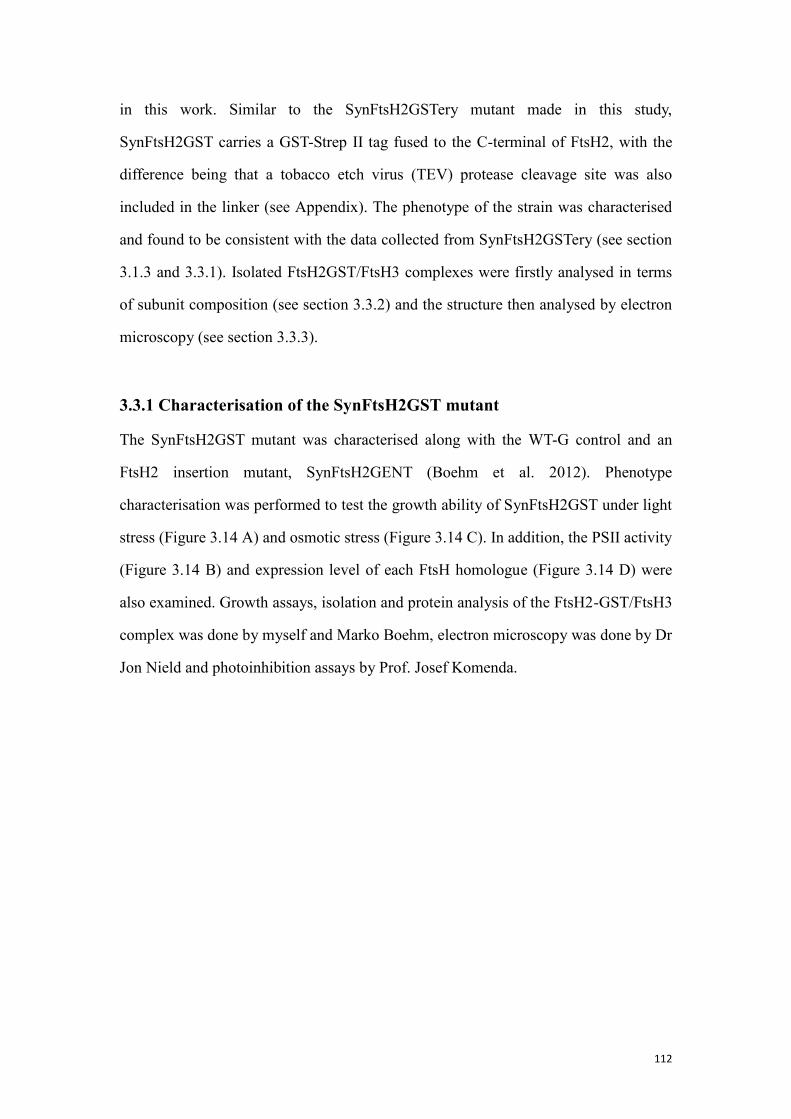
112
in this work. Similar to the SynFtsH2GSTery mutant made in this study,
SynFtsH2GST carries a GST-Strep II tag fused to the C-terminal of FtsH2, with the
difference being that a tobacco etch virus (TEV) protease cleavage site was also
included in the linker (see Appendix). The phenotype of the strain was characterised
and found to be consistent with the data collected from SynFtsH2GSTery (see section
3.1.3 and 3.3.1). Isolated FtsH2GST/FtsH3 complexes were firstly analysed in terms
of subunit composition (see section 3.3.2) and the structure then analysed by electron
microscopy (see section 3.3.3).
3.3.1 Characterisation of the SynFtsH2GST mutant
The SynFtsH2GST mutant was characterised along with the WT-G control and an
FtsH2 insertion mutant, SynFtsH2GENT (Boehm et al. 2012). Phenotype
characterisation was performed to test the growth ability of SynFtsH2GST under light
stress (Figure 3.14 A) and osmotic stress (Figure 3.14 C). In addition, the PSII activity
(Figure 3.14 B) and expression level of each FtsH homologue (Figure 3.14 D) were
also examined. Growth assays, isolation and protein analysis of the FtsH2-GST/FtsH3
complex was done by myself and Marko Boehm, electron microscopy was done by Dr
Jon Nield and photoinhibition assays by Prof. Josef Komenda.
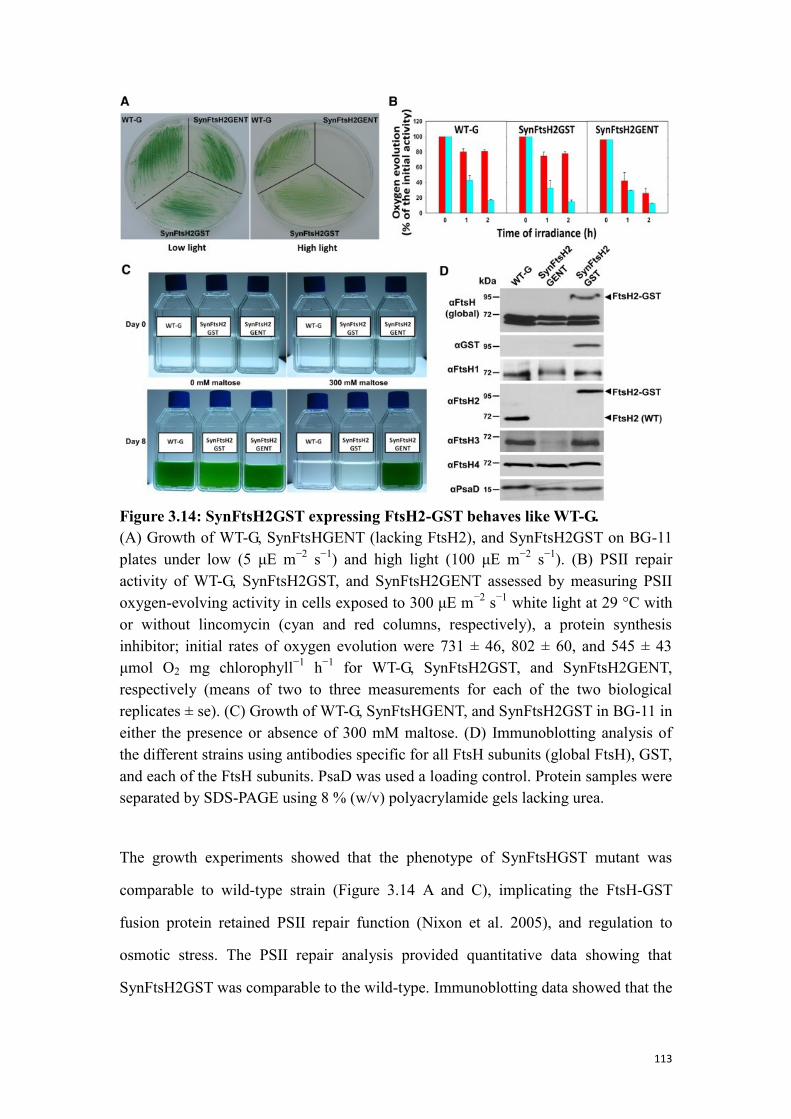
113
Figure 3.14: SynFtsH2GST expressing FtsH2-GST behaves like WT-G.
(A) Growth of WT-G, SynFtsHGENT (lacking FtsH2), and SynFtsH2GST on BG-11
plates under low (5 μE m−2
s−1
) and high light (100 μE m−2
s−1
). (B) PSII repair
activity of WT-G, SynFtsH2GST, and SynFtsH2GENT assessed by measuring PSII
oxygen-evolving activity in cells exposed to 300 μE m−2
s−1
white light at 29 °C with
or without lincomycin (cyan and red columns, respectively), a protein synthesis
inhibitor; initial rates of oxygen evolution were 731 ± 46, 802 ± 60, and 545 ± 43
μmol O2 mg chlorophyll−1
h−1
for WT-G, SynFtsH2GST, and SynFtsH2GENT,
respectively (means of two to three measurements for each of the two biological
replicates ± se). (C) Growth of WT-G, SynFtsHGENT, and SynFtsH2GST in BG-11 in
either the presence or absence of 300 mM maltose. (D) Immunoblotting analysis of
the different strains using antibodies specific for all FtsH subunits (global FtsH), GST,
and each of the FtsH subunits. PsaD was used a loading control. Protein samples were
separated by SDS-PAGE using 8 % (w/v) polyacrylamide gels lacking urea.
The growth experiments showed that the phenotype of SynFtsHGST mutant was
comparable to wild-type strain (Figure 3.14 A and C), implicating the FtsH-GST
fusion protein retained PSII repair function (Nixon et al. 2005), and regulation to
osmotic stress. The PSII repair analysis provided quantitative data showing that
SynFtsH2GST was comparable to the wild-type. Immunoblotting data showed that the
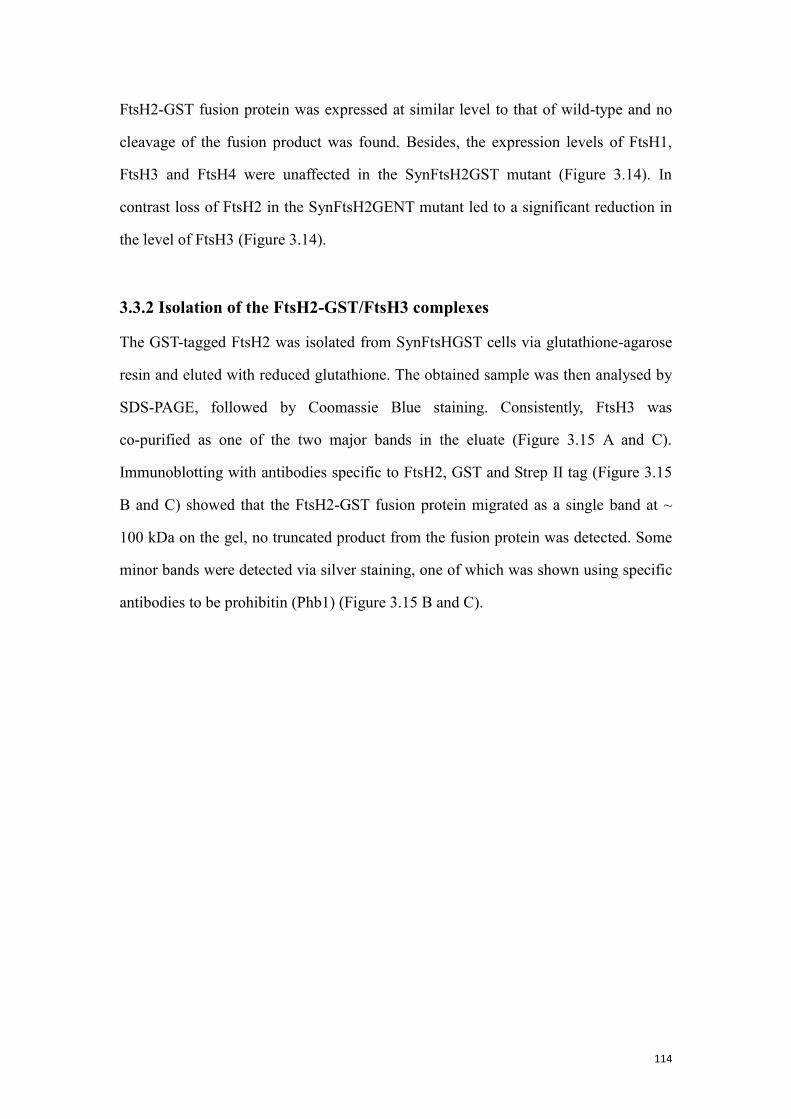
114
FtsH2-GST fusion protein was expressed at similar level to that of wild-type and no
cleavage of the fusion product was found. Besides, the expression levels of FtsH1,
FtsH3 and FtsH4 were unaffected in the SynFtsH2GST mutant (Figure 3.14). In
contrast loss of FtsH2 in the SynFtsH2GENT mutant led to a significant reduction in
the level of FtsH3 (Figure 3.14).
3.3.2 Isolation of the FtsH2-GST/FtsH3 complexes
The GST-tagged FtsH2 was isolated from SynFtsHGST cells via glutathione-agarose
resin and eluted with reduced glutathione. The obtained sample was then analysed by
SDS-PAGE, followed by Coomassie Blue staining. Consistently, FtsH3 was
co-purified as one of the two major bands in the eluate (Figure 3.15 A and C).
Immunoblotting with antibodies specific to FtsH2, GST and Strep II tag (Figure 3.15
B and C) showed that the FtsH2-GST fusion protein migrated as a single band at ~
100 kDa on the gel, no truncated product from the fusion protein was detected. Some
minor bands were detected via silver staining, one of which was shown using specific
antibodies to be prohibitin (Phb1) (Figure 3.15 B and C).
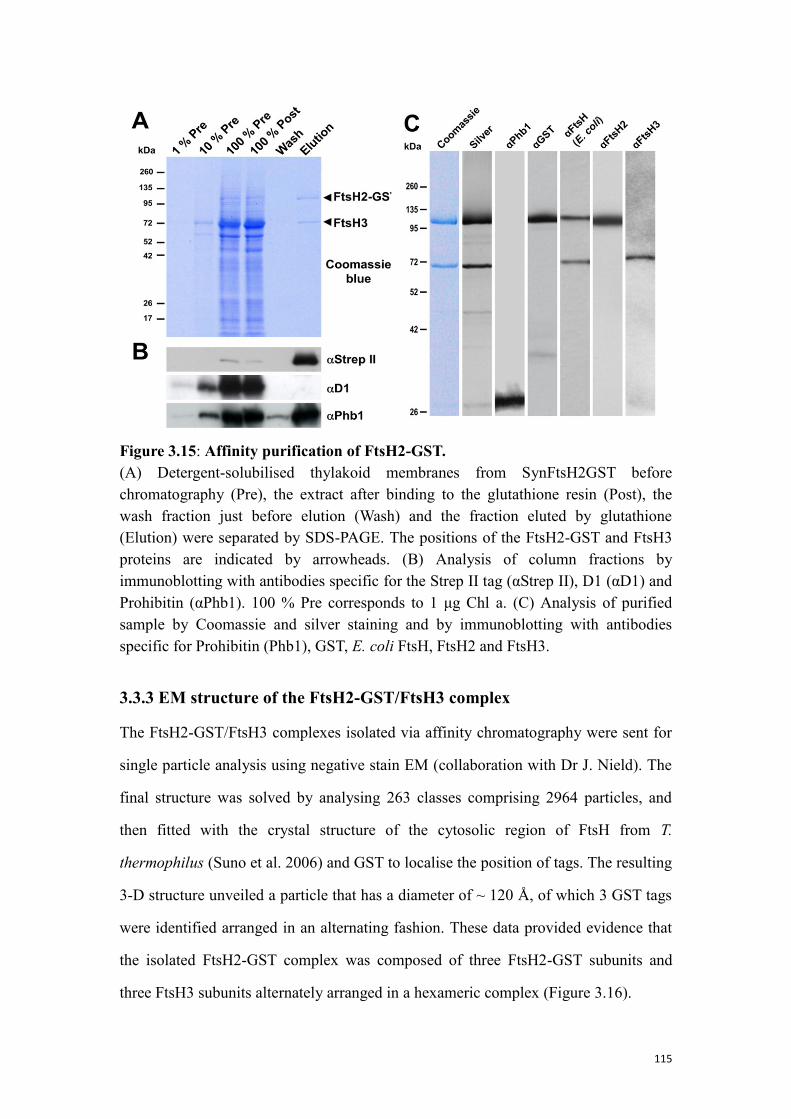
115
Figure 3.15: Affinity purification of FtsH2-GST.
(A) Detergent-solubilised thylakoid membranes from SynFtsH2GST before
chromatography (Pre), the extract after binding to the glutathione resin (Post), the
wash fraction just before elution (Wash) and the fraction eluted by glutathione
(Elution) were separated by SDS-PAGE. The positions of the FtsH2-GST and FtsH3
proteins are indicated by arrowheads. (B) Analysis of column fractions by
immunoblotting with antibodies specific for the Strep II tag (αStrep II), D1 (αD1) and
Prohibitin (αPhb1). 100 % Pre corresponds to 1 μg Chl a. (C) Analysis of purified
sample by Coomassie and silver staining and by immunoblotting with antibodies
specific for Prohibitin (Phb1), GST, E. coli FtsH, FtsH2 and FtsH3.
3.3.3 EM structure of the FtsH2-GST/FtsH3 complex
The FtsH2-GST/FtsH3 complexes isolated via affinity chromatography were sent for
single particle analysis using negative stain EM (collaboration with Dr J. Nield). The
final structure was solved by analysing 263 classes comprising 2964 particles, and
then fitted with the crystal structure of the cytosolic region of FtsH from T.
thermophilus (Suno et al. 2006) and GST to localise the position of tags. The resulting
3-D structure unveiled a particle that has a diameter of ~ 120 Å, of which 3 GST tags
were identified arranged in an alternating fashion. These data provided evidence that
the isolated FtsH2-GST complex was composed of three FtsH2-GST subunits and
three FtsH3 subunits alternately arranged in a hexameric complex (Figure 3.16).
116
Figure 3.16: Three-Dimensional Modeling of the GST-Tagged FtsH2/FtsH3
complex.
An isomesh rendered molecular envelope, contoured with a threshold of 2.5 σ for the
final calculated asymmetric three-dimensional map, is shown in white. The modeling
in of the crystallography-derived hexameric soluble fragment of apoFtsH from T.
maritima (3KDS.pdb) was done by visual inspection with atoms colored as a spectral
rainbow from the N terminus (blue) to the C terminus (red). (A) A 5-nm-thick cross
section viewed from the C-terminal PDs of 3KDS.pdb downwards, revealing its
hexameric nature. (B) A 4-nm-thick cross section, viewed from the GST tags upwards,
toward the C-terminal domains of the hexameric biological assembly of 3KDS.pdb.
(C) A 5-nm-thick cross section, viewed from the side; the best fit for the six FtsH
protomers is shown with the N-terminal AAA+ domain uppermost. (D) Four regions
shown include an N-terminal cap, whose volume is calculated to be ~36 kD
(assuming 0.844 Å3 per D at 2.5 σ), a central core of 360 kD, a C-terminal bottom of
30 kD, and three smaller outlying domains of 18 kD. In (B) to (D), these outlying
domains, closest to the C-terminally orientated central core 3KDS.pdb file, are
assigned to the GST tag (1GTA.pdb). Three such domains are observed, even though
no threefold symmetry operators were applied during angular reconstitution. The
maximum diameter of the complex was observed to be 120 Å. Bar = 25 Å.
117
3.4 Discussion
3.4.1 Composition of FtsH complexes in Synechocystis
Our data support the presence of FtsH1/FtsH3, FtsH2/FtsH3 and FtsH4 complexes in
Synechocystis sp. PCC 6803. Phylogenetic analysis showed that both FtsH1 and
FtsH2 are grouped with the Type B FtsH proteases from A. thaliana that interact with
Type A isomers, and that FtsH3 is the only candidate sharing close phylogeny with
Type A FtsH (Sakamoto et al. 2003). Therefore the hetero-complexes identified in
Synechocystis might share close structural similarities with their counterparts in
chloroplasts.
AFG3L2, one of the two m-AAA protease subunits in human is not only capable of
forming hetero-complexes with paraplegin, but can also self-assemble into
homo-complexes (Koppen et al. 2007). Therefore, besides the presence of
FtsH1/FtsH3 and FtsH2/FtsH3 hetero-complexes, it remains possible that some FtsH1,
FtsH2 and FtsH3 homo-complexes might accumulate under certain conditions. FtsH2
is so far the best studied FtsH homologue in Synechocystis and the EM structure of an
FtsH2-GST/FtsH3 complex was determined in this work (see section 3.3.3). The
structure was obtained by averaging nearly 3000 individual complexes, isolated via
affinity purification of the FtsH2-GST subunits, and the resulting structure clearly
showed three FtsH2 subunits arranged in an alternating fashion in each complex (see
section 3.3.3). These data indicate that there is only one dominant species of
FtsH2-GST/FtsH3 complex in the sample, with a strict alternating arrangement of
subunits. If the arrangement of FtsH2-GST and FtsH3 subunits was random, the
averaging procedure used in the image reconstitution would have led to a GST “ring”
at the bottom of the complex, rather than three defined additional densities. These data
also do not support the presence of FtsH2-GST homo-complexes, at least under the
growth conditions used to grow the cyanobacterial strain. Currently, the structural data
of the remaining FtsH complexes are not yet available, however, it seems unlikely that
FtsH1 and FtsH3 form homo-complexes. Consistent with formation of an
118
FtsH2/FtsH3 heterocomplex, disruption of ftsH2 resulted in the dramatic reduction in
the amount of FtsH3 in the mutant cells lacking FtsH2 (Figure 3.14D). A more
in-depth study revealed that the reduction of FtsH3 was due to enhanced degradation
(Boehm et al. 2012), which leads to the conclusion that the presence of FtsH3 alone is
unstable in the membranes and is prone to proteolytic degradation. Similarly,
reduction of FtsH3 level using an inducible plasmid vector system also impaired
accumulation of FtsH2 when the expression of FtsH3 was suppressed (Boehm et al.
2012), suggesting that losing either type of the subunits leads to extensive degradation
of the other one. On that basis, FtsH1, which shares close similarities with FtsH2, is
unlikely to accumulate without FtsH3.
3.4.2 Membrane targeting system
In vitro studies of the integration of thylakoid FtsH from A. thaliana have revealed
that the insertion of FtsH5, a Type A FtsH subunit, is via the Sec pathway and NTP
dependent, whereas the integration of FtsH2, a Type B protease, is via the Tat pathway
and requiring a proton gradient across the membrane (Rodrigues et al. 2011). The
striking difference is thought to be the result of variations in the N-terminal sequences
of the Type A and Type B subfamilies. In particular, the N-terminus of Type B FtsH
exclusively features a twin arginine motif just before the first transmembrane helix,
which is a sign of Tat-directed signal peptide. Moreover, both Type A and Type B
FtsH contain an A-X-A motif (where X is any amino acid), the cleavage site for the
thylakoidal processing peptidase (TPP), immediately after the first transmembrane
helix, suggesting that the mature proteins will have the first transmembrane region
removed, leaving only one transmembrane anchor and a lumenal-facing small domain
(Rodrigues et al. 2011). However the N-terminal sequence of chloroplast FtsH
subunits present in the final FtsH complex has not yet been determined, which leaves
open the possibility that the observed cleavage of imported FtsH subunits was
non-physiological. We examined the N-terminal sequence of the four FtsH
homologues in Synechocystis (see section 3.1.5) by N-terminal sequencing. Our data
119
suggested that the N-terminus of FtsH2 remains intact, and only the first
formylmethionine of FtsH3 and FtsH4 is removed in the mature FtsH proteases in
vivo.
It is surprising that FtsH4, which also features the twin arginine motif and an A-P-A
cleavage site around the first transmembrane domain, similar to that of Type B FtsH
in A. thaliana, retained almost its full N-terminal sequence. However, removal of the
signal peptide is not obligatory for Tat-dependent thylakoid transport (Molik et al.
2001). Cleavage of the TAT signal peptide requires charged or polar residuals flanking
the A-X-A cleavage site, possibly to enhance the lumenal exposure to TPP or release
the protein from the Tat translocon (Frielingsdorf and Klosgen 2007). Further
bioinformatic analysis on the N-terminal region of FtsH4 suggested that in contrast to
chloroplastic FtsH, the predicted peptidase cleavage site in FtsH4 is located in the first
transmembrane helix, which might be embedded in the lipid bilayer and not accessible
to TPP. Nevertheless, the presence of the twin arginine motif in FtsH4 implies that
insertion of FtsH4 is likely to be via the Tat pathway, which integrates fully folded
FtsH4 but without removing the signal peptide.
FtsH3 might be the only FtsH homologue localised in both thylakoid and cytoplasmic
membranes (see section 3.2.6). The N-terminal sequence analysis of FtsH3 in
FtsH1-GST/FtsH3 complexes showed no difference to that in FtsH2-GST/FtsH3
complexes, indicating that specific N-terminal cleavage of FtsH3 does not control the
integration of FtsH3 into either of the complexes. Considering that FtsH3 is the only
Type A-like FtsH homologue in Synechocystis (Sakamoto et al. 2003), the Sec
pathway is most likely to be responsible for the integration of FtsH3. Unlike the Tat
pathway, which transports both folded and unfolded substrates, Sec pathway
transports unfolded proteins through a SecYE channel into the membrane which is
unable to transport folded domains (Henry et al. 1997). Studies on chimeric Type A
120
and Type B chloroplast-targeted FtsH proteins that have swapped signal peptides
showed that the Sec pathway is unable to insert Type B FtsH, suggesting the domains
of the fusion protein were folded in the stroma prior to membrane integration,
whereas the folding process of Type A FtsH occur after integration (Rodrigues et al.
2011).
Out of the three FtsH homologues that have been N-terminally sequenced, FtsH2 is
the only one to have an intact sequence. Although related to the Type B FtsH subunits
in chloroplasts, no twin arginine motif was found in the TM domain, therefore, the
integration of FtsH2 is unlikely to be Tat dependent. The TM domain of FtsH
homologues in Synechocystis is the least conserved region over the whole sequence,
hence the possibility of a Sec dependent membrane integration mechanism cannot be
ruled out for FtsH2. On the other hand, the N-terminal sequence of FtsH2 only
contains 4 residues before the first transmembrane helix. Therefore, FtsH2 might
simply spontaneously insert into the thylakoid membrane without using Sec or Tat
translocons, similar to that of PsbW (Kim et al. 1998).
No data were obtained from N-terminal analysis of FtsH1, possibly due to N-terminal
blockage during gel electrophoresis. However, it is still noteworthy that the
N-terminal sequence of FtsH1 is much longer than any other homologues. There are
19 residues before the start of the first alpha-helix and 116 residues between the two
transmembrane helices, which makes it the largest TM domain among the four.
Although further analysis is required to unambiguously clarify the localisation of
FtsH1, the current data suggest that FtsH1 is exclusively present in or close to the
cytoplasmic membrane. The long N-terminal sequence might contain specific
membrane targeting signals, however, it is unlikely to utilise Tat pathway as the twin
arginine motif is missing.
121
3.4.3 Localisation of FtsH proteases in Synechocystis
The localisation of all four FtsH homologues in Synechocystis was investigated via
both fluorescence microscopy (see section 3.2.5) and immunoblotting (see section
3.2.6). Benefiting from the high abundance of FtsH2 and FtsH4, it was clear that the
two homologues are present on the thylakoid membranes, and further immunoblotting
assays also showed that FtsH2 and FtsH4 are exclusively present in the thylakoid
membrane fraction. The localisation of FtsH1 and FtsH3 was less obvious by
fluorescence microscopy, this is due to the lower expression level of FtsH1 (see
section 3.2.3) and low expression and instability of the FtsH3-GFP fusion (see Figure
3.9). Nevertheless, the images from fluorescence microscopy showed weak signals
from the cytoplasmic membrane area. The immunoblotting assay further confirmed
that FtsH3 is present in both thylakoid and cytoplasmic membranes; unfortunately,
blotting data could not be obtained for FtsH1. In parallel work, strains of
Synechococcus elongatus PCC 7942 and Synechocystis PCC 6803 expressing
C-terminal GFP-tagged FtsH derivatives also yielded similar fluorescence data to that
shown here (unpublished data from Prof. C. Mullineaux group). Therefore,
collectively all the data indicate that the FtsH complexes occupy distinct regions of
the cyanobacterial cell: FtsH2 and FtsH4 complexes are found in the thylakoid
membranes, FtsH3 is localised to both thylakoid and cytoplasmic membranes and,
given the available data, FtsH1 is located in or close to the cytoplasmic membrane.
The abundance of FtsH3-GFP fusion protein in SynFtsH3GFPcam mutants was
relatively low compared to amount of FtsH3 in WT-G (Figure 3.8). However, FtsH3
from WT-G, which is slightly smaller than the other three homologues, ran as a lower
band on appropriate SDS-PAGE gels, is relatively abundant (Figure 3.13 B and Figure
3.14 D). Hence the fusion of a GFP tag might have disturbed the stability of FtsH3
and enhanced degradation (Boehm et al. 2012). FtsH3 was found to interact with both
FtsH1 and FtsH2 (Figure 3.4). However, FtsH3 predominantly interacts with FtsH2 in
122
WT-G as FtsH3 only accumulated to 10 % of the wild-type level in an FtsH2
defective mutant (Boehm et al. 2012). This is also in line with a comparison of the
immunodetectable levels of FtsH1 and FtsH2 in Figure 3.9B. The low level of GFP
signal detected in SynFtsH3GSTcam was mostly spread towards the cytoplasmic
membrane region and little was found in the thylakoid membrane where FtsH2/FtsH3
complexes will be located (Figure 3.12 B and C). One possible explanation is that the
non-fluorescent cleaved FtsH3-GFP protein is mainly present in the FtsH2/FtsH3
complexes in the thylakoid membrane, and that the residual FtsH3-GFP interacts more
strongly with FtsH1 than FtsH3 and so is preferentially located with FtsH1 in the
cytoplasmic membrane.
3.4.4 Structure of hetero-oligomeric FtsH complexes
Although crystal structures for the cytosolic domains of bacterial FtsH proteases have
been determined, there is much less structural information on the intact FtsH complex.
Indeed the widely assumed hexameric structure for FtsH is dependent on the analysis
of soluble fragments not the intact complex. Our work on the structure of the native
FtsH2-GST/FtsH3 complex from Synechocystis therefore provides important new
information on the structure of an intact hetero-oligomeric FtsH complex. Importantly
our structural model suggests that the intact complex is indeed hexameric.
Additionally, the subunit arrangement within the hetero-complex, elucidated by
localising the additional GST density on the FtsH2 subunits, showed a clear
alternating arrangement of FtsH2-GST and FtsH3 protomers. Given the
co-purification of FtsH1 and FtsH3 and the close phylogenetic relationship between
FtsH1 and FtsH2, it seems likely that the subunits within the FtsH1/FtsH3 complex
might also alternate.
During the course of this thesis, a cryo-EM structure of the Yta10/Yta12 complex, a
mitochondrial FtsH complex from yeast, was determined at ~ 12 Ǻ resolution (Lee et
al. 2011). The structure of the Yta10/12 complex also exhibited a hexameric structure
123
of similar size to the model present here. Although the EM data was of insufficient
resolution to differentiate between the Yta10 and Yta12 subunits, a computational
analysis on the subunit arrangement of Yta10/Yta12 complexes also suggested
alternating protomers (Lee et al. 2011). Interestingly, a ~ 13 Ǻ gap was identified
between the trans-membrane domain and the substrate binding site in the soluble
fragment of FtsH, which is equivalent to the length of a polypeptide chain consisting
of ~ 20 residues (Lee et al. 2011). This finding is consistent with previous work
showing that the length of the N-terminal tail of D1 is crucial for FtsH-mediated
degradation and that FtsH-mediated degradation of D1 is likely to be initiated at the
N-terminus (Komenda et al. 2007b).
124
Chapter 4: Functional characterisation of FtsH proteases
in vivo and in vitro
4.1 Functional analysis of FtsH-deficient mutants
Early mutagenesis experiments revealed that the ftsH1 and ftsH3 genes of
Synechocystis 6803 are required for cell viability whereas ftsH2 and ftsH4 are
non-essential (Mann et al. 2000). More recent studies have confirmed that FtsH2 is
involved in removal of photodamaged D1 protein (Silva et al. 2003; Komenda et al.
2006b) and osmoregulation (Stirnberg et al. 2007). On the other hand, the function of
FtsH4 is not yet known as disruption of this gene did not yield a distinctive phenotype
under the conditions tested (Mann et al. 2000). It has been shown that in the
chloroplasts of A. thaliana, PSII repair is maintained by multiple types of FtsH
complexes composed of different isomers of Type A and Type B proteases (Yu et al.
2005). Among the four homologues in A. thaliana, FtsH1 and FtsH8 appear to
function as minor isomers, disruption of which results in no obvious phenotype
(Sakamoto et al. 2003). These results therefore raised the speculation that FtsH4 in
Synechocystis might have functional overlap with other FtsH complexes. To explore
the potential function of FtsH4, a double mutant deficient in both FtsH2 and FtsH4
was made (see section 4.1.2-4.1.3) and characterised in this work (see section
4.1.4-4.1.5). In addition, a bioinformatic analysis was performed to identify suitable
residues for mutagenesis (see section 4.1.1 and section 4.2).
4.1.1 Defining the functional domains of each cyanobacterial FtsH.
Bioinformatic analysis is a great tool to identify conserved amino-acid residues and
motifs between homologous proteins. Benefiting from the previous experimental data,
especially the crystal structures of the cytosolic domains of several bacterial FtsHs, a
few conserved motifs in FtsH have been defined (Suno et al. 2006). After aligning
FtsH homologues from both Synechocystis 6803 and T. elongatus with that of T.
125
thermophilus, we were able to locate the conserved alanine (A144, designation
according to the sequence of FtsH from T. thermophilus and hereafter) and glycine
(G399) at each end of the AAA+ domain (Figure 4.1). The transmembrane and
protease domains are less conserved due to the diverse physiological functions;
therefore, the actual boundary of these two domains might vary among individuals.
The conserved motifs that define the FtsH protease family were aligned (Figure 4.1,
blue boxes), including the classic Walker A, Walker B and second region of homology
(SRH) motifs responsible for nucleotide hydrolysis, and the zinc ion-binding motif
(ZnBD) that enables metalloproteolytic activity. Notably, the FtsH family also
features a conserved @XG (@ represents hydrophobic residue, X represents any
residue) sequence in the AAA+ domain, in this case Phe-Val-Gly. According to the
crystal structures of the T. maritima and T. thermophilus FtsH hexameric complexes,
this motif appears aligned around the entrance of the central pore, and is believed to
be responsible for initial substrate binding and translocation through the pore to the
protease catalytic site (Bieniossek et al. 2006). Moreover, unlike other known zincins,
the third ligand to the zinc ion in FtsH is an aspartic acid, instead of glutamic acid, in
the protease domain (Suno et al. 2006).
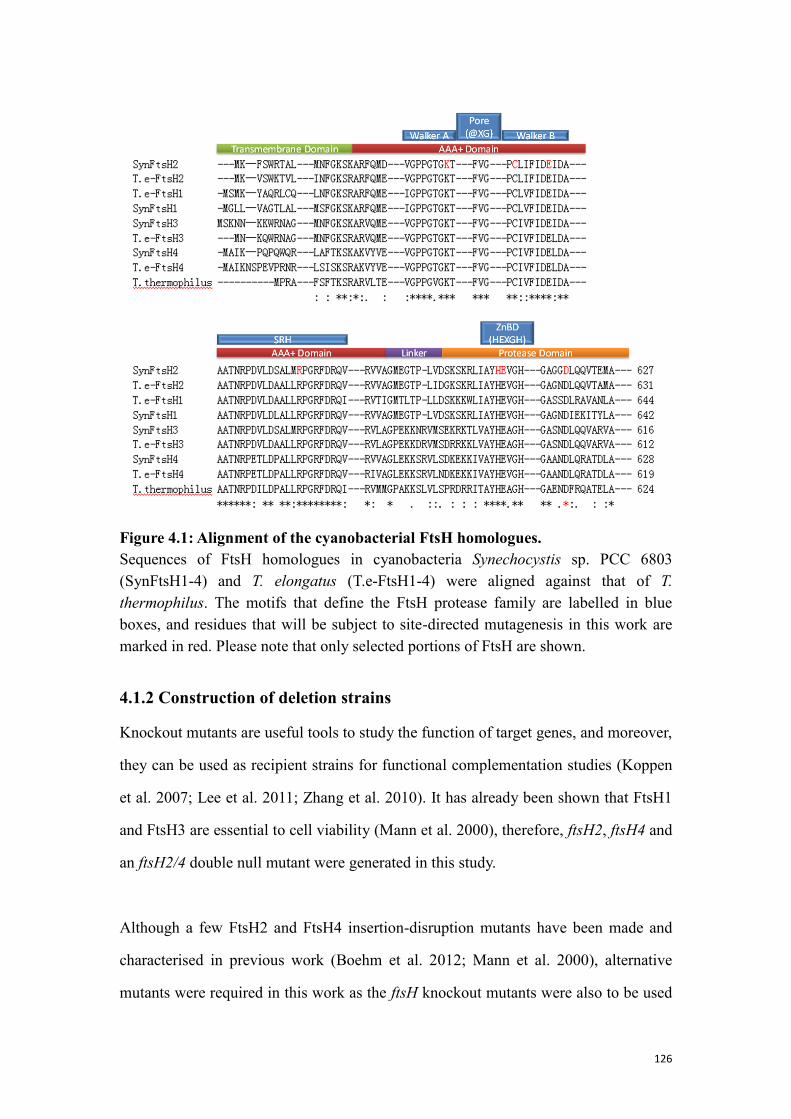
126
Figure 4.1: Alignment of the cyanobacterial FtsH homologues.
Sequences of FtsH homologues in cyanobacteria Synechocystis sp. PCC 6803
(SynFtsH1-4) and T. elongatus (T.e-FtsH1-4) were aligned against that of T.
thermophilus. The motifs that define the FtsH protease family are labelled in blue
boxes, and residues that will be subject to site-directed mutagenesis in this work are
marked in red. Please note that only selected portions of FtsH are shown.
4.1.2 Construction of deletion strains
Knockout mutants are useful tools to study the function of target genes, and moreover,
they can be used as recipient strains for functional complementation studies (Koppen
et al. 2007; Lee et al. 2011; Zhang et al. 2010). It has already been shown that FtsH1
and FtsH3 are essential to cell viability (Mann et al. 2000), therefore, ftsH2, ftsH4 and
an ftsH2/4 double null mutant were generated in this study.
Although a few FtsH2 and FtsH4 insertion-disruption mutants have been made and
characterised in previous work (Boehm et al. 2012; Mann et al. 2000), alternative
mutants were required in this work as the ftsH knockout mutants were also to be used
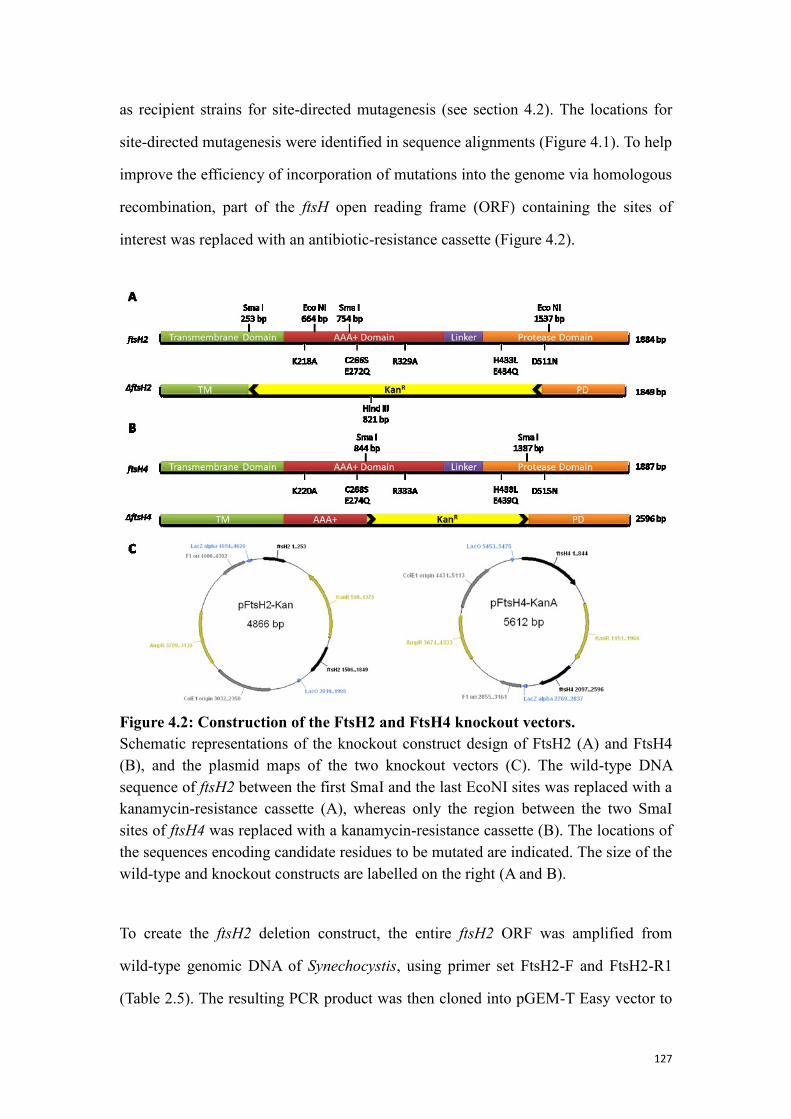
127
as recipient strains for site-directed mutagenesis (see section 4.2). The locations for
site-directed mutagenesis were identified in sequence alignments (Figure 4.1). To help
improve the efficiency of incorporation of mutations into the genome via homologous
recombination, part of the ftsH open reading frame (ORF) containing the sites of
interest was replaced with an antibiotic-resistance cassette (Figure 4.2).
Figure 4.2: Construction of the FtsH2 and FtsH4 knockout vectors.
Schematic representations of the knockout construct design of FtsH2 (A) and FtsH4
(B), and the plasmid maps of the two knockout vectors (C). The wild-type DNA
sequence of ftsH2 between the first SmaI and the last EcoNI sites was replaced with a
kanamycin-resistance cassette (A), whereas only the region between the two SmaI
sites of ftsH4 was replaced with a kanamycin-resistance cassette (B). The locations of
the sequences encoding candidate residues to be mutated are indicated. The size of the
wild-type and knockout constructs are labelled on the right (A and B).
To create the ftsH2 deletion construct, the entire ftsH2 ORF was amplified from
wild-type genomic DNA of Synechocystis, using primer set FtsH2-F and FtsH2-R1
(Table 2.5). The resulting PCR product was then cloned into pGEM-T Easy vector to
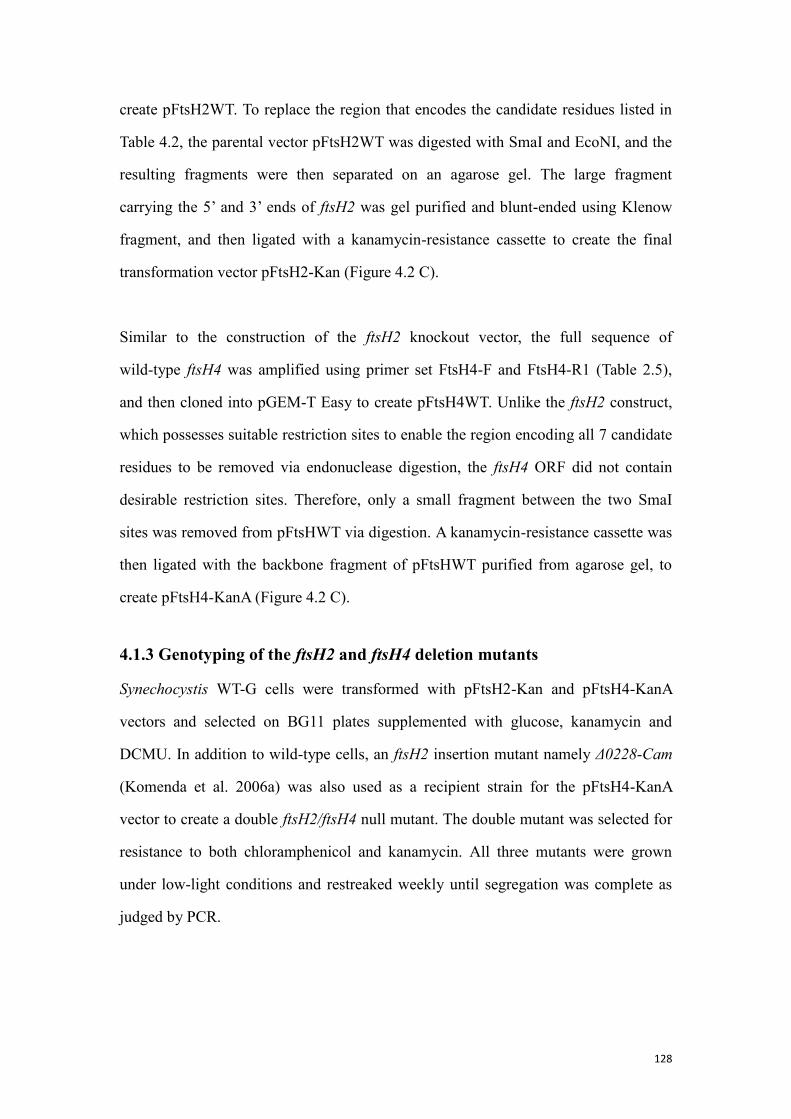
128
create pFtsH2WT. To replace the region that encodes the candidate residues listed in
Table 4.2, the parental vector pFtsH2WT was digested with SmaI and EcoNI, and the
resulting fragments were then separated on an agarose gel. The large fragment
carrying the 5’ and 3’ ends of ftsH2 was gel purified and blunt-ended using Klenow
fragment, and then ligated with a kanamycin-resistance cassette to create the final
transformation vector pFtsH2-Kan (Figure 4.2 C).
Similar to the construction of the ftsH2 knockout vector, the full sequence of
wild-type ftsH4 was amplified using primer set FtsH4-F and FtsH4-R1 (Table 2.5),
and then cloned into pGEM-T Easy to create pFtsH4WT. Unlike the ftsH2 construct,
which possesses suitable restriction sites to enable the region encoding all 7 candidate
residues to be removed via endonuclease digestion, the ftsH4 ORF did not contain
desirable restriction sites. Therefore, only a small fragment between the two SmaI
sites was removed from pFtsHWT via digestion. A kanamycin-resistance cassette was
then ligated with the backbone fragment of pFtsHWT purified from agarose gel, to
create pFtsH4-KanA (Figure 4.2 C).
4.1.3 Genotyping of the ftsH2 and ftsH4 deletion mutants
Synechocystis WT-G cells were transformed with pFtsH2-Kan and pFtsH4-KanA
vectors and selected on BG11 plates supplemented with glucose, kanamycin and
DCMU. In addition to wild-type cells, an ftsH2 insertion mutant namely Δ0228-Cam
(Komenda et al. 2006a) was also used as a recipient strain for the pFtsH4-KanA
vector to create a double ftsH2/ftsH4 null mutant. The double mutant was selected for
resistance to both chloramphenicol and kanamycin. All three mutants were grown
under low-light conditions and restreaked weekly until segregation was complete as
judged by PCR.
129
Figure 4.3: Genotyping of the ftsH2 and ftsH4 deletion mutants.
Mutated ftsH genes were amplified via PCR and analysed on agarose gels to show
segregation of the mutant genotype (A, B and C). The PCR fragments amplified from
ftsH2 cells were further digested with HindIII (A, right panel) to confirm integration
of the kanamycin resistance cassette. (D) A schematic representation of the disruption
construction of ftsH2 in Δ0228-Cam.
The genomic DNA of the newly constructed mutants, namely ΔftsH2, ΔftsH4 and
ΔftsH2ΔftsH4, was extracted via phenol-chloroform extraction and the mutated ORFs
were amplified with primer pair FtsH2-F/FtsH2-R1 and/or FtsH4-F/FtsH4-R1,
respectively (Figure 4.3 A B and C). The ftsH4 construct is ~700 bp longer than the
wild-type; the ftsH2 knockout construct, however, is almost the same size as the
wild-type. Therefore a diagnostic restriction digest with HindIII, which exclusively
cuts the kanamycin-resistance cassette (Figure 4.3 A), was performed (Figure 4.3 A,
right panel). According to the PCR and digestion results, all three mutants, ΔftsH2,
ΔftsH4 and ΔftsH2ΔftsH4 were either fully segregated or virtually fully segregated.
The extra higher molecular mass bands observed in the WT samples might reflect the
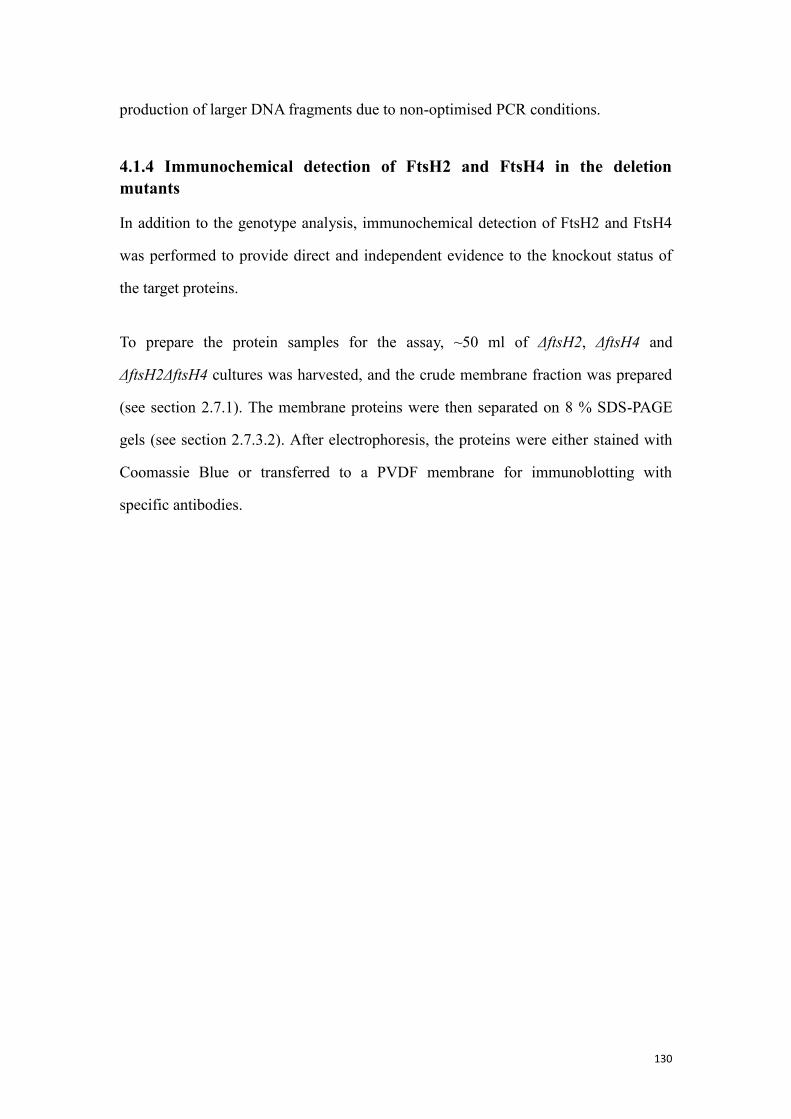
130
production of larger DNA fragments due to non-optimised PCR conditions.
4.1.4 Immunochemical detection of FtsH2 and FtsH4 in the deletion
mutants
In addition to the genotype analysis, immunochemical detection of FtsH2 and FtsH4
was performed to provide direct and independent evidence to the knockout status of
the target proteins.
To prepare the protein samples for the assay, ~50 ml of ΔftsH2, ΔftsH4 and
ΔftsH2ΔftsH4 cultures was harvested, and the crude membrane fraction was prepared
(see section 2.7.1). The membrane proteins were then separated on 8 % SDS-PAGE
gels (see section 2.7.3.2). After electrophoresis, the proteins were either stained with
Coomassie Blue or transferred to a PVDF membrane for immunoblotting with
specific antibodies.
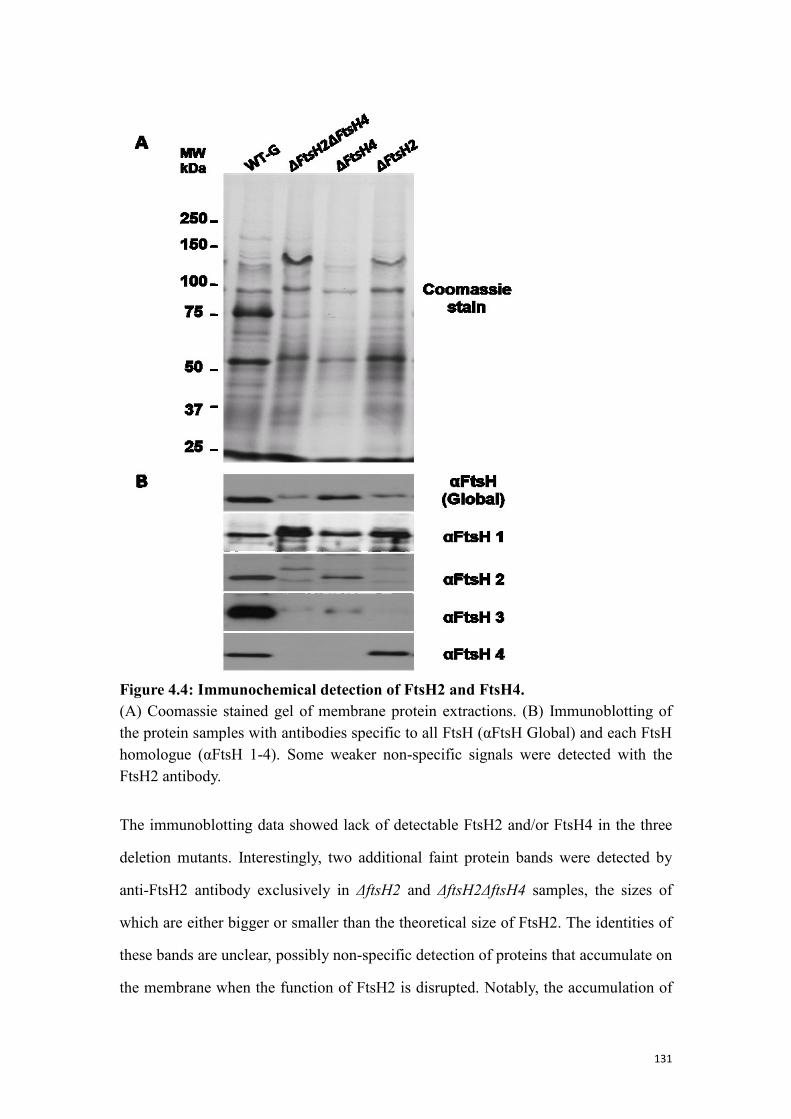
131
Figure 4.4: Immunochemical detection of FtsH2 and FtsH4.
(A) Coomassie stained gel of membrane protein extractions. (B) Immunoblotting of
the protein samples with antibodies specific to all FtsH (αFtsH Global) and each FtsH
homologue (αFtsH 1-4). Some weaker non-specific signals were detected with the
FtsH2 antibody.
The immunoblotting data showed lack of detectable FtsH2 and/or FtsH4 in the three
deletion mutants. Interestingly, two additional faint protein bands were detected by
anti-FtsH2 antibody exclusively in ΔftsH2 and ΔftsH2ΔftsH4 samples, the sizes of
which are either bigger or smaller than the theoretical size of FtsH2. The identities of
these bands are unclear, possibly non-specific detection of proteins that accumulate on
the membrane when the function of FtsH2 is disrupted. Notably, the accumulation of
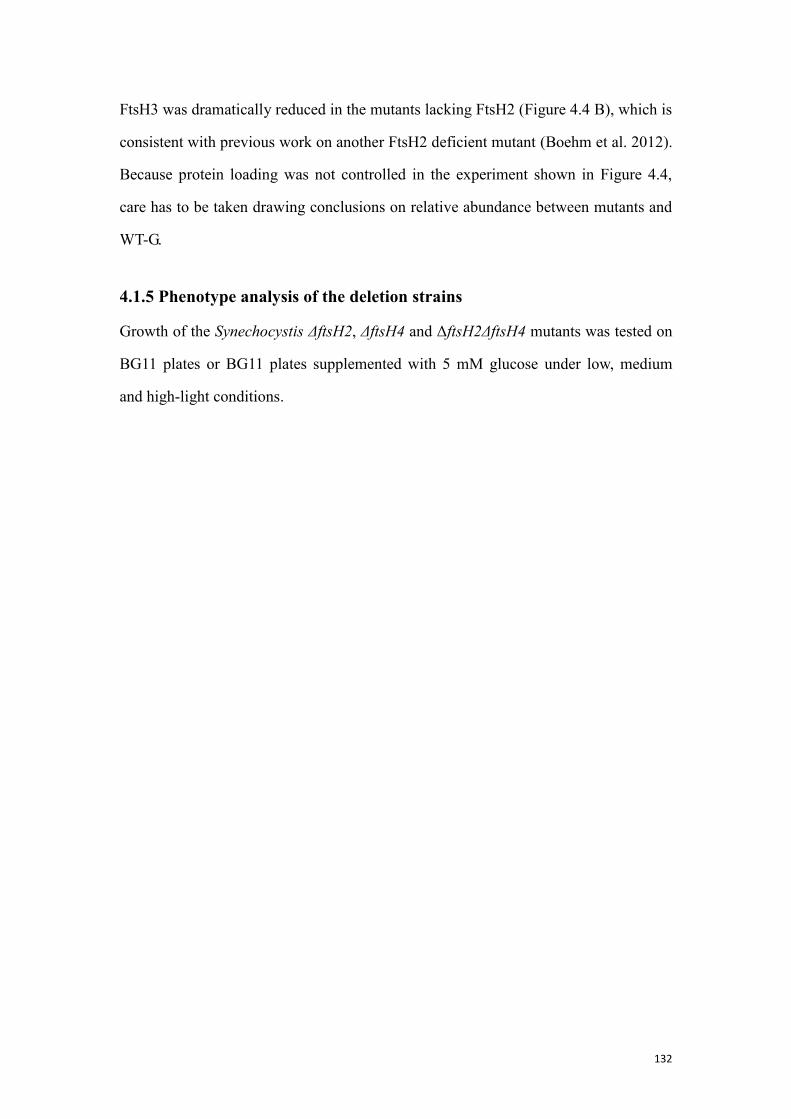
132
FtsH3 was dramatically reduced in the mutants lacking FtsH2 (Figure 4.4 B), which is
consistent with previous work on another FtsH2 deficient mutant (Boehm et al. 2012).
Because protein loading was not controlled in the experiment shown in Figure 4.4,
care has to be taken drawing conclusions on relative abundance between mutants and
WT-G.
4.1.5 Phenotype analysis of the deletion strains
Growth of the Synechocystis ΔftsH2, ΔftsH4 and ΔftsH2ΔftsH4 mutants was tested on
BG11 plates or BG11 plates supplemented with 5 mM glucose under low, medium
and high-light conditions.
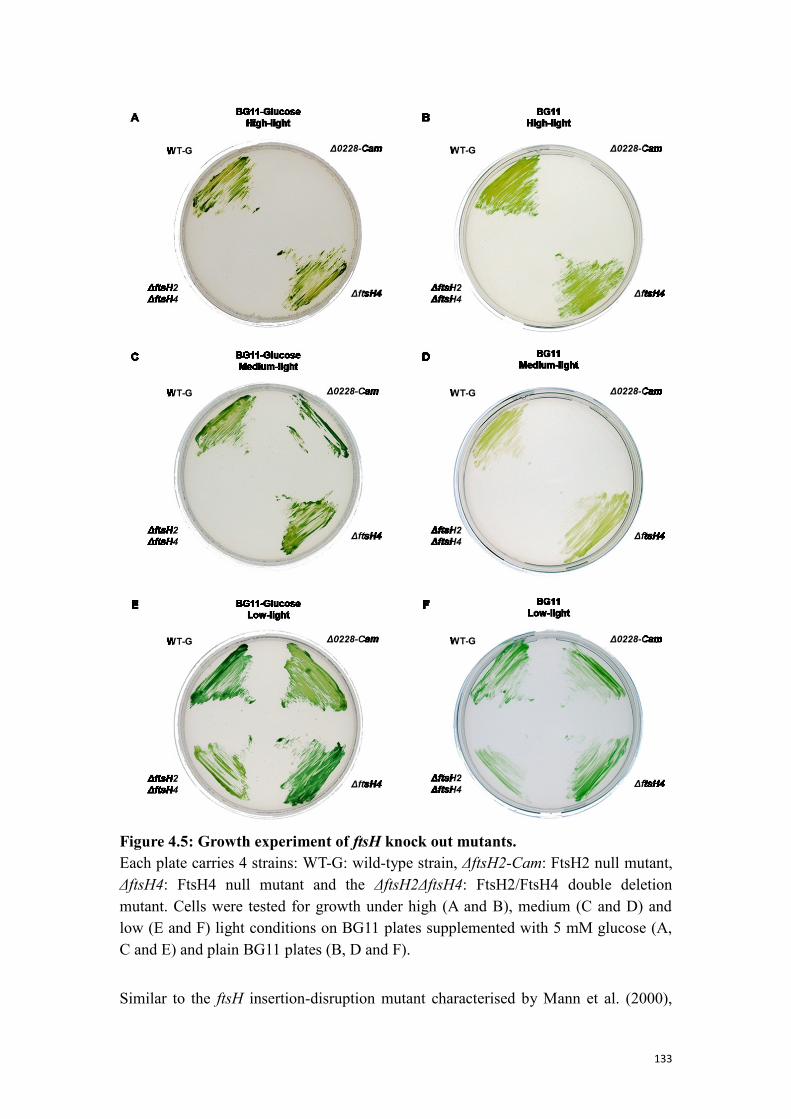
133
Figure 4.5: Growth experiment of ftsH knock out mutants.
Each plate carries 4 strains: WT-G: wild-type strain, ΔftsH2-Cam: FtsH2 null mutant,
ΔftsH4: FtsH4 null mutant and the ΔftsH2ΔftsH4: FtsH2/FtsH4 double deletion
mutant. Cells were tested for growth under high (A and B), medium (C and D) and
low (E and F) light conditions on BG11 plates supplemented with 5 mM glucose (A,
C and E) and plain BG11 plates (B, D and F).
Similar to the ftsH insertion-disruption mutant characterised by Mann et al. (2000),
134
the ftsH4 null mutant displayed a WT-like phenotype (Figure 4.5 A) and the ftsH2 null
mutant was more susceptible to light stress (Silva et al. 2003) (Figure 4.5 A).
Interestingly, the double mutant was even more sensitive to light stress comparing to
the ftsH2 single mutant (Figure 4.5 C), indicating FtsH4 could play a minor role in
counteracting photoinhibition.
4.2 Construction of FtsH site-directed mutants
Previous studies on chloroplast, mitochondrial and bacterial FtsH proteases have
identified conserved residues that have a great impact on the correct function of the
protease complex (Arlt et al. 1996; Karata et al. 1999; Suno et al. 2006; Zhang et al.
2010). In this work, we took advantage of the available data to target seven
Synechocystis residues in the AAA+ and PD domains for mutagenesis (Table 4.1 and
Table 4.2), with the aim to generate protease inactive complexes to allow
identification of potential substrates in pull-down assays. Six of the characterised
residues were chosen to test for effects on protease activity or ATP-ase activity (Table
4.1). The conserved residues at Walker A and Walker B motifs are essential for correct
docking of ATP into the binding pocket of the AAA+ domain, whereas, the conserved
“arginine finger” on the second region of homology (SRH) has been proposed to be
essential to the hydrolysis of ATP (Suno et al., 2006). The remaining three residues
located at the protease domain are the three ligands that coordinate the zinc ion at the
proteaolytic site, some of which have been shown to be essential to the proteolytic
activity (Karata et al., 1999; Zhang et al., 2010). In addition, a conserved cysteine
residue found in the Walker B motif, and found in all cyanobacterial FtsH homologues,
was mutated to serine to test for a potential role in redox-control of the enzyme
(Mata-Cabana et al., 2007). Notably, the cysteine is unique to five of the eight
cyanobacterial FtsH proteases covered in this study, only SynFtsH1, TheFtsH1 and
TheFtsH4 have a second cysteine downstream of the HEXGH motif. Moreover, this
cysteine is not universally conserved across the entire FtsH family; according to the
phylogenetic analysis, most mitochondrial FtsH orthologues have a serine or alanine
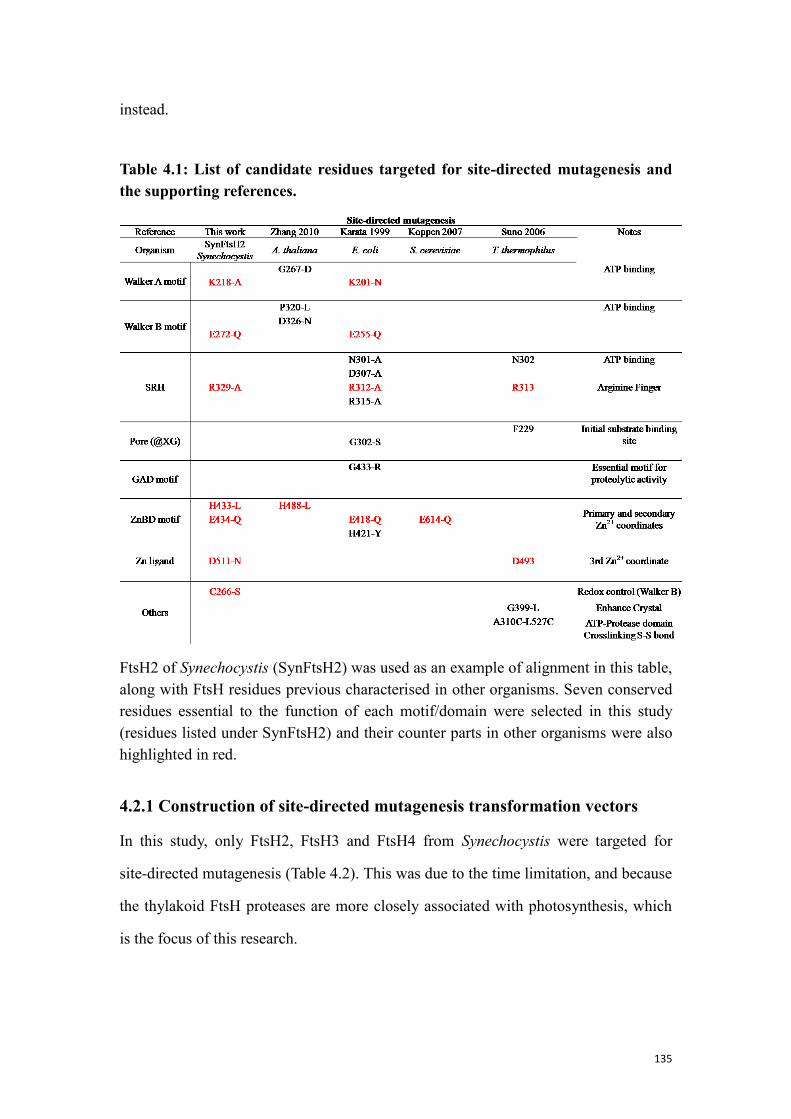
135
instead.
Table 4.1: List of candidate residues targeted for site-directed mutagenesis and
the supporting references.
FtsH2 of Synechocystis (SynFtsH2) was used as an example of alignment in this table,
along with FtsH residues previous characterised in other organisms. Seven conserved
residues essential to the function of each motif/domain were selected in this study
(residues listed under SynFtsH2) and their counter parts in other organisms were also
highlighted in red.
4.2.1 Construction of site-directed mutagenesis transformation vectors
In this study, only FtsH2, FtsH3 and FtsH4 from Synechocystis were targeted for
site-directed mutagenesis (Table 4.2). This was due to the time limitation, and because
the thylakoid FtsH proteases are more closely associated with photosynthesis, which
is the focus of this research.
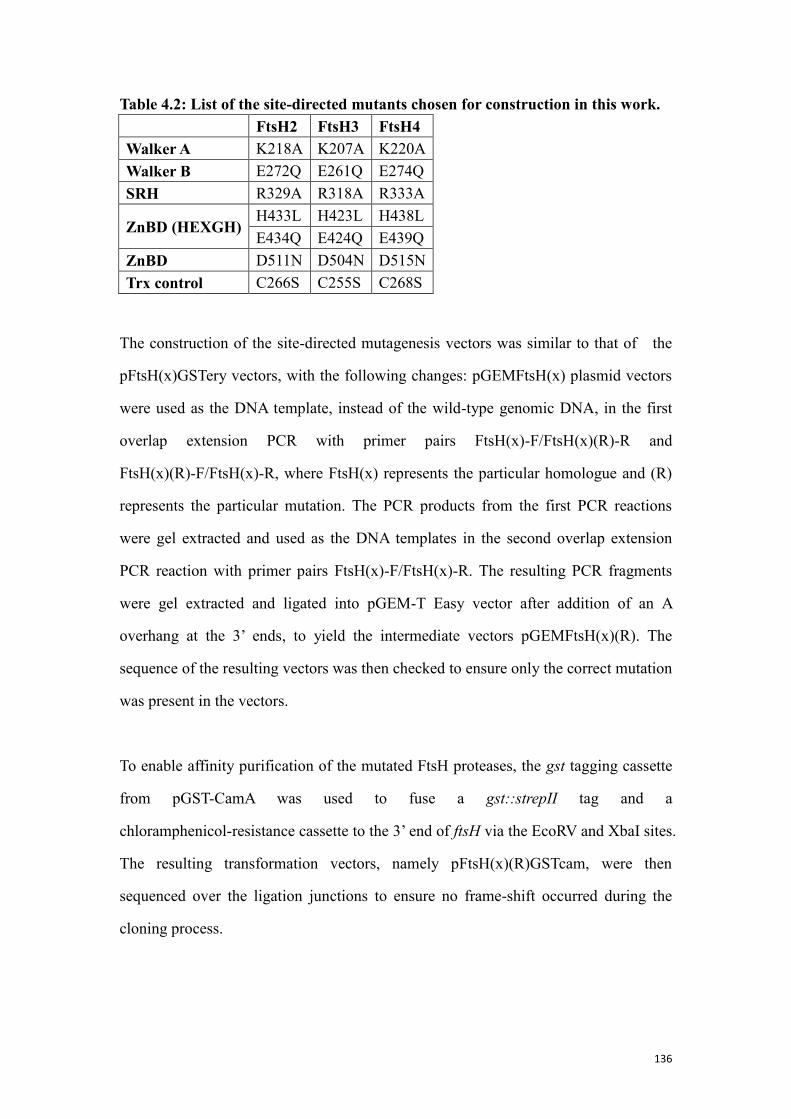
136
Table 4.2: List of the site-directed mutants chosen for construction in this work.
FtsH2 FtsH3 FtsH4
Walker A K218A K207A K220A
Walker B E272Q E261Q E274Q
SRH R329A R318A R333A
ZnBD (HEXGH) H433L H423L H438L
E434Q E424Q E439Q
ZnBD D511N D504N D515N
Trx control C266S C255S C268S
The construction of the site-directed mutagenesis vectors was similar to that of the
pFtsH(x)GSTery vectors, with the following changes: pGEMFtsH(x) plasmid vectors
were used as the DNA template, instead of the wild-type genomic DNA, in the first
overlap extension PCR with primer pairs FtsH(x)-F/FtsH(x)(R)-R and
FtsH(x)(R)-F/FtsH(x)-R, where FtsH(x) represents the particular homologue and (R)
represents the particular mutation. The PCR products from the first PCR reactions
were gel extracted and used as the DNA templates in the second overlap extension
PCR reaction with primer pairs FtsH(x)-F/FtsH(x)-R. The resulting PCR fragments
were gel extracted and ligated into pGEM-T Easy vector after addition of an A
overhang at the 3’ ends, to yield the intermediate vectors pGEMFtsH(x)(R). The
sequence of the resulting vectors was then checked to ensure only the correct mutation
was present in the vectors.
To enable affinity purification of the mutated FtsH proteases, the gst tagging cassette
from pGST-CamA was used to fuse a gst::strepII tag and a
chloramphenicol-resistance cassette to the 3’ end of ftsH via the EcoRV and XbaI sites.
The resulting transformation vectors, namely pFtsH(x)(R)GSTcam, were then
sequenced over the ligation junctions to ensure no frame-shift occurred during the
cloning process.
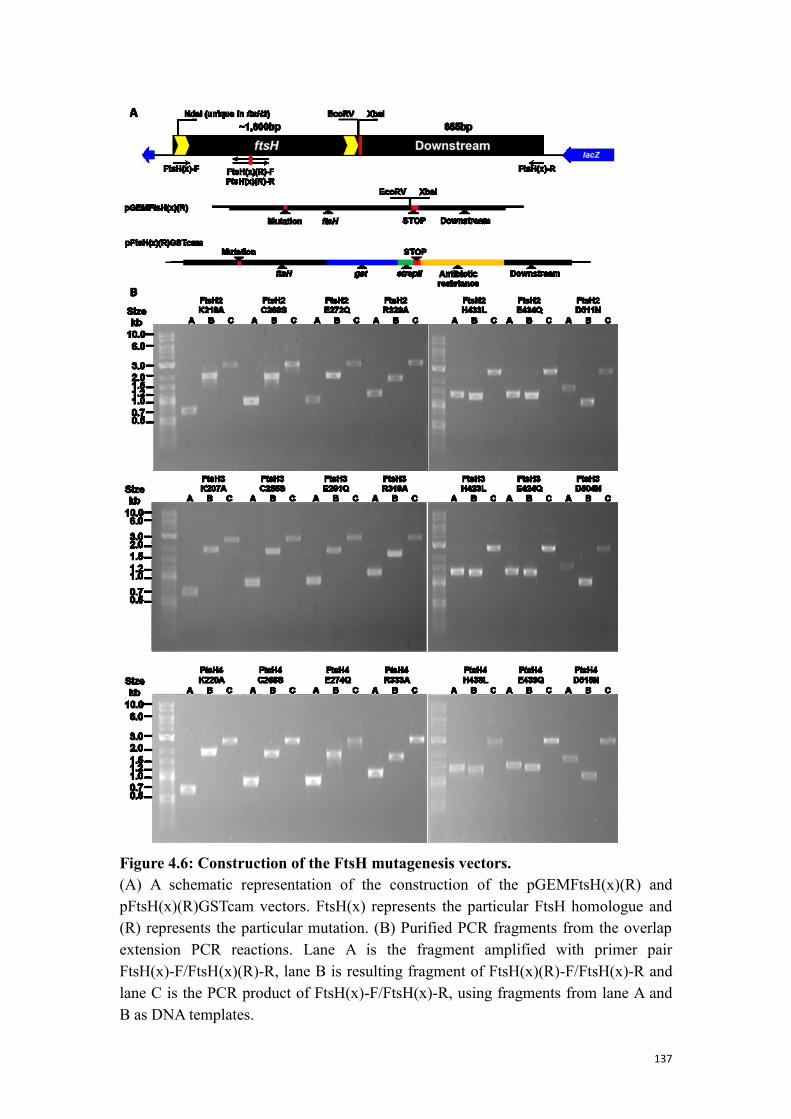
137
Figure 4.6: Construction of the FtsH mutagenesis vectors.
(A) A schematic representation of the construction of the pGEMFtsH(x)(R) and
pFtsH(x)(R)GSTcam vectors. FtsH(x) represents the particular FtsH homologue and
(R) represents the particular mutation. (B) Purified PCR fragments from the overlap
extension PCR reactions. Lane A is the fragment amplified with primer pair
FtsH(x)-F/FtsH(x)(R)-R, lane B is resulting fragment of FtsH(x)(R)-F/FtsH(x)-R and
lane C is the PCR product of FtsH(x)-F/FtsH(x)-R, using fragments from lane A and
B as DNA templates.
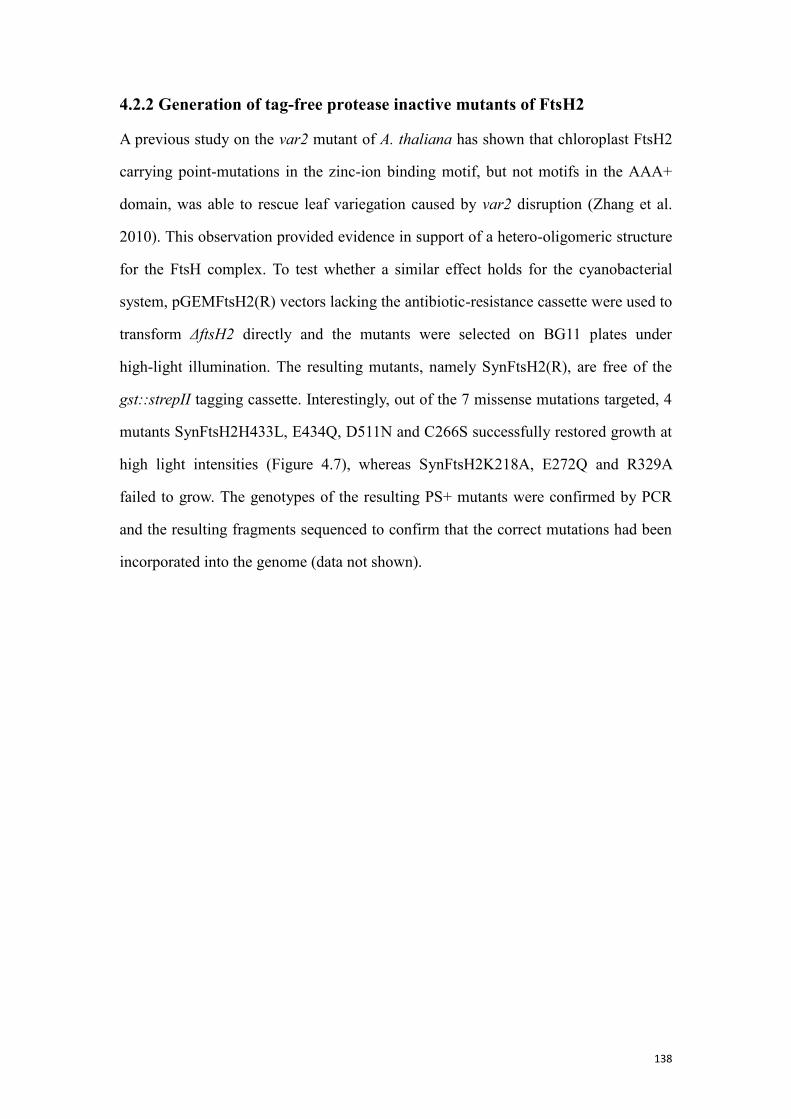
138
4.2.2 Generation of tag-free protease inactive mutants of FtsH2
A previous study on the var2 mutant of A. thaliana has shown that chloroplast FtsH2
carrying point-mutations in the zinc-ion binding motif, but not motifs in the AAA+
domain, was able to rescue leaf variegation caused by var2 disruption (Zhang et al.
2010). This observation provided evidence in support of a hetero-oligomeric structure
for the FtsH complex. To test whether a similar effect holds for the cyanobacterial
system, pGEMFtsH2(R) vectors lacking the antibiotic-resistance cassette were used to
transform ΔftsH2 directly and the mutants were selected on BG11 plates under
high-light illumination. The resulting mutants, namely SynFtsH2(R), are free of the
gst::strepII tagging cassette. Interestingly, out of the 7 missense mutations targeted, 4
mutants SynFtsH2H433L, E434Q, D511N and C266S successfully restored growth at
high light intensities (Figure 4.7), whereas SynFtsH2K218A, E272Q and R329A
failed to grow. The genotypes of the resulting PS+ mutants were confirmed by PCR
and the resulting fragments sequenced to confirm that the correct mutations had been
incorporated into the genome (data not shown).
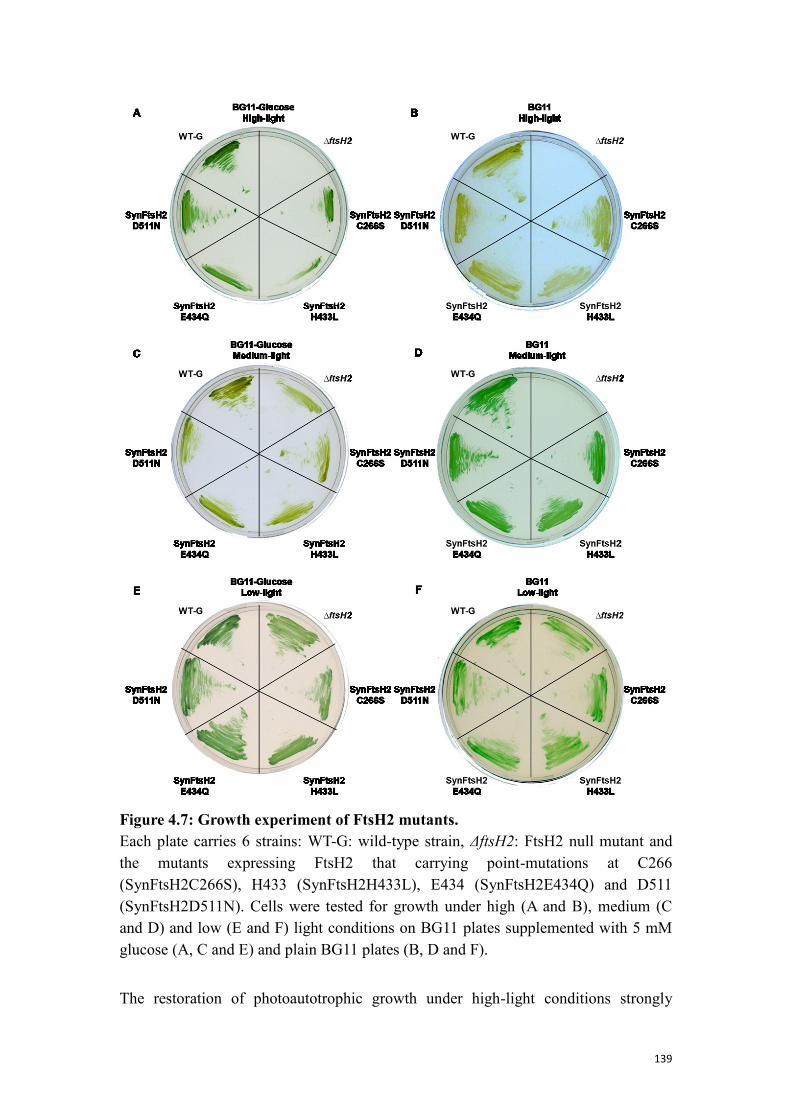
139
Figure 4.7: Growth experiment of FtsH2 mutants.
Each plate carries 6 strains: WT-G: wild-type strain, ΔftsH2: FtsH2 null mutant and
the mutants expressing FtsH2 that carrying point-mutations at C266
(SynFtsH2C266S), H433 (SynFtsH2H433L), E434 (SynFtsH2E434Q) and D511
(SynFtsH2D511N). Cells were tested for growth under high (A and B), medium (C
and D) and low (E and F) light conditions on BG11 plates supplemented with 5 mM
glucose (A, C and E) and plain BG11 plates (B, D and F).
The restoration of photoautotrophic growth under high-light conditions strongly
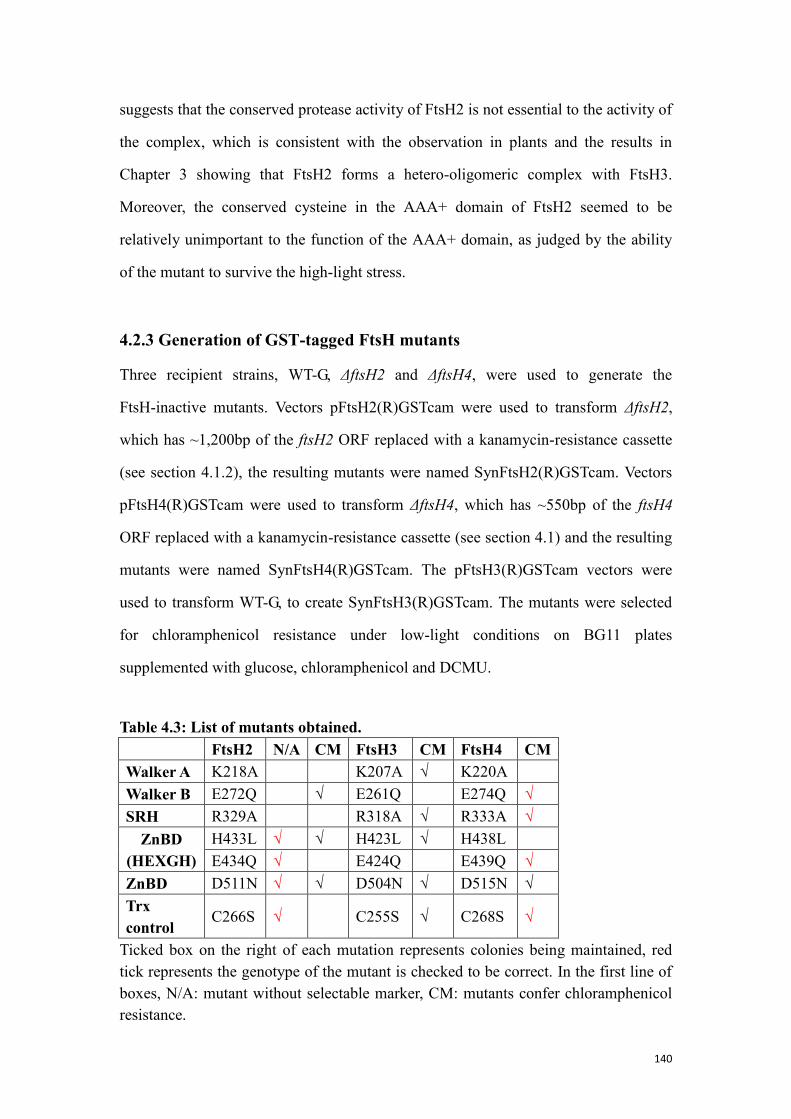
140
suggests that the conserved protease activity of FtsH2 is not essential to the activity of
the complex, which is consistent with the observation in plants and the results in
Chapter 3 showing that FtsH2 forms a hetero-oligomeric complex with FtsH3.
Moreover, the conserved cysteine in the AAA+ domain of FtsH2 seemed to be
relatively unimportant to the function of the AAA+ domain, as judged by the ability
of the mutant to survive the high-light stress.
4.2.3 Generation of GST-tagged FtsH mutants
Three recipient strains, WT-G, ΔftsH2 and ΔftsH4, were used to generate the
FtsH-inactive mutants. Vectors pFtsH2(R)GSTcam were used to transform ΔftsH2,
which has ~1,200bp of the ftsH2 ORF replaced with a kanamycin-resistance cassette
(see section 4.1.2), the resulting mutants were named SynFtsH2(R)GSTcam. Vectors
pFtsH4(R)GSTcam were used to transform ΔftsH4, which has ~550bp of the ftsH4
ORF replaced with a kanamycin-resistance cassette (see section 4.1) and the resulting
mutants were named SynFtsH4(R)GSTcam. The pFtsH3(R)GSTcam vectors were
used to transform WT-G, to create SynFtsH3(R)GSTcam. The mutants were selected
for chloramphenicol resistance under low-light conditions on BG11 plates
supplemented with glucose, chloramphenicol and DCMU.
Table 4.3: List of mutants obtained.
FtsH2 N/A CM FtsH3 CM FtsH4 CM
Walker A K218A K207A √ K220A
Walker B E272Q √ E261Q E274Q √
SRH R329A R318A √ R333A √
ZnBD
(HEXGH)
H433L √ √ H423L √ H438L
E434Q √ E424Q E439Q √
ZnBD D511N √ √ D504N √ D515N √
Trx
control C266S √ C255S √ C268S √
Ticked box on the right of each mutation represents colonies being maintained, red
tick represents the genotype of the mutant is checked to be correct. In the first line of
boxes, N/A: mutant without selectable marker, CM: mutants confer chloramphenicol
resistance.
141
Among the 21 constructs made in this project, the screening of FtsH4
protease-inactive mutants was one of the top priorities as FtsH4 does not form
hetero-complexes (see section 3.1.4), hence the inactivation of FtsH4 complexes is
not subject to the residual activity from the other type of subunit. Four mutants
carrying designated mutations at C268, E274, R333 and E439 have been generated so
far with the DNA sequence of the resulting mutants confirmed via sequencing. Further
protein analysis using immunoblotting with anti-FtsH4 antibody showed the
FtsH4-GST fusion protein was intact, however, the expression level of the fusion
protein was much lower than that of wild-type, which is consistent with the previous
observations on SynFtsH4GFPcam strain, indicating the C-terminal tag affects the
accumulation of the protease (Figure 4.8).
Figure 4.8: Immunochemical detection of FtsH4(R)-GST recombinant proteins.
(A) Coomassie stained gel of membrane proteins from SynFtsH4(R)GSTcam mutants.
(B) Immunoblotting of the protein samples with antibodies specific to FtsH4.
142
4.3 Physiological influence of the C-terminal GST tag on FtsH
protease activity
As described in Chapter 3 (see section 3.2.4), the addition of a C-terminal GFP tag to
FtsH1, FtsH2 and FtsH4 did not alter the sensitivity of the mutants to light stress. In
contrast, addition of a GST tag to the C-terminus of FtsH3 led to increased
susceptibility to photoinhibition (see section 3.1.3). Immunoblotting analysis further
provided hints that the increased sensitivity might be attributed to the presence of the
C-terminal GST tag, whereas the FtsH3-GFP strain was not affected possibly due to
the cleavage of the GFP tag from the C-terminus (see section 3.2.3). As multiple types
of FtsH complex were identified in this work (see section 3.1.4), it is possible that the
functions of complexes with different composition might show functional overlap (see
section 5.1.1). To further examine the physiological influence of the C-terminal GST
tag of each FtsH homologue with reduced functional interference from other types of
FtsH complexes, the double deletion mutantΔftsH2ΔftsH4 was used as the recipient
strain instead of WT-G cells to construct double and triple mutants expressing
FtsH-GST derivative proteases.
4.3.1 Construction and phenotype analysis of the mutants
pFtsHxGSTery vectors (see section 3.1.1) was used to transform the FtsH2/4 null
mutant ΔftsH2ΔftsH4, yielding a triple mutant SynFtsH1GSTΔ24, and two double
mutants SynFtsH2GSTΔ4 and SynFtsH4GSTΔ2. The transformation was carried out
following the same procedure as described earlier (see section 3.1.1). Growth of the
resulting mutants was then compared to the wild-type and the parental strain
ΔftsH2ΔftsH4 under various light intensities.
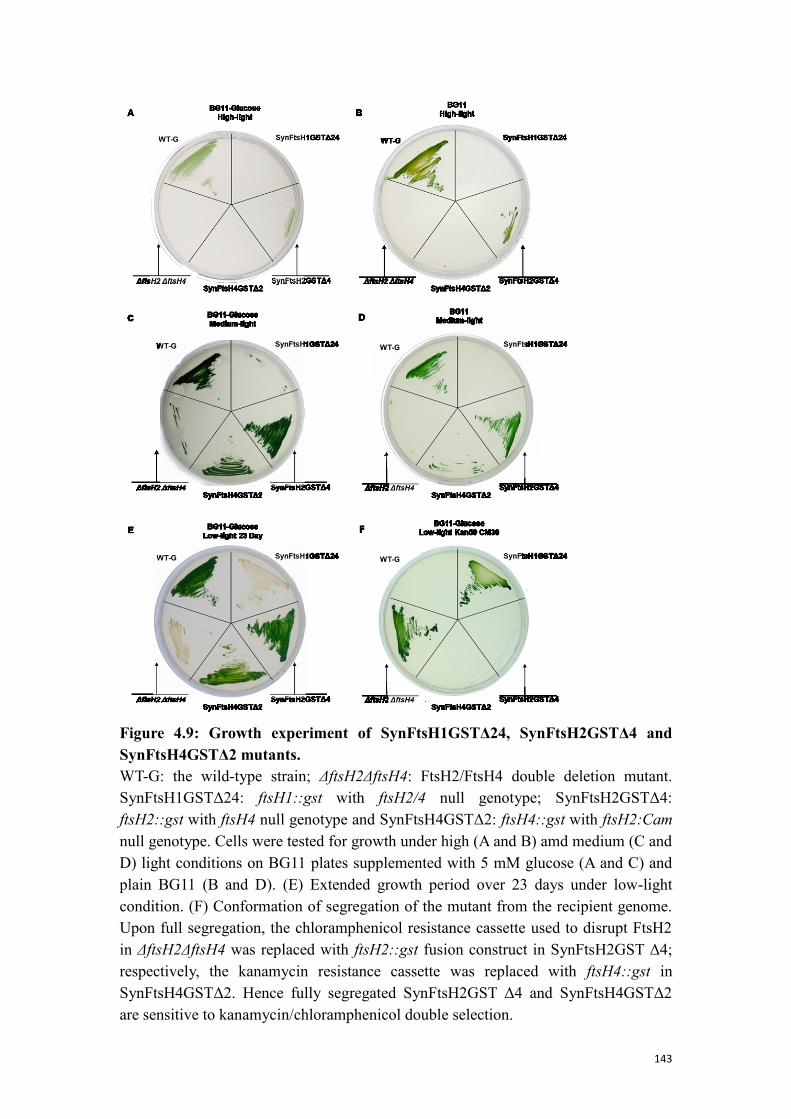
143
Figure 4.9: Growth experiment of SynFtsH1GSTΔ24, SynFtsH2GSTΔ4 and
SynFtsH4GSTΔ2 mutants.
WT-G: the wild-type strain; ΔftsH2ΔftsH4: FtsH2/FtsH4 double deletion mutant.
SynFtsH1GSTΔ24: ftsH1::gst with ftsH2/4 null genotype; SynFtsH2GSTΔ4:
ftsH2::gst with ftsH4 null genotype and SynFtsH4GSTΔ2: ftsH4::gst with ftsH2:Cam
null genotype. Cells were tested for growth under high (A and B) amd medium (C and
D) light conditions on BG11 plates supplemented with 5 mM glucose (A and C) and
plain BG11 (B and D). (E) Extended growth period over 23 days under low-light
condition. (F) Conformation of segregation of the mutant from the recipient genome.
Upon full segregation, the chloramphenicol resistance cassette used to disrupt FtsH2
in ΔftsH2ΔftsH4 was replaced with ftsH2::gst fusion construct in SynFtsH2GST Δ4;
respectively, the kanamycin resistance cassette was replaced with ftsH4::gst in
SynFtsH4GSTΔ2. Hence fully segregated SynFtsH2GST Δ4 and SynFtsH4GSTΔ2
are sensitive to kanamycin/chloramphenicol double selection.
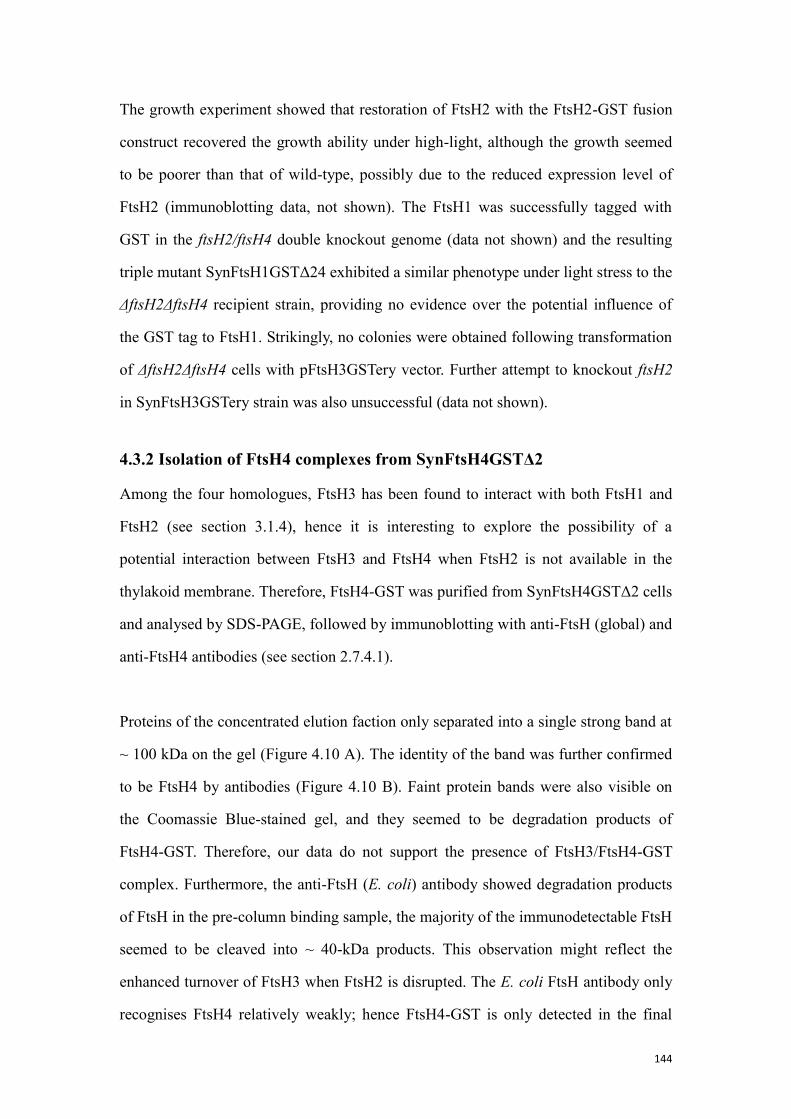
144
The growth experiment showed that restoration of FtsH2 with the FtsH2-GST fusion
construct recovered the growth ability under high-light, although the growth seemed
to be poorer than that of wild-type, possibly due to the reduced expression level of
FtsH2 (immunoblotting data, not shown). The FtsH1 was successfully tagged with
GST in the ftsH2/ftsH4 double knockout genome (data not shown) and the resulting
triple mutant SynFtsH1GSTΔ24 exhibited a similar phenotype under light stress to the
ΔftsH2ΔftsH4 recipient strain, providing no evidence over the potential influence of
the GST tag to FtsH1. Strikingly, no colonies were obtained following transformation
of ΔftsH2ΔftsH4 cells with pFtsH3GSTery vector. Further attempt to knockout ftsH2
in SynFtsH3GSTery strain was also unsuccessful (data not shown).
4.3.2 Isolation of FtsH4 complexes from SynFtsH4GSTΔ2
Among the four homologues, FtsH3 has been found to interact with both FtsH1 and
FtsH2 (see section 3.1.4), hence it is interesting to explore the possibility of a
potential interaction between FtsH3 and FtsH4 when FtsH2 is not available in the
thylakoid membrane. Therefore, FtsH4-GST was purified from SynFtsH4GSTΔ2 cells
and analysed by SDS-PAGE, followed by immunoblotting with anti-FtsH (global) and
anti-FtsH4 antibodies (see section 2.7.4.1).
Proteins of the concentrated elution faction only separated into a single strong band at
~ 100 kDa on the gel (Figure 4.10 A). The identity of the band was further confirmed
to be FtsH4 by antibodies (Figure 4.10 B). Faint protein bands were also visible on
the Coomassie Blue-stained gel, and they seemed to be degradation products of
FtsH4-GST. Therefore, our data do not support the presence of FtsH3/FtsH4-GST
complex. Furthermore, the anti-FtsH (E. coli) antibody showed degradation products
of FtsH in the pre-column binding sample, the majority of the immunodetectable FtsH
seemed to be cleaved into ~ 40-kDa products. This observation might reflect the
enhanced turnover of FtsH3 when FtsH2 is disrupted. The E. coli FtsH antibody only
recognises FtsH4 relatively weakly; hence FtsH4-GST is only detected in the final
145
purified fraction.
Figure 4.10: Isolation of FtsH4 complexes from SynFtsH4GSTΔ2.
(A) Detergent-solubilised thylakoid membranes from SynFtsH2GST before
chromatography (Pre-inc), the extract after binding to the glutathione resin (Post-inc),
and the fraction eluted by glutathione E and the final concentrated elution fraction [E]
were separated by SDS-PAGE and stained in Coomassie blue. (B) Analysis of the
column fractions by immunoblotting with antibodies specific for FtsH4 and E. coli
FtsH.
4.4 In vitro characterisation of FtsH homologues
Despite the many studies on cyanobacterial FtsH, there has been no rigorous
biochemical analysis of enzyme activity. To explore the NTP hydrolysis and
proteolytic activity of the FtsH proteases, in vitro assays (see section 2.7.5 and 2.7.6)
were used to examine the activity of FtsH proteases. Unfortunately, indigenous FtsH
complexes purified from SynFtsH(x)GSTery mutants failed to show significant
activity in the assays (data not shown). This was possibly due to the fact that the
reaction condition was not optimal and the membrane anchored complexes was not
stable in the detergent micelles.
The bottleneck to the optimisation of the in vitro assays was the insufficient supply of
146
the Synechocystis FtsH samples, due to its low abundance in the cells. To overcome
this problem, an E. coli over-expression system was developed to produce large
quantities of recombinant FtsH protease. Although the transmembrane domain of FtsH
was speculated to be beneficial to the oligomerisation of FtsH complexes (Kihara et al.
1998), it was not essential to the function and complex formation of some bacterial
FtsH (Suno et al. 2006). Therefore, to further reduce the challenges in protein
purification and in vitro assays, only the soluble cytosolic region of each FtsH
homologue, namely Δ(tm)FtsH, was expressed.
Although vectors expressing Synechocystis FtsH homologues were constructed (data
not shown), the work described in this study was more focused on the expression of T.
elongatus FtsH proteases. The focus on T. elongatus was mainly because of the
potential to conduct structural studies. To initiate the study, only FtsH2, FtsH3 and
FtsH4 from T. elongatus were expressed and tested in this project (Table 4.3). Proteins
from T. elongatus are more robust and thermostable, which make them highly suitable
for structural and biochemical studies. Due to time pressure, FtsH1 was not included
in this work because it seemed least likely to be involved in PSII repair, based on its
location within the cell (Figure 3.12 A).
4.4.1 Defining the FtsH homologues from Thermosynechococcus elongatus
As the model organism for physiological study of proteins involved in photosynthesis,
the four FtsH homologues in Synechocystis sp. PCC6803, ftsH1 (slr1390), ftsH2
(slr0228), ftsH3 (slr1604) and ftsH4 (sll1463), have been defined in previous studies
(Mann et al. 2000; Sokolenko et al. 2002). In contrast, although four FtsH
homologues, tll1832, tll0734, tll0131 and tlr0528 have been annotated in the
Thermosynechococcus elongatus genome, none of the four ORFs has been properly
defined. To clarify the evolutionary relationship between the FtsH homologues found
in T. elongatus with their orthologues in Synechocystis sp. PCC 6803, the phylogeny
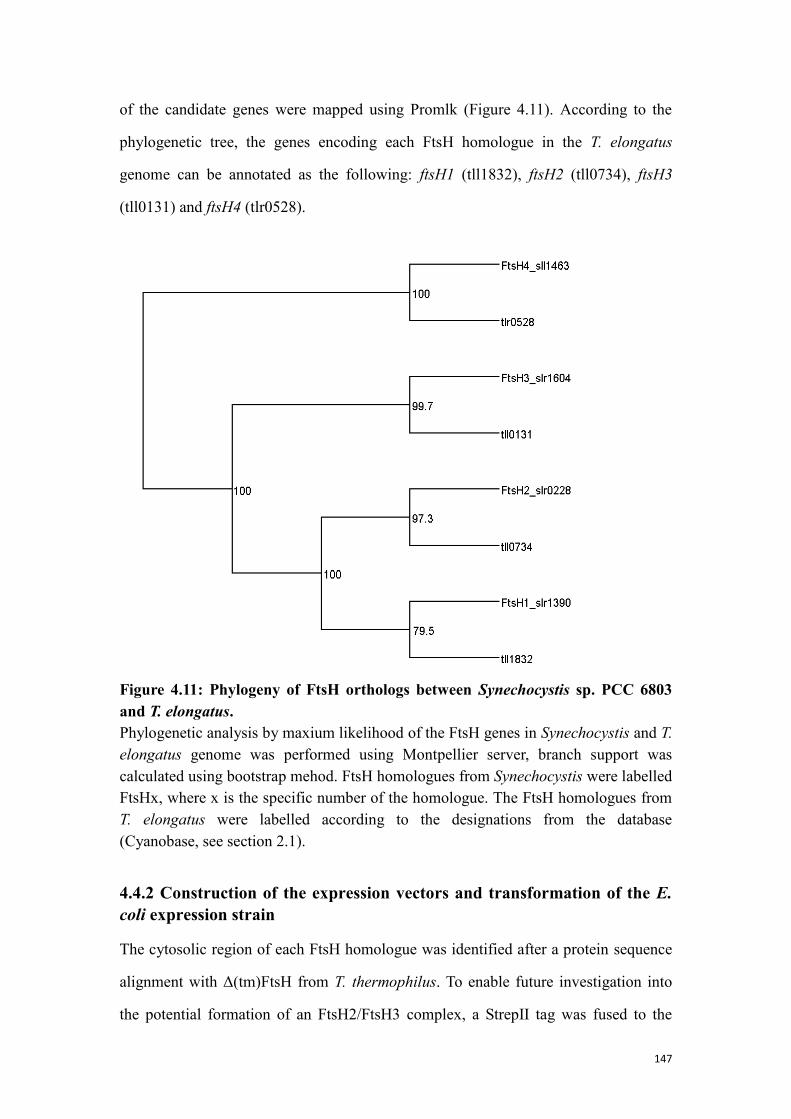
147
of the candidate genes were mapped using Promlk (Figure 4.11). According to the
phylogenetic tree, the genes encoding each FtsH homologue in the T. elongatus
genome can be annotated as the following: ftsH1 (tll1832), ftsH2 (tll0734), ftsH3
(tll0131) and ftsH4 (tlr0528).
Figure 4.11: Phylogeny of FtsH orthologs between Synechocystis sp. PCC 6803
and T. elongatus.
Phylogenetic analysis by maxium likelihood of the FtsH genes in Synechocystis and T.
elongatus genome was performed using Montpellier server, branch support was
calculated using bootstrap mehod. FtsH homologues from Synechocystis were labelled
FtsHx, where x is the specific number of the homologue. The FtsH homologues from
T. elongatus were labelled according to the designations from the database
(Cyanobase, see section 2.1).
4.4.2 Construction of the expression vectors and transformation of the E.
coli expression strain
The cytosolic region of each FtsH homologue was identified after a protein sequence
alignment with Δ(tm)FtsH from T. thermophilus. To enable future investigation into
the potential formation of an FtsH2/FtsH3 complex, a StrepII tag was fused to the
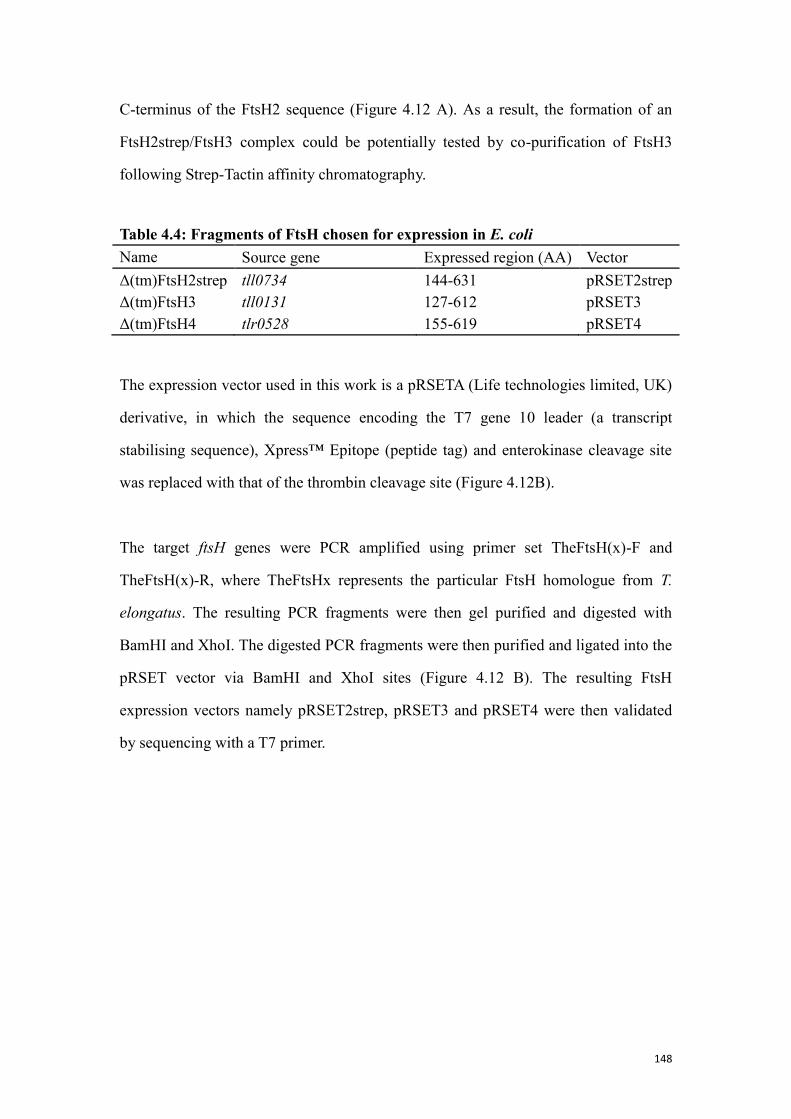
148
C-terminus of the FtsH2 sequence (Figure 4.12 A). As a result, the formation of an
FtsH2strep/FtsH3 complex could be potentially tested by co-purification of FtsH3
following Strep-Tactin affinity chromatography.
Table 4.4: Fragments of FtsH chosen for expression in E. coli
Name Source gene Expressed region (AA) Vector
Δ(tm)FtsH2strep tll0734 144-631 pRSET2strep
Δ(tm)FtsH3 tll0131 127-612 pRSET3
Δ(tm)FtsH4 tlr0528 155-619 pRSET4
The expression vector used in this work is a pRSETA (Life technologies limited, UK)
derivative, in which the sequence encoding the T7 gene 10 leader (a transcript
stabilising sequence), Xpress™ Epitope (peptide tag) and enterokinase cleavage site
was replaced with that of the thrombin cleavage site (Figure 4.12B).
The target ftsH genes were PCR amplified using primer set TheFtsH(x)-F and
TheFtsH(x)-R, where TheFtsHx represents the particular FtsH homologue from T.
elongatus. The resulting PCR fragments were then gel purified and digested with
BamHI and XhoI. The digested PCR fragments were then purified and ligated into the
pRSET vector via BamHI and XhoI sites (Figure 4.12 B). The resulting FtsH
expression vectors namely pRSET2strep, pRSET3 and pRSET4 were then validated
by sequencing with a T7 primer.
149
Figure 4.12: Construction of the cytosolic-FtsH expression vectors.
(A) A schematic representation of the cytosolic FtsH proteases expressed from the
vectors. (B) A plasmid map of the expression vector producing Δ(tm)FtsH2strep. The
vectors for FtsH3 and FtsH4 do not have the strepII tag at the 3’ end of the ftsH
sequence.
4.4.3 Expression and purification FtsH2, 3 and 4 fragments from E. coli
E. coli expression strain KRX (Promega, UK) was transformed with the FtsH
expression vectors. The recombinant FtsH proteins were induced with L-rhamnose
according to the induction protocol (see section 2.7.2.2). After overnight incubation at
18 oC, cells were harvested and the recombinant proteins were purified via nickel
affinity chromatography (see section 2.7.2.2). Samples from each fraction during the
purification procedure were collected and analysed on 10 % SDS-PAGE gels (Figure
4.13).
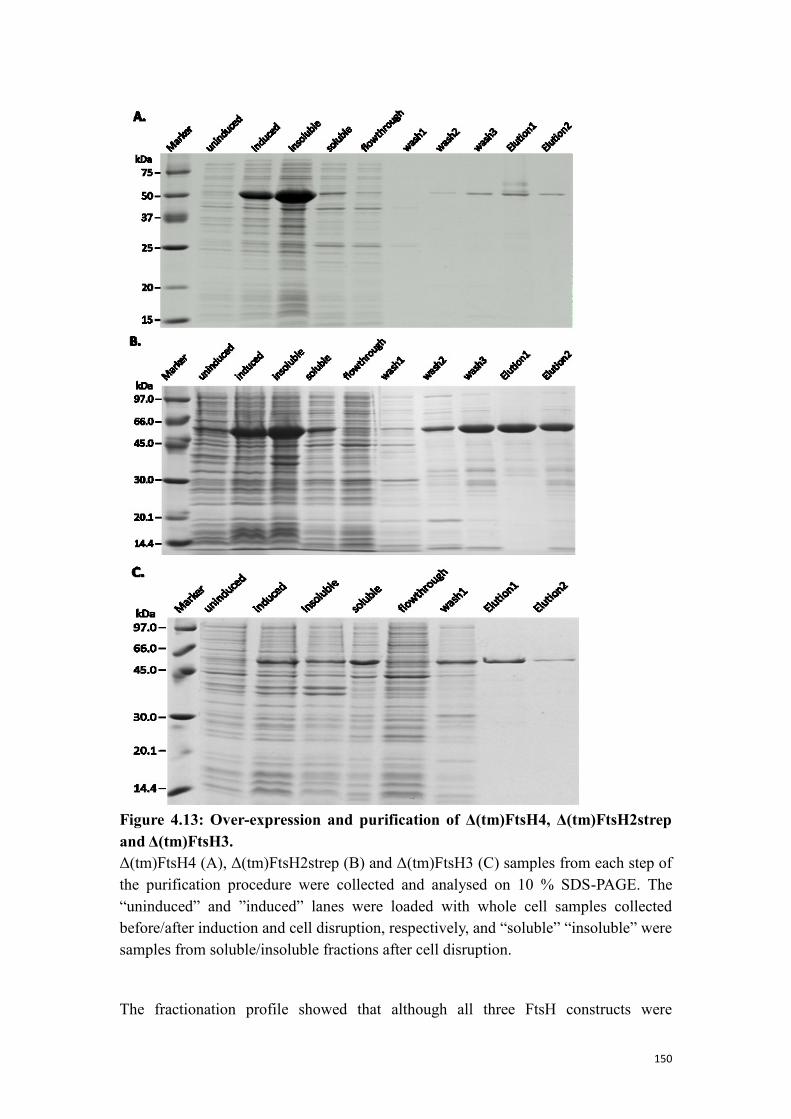
150
Figure 4.13: Over-expression and purification of Δ(tm)FtsH4, Δ(tm)FtsH2strep
and Δ(tm)FtsH3.
Δ(tm)FtsH4 (A), Δ(tm)FtsH2strep (B) and Δ(tm)FtsH3 (C) samples from each step of
the purification procedure were collected and analysed on 10 % SDS-PAGE. The
“uninduced” and ”induced” lanes were loaded with whole cell samples collected
before/after induction and cell disruption, respectively, and “soluble” “insoluble” were
samples from soluble/insoluble fractions after cell disruption.
The fractionation profile showed that although all three FtsH constructs were
151
successfully expressed, a large amount of the recombinant protein was found in the
insoluble fraction, which might due to the formation of inclusion bodies under
sub-optimal induction condition. Nevertheless, the elution profile of Δ(tm)FtsH2strep,
Δ(tm)FtsH3 and Δ(tm)FtsH4 showed that the three recombinant FtsH proteases were
successfully induced and purified (Figure 4.13). The purified recombinant proteins in
the elution lane were relatively pure and matched the theoretical masses of 52.27 kDa
for Δ(tm)FtsH4, 55.93 kDa for Δ(tm)FtsH2strep and 55 kDa for Δ(tm)FtsH3. The
eluates were subsequently concentrated and tested for NTPase and protease activities.
4.4.4 NTPase activity of Δ(tm)FtsH4, Δ(tm)FtsH2strep and Δ(tm)FtsH3
FtsH proteases have been reported to utilise diverse nucleoside-5’-triphosphate for
proteolytic activities (Bruckner et al. 2003). To further investigate the nucleotide
specificity of the AAA+ domain in our FtsH constructs, four nucleotides ATP, GTP,
CTP and UTP were tested. Data from the NTP hydrolysis assay showed that the
activity of Δ(tm)FtsH4 was in general much higher than the other two proteases and
capable of hydrolysing both ATP and CTP. The hydrolysis rate of CTP by Δ(tm)FtsH2
was also comparatively high, in fact CTP seemed to be the most favourable nucleotide
among the four (Figure 4.14 A). A negative control using His-tagged Psb28, a known
PSII assembly factor, purified from the same expression strain according to the same
procedure gave an ATPase activity of approximately 20% of the ATP only control
(data not shown).
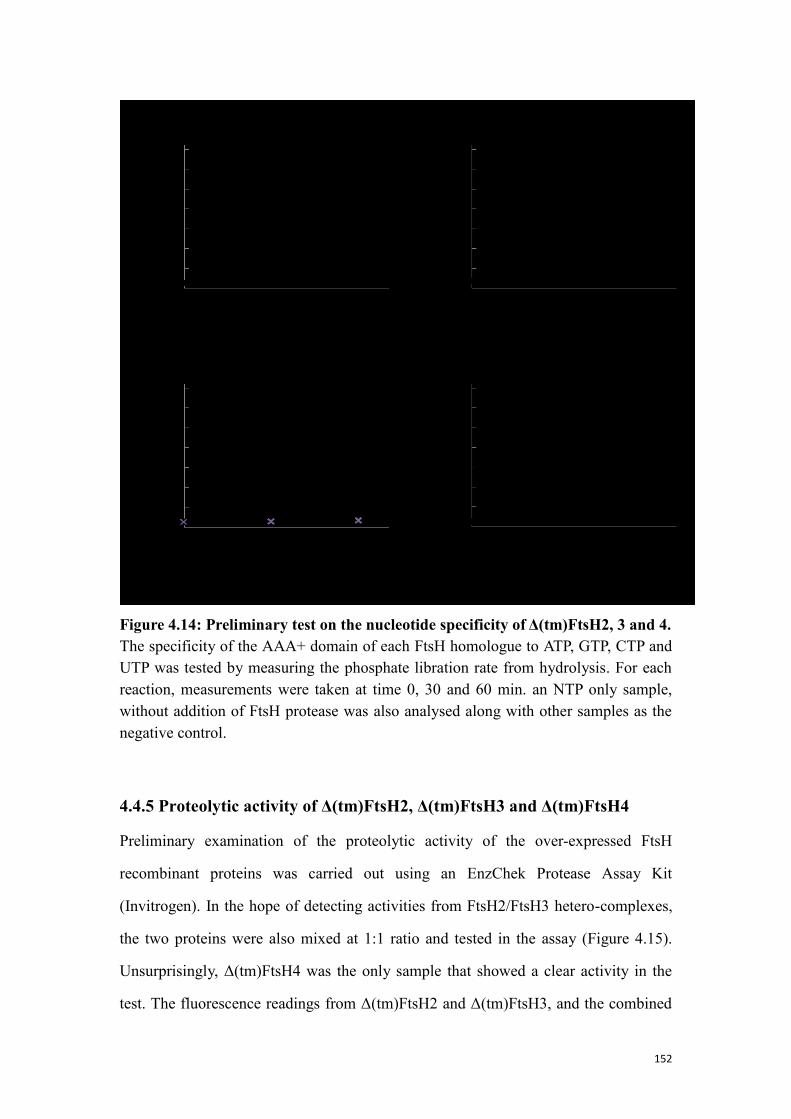
152
Figure 4.14: Preliminary test on the nucleotide specificity of Δ(tm)FtsH2, 3 and 4.
The specificity of the AAA+ domain of each FtsH homologue to ATP, GTP, CTP and
UTP was tested by measuring the phosphate libration rate from hydrolysis. For each
reaction, measurements were taken at time 0, 30 and 60 min. an NTP only sample,
without addition of FtsH protease was also analysed along with other samples as the
negative control.
4.4.5 Proteolytic activity of Δ(tm)FtsH2, Δ(tm)FtsH3 and Δ(tm)FtsH4
Preliminary examination of the proteolytic activity of the over-expressed FtsH
recombinant proteins was carried out using an EnzChek Protease Assay Kit
(Invitrogen). In the hope of detecting activities from FtsH2/FtsH3 hetero-complexes,
the two proteins were also mixed at 1:1 ratio and tested in the assay (Figure 4.15).
Unsurprisingly, Δ(tm)FtsH4 was the only sample that showed a clear activity in the
test. The fluorescence readings from Δ(tm)FtsH2 and Δ(tm)FtsH3, and the combined
153
sample were slightly higher than that of His-tagged Psb28, hence minor activity from
these samples still cannot be excluded. Moreover, previous studies showed the
activity of FtsH from E. coli is highly dependent on oligomerisation (Kihara et al
1998). In this experiment, the combined Δ(tm)FtsH2 and Δ(tm)FtsH3 sample did not
show improved activity, possibly because inducing oligomerisation of FtsH might not
be straightforward.
Figure 4.15: A fluorescence-based quantitative protease assay trial.
The proteolytic activity of each FtsH homologue was assessed according to the
degradation rate of the casein substrate. In addition to Δ(tm)FtsH2, Δ(tm)FtsH3 and
Δ(tm)FtsH4, recombinant Psb28 expressed and purified using the same expression
system was also included in this experiment as negative control of contamination of E.
coli proteases. To explore the potential oligomerisation of active FtsH2/FtsH3
complex in vitro, a sample containing equal amount of Δ(tm)FtsH2, Δ(tm)FtsH3 was
also prepared and analysed.
4.5 Discussion
4.5.1 The dispensability of subunits within FtsH hetero-complex
Previous work has shown that the FtsH hetero-complexes residing in the thylakoid
membrane of A. thaliana are still capable of participating in the PSII repair process
when the protease activity, but not the AAA+ domain, of the Type B subunit is
inactivated (Zhang et al. 2010). To test whether the FtsH2/FtsH3 hetero-complex in
cyanobacteria also exhibited a similar characteristic, similar mutations were generated
in the Type B-like homologue FtsH2, and the resulting mutants were selected for
154
growth under high-light conditions. Among the 7 designed mutations, only 4 mutants
were able to grow after transformation, including the three mutations at the zinc
ion-binding residues and the cysteine that proposed to play a role in thioredoxin
control. None of the three mutations designed to disrupt ATP hydrolysis were able to
restore photoautotrophic growth at high light. These mutants have subsequently been
isolated by introducing a GST tagging cassette and selecting with antibiotics (data not
shown). Therefore, the current data suggest that the proteolytic activity of FtsH2 in
the FtsH2/FtsH3 complex is not essential for D1 degradation function. Presumably the
proteolytic activity still present in the FtsH3 subunit confers sufficient activity to the
FtsH2/FtsH3 complex to allow growth at high light. In contrast, the AAA+ domain of
FtsH2 appears to play a much more important role for the function of the complex.
It is still unclear whether inactivating the protease domain of FtsH3 but not FtsH2
would impair D1 degradation. It is conceivable that FtsH3 plays a more important
proteolytic role in the degradation of substrates in the hetero-complex, at least the
degradation of D1. It cannot be ruled out that the function of FtsH2, and perhaps the
other type B-like homologue, FtsH1, might mainly be to act as a molecular scaffold to
stabilise FtsH3 and to assist the ATP-dependent proteolytic activities. Similar
complexes that consist of inactivated FtsH subunits are naturally present in the
chloroplast envelope of A. thaliana, where FtsH12 forms complexes with FtsHi, an
FtsH sub-family that lacks the zinc ion binding motif. The partially inactive
FtsH12/FtsHi complexes are essential for embryogenesis in plants (Wagner et al.
2012). Conceivably, formation of some FtsH hetero-complexes might have evolved
for better substrate specificity, at the expense of maximal proteolytic activity.
4.5.2 Effect of C-terminal GST tag on FtsH function
C-terminal GST/ GFP tags have been fused to each of the four FtsH homologues in
the WT-G Synechocystis strain and the growth of the resulting mutants was then
155
assessed under a range of illumination intensities. Firstly, we showed that the addition
of the C-terminal GST or GFP tag did not cause lethality, hence the tag did not abolish
the function of FtsH1 or FtsH3 completely. On the other hand, mutant
SynFtsH3GSTery, which expresses the FtsH3-GST fusion protein, exhibited increased
sensitivity to light and was unable to grow under strong illumination (Figure 3.3). The
degree of the sensitivity was similar to that of the FtsH2 null mutant (Figure 4.5).
Since the FtsH2/FtsH3 hetero-complexes are responsible for maintenance of PSII
activity under light stress (Boehm et al. 2012), it is conceivable that the PSII repair
function of the FtsH2/3 complexes was impaired by addition of the GST tag at the
C-terminus of FtsH3. Further attempts to construct an FtsH2 null mutant that
expressed GST-tagged FtsH3 derivative failed to yield colonies after transformation.
Three approaches were tried: either introducing ftsH3::gst construct into ΔftsH2 and
ΔftsH2ΔftsH4, then disrupting ftsH2 in SynFtsH3GSTery; all proved unsuccessful (see
section 4.3.1). Therefore, it seems the genotype is lethal to cell viability. Disruption of
ftsH2 destabilises and prohibits the accumulation of FtsH3 in the thylakoid
membranes (Boehm et al. 2012), hence the lethality of the ΔftsH2/ftsH3::gst genotype
should be attributed to the functionally impaired FtsH1/FtsH3 complexes, or effects
on the expression of FtsH3.
In contrast, the GST tag fused to the C-termini of FtsH1 and FtsH2 seemed not to
affect drastically the growth phenotype of the resulting mutants. The phenotype of
SynFtsH1GSTΔ24, presumably only expressing FtsH1GST/FtsH3 complexes, was
comparable to that of the recipient ΔftsH2ΔftsH4 strain. Together, the presence of a
GST or GFP tag at the C-terminal of the Type B-like FtsH subunits seemed to not
affect the major function of the complexes. Considering the diverse cellular activities
that FtsH proteases play, the possibility that some minor functions of the FtsH
hetero-complexes might be interrupted by the C-terminal tag on Type B-like subunits
cannot be rule out at this stage.
156
FtsH4 is the only FtsH subunit in Synechocystis that did not show any detectable
interaction with other homologues, and also the only one that did not show
distinguishable phenotype upon disruption. Hence it remains unclear whether the GST
and GFP tagged FtsH4 fusion proteins are functional in vivo or not. The
immunoblotting data have consistently showed drastic reduction of the FtsH4 level in
the mutant strains compared to wild-type (Figure 3.9 and 4.8), which might be a sign
of functional disruption of the complexes causing enhanced instability in the
membrane. Alternatively, the effect might simply reflect effects on transcript
abundance due to the destabilising effect of the antibiotic-resistance cassette on the 3’
region of the transcript.
4.5.3 Types of FtsH complex in the thylakoid membranes
FtsH proteases play an important house-keeping role in maintaining the quality of
membrane proteins. Proteins embedded in the thylakoid membranes are maintained by
three FtsH homologues, FtsH2, FtsH3 and FtsH4 (see section 3.2.5 and 3.2.6).
Preliminary studies showed FtsH2 and FtsH3 form hetero-complexes that play a
dominant role in D1 degradation. However, mutants lacking FtsH2 were also viable
for photoautotrophic growth under low-light conditions. Taken into account that D1 is
a short-lived membrane protein which undergoes irreversible damage even under
low-light conditions, it is likely that additional proteolytic systems capable of D1
removal exist. The FtsH2/FtsH4 double deletion mutant generated in this work
displayed increased sensitivity to light stress compare to the FtsH2 single deletion
mutant (see section 4.1.5), which raised speculation that FtsH4 homo-complexes
might also contribute to PSII repair, albeit, only play a minor role or an indirect one.
In human mitochondria, FtsH can form both homo and hetero-complexes (Koppen et
al. 2007), which raises the possibility that potentially FtsH4 could form a
hetero-complex with FtsH3 in the absence of FtsH2. To test this theory, the
157
composition of FtsH4 complexes from SynFtsH4GSTΔ2 was examined, as the
potential interaction between FtsH3 and FtsH4 should be enhanced when the major
competitor FtsH2 is missing in this strain. The results showed no evidence for
co-purification of other types of FtsH with FtsH4. Therefore, the current data still
favour functional overlap between FtsH4 and FtsH2/FtsH3 complexes or a indirect
role for FtsH4 to aid D1 degradation. Furthermore, the FtsH2/FtsH4 double deletion
mutant is still capable of photoautotrophic growth. The underlying maintenance
mechanisms are still to be elucidated. In addition a notable phenotype observed with
the double mutant was enhanced senescence under low light (Figure 4.9).
4.5.3 Nucleotides hydrolysis and proteolytic activity of Δ(tm)FtsH4,
Δ(tm)FtsH2 and Δ(tm)FtsH3
The cytosolic domains of FtsH2, FtsH3 and FtsH4 were cloned and expressed in E.
coli, with the aim to provide activity data for cyanobacterial FtsH proteases. The
activity of FtsH includes hydrolysis of nucleotides in the AAA+ domain and
processing of protein substrates through the Zn2+
-binding motif. According to one
current model, which were established on the basis of the crystal structure of FtsH
from T. thermophilus (Suno et al. 2006) and supported by in vivo assays (Zhang et al.
2010), the hydrolysis of a nucleotide in the AAA+ domain requires synergetic
movement between neighbouring protomers in the hexameric complex. However, an
individual subunit can also hydrolyse NTP in an inefficient manner. Our results
showed NTPase activities from all three FtsH proteases, of which, FtsH4 displayed a
much higher activity than the other two. The striking difference might reflect the
potential presence of some complex formation in the FtsH4 sample. However, it is
noteworthy that the rate of nucleotide hydrolysis was extremely low, even that of
FtsH4 comparing to other bacterial FtsH presented in the literature (Suno et al. 2006).
Studies on E. coli FtsH have shown that the AAA+ domain of FtsH is rather
unspecific to substrates, in particular, CTP was also a favourable nucleotide in in
vitro assays (Bruckner et al. 2003). Our data is largely in line with this conclusion, as
158
the hydrolysis rate of CTP was even higher than that of ATP. Only FtsH4 was able to
degrade the casein substrates in the protease assay. The other FtsH proteases,
including a sample with FtsH2 and FtsH3 combined did not yield any activity,
possibly because heterocomplex formation was unsuccessful. The trans-membrane
domain of E. coli FtsH is important for complex formation, however, cytosolic
domains of FtsH from T. thermophilus can form hetero-complexes without the
trans-membrane region. Therefore, the necessity of N-terminal truncation for
oligomerisation is dependent on the characteristic of each complex and so we cannot
exclude the possibility that only full-length FtsH2 and FtsH3 from cyanobacteria can
form a complex. The ability to isolate soluble fragments of FtsH from T. elongatus
demonstrated here paves the way for more detailed structural studies on
cyanobacterial FtsH.
159
Chapter 5: Probing physiological function and
regulatory mechanisms of FtsH in Synechocystis
5.1 Identification of potential substrates and auxiliary proteins
Very little is known about the substrate specificity of the FtsH complexes in
Synechocystis 6803 and the proteins with which they interact. FtsH in E. coli has been
found to form supercomplexes with members of the Band 7 superfamily and to bind
to YccA (reviewed by Ito and Akiyama 2005). Therefore, we explored the potential
substrates and auxiliary proteins of FtsH in Synechocystis by analysing the identity of
proteins that co-purified with each FtsH-GST derivative (see section 5.1.1). A range of
proteins was identified in each FtsH sample, among which, both prohibitin and a
cyanobacterial homologue of YccA were detected in the FtsH2 and FtsH3 samples.
Interestingly, a homologue of the Arabidopsis ethylene-dependent
gravitropism-deficient and yellow-green-like 2 protein (EGY2), encoded by sll0862,
was also co-purified with FtsH2 and FtsH3. EGY2 is one of the few metalloproteases
involved in intramembrane proteolysis in A. thaliana and contributes to fatty acid
biosynthesis (Chen et al. 2012). Preliminary work to characterise the function of the
Synechocystis EGY2 and YccA homologues was also performed in this study (see
section 5.1.2). In addition, I have investigated whether Psb29 might also play a role in
controlling the expression level of FtsH proteases in Synechocystis as previous work
in Arabidopsis has made such a link.
5.1.1 Potential substrates/auxiliary proteins co-purified with FtsH
proteases
To elucidate the potential binding partners and substrates of FtsH complexes, proteins
co-purified with each FtsH-GST construct were analysed via peptide mass
fingerprinting (PMF); this work was carried out in collaboration with Prof. Michael
Hippler, University of Münster.
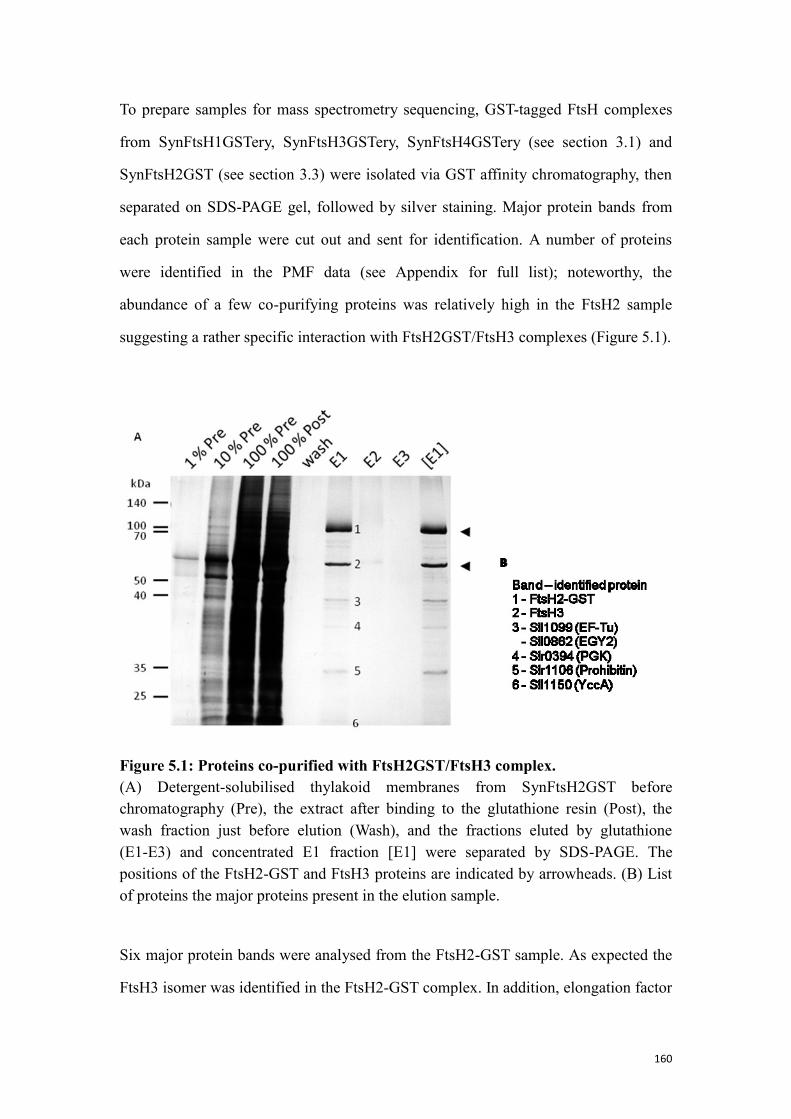
160
To prepare samples for mass spectrometry sequencing, GST-tagged FtsH complexes
from SynFtsH1GSTery, SynFtsH3GSTery, SynFtsH4GSTery (see section 3.1) and
SynFtsH2GST (see section 3.3) were isolated via GST affinity chromatography, then
separated on SDS-PAGE gel, followed by silver staining. Major protein bands from
each protein sample were cut out and sent for identification. A number of proteins
were identified in the PMF data (see Appendix for full list); noteworthy, the
abundance of a few co-purifying proteins was relatively high in the FtsH2 sample
suggesting a rather specific interaction with FtsH2GST/FtsH3 complexes (Figure 5.1).
Figure 5.1: Proteins co-purified with FtsH2GST/FtsH3 complex.
(A) Detergent-solubilised thylakoid membranes from SynFtsH2GST before
chromatography (Pre), the extract after binding to the glutathione resin (Post), the
wash fraction just before elution (Wash), and the fractions eluted by glutathione
(E1-E3) and concentrated E1 fraction [E1] were separated by SDS-PAGE. The
positions of the FtsH2-GST and FtsH3 proteins are indicated by arrowheads. (B) List
of proteins the major proteins present in the elution sample.
Six major protein bands were analysed from the FtsH2-GST sample. As expected the
FtsH3 isomer was identified in the FtsH2-GST complex. In addition, elongation factor
161
(EF-Tu) and phosphoglycerate kinase (PGK), both soluble components, were
identified. These results indicated that the FtsH2-GST/FtsH3 complex might play a
role in regulation of translation and glycolysis. Prohibitin or Band 7 homologues have
been shown to form complexes with bacterial and mitochondrial FtsH (Steglich et al.
1999; Van Aken et al. 2007), possibly to help stabilise the complex (Janska et al.
2013). A prohibitin homologue (Slr1106) was also found in the sample, hence a
similar regulatory interaction between FtsH and prohibitin might also be present in the
cyanobacterial system. A homologue of YccA, which is known to be a substrate and
also an auxiliary binding partner of FtsH in E. coli (Kihara et al. 1998), was also
identified in the eluate. Recent work has suggested that YccA might down-regulate
the activity of FtsH in E. coli (van Stelten et al. 2009). Surprisingly, the homologue of
Arabidopsis EGY2, encoded by sll0862, was also co-purified with FtsH2, and its
interaction with FtsH3-GST was also confirmed (see Appendix). EGY2 belongs to the
Site-2 protease (S2P) family and is one of the few intra-membrane proteases localised
in the chloroplast thylakoid membrane. It also features a Zn2+
-binding motif in the
peptidase domain and is capable of degrading casein substrate in an ATP
hydrolysis-independent manner (Chen et al. 2012). An interesting point is that the
proteolytic site of Sll0862 is likely to be within the membrane, whereas its FtsH
counterpart is in the cytoplasm. This raises the interesting possibility that Sll0862
might co-operate with FtsH complexes to help remove recalcitrant substrates from the
membrane.
5.1.2 Probing the function of Sll0862 and Sll1150
5.1.2.1 Construction of sll0862 null mutants
The entire ORF of sll0862 was removed from the genome and replaced by an
antibiotic-resistance cassette. To achieve the goal, a deletion vector was constructed in
two steps. First, two flanking sequences, 445 bp upstream and 555 bp downstream of
the sll0862 ORF were joined together via overlap extension PCR using primer set
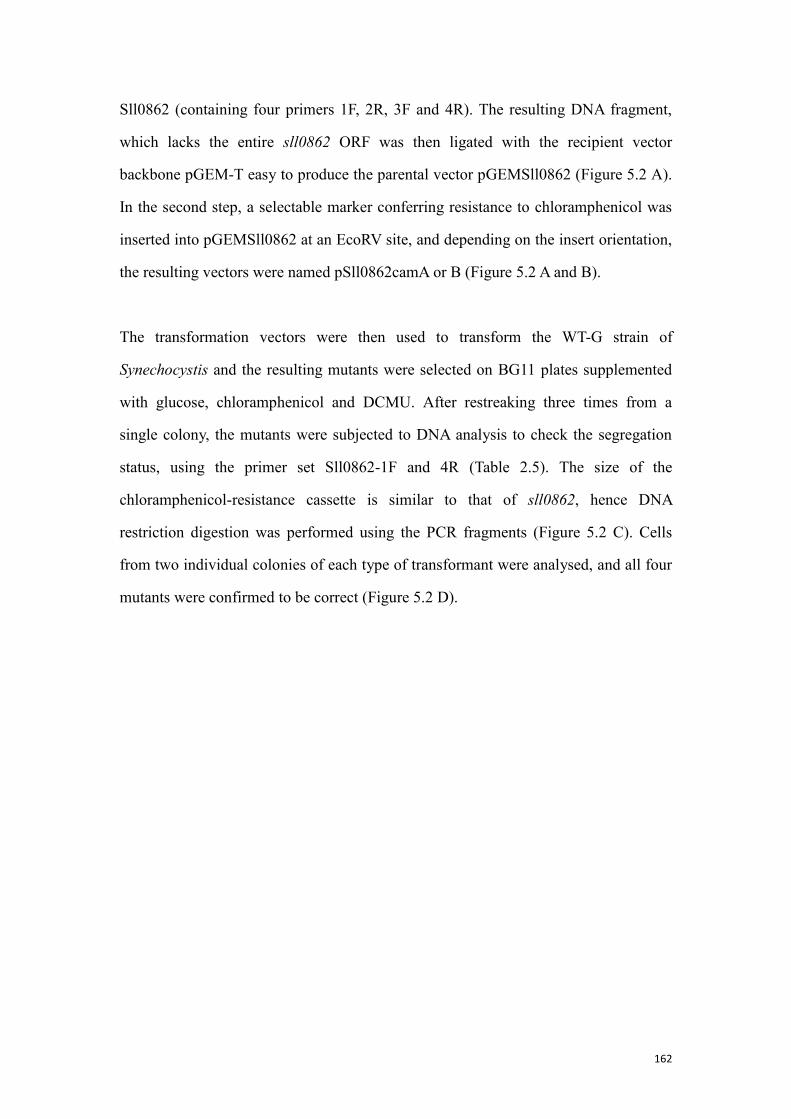
162
Sll0862 (containing four primers 1F, 2R, 3F and 4R). The resulting DNA fragment,
which lacks the entire sll0862 ORF was then ligated with the recipient vector
backbone pGEM-T easy to produce the parental vector pGEMSll0862 (Figure 5.2 A).
In the second step, a selectable marker conferring resistance to chloramphenicol was
inserted into pGEMSll0862 at an EcoRV site, and depending on the insert orientation,
the resulting vectors were named pSll0862camA or B (Figure 5.2 A and B).
The transformation vectors were then used to transform the WT-G strain of
Synechocystis and the resulting mutants were selected on BG11 plates supplemented
with glucose, chloramphenicol and DCMU. After restreaking three times from a
single colony, the mutants were subjected to DNA analysis to check the segregation
status, using the primer set Sll0862-1F and 4R (Table 2.5). The size of the
chloramphenicol-resistance cassette is similar to that of sll0862, hence DNA
restriction digestion was performed using the PCR fragments (Figure 5.2 C). Cells
from two individual colonies of each type of transformant were analysed, and all four
mutants were confirmed to be correct (Figure 5.2 D).
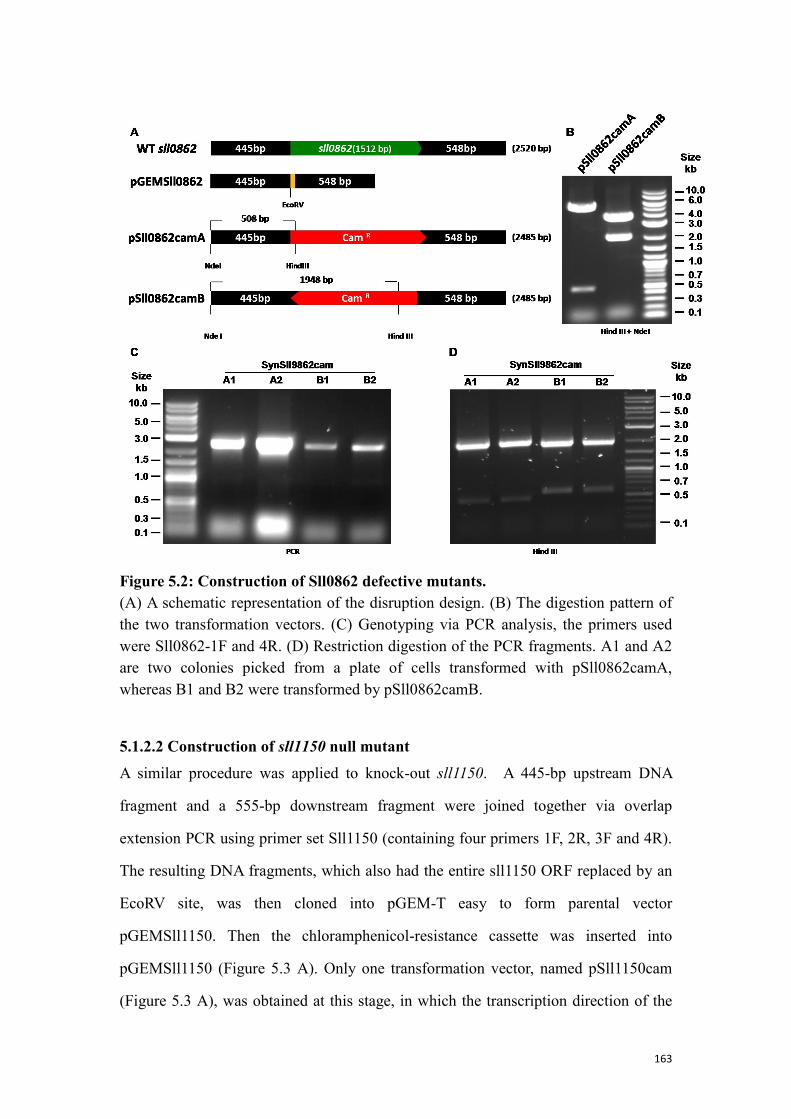
163
Figure 5.2: Construction of Sll0862 defective mutants.
(A) A schematic representation of the disruption design. (B) The digestion pattern of
the two transformation vectors. (C) Genotyping via PCR analysis, the primers used
were Sll0862-1F and 4R. (D) Restriction digestion of the PCR fragments. A1 and A2
are two colonies picked from a plate of cells transformed with pSll0862camA,
whereas B1 and B2 were transformed by pSll0862camB.
5.1.2.2 Construction of sll1150 null mutant
A similar procedure was applied to knock-out sll1150. A 445-bp upstream DNA
fragment and a 555-bp downstream fragment were joined together via overlap
extension PCR using primer set Sll1150 (containing four primers 1F, 2R, 3F and 4R).
The resulting DNA fragments, which also had the entire sll1150 ORF replaced by an
EcoRV site, was then cloned into pGEM-T easy to form parental vector
pGEMSll1150. Then the chloramphenicol-resistance cassette was inserted into
pGEMSll1150 (Figure 5.3 A). Only one transformation vector, named pSll1150cam
(Figure 5.3 A), was obtained at this stage, in which the transcription direction of the
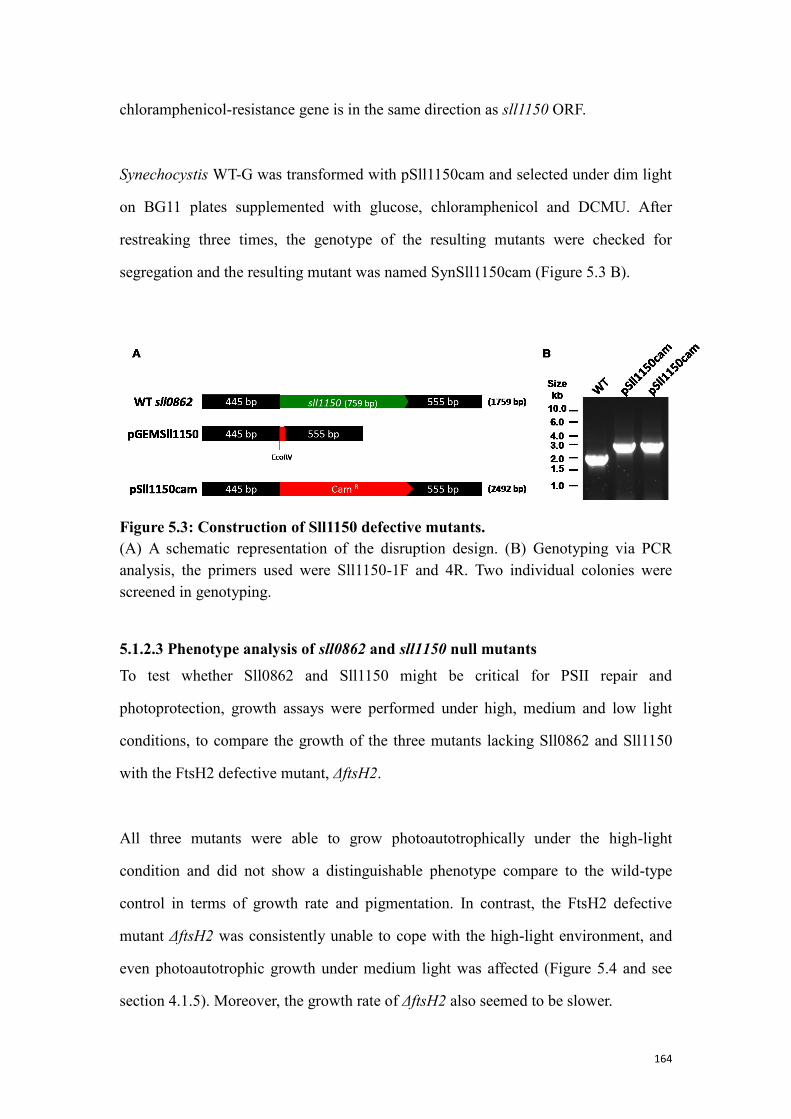
164
chloramphenicol-resistance gene is in the same direction as sll1150 ORF.
Synechocystis WT-G was transformed with pSll1150cam and selected under dim light
on BG11 plates supplemented with glucose, chloramphenicol and DCMU. After
restreaking three times, the genotype of the resulting mutants were checked for
segregation and the resulting mutant was named SynSll1150cam (Figure 5.3 B).
Figure 5.3: Construction of Sll1150 defective mutants.
(A) A schematic representation of the disruption design. (B) Genotyping via PCR
analysis, the primers used were Sll1150-1F and 4R. Two individual colonies were
screened in genotyping.
5.1.2.3 Phenotype analysis of sll0862 and sll1150 null mutants
To test whether Sll0862 and Sll1150 might be critical for PSII repair and
photoprotection, growth assays were performed under high, medium and low light
conditions, to compare the growth of the three mutants lacking Sll0862 and Sll1150
with the FtsH2 defective mutant, ΔftsH2.
All three mutants were able to grow photoautotrophically under the high-light
condition and did not show a distinguishable phenotype compare to the wild-type
control in terms of growth rate and pigmentation. In contrast, the FtsH2 defective
mutant ΔftsH2 was consistently unable to cope with the high-light environment, and
even photoautotrophic growth under medium light was affected (Figure 5.4 and see
section 4.1.5). Moreover, the growth rate of ΔftsH2 also seemed to be slower.

165
In summary, the growth assays showed that growth of mutants lacking Sll0862 and
Sll1150 at high irradiances was not drastically affected, hence the function of FtsH2
was not drastically impaired by the respective mutations. Nevertheless, these data are
insufficiently sophisticated to exclude a possible role of Sll0862 and Sll1150 in FtsH
function. The physiological functions of Sll0862 and Sll1150 also remain unclear as
the mutants exhibited wild-type-like phenotype under the tested conditions.
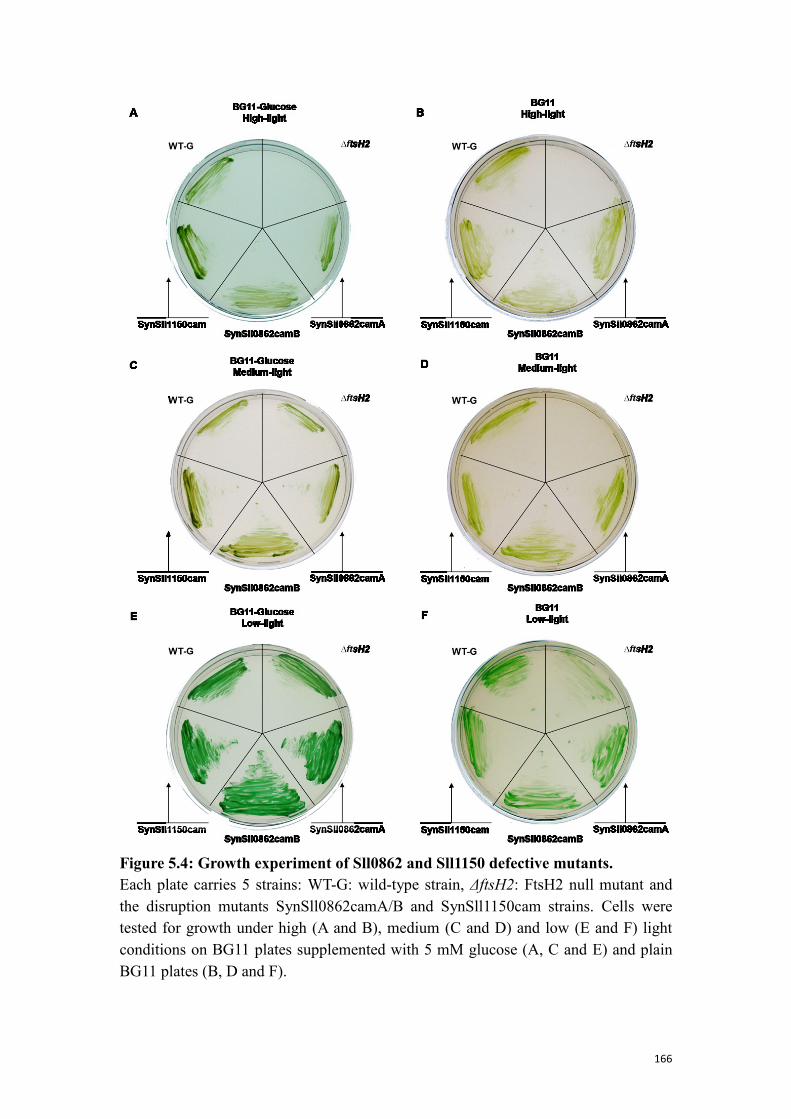
166
Figure 5.4: Growth experiment of Sll0862 and Sll1150 defective mutants.
Each plate carries 5 strains: WT-G: wild-type strain, ΔftsH2: FtsH2 null mutant and
the disruption mutants SynSll0862camA/B and SynSll1150cam strains. Cells were
tested for growth under high (A and B), medium (C and D) and low (E and F) light
conditions on BG11 plates supplemented with 5 mM glucose (A, C and E) and plain
BG11 plates (B, D and F).
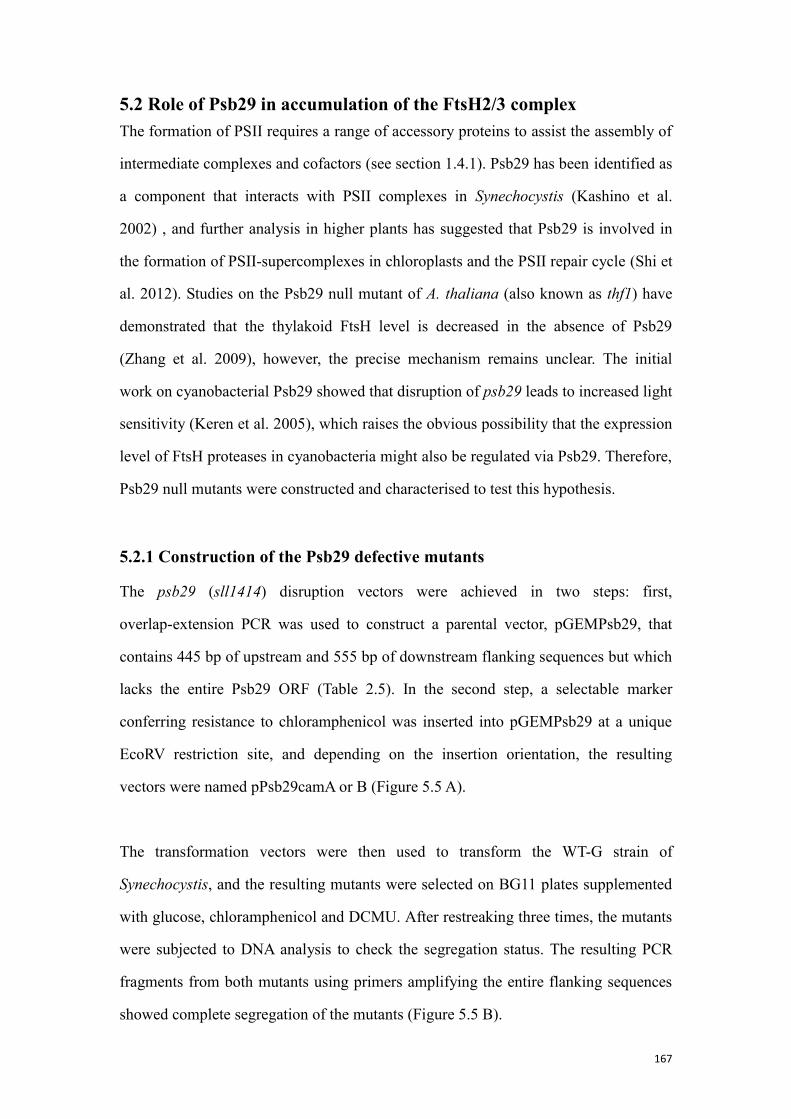
167
5.2 Role of Psb29 in accumulation of the FtsH2/3 complex
The formation of PSII requires a range of accessory proteins to assist the assembly of
intermediate complexes and cofactors (see section 1.4.1). Psb29 has been identified as
a component that interacts with PSII complexes in Synechocystis (Kashino et al.
2002) , and further analysis in higher plants has suggested that Psb29 is involved in
the formation of PSII-supercomplexes in chloroplasts and the PSII repair cycle (Shi et
al. 2012). Studies on the Psb29 null mutant of A. thaliana (also known as thf1) have
demonstrated that the thylakoid FtsH level is decreased in the absence of Psb29
(Zhang et al. 2009), however, the precise mechanism remains unclear. The initial
work on cyanobacterial Psb29 showed that disruption of psb29 leads to increased light
sensitivity (Keren et al. 2005), which raises the obvious possibility that the expression
level of FtsH proteases in cyanobacteria might also be regulated via Psb29. Therefore,
Psb29 null mutants were constructed and characterised to test this hypothesis.
5.2.1 Construction of the Psb29 defective mutants
The psb29 (sll1414) disruption vectors were achieved in two steps: first,
overlap-extension PCR was used to construct a parental vector, pGEMPsb29, that
contains 445 bp of upstream and 555 bp of downstream flanking sequences but which
lacks the entire Psb29 ORF (Table 2.5). In the second step, a selectable marker
conferring resistance to chloramphenicol was inserted into pGEMPsb29 at a unique
EcoRV restriction site, and depending on the insertion orientation, the resulting
vectors were named pPsb29camA or B (Figure 5.5 A).
The transformation vectors were then used to transform the WT-G strain of
Synechocystis, and the resulting mutants were selected on BG11 plates supplemented
with glucose, chloramphenicol and DCMU. After restreaking three times, the mutants
were subjected to DNA analysis to check the segregation status. The resulting PCR
fragments from both mutants using primers amplifying the entire flanking sequences
showed complete segregation of the mutants (Figure 5.5 B).
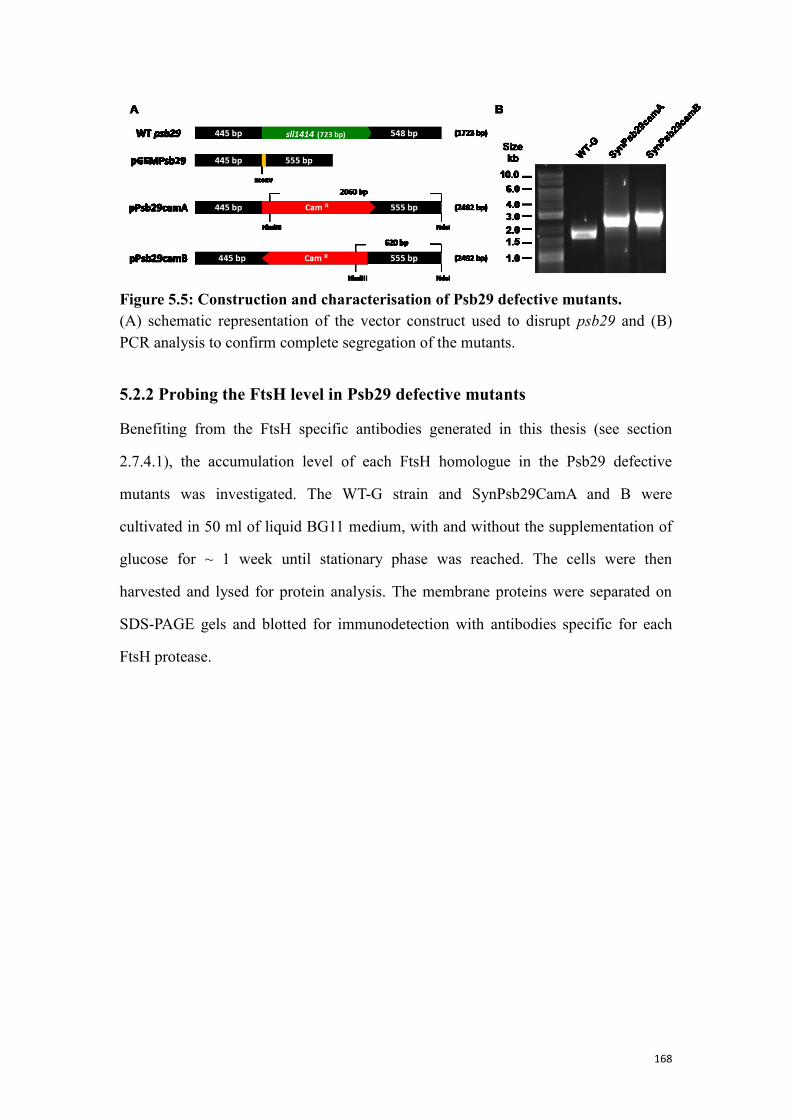
168
Figure 5.5: Construction and characterisation of Psb29 defective mutants.
(A) schematic representation of the vector construct used to disrupt psb29 and (B)
PCR analysis to confirm complete segregation of the mutants.
5.2.2 Probing the FtsH level in Psb29 defective mutants
Benefiting from the FtsH specific antibodies generated in this thesis (see section
2.7.4.1), the accumulation level of each FtsH homologue in the Psb29 defective
mutants was investigated. The WT-G strain and SynPsb29CamA and B were
cultivated in 50 ml of liquid BG11 medium, with and without the supplementation of
glucose for ~ 1 week until stationary phase was reached. The cells were then
harvested and lysed for protein analysis. The membrane proteins were separated on
SDS-PAGE gels and blotted for immunodetection with antibodies specific for each
FtsH protease.
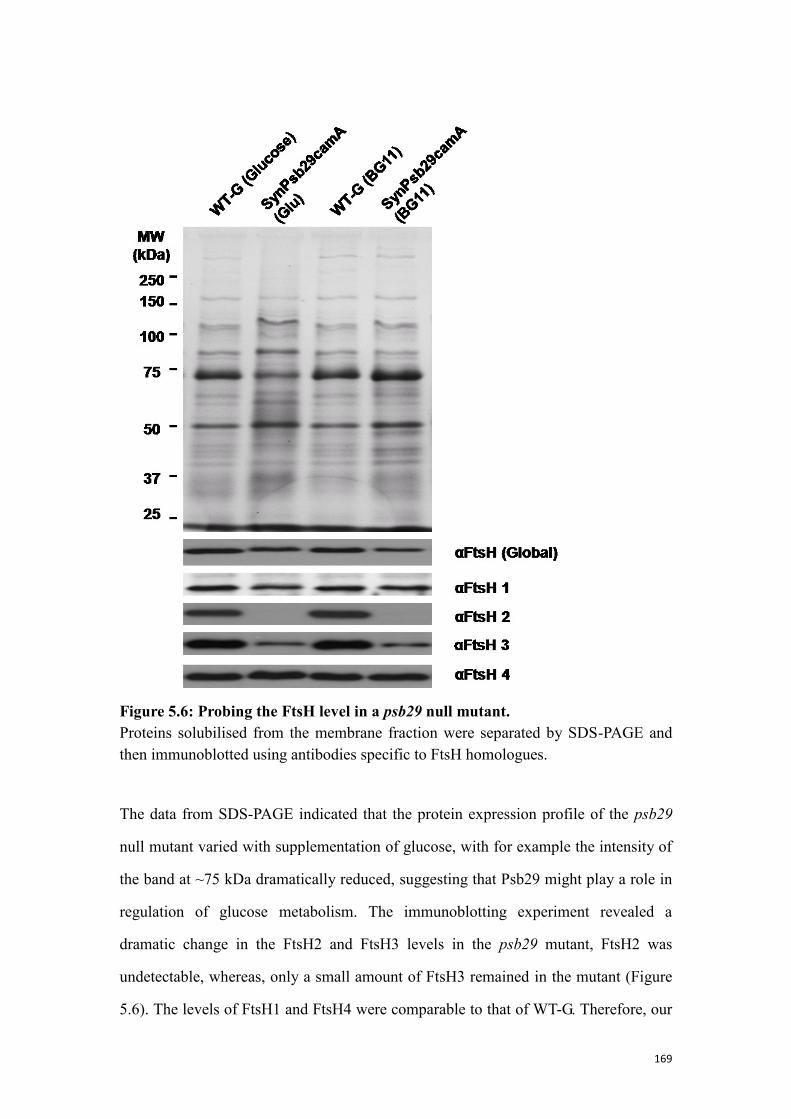
169
Figure 5.6: Probing the FtsH level in a psb29 null mutant.
Proteins solubilised from the membrane fraction were separated by SDS-PAGE and
then immunoblotted using antibodies specific to FtsH homologues.
The data from SDS-PAGE indicated that the protein expression profile of the psb29
null mutant varied with supplementation of glucose, with for example the intensity of
the band at ~75 kDa dramatically reduced, suggesting that Psb29 might play a role in
regulation of glucose metabolism. The immunoblotting experiment revealed a
dramatic change in the FtsH2 and FtsH3 levels in the psb29 mutant, FtsH2 was
undetectable, whereas, only a small amount of FtsH3 remained in the mutant (Figure
5.6). The levels of FtsH1 and FtsH4 were comparable to that of WT-G. Therefore, our
170
data suggest that in cyanobacteria, the accumulation of FtsH2 and FtsH3 is dependent
on Psb29. The other psb29 knockout mutant SynPsb29camB was also examined via
immunochemical detection, and comparable results were obtained (data not shown).
5.2.3 Phenotype analysis of the Psb29 defective mutant
Growth of Psb29 defective mutants of Synechocystis 6803 has been previously
reported to be more sensitive to strong illumination (Keren et al. 2005). To confirm
this finding, a growth experiment was performed to compare the light sensitivity
between SynPsb29camA and the FtsH2 null mutant ΔftsH2.
The data from the growth experiment showed that disruption of psb29 led to increased
light sensitivity (Figure 5.7 B). However, the phenotype of the psb29 mutant was not
as severe as the FtsH2 defective mutant as SynPsb29camA grew, although more
poorly than WT-G, under high-light with glucose and moderate-light without glucose
(Figure 5.7 A and D). A plausible explanation is that there might be trace amounts of
FtsH2 present in the psb29 null mutant which evaded detection by the FtsH2 antibody.
Alternatively, expression of FtsH2 might be aberrant in the psb29 mutant under low
light levels or in flask-grown liquid cultures but could be overcome to some degree at
increased irradiance levels in the presence of glucose.
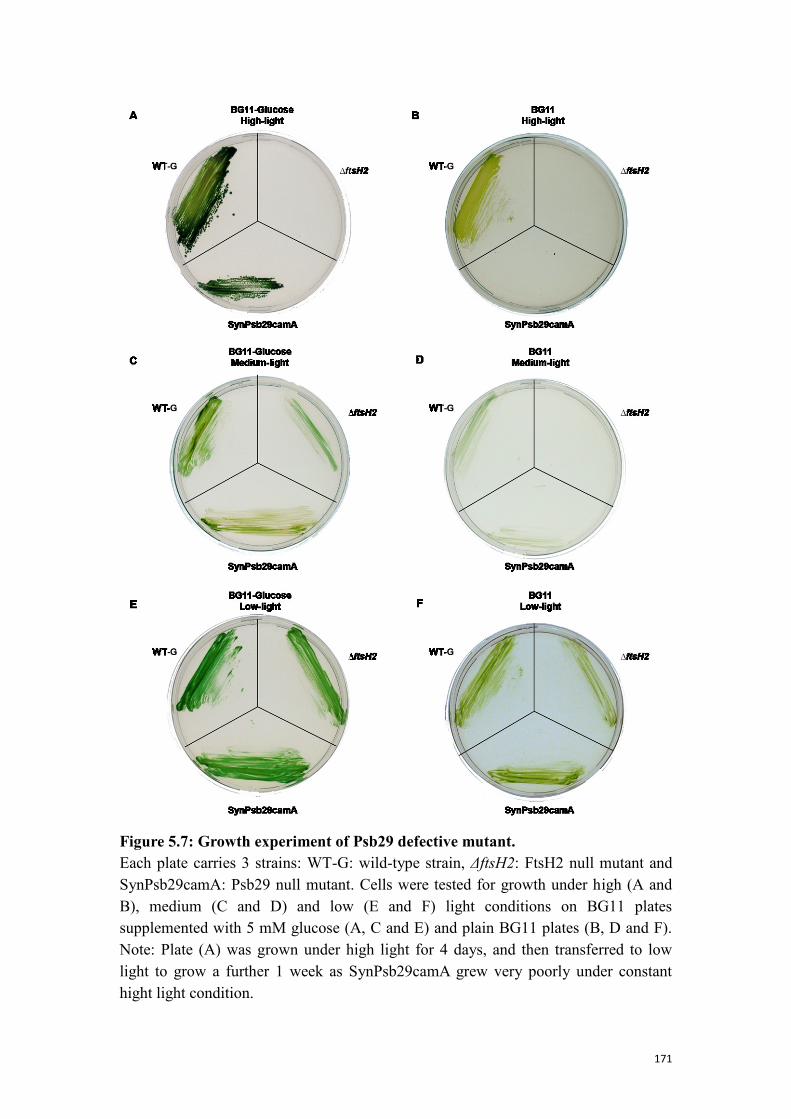
171
Figure 5.7: Growth experiment of Psb29 defective mutant.
Each plate carries 3 strains: WT-G: wild-type strain, ΔftsH2: FtsH2 null mutant and
SynPsb29camA: Psb29 null mutant. Cells were tested for growth under high (A and
B), medium (C and D) and low (E and F) light conditions on BG11 plates
supplemented with 5 mM glucose (A, C and E) and plain BG11 plates (B, D and F).
Note: Plate (A) was grown under high light for 4 days, and then transferred to low
light to grow a further 1 week as SynPsb29camA grew very poorly under constant
hight light condition.
172
5.3 Discussion
5.3.1 Identification of co-purifying proteins
In vivo studies using FtsH2 deficient mutants have demonstrated a serious growth
defect under a range of abiotic stress conditions including high light and heat stress
(Nixon et al. 2010), hence FtsH2 is considered to be a general housekeeping protease
that plays a quality control duty in cyanobacteria (Nixon et al. 2010). On the other
hand, little is known about the functions of the other three FtsH homologues in
Synechocystis, due to the challenges generating null mutants (FtsH1 and FtsH3) and a
lack of a distinguishable phenotype (FtsH4). Analysis of co-purifying proteins in
various GST-tagged FtsH preparations is one way that candidate substrates or
interacting proteins can be identified for further investigation. Both soluble and
membrane proteins with diverse cellular functions have been found to apparently
interact with FtsH proteases (see section 5.1.1 and Appendix), suggesting that all four
FtsH proteases are involved in various cellular activities in Synechocystis. We propose
that the identified proteins that co-purify with FtsH complexes might be: (1) subunits
of the complex (2) auxiliary modules that form supercomplexes with FtsH or (3)
substrates of FtsH proteases. On the other hand, due to the high sensitivity,
contaminants inside samples are often detected by PMF and resulting in false reading.
For instance, trace amount of FtsH4 was identified in FtsH1-GST sample by PMF
(see Appendix), which is contradictory to the immunoblotting (see section 3.1.4) and
fluorescence microscopy data (see section 3.2.5). Further investigation showed the
size of the protein band where FtsH4 was detected was just ~ 20 kDa (data not shown),
therefore, it is likely to be contamination due to the high abundance of FtsH4 in vivo
(Figure 3.12). To minimise the influence from contamination, control experiments
with wild-type cells should be included in the future.
Members of the Band 7 protein family are known to form supercomplexes with FtsH
in both E. coli and mitochondria (Back et al. 2002; Kihara et al. 1996). Since FtsH
alone retains proteolytic activity in vitro (Suno et al. 2006), the Band 7 proteins are
173
considered to be auxiliary proteins thought to play a regulatory role in FtsH activity
(Janska et al. 2013). Given this, it is highly significant that members of the Band 7
protein family of Synechocystis were also detected in three out of the four FtsH
samples (see section 5.1.1 and Appendix). The trace amount of Band 7 proteins in the
Synechocystis samples might reflect instability during purification or the presence of
only small amounts of supercomplex. Such low amounts help explain why larger
supercomplexes were not detected by electron microscopy. Prohibitin1 (Slr1106), a
Band 7 protein of unknown function (Boehm et al. 2009), was co-purified with FtsH4
in addition to previously identified interaction with FtsH2/FtsH3 complex (see section
3.3.2). Interestingly, Prohibitin 5 (Sll1021), another member of Band 7 family, was
detected exclusively in the FtsH4 sample. However, due to the lack of phenotype from
the FtsH4 defective mutant, it is difficult to probe the physiological function of this
interaction. Neither of the two prohibitins was detected in the FtsH1 sample, hence it
is not clear whether FtsH1/FtsH3 complexes interact with Band 7 proteins.
Prohibitin1 is a membrane protein localised on both thylakoid and cytoplasmic
membranes (Boehm et al. 2009), therefore, a potential interaction with FtsH1/FtsH3
complex remains plausible.
YccA is a small integral membrane protein, containing 7 transmembrane helices
(Kihara et al. 1998). Interestingly, YccA can interact with FtsH both as a substrate (Ito
and Akiyama 2005) or an inhibitor (van Stelten et al. 2009). In vivo studies have
showed that accumulation of YccA is regulated by FtsH-mediated degradation in E.
coli (Kihara et al. 1998), and that the abundance or stability of YccA suppresses the
activity of FtsH (van Stelten et al. 2009). Again it is highly significant that the
Synechocystis homologue of YccA (Sll1150) was also detected in the FtsH
preparations. To gain insight into the function of the YccA homologue in
Synechocystis, a mutant (SynSll1150cam) having the entire DNA coding region
removed, was constructed in this work. Preliminary characterisation via growth assay
174
showed no distinguishable phenotype comparing to the wild-type strain (see section
5.1.2.3). Hence the function of YccA in Synechocystis remains unclear. Nevertheless,
the growth assay showed that the function of the FtsH2/FtsH3 complexes was not
compromised by the lack of YccA. However, this is to be expected if Sll1150 acts as a
negative regulator.
YccA is a bacterial homologue of Bax Inhibitor-1 (BI-1), a protein conserved in both
mammalian and plants cells (Huckelhoven 2004). In mammalian cells, BI-1 plays a
regulatory role in Bax-mediated programmed cell death (Grzmil et al. 2003; Villalva
et al. 2002). Strikingly, despite having no Bax-mediated pathway in plants, the BI-1
homologues in Arabidopsis are not only conserved, but are also capable of
complementing the function of their mammalian counterparts (Huckelhoven 2004).
Therefore, it is conceivable that BI-1 might execute its function via regulation of FtsH,
which is also conserved in both mammalian and plants system.
A number of proteins that are part of photosynthetic complexes were also identified
exclusively in the FtsH2 and/or FtsH3 samples (see appendix for full list), including
the phycobilisome rod linker (Sll1580), the phycocyanin alpha subunit (Sll1578) and
the gamma chain of ATP synthase (Sll1327). These data indicate the FtsH2/FtsH3
complex might play a general role in maintaining the photosynthetic machinery,
however, the D1 protein, which is in the centre of FtsH-mediated PSII repair cycle
(Nixon et al. 2005), has so far not been detected in any of the samples.
Characterisation of mutants lacking FtsH2 has shown that D1 degradation is impaired
at an early stage (Silva et al. 2003); however, evidence of direct contact between the
two proteins is still lacking. A possible explanation is that FtsH-mediated D1
degradation is a rapid process, so that the abundance of D1 trapped in FtsH complexes
is low. Alternatively, D1 could be released from the FtsH complexes during
purification. Recent work on FtsH in E. coli has identified new substrates via mutating
175
the Zn2+
-binding motif, hence fast processing substrates were “trapped” in the
protease inactive FtsH derivative (Westphal et al. 2012). A similar approach could be
applied to explore the D1-FtsH interaction using the mutants described in Chapter 4.
The function of FtsH4 is unclear due to lack of distinctive phenotype in the protease
defective mutants. The PMF data showed FtsH4 interacts with several proteins which
were also detected in other FtsH samples (see Appendix). Therefore, the functional
redundancy across FtsH homologues is likely to compensate the loss of FtsH4.
However, a few proteins carrying distinctive physiological functions were exclusively
detected in the FtsH4 sample, including the homologue of Arabidopsis KaiC (Slr0758)
involved in regulation of circadian clock, the precursor of phosphate-binding
periplasmic protein (Sll0680) that might play a role in cell adhesion (Zaborina et al.
2008), a homologue of the FkbM family of methyltransferases (Sll1530), which is
involved in the synthesis of FK506 associated with immunosuppression (Chen et al.
2013). These preliminary data therefore open up interesting new avenues to explore
the role of FtsH4.
Although FtsH2/FtsH3 complexes appear to play a major role in D1 degradation, it
remains feasible that additional proteases might associate with FtsH complexes in vivo
to help aid processive proteolysis of transmembrane proteins. That is why it is so
exciting to identify a second protease, a homologue of Arabidopsis EGY2 (Sll0862),
interacting with the FtsH2/FtsH3 complex (see section 5.1.1). EGY2 is an
ATP-independent, Zn2+
-binding metalloprotease thought to cleave proteins within
transmembrane regions (Chen et al. 2012). Using the FtsH complex as an anchor
would generate a general “membrane protein degradation centre” capable of removing
recalcitrant membrane substrates. To test for a role for sll0862 in photoprotection, two
sll0862 null mutants were constructed and photoautotrophic growth was assessed
under strong illumination. However, both mutants showed no distinguishable defect
176
compared to the wild-type, in contrast to the FtsH2 defective mutant (see section
5.1.2.3). Therefore, these data do not indicate a critical role for Sll0862 in
photoprotection, which would suggest that FtsH2/FtsH3 complexes are capable of
maintaining the PSII repair cycle in the absence of Sll0862. Given that there is a
homologue of Sll0862 encoded in the Synechocystis genome (annotated as Slr0643) it
still remains possible that loss of Sll0862 might be compensated for by this protein.
This can be tested by analysis of a double mutant.
5.3.2 A role for Psb29 in controlling levels of the FtsH2/3 complex
Psb29 is universally conserved in cyanobacteria, green algae and all vascular plants
for which genome data are available (Keren et al. 2005). Psb29 was initially identified
as a novel PSII-associated protein in His-tagged PSII preparations isolated from
Synechocystis (Kashino et al. 2002). Subsequent characterisation revealed that the
Synechocystis Psb29 defective mutant exhibited slow-growth and increased light
sensitivity.
Psb29 is the homologue of THYLAKOID FORMATION 1 (THF1) in A. thaliana
(Wang et al. 2004), which is ubiquitously expressed in all organs of A. thaliana, and
dual targeted to the membrane envelop and the stroma (Huang et al. 2006). THF1
plays diverse cellular roles including a G-protein-coupled signalling pathway that
regulates sugar transport and FtsH accumulation in chloroplasts (Huang et al. 2006;
Zhang et al. 2009). The data presented in this chapter suggest that the level of the
FtsH2/FtsH3 complex is also dependent on Psb29 in Synechocystis. In addition the
protein expression profile is abnormal in psb29 null mutants grown in the presence of
glucose (Figure 5.5), suggesting that Psb29 might also be somehow involved in
glucose sensing. The link between Psb29 and FtsH is still unclear. The decrease in
FtsH accumulation in the psb29/thf1 null mutant of Arabidopsis is not due to effects
on transcript levels (Zhang et al. 2009), but rather seems to be post-transcriptional.
177
Given that unassembled FtsH2 and FtsH3 are rather sensitive to degradation (Boehm
et al. 2012; Sakamoto 2003), it seems plausible that Psb29 might play a direct role in
the assembly of the FtsH2/FtsH3 complex. Notably, the accumulation level of FtsH1
and FtsH4 was comparable to that of wild-type (Figure 5.5), which would suggest that
Psb29 is not involved in, or not important for, the assembly of FtsH4 complexes and
FtsH1/3 complexes.
Disruption of thf1 in Arabidopsis leads to a dramatic reduction in the level of FtsH
heterocomplexes in the thylakoid membrane. Interestingly, the accumulation of the
FtsH subunits in the membrane depends on the type of FtsH subunit with the
abundance of Type A subunits reduced to ~ 20 % of the wild-type level whereas the
Type B subunit was only reduced to 60 %. It is possible that Psb29 might act as a
molecular scaffold assisting the correct folding of Type A subunits, or coordinating
the assembly of the FtsH2/3 complex. Given the similarities in the phenotypes of the
cyanobacterial and Arabidopsis mutants with regard to effects on FtsH complexes, it
seems that this role for Psb29 has been conserved through evolution. Localisation data
for Psb29 in Synechocystis are still lacking, but on the basis of the interaction between
Psb29 and His-tagged PSII, and also the fact that the FtsH2/FtsH3 complex resides in
the thylakoid, it is likely that Psb29 does indeed attach to the thylakoid membrane.
178
Chapter 6: Conclusions and future work
This work has investigated the FtsH family proteases in the cyanobacterium
Synechocystis sp. PCC 6803, and has provided further insights into the structure,
function and regulation of these proteases. FtsH proteases are universally preserved in
eubacteria, mitochondria and chloroplasts (Ito and Akiyama 2005). Most bacteria only
express one type of FtsH and, in the case of E. coli, it is essential to cell viability
(Ogura et al. 1999). In contrast four FtsH homologues have been identified in
Synechocystis, of which, FtsH1 and FtsH3 are essential (Mann et al. 2000), FtsH2
plays important role in maintaining photosynthesis (Nixon et al. 2005), and the
function of FtsH4 is unknown. Little was known at the outset of this thesis about the
structure and function of these FtsH proteases, in particular, the interaction between
the different homologues. The experimental data presented in this work has provided
new insights into the composition, localisation and structure of FtsH proteases (see
Chapter 3; see section 6.1), functional mechanisms (see Chapter 4; see section 6.2)
and the substrates and regulation of FtsH proteases (see Chapter 5; see section 6.3).
Some data obtained in this work, including the composition analysis of FtsH
complexes and the EM structure of the FtsH2GST/FtsH3 hetero-hexameric complex
both in Chapter 3 were published in Boehm et al., 2012. In this final chapter, the most
important results from previous chapters will be briefly summarised, followed by an
outlook on potential future work (see section 6.4).
6.1 FtsH complexes in Synechocystis, composition, localisation and
structure
FtsH proteases are integral membrane proteases that have been implicated to form
large complexes in vivo (Ito and Akiyama 2005). In the case of yeast mitochondria,
both homo- and heterocomplexes are found in the inner membrane. Genetic and
biochemical studies have also provided early indications that the FtsH complexes
179
found in Arabidopsis chloroplasts are also homo-oligomeric and hetero-oligomeric
(Sakamoto 2003; Zaltsman et al. 2005); the latter composed of two types of FtsH
subunit: type A and type B. However, no FtsH complex has been isolated from
chloroplasts and characterised so there is a lack of direct evidence. In addition, FtsH
can form large supercomplexes with members of the Band 7 (or SPFH) family of
proteins. Whether such a situation exists in plant chloroplasts or cyanobacteria is
unclear (Janska et al. 2013). Although FtsH is widely considered to be a hexamer, this
is based on the crystal structures for the cytosolic domains of bacterial FtsH
over-expressed in E. coli. Although this would appear a reasonable assumption, the
structure of the native FtsH complex is still lacking, hence vital details concerning the
size, shape and subunit positioning within the complex, particular important in the
case of hetero-complexes of FtsH, remain important questions to answer.
In this work, mutagenesis was performed to fuse a C-terminal GST tag to each of the
four FtsH homologues found in the cyanobacterium Synechocystis sp. PCC 6803. The
resulting mutants showed wild-type-like phenotype, with the exception of the mutant
encoding FtsH3-GST, which showed an increased light sensitivity (see Figure 3.3).
Nevertheless, the ability to segregate the mutation plus the phenotype analysis
suggested that fusion of a C-terminal tag did not inactivate activity of the FtsH
proteases (see section 3.1.3). Subsequently, each FtsH homologue was isolated via
affinity purification and subjected to biochemical and structural analysis. The
immunoblotting analysis revealed co-purification of FtsH1/FtsH3 and FtsH2/FtsH3,
suggesting the presence of hetero-complexes, although formation of a small
proportion of homocomplexes cannot be excluded, whereas no other FtsH homologue
was detected in the FtsH4 sample (Figure 3.4). Structural analysis of an
FtsH-GST/FtsH3 complex revealed the presence of a hexameric particle that has a
diameter of ~ 120 Å, with FtsH2-GST and FtsH3 subunits arranged in an alternating
fashion (Figure 3.16). This work has been published (Boehm et al. 2012).
180
As a membrane protease, correct localisation is vital to gain access to membrane
bound substrates. In addition to the cytoplasmic membrane, cyanobacteria contain a
unique thylakoid system in which the photosynthetic machinery resides (Vermaas
2001). In chloroplasts, different FtsH homologues have been found either in the
thylakoid membranes (Zaltsman et al. 2005) or in the chloroplast envelope
membranes (Ferro et al. 2010), which raised speculation that the localisation of FtsH
complexes in Synechocystis might also be membrane specific. Localisation data were
collected using two independent approaches: first, fluorescence microscopy showed
that GFP-tagged FtsH2 and FtsH4 were mainly detected in the thylakoid membrane
system, whereas weak signals of FtsH1 and FtsH3 were detected in or close to the
cytoplasmic membranes. Second, immunoblotting of protein fractions comprising
cytoplasmic and thylakoid membranes of wild-type Synechocystis using FtsH-specific
antibodies confirmed that FtsH2 and FtsH4 were present in the thylakoid membrane
fraction, whereas, signals of FtsH3 were detected in both the cytoplasmic and
thylakoid membrane fractions (Figure 3.13). The localisation of FtsH1was not
elucidated in biochemical analysis due to time limitations. Further work is required to
assess whether the FtsH complexes are found in defined regions of the membrane
system, such as biogenesis centres where the photosystems are thought to be
assembled or repair centres where PSII may be repaired following photodamage
(Komenda et al. 2012).
The compositional and structural analysis, in tandem with data from localisation
studies, therefore suggests that the four FtsH homologues could form two
heterocomplexes (FtsH1/FtsH3 and FtsH2/FtsH3) and an FtsH4 homocomplex.
FtsH2/FtsH3 complex along with FtsH4 appear to be located in the thylakoid
membranes, whereas, the FtsH1/FtsH3 complex is likely to reside in or close to the
cytoplasmic membrane. N-terminal sequencing data did not support the hypothesis
that the first predicted transmembrane helix of FtsH acts a cleavable signal peptide as
181
suggested for chloroplast FtsH from import experiments (Rodrigues et al. 2011).
Hence my current view is that FtsH proteases in Synechocystis contain both
transmembrane helices. It should be noted that this conclusion does not rule out a
targeting function for the first transmembrane helix and does not extend to FtsH1 for
which no N-terminal sequence data were obtained.
6.2 Functional characterisation of FtsH proteases in vivo and in vitro
The function of FtsH is vital and diverse and in E. coli substrates of FtsH-mediated
degradation cover a range of soluble and membrane proteins (Ito and Akiyama 2005).
Similarly, in Synechocystis, FtsH2 plays a general housekeeping role in maintaining
the quality of membrane proteins (Nixon et al. 2005). Preliminary work on
Synechocystis FtsH showed the essentiality of FtsH1 and FtsH3 and dispensability of
FtsH2 and FtsH4 (Mann et al. 2000). Among the four homologues, the function of
FtsH4 is totally unknown as no distinguishable phenotype was observed in the FtsH4
null mutant (Mann et al. 2000). Our localisation data clearly showed that both FtsH2
and FtsH4 are present in the thylakoid membranes, although a location in different
regions cannot be totally excluded, (see section 3.12), which raised the speculation
that the function of FtsH4 might be overshadowed by the FtsH2/FtsH3 complex due
to functional redundancies. Hence an FtsH2/FtsH4 double knockout mutant was
constructed and compared with FtsH2 single deletion strain under increased
illumination intensity (see Figure 4.5). Growth of the double mutant showed a higher
sensitivity to light stress comparing to the FtsH2 single mutant, indicating FtsH4 also
contributes to photoprotection. However, the underlying mechanism is still unclear.
In chloroplasts, FtsH isomers are believed to mainly form heterocomplexes
(Sakamoto 2003). Despite having no structural data, an interesting observation is that
inactivation of only one type of subunits on the AAA+ domain via amino acid
substitution rendered the entire protease non-functional, whereas, inactivation of the
182
Zn2+_
binding motif only had minor effect on the proteolytic function of the FtsH
complex (Zhang et al. 2010). A similar effect also seems to hold for the Synechocystis
FtsH2/FtsH3 complex. Indeed, FtsH2 mutants containing mutations which lead to loss
of protease activity in homologous FtsH subunits were still capable of growing under
high-light conditions (see Figure 4.7). Along with the protease defective mutants, the
C266S mutant also survived light stress. C266 is a conserved residue localised in the
AAA+ domain, which has been speculated to play a role in regulatory control of the
FtsH complex (Mata-Cabana et al. 2007). However, the function of FtsH2 seemed to
be unaffected in this preliminary test.
Despite in vivo studies showing that FtsH is at the centre of D1 degradation in the
PSII repair cycle (Nixon et al. 2005), evidence of direct interaction between FtsH and
D1 protein is still lacking. Inactivation of the Zn2+
binding motif has been shown to
“trap” fast degrading substrates in the proteolytic chamber (Westphal et al. 2012).
Hence construction of the protease defective FtsH might increase the chance of
detecting such interaction. Unfortunately, the protease domain of FtsH2/FtsH3
complex functions redundantly as with their counterparts in Arabidopsis (Zhang et al.
2010), which possess greater challenge to achieve complete inactivation of the
protease domain. On the other hand, since FtsH4 functions alone, inactivation of the
protease domain is much simpler. In this work, four FtsH4 mutants carrying point
mutations were made (see Figure 4.8) and ready for future characterisation.
The C-terminal GST tag fused to each FtsH homologue did not compromise the major
function of FtsH, however, mutant expressing FtsH3-GST fusion protein exhibited
increased sensitivity to light stress (see Figure 3.3). To gain further insight into the
influence of the GST tag on the physiological function of FtsH, the ftsH2/ftsH4
double deletion strain, which was used as recipient strain to minimise the functional
overlap from other FtsH homologues, was transformed with the four GST tagging
183
vectors. In contrast to the other three mutants, cells transformed with pFtsH3GSTery
construct failed to grow. A reverse approach was also attempted, by disrupting ftsH2
from SynFtsH3GSTery strain, and again, no colonies were obtained (data not shown).
Hence GST tag at the C-terminus of FtsH3 did lead to functional disturbance,
however, the fusion protein still retained limited activity as judged from
transformation of WT-G. Interestingly, and in contrast to FtsH3, the GST-tagged
FtsH1 seemed not to affect cell viability; the phenotype of the triple mutant was
indistinguishable to the recipient strain (see Figure 4.9).
FtsH4 is the only homologue not found interacting with other FtsH homologues. We
explored the possibility that competition from FtsH2 might prevent the interaction
between FtsH3 and FtsH4, which are both found in the thylakoid membrane. Hence a
protein preparation of FtsH4 was performed to isolate FtsH4-GST fusion protein from
SynFtsH4GSTΔ2, the double mutant lacking FtsH2. The isolated protein sample,
again, containing only one major band (see Figure 4.10), hence the interaction
between FtsH homologues is rather specific.
FtsH is a member of AAA+ superfamily, and contains three functional domains: a
transmembrane domain, an AAA+ domain and a Zn2+
binding protease domain (Sauer
and Baker 2011); hence FtsH possesses both ATPase and protease activity. There is
however very limited characterisation of native FtsH activity from either
cyanobacteria or chloroplasts mainly due to low abundance and insolubility. To
bypass this limitation, an E. coli heterologous expression system was used to
over-express the cytosolic region of FtsH2, FtsH3 and FtsH4. Noteworthy, to
maximise the chance of getting stable proteins, the coding sequence of the
recombinants proteins were cloned from a thermophilic cyanobacterial strain, T.
elongatus (see Table 4.3). The resulting recombinant proteins lacking the
transmembrane domain were purified from the soluble fraction (see Figure 4.13) and
184
then tested for NTPase and protease activity. Among the three homologues
investigated, FtsH4 exhibited the highest NTP hydrolysis activity (see Figure 4.14),
and was the only one possessing proteolytic activity in vitro using casein as a
substrate (see Figure 4.15). Both FtsH2 and FtsH3 exhibited comparatively low
activity in the NTP hydrolysis assay, however, the activity of FtsH2 was dramatically
increased when incubating with CTP (see Figure 4.14). In fact, among the four
nucleotides, CTP seemed to be the preferred substrate to all three FtsH proteases,
followed by ATP, GTP and UTP. Early functional characterisation of E. coli FtsH
suggested complex formation is key to efficient ATP hydrolysis and proteolytic
activities (Akiyama and Ito 2000), therefore, it is conceivable that
hexameric-oligomers might be present in the FtsH4 sample and contribute to the
higher activities. The availability of these soluble fragments of cyanobacterial FtsH in
high yield opens up the possibility of conducting crystallisation trials to enable more
detailed structural information to be obtained.
6.3 Probing physiological function and regulatory mechanisms of
FtsH in Synechocystis
Proteins that co-purify with FtsH are potential substrates of the complex, possibly
trapped in the complex (Westphal et al. 2012). Further work is required to confirm
that they are truly substrates such as by comparing turnover of the protein in vivo in
WT and mutant. In agreement with the general housekeeping role that FtsH play, both
soluble and membrane proteins with diverse cellular functions have been found
interacting with FtsH proteases (see Appendix). Thus, the composition of the
candidate substrates varies between homologues, indicating that each homologue
carries out specific duties. In the case of the FtsH2/FtsH3 complex, a few subunits of
photosynthetic complexes were detected in FtsH2 and/or FtsH3 samples, hence
providing direct evidence that FtsH2/FtsH3 complex is involved in maintenance of
photosynthetic pathway. Previous in vivo characterisation was unable to elucidate the
function of FtsH4 due to the lack of distinguishable phenotype of the defective mutant
185
(Mann et al. 2000). Interestingly proteins involved in the circadian cycle, and ion
uptake were detected. Hence FtsH4 might play a role in these pathways and be located
in regions of the thylakoid membrane close to the periplasm, such as the
PratA-defined membranes (Schottkowski et al. 2009).
The function of FtsH in other systems is thought to be regulated via interaction with
auxiliary proteins, such as members of the Band 7 family of proteins and possibly
YccA homologues. Although Prohibitin 1, a member of the Band 7 family, was
consistently detected in FtsH2-GST/FtsH3 protein samples (see section 3.3.2, 5.1.1
and Appendix), a regulatory function of Prohibitin 1 in FtsH activity in Synechocystis
has not been observed so far (Boehm et al. 2009). Therefore, the regulation of FtsH
complexes remains unclear. Two more candidates that might regulate or work with
FtsH complexes were tested in this work. These included the homologues of E. coli
YccA (Sll1150) and Arabidopsis EGY2 (Sll0862). YccA is a substrate and inhibitor of
E. coli FtsH (Ito and Akiyama 2005; van Stelten et al. 2009), whose abundance and
stability influence the FtsH activity. In our preliminary study, a sll1150 null mutant
was constructed and tested for photoautotrophic growth. The resulting mutant
exhibited wild-type-like phenotype; hence did not yield functional insights into the
FtsH complex. EGY2 is an membrane-bound Zn2+
-binding protease involved in
cleaving transmembrane regions of membrane proteins. A working hypothesis for the
interaction between FtsH and Sll0862 was that by anchoring on the FtsH2/FtsH3, the
two proteases can form a repair centre to degrade a wider range of substrates, possibly
through a synergetic process. Defective mutants of Sll0862 were made and checked
for photoautotrophic growth, however, the mutants exhibited a wild-type-like
phenotype (Figure 5.3). Hence the involvement of Sll1150 and Sll0862 in
FtsH-mediated PSII repair remains unclear. It therefore remains possible that Sll0862
is actually a substrate of FtsH rather than a co-protease. More work is therefore
required to monitor D1 degradation in the absence of Sll0862, to see if D1 turnover is
186
slower for instance, and to test for possible overlap of function with a close
homologue of Sll0862 also found in Synechocystis. This can be done through
construction of a double mutant.
Psb29 has previously been identified as an auxiliary factor of PSII (Kashino et al.
2002). A mutant of Arabidopsis lacking a functional homologue of Psb29, also termed
Thf1, shows striking leaf variegation similar to that of FtsH defective mutants (Zhang
et al. 2009). In this work, psb29 null mutants were constructed and tested for growth.
Growth of the psb29 null mutant was sensitive to light stress, but the effect was less
severe than that of ftsH2 null mutants (see Figure 5.6). Analysis of FtsH protein levels
in the psb29 mutant revealed a remarkable reduction in both FtsH2 and FtsH3 but not
FtsH1 and FtsH4 (see Figure 5.5). Our working model is that the phenotype of the
psb29 mutant is related to perturbed accumulation of specifically the FtsH2/FtsH3
heterocomplex. The underlying mechanism remains unclear but we assume that it has
been conserved through evolution. Based on the data obtained with the thf1 mutant,
the effect appears to be post-transcriptional, possibly at the level of assembly of the
FtsH complex.
6.4 Future work
Significant progress has been made in this work in understanding the structure and
function of the FtsH proteases in Synechocystis 6803. Among the three FtsH
complexes identified in this work, only the structure of the FtsH2/FtsH3 complex has
been studied to any great depth. The size and subunit organisation of FtsH1/FtsH3
complex might be similar to that of the determined FtsH2/FtsH3 complex, however,
little is known about FtsH4 as the evidence of homocomplex formation is lacking.
Subsequent work, such as by electron microscopy, could address the size and
composition of the remaining complexes.
187
I have provided evidence that the protease domain of FtsH2 is not required for a
functional FtsH2/FtsH3 complex, which is consistent to the observation in
Arabidopsis (Zhang et al. 2010). On the other hand, a number of mutants carrying
mutations in the AAA+ domain and having drastic effects on function have been
constructed but have yet to be analysed. The equivalent mutations in Arabidopsis
FtsH2 (VAR2) led to inactivation of the whole complex. Moreover, to clarify the
potential thioredoxin control of FtsH complexes, a mutant carrying C266S mutation
was made. The mutant displayed wild-type-like phenotype in the preliminary growth
experiment. Growth experiments under different environmental conditions might
identify a growth defect.
Growth experiments showed that affinity-tagging of FtsH1 and FtsH2 does not
compromise the function of the proteases. However, the C-terminal GST tag showed
partial functional interference of FtsH3, whereas the influence of GST tagging on
FtsH4 remains unclear. Further investigations would be beneficial to clarify the
differential interference of GST tagging between Type A-like (FtsH3) and Type B-like
(FtsH1 and FtsH2) subunits.
Substrate analysis unveiled the potential functions of FtsH4, which suggested
directions for future experiments. A series of mutants expressing inactive FtsH
derivatives have been made, some of which were designed to “trap” substrates, hence
capable of capturing fast degrading degradants (Westphal et al. 2012). Future work is
required to analysis the composition of co-purified proteins, in a hope to identify
previously unknown substrates, and also possibly D1.
The auxiliary proteins that form supercomplexes with FtsH are potentially involved in
regulation the activity of the FtsH complexes. Two potential candidates, homologues
of YccA and EGY2 were examined in preliminary studies, but no evidence of
188
regulation has so far been observed. Further investigations might be beneficial
towards understanding the interaction between these proteins and FtsH. It is worth
noting that in E. coli, the N-terminus of YccA seems to be essential to FtsH-mediated
degradation, and truncated YccA lacking the N-terminal region, which is not
degradable, could stably interact with FtsH and inhibit its activity (Saikawa et al. 2004;
van Stelten et al. 2009). Therefore, future studies on mutants expressing truncated
Sll1150 are suggested.
The accumulation of FtsH2/FtsH3 complex is mediated by Psb29, however, the
underlying regulatory mechanism is so far unclear. The crystal structure of Psb29
from T. elongatus has recently been solved (Nixon and Murray, unpublished), and has
revealed it to be a “pin” shape. On the basis of the structure of Psb29, a potential
working hypothesis to be tested is that Psb29 might act as a molecular scaffold to
stabilise unassembled FtsH3 or FtsH2 isomers on the thylakoid membrane as
unassembled FtsH subunits have been shown to be unstable and rapidly degraded
(Boehm et al. 2012).
Finally, vectors expressing the cytosolic domain of FtsH2, FtsH3 and FtsH4 from T.
elongatus, were constructed in this work and the resulting recombinant proteins
displayed low level of NTPase activity. In contrast to FtsH2 and FtsH3, the
recombinant FtsH4 exhibited higher activity in NTP hydrolysis, and is the only one
that displayed proteolytic activity. The in vitro data raised the speculation that the
increased activity from FtsH4 might be a result of homo-oligomerisation Therefore,
future work might include examining the size of FtsH4, also in vitro oligomerisation
of FtsH2 and FtsH3. Attempts to crystallise the over-expressed FtsH proteins could
be made to yield the necessary atomic resolution structural data to help elucidate the
molecular mechanism of cyanobacterial FtsH proteases.
189
References
Adam Z, Clarke AK (2002) Cutting edge of chloroplast proteolysis. Trends Plant Sci
7: 451-456
Akiyama Y (1999) Self-processing of FtsH and its implication for the cleavage
specificity of this protease. Biochemistry 38: 11693-11699
Allakhverdiev SI, Murata N (2004) Environmental stress inhibits the synthesis de
novo of proteins involved in the photodamage-repair cycle of Photosystem II in
Synechocystis sp. PCC 6803. Biochim Biophys Acta 1657: 23-32
Allen JF (2003) Botany. State transitions--a question of balance. Science 299:
1530-1532
Allen JF, Forsberg J (2001) Molecular recognition in thylakoid structure and function.
Trends Plant Sci 6: 317-326
Allred DR, Staehelin LA (1986) Spatial organization of the cytochrome b6-f complex
within chloroplast thylakoid membranes. Biochim Biophys Acta 849: 94-103
Amarnath K, Zaks J, Park SD, Niyogi KK, Fleming GR (2012) Fluorescence lifetime
snapshots reveal two rapidly reversible mechanisms of photoprotection in live cells of
Chlamydomonas reinhardtii. Proc Natl Acad Sci U S A 109: 8405-8410
Anderson JM (1986) Photoregulation of the composition, function, and structure of
thylakoid membranes. Annual Review of Plant Physiology 37: 93-136
Andersson B, Anderson JM (1980) Lateral heterogeneity in the distribution of
chlorophyll-protein complexes of the thylakoid membranes of spinach chloroplasts.
Biochim Biophys Acta 593: 427-440
Antal TK, Lo W, Armstrong WH, Tyystjarvi E (2009) Illumination with ultraviolet or
visible light induces chemical changes in the water-soluble manganese complex,
[Mn(4)O(6)(bpea)(4)]Br(4). Photochem Photobiol 85: 663-668
Arlt H, Tauer R, Feldmann H, Neupert W, Langer T (1996) The YTA10-12 complex,
an AAA protease with chaperone-like activity in the inner membrane of mitochondria.
Cell 85: 875-885
190
Arnold I, Langer T (2002) Membrane protein degradation by AAA proteases in
mitochondria. Biochim Biophys Acta 1592: 89-96
Arnon DI (1971) The light reactions of photosynthesis. Proc Natl Acad Sci U S A 68:
2883-2892
Aro EM, McCaffery S, Anderson JM (1993a) Photoinhibition and D1 Protein
Degradation in Peas Acclimated to Different Growth Irradiances. Plant Physiol 103:
835-843
Aro EM, Virgin I, Andersson B (1993b) Photoinhibition of Photosystem II.
Inactivation, protein damage and turnover. Biochim Biophys Acta 1143: 113-134
Asada K (1999) THE WATER-WATER CYCLE IN CHLOROPLASTS: Scavenging
of Active Oxygens and Dissipation of Excess Photons. Annu Rev Plant Physiol Plant
Mol Biol 50: 601-639
Asada K (2000) The water-water cycle as alternative photon and electron sinks. Philos
Trans R Soc Lond B Biol Sci 355: 1419-1431
Atorino L, Silvestri L, Koppen M, Cassina L, Ballabio A, Marconi R, Langer T,
Casari G (2003) Loss of m-AAA protease in mitochondria causes complex I
deficiency and increased sensitivity to oxidative stress in hereditary spastic paraplegia.
J Cell Biol 163: 777-787
Badger MR, von Caemmerer S, Ruuska S, Nakano H (2000) Electron flow to oxygen
in higher plants and algae: rates and control of direct photoreduction (Mehler reaction)
and rubisco oxygenase. Philos Trans R Soc Lond B Biol Sci 355: 1433-1446
Bailey S, Thompson E, Nixon PJ, Horton P, Mullineaux CW, Robinson C, Mann NH
(2002) A critical role for the Var2 FtsH homologue of Arabidopsis thaliana in the
photosystem II repair cycle in vivo. J Biol Chem 277: 2006-2011
Bailleul B, Rogato A, de Martino A, Coesel S, Cardol P, Bowler C, Falciatore A,
Finazzi G (2010) An atypical member of the light-harvesting complex stress-related
protein family modulates diatom responses to light. Proc Natl Acad Sci U S A 107:
18214-18219
Banks RD, Blake CC, Evans PR, Haser R, Rice DW, Hardy GW, Merrett M, Phillips
AW (1979) Sequence, structure and activity of phosphoglycerate kinase: a possible
hinge-bending enzyme. Nature 279: 773-777
191
Barber J (2007) Biological solar energy. Philos Transact A Math Phys Eng Sci 365:
1007-1023
Barber J, Andersson B (1992) Too much of a good thing: light can be bad for
photosynthesis. Trends Biochem Sci 17: 61-66
Barber J, Nield J, Morris EP, Zheleva D, Hankamer B (1997) The structure, function
and dynamics of photosystem two. Physiol Plant 100: 817-827
Barber J, Tran PD (2013) From natural to artificial photosynthesis. Journal of the
Royal Society, Interface / the Royal Society 10: 20120984
Barker M, de Vries R, Nield J, Komenda J, Nixon PJ (2006) The Deg proteases
protect Synechocystis sp. PCC 6803 during heat and light stresses but are not essential
for removal of damaged D1 protein during the photosystem two repair cycle. J Biol
Chem 281: 30347-30355
Barker M, Boehm M, Nixon PJ, Nield J (2008) Structural analysis of an FtsH2/FtsH3
complex isolated from Synechocystis sp. PCC 6803. In Photosynthesis. Energy from
the Sun, J.F. Allen, E. Gannt, J. Golbeck, and B. Osmond, eds (Dordrecht, The
Netherlands: Springer), pp. 738–740.
Bellafiore S, Barneche F, Peltier G, Rochaix JD (2005) State transitions and light
adaptation require chloroplast thylakoid protein kinase STN7. Nature 433: 892-895
Betterle N, Ballottari M, Zorzan S, de Bianchi S, Cazzaniga S, Dall'osto L,
Morosinotto T, Bassi R (2009) Light-induced dissociation of an antenna
hetero-oligomer is needed for non-photochemical quenching induction. J Biol Chem
284: 15255-15266
Bieniossek C, Niederhauser B, Baumann UM (2009) The crystal structure of
apo-FtsH reveals domain movements necessary for substrate unfolding and
translocation. Proc Natl Acad Sci U S A 106: 21579-21584
Bieniossek C, Schalch T, Bumann M, Meister M, Meier R, Baumann U (2006) The
molecular architecture of the metalloprotease FtsH. Proc Natl Acad Sci U S A 103:
3066-3071
Boehm M, Nield J, Zhang P, Aro EM, Komenda J, Nixon PJ (2009) Structural and
mutational analysis of band 7 proteins in the cyanobacterium Synechocystis sp. strain
PCC 6803. J Bacteriol 191: 6425-6435
192
Boehm M, Romero E, Reisinger V, Yu J, Komenda J, Eichacker LA, Dekker JP,
Nixon PJ (2011) Investigating the early stages of photosystem II assembly in
Synechocystis sp. PCC 6803: isolation of CP47 and CP43 complexes. J Biol Chem
286: 14812-14819
Boehm M, Yu J, Krynicka V, Barker M, Tichy M, Komenda J, Nixon PJ, Nield J
(2012) Subunit organization of a Synechocystis hetero-oligomeric thylakoid FtsH
complex involved in photosystem II repair. Plant Cell 24: 3669-3683
Bonardi V, Pesaresi P, Becker T, Schleiff E, Wagner R, Pfannschmidt T, Jahns P,
Leister D (2005) Photosystem II core phosphorylation and photosynthetic acclimation
require two different protein kinases. Nature 437: 1179-1182
Bonente G, Ballottari M, Truong TB, Morosinotto T, Ahn TK, Fleming GR, Niyogi
KK, Bassi R (2011) Analysis of LhcSR3, a protein essential for feedback
de-excitation in the green alga Chlamydomonas reinhardtii. PLoS Biol 9: e1000577
Bonente G, Howes BD, Caffarri S, Smulevich G, Bassi R (2008) Interactions between
the photosystem II subunit PsbS and xanthophylls studied in vivo and in vitro. J Biol
Chem 283: 8434-8445
Brimblecombe P, Davies TD (1982) The Earth's Atmosphere. In Cambridge
Encylopaedia of Earth Sciences (Ed. D. Smith). Cambridge University Press.
Bruckner RC, Gunyuzlu PL, Stein RL (2003) Coupled kinetics of ATP and peptide
hydrolysis by Escherichia coli FtsH protease. Biochemistry 42: 10843-10852
Bugos RC, Yamamoto HY (1996) Molecular cloning of violaxanthin de-epoxidase
from romaine lettuce and expression in Escherichia coli. Proc Natl Acad Sci U S A 93:
6320-6325
Campbell D, Eriksson MJ, Oquist G, Gustafsson P, Clarke AK (1998) The
cyanobacterium Synechococcus resists UV-B by exchanging photosystem II
reaction-center D1 proteins. Proc Natl Acad Sci U S A 95: 364-369
Campbell D, Öquist G (1996) Predicting light acclimation in cyanobacteria from
non-photochemical quenching of photosystem II fluorescence, which reflects state
transitions in these organisms. Plant Physiol 111: 1293-1298
Cardona T, Sedoud A, Cox N, Rutherford AW (2012) Charge separation in
photosystem II: a comparative and evolutionary overview. Biochim Biophys Acta
1817: 26-43
193
Cassman KG (1999) Ecological intensification of cereal production systems: yield
potential, soil quality, and precision agriculture. Proc Natl Acad Sci U S A 96:
5952-5959
Chen D, Zhang L, Pang B, Chen J, Xu Z, Abe I, Liu W (2013) FK506 maturation
involves a cytochrome P450 protein-catalyzed four-electron C-9 oxidation in parallel
with a C-31 O-methylation. J Bacteriol 195: 1931-1939
Chen G, Law K, Ho P, Zhang X, Li N (2012) EGY2, a chloroplast membrane
metalloprotease, plays a role in hypocotyl elongation in Arabidopsis. Mol Biol Rep 39:
2147-2155
Chen GX, Kazimir J, Cheniae GM (1992) Photoinhibition of hydroxylamine-extracted
photosystem II membranes: studies of the mechanism. Biochemistry 31: 11072-11083
Chen H, Zhang D, Guo J, Wu H, Jin M, Lu Q, Lu C, Zhang L (2006) A Psb27
homologue in Arabidopsis thaliana is required for efficient repair of photodamaged
photosystem II. Plant Mol Biol 61: 567-575
Cheregi O, Sicora C, Kos PB, Barker M, Nixon PJ, Vass I (2007) The role of the FtsH
and Deg proteases in the repair of UV-B radiation-damaged Photosystem II in the
cyanobacterium Synechocystis PCC 6803. Biochim Biophys Acta 1767: 820-828
Clarke AK, Campbell D, Gustafsson P, Öquist G (1995) Dynamic responses of
photosystem II and phycobilisomes to changing light in the cyanobacterium
Synechococcus sp. PCC 7942. Planta 197: 553-562
Clarke AK, Soitamo A, Gustafsson P, Oquist G (1993) Rapid interchange between
two distinct forms of cyanobacterial photosystem II reaction-center protein D1 in
response to photoinhibition. Proc Natl Acad Sci U S A 90: 9973-9977
Clarke JE, Johnson GN (2001) In vivo temperature dependence of cyclic and
pseudocyclic electron transport in barley. Planta 212: 808-816
Dal Corso G, Pesaresi P, Masiero S, Aseeva E, Schunemann D, Finazzi G, Joliot P,
Barbato R, Leister D (2008) A complex containing PGRL1 and PGR5 is involved in
the switch between linear and cyclic electron flow in Arabidopsis. Cell 132: 273-285
Danielsson R, Suorsa M, Paakkarinen V, Albertsson PA, Styring S, Aro EM,
Mamedov F (2006) Dimeric and monomeric organization of photosystem II.
Distribution of five distinct complexes in the different domains of the thylakoid
membrane. J Biol Chem 281: 14241-14249
194
de Winter F, Swenson RB (2006) Dawn of the solar era: A wake-up call. Solar Today
2: 15-9
Dekker JP, Boekema EJ (2005) Supramolecular organization of thylakoid membrane
proteins in green plants. Biochim Biophys Acta 1706: 12-39
DeLano WL (2008) The PyMOL Molecular Graphics System. (Palo Alto, CA:
DeLano Scientific)
Demmig-Adams B, Adams III WW (1996) The role of xanthophyll cycle carotenoids
in the protection of photosynthesis. Trends Plant Sci 1: 21-26
Di Mascio P, Devasagayam TP, Kaiser S, Sies H (1990) Carotenoids, tocopherols and
thiols as biological singlet molecular oxygen quenchers. BiochemSoc Trans 18:
1054-1056
Dobakova M, Sobotka R, Tichy M, Komenda J (2009) Psb28 protein is involved in
the biogenesis of the photosystem II inner antenna CP47 (PsbB) in the
cyanobacterium Synechocystis sp. PCC 6803. Plant Physiol 149: 1076-1086
Eichacker LA, Helfrich M, Rudiger W, Muller B (1996) Stabilization of chlorophyll
a-binding apoproteins P700, CP47, CP43, D2, and D1 by chlorophyll a or
Zn-pheophytin a. J Biol Chem 271: 32174-32179
Ejima K, Kawaharada T, Inoue S, Kojima K, Nishiyama Y (2012) A change in the
sensitivity of elongation factor G to oxidation protects photosystem II from
photoinhibition in Synechocystis sp. PCC 6803. FEBS Lett 586: 778-783
Elrad D, Niyogi KK, Grossman AR (2002) A major light-harvesting polypeptide of
photosystem II functions in thermal dissipation. Plant Cell 14: 1801-1816
Erzberger JP, Berger JM (2006) Evolutionary relationships and structural mechanisms
of AAA+ proteins. Annu Rev Biophys Biomol Struct 35: 93-114
Escoubas JM, Lomas M, LaRoche J, Falkowski PG (1995) Light intensity regulation
of cab gene transcription is signaled by the redox state of the plastoquinone pool. Proc
Natl Acad Sci U S A 92: 10237-10241
Ferrante P, Ballottari M, Bonente G, Giuliano G, Bassi R (2012) LHCBM1 and
LHCBM2/7 polypeptides, components of major LHCII complex, have distinct
functional roles in photosynthetic antenna system of Chlamydomonas reinhardtii. J
195
Biol Chem 287: 16276-16288
Ferreira KN, Iverson TM, Maghlaoui K, Barber J, Iwata S (2004) Architecture of the
photosynthetic oxygen-evolving center. Science 303: 1831-1838
Ferro M, Brugiere S, Salvi D, Seigneurin-Berny D, Court M, Moyet L, Ramus C,
Miras S, Mellal M, Le Gall S, Kieffer-Jaquinod S, Bruley C, Garin J, Joyard J,
Masselon C, Rolland N (2010) AT_CHLORO, a comprehensive chloroplast proteome
database with subplastidial localization and curated information on envelope proteins.
MCP 9: 1063-1084
Frielingsdorf S, Klosgen RB (2007) Prerequisites for terminal processing of
thylakoidal Tat substrates. J Biol Chem 282: 24455-24462
Gal A, Zer H, Ohad I (1997) Redox-controlled thylakoid protein phosphorylation.
News and views. Physiol Plant 100: 869-885
Garcia-Lorenzo M, Sjodin A, Jansson S, Funk C (2006) Protease gene families in
Populus and Arabidopsis. BMC Plant Biol 6: 30
Golden SS, Brusslan J, Haselkorn R (1986) Expression of a family of psbA genes
encoding a photosystem II polypeptide in the cyanobacterium Anacystis nidulans R2.
EMBO J 5: 2789-2798
Gombos Z, Wada H, Murata N (1994) The recovery of photosynthesis from
low-temperature photoinhibition is accelerated by the unsaturation of membrane lipids:
a mechanism of chilling tolerance. Proc Natl Acad Sci U S A 91: 8787-8791
Goral TK, Johnson MP, Brain AP, Kirchhoff H, Ruban AV, Mullineaux CW (2010)
Visualizing the mobility and distribution of chlorophyll proteins in higher plant
thylakoid membranes: effects of photoinhibition and protein phosphorylation. Plant J
62: 948-959
Goral TK, Johnson MP, Duffy CD, Brain AP, Ruban AV, Mullineaux CW (2012)
Light-harvesting antenna composition controls the macrostructure and dynamics of
thylakoid membranes in Arabidopsis. Plant J 69: 289-301
Gottesman S (2003) Proteolysis in bacterial regulatory circuits. Annu Rev Cell Dev
Biol 19: 565-587
196
Gould SB, Waller RF, McFadden GI (2008) Plastid evolution. Annu Rev Plant Biol
59: 491-517
Graef M, Seewald G, Langer T (2007) Substrate recognition by AAA+ ATPases:
distinct substrate binding modes in ATP-dependent protease Yme1 of the
mitochondrial intermembrane space. Mol Cell Biol 27: 2476-2485
Grossman AR, Bhaya D, Apt KE, Kehoe DM (1995) Light-harvesting complexes in
oxygenic photosynthesis: diversity, control, and evolution. Annu Rev Genet 29:
231-288
Grossman AR, Schaefer MR, Chiang GG, Collier JL (1993) The phycobilisome, a
light-harvesting complex responsive to environmental conditions. Microbiol Rev 57:
725-749
Grzmil M, Thelen P, Hemmerlein B, Schweyer S, Voigt S, Mury D, Burfeind P (2003)
Bax inhibitor-1 is overexpressed in prostate cancer and its specific down-regulation
by RNA interference leads to cell death in human prostate carcinoma cells. Am J
Pathol 163: 543-552
Guindon S, Dufayard JF, Lefort V, Anisimova M, Hordijk W, Gascuel O (2010) New
Algorithms and Methods to Estimate Maximum-Likelihood Phylogenies: Assessing
the Performance of PhyML 3.0. Systematic Biology, 59(3):307-21
Gwizdala M, Wilson A, Kirilovsky D (2011) In vitro reconstitution of the
cyanobacterial photoprotective mechanism mediated by the Orange Carotenoid
Protein in Synechocystis PCC 6803. Plant Cell 23: 2631-2643
Hakala M, Rantamaki S, Puputti EM, Tyystjarvi T, Tyystjarvi E (2006)
Photoinhibition of manganese enzymes: insights into the mechanism of photosystem
II photoinhibition. J Exp Bot 57: 1809-1816
Hakala M, Tuominen I, Keranen M, Tyystjarvi T, Tyystjarvi E (2005) Evidence for
the role of the oxygen-evolving manganese complex in photoinhibition of
Photosystem II. Biochim Biophys Acta 1706: 68-80
Hakala-Yatkin M, Sarvikas P, Paturi P, Mantysaari M, Mattila H, Tyystjarvi T,
Nedbal L, Tyystjarvi E (2011) Magnetic field protects plants against high light by
slowing down production of singlet oxygen. Physiol Plant 142: 26-34
197
Hankamer B, Morris E, Nield J, Carne A, Barber J (2001) Subunit positioning and
transmembrane helix organisation in the core dimer of photosystem II. FEBS Lett 504:
142-151
Harries JE, Brindley HE, Sagoo PJ, Bantges RJ (2001) Increases in greenhouse
forcing inferred from the outgoing longwave radiation spectra of the Earth in 1970
and 1997. Nature 410: 355-357
Haussuhl K, Andersson B, Adamska I (2001) A chloroplast DegP2 protease performs
the primary cleavage of the photodamaged D1 protein in plant photosystem II. EMBO
J 20: 713-722
Havaux M, Eymery F, Porfirova S, Rey P, Dormann P (2005) Vitamin E protects
against photoinhibition and photooxidative stress in Arabidopsis thaliana. Plant Cell
17: 3451-3469
Henry R, Carrigan M, McCaffrey M, Ma X, Cline K (1997) Targeting determinants
and proposed evolutionary basis for the Sec and the Delta pH protein transport
systems in chloroplast thylakoid membranes. J Cell Biol 136: 823-832
Herman C, Thevenet D, D'Ari R, Bouloc P (1995) Degradation of sigma 32, the heat
shock regulator in Escherichia coli, is governed by HflB. Proc Natl Acad Sci U S A
92: 3516-3520
Herman C, Thevenet D, D'Ari R, Bouloc P (1997) The HflB protease of Escherichia
coli degrades its inhibitor lambda cIII. J Bacteriol 179: 358-363
Hihara Y, Ikeuchi M (1997) Mutation in a novel gene required for photomixotrophic
growth leads to enhanced photoautotrophic growth of Synechocystis sp. PCC 6803.
Photosynth Res 53: 243-252
Hill TM, Kennett JP, Valentine DL, Yang Z, Reddy CM, Nelson RK, Behl RJ, Robert
C, Beaufort L (2006) Climatically driven emissions of hydrocarbons from marine
sediments during deglaciation. Proc Natl Acad Sci U S A 103: 13570-13574
Horton P, Ruban AV (1992) Regulation of Photosystem II. Photosynth Res 34:
375-385
Horton RM, Ho SN, Pullen JK, Hunt HD, Cai Z, Pease LR (1993) Gene splicing by
overlap extension. Methods Enzymol 217: 270-279
198
Huang J, Taylor JP, Chen JG, Uhrig JF, Schnell DJ, Nakagawa T, Korth KL, Jones
AM (2006) The plastid protein THYLAKOID FORMATION1 and the plasma
membrane G-protein GPA1 interact in a novel sugar-signaling mechanism in
Arabidopsis. Plant Cell 18: 1226-1238
Huang J, Taylor JP, Chen JG, Uhrig JF, Schnell DJ, Nakagawa T, Korth KL, Jones
AM (2006) The plastid protein THYLAKOID FORMATION1 and the plasma
membrane G-protein GPA1 interact in a novel sugar-signaling mechanism in
Arabidopsis. Plant Cell 18: 1226-1238
Huckelhoven R (2004) BAX Inhibitor-1, an ancient cell death suppressor in animals
and plants with prokaryotic relatives. Apoptosis 9: 299-307
Huesgen PF, Schuhmann H, Adamska I (2006) Photodamaged D1 protein is degraded
in Arabidopsis mutants lacking the Deg2 protease. FEBS Lett 580: 6929-6932
Ito K, Akiyama Y (2005) Cellular functions, mechanism of action, and regulation of
FtsH protease. Annu Rev Microbiol 59: 211-231
Ivleva NB, Shestakov SV, Pakrasi HB (2000) The carboxyl-terminal extension of the
precursor D1 protein of photosystem II is required for optimal photosynthetic
performance of the cyanobacterium Synechocystis sp. PCC 6803. Plant Physiol 124:
1403-1412
Iwai M, Katoh H, Katayama M, Ikeuchi M (2004) Improved genetic transformation of
the thermophilic cyanobacterium, Thermosynechococcus elongatus BP-1. Plant Cell
Physiol 45: 171-175
Janska H, Kwasniak M, Szczepanowska J (2013) Protein quality control in organelles
- AAA/FtsH story. Biochim Biophys Acta 1833: 381-387
Johnson MP, Ruban AV (2011) Restoration of rapidly reversible photoprotective
energy dissipation in the absence of PsbS protein by enhanced DeltapH. J Biol Chem
286: 19973-19981
Kamata T, Hiramoto H, Morita N, Shen JR, Mann NH, Yamamoto Y (2005) Quality
control of Photosystem II: an FtsH protease plays an essential role in the turnover of
the reaction center D1 protein in Synechocystis PCC 6803 under heat stress as well as
light stress conditions. Photochem Photobiol Sci 4: 983-990
199
Kanemori M, Nishihara K, Yanagi H, Yura T (1997) Synergistic roles of HslVU and
other ATP-dependent proteases in controlling in vivo turnover of sigma32 and
abnormal proteins in Escherichia coli. J Bacteriol 179: 7219-7225
Kanervo E, Suorsa M, Aro EM (2005) Functional flexibility and acclimation of the
thylakoid membrane. Photochem Photobiol Sci 4: 1072-1080
Karamoko M, Cline S, Redding K, Ruiz N, Hamel PP (2011) Lumen Thiol
Oxidoreductase1, a disulfide bond-forming catalyst, is required for the assembly of
photosystem II in Arabidopsis. Plant Cell 23: 4462-4475
Karata K, Inagawa T, Wilkinson AJ, Tatsuta T, Ogura T (1999) Dissecting the role of
a conserved motif (the second region of homology) in the AAA family of ATPases.
Site-directed mutagenesis of the ATP-dependent protease FtsH. J Biol Chem 274:
26225-26232
Kashino Y, Lauber WM, Carroll JA, Wang Q, Whitmarsh J, Satoh K, Pakrasi HB
(2002) Proteomic analysis of a highly active photosystem II preparation from the
cyanobacterium Synechocystis sp. PCC 6803 reveals the presence of novel
polypeptides. Biochemistry 41: 8004-8012
Keren N, Liberton M, Pakrasi HB (2005a) Photochemical competence of assembled
photosystem II core complex in cyanobacterial plasma membrane. J Biol Chem 280:
6548-6553
Keren N, Ohkawa H, Welsh EA, Liberton M, Pakrasi HB (2005b) Psb29, a conserved
22-kD protein, functions in the biogenesis of Photosystem II complexes in
Synechocystis and Arabidopsis. Plant Cell 17: 2768-2781
Kerfeld CA, Sawaya MR, Brahmandam V, Cascio D, Ho KK, Trevithick-Sutton CC,
Krogmann DW, Yeates TO (2003) The crystal structure of a cyanobacterial
water-soluble carotenoid binding protein. Structure 11: 55-65
Kerr RA (2005) Earth science. The story of O2. Science 308: 1730-1732
Kettunen R, Pursiheimo S, Rintamäki E, Van Wijk KJ, Aro EM (1997)
Transcriptional and translational adjustments of psbA gene expression in mature
chloroplasts during photoinhibition and subsequent repair of photosystem II. Eur J
Biochem 247: 441-448
Kihara A, Akiyama Y, Ito K (1998) Different pathways for protein degradation by the
FtsH/HflKC membrane-embedded protease complex: an implication from the
200
interference by a mutant form of a new substrate protein, YccA. J Mol Biol 279:
175-188
Kim SJ, Robinson C, Mant A (1998) Sec/SRP-independent insertion of two thylakoid
membrane proteins bearing cleavable signal peptides. FEBS Lett 424: 105-108
Klimov VV, Shafiev MA, Allakhverdiev SI (1990) Photoinactivation of the
reactivation capacity of photosystem II in pea subchloroplast particles after a
complete removal of manganese. 23: 59-65
Klinkert B, Ossenbuhl F, Sikorski M, Berry S, Eichacker L, Nickelsen J (2004) PratA,
a periplasmic tetratricopeptide repeat protein involved in biogenesis of photosystem II
in Synechocystis sp. PCC 6803. J Biol Chem 279: 44639-44644
Knox JP, Dodge AD (1985) Singlet oxygen and plants. Phytochemistry 24: 889-896
Kok B, Forbush B, McGloin M (1970) Cooperation of charges in photosynthetic O2
evolution-I. A linear four step mechanism. Photochem Photobiol 11: 457-475
Komenda J, Barker M, Kuvikova S, de Vries R, Mullineaux CW, Tichy M, Nixon PJ
(2006a) The FtsH protease slr0228 is important for quality control of photosystem II
in the thylakoid membrane of Synechocystis sp. PCC 6803. J Biol Chem 281:
1145-1151
Komenda J, Hassan HA, Diner BA, Debus RJ, Barber J, Nixon PJ (2000) Degradation
of the Photosystem II D1 and D2 proteins in different strains of the cyanobacterium
Synechocytis PCC 6803 varying with respect to the type and level of psbA transcript.
Plant Mol Biol 42: 635-645
Komenda J, Knoppova J, Kopecna J, Sobotka R, Halada P, Yu J, Nickelsen J, Boehm
M, Nixon PJ (2012a) The Psb27 assembly factor binds to the CP43 complex of
photosystem II in the cyanobacterium Synechocystis sp. PCC 6803. Plant Physiol 158:
476-486
Komenda J, Kuvikova S, Granvogl B, Eichacker LA, Diner BA, Nixon PJ (2007a)
Cleavage after residue Ala352 in the C-terminal extension is an early step in the
maturation of the D1 subunit of Photosystem II in Synechocystis PCC 6803. Biochim
Biophys Acta 1767: 829-837
Komenda J, Nickelsen J, Tichy M, Prasil O, Eichacker LA, Nixon PJ (2008) The
cyanobacterial homologue of HCF136/YCF48 is a component of an early
photosystem II assembly complex and is important for both the efficient assembly and
201
repair of photosystem II in Synechocystis sp. PCC 6803. J Biol Chem 283:
22390-22399
Komenda J, Reisinger V, Muller BC, Dobakova M, Granvogl B, Eichacker LA (2004)
Accumulation of the D2 protein is a key regulatory step for assembly of the
photosystem II reaction center complex in Synechocystis PCC 6803. J Biol Chem 279:
48620-48629
Komenda J, Sobotka R, Nixon PJ (2012b) Assembling and maintaining the
Photosystem II complex in chloroplasts and cyanobacteria. Curr Opin Plant Biol 15:
245-251
Komenda J, Tichy M, Prasil O, Knoppova J, Kuvikova S, de Vries R, Nixon PJ
(2007b) The exposed N-terminal tail of the D1 subunit is required for rapid D1
degradation during photosystem II repair in Synechocystis sp PCC 6803. Plant Cell 19:
2839-2854
Koppen M, Metodiev MD, Casari G, Rugarli EI, Langer T (2007) Variable and
tissue-specific subunit composition of mitochondrial m-AAA protease complexes
linked to hereditary spastic paraplegia. Mol Cell Biol 27: 758-767
Kruger TP, Ilioaia C, Johnson MP, Ruban AV, Papagiannakis E, Horton P, van
Grondelle R (2012) Controlled disorder in plant light-harvesting complex II explains
its photoprotective role. Biophys J 102: 2669-2676
Kuvikova S, Tichy M, Komenda J (2005) A role of the C-terminal extension of the
photosystem II D1 protein in sensitivity of the cyanobacterium Synechocystis PCC
6803 to photoinhibition. Photochem Photobiol Sci 4: 1044-1048
Langklotz S, Baumann U, Narberhaus F (2012) Structure and function of the bacterial
AAA protease FtsH. Biochim Biophys Acta 1823: 40-48
Lee H-Y, Hong Y-N, Chow WS (2001) Photoinactivation of photosystem II
complexes and photoprotection by non-functional neighbors in Capsicum annuum L.
leaves. Planta 212: 332-342
Lee S, Augustin S, Tatsuta T, Gerdes F, Langer T, Tsai FT (2011) Electron
cryomicroscopy structure of a membrane-anchored mitochondrial AAA protease. J
Biol Chem 286: 4404-4411
Leffers GG, Jr., Gottesman S (1998) Lambda Xis degradation in vivo by Lon and
FtsH. J Bacteriol 180: 1573-1577
202
Li XP, Bjorkman O, Shih C, Grossman AR, Rosenquist M, Jansson S, Niyogi KK
(2000) A pigment-binding protein essential for regulation of photosynthetic light
harvesting. Nature 403: 391-395
Lindahl M, Spetea C, Hundal T, Oppenheim AB, Adam Z, Andersson B (2000) The
thylakoid FtsH protease plays a role in the light-induced turnover of the photosystem
II D1 protein. Plant Cell 12: 419-431
Lindahl M, Yang D-H, Andersson B (1995) Regulatory proteolysis of the major
light-harvesting chlorophyll a/b protein of Photosystem II by a light-induced
membrane-associated enzymic system. Eur J Biochem 231: 503-509
Liu Z, Yan H, Wang K, Kuang T, Zhang J, Gui L, An X, Chang W (2004) Crystal
structure of spinach major light-harvesting complex at 2.72 A resolution. Nature 428:
287-292
Long SP, Humphries S, Falkowski PG (1994) Photoinhibition of photosynthesis in
nature. Annu Rev Plant Physiol Plant Mol Biol 45: 633-662
Ludtke SJ, Chen DH, Song JL, Chuang DT, Chiu, W (2004) Seeing GroEL at 6 A
resolution by single particle electron cryomicroscopy. Structure 12: 1129–1136
Mann NH, Novac N, Mullineaux CW, Newman J, Bailey S, Robinson C (2000)
Involvement of an FtsH homologue in the assembly of functional photosystem I in the
cyanobacterium Synechocystis sp. PCC 6803. FEBS Lett 479: 72-77
Mata-Cabana A, Florencio FJ, Lindahl M (2007) Membrane proteins from the
cyanobacterium Synechocystis sp. PCC 6803 interacting with thioredoxin. Proteomics
7: 3953-3963
Matsubara S, Chow WS (2004) Populations of photoinactivated photosystem II
reaction centers characterized by chlorophyll a fluorescence lifetime in vivo. Proc Natl
Acad Sci U S A 101: 18234-18239
Mattoo AK, Hoffman-Falk H, Marder JB, Edelman M (1984) Regulation of protein
metabolism: Coupling of photosynthetic electron transport to in vivo degradation of
the rapidly metabolized 32-kilodalton protein of the chloroplast membranes. Proc Natl
Acad Sci U S A 81: 1380-1384
McTigue MA, Williams DR, Tainer JA (1995) Crystal structures of a schistosomal
drug and vaccine target: glutathione Stransferase from Schistosoma japonica and its
complex with the leading antischistosomal drug praziquantel. J. Mol. Biol. 246:
203
21–27.
Melis A (1999) Photosystem-II damage and repair cycle in chloroplasts: what
modulates the rate of photodamage ? Trends Plant Sci 4: 130-135
Michoux F, Takasaka K, Boehm M, Komenda J, Nixon PJ, Murray JW (2012) Crystal
structure of the Psb27 assembly factor at 1.6 Å: implications for binding to
Photosystem II. Photosynth Res 110: 169-175
Miyagawa Y, Tamoi M, Shigeoka S (2000) Evaluation of the defense system in
chloroplasts to photooxidative stress caused by paraquat using transgenic tobacco
plants expressing catalase from Escherichia coli. Plant Cell Physiol 41: 311-320
Miyake C, Shinzaki Y, Miyata M, Tomizawa K (2004) Enhancement of cyclic
electron flow around PSI at high light and its contribution to the induction of
non-photochemical quenching of chl fluorescence in intact leaves of tobacco plants.
Plant Cell Physiol 45: 1426-1433
Molik S, Karnauchov I, Weidlich C, Herrmann RG, Klosgen RB (2001) The Rieske
Fe/S protein of the cytochrome b6/f complex in chloroplasts: missing link in the
evolution of protein transport pathways in chloroplasts? J Biol Chem 276:
42761-42766
Moon BY, Higashi S, Gombos Z, Murata N (1995) Unsaturation of the membrane
lipids of chloroplasts stabilizes the photosynthetic machinery against low-temperature
photoinhibition in transgenic tobacco plants. Proc Natl Acad Sci U S A 92: 6219-6223
Muller P, Li XP, Niyogi KK (2001) Non-photochemical quenching. A response to
excess light energy. Plant Physiol 125: 1558-1566
Mullineaux C (1999) The thylakoid membranes of cyanobacteria: structure, dynamics
and function. Functional Plant Biol. 26: 671-677
Mullineaux CW, Emlyn-Jones D (2005) State transitions: an example of acclimation
to low-light stress. J Exp Bot 56: 389-393
Munekage Y, Hashimoto M, Miyake C, Tomizawa K, Endo T, Tasaka M, Shikanai T
(2004) Cyclic electron flow around photosystem I is essential for photosynthesis.
Nature 429: 579-582
204
Murata N, Allakhverdiev SI, Nishiyama Y (2012) The mechanism of photoinhibition
in vivo: re-evaluation of the roles of catalase, alpha-tocopherol, non-photochemical
quenching, and electron transport. Biochim Biophys Acta 1817: 1127-1133
Murata N, Sugahara K (1969) Control of excitation transfer in photosynthesis. 3.
Light-induced decrease of chlorophyll a fluorescence related to photophosphorylation
system in spinach chloroplasts. Biochim Biophys Acta 189: 182-192
Neely WC, Martin JM, Barker SA (1988) Products and relative reaction rates of the
oxidation of tocopherols with singlet molecular oxygen. Photochem Photobiol 48:
423-428
Neuwald AF, Aravind L, Spouge JL, Koonin EV (1999) AAA+: A class of
chaperone-like ATPases associated with the assembly, operation, and disassembly of
protein complexes. Genome Res 9: 27-43
Nickelsen J, Rengstl B (2013) Photosystem II assembly: from cyanobacteria to plants.
Annu Rev Plant Biol 64: 609-635
Nishiyama Y, Allakhverdiev SI, Yamamoto H, Hayashi H, Murata N (2004) Singlet
oxygen inhibits the repair of photosystem II by suppressing the translation elongation
of the D1 protein in Synechocystis sp. PCC 6803. Biochemistry 43: 11321-11330
Nishiyama Y, Yamamoto H, Allakhverdiev SI, Inaba M, Yokota A, Murata N (2001)
Oxidative stress inhibits the repair of photodamage to the photosynthetic machinery.
EMBO J 20: 5587-5594
Nixon PJ, Barker M, Boehm M, de Vries R, Komenda J (2005) FtsH-mediated repair
of the photosystem II complex in response to light stress. J Exp Bot 56: 357-363
Nixon PJ, Michoux F, Yu J, Boehm M, Komenda J (2010a) Recent advances in
understanding the assembly and repair of photosystem II. Annal Bot 106: 1-16
Niyogi KK (1999) Photoprotection revisited: Genetic and molecular approaches.
Annu Rev Plant Physiol Plant Mol Biol 50: 333-359
Niyogi KK, Truong TB (2013) Evolution of flexible non-photochemical quenching
mechanisms that regulate light harvesting in oxygenic photosynthesis. Curr Opin
Plant Biol doi: 10.1016/j.pbi.2013.03.011.
205
Nolden M, Ehses S, Koppen M, Bernacchia A, Rugarli EI, Langer T (2005) The
m-AAA protease defective in hereditary spastic paraplegia controls ribosome
assembly in mitochondria. Cell 123: 277-289
Nouwen N, Piwowarek M, Berrelkamp G, Driessen AJ (2005) The large first
periplasmic loop of SecD and SecF plays an important role in SecDF functioning. J
Bacteriol 187: 5857-5860
Nowaczyk MM, Hebeler R, Schlodder E, Meyer HE, Warscheid B, Rogner M (2006)
Psb27, a cyanobacterial lipoprotein, is involved in the repair cycle of photosystem II.
Plant Cell 18: 3121-3131
Ogura T, Inoue K, Tatsuta T, Suzaki T, Karata K, Young K, Su LH, Fierke CA,
Jackman JE, Raetz CR, Coleman J, Tomoyasu T, Matsuzawa H (1999) Balanced
biosynthesis of major membrane components through regulated degradation of the
committed enzyme of lipid A biosynthesis by the AAA protease FtsH (HflB) in
Escherichia coli. Mol Microbiol 31: 833-844
Ohad I, Keren N, Zer H, Gong H, Mor TS, Gal A, Tal S, Domovich Y (1994)
Light-induced degradation of the PSII reaction centre D1 protein in vivo: an
integrative approach. In: Baker NR, Bowyer JR, eds. Photoinhibition of
photosynthesis. Oxford: Bios Scientific Publishers: 161-177
Ohad I, Kyle DJ, Arntzen CJ (1984) Membrane protein damage and repair: removal
and replacement of inactivated 32-kilodalton polypeptides in chloroplast membranes.
J Cell Biol 99: 481-485
Ohnishi N, Allakhverdiev SI, Takahashi S, Higashi S, Watanabe M, Nishiyama Y,
Murata N (2005) Two-step mechanism of photodamage to Photosystem II: Step 1
occurs at the oxygen-evolving complex and step 2 occurs at the photochemical
reaction center. Biochemistry 44: 8494-8499
Okamoto S, Ikeuchi M, Ohmori M (1999) Experimental analysis of recently
transposed insertion sequences in the cyanobacterium Synechocystis sp. PCC 6803.
DNA Res 6: 265-273
Onai K, Morishita M, Kaneko T, Tabata S, Ishiura M (2004) Natural transformation
of the thermophilic cyanobacterium Thermosynechococcus elongatus BP-1: a simple
and efficient method for gene transfer. Mol Genet Genomics 271: 50-59
206
Ossenbühl F, Gohre V, Meurer J, Krieger-Liszkay A, Rochaix JD, Eichacker LA
(2004) Efficient assembly of photosystem II in Chlamydomonas reinhardtii requires
Alb3.1p, a homolog of Arabidopsis ALBINO3. Plant Cell 16: 1790-1800
Ossenbuhl F, Inaba-Sulpice M, Meurer J, Soll J, Eichacker LA (2006) The
Synechocystis sp PCC 6803 oxa1 homolog is essential for membrane integration of
reaction center precursor protein pD1. Plant Cell 18: 2236-2246
Peers G, Truong TB, Ostendorf E, Busch A, Elrad D, Grossman AR, Hippler M,
Niyogi KK (2009) An ancient light-harvesting protein is critical for the regulation of
algal photosynthesis. Nature 462: 518-521
Prasil O, Adir N, Ohad I (1992) Dynamics of PSII: mechanism of photoinhibition and
recovery processes. In: Barber J, ed. The photosystems: structure, function and
molecular biology. Amsterdam: Elsevier Science Publishers: 295-298
Pribil M, Pesaresi P, Hertle A, Barbato R, Leister D (2010) Role of plastid protein
phosphatase TAP38 in LHCII dephosphorylation and thylakoid electron flow. PLoS
Biol 8: e1000288
Prommeenate P, Lennon AM, Markert C, Hippler M, Nixon PJ (2004) Subunit
composition of NDH-1 complexes of Synechocystis sp. PCC 6803: identification of
two new ndh gene products with nuclear-encoded homologues in the chloroplast Ndh
complex. J Biol Chem 279: 28165-28173
Rengstl B, Oster U, Stengel A, Nickelsen J (2011) An intermediate membrane
subfraction in cyanobacteria is involved in an assembly network for Photosystem II
biogenesis. J Biol Chem 286: 21944-21951
Reuter W, Muller C (1993) New trends in photobiology : Adaptation of the
photosynthetic apparatus of cyanobacteria to light and co2. J Photochem Photobiol 21:
3-27
Rivalta I, Brudvig GW, Batista VS (2012) Oxomanganese complexes for natural and
artificial photosynthesis. Curr Opin Chem Biol 16: 11-18
Rochaix JD (2007) Role of thylakoid protein kinases in photosynthetic acclimation.
FEBS Lett 581: 2768-2775
Rodrigues RA, Silva-Filho MC, Cline K (2011) FtsH2 and FtsH5: two homologous
subunits use different integration mechanisms leading to the same thylakoid
multimeric complex. Plant J 65: 600-609
207
Roose JL, Pakrasi HB (2004) Evidence that D1 processing is required for manganese
binding and extrinsic protein assembly into photosystem II. J Biol Chem 279:
45417-45422
Roose JL, Pakrasi HB (2008) The Psb27 protein facilitates manganese cluster
assembly in photosystem II. J Biol Chem 283: 4044-4050
Ruban AV, Johnson MP, Duffy CD (2012) The photoprotective molecular switch in
the photosystem II antenna. Biochim Biophys Acta 1817: 167-181
Ruban AV, Young AJ, Horton P (1993) Induction of Nonphotochemical energy
dissipation and absorbance changes in leaves (Evidence for changes in the state of the
light-harvesting system of Photosystem II in vivo). Plant Physiol 102: 741-750
Ruprecht J, Nield, J (2001) Determining the structure of biological macromolecules
by transmission electron microscopy, single particle analysis and 3D reconstruction.
Prog. Biophys. Mol. Biol. 75: 121–164.
Saikawa N, Akiyama Y, Ito K (2004) FtsH exists as an exceptionally large complex
containing HflKC in the plasma membrane of Escherichia coli. J Struct Biol 146:
123-129
Sakamoto W (2003) Leaf-variegated mutations and their responsible genes in
Arabidopsis thaliana. Genes Gen Syst 78: 1-9
Sakamoto W, Zaltsman A, Adam Z, Takahashi Y (2003) Coordinated regulation and
complex formation of yellow variegated1 and yellow variegated2, chloroplastic FtsH
metalloproteases involved in the repair cycle of photosystem II in Arabidopsis
thylakoid membranes. Plant Cell 15: 2843-2855
Sarvikas P, Hakala M, Patsikka E, Tyystjarvi T, Tyystjarvi E (2006) Action spectrum
of photoinhibition in leaves of wild type and npq1-2 and npq4-1 mutants of
Arabidopsis thaliana. Plant Cell Physiol 47: 391-400
Sarvikas P, Tyystjarvi T, Tyystjarvi E (2010) Kinetics of prolonged photoinhibition
revisited: photoinhibited Photosystem II centres do not protect the active ones against
loss of oxygen evolution. Photosynth Res 103: 7-17
Sauer RT, Baker TA (2011) AAA+ proteases: ATP-fueled machines of protein
destruction. Annu Rev Biochem 80: 587-612
208
Schirmer EC, Glover JR, Singer MA, Lindquist S (1996) HSP100/Clp proteins: a
common mechanism explains diverse functions. Trends Biochem Sci 21: 289-296
Scholz O, Thiel A, Hillen W, Niederweis M (2000) Quantitative analysis of gene
expression with an improved green fluorescent protein. Eur J Biochem 267:
1565-1570
Schottkowski M, Gkalympoudis S, Tzekova N, Stelljes C, Schunemann D, Ankele E,
Nickelsen J (2009) Interaction of the periplasmic PratA factor and the PsbA (D1)
protein during biogenesis of photosystem II in Synechocystis sp. PCC 6803. J Biol
Chem 284: 1813-1819
Schottkowski M, Ratke J, Oster U, Nowaczyk M, Nickelsen J (2009b) Pitt, a novel
tetratricopeptide repeat protein involved in light-dependent chlorophyll biosynthesis
and thylakoid membrane biogenesis in Synechocystis sp. PCC 6803. Mol Plant 2:
1289-1297
Shapiguzov A, Ingelsson B, Samol I, Andres C, Kessler F, Rochaix JD, Vener AV,
Goldschmidt-Clermont M (2010) The PPH1 phosphatase is specifically involved in
LHCII dephosphorylation and state transitions in Arabidopsis. Proc Natl Acad Sci U
S A 107: 4782-4787
Sherman DM, Troyan TA, Sherman LA (1994) Localization of membrane proteins in
the cyanobacterium Synechococcus sp. PCC 7942. Plant Physiol 106: 251-262
Shi LX, Hall M, Funk C, Schroder WP (2012) Photosystem II, a growing complex:
updates on newly discovered components and low molecular mass proteins. Biochim
Biophys Acta 1817: 13-25
Shikanai T, Munekage Y, Kimura K (2002) Regulation of proton-to-electron
stoichiometry in photosynthetic electron transport: physiological function in
photoprotection. J Plant Res 115: 3-10
Shikanai T, Takeda T, Yamauchi H, Sano S, Tomizawa KI, Yokota A, Shigeoka S
(1998) Inhibition of ascorbate peroxidase under oxidative stress in tobacco having
bacterial catalase in chloroplasts. FEBS Lett 428: 47-51
Shinopoulos KE, Brudvig GW (2012) Cytochrome b-559 and cyclic electron transfer
within photosystem II. Biochim Biophys Acta 1817: 66-75
209
Shinopoulos KE, Yu J, Nixon PJ, Brudvig GW (2013) Using site-directed
mutagenesis to probe the role of the D2 carotenoid in the secondary electron-transfer
pathway of photosystem II. Photosynth Res (in press)
Shotland Y, Shifrin A, Ziv T, Teff D, Koby S, Kobiler O, Oppenheim AB (2000)
Proteolysis of bacteriophage lambda CII by Escherichia coli FtsH (HflB). J Bacteriol
182: 3111-3116
Silva P, Thompson E, Bailey S, Kruse O, Mullineaux CW, Robinson C, Mann NH,
Nixon PJ (2003) FtsH is involved in the early stages of repair of photosystem II in
Synechocystis sp PCC 6803. Plant Cell 15: 2152-2164
Sippola K, Aro EM (2000) Expression of psbA genes is regulated at multiple levels in
the cyanobacterium Synechococcus sp. PCC 7942. Photochem Photobiol 71: 706-714
Sokolenko A, Pojidaeva E, Zinchenko V, Panichkin V, Glaser VM, Herrmann RG,
Shestakov SV (2002) The gene complement for proteolysis in the cyanobacterium
Synechocystis sp. PCC 6803 and Arabidopsis thaliana chloroplasts. Curr Genet 41:
291-310
Spetea C, Hundal T, Lohmann F, Andersson B (1999) GTP bound to chloroplast
thylakoid membranes is required for light-induced, multienzyme degradation of the
photosystem II D1 protein. Proc Natl Acad Sci U S A 96: 6547-6552
Stanier RY, Kunisawa R, Mandel M, Cohen-Bazire G (1971) Purification and
properties of unicellular blue-green algae (order Chroococcales). Bacteriol Rev 35:
171-205
Steglich G, Neupert W, Langer T (1999) Prohibitins regulate membrane protein
degradation by the m-AAA protease in mitochondria. Mol Cell Biol 19: 3435-3442
Stengel A, Gugel IL, Hilger D, Rengstl B, Jung H, Nickelsen J (2012) Initial steps of
photosystem II de novo assembly and preloading with manganese take place in
biogenesis centers in Synechocystis. Plant Cell 24: 660-675
Stewart DH, Brudvig GW (1998) Cytochrome b559 of photosystem II. Biochim
Biophys Acta 1367: 63-87
Stirnberg M, Fulda S, Huckauf J, Hagemann M, Kramer R, Marin K (2007) A
membrane-bound FtsH protease is involved in osmoregulation in Synechocystis sp.
PCC 6803: the compatible solute synthesizing enzyme GgpS is one of the targets for
proteolysis. Mol Microbiol 63: 86-102
210
Styring S, Virgin I, Ehrenberg A, Andersson B (1990) Strong light photoinhibition of
electron-transport in Photosystem II - Impairment of the function of the 1st quinone
acceptor, Qa. Biochim Biophys Acta 1015: 269-278
Suno R, Niwa H, Tsuchiya D, Zhang X, Yoshida M, Morikawa K (2006) Structure of
the whole cytosolic region of ATP-dependent protease FtsH. Mol Cell 22: 575-585
Symes MD, Lutterman DA, Teets TS, Anderson BL, Breen JJ, Nocera DG (2013)
Photo-active cobalt cubane model of an oxygen-evolving catalyst. ChemSusChem 6:
65-69
Takahashi S, Milward SE, Fan DY, Chow WS, Badger MR (2009) How does cyclic
electron flow alleviate photoinhibition in Arabidopsis? Plant Physiol 149: 1560-1567
Takeda T, Yokota A, Shigeoka S (1995) Resistance of photosynthesis to hydrogen
peroxide in algae. Plant Cell Physiol 36: 1089-1095
Tamoi M, Murakami A, Takeda T, Shigeoka S (1998) Acquisition of a new type of
fructose-1,6-bisphosphatase with resistance to hydrogen peroxide in cyanobacteria:
molecular characterization of the enzyme from Synechocystis PCC 6803. Biochim
Biophys Acta 1383: 232-244
Tikkanen M, Nurmi M, Kangasjarvi S, Aro EM (2008) Core protein phosphorylation
facilitates the repair of photodamaged photosystem II at high light. Biochim Biophys
Acta 1777: 1432-1437
Tikkanen M, Piippo M, Suorsa M, Sirpio S, Mulo P, Vainonen J, Vener AV,
Allahverdiyeva Y, Aro EM (2006) State transitions revisited-a buffering system for
dynamic low light acclimation of Arabidopsis. Plant Mol Biol 62: 779-793
Tilman D, Cassman KG, Matson PA, Naylor R, Polasky S (2002) Agricultural
sustainability and intensive production practices. Nature 418: 671-677
Tomoyasu T, Gamer J, Bukau B, Kanemori M, Mori H, Rutman AJ, Oppenheim AB,
Yura T, Yamanaka K, Niki H, et al. (1995) Escherichia coli FtsH is a
membrane-bound, ATP-dependent protease which degrades the heat-shock
transcription factor sigma 32. EMBO J 14: 2551-2560
Tsukazaki T, Mori H, Echizen Y, Ishitani R, Fukai S, Tanaka T, Perederina A,
Vassylyev DG, Kohno T, Maturana AD, Ito K, Nureki O (2011) Structure and
function of a membrane component SecDF that enhances protein export. Nature 474:
235-238
211
Umena Y, Kawakami K, Shen J-R, Kamiya N (2011) Crystal structure of
oxygen-evolving photosystem II at a resolution of 1.9Å. Nature 473: 55-60
Van Aken O, Pecenkova T, van de Cotte B, De Rycke R, Eeckhout D, Fromm H, De
Jaeger G, Witters E, Beemster GT, Inze D, Van Breusegem F (2007) Mitochondrial
type-I prohibitins of Arabidopsis thaliana are required for supporting proficient
meristem development. Plant J 52: 850-864
Van Heel M (1987) Angular reconstitution: a posteriori assignment of projection
directions for 3D reconstruction. Ultramicroscopy 21: 111–123
Van Heel M, Schatz M (2005) Fourier shell correlation threshold criteria. J. Struct.
Biol. 151: 250–262
van Stelten J, Silva F, Belin D, Silhavy TJ (2009) Effects of antibiotics and a
proto-oncogene homolog on destruction of protein translocator SecY. Science 325:
753-756
Vass I, Styring S, Hundal T, Koivuniemi A, Aro EM, Andersson B (1992) Reversible
and irreversible intermediates during photoinhibition of Photosystem II. Stable
reduced Qa species promote chlorophyll triplet formation. Proc Natl Acad Sci USA
89: 1408-1412
Vasudevan D, Fu A, Luan S, Swaminathan K (2012) Crystal structure of Arabidopsis
cyclophilin38 reveals a previously uncharacterized immunophilin fold and a possible
autoinhibitory mechanism. Plant Cell 24: 2666-2674
Wada H, Gombos Z, Murata N (1994) Contribution of membrane lipids to the ability
of the photosynthetic machinery to tolerate temperature stress. Proc Natl Acad Sci U
S A 91: 4273-4277
Wagner R, Aigner H, Funk C (2012) FtsH proteases located in the plant chloroplast.
Physiol Plant 145: 203-214
Wang Q, Sullivan RW, Kight A, Henry RL, Huang J, Jones AM, Korth KL (2004)
Deletion of the chloroplast-localized Thylakoid formation1 gene product in
Arabidopsis leads to deficient thylakoid formation and variegated leaves. Plant
Physiol 136: 3594-3604
Wei Z, Cady CW, Brudvig GW, Hou HJ (2011) Photodamage of a Mn(III/IV)-oxo
mixed-valence compound and photosystem II: evidence that a high-valent manganese
212
species is responsible for UV-induced photodamage of the oxygen-evolving complex
in photosystem II. J Photochem Photobiol 104: 118-125
Westphal K, Langklotz S, Thomanek N, Narberhaus F (2012) A trapping approach
reveals novel substrates and physiological functions of the essential protease FtsH in
Escherichia coli. J Biol Chem 287: 42962-42971
Williams JGK (1988) Construction of specific mutations in photosystem II
photosynthetic reaction center by genetic engineering methods in Synechocystis 6803.
In: Lester Packer ANG (ed) Methods in Enzymology: Cyanobacteria. Academic Press,
pp 766-778
Wingler A, Lea PJ, Quick WP, Leegood RC (2000) Photorespiration: metabolic
pathways and their role in stress protection. Philos Trans R Soc Lond B Biol Sci 355:
1517-1529
Yamamoto T, Burke J, Autz G, Jagendorf AT (1981) Bound ribosomes of pea
chloroplast thylakoid membranes: Location and release in vitro by high Salt,
puromycin, and RNase. Plant Physiol 67: 940-949
Yang Y, Ramelot TA, Cort JR, Wang D, Ciccosanti C, Hamilton K, Nair R, Rost B,
Acton TB, Xiao R, Everett JK, Montelione GT, Kennedy MA (2011) Solution NMR
structure of photosystem II reaction center protein Psb28 from Synechocystis sp.
Strain PCC 6803. Proteins 79: 340-344
Yu F, Park S, Rodermel SR (2005) Functional redundancy of AtFtsH
metalloproteases in thylakoid membrane complexes. Plant Physiol 138: 1957-1966
Zaborina O, Holbrook C, Chen Y, Long J, Zaborin A, Morozova I, Fernandez H,
Wang Y, Turner JR, Alverdy JC (2008) Structure-function aspects of PstS in
multi-drug-resistant Pseudomonas aeruginosa. PLoS pathogens 4: e43
Zaltsman A, Ori N, Adam Z (2005) Two types of FtsH protease subunits are required
for chloroplast biogenesis and Photosystem II repair in Arabidopsis. Plant Cell 17:
2782-2790
Zhang D, Kato Y, Zhang L, Fujimoto M, Tsutsumi N, Sodmergen, Sakamoto W
(2010) The FtsH protease heterocomplex in Arabidopsis: dispensability of type-B
protease activity for proper chloroplast development. Plant Cell 22: 3710-3725
Zhang L, Wei Q, Wu W, Cheng Y, Hu G, Hu F, Sun Y, Zhu Y, Sakamoto W, Huang J
(2009) Activation of the heterotrimeric G protein alpha-subunit GPA1 suppresses the
213
ftsH-mediated inhibition of chloroplast development in Arabidopsis. Plant J 58:
1041-1053
Zhang P, Sicora CI, Vorontsova N, Allahverdiyeva Y, Battchikova N, Nixon PJ, Aro
EM (2007) FtsH protease is required for induction of inorganic carbon acquisition
complexes in Synechocystis sp. PCC 6803. Mol Microbiol 65: 728-740
Zhang PP, Battchikova N, Jansen T, Appel J, Ogawa T, Aro EM. (2004) Expression
and functional roles of the two distinct NDH-1 complexes and the carbon acquisition
complex NdhD3/NdhF3/CupA/Sll1735 in Synechocystis sp PCC 6803. Plant Cell 16:
3326–3340
Zolla L, Rinalducci S (2002) Involvement of active oxygen species in degradation of
light-harvesting proteins under light stresses. Biochemistry 41: 14391-14402
Zouni A, Witt HT, Kern J, Fromme P, Krauss N, Saenger W, Orth P (2001) Crystal
structure of photosystem II from Synechococcus elongatus at 3.8 Å resolution. Nature
409: 739-743
Zurawski G, Bohnert HJ, Whitfeld PR, Bottomley W (1982) Nucleotide sequence of
the gene for the M(r) 32,000 thylakoid membrane protein from Spinacia oleracea and
Nicotiana debneyi predicts a totally conserved primary translation product of M(r)
38,950. Proc Natl Acad Sci USA 79: 7699-7703
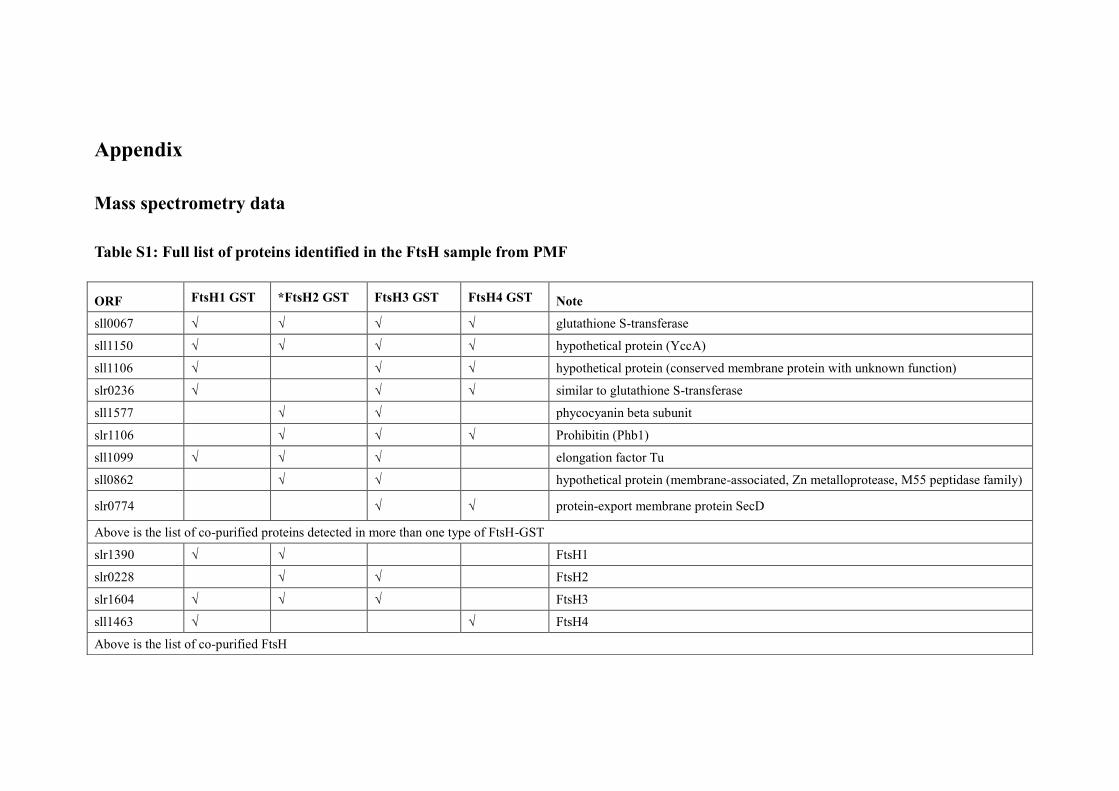
Appendix
Mass spectrometry data
Table S1: Full list of proteins identified in the FtsH sample from PMF
ORF FtsH1 GST *FtsH2 GST FtsH3 GST FtsH4 GST Note
sll0067 √ √ √ √ glutathione S-transferase
sll1150 √ √ √ √ hypothetical protein (YccA)
sll1106 √ √ √ hypothetical protein (conserved membrane protein with unknown function)
slr0236 √ √ √ similar to glutathione S-transferase
sll1577 √ √ phycocyanin beta subunit
slr1106 √ √ √ Prohibitin (Phb1)
sll1099 √ √ √ elongation factor Tu
sll0862 √ √ hypothetical protein (membrane-associated, Zn metalloprotease, M55 peptidase family)
slr0774 √ √ protein-export membrane protein SecD
Above is the list of co-purified proteins detected in more than one type of FtsH-GST
slr1390 √ √ FtsH1
slr0228 √ √ FtsH2
slr1604 √ √ √ FtsH3
sll1463 √ √ FtsH4
Above is the list of co-purified FtsH
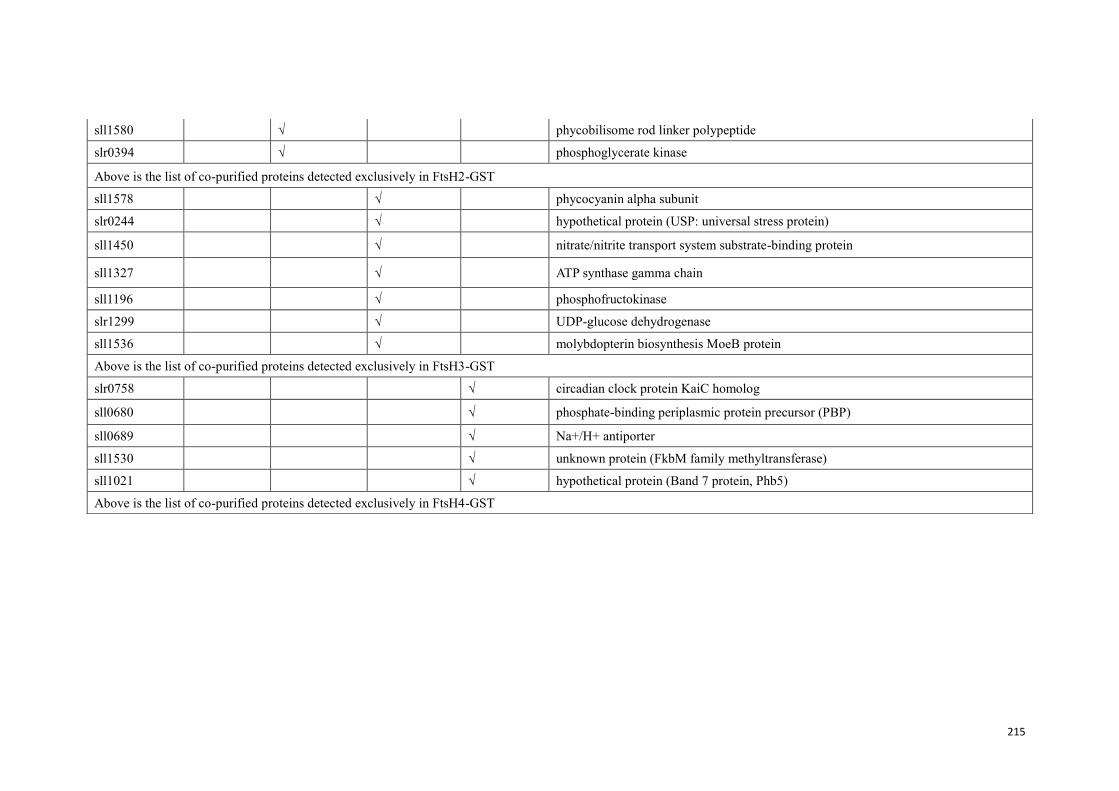
215
sll1580 √ phycobilisome rod linker polypeptide
slr0394 √ phosphoglycerate kinase
Above is the list of co-purified proteins detected exclusively in FtsH2-GST
sll1578 √ phycocyanin alpha subunit
slr0244 √ hypothetical protein (USP: universal stress protein)
sll1450 √ nitrate/nitrite transport system substrate-binding protein
sll1327 √ ATP synthase gamma chain
sll1196 √ phosphofructokinase
slr1299 √ UDP-glucose dehydrogenase
sll1536 √ molybdopterin biosynthesis MoeB protein
Above is the list of co-purified proteins detected exclusively in FtsH3-GST
slr0758 √ circadian clock protein KaiC homolog
sll0680 √ phosphate-binding periplasmic protein precursor (PBP)
sll0689 √ Na+/H+ antiporter
sll1530 √ unknown protein (FkbM family methyltransferase)
sll1021 √ hypothetical protein (Band 7 protein, Phb5)
Above is the list of co-purified proteins detected exclusively in FtsH4-GST
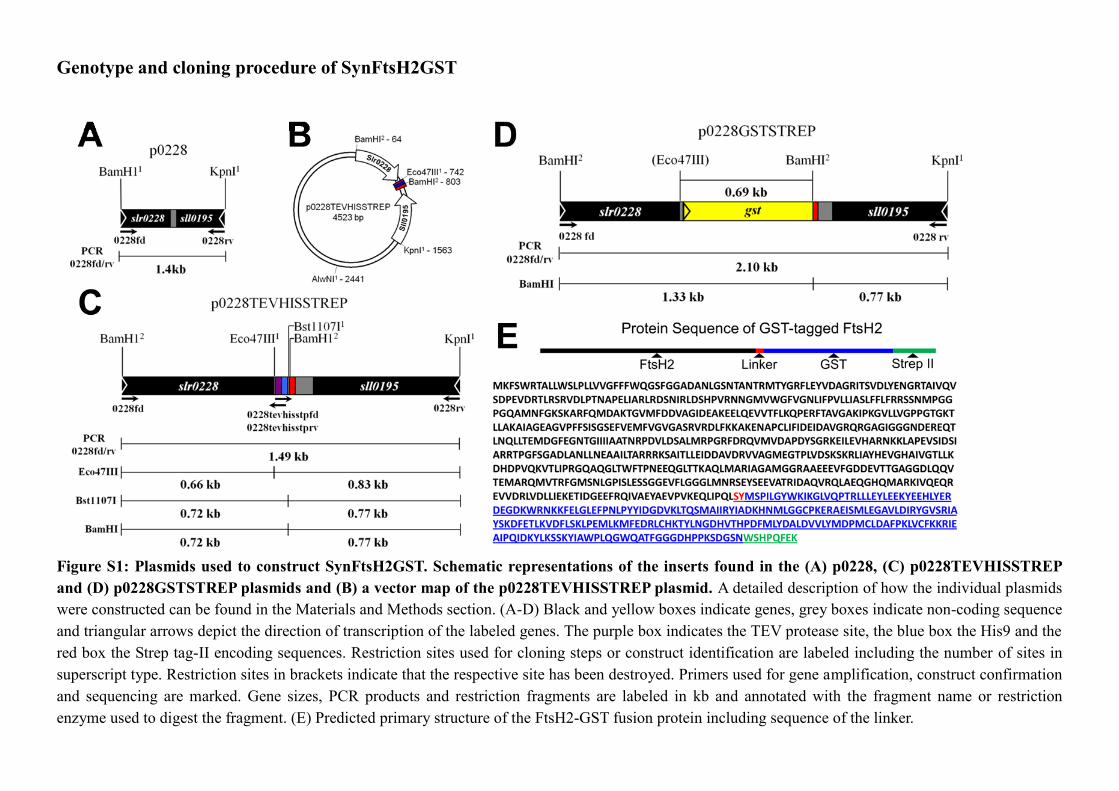
Genotype and cloning procedure of SynFtsH2GST
Figure S1: Plasmids used to construct SynFtsH2GST. Schematic representations of the inserts found in the (A) p0228, (C) p0228TEVHISSTREP
and (D) p0228GSTSTREP plasmids and (B) a vector map of the p0228TEVHISSTREP plasmid. A detailed description of how the individual plasmids
were constructed can be found in the Materials and Methods section. (A-D) Black and yellow boxes indicate genes, grey boxes indicate non-coding sequence
and triangular arrows depict the direction of transcription of the labeled genes. The purple box indicates the TEV protease site, the blue box the His9 and the
red box the Strep tag-II encoding sequences. Restriction sites used for cloning steps or construct identification are labeled including the number of sites in
superscript type. Restriction sites in brackets indicate that the respective site has been destroyed. Primers used for gene amplification, construct confirmation
and sequencing are marked. Gene sizes, PCR products and restriction fragments are labeled in kb and annotated with the fragment name or restriction
enzyme used to digest the fragment. (E) Predicted primary structure of the FtsH2-GST fusion protein including sequence of the linker.
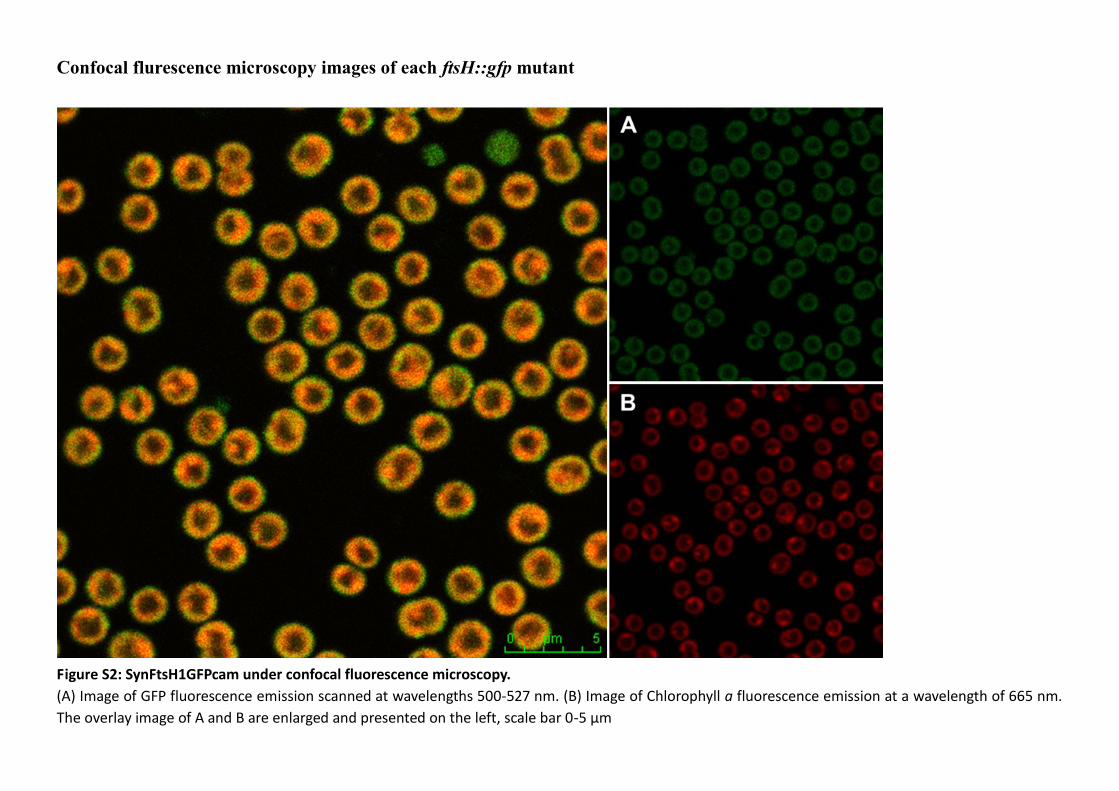
Confocal flurescence microscopy images of each ftsH::gfp mutant
Figure S2: SynFtsH1GFPcam under confocal fluorescence microscopy.
(A) Image of GFP fluorescence emission scanned at wavelengths 500-527 nm. (B) Image of Chlorophyll a fluorescence emission at a wavelength of 665 nm.
The overlay image of A and B are enlarged and presented on the left, scale bar 0-5 µm
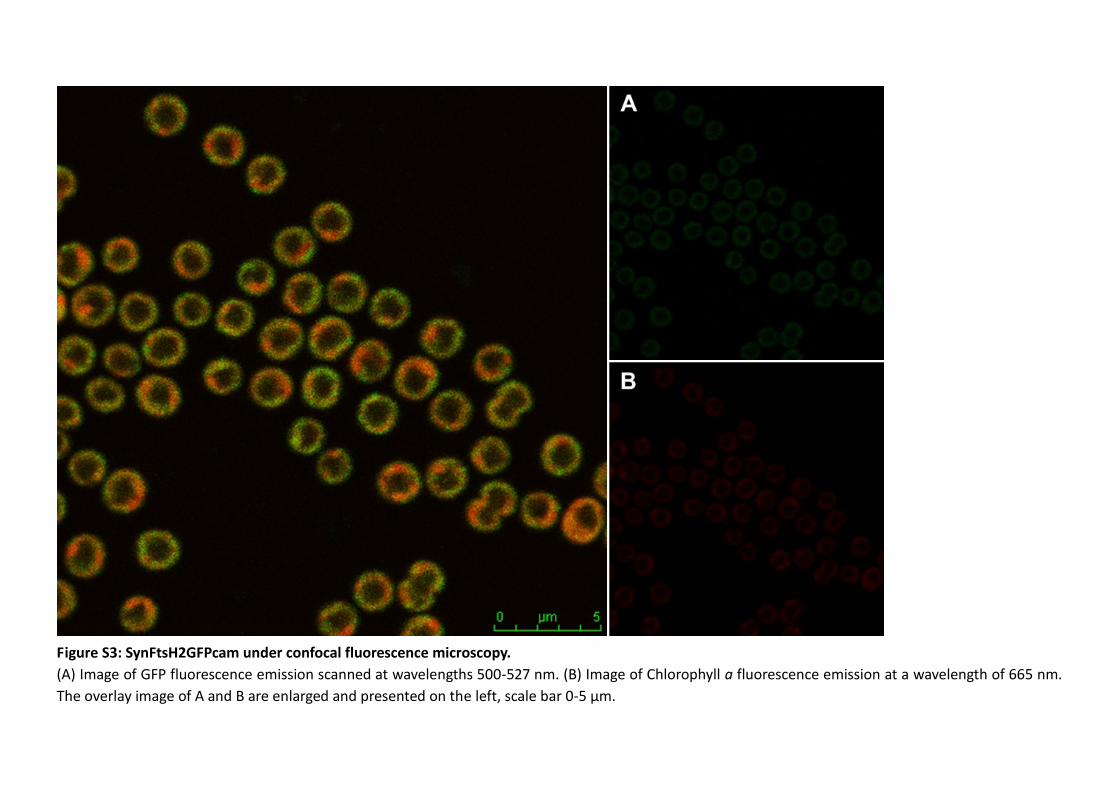
Figure S3: SynFtsH2GFPcam under confocal fluorescence microscopy.
(A) Image of GFP fluorescence emission scanned at wavelengths 500-527 nm. (B) Image of Chlorophyll a fluorescence emission at a wavelength of 665 nm.
The overlay image of A and B are enlarged and presented on the left, scale bar 0-5 µm.
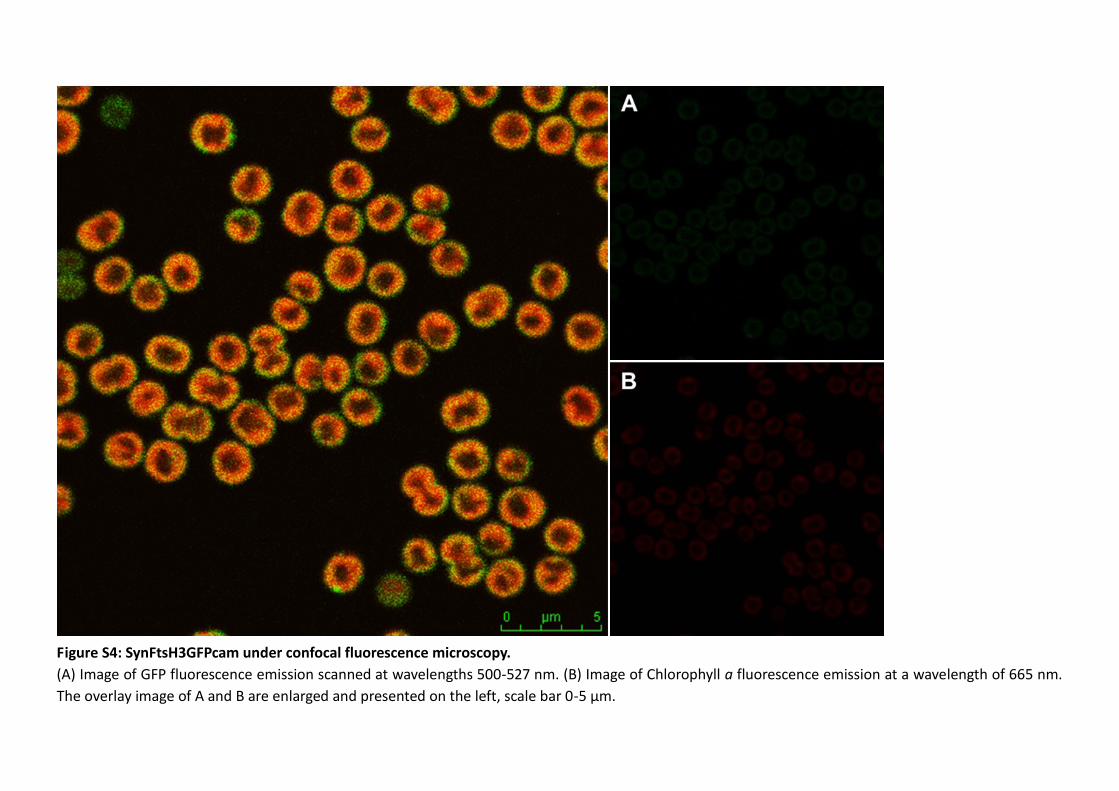
Figure S4: SynFtsH3GFPcam under confocal fluorescence microscopy.
(A) Image of GFP fluorescence emission scanned at wavelengths 500-527 nm. (B) Image of Chlorophyll a fluorescence emission at a wavelength of 665 nm.
The overlay image of A and B are enlarged and presented on the left, scale bar 0-5 µm.
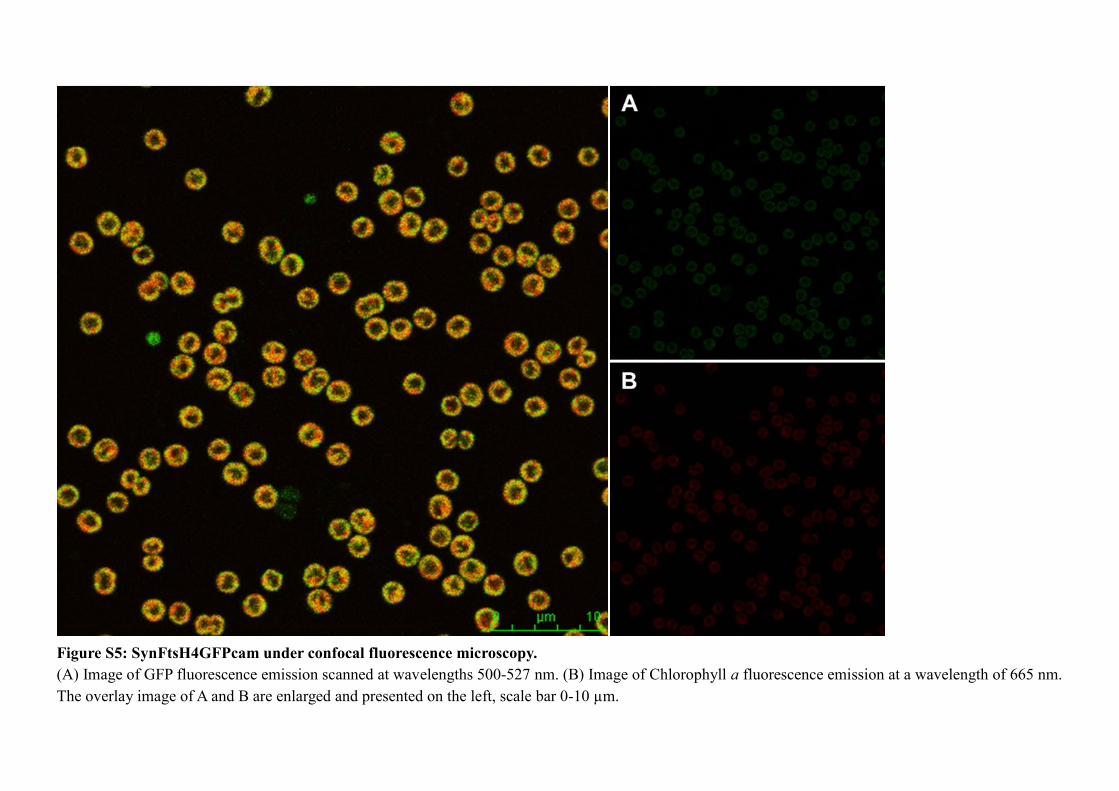
Figure S5: SynFtsH4GFPcam under confocal fluorescence microscopy.
(A) Image of GFP fluorescence emission scanned at wavelengths 500-527 nm. (B) Image of Chlorophyll a fluorescence emission at a wavelength of 665 nm.
The overlay image of A and B are enlarged and presented on the left, scale bar 0-10 µm.