Embed Size (px)
Citation preview
Investigation of Fuel Chemistry and Bed Properties in
a Fluidized Bed Black Liquor Steam Reformer
DOE Cooperative Agreement DE-FC26-02NT41490
Quarterly Report
Reporting Period Start Date: 01/01/2003 Reporting Period End Date: 03/31/2003
Principal Author: Kevin Whitty
Prime (submitting) Organization: University of Utah 1471 East Federal Way Salt Lake City, UT 84102 Project Subcontractors: Brigham Young University Reaction Engineering International A-261 ASB 77 West 200 South, Suite 210 Provo, UT 84602 Salt Lake City, UT 84101 University of Maine Georgia Tech Research Corp 5717 Corbett Hall 505 Tenth Street, NW Orono, ME 04469 Atlanta, GA 30318
DISCLAIMER
This report was prepared as an account of work sponsored by an agency of the United States Government. Neither the United States Government nor any agency thereof, nor any of their employees, makes any warranty, express or implied, or assumes any legal liability or responsibility for the accuracy, completeness, or usefulness of any information, apparatus, product, or process disclosed, or represents that its use would not infringe privately owned rights. Reference herein to any specific commercial product, process, or service by trade name, trademark, manufacturer, or otherwise does not necessarily constitute or imply its endorsement, recommendation, or favoring by the United States Government or any agency thereof. The views and opinions of authors expressed herein do not necessarily state or reflect those of the United States Government or any agency thereof.
i
ABSTRACT
University of Utah's project "Investigation of Fuel Chemistry and Bed Agglomeration in a Fluidized Bed Black Liquor Steam Reformer" (DE-FC26-02NT41490) has been in progress for six months. Activity during the most recent quarter focused on (1) finalizing the design of the University of Utah gasification test system, (2) constructing and performing tests with the cold flow model of the Utah gasifier, (3) designing the bed agglomeration reactor and testing a cold flow version of this and (4) modeling the Big Island black liquor steam reformer.
The designs for all major components of the gasification test system are complete. The fluidized bed reactor underwent a significant redesign to make it a refractory-lined unit, and final engineering approval of this design is pending. The layout of the whole system, including the position of the components relative to one another and the pit design, has been established.
The cold flow model was constructed and several tests were performed under a variety of conditions. The system was videotaped during operation and movies were distributed on CD-ROM. The cold flow system confirms that the real gasifier will have well-distributed flow of gas without bed slugging or gas bypassing the tube bundles.
Brigham Young University has constructed a cold flow version of the bed agglomeration reactor they have designed, and have performed tests to identify fluidizing behavior in this rig. A model of the fluidization has been developed, and background reviews to identify suitable properties of bed material have been carried out.
Reaction Engineering International has completed the first version of a 1½-D model for the Big Island steam reformer that includes fluid dynamics, energy and mass transfer and chemistry in the system. The model indicates that the temperature profile throughout the reactor will not be uniform, but will vary from top to bottom as a result of liquor injection, heat transfer in the pulsed combustion heater bundle sections and chemistry within the system.
ii
TABLE OF CONTENTS
Abstract ........................................................................................................................................................................... i Table of Contents ........................................................................................................................................................... ii 1. Introduction ............................................................................................................................................................ 1 2. Project Status .......................................................................................................................................................... 2
2.1 Summary of Progress this Quarter ................................................................................................................ 2 2.2 Current Status of Individual Technical Tasks ............................................................................................... 3
3. Experimental Devices and Procedures.................................................................................................................... 5 3.1 Fluidized Bed Black Liquor Gasification Test System ................................................................................. 5
3.1.1 Steam Feed System......................................................................................................................... 5 3.1.2 Black Liquor Feed System ............................................................................................................. 7 3.1.3 Fluidized Bed Reactor .................................................................................................................... 7 3.1.4 Solids Removal System.................................................................................................................. 8 3.1.5 Product Gas Handling System........................................................................................................ 8
3.2 Fluidized Bed Gasifier Cold Flow Model ..................................................................................................... 9 3.3 BYU Bed Agglomeration Test Reactor....................................................................................................... 11
4. Experimental Results and Discussion................................................................................................................... 12 5. Computational Modeling – Description and Results ............................................................................................ 13
5.1 Generic, Simple Steam Reformer Model ("Whitty Model") ....................................................................... 13 5.1.1 General Description...................................................................................................................... 13 5.1.2 Treatment of Chemistry and Liquor Conversion throughout the Reactor .................................... 14 5.1.3 Level-by-Level Calculations ........................................................................................................ 15 5.1.4 Results for Modeling of the Big Island Steam Reformer ............................................................. 16
5.2 Computational Model of Entire Reactor (REI 1½-D Model)...................................................................... 18 5.2.1 Three-Phase Bubbling Fluidized Bed Model Description ............................................................ 18 5.2.2 Preliminary Model Results ........................................................................................................... 25 5.2.3 Future Work ................................................................................................................................. 27
6. Conclusions .......................................................................................................................................................... 27 Nomenclature............................................................................................................................................................... 28 References.................................................................................................................................................................... 30
1
INVESTIGATION OF FUEL CHEMISTRY AND BED PROPERTIES IN A FLUIDIZED BED BLACK LIQUOR STEAM REFORMER
(DE-FC26-02NT41490)
Quarterly Report for Project Year 1, Quarter 2
1. INTRODUCTION
University of Utah's project entitled "Investigation of Fuel Chemistry and Bed Behavior in a Fluidized Bed Black Liquor Steam Reformer" (DOE Cooperative Agreement DE-FC26-02NT41490) officially began September 30, 2002. The project was developed in response to a solicitation released by the U.S. Department of Energy National Energy Technology Laboratory (DOE/NETL) in December 2001, requesting proposals for projects targeted towards black liquor/biomass gasification technology support research and development. Specifically, the RFP was seeking projects that would provide technical support for Department of Energy supported black liquor and biomass gasification demonstration projects under development at the time.
The University of Utah project was developed to provide technical support for the demonstration of MTCI's black liquor steam reforming process at Georgia-Pacific's paper mill in Big Island, Virginia. The project includes a number of tasks to achieve this end:
1. Construction of a fluidized bed black liquor gasification test system 2. Investigation of bed performance 2.1 Mapping of bed properties and chemistry 2.2 Evaluation of bed agglomeration propensity 2.3 Evaluation of titanate addition 3. Evaluation of product gas quality 3.1 Speciation of gaseous products 3.2 Characterization and destruction of tars 4. Black liquor conversion analysis and modeling 5. Modeling of the Big Island gasifier 5.1 1½-D model of entire reactor 5.2 3-D modeling of specific parts of the reactor 6. Project management
The project includes four subcontracts to groups that possess expertise in technical areas relevant to the project. These subcontractors and their corresponding roles within the project are:
1. Brigham Young University (Prof. Larry Baxter): bed agglomeration studies 2. University of Maine (Prof. Adriaan van Heiningen): conversion analysis/modeling and Ti addition 3. Georgia Institute of Technology (Prof. Pradeep Agrawal): catalytic destruction of tars 4. Reaction Engineering International (Dr. Adel Sarofim): gasifier modeling
This report provides an update on the status of the project, presents accomplishments to date, describes the experiments and modeling associated with the project and gives results and conclusions of the work.
Quarterly technical progress report for DOE project DE-FC26-02NT41490 Project year 1, quarter 2
2
2. PROJECT STATUS
The project is progressing, though all procurement and construction of the University of Utah gasification test system has been suspended on orders from the Department of Energy until particular funding details can be sorted out. All other activities, including design of the gasification system, are allowed to continue as planned.
2.1 Summary of Progress this Quarter Significant effort was put into many of the project tasks during this quarter. Achievements for the quarter are summarized below.
Utah Gasification Test System Design. During this quarter the design of all major components of the test system was completed, though the fluidized bed reactor design is pending approval by a professional engineering firm. The approach for handling the product gas (syngas) was modified to lower construction costs and improve safety. The configuration of the whole system, placement of components in relation to one another and the dimensions and design of the pit, were determined. The overall design of the system is now essentially complete, and the project is ready to enter the procurement and construction phase.
Cold Flow Gasifier Model. The cold flow model of the University of Utah's gasification test system was constructed and preliminary tests were carried out. Based on the results of these, some design modifications were made and additional tests were performed. The bed was videotaped while operating, and digital movie clips under several conditions were edited and placed on CD-ROM for viewing on a personal computer. Copies of the CD-ROM were distributed.
Bed Agglomeration Studies. Brigham Young University has been working on design of the experimental reactor for bed agglomeration studies. Correlations were taken from the literature summary that enabled profiles to be developed of pressure drop versus flow rate, bed height versus flow rate, minimum fluidization velocity versus temperature and particle diameter. These profiles have been developed but they have not yet been verified experimentally. The preliminary model of the reactor was also developed, made out of ABS pipe and Plexiglas. Sand was used as the bed with compressed house air as the fluidizing agent. Further research was done to determine properties of black liquor of interest in the fluid bed reactor.
Computational Modeling. The relatively simple "Whitty model" used for design of the Utah gasification test system was cleaned up and updated to account for the progression of gas composition, pressure, and gas velocity throughout the bed. The development, assumptions, treatment of liquor conversion and design of the model were documented, and are included in this report.
The more advanced "REI 1½-D model" being developed by Reaction Engineering International saw significant progress during this quarter. In February, Professor Leon Glicksman from MIT visited and provided useful guidance on the treatment of bubbles and gas flow through the bed. Based partly on Prof. Glicksman's input, a three-phase bubbling fluidized bed model was developed. Mass and energy balances have been incorporated into the model, as have kinetics for the chemical reactions that occur in the reformer. Details of the REI 1½-D model are provided in Section 5.2.
Quarterly technical progress report for DOE project DE-FC26-02NT41490 Project year 1, quarter 2
3
2.2 Current Status of Individual Technical Tasks The status of each of the five technical tasks as per the end of the second quarter, March 31, 2003, is described below. Anticipated progress during the next quarter is also indicated.
Task 1 — Construction of a fluidized bed black liquor gasification test system. Design of the black liquor gasification test system is essentially complete. All major components have been specified and designed, and the basic overall layout of the system has been determined.
The reactor envisioned in the original proposal called for a dual vessel system, an outer carbon steel pressure vessel housing an inner stainless steel reactor vessel, plus shell heaters to heat the system. During the project kickoff meeting October 16-17, experts from MTCI/ThermoChem and Georgia Pacific recommended instead a single wall "hot shell" design, which would greatly simplify construction and installation of the system.
During this quarter, it was determined that a "hot shell" reactor is prohibitively complex and expensive. The design called for a vessel that not only would be exposed to high temperatures and the potentially corrosive environment in the reactor, but would also be a pressure vessel that would have to conform to ASME specifications and have an ASME stamp. With the help of materials experts at Oak Ridge National Laboratory, several potential construction materials were evaluated and two alternatives, SS321 and Incoloy 800H, were identified. A hybrid design, using "super alloy" 800H in areas receiving the most severe exposure (e.g., heater bundles, distributor) and less expensive SS321 for other parts of the system, was developed. Price quotes were received for the individual flanges and pipes that would make up the system, assuming 300# class flanges. The cost for parts alone, excluding fabrication, far exceeded that budgeted for the reactor. The design was brought to an engineering firm for review, and it was learned that to meet ASME specifications the SS321 flanges would actually have to be 600# class to handle the design temperature and pressure. The decision to abandon the hot shell design was made at this point.
The current reactor design calls for a refractory-lined carbon steel pressure vessel, described in detail in Section 3.1. The preliminary detailed design of this reactor is complete, and is being sent for engineering review. An operational drawback to this design is that the refractory lining requires several days to heat up and cool down. However, the reactor will be much less costly to build and operate.
For the overall system, preliminary process and instrumentation diagrams (P&ID's) have been developed and component balances for the system have been calculated for four cases: standard (Big Island) conditions, low pressure, high pressure and high black liquor flow. These balances have been used to size the equipment. All major components of the system (black liquor feed pump, boiler feedwater conditioner, boiler, steam superheater, reactor, product gas combustor, flue gas cooler/condenser) have been specified and designed. Details of these units are provided in Section 3.1.
Two alternatives for the product gas handling system were considered. With Alternative A, the product gas from the reactor is fed directly into a natural gas-fired afterburner, with minimal cooling before the combustor to minimize the risk of condensation of organic species in the gas line. Alternative B involves first cooling and condensing water from the product gas, burning the concentrated syngas in an afterburner, then cooling/condensing this flue gas. The advantage of Alternative B is that the syngas is able to sustain combustion with little or no natural gas assist, saving approximately $6000 per year in natural gas costs and allowing a much smaller afterburner. However, Alternative B is also more complex, requiring two condenser/coolers, and the concentrated syngas would be highly poisonous (H2S concentrations on the order of 10,000 ppm when running kraft liquor). Largely due to safety concerns, it was decided to go with Alternative A.
Quarterly technical progress report for DOE project DE-FC26-02NT41490 Project year 1, quarter 2
4
During the next quarter, the refractory-lined reactor design will be finalized and will receive engineering approval. Finishing touches on the overall design of the system will be added, and a detailed 3-D model of the whole system layout will be created. When the procurement and construction are allowed to proceed, equipment orders will be placed and construction of the foundation and support structure for the system will begin.
Task 2 — Investigation of bed performance. Two of the three subtasks in this task involve experimentation in the gasifier system and will be conducted later in the program. One element of the third, evaluation of bed agglomeration propensity, is in progress at Brigham Young University. A literature search on melting properties of inorganic components and mixtures is underway. Design of the fluidized bed agglomeration test system (described in Section 3.3) is in progress, and a transparent cold-flow model of this system has been constructed to identify suitable flow regimes and distributor design. Construction of the real test system should be completed during the next quarter.
Task 3 — Evaluation of product gas quality. This task centers on experiments in the gasifier, and will not begin until after the gasification test system has been constructed.
Task 4 — Black liquor conversion analysis and modeling. Much of this task involves interpretation of data from the gasifier, and will not begin until later in the program. For appropriate interpretation of this data, however, the gasifier data must be augmented with results from more fundamental experiments. Over the past two decades many groups in North America and Scandinavia have investigated black liquor pyrolysis and gasification in well-controlled laboratory experiments. Efforts are underway to amass and organize this information.
Task 5 — Modeling of the Big Island gasifier. Development of the 1½-D model of the entire gasifier is progressing well. A preliminary version of this model, including fluid dynamics, mass transfer, energy transfer and chemistry, has been developed. Results of this modeling are presented in Section 5. Development of the 3-D model is not scheduled to begin until later in the program.
Quarterly technical progress report for DOE project DE-FC26-02NT41490 Project year 1, quarter 2
5
3. EXPERIMENTAL DEVICES AND PROCEDURES
The project has three primary experimental systems: the black liquor gasification test system, a cold-flow model of the fluidized bed reactor and a bed agglomeration test reactor. These systems are described in the sections that follow.
3.1 Fluidized Bed Black Liquor Gasification Test System The University of Utah's fluidized bed black liquor gasifier has been designed to simulate conditions in the bottom of Georgia-Pacific's Big Island demonstration system. Design specifications for the system are listed in Table 1.
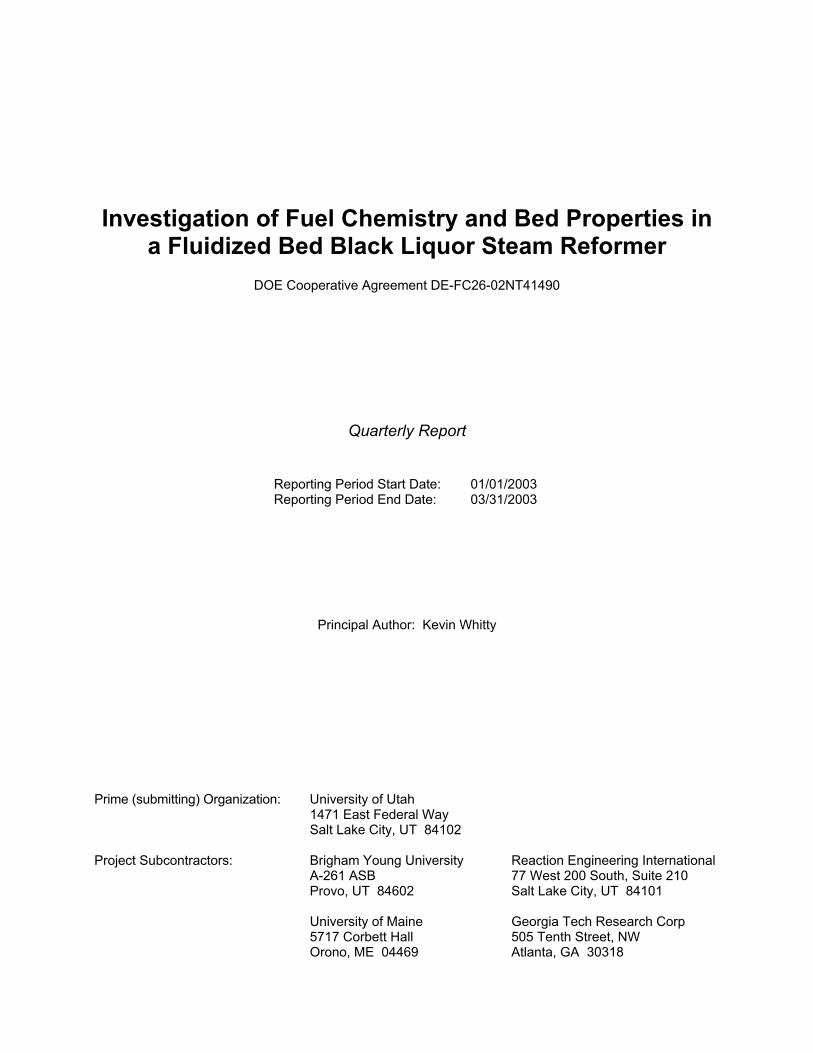
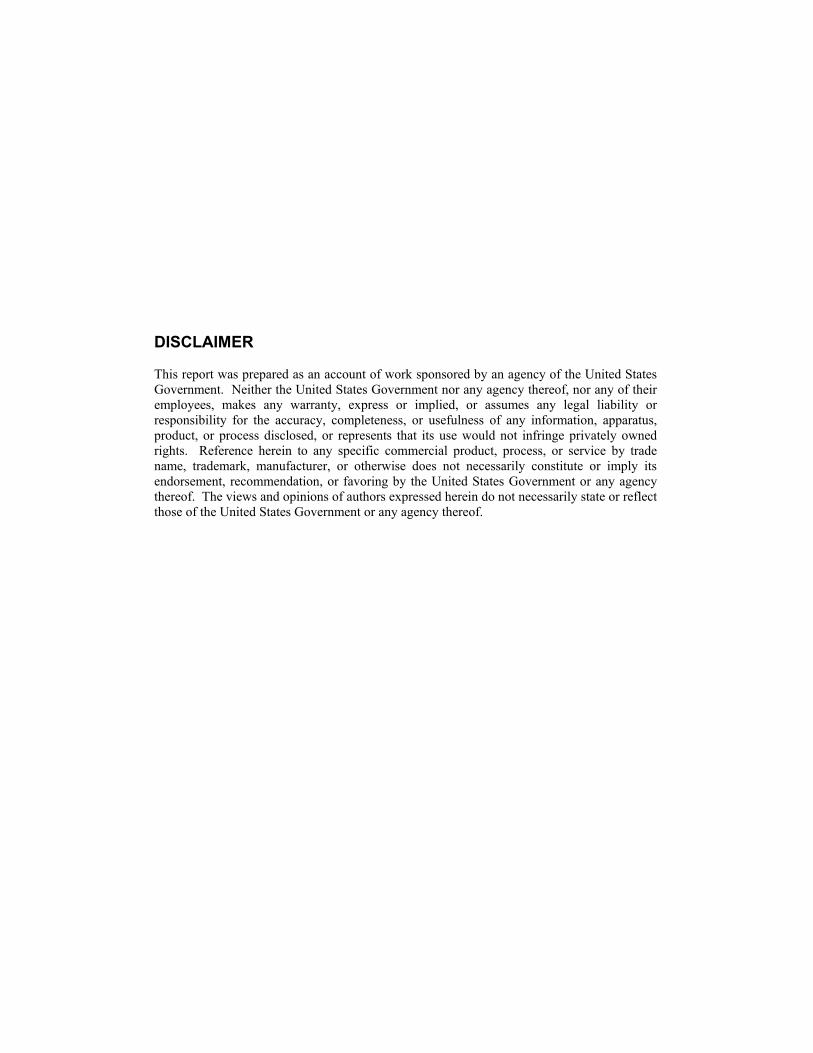
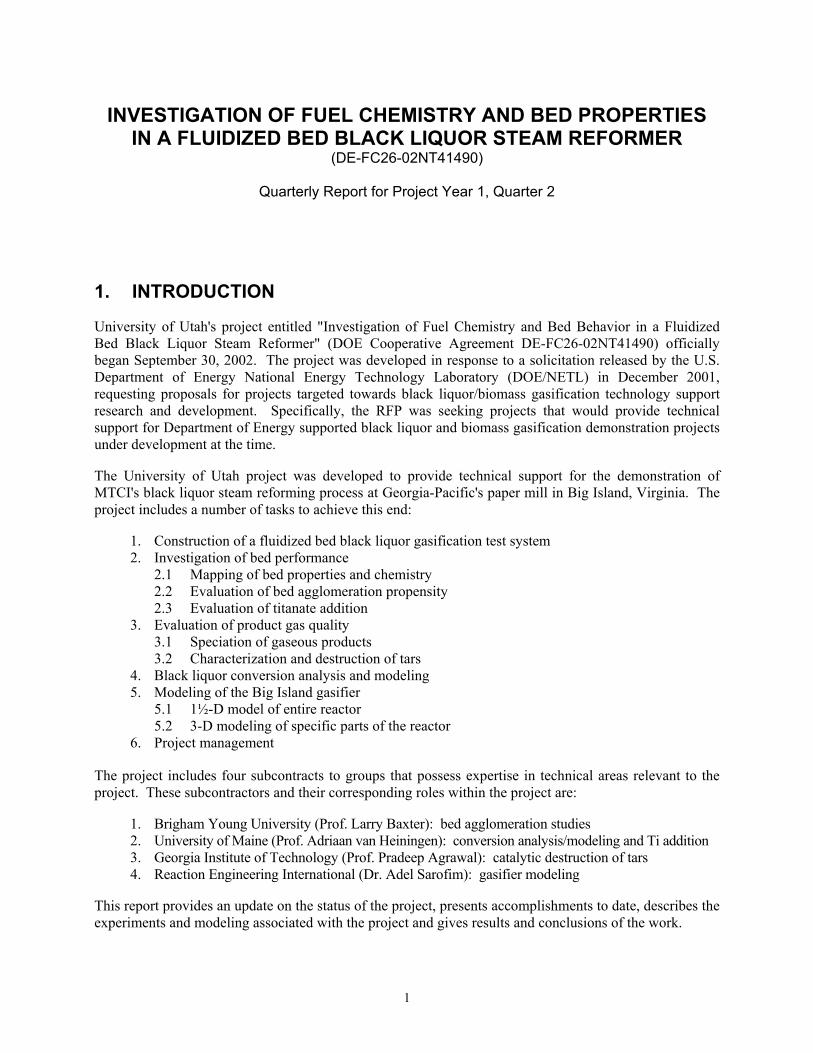
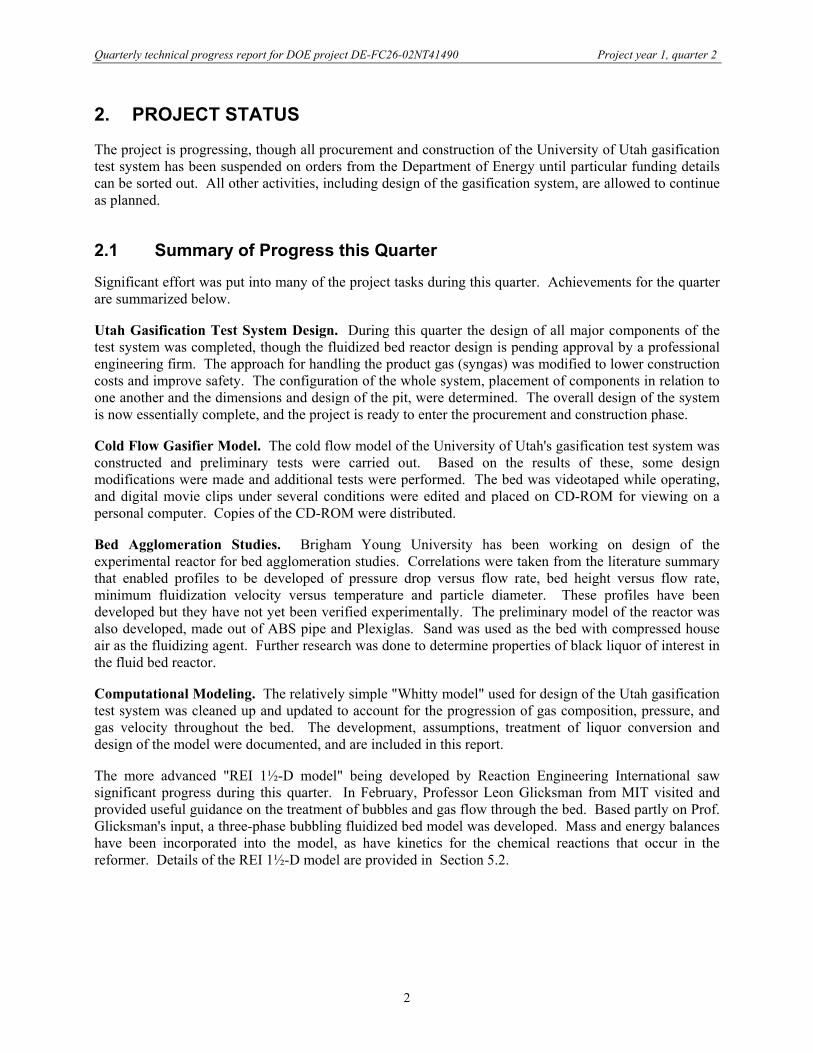
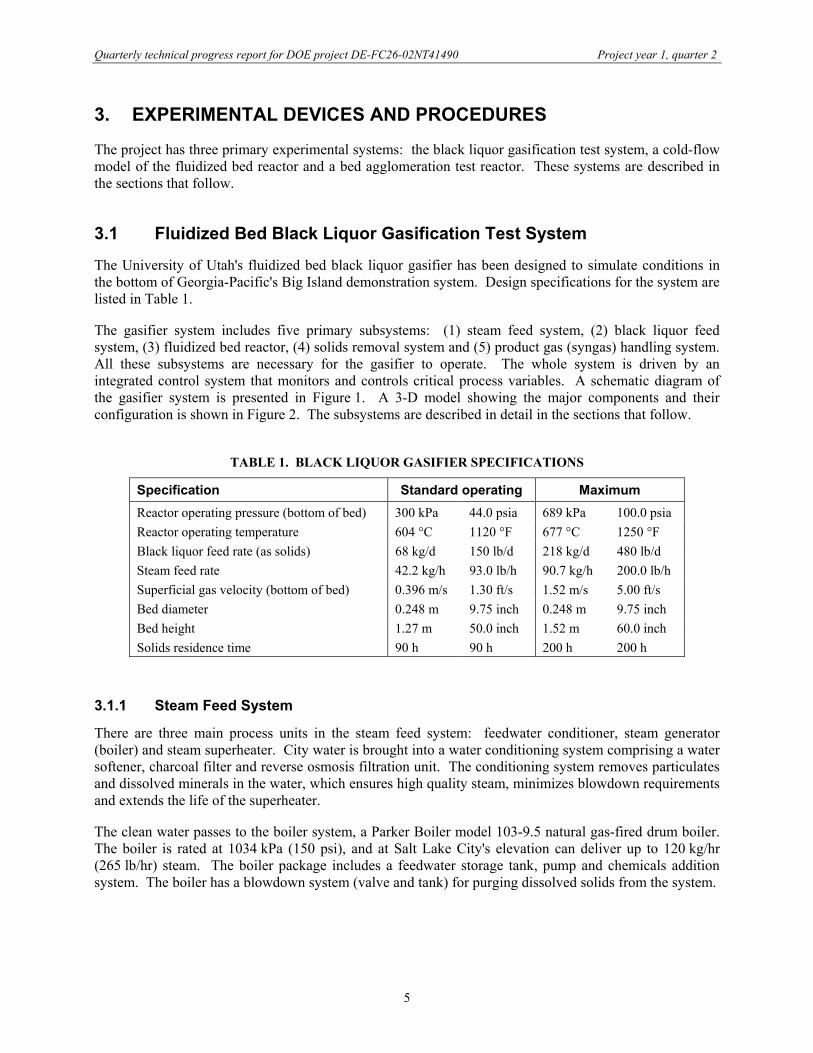
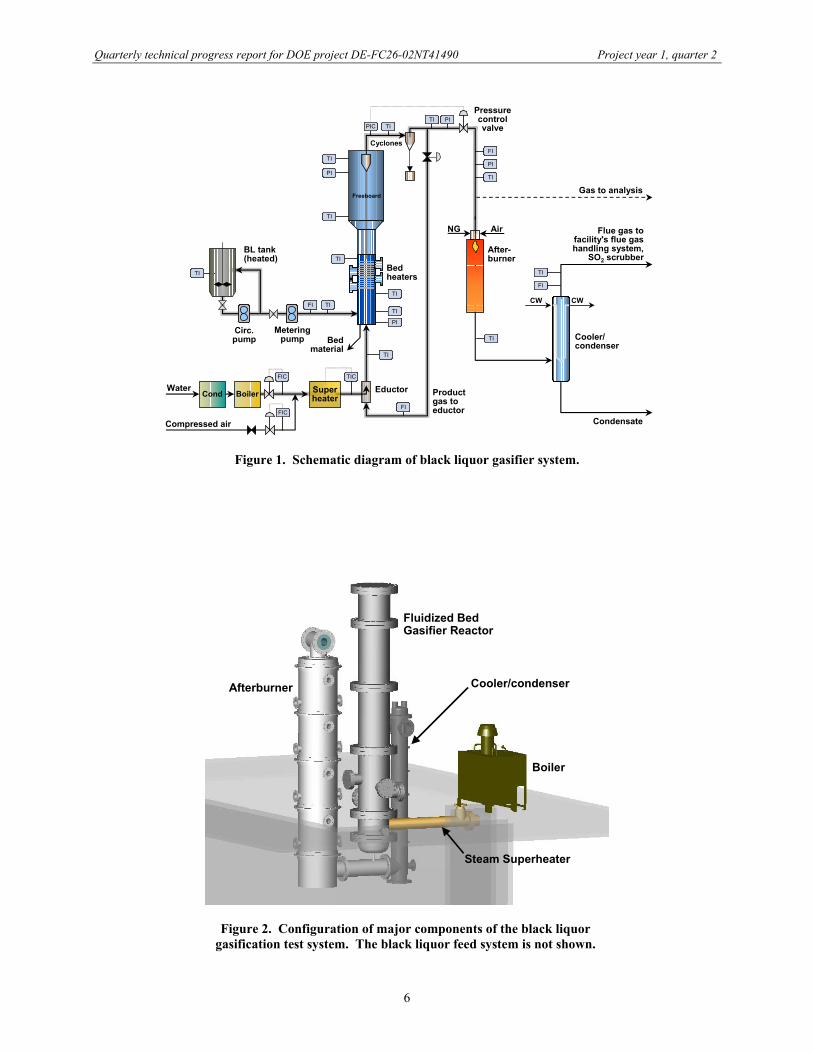
The gasifier system includes five primary subsystems: (1) steam feed system, (2) black liquor feed system, (3) fluidized bed reactor, (4) solids removal system and (5) product gas (syngas) handling system. All these subsystems are necessary for the gasifier to operate. The whole system is driven by an integrated control system that monitors and controls critical process variables. A schematic diagram of the gasifier system is presented in Figure 1. A 3-D model showing the major components and their configuration is shown in Figure 2. The subsystems are described in detail in the sections that follow.
TABLE 1. BLACK LIQUOR GASIFIER SPECIFICATIONS
Specification Standard operating Maximum Reactor operating pressure (bottom of bed) 300 kPa 44.0 psia 689 kPa 100.0 psia Reactor operating temperature 604 °C 1120 °F 677 °C 1250 °F Black liquor feed rate (as solids) 68 kg/d 150 lb/d 218 kg/d 480 lb/d Steam feed rate 42.2 kg/h 93.0 lb/h 90.7 kg/h 200.0 lb/h Superficial gas velocity (bottom of bed) 0.396 m/s 1.30 ft/s 1.52 m/s 5.00 ft/s Bed diameter 0.248 m 9.75 inch 0.248 m 9.75 inch Bed height 1.27 m 50.0 inch 1.52 m 60.0 inch Solids residence time 90 h 90 h 200 h 200 h
3.1.1 Steam Feed System
There are three main process units in the steam feed system: feedwater conditioner, steam generator (boiler) and steam superheater. City water is brought into a water conditioning system comprising a water softener, charcoal filter and reverse osmosis filtration unit. The conditioning system removes particulates and dissolved minerals in the water, which ensures high quality steam, minimizes blowdown requirements and extends the life of the superheater.
The clean water passes to the boiler system, a Parker Boiler model 103-9.5 natural gas-fired drum boiler. The boiler is rated at 1034 kPa (150 psi), and at Salt Lake City's elevation can deliver up to 120 kg/hr (265 lb/hr) steam. The boiler package includes a feedwater storage tank, pump and chemicals addition system. The boiler has a blowdown system (valve and tank) for purging dissolved solids from the system.
Quarterly technical progress report for DOE project DE-FC26-02NT41490 Project year 1, quarter 2
6
TITI
WaterFICFIC TICTIC
Compressed air
BL tank(heated)
Circ.pump
Eductor
Bedmaterial
PICPIC
Cyclones
TITI
TITI
TITI
PIPI
Product gas to eductorFIFI
TITI
FIFI
After-burner
Flue gas to facility's flue gas handling system,
SO2 scrubber
PIPI
TITI
FIFI
Pressure control valve
PIPI
TITI
Gas to analysis
Superheater
Freeboard
Bed heaters
TITI
TITI
TITI
CW CW
FICFIC
BoilerCond
AirNG
FIFI
TITI
PIPI
Meteringpump
Condensate
Cooler/condenser
TITI
TITI
Figure 1. Schematic diagram of black liquor gasifier system.
Boiler
Fluidized Bed Gasifier Reactor
Steam Superheater
Afterburner Cooler/condenser
Figure 2. Configuration of major components of the black liquor gasification test system. The black liquor feed system is not shown.
Quarterly technical progress report for DOE project DE-FC26-02NT41490 Project year 1, quarter 2
7
Immediately after generation, the steam passes through a preheater to superheat it by approximately 20°C (36°F) so the risk of condensation downstream is minimized. An adjustable pressure reduction valve then lowers the steam pressure to a pressure closer to the reactor pressure. This improves controllability of the steam flow rate and raises the level of superheat in the steam. The steam runs through a control valve and flowmeter, which are coupled to the control system and used to control the steam flow rate.
The steam finally passes through the superheater to increase the temperature to as much as 593°C (1100°F) before entering the reactor. The superheater is a 32 kW circulation heater built by Accutherm, housing 24 Incoloy 840 sheathed elements in a stainless steel pressure vessel. The superheater is designed to heat as much as 90 kg/hr (200 lb/hr) steam at 585 kPa (85 psia) to 593°C (1100°F). After leaving the superheater the steam runs through an eductor where it may mix with recycled product gas before entering the reactor plenum.
3.1.2 Black Liquor Feed System
The black liquor feed system comprises a liquor storage tank, recirculation pump, metering pump, flowmeter and injector. Black liquor is loaded from drums into an electrically heated, stirred storage tank. This tank holds 100 gallons of liquor, or approximately enough for 3 days of continuous testing at standard conditions. A coil of tubing within the tank allows steam to be used for additional heating, if necessary.
A positive displacement pump circulates the liquor from the tank outlet back to the tank. A high-pressure metering pump (FMI QV-Q1CSC) feeds the liquor to the injector at pressures up to 100 psi. The metering pump is calibrated using a graduated cylinder, and the flow rate can be confirmed with the flowmeter downstream of the pump. The liquor is mixed with process steam and fed into the reactor through a steam jacketed, steam atomizing injector.
3.1.3 Fluidized Bed Reactor
The fluidized bed reactor consists of a distributor section, lower bed section and an upper freeboard section. The distributor section is made up of a plenum and a distributor plate with bubble caps for gas introduction and distribution. A pipe for solids removal runs concentrically from the top of the distributor plate through the plenum and out to the solids removal lock hopper system.
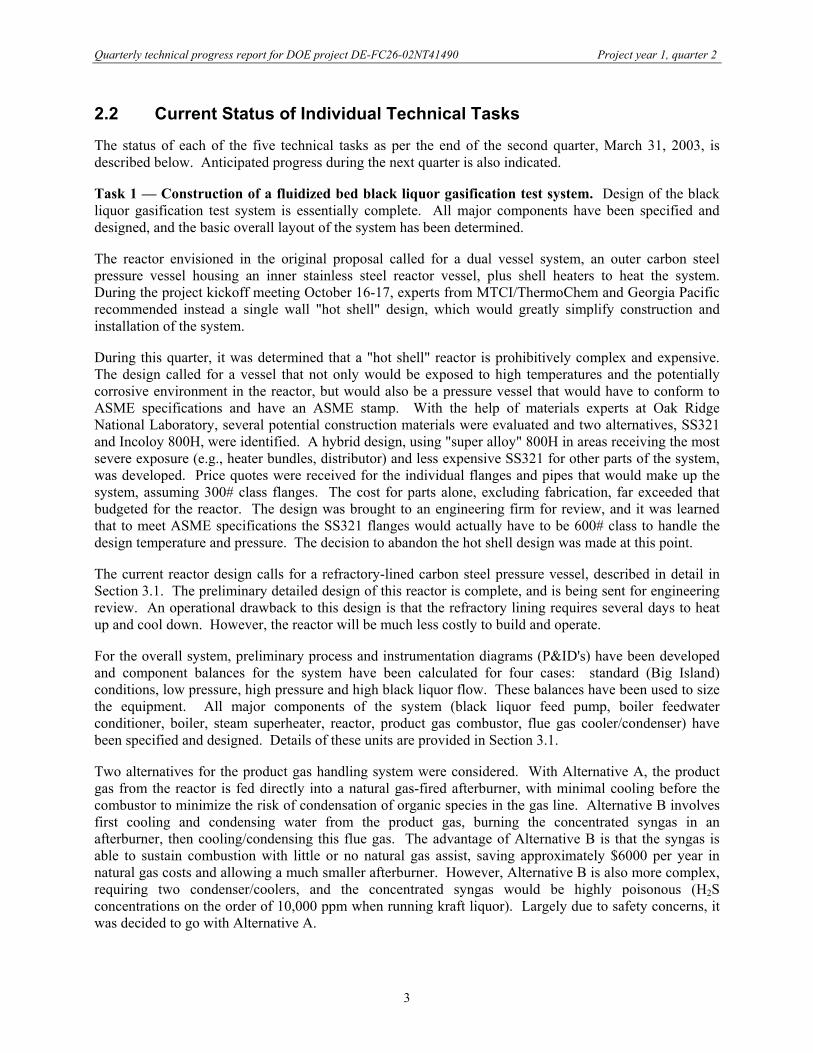
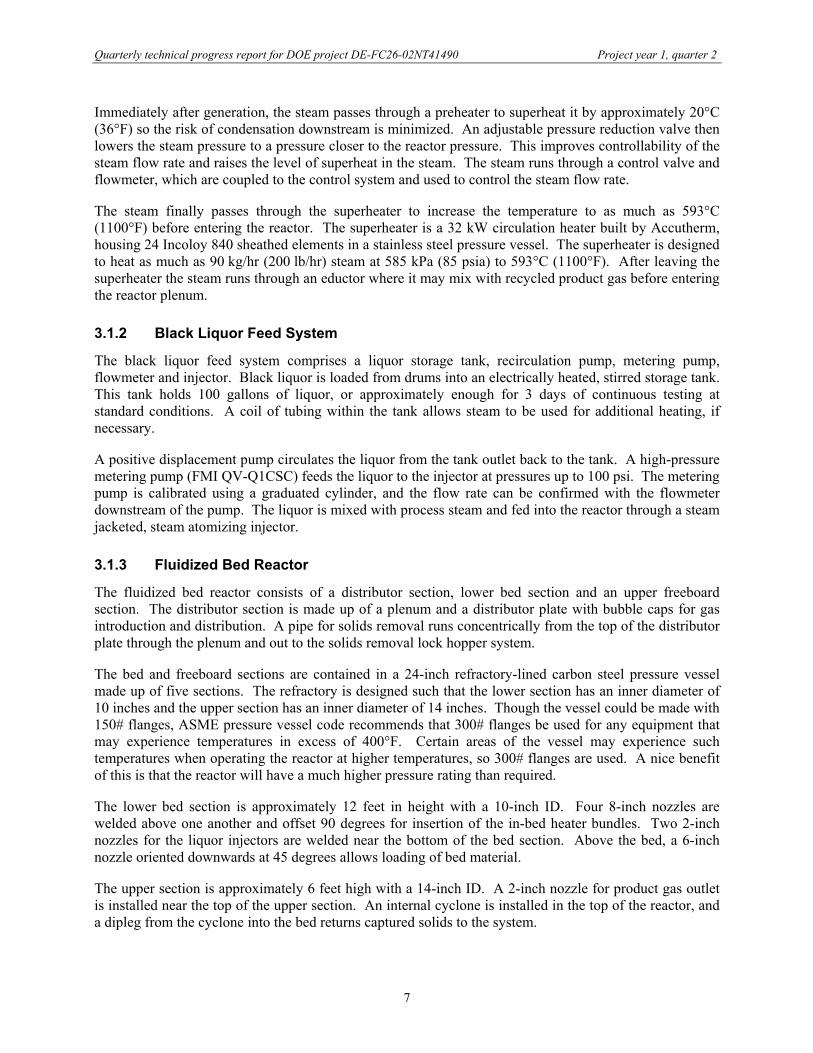
The bed and freeboard sections are contained in a 24-inch refractory-lined carbon steel pressure vessel made up of five sections. The refractory is designed such that the lower section has an inner diameter of 10 inches and the upper section has an inner diameter of 14 inches. Though the vessel could be made with 150# flanges, ASME pressure vessel code recommends that 300# flanges be used for any equipment that may experience temperatures in excess of 400°F. Certain areas of the vessel may experience such temperatures when operating the reactor at higher temperatures, so 300# flanges are used. A nice benefit of this is that the reactor will have a much higher pressure rating than required.
The lower bed section is approximately 12 feet in height with a 10-inch ID. Four 8-inch nozzles are welded above one another and offset 90 degrees for insertion of the in-bed heater bundles. Two 2-inch nozzles for the liquor injectors are welded near the bottom of the bed section. Above the bed, a 6-inch nozzle oriented downwards at 45 degrees allows loading of bed material.
The upper section is approximately 6 feet high with a 14-inch ID. A 2-inch nozzle for product gas outlet is installed near the top of the upper section. An internal cyclone is installed in the top of the reactor, and a dipleg from the cyclone into the bed returns captured solids to the system.
Quarterly technical progress report for DOE project DE-FC26-02NT41490 Project year 1, quarter 2
8
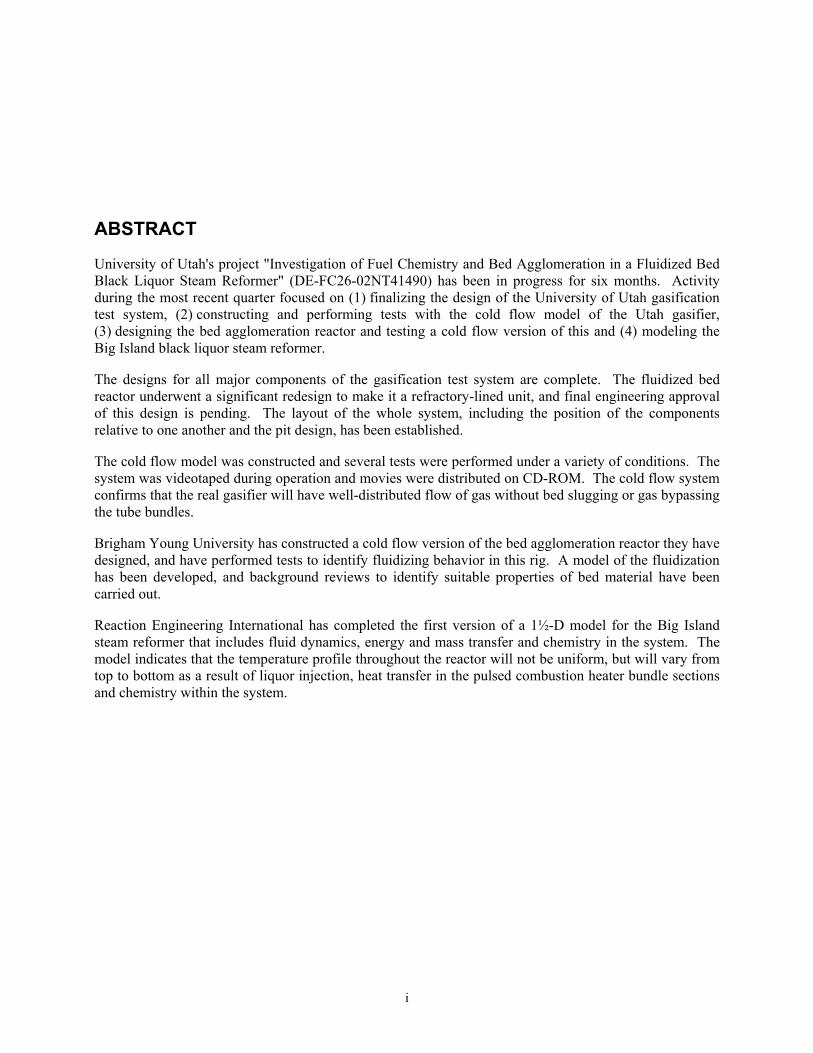
Figure 3. Proposed reactor, cutaway of reactor and detail of lower section. The two layers of refractory lining are shown in green.
Four bundles of 20 electric cartridge heaters will provide necessary heat for the gasification reactions. The heaters will be housed in thermowells welded to blind flanges, with a refractory plug filling the section that will pass through the refractory lining. The thermowells are staggered and the bundles are stacked perpendicular to one another. In total, approximately 40 kW of energy can be input to the bed through the heater bundles.
3.1.4 Solids Removal System
The solids removal system is made up of a lock hopper and nitrogen purge system. The lock hopper comprises a section of pipe between two sealing valves, plus a purge valve for pressure relief. During operation, the upper valve will open momentarily to allow solids to fall into the hopper. It will then close and the hopper purge valve will open to depressurize the lock hopper. Once depressurized, the bottom valve will open and the solids will fall into the receiving receptacle. A section of pipe above the lock hopper will be continuously purged with nitrogen so the solids and surrounding gas will be cool and non-reactive when they are removed from the system.
3.1.5 Product Gas Handling System
The product gas handling system safely disposes of the synthesis gas produced in the gasifier. Product gas from the gasifier is run through a high efficiency external cyclone, which delivers removed particulate to a catch pot. The gas runs through a control valve that sets the pressure of the system. Downstream of this valve the gas is essentially at atmospheric pressure.
The product gas must be combusted before being exhausted, so it is fed to a natural gas-fired afterburner. The gas is not cooled first, but is kept hot to avoid tar condensation and to avoid risks associated with hydrogen sulfide in a concentrated syngas that would result if the gas were first cooled and condensed. The gas is burned at a minimum temperature of 1093°C (2000°F) for two seconds to ensure efficient destruction of any tars remaining in the gas at this point. The hot product gas from the combustion is cooled in a water-fed cooler/condenser. Finally, the cool product gas is sent to the facility's flue gas handling system, where it is scrubbed and exhausted.
Quarterly technical progress report for DOE project DE-FC26-02NT41490 Project year 1, quarter 2
9
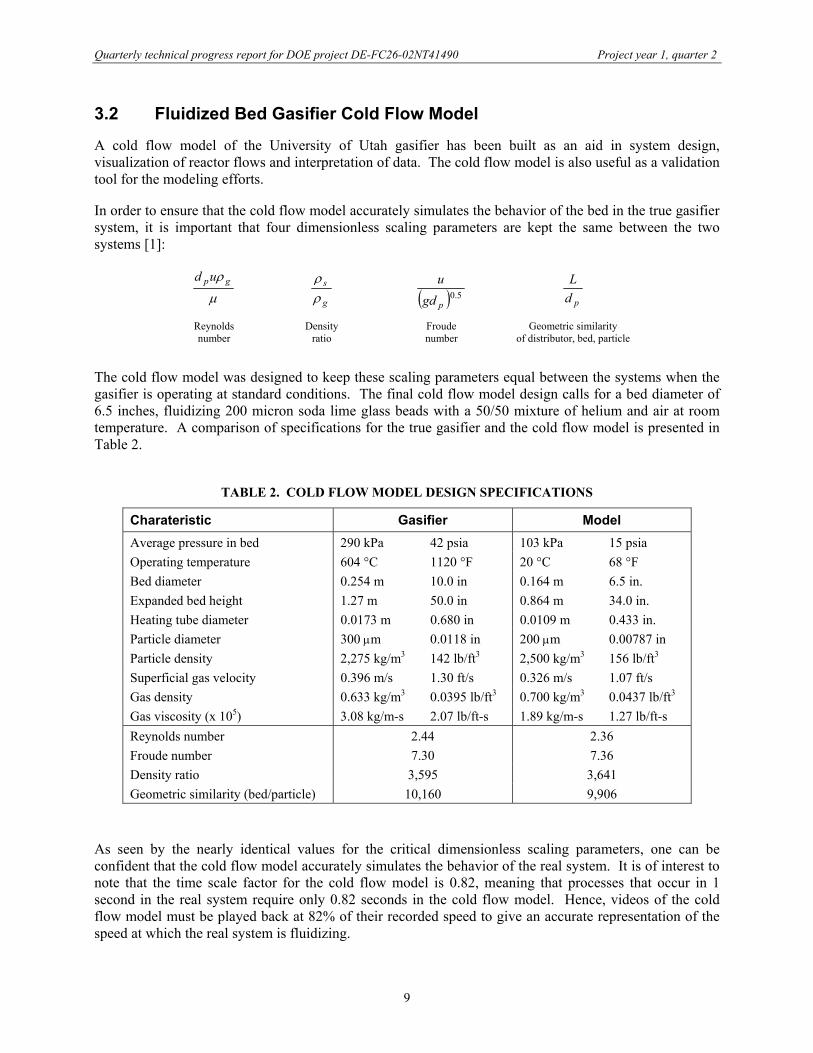
3.2 Fluidized Bed Gasifier Cold Flow Model A cold flow model of the University of Utah gasifier has been built as an aid in system design, visualization of reactor flows and interpretation of data. The cold flow model is also useful as a validation tool for the modeling efforts.
In order to ensure that the cold flow model accurately simulates the behavior of the bed in the true gasifier system, it is important that four dimensionless scaling parameters are kept the same between the two systems [1]:
µ
ρ gpud
g
s
ρρ ( ) 5.0
pgdu
pdL
Reynolds Density Froude Geometric similarity number ratio number of distributor, bed, particle
The cold flow model was designed to keep these scaling parameters equal between the systems when the gasifier is operating at standard conditions. The final cold flow model design calls for a bed diameter of 6.5 inches, fluidizing 200 micron soda lime glass beads with a 50/50 mixture of helium and air at room temperature. A comparison of specifications for the true gasifier and the cold flow model is presented in Table 2.
TABLE 2. COLD FLOW MODEL DESIGN SPECIFICATIONS
Charateristic Gasifier Model Average pressure in bed 290 kPa 42 psia 103 kPa 15 psia Operating temperature 604 °C 1120 °F 20 °C 68 °F Bed diameter 0.254 m 10.0 in 0.164 m 6.5 in. Expanded bed height 1.27 m 50.0 in 0.864 m 34.0 in. Heating tube diameter 0.0173 m 0.680 in 0.0109 m 0.433 in. Particle diameter 300 µm 0.0118 in 200 µm 0.00787 in Particle density 2,275 kg/m3 142 lb/ft3 2,500 kg/m3 156 lb/ft3 Superficial gas velocity 0.396 m/s 1.30 ft/s 0.326 m/s 1.07 ft/s Gas density 0.633 kg/m3 0.0395 lb/ft3 0.700 kg/m3 0.0437 lb/ft3 Gas viscosity (x 105) 3.08 kg/m-s 2.07 lb/ft-s 1.89 kg/m-s 1.27 lb/ft-s Reynolds number 2.44 2.36 Froude number 7.30 7.36 Density ratio 3,595 3,641 Geometric similarity (bed/particle) 10,160 9,906
As seen by the nearly identical values for the critical dimensionless scaling parameters, one can be confident that the cold flow model accurately simulates the behavior of the real system. It is of interest to note that the time scale factor for the cold flow model is 0.82, meaning that processes that occur in 1 second in the real system require only 0.82 seconds in the cold flow model. Hence, videos of the cold flow model must be played back at 82% of their recorded speed to give an accurate representation of the speed at which the real system is fluidizing.
Quarterly technical progress report for DOE project DE-FC26-02NT41490 Project year 1, quarter 2
10
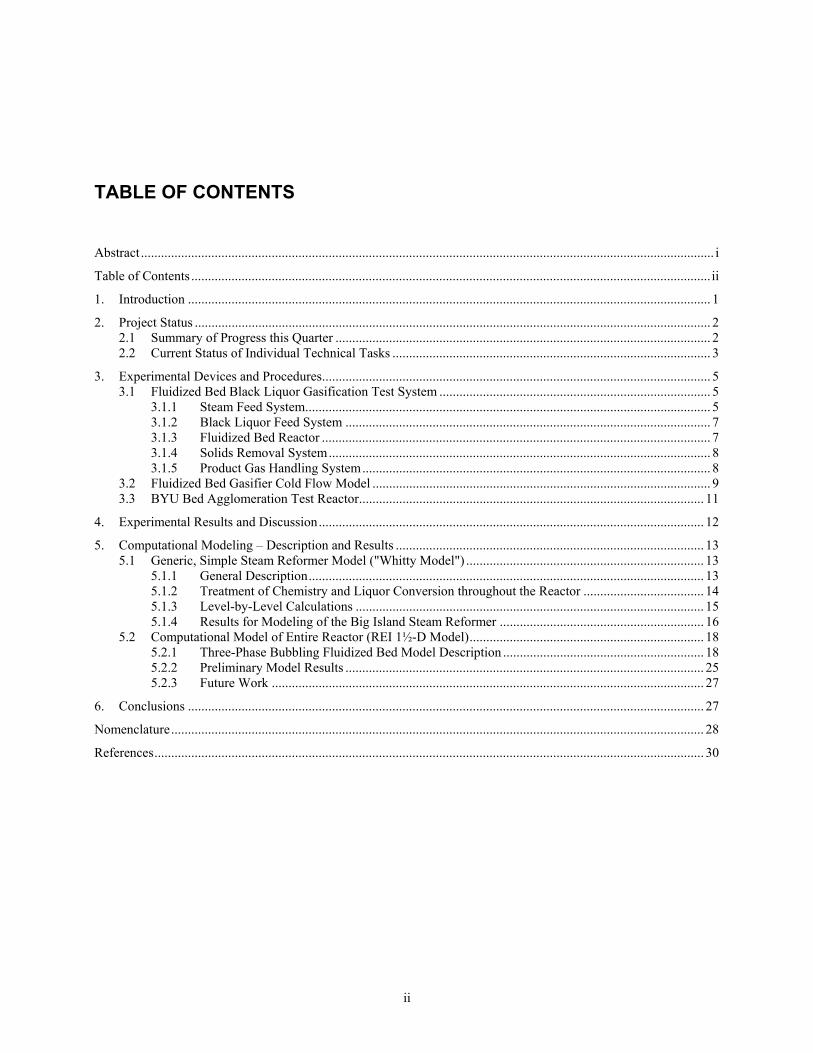
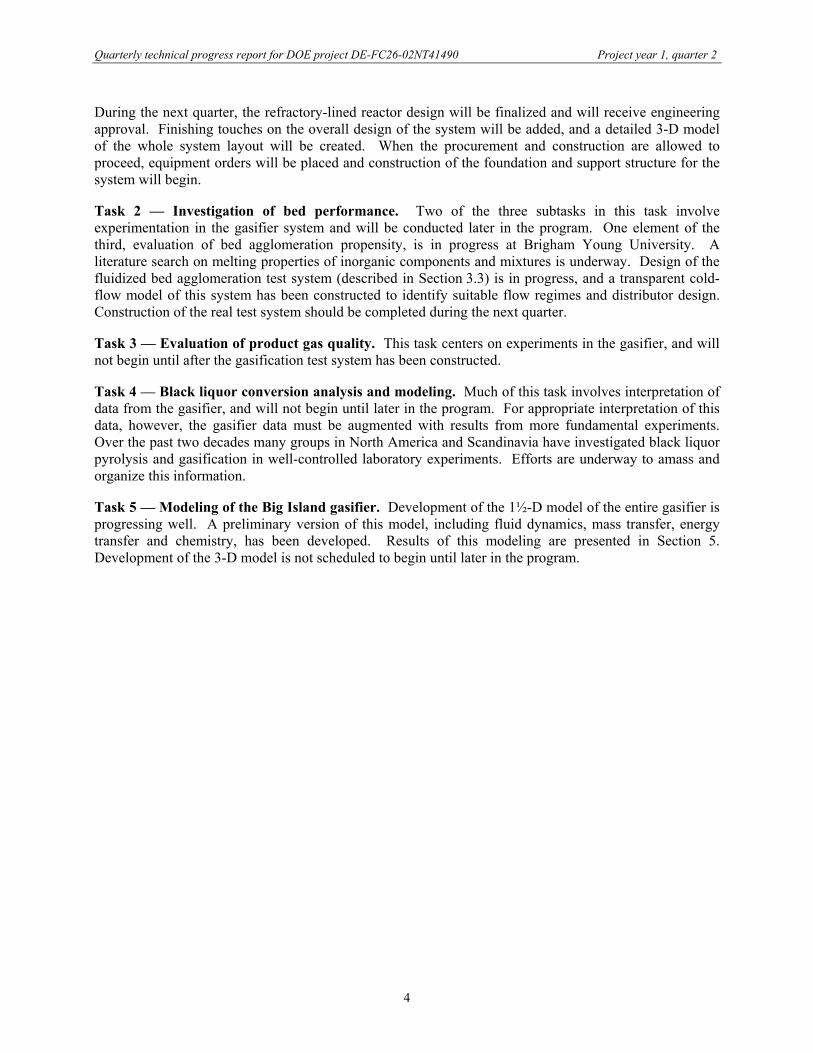
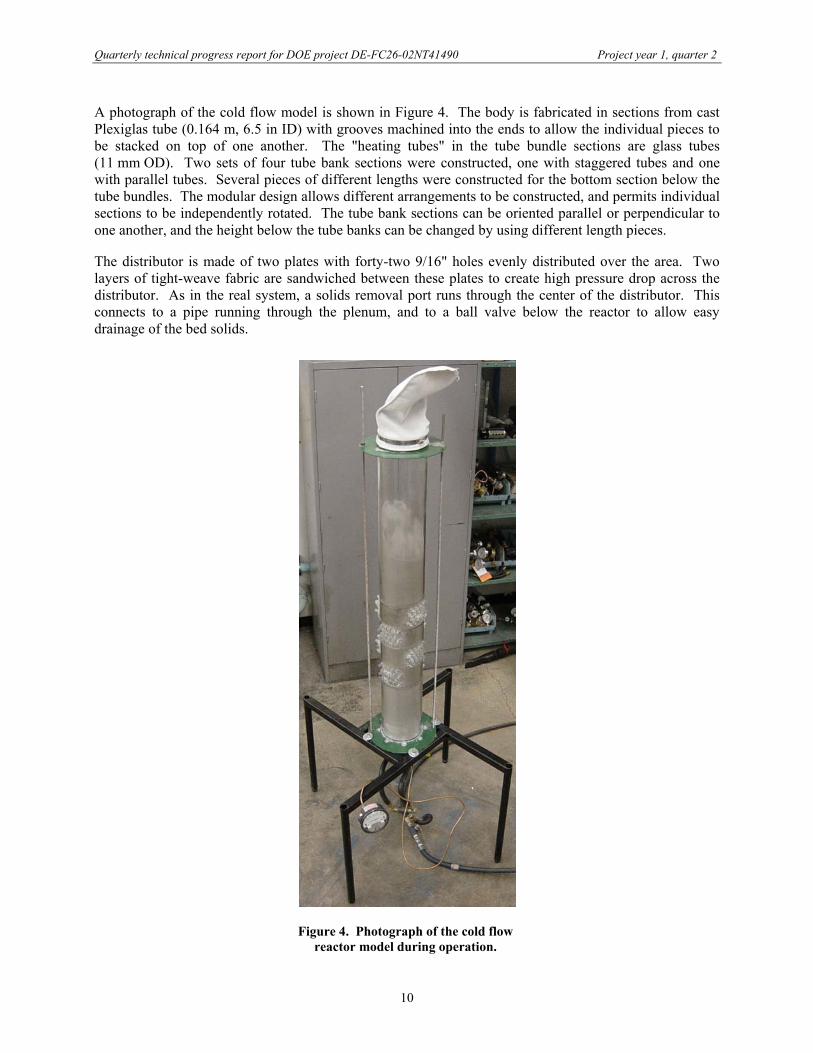
A photograph of the cold flow model is shown in Figure 4. The body is fabricated in sections from cast Plexiglas tube (0.164 m, 6.5 in ID) with grooves machined into the ends to allow the individual pieces to be stacked on top of one another. The "heating tubes" in the tube bundle sections are glass tubes (11 mm OD). Two sets of four tube bank sections were constructed, one with staggered tubes and one with parallel tubes. Several pieces of different lengths were constructed for the bottom section below the tube bundles. The modular design allows different arrangements to be constructed, and permits individual sections to be independently rotated. The tube bank sections can be oriented parallel or perpendicular to one another, and the height below the tube banks can be changed by using different length pieces.
The distributor is made of two plates with forty-two 9/16" holes evenly distributed over the area. Two layers of tight-weave fabric are sandwiched between these plates to create high pressure drop across the distributor. As in the real system, a solids removal port runs through the center of the distributor. This connects to a pipe running through the plenum, and to a ball valve below the reactor to allow easy drainage of the bed solids.
Figure 4. Photograph of the cold flow reactor model during operation.
Quarterly technical progress report for DOE project DE-FC26-02NT41490 Project year 1, quarter 2
11
During operation, compressed air and helium are fed through two separate rotameters that have been independently calibrated. The gases are mixed and fed to the plenum of the fluidized bed, below the distributor, and flow evenly through the distributor. At standard operating conditions (14.8 scfm total flow, 26" slumped bed height), pressure drop across the distributor accounts for approximately 25% of the total pressure drop across the system.
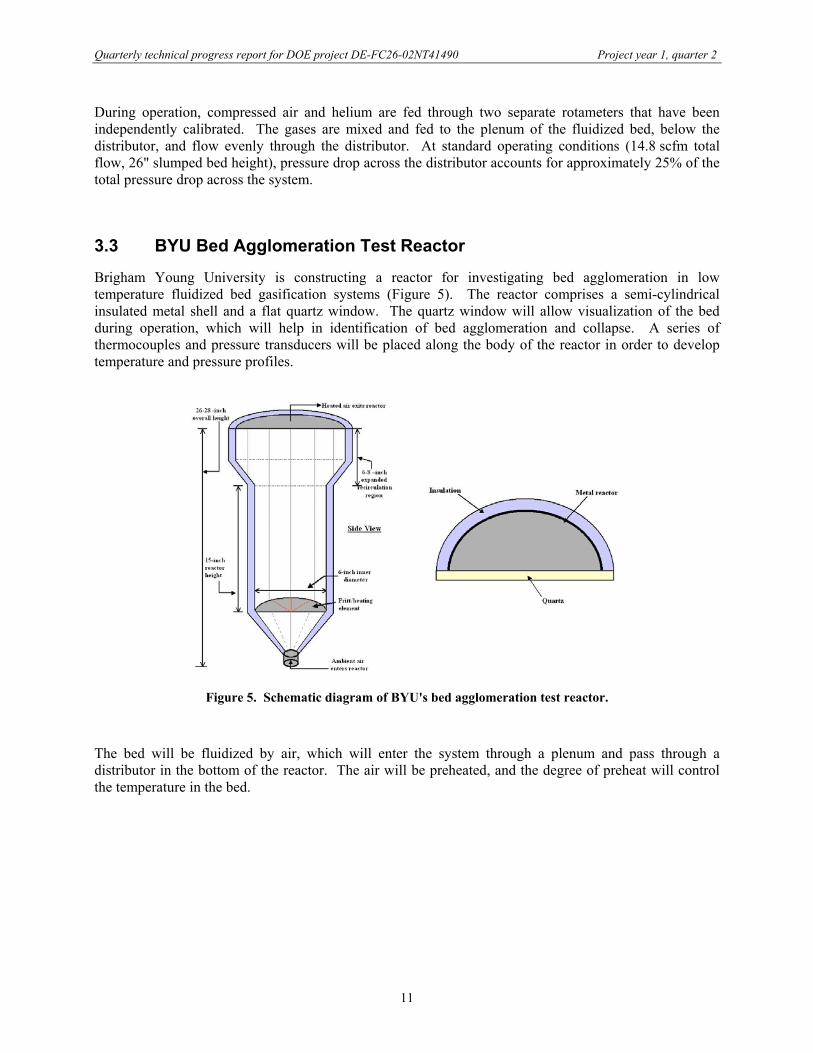
3.3 BYU Bed Agglomeration Test Reactor Brigham Young University is constructing a reactor for investigating bed agglomeration in low temperature fluidized bed gasification systems (Figure 5). The reactor comprises a semi-cylindrical insulated metal shell and a flat quartz window. The quartz window will allow visualization of the bed during operation, which will help in identification of bed agglomeration and collapse. A series of thermocouples and pressure transducers will be placed along the body of the reactor in order to develop temperature and pressure profiles.
Figure 5. Schematic diagram of BYU's bed agglomeration test reactor.
The bed will be fluidized by air, which will enter the system through a plenum and pass through a distributor in the bottom of the reactor. The air will be preheated, and the degree of preheat will control the temperature in the bed.
Quarterly technical progress report for DOE project DE-FC26-02NT41490 Project year 1, quarter 2
12
4. EXPERIMENTAL RESULTS AND DISCUSSION
Most of the experimental equipment that will be used in this project is still undergoing design or construction. The cold flow model of the University of Utah gasification test system has been constructed, however, and initial results from this unit have been obtained.
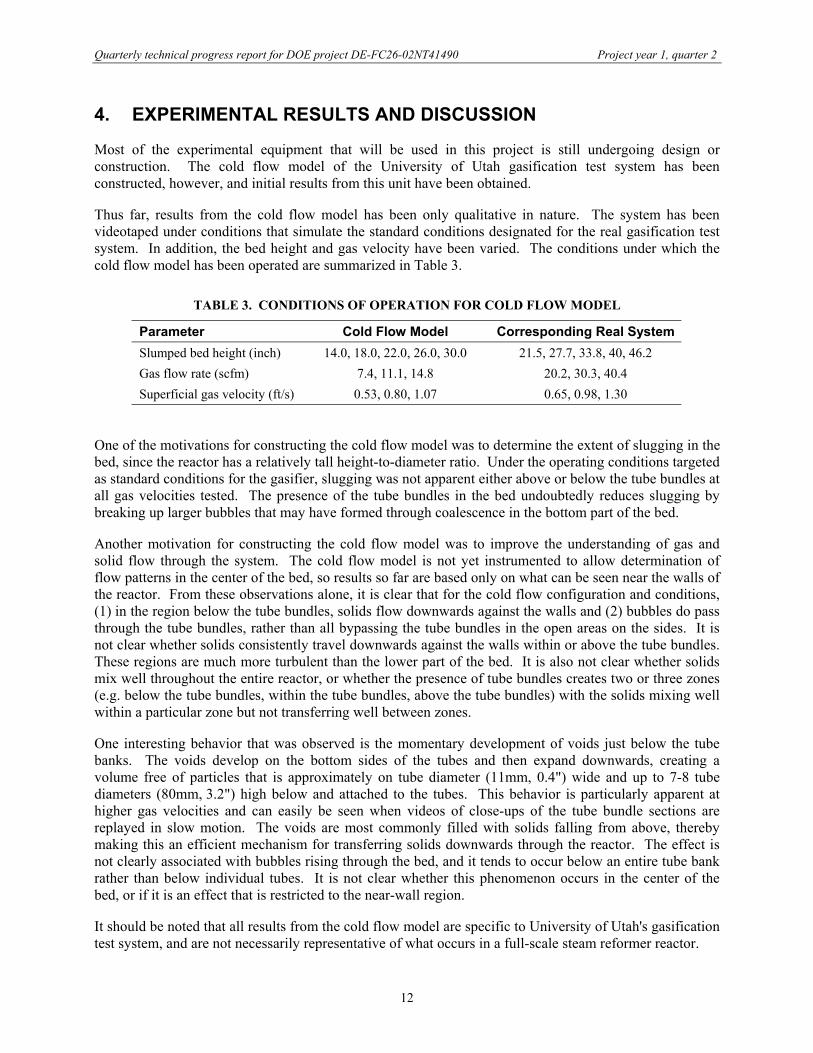
Thus far, results from the cold flow model has been only qualitative in nature. The system has been videotaped under conditions that simulate the standard conditions designated for the real gasification test system. In addition, the bed height and gas velocity have been varied. The conditions under which the cold flow model has been operated are summarized in Table 3.
TABLE 3. CONDITIONS OF OPERATION FOR COLD FLOW MODEL
Parameter Cold Flow Model Corresponding Real SystemSlumped bed height (inch) 14.0, 18.0, 22.0, 26.0, 30.0 21.5, 27.7, 33.8, 40, 46.2 Gas flow rate (scfm) 7.4, 11.1, 14.8 20.2, 30.3, 40.4 Superficial gas velocity (ft/s) 0.53, 0.80, 1.07 0.65, 0.98, 1.30
One of the motivations for constructing the cold flow model was to determine the extent of slugging in the bed, since the reactor has a relatively tall height-to-diameter ratio. Under the operating conditions targeted as standard conditions for the gasifier, slugging was not apparent either above or below the tube bundles at all gas velocities tested. The presence of the tube bundles in the bed undoubtedly reduces slugging by breaking up larger bubbles that may have formed through coalescence in the bottom part of the bed.
Another motivation for constructing the cold flow model was to improve the understanding of gas and solid flow through the system. The cold flow model is not yet instrumented to allow determination of flow patterns in the center of the bed, so results so far are based only on what can be seen near the walls of the reactor. From these observations alone, it is clear that for the cold flow configuration and conditions, (1) in the region below the tube bundles, solids flow downwards against the walls and (2) bubbles do pass through the tube bundles, rather than all bypassing the tube bundles in the open areas on the sides. It is not clear whether solids consistently travel downwards against the walls within or above the tube bundles. These regions are much more turbulent than the lower part of the bed. It is also not clear whether solids mix well throughout the entire reactor, or whether the presence of tube bundles creates two or three zones (e.g. below the tube bundles, within the tube bundles, above the tube bundles) with the solids mixing well within a particular zone but not transferring well between zones.
One interesting behavior that was observed is the momentary development of voids just below the tube banks. The voids develop on the bottom sides of the tubes and then expand downwards, creating a volume free of particles that is approximately on tube diameter (11mm, 0.4") wide and up to 7-8 tube diameters (80mm, 3.2") high below and attached to the tubes. This behavior is particularly apparent at higher gas velocities and can easily be seen when videos of close-ups of the tube bundle sections are replayed in slow motion. The voids are most commonly filled with solids falling from above, thereby making this an efficient mechanism for transferring solids downwards through the reactor. The effect is not clearly associated with bubbles rising through the bed, and it tends to occur below an entire tube bank rather than below individual tubes. It is not clear whether this phenomenon occurs in the center of the bed, or if it is an effect that is restricted to the near-wall region.
It should be noted that all results from the cold flow model are specific to University of Utah's gasification test system, and are not necessarily representative of what occurs in a full-scale steam reformer reactor.
Quarterly technical progress report for DOE project DE-FC26-02NT41490 Project year 1, quarter 2
13
5. COMPUTATIONAL MODELING – DESCRIPTION AND RESULTS
Three computational models of fluidized bed steam reformers are being developed under the University of Utah project. One is essentially a general, idealized model for any fluidized bed black liquor steam reformer that maps the anticipated gas compositions and flow rates throughout the reactor. A second model is a 1½-D model of the entire Big Island reactor that predicts bubble development and rise, liquor conversion, temperature distributions and gas compositions. The third model has yet to be developed, but will be a set of 3-D computational fluid dynamic (CFD) models detailing fluid dynamics, heat transfer and chemistry for specific parts of the Big Island reformer. The sections below describe the first two models.
5.1 Generic, Simple Steam Reformer Model ("Whitty Model")
5.1.1 General Description
This model was developed primarily as an aid for designing the University of Utah black liquor gasification test system, and is essentially a glorified mass balance for the steam reformer. Given the reactor geometry, inputs to the system (black liquor properties and flow, steam flow, fraction of product gas recycled) and conditions in the reactor (freeboard pressure, bed temperature), the model predicts the pressure, gas composition, superficial and actual gas velocities, and residence times throughout the bed. The entire model is contained on one Microsoft Excel worksheet, has a user-friendly interface, is portable and can easily be modified.
In designing the University of Utah test gasifier, the model was first set up to simulate the Big Island steam reformer. A copy of that model was made and the reactor geometry, conditions and flows were manipulated to create a system that would simulate conditions in the bottom section of the Big Island steam reformer to the extent possible, and that would be reasonably sized with regard to space available, construction and operating costs, and operator demand.
The model makes the following simplifying assumptions:
• The entire reactor (bed and freeboard) is at one given temperature • Gas flows uniformly (plug flow, with no channeling) through the reactor • Solids in the bed are perfectly mixed throughout the bed • Black liquor is injected at the very bottom of the bed • Black liquor dries and pyrolyzes immediately upon entering the reactor • The gas consists only of H2O, CO2, H2, CO and H2S • The gas is always at equilibrium with regard to the water-gas shift reaction
Some of these assumptions are arguably unrealistic, but they are acceptable for the purpose of the model. The model does not take into consideration energy entering or exiting the system, nor does it consider rates or kinetics of the conversion reactions. Instead, the user inputs the overall carbon conversion.
All gas phase equilibrium calculations are performed by the following procedure:
1. The C, H, O and S atoms entering the system or level are totaled. 2. All S atoms and 2xS hydrogen atoms are removed from the system. 3. The equilibrium composition of H2O, CO2, H2 and CO for the remaining atoms is calculated. 4. The H2S removed in step 2 is returned to the mixture.
Quarterly technical progress report for DOE project DE-FC26-02NT41490 Project year 1, quarter 2
14
In step 3, the composition is calculated by developing a quadratic equation with one real root and identifying this root. The solution can thus be found directly, eliminating the need for iteration or a solver. A pleasant benefit of this approach is that the model solution updates immediately when a change is made to the inputs. (This is one of the reasons it was decided not to include methane in the system.)
The model considers gas flow through the bed from the bottom up. The bed is divided into ten sections of equal volume, and the compositions and flows into and out of each section (labeled Levels 0 through 10) are determined. In addition, there is a "bottom" level below Level 0 that considers only the incoming steam and recycled syngas. Descriptions of the different sections and processes that take place in these sections are described in the sections that follow.
5.1.2 Treatment of Chemistry and Liquor Conversion throughout the Reactor
5.1.2.1 Bottom Level: Steam and Recycled Syngas Feed
The user can input the steam feed rate as well as the recycle ratio, defined as mass of recycled syngas to mass of steam introduced into the reactor. The model first performs an initial mass balance for the total system to determine the final product gas composition. The appropriate flow of this product gas (based on recycle ratio) is combined with the incoming steam flow and the equilibrium composition of this mixture is determined. This mixture is passed on to Section 1.
5.1.2.2 Section 1: Black Liquor Feeding, Drying, Pyrolysis
In the model, black liquor is fed in Section 1. It is assumed that drying and pyrolysis are instantaneous, and that all gas generated by pyrolysis and gasification impacts gas flow in this section. H2O from drying of the liquor is added to the gas phase of the system. Carbon, hydrogen, oxygen and sulfur released from the liquor during pyrolysis are added to the gas phase as described below.
Carbon: Frederick and Hupa [2] offer a relation to determine the percentage of carbon retained in the char as a function of temperature:
Percentage of carbon retained in char = 645 exp(–0.00332T) (1)
where T is in °C.
Hydrogen: Historically, there has not been much interest in studying hydrogen release during pyrolysis, and no published results on this issue are available. Elemental compositions of liquor and chars are available, however. Hydrogen contents in black liquor solids are on the order of 3.5%. Reported hydrogen contents of different chars are in the range 2 wt%. The char yield during formation of such chars is roughly 65%. An estimate of hydrogen released can thus be calculated: (3.5 – (2.0 x 0.65)) / 3.5 = 63%. The release is undoubtedly affected by temperature, but until data to model this is available, a constant 63% H loss is assumed.
Oxygen: Like hydrogen, there is essentially no data on oxygen release during pyrolysis. Data on component release versus temperature are available for carbon, sodium and sulfur, and the total volatiles yield versus temperature is also available. Using this information, a relation for oxygen release as a function of temperature was back-calculated such that the total volatiles yield agrees with that estimated from Frederick and Hupa [2]:
Volatiles yield (%) = –39.7 + 0.1T (2)
Quarterly technical progress report for DOE project DE-FC26-02NT41490 Project year 1, quarter 2
15
Data between 700 and 900°C was fit, and the relation can comfortably be extrapolated to 600°C. The resulting relation for the percent oxygen volatilized is:
Percent oxygen release = 3.77 exp(0.00292T) (3)
where T is in °C.
Sulfur: Frederick et al. [3] offer a correlation for sulfur release during black liquor devolatilization. The correlation depends only on temperature. For temperatures between 250 and 1018°C,
Percent sulfur released = –163.27 + 0.9717T –1.15e–3T2 + 4.283e–7T3 (4)
Other elements: Volatilization of all other elements (Na, K, Cl, N, Ca, Si, etc.) is ignored.
5.1.2.3 Sections 1–10: Black Liquor Char Gasification
Once the liquor has devolatilized, a char remains. This char is slowly gasified until an inorganic residue (ash) remains. It is assumed that, since the bed is well mixed, this gasification occurs uniformly throughout the bed. Each of the ten bed sections thus contributes equally to C, H, O and S release through gasification. For example, if 20% of the incoming carbon is released during pyrolysis in Section 1 and 10% of the incoming carbon exits the reactor in the solids (as carbonate or unreacted carbon), the remaining 70% is released equally over the 10 sections, with 7% of the incoming carbon being released in each Section.
It is assumed that the final solid product is pure sodium carbonate, Na2CO3, plus residual unreacted organic carbon. (The percent conversion of total carbon is an input variable.) Consequently, all sulfur and hydrogen are assumed to exit in the gas phase. The production rate of sodium carbonate is calculated based on the amount of incoming sodium (and potassium, which was treated as sodium). The associated carbon and oxygen in the carbonate are then calculated. The amounts of carbon and oxygen released during gasification are determined by subtracting the amounts released during pyrolysis and exiting with the solid from the amount input with the black liquor solids.
5.1.3 Level-by-Level Calculations
Conditions at each level are calculated as follows:
Level 0 (below Section 1): The model starts with the bottom of Section 1 (Level 0) and adds all gas-phase C, H, O and S contributed by (1) steam and recycle gas fed to the distributor, (2) drying of the black liquor, and (3) devolatilization of the black liquor solids. The equilibrium composition is calculated, as is the pressure at this point based on the given freeboard pressure and bed height. Since the temperature, pressure, volumetric gas flow rate, reactor geometry and bed void fraction are known, the superficial and actual gas velocities (after drying/devolatilization) are calculated.
Level 1 (above Section 1): At Level 1, the gas has gone through 10% of the volume of the bed. During its passage through this section, C, H, O and S corresponding to 10% of the total char gasification (since this is one of 10 sections) are added to the gas phase. The equilibrium gas composition, pressure, superficial and actual velocities are all recomputed. The residence time in Section 1 is calculated by dividing the height of the section by the average gas velocity through the section (taken as the average of the incoming and outgoing gas velocities).
Quarterly technical progress report for DOE project DE-FC26-02NT41490 Project year 1, quarter 2
16
Levels (and Sections) 2-10: Conditions in the rest of the bed are determined essentially the same as for Level 1. The gas composition is updated and brought to equilibrium, then pressure, gas velocity and residence time is calculated. The final gas exiting the top of the bed (Section 10) is taken to be the product gas from the reactor.
Freeboard: The geometry of the freeboard, including the expansion section at the top of the reactor, is input and the freeboard volume is calculated. The gas velocity and residence time in this section is subsequently calculated. It is assumed that no chemical reactions occur in the freeboard.
5.1.4 Results for Modeling of the Big Island Steam Reformer
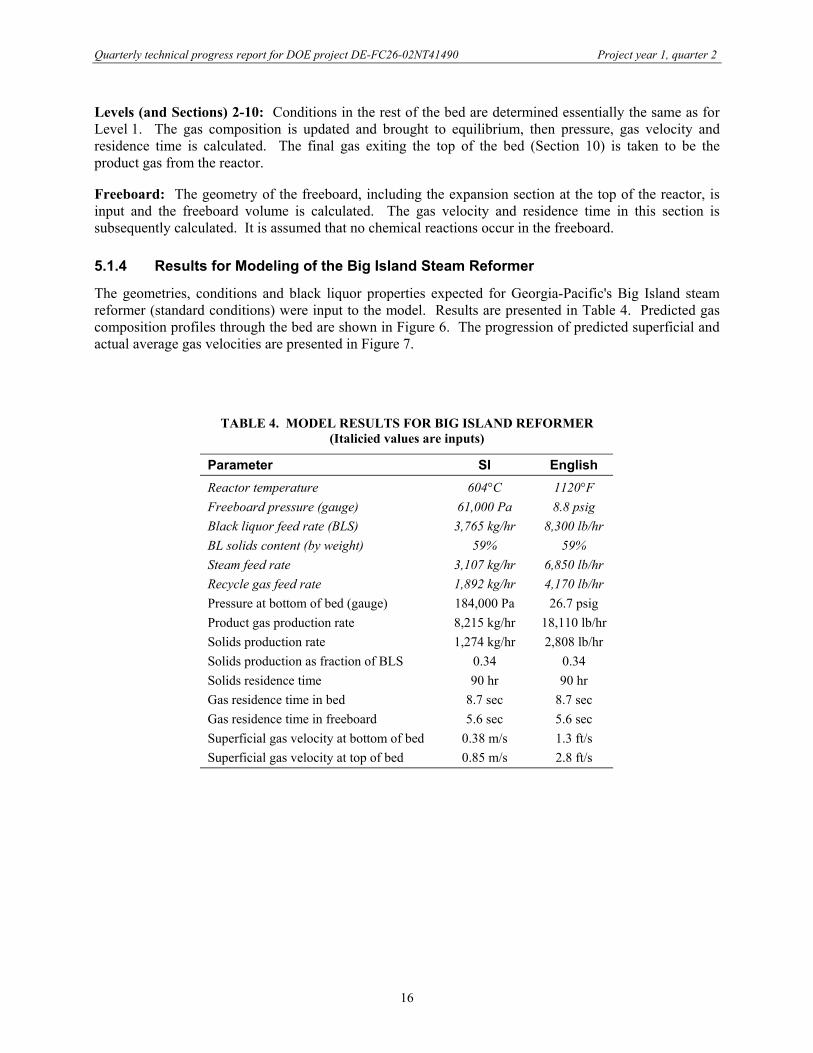
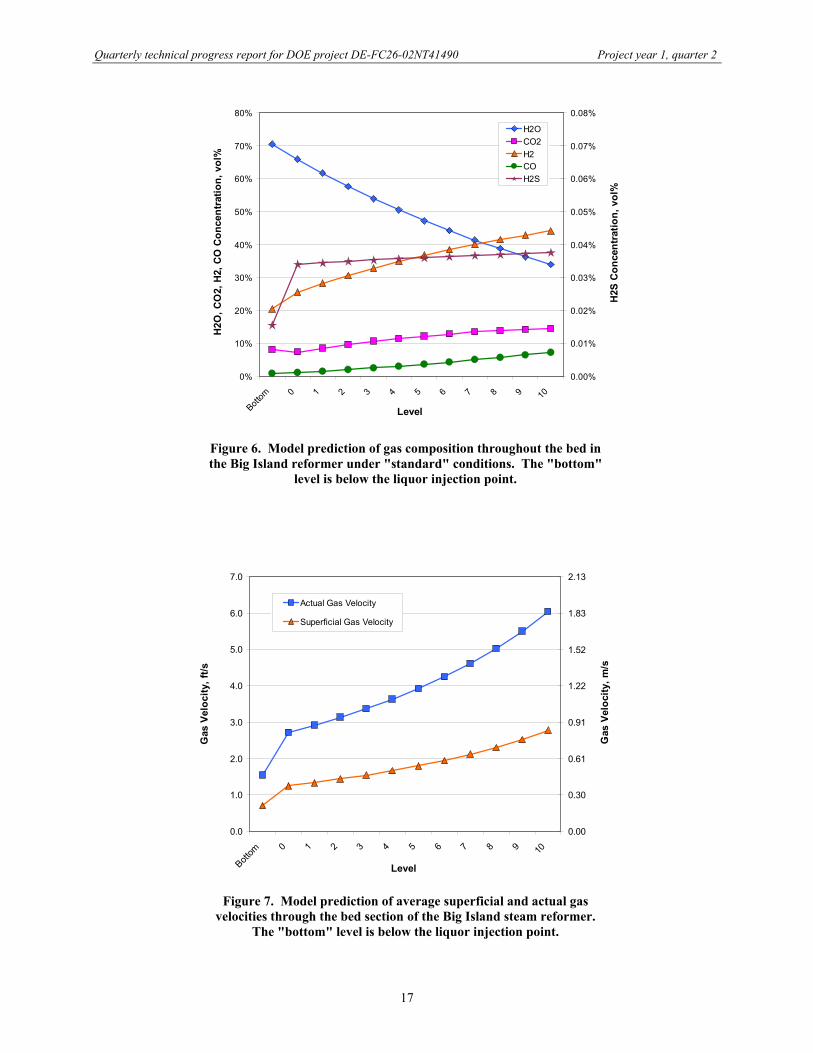
The geometries, conditions and black liquor properties expected for Georgia-Pacific's Big Island steam reformer (standard conditions) were input to the model. Results are presented in Table 4. Predicted gas composition profiles through the bed are shown in Figure 6. The progression of predicted superficial and actual average gas velocities are presented in Figure 7.
TABLE 4. MODEL RESULTS FOR BIG ISLAND REFORMER (Italicied values are inputs)
Parameter SI English Reactor temperature 604°C 1120°F Freeboard pressure (gauge) 61,000 Pa 8.8 psig Black liquor feed rate (BLS) 3,765 kg/hr 8,300 lb/hr BL solids content (by weight) 59% 59% Steam feed rate 3,107 kg/hr 6,850 lb/hr Recycle gas feed rate 1,892 kg/hr 4,170 lb/hr Pressure at bottom of bed (gauge) 184,000 Pa 26.7 psig Product gas production rate 8,215 kg/hr 18,110 lb/hr Solids production rate 1,274 kg/hr 2,808 lb/hr Solids production as fraction of BLS 0.34 0.34 Solids residence time 90 hr 90 hr Gas residence time in bed 8.7 sec 8.7 sec Gas residence time in freeboard 5.6 sec 5.6 sec Superficial gas velocity at bottom of bed 0.38 m/s 1.3 ft/s Superficial gas velocity at top of bed 0.85 m/s 2.8 ft/s
Quarterly technical progress report for DOE project DE-FC26-02NT41490 Project year 1, quarter 2
17
0%
10%
20%
30%
40%
50%
60%
70%
80%
Bottom 0 1 2 3 4 5 6 7 8 9 10
Level
H2O
, CO
2, H
2, C
O C
once
ntra
tion,
vol
%
0.00%
0.01%
0.02%
0.03%
0.04%
0.05%
0.06%
0.07%
0.08%
H2S
Conc
entra
tion,
vol
%
H2OCO2H2COH2S
Figure 6. Model prediction of gas composition throughout the bed in the Big Island reformer under "standard" conditions. The "bottom"
level is below the liquor injection point.
0.0
1.0
2.0
3.0
4.0
5.0
6.0
7.0
Bottom 0 1 2 3 4 5 6 7 8 9 10
Level
Gas
Vel
ocity
, ft/s
0.00
0.30
0.61
0.91
1.22
1.52
1.83
2.13
Gas
Vel
ocity
, m/s
Actual Gas Velocity
Superficial Gas Velocity
Figure 7. Model prediction of average superficial and actual gas velocities through the bed section of the Big Island steam reformer.
The "bottom" level is below the liquor injection point.
Quarterly technical progress report for DOE project DE-FC26-02NT41490 Project year 1, quarter 2
18
5.2 Computational Model of Entire Reactor (REI 1½-D Model) Reaction Engineering International (REI) is developing a 1½-D model based on an existing fluidized bed model that REI developed under a DOE-sponsored Vision 21 program. The model takes into account vertical temperature and concentration gradients and downflow near the wall. The model for the entire Big Island reactor describes the fluid dynamics, chemistry and heat transfer in the reactor. Details of the system, such as interaction between bubbles and the pulsed heater tube bundles, are estimated from the correlations for heat exchange tubes in fluidized bed combustors.
The model now uses literature data for system chemistry and fluid dynamics. This model will be improved over time by incorporating data on conversion from the University of Utah's gasification test system, and by modifying the fluid dynamics submodel to use the fluid dynamics portion of the rigid MFIX code developed at the National Energy Technology Laboratory (NETL). As development progresses, the model will be validated through comparison with results from the Utah gasifier. Once the Big Island facility is operating, the ambition is to validate the model with data from this system.
5.2.1 Three-Phase Bubbling Fluidized Bed Model Description
A three-phase countercurrent backmixing model has been developed and implemented into a computer code. The model assumes that the fluidized bed consists of three distinct phases:
• A particle-free bubble phase where the gas moves upward in plug flow • A wake-cloud phase where the gas and the solids move upward with the bubbles • A dense phase in which the solids move downward. The voidage in the dense phase is assumed to
be the same as that in the wake-cloud phase and is assumed to be the voidage at minimum fluidization.
• The bubble sizes are calculated allowing for bubble growth by coalescence with increasing height in the bed and decrease in bubble size as a result of bubble intersection with tubes. Different bubble sizes are calculated for the bubbles in the heater tube banks, the voids between the tube banks and the confining cylindrical walls, and the bubbles that flow through the open wedges between the overlap of tube banks. The evolution in bubble size for each section was reported in the previous quarterly progress report. In the 1½-D model the bubble sizes are averaged across a cylindrical cross section.
Details of the model are given in the following sections.
5.2.1.1 Overall Gas Balances
For the conditions under consideration, bubbles in the fluidized bed are fast bubbles [1]. Thus, the three-phase countercurrent backmixing model leads to
mfe,gwbbmfwbbb0 u])f(1f1[ufffuu ε+−+ε+= (5)
where ug,e is the gas velocity in the dense phase. Solid particles carried up in the wake phase must be balanced by the solids moving downward in the dense phase, therefore,
)]f(1f1[uffu wbe,swbb +−=− (6)
Quarterly technical progress report for DOE project DE-FC26-02NT41490 Project year 1, quarter 2
19
where us,e is the velocity of solids in the dense phase. The slip velocity between the gas and the particles in the dense phase is assumed to be the ratio of the minimum fluidization velocity to the bed voidage at minimum fluidization. Thus, the absolute gas velocity in the dense phase is given by
mfmfe,se,g /uuu ε+= (7)
Note that when the superficial gas velocity is sufficiently high, ug,e may become negative indicating gas in the dense phase moving downward. Since the total gas mass flow rate may change along the bed height as the gasification proceeds, the superficial gas velocity also changes; it can be written as
∑+=ρ
= − AhMfRmm;Am
u ii1j,gj,gg
g0 (8)
where j is the cell index starting from the bottom of the bed; f is the phase fraction and Ri, Mi, and h are gas species formation rate (kmol/m3s), species molecular weight and the cell height, respectively.
5.2.1.2 Species Mass Balances
For steady state conditions, species mass balance equations in different phases can be written as follows:
Bubble phase
0RAf)CC(KAfdz
)Afu(d)CC(
dz)ACfu(d
b,ibw,ib,ibwbbb
w,i2b,ilb,ibb =+−+λ+λ− (9)
where Ci,b denotes the concentration of species i. Subscripts b, w represent the bubble and wake phases, respectively. A is the cross-sectional area of the bed; it changes along the bed height in the regions of the tube bundles and the freeboard. The first term in the above equation is the convection due to the finite velocity of the bubble phase. The second term represents the cross-flow that accounts for the variation of bubble properties along the bed height above the gas distributor. λ1 and λ2 are constant; if d(ubfbA)/dz ≥ 0, λ1 = 0 and λ2 = 1; if d(ubfbA)/dz < 0, λ1 = 1 and λ2 = 0. The third term is the exchange of gas between the bubble phase and the wake phase. The last term represents the consumption rate of species i in the bubble phase.
Wake phase
Similarly, for the wake phase, gas species mass balance can be written as
0RA)ε(1ffRAεff)CC(AKf
)CC(AKfzd
}uεA)]f(1f{[1d)CλC(λ
dz)Afu(d
)CC(dz
)CεAffu(d
sw,i,mfwbgw,i,mfwbe,iw,iweb
b,iw,ibwbeg,mfwb
wi,4ei,3
bbw,i2b,i1
w,imfwbb
=−++−+
−++−
++
λ+λ+
(10)
Quarterly technical progress report for DOE project DE-FC26-02NT41490 Project year 1, quarter 2
20
The first term in the above equation is the convection term. The second and third terms are the cross-flow. λ3 and λ4 are constant; if d{[1–fb(1+fw)]Aεmfug,e}/dz ≥ 0, λ3=0 and λ4=1; if d{[1–fb(1+fw)]Aεmfug,e}/dz < 0, λ3=1 and λ4=0. The fourth and fifth terms are the exchange of gas between the bubble and wake phases and between the wake and dense phases, respectively. The last two terms represent species consumption rates due to homogeneous and heterogeneous reactions, respectively.
Dense phase
For the dense phase, mass balance equation can be derived as
0R)ε)}A(1f(1f{1RεA)]f(1f[1)C-(CAKfzd
}uεA)]f(1f{[1d)CλC(λ
zd}CuεA)]f(1f{[1d
es,mfwbge,i,mfwbwi,ei,web
eg,mfwbwi,4ei,3
ei,eg,mfwb
=−+−++−++
+−+−
+− (11)
The terms in the above equation represent convection, cross-flow, exchange of gas between the dense and wake phases, species consumption rates due to homogeneous and heterogeneous reactions, respectively.
Freeboard region
In the freeboard, homogeneous reactions, especially the water-gas shift reaction, continue. The mass balance equation accounts for these reactions. The species mass balance equation is
0RdzCd
u f,if,i
0 =+ (12)
5.2.1.3 Exchange Coefficients
The mass exchange coefficients have been adopted from Kunii and Levenspiel [1]. The mass transfer coefficient between the bubble phase and the wake phase is
bmf25.1
b25.05.0
gbw d/u5.4)d/gD(85.5K += (13)
where Dg is the gas diffusivity and db is the bubble diameter. The mass exchange coefficient between the wake and emulsion phases is taken as
213bmfgbwe )d/Dgd71.0(77.6K ε= (14)
5.2.1.4 Energy Balance
Assume the gas in the bubble phase, the wake phase and the dense phase has the same temperature and the solids in the wake and dense phases also have the same temperature. The gas and the solids may have different temperatures and heat exchange is allowed to take place between the gas and solid phases. An energy balance for the gas phase can be written as
Quarterly technical progress report for DOE project DE-FC26-02NT41490 Project year 1, quarter 2
21
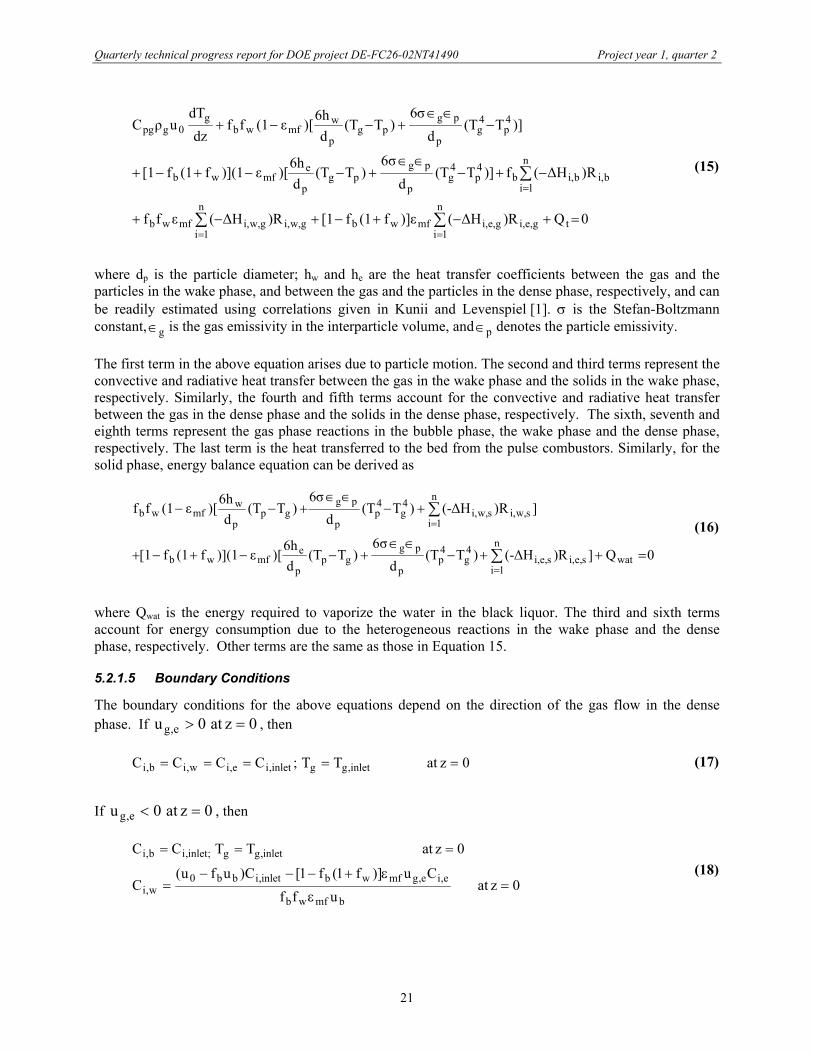
0Q)R∆H()]εf(1f[1)R∆H(εff
R)∆Η(f)]T(Td
6σ)T(T
d6h
)[ε)](1f(1f[1
)]T(Td
σ6)T(T
d6h
)[ε(1ffzd
TduρC
tn
1ige,i,ge,i,mfwb
n
1igw,i,gw,i,mfwb
bi,n
libi,b
4p
4g
p
pgpg
p
emfwb
4p
4g
p
pgpg
p
wmfwb
g0gpg
=+−+−+−+
−+−∈∈
+−−+−+
−∈∈
+−−+
∑∑
∑
==
=
(15)
where dp is the particle diameter; hw and he are the heat transfer coefficients between the gas and the particles in the wake phase, and between the gas and the particles in the dense phase, respectively, and can be readily estimated using correlations given in Kunii and Levenspiel [1]. σ is the Stefan-Boltzmann constant, g∈ is the gas emissivity in the interparticle volume, and p∈ denotes the particle emissivity.
The first term in the above equation arises due to particle motion. The second and third terms represent the convective and radiative heat transfer between the gas in the wake phase and the solids in the wake phase, respectively. Similarly, the fourth and fifth terms account for the convective and radiative heat transfer between the gas in the dense phase and the solids in the dense phase, respectively. The sixth, seventh and eighth terms represent the gas phase reactions in the bubble phase, the wake phase and the dense phase, respectively. The last term is the heat transferred to the bed from the pulse combustors. Similarly, for the solid phase, energy balance equation can be derived as
0Q])RH(-∆)T(Td
6σ)T(T
d6h
)[ε)](1f(1f[1
]R)H(-∆)T(Td
σ6)T(T
d6h
)[ε(1ff
watn
1ise,i,se,i,
4g
4p
p
pggp
p
emfwb
sw,i,n
1isw,i,
4g
4p
p
pggp
p
wmfwb
=++−∈∈
+−−+−+
+−∈∈
+−−
∑
∑
=
= (16)
where Qwat is the energy required to vaporize the water in the black liquor. The third and sixth terms account for energy consumption due to the heterogeneous reactions in the wake phase and the dense phase, respectively. Other terms are the same as those in Equation 15.
5.2.1.5 Boundary Conditions
The boundary conditions for the above equations depend on the direction of the gas flow in the dense phase. If 0zat0u e,g => , then
0zatTT;CCCC inlet,gginlet,ie,iw,ib,i ===== (17)
If 0zat0u e,g =< , then
0zatuff
Cu)]f1(f1[C)ufu(C
0zatTTCC
bmfwb
e,ie,gmfwbinlet,ibb0w,i
inlet,gg;inlet,ib,i
=ε
ε+−−−=
=== (18)
Quarterly technical progress report for DOE project DE-FC26-02NT41490 Project year 1, quarter 2
22
and at the top surface of the fluidized bed,
tw,ie,i HzatCC == (19)
5.2.1.6 Gasification Kinetics
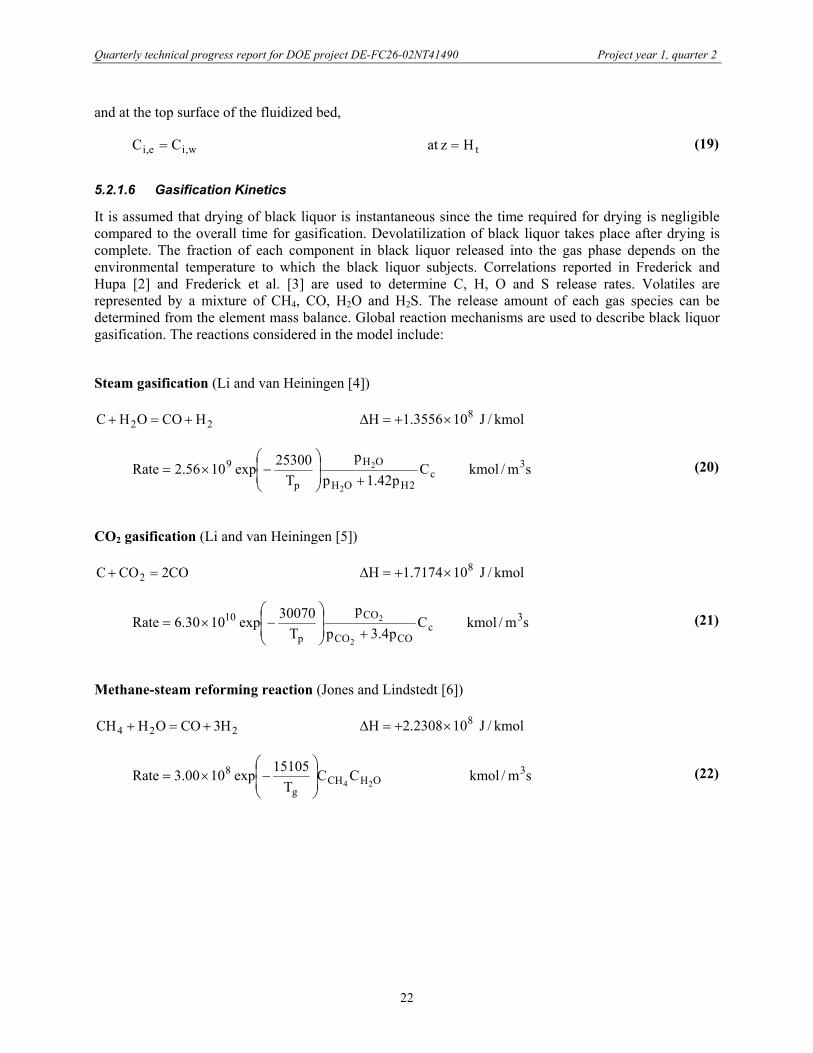
It is assumed that drying of black liquor is instantaneous since the time required for drying is negligible compared to the overall time for gasification. Devolatilization of black liquor takes place after drying is complete. The fraction of each component in black liquor released into the gas phase depends on the environmental temperature to which the black liquor subjects. Correlations reported in Frederick and Hupa [2] and Frederick et al. [3] are used to determine C, H, O and S release rates. Volatiles are represented by a mixture of CH4, CO, H2O and H2S. The release amount of each gas species can be determined from the element mass balance. Global reaction mechanisms are used to describe black liquor gasification. The reactions considered in the model include:
Steam gasification (Li and van Heiningen [4])
22 HCOOHC +=+ kmol/J103556.1H 8×+=∆
sm/kmolCp42.1p
pT
25300exp1056.2Rate 3c
2HOH
OH
p
9
2
2
+
−×= (20)
CO2 gasification (Li and van Heiningen [5])
CO2COC 2 =+ kmol/J107174.1H 8×+=∆
sm/kmolCp4.3p
pT
30070exp1030.6Rate 3c
COCO
CO
p
10
2
2
+
−×= (21)
Methane-steam reforming reaction (Jones and Lindstedt [6])
224 H3COOHCH +=+ kmol/J102308.2H 8×+=∆
sm/kmolCCT
15105exp1000.3Rate 3OHCH
g
824
−×= (22)
Quarterly technical progress report for DOE project DE-FC26-02NT41490 Project year 1, quarter 2
23
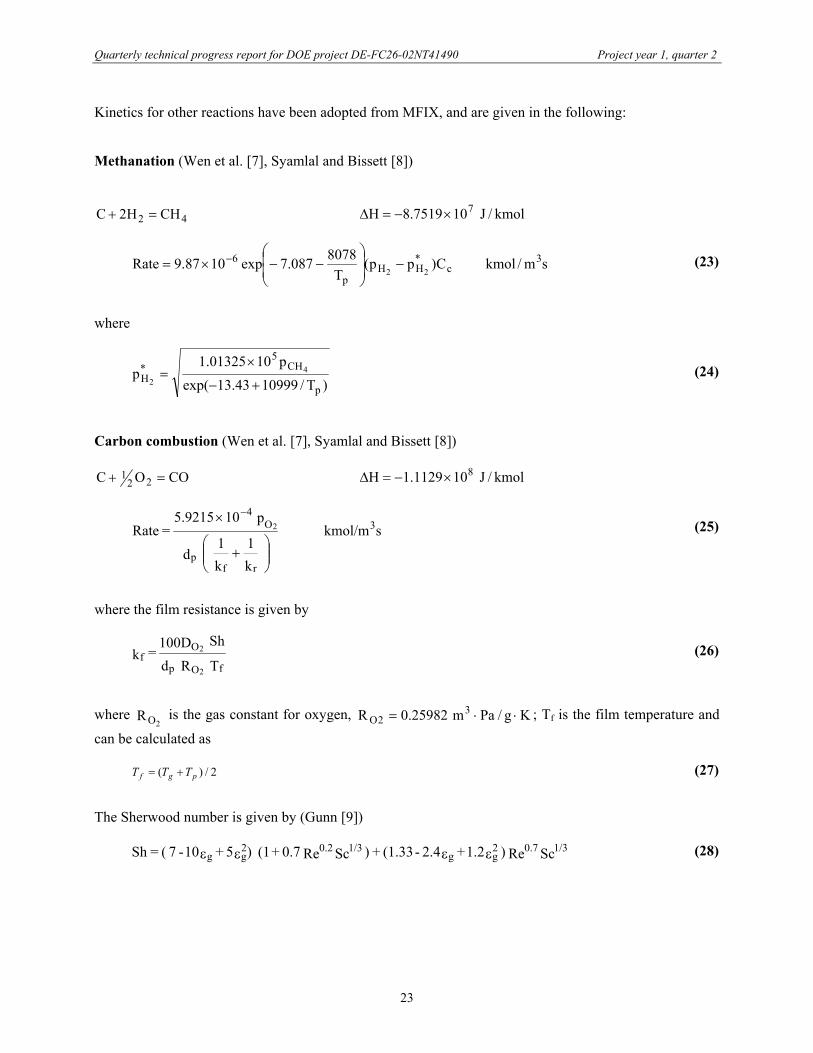
Kinetics for other reactions have been adopted from MFIX, and are given in the following:
Methanation (Wen et al. [7], Syamlal and Bissett [8])
42 CHH2C =+ kmol/J107519.8H 7×−=∆
sm/kmolC)pp(T
8078087.7exp1087.9Rate 3c
*HH
p
622
−
−−×= − (23)
where
)T/1099943.13exp(p1001325.1
pp
CH5
*H
42 +−
×= (24)
Carbon combustion (Wen et al. [7], Syamlal and Bissett [8])
COOC 221 =+ kmol/J101129.1H 8×−=∆
skmol/m
k1
k1 d
p 109215.5 = Rate 3
rfp
O4
2
+
× − (25)
where the film resistance is given by
T R d
Sh D100 = k
fOp
Of
2
2 (26)
where 2OR is the gas constant for oxygen, Kg/Pam25982.0R 3
2O ⋅⋅= ; Tf is the film temperature and
can be calculated as
2/)( pgf TTT += (27)
The Sherwood number is given by (Gunn [9])
Sc Re ) 1.2 + 2.4 - (1.33 + ) Sc Re 0.7 + (1 )5 + 10 - 7 ( =Sh 1/30.72gg
1/30.22gg εεεε (28)
Quarterly technical progress report for DOE project DE-FC26-02NT41490 Project year 1, quarter 2
24
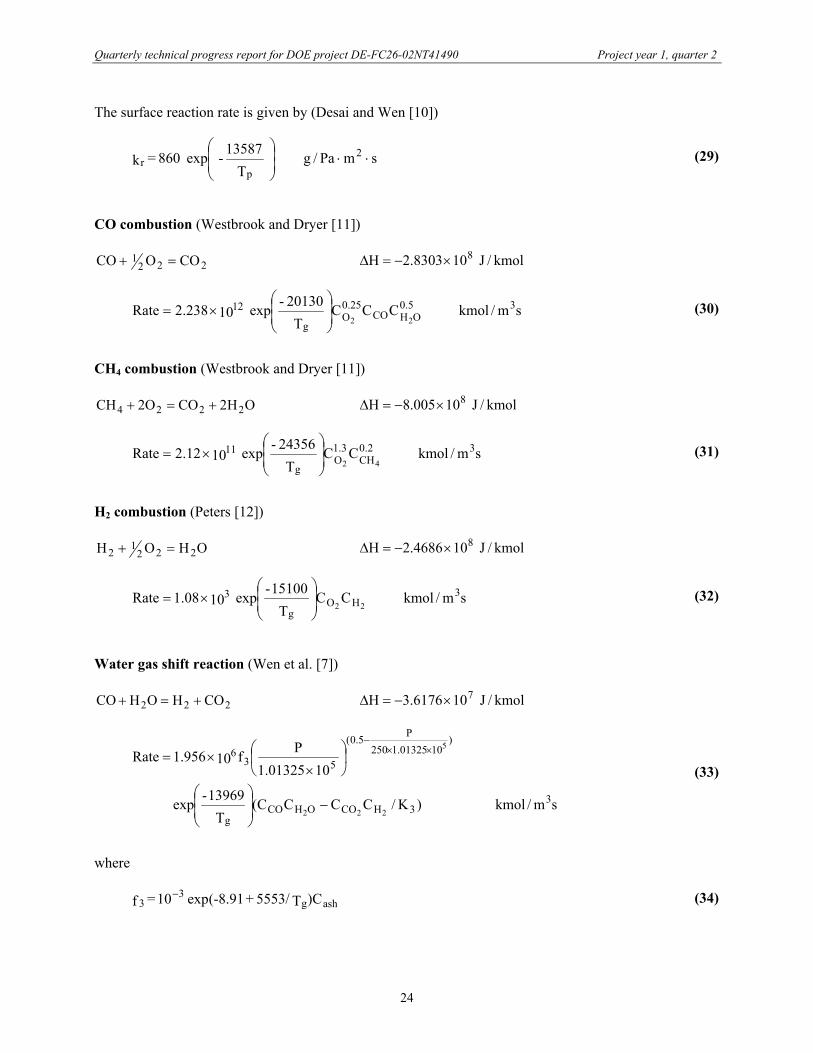
The surface reaction rate is given by (Desai and Wen [10])
smPa/g T
13587- exp 860 = k 2
pr ⋅⋅
(29)
CO combustion (Westbrook and Dryer [11])
2221 COOCO =+ kmol/J108303.2H 8×−=∆
sm/kmol CCCT
20130-exp 10238.2Rate 35.0OHCO
25.0O
g
1222
×= (30)
CH4 combustion (Westbrook and Dryer [11])
OH2COO2CH 2224 +=+ kmol/J10005.8H 8×−=∆
sm/kmol CCT
24356-exp 1012.2Rate 32.0CH
3.1O
g
1142
×= (31)
H2 combustion (Peters [12])
OHOH 2221
2 =+ kmol/J104686.2H 8×−=∆
sm/kmol CCT
15100-exp 1008.1Rate 3HO
g
322
×= (32)
Water gas shift reaction (Wen et al. [7])
222 COHOHCO +=+ kmol/J106176.3H 7×−=∆
sm/kmol )K/CCCC(T
13969-exp
1001325.1Pf10956.1Rate
33HCOOHCO
g
)1001325.1250
P5.0(
536
222
5
−
××= ××
−
(33)
where
ashg3
3 )CT5553/+(-8.91exp10 = f − (34)
Quarterly technical progress report for DOE project DE-FC26-02NT41490 Project year 1, quarter 2
25
and the equilibrium constant is given by
)T/3955.71+61exp(-3.630 = K g3 (35)
The above mechanisms only account for gasification and combustion of carbon in black liquor. Since black liquor contains significant amount of oxygen and considerable amount of hydrogen, it is important to also consider the release of oxygen and hydrogen from black liquor during gasification. It is assumed that ash consists of sodium carbonate and potassium carbonate. The release rates of oxygen and hydrogen are assumed to be proportional to the carbon consumption rate and the ratio of the amount of oxygen or hydrogen available for release to the amount of carbon available for gasification.
5.2.2 Preliminary Model Results
The mass and energy balance equations given above form a set of equations, which have to be solved numerically simultaneously along with the boundary conditions. A finite-difference method has been used to discretize the equations and a computer code has been developed. In order to test the code, the following operating conditions are used in the simulations:
• Black liquor solids: 8300 lb/hr • Liquor solids fraction: 0.59 • Steam flow rate: 6850 lb/hr • Recycle gas: 4170 lb/hr • Pressure at the freeboard: 8.8 psig • Solids Removal Rate: 2835 lb/hr
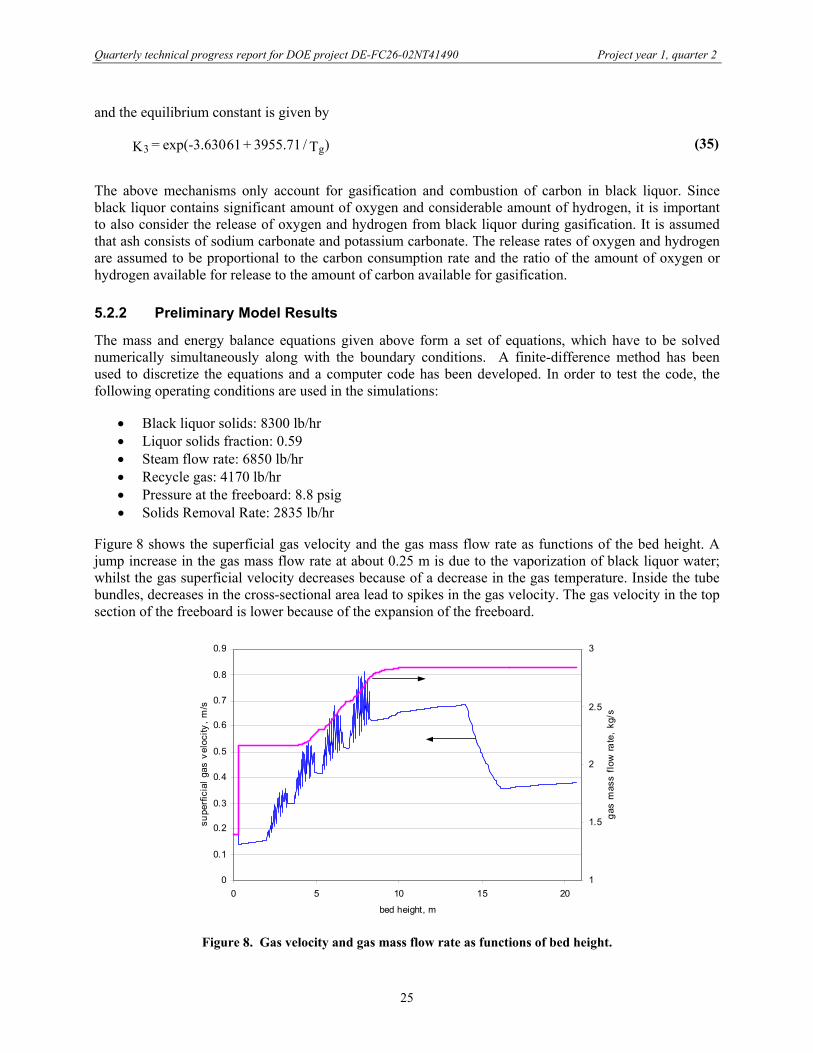
Figure 8 shows the superficial gas velocity and the gas mass flow rate as functions of the bed height. A jump increase in the gas mass flow rate at about 0.25 m is due to the vaporization of black liquor water; whilst the gas superficial velocity decreases because of a decrease in the gas temperature. Inside the tube bundles, decreases in the cross-sectional area lead to spikes in the gas velocity. The gas velocity in the top section of the freeboard is lower because of the expansion of the freeboard.
0
0.1
0.2
0.3
0.4
0.5
0.6
0.7
0.8
0.9
0 5 10 15 20
bed height, m
supe
rfici
al g
as v
eloc
ity, m
/s
1
1.5
2
2.5
3
gas
mas
s flo
w ra
te,
kg/s
Figure 8. Gas velocity and gas mass flow rate as functions of bed height.
Quarterly technical progress report for DOE project DE-FC26-02NT41490 Project year 1, quarter 2
26
300
400
500
600
700
800
900
0 5 10 15 20
bed height, m
tem
pera
ture
, KTgTp
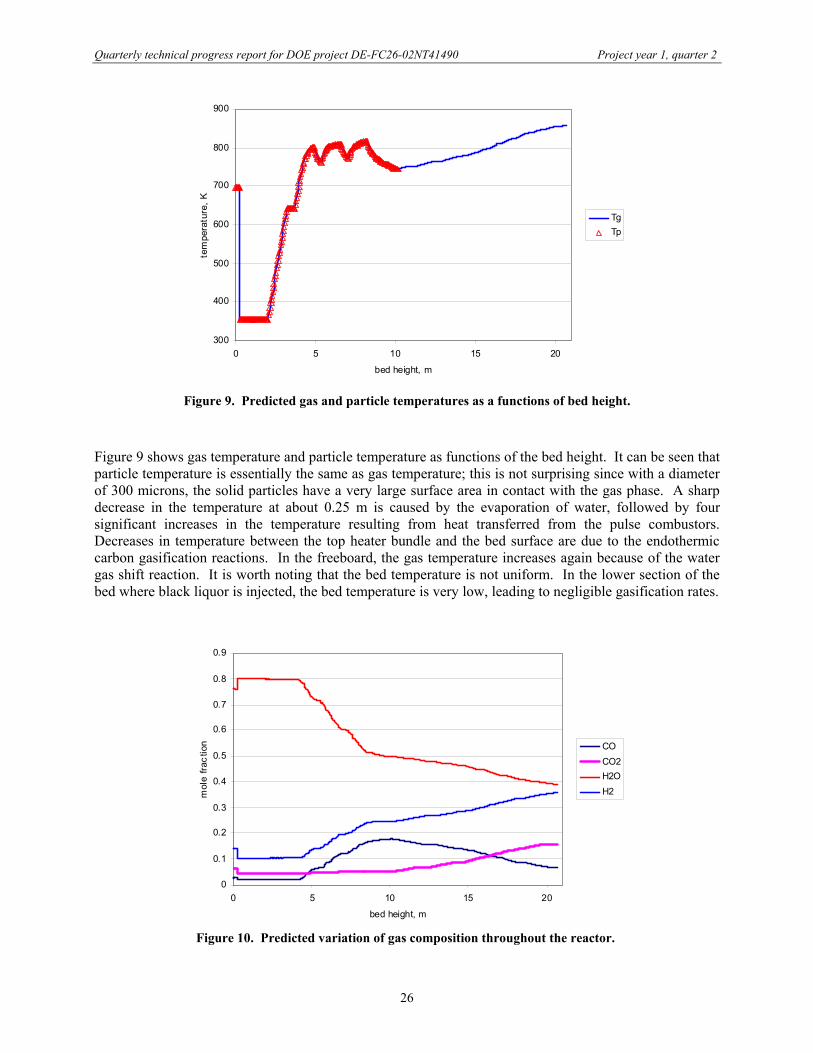
Figure 9. Predicted gas and particle temperatures as a functions of bed height.
Figure 9 shows gas temperature and particle temperature as functions of the bed height. It can be seen that particle temperature is essentially the same as gas temperature; this is not surprising since with a diameter of 300 microns, the solid particles have a very large surface area in contact with the gas phase. A sharp decrease in the temperature at about 0.25 m is caused by the evaporation of water, followed by four significant increases in the temperature resulting from heat transferred from the pulse combustors. Decreases in temperature between the top heater bundle and the bed surface are due to the endothermic carbon gasification reactions. In the freeboard, the gas temperature increases again because of the water gas shift reaction. It is worth noting that the bed temperature is not uniform. In the lower section of the bed where black liquor is injected, the bed temperature is very low, leading to negligible gasification rates.
0
0.1
0.2
0.3
0.4
0.5
0.6
0.7
0.8
0.9
0 5 10 15 20
bed height, m
mol
e fra
ctio
n COCO2H2OH2
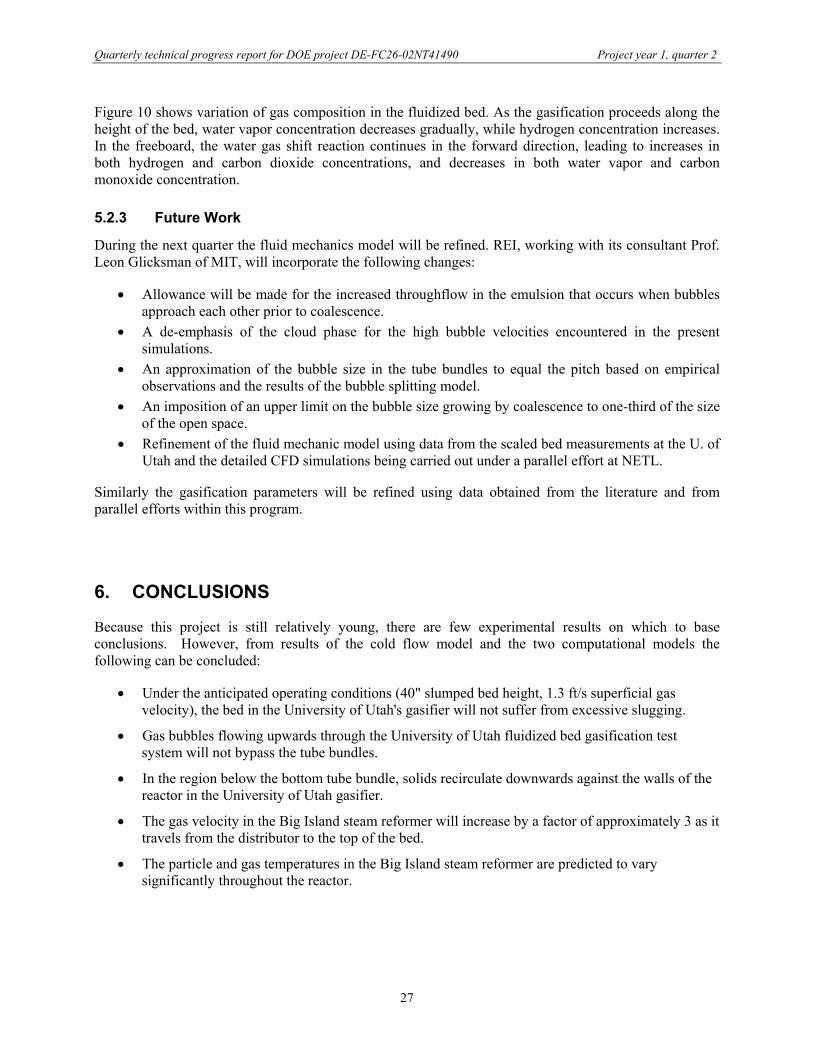
Figure 10. Predicted variation of gas composition throughout the reactor.
Quarterly technical progress report for DOE project DE-FC26-02NT41490 Project year 1, quarter 2
27
Figure 10 shows variation of gas composition in the fluidized bed. As the gasification proceeds along the height of the bed, water vapor concentration decreases gradually, while hydrogen concentration increases. In the freeboard, the water gas shift reaction continues in the forward direction, leading to increases in both hydrogen and carbon dioxide concentrations, and decreases in both water vapor and carbon monoxide concentration.
5.2.3 Future Work
During the next quarter the fluid mechanics model will be refined. REI, working with its consultant Prof. Leon Glicksman of MIT, will incorporate the following changes:
• Allowance will be made for the increased throughflow in the emulsion that occurs when bubbles approach each other prior to coalescence.
• A de-emphasis of the cloud phase for the high bubble velocities encountered in the present simulations.
• An approximation of the bubble size in the tube bundles to equal the pitch based on empirical observations and the results of the bubble splitting model.
• An imposition of an upper limit on the bubble size growing by coalescence to one-third of the size of the open space.
• Refinement of the fluid mechanic model using data from the scaled bed measurements at the U. of Utah and the detailed CFD simulations being carried out under a parallel effort at NETL.
Similarly the gasification parameters will be refined using data obtained from the literature and from parallel efforts within this program.
6. CONCLUSIONS
Because this project is still relatively young, there are few experimental results on which to base conclusions. However, from results of the cold flow model and the two computational models the following can be concluded:
• Under the anticipated operating conditions (40" slumped bed height, 1.3 ft/s superficial gas velocity), the bed in the University of Utah's gasifier will not suffer from excessive slugging.
• Gas bubbles flowing upwards through the University of Utah fluidized bed gasification test system will not bypass the tube bundles.
• In the region below the bottom tube bundle, solids recirculate downwards against the walls of the reactor in the University of Utah gasifier.
• The gas velocity in the Big Island steam reformer will increase by a factor of approximately 3 as it travels from the distributor to the top of the bed.
• The particle and gas temperatures in the Big Island steam reformer are predicted to vary significantly throughout the reactor.
Quarterly technical progress report for DOE project DE-FC26-02NT41490 Project year 1, quarter 2
28
NOMENCLATURE
Symbols
A cross-sectional area of the bed, m2 C gas species concentration, kmol/m3 Cpg gas specific heat, J/kg⋅K d diameter, m Dg gas diffusivity, m2/s DO2 oxygen diffusivity, m2/s f phase fraction g acceleration due to gravity, m/s2 h heat transfer coefficient, W/m2⋅K Ht expanded bed height, m K3 equilibrium constant Kbw mass transfer coefficient between the bubble phase and the wake phase, 1/s Kwe mass transfer coefficient between the wake phase and the dense phase, 1/s L length, m m gas mass flow rate, kg/s Mi gas species molecular weight, kg/kmol pi gas species partial pressure, Pa Qt heat transferred from the pulse combustor, W/m3 Qwat heat required for evaporation of water, W/m3 R universal gas constant, J/mol⋅K Re Reynolds number )/du( pmfg µρ=
Ri,b, Ri,w,g, Ri,e,g homogeneous reaction rate in the bubble, wake and dense phases, kmol/m3⋅s Ri,w,s, Ri,e,s heterogeneous reaction rate in the wake and dense phases, kmol/m3⋅s Sc Schmidt number ))D/(( ggρµ=
T temperature, K u velocity, m/s u0 superficial gas velocity, m/s ub bubble rise velocity, m/s ε bed voidage ∈ emissivity µ gas viscosity, Pa·s ρ density, kg/m3 σ Stefan-Boltzmann constant ∆H heat of reaction, J/kmol
Quarterly technical progress report for DOE project DE-FC26-02NT41490 Project year 1, quarter 2
29
Subscripts
ash ash in black liquor b bubble phase c carbon e dense (emulsion) phase f freeboard or film g gas i gas species index inlet inlet conditions j cell index mf minimum fluidization p particle s solids w wake phase
Quarterly technical progress report for DOE project DE-FC26-02NT41490 Project year 1, quarter 2
30
REFERENCES
1. KUNII, D., LEVENSPIEL, O., Fluidization Engineering, Butterworth-Heinemann Publ., Newton, MA (1991).
2. FREDERICK, J., HUPA, M., "Combustion properties of kraft black liquors," Åbo Akademi Combustion Chemistry Research Group Report 93-3, also reported under DOE project DE-IG02-90CE40936, subcontract 91-001, ISBN 951-650-236-9 (1993).
3. FREDERICK, W.J., IISA, K., WÅG, K., REIS, V.V., BOONSONGSUP, L., FORSSÉN, M., HUPA, M., "Sodium and sulfur release and recapture during black liquor burning," Åbo Akademi Combustion Chemistry Research Group Report 96-4, also reported under DOE contract DE-FG02-90CE40936, ISBN 951-650-719-0 (1996).
4. LI, J., VAN HEININGEN, A.R.P., "Kinetics of gasification of black liquor char by steam," Ind. Eng. Chem. Res. 30(7):1594-1601 (1991).
5. LI, J., VAN HEININGEN, A.R.P., "Kinetics of CO2 gasification of fast pyrolysis black liquor char," Ind. Eng. Chem. Res. 29(9):1776-1785 (1990).
6. JONES, W.P., LINDSTEDT, R.P., "Global reaction schemes for hydrocarbon combustion," Combustion and Flame, 73:233-249 (1988).
7. WEN, C.Y., CHEN, H., ONOZAKI, M., "User's manual for computer simulation and design of the moving bed coal gasifier," DOE/MC/16474-1390, NTIS/DE83009533 (1982).
8. SYAMLAL, M., BISSETT, L.A., "METC gasifier advanced simulation (MGAS) model," Technical Note, NTIS report No. DOE/METC-92/4108 (1992).
9. GUNN, D.J., "Transfer of heat or mass to particles in fixed and fluidized beds," Int. J. Heat Mass Transfer, 21:467-476 (1978).
10. DESAI, P.R., WEN, C.Y., "Computer modeling of the MERC fixed bed gasifier," MERC/CR-78/3 (1978).
11. WESTBROOK, C.K., DRYER, F.L., "Simplified mechanisms for the oxidation of hydrocarbon fuels in flames," Combustion Sci. Tech., 27:31-43 (1981).
12. PETERS, N., "Premixed burning in diffusion flames -- the flame zone model of Libby and Economos," Int. J. Heat Mass Transfer, 22:691-703 (1979).