Embed Size (px)
Citation preview

Digest Journal of Nanomaterials and Biostructures Vol. 9, No. 4, October - December 2014, p. 1713 - 1727
INVESTIGATION OF PRISTINE AND FUNCTIONALIZED SINGLE-WALLED
CARBON NANOHORNS FOR PHOSPHOR APPLICATIONS
D. KUMAR*, KAVITA
a, K. SINGH, V. VERMA
b , H. S. BHATTI
Department of Physics, Punjabi University, Patiala-147002, Punjab, India a
Department of Physics, M M Modi College, Patiala-147001, Punjab, India bDepartment of Physics, Govt. College, Naya Nangal, Distt Ropar 140126,
Punjab, India
Carbon nanohorns represent a largely unexplored carbon allotrope within the family of
fullerenes and carbon nanotubes. There are three critical points that differentiate carbon
nanohorns (CNHs) from carbon nanotubes (CNTs), namely, i)purity, due to the absence of
any metal nanoparticles during production, ii) heterogeneous surface structure, due to
highly-strained conical-ends, and, iii) aggregation in spherical superstructures, typically
ranging between 50-100 nm. In the present investigation single wall carbon nanohorns
have been synthesized by submerged arc method followed by hydroxyl and carboxylic
addent functionalization using high speed vibration method to make them water soluble.
Crystallographic, topographic and morphological analyses of pristine and water soluble
SWCNHs have been studied via powder X-ray diffraction, field emission scanning
electron microscope, high resolution transmission electron microscope and atomic force
microscope respectively. UV-Vis. absorption, Raman spectroscopy, thermogravemetric
analysis, X-ray photo electron spectroscopy and Fourier transform infra-red spectroscopic
studies have been carried out for the functionalization confirmation. Optical, quantitative
and qualitative analysis of the pristine and functionalized single wall carbon nanohorns
(SWCNHs) have been conceded via energy resolved and time resolved photoluminescence
and energy dispersive X-ray spectroscopic studies respectively. Spectroscopic studies
confirm the formation of good quality pristine and functionalized SWCNHs with hydroxyl
and carboxylic group addent Spectroscopic studies confirm the formation of good quality
pristine and water soluble SWCNHs. The presented method demonstrated its remarkable
potentiality in large-scale production of SWCNHs with good purity. Structural analyses of
synthesized and functionalized SWCNHs have been studied using Brunauer-Emmett-
Teller Surface area analysis Barrett-Joyner-Halenda pore size and volume analysis
Technique.
(Received October 5, 2014; Accepted December 17, 2014)
Keywords: SWCNHs, submerged arc method, Crystallographic, Topographic,
Morphological and spectroscopic studies
1. Introduction
Single-walled carbon nanohorn (SWCNH) is the name given by Sumio Iijima and
colleagues in 1999 to horn-shaped sheath aggregate of graphene sheets. [1-2] Very similar
structures had been observed by Peter et. al,.[3] in 1994. Ever since the discovery of the fullerene,
[4] the family of carbon nanostructures has been steadily expanded. Included in this family are
single-walled (SWCNTs) and multi-walled carbon nanotubes (MWCNTs), [5] carbon onions and
cones and, most recently, SWCNHs. These SWCNHs with about 40–50 nm tubule length and 2–
3 nm in diameter are derived from SWCNTs and ended by a five-pentagon conical cap with a cone
opening angle of ~20o.[6-8] Moreover, thousands of SWCNHs associate with each other to form
*Corresponding author:

1714
the ‘dahlia-like' and ‘bud-like’ structured aggregates which have an average diameter of about 80-
100 nm. The former consists of tubules and graphene sheets protruding from its surface like petals
of a dahlia, while the latter is composed of tubules developing inside the particle itself.[9] Their
unique structures with high surface area and micro porosity make SWCNHs a promising material
for gas adsorption, biosensing, drug delivery,[10] gas storage[11] and catalyst support for fuel cell
[12] Single-walled carbon nanohorns are an example of the family of carbon nanocones SWCNHs
can be synthesized with high purity by CO2 laser ablation [1] and arc discharge without any metal
catalyst [13]. The size and purity of the SWCNHs can be changed by varying the parameters such
as temperature, pressure, voltage and current. Various methods have been developed to
functionalize carbon nanohorns including covalent bonding, π-π stacking, supramolecular
assembly and decoration of metal nanoparticles. [14-22]. The present research paper make use of
submerged arc method for production of SWCNHs and then utilized high speed vibration method
(HSVM) to functionalize these materials with hydroxyl and carboxylic groups to make them water
soluble.
2. Experimental Details
2.1 Synthesis of SWCNHs
A dc arc discharge was generated between two graphite electrodes submerged in 2000 cm3
of liquid nitrogen in a thick glass vessel. The arc discharge was initiated in the liquid nitrogen by
touching a 99.99% purity graphite anode (3 mm in diameter) with a graphite cathode (12 mm tip
diameter) of similar purity. The arc voltage and current were typically 34 V and 50 A,
respectively.. The gap between the electrodes was manually controlled by a screw unit so that they
always remain at a separation of approximately 1 mm by continuously translating the anode during
the experiment in order to maintain a stable discharge. The arc discharge in liquid nitrogen is
turbulent, and dense black smoke is observed near the discharge region. The evaporation rate of
liquid nitrogen was about 200 cm3 min
−1 and the anode consumption rate was about 375.3
mgmin−1
. In contrast to the discharge in water, the products from the arc discharge in liquid
nitrogen settle exclusively at the bottom of the reaction container.
2.2 Functionalization of SWCNHs with hydroxyl and carboxylic group
10 g of succinic anhydride (100 mmol) fine powder were added to 20 ml of an ice cold
solution of 8 % hydrogen peroxide (52 mmol). The mixture was stirred for about 1 hour at 0 °C.
The white gel-like solution was filtered through a 5 μm polycarbonate filter. The resulting succinic
acid acyl peroxide was washed with cold distilled water, and then dried under vacuum at room
temperature for about 24 hours. Approximately 6 g of succinic acid acyl peroxide was obtained.
Again 5 mg of this sample was mixed with 100 equiv. (mass ratio) of succinic acid acyl peroxide.
The resulting mixture was put in a stainless steel beaker and shaken vigorously for 1.5 hours
@1725 rpm which leads to an ultrafine powder. This ultrafine powder was washed with a large
amount of acetone and centrifuged to remove any organic residues not associated with the
SWCNHs. The supernatant was carefully decanted. This process was repeated three times and the
solid was washed with pure water once. In this way hydroxyl and carboxylic group are attached
with SWCNHs.
3. Characterization
Crystallography of pristine and functionalized SWCNHs were characterized by powder X-
ray diffraction (XRD) (Rigaku Japan, Miniflex 600), Topography of these nanostructures were
characterized by field emission scanning electron microscope (FESEM) (SUPRA 55 OX-FORD
INSTRUMENTS) & Atomic force microscope (AFM) (Park XE 70), Morphology of synthesized
and functionalized SWCNHs was characterized by high resolution transmission electron

1715
microscope (HRTEM) (Hitachi (H-7500)), Fourier Transform Infrared Spectroscopy (FTIR)
(Perkin Elmer - Spectrum RX-IFTIR), UV-Vis. absorption spectroscopy (Hitachi-330
spectrophotometer), Micro-Raman spectroscopy was performed on "Renishaw in Via Raman
microscope". using Ar+ laser as an excitation source with 514 nm line, X-ray Photoelectron
spectroscopy (XPS) (kratos axis ultra DLD) was performed for detailed quantative and qualitative
analysis. Optical characterization were performed using steady state Photoluminescence (PL)
spectroscopy (Perkin Elmer LS 55 Fluorescence spectrophotometer), and time resolved
fluorescence spectroscopy (Edinburgh FL 920 Fluorescence life time spectrometer) and energy
dispersive X ray spectroscopy (EDS) Thermogravometric analysis [TGA-DSC-DTA] (Perkin
Elmer STA 6000), surface area and pore size determination using BET-BJH technique (Nova
2000e Quantachrome) was performed
Results and Discussion
The phase identification from the recorded XRD patterns in fig. 1 has been carried out
with the help of standard JCPDS data base. Comparison of XRD patterns with JCPDS No. 23-64,
P63/mmc have confirmed that diffraction peaks correspond to the hexagonal wurtzite crystal
structure having lattice parameters a =5.657 Å c =6.721 Å.
Fig. 1. XRD Pattern of Pristine (Red) and water soluble (Blue) SWCNHs
Average crystallite size can be calculated from the line broadening of the diffractogram
peaks using Scherrer formula
(1)
Where D is the average crystallite size, λ is incident X-ray wavelength, β is the full width half
maximum (FWHM) of diffraction peak expressed in radians and θ is peak position in X-ray
diffractogram.. Average crystalline size for synthesized SWCNHs is 2.371 nm where as for water
soluble SWCNHs it is 1.072nm.
Figures 2 and 3 shows FESEM micrograph recorded for pristine and functionalized
SWCNHs. FESEM micrograph in fig. 2 shows agglomerated (dahia) SWCNHs where as fig. 3
FESEM micrograph shows topography of water soluble SWCNHs. Morphology of synthesized
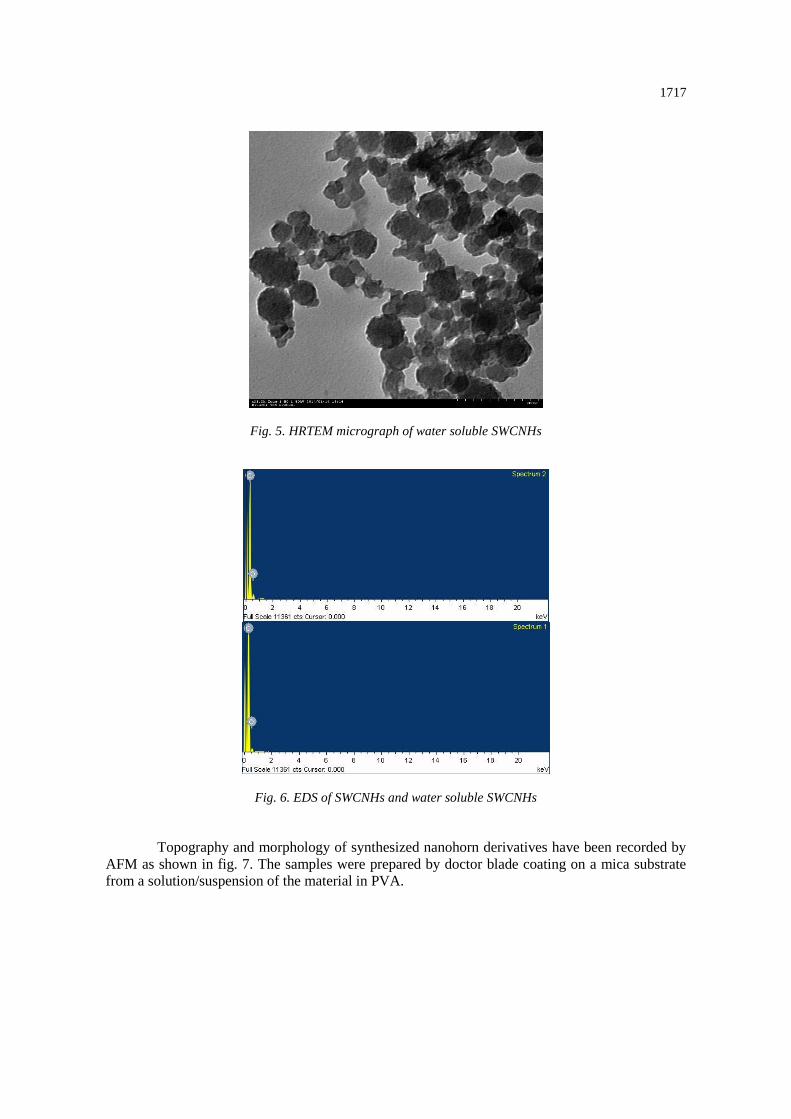
SWCNHs derivatives have been investigated by HRTEM. HRTEM micrograph of all the
compounds revealed the presence of nanohorns; in all cases the pictures consisted of small round
shaped aggregates with diameters of about 80-100 nm in which it was possible to distinguish small
conical caps pointing out and the same is visible from micrograph fig. 4. Almost no difference can
be noticed between the pristine material and the water soluble nanohorns and the same is revealed

1716
from micrograph shown in fig. 5. Recorded energy dispersive spectra in fig 6 confirm that the
carbon content in synthesized SWCNHs is 89.19 wt % along with 10.81 wt % oxygen where as in
case of water soluble SWCNHs carbon content is 83.95 wt% along with 16.05 wt% oxygen
Fig. 2 FESEM micrograph of SWCNHs
Fig. 3. FESEM micrograph of water soluble SWCNHs
Fig. 4. HRTEM micrograph of SWCNHs
1717
Fig. 5. HRTEM micrograph of water soluble SWCNHs
Fig. 6. EDS of SWCNHs and water soluble SWCNHs
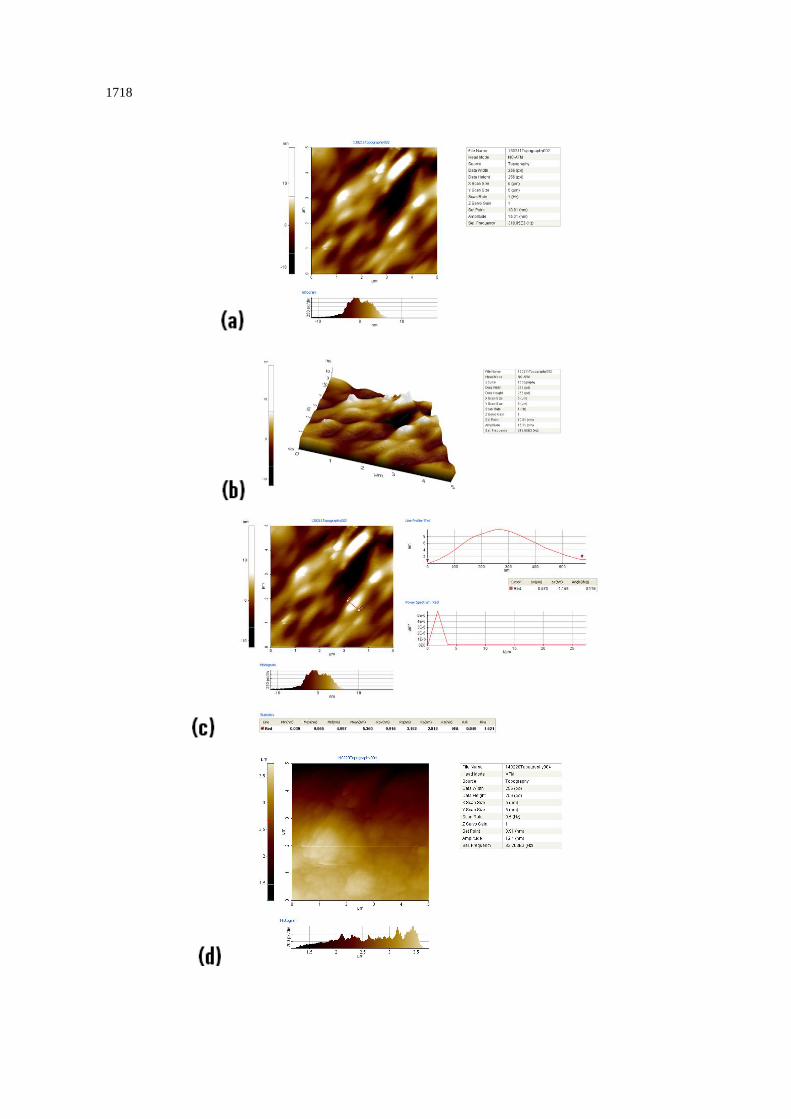
Topography and morphology of synthesized nanohorn derivatives have been recorded by
AFM as shown in fig. 7. The samples were prepared by doctor blade coating on a mica substrate
from a solution/suspension of the material in PVA.
1718

1719
Fig 7. (a-c) AFM of SWCNHs (d-f) water soluble SWCNHs
The images revealed in all cases the coexistence of individual SWCNHs (round shapes of
about 60-100 nm diameter) as well as aggregates several hundred nanometers high. Two
representative images of SWCNHs fig 7 (a-c) and water soluble SWCNHs fig 7 (d-f) are shown;
the use of AFM allow us to see the fine structure of the nanohorns, in fig. 7 (a and b) and only
some asperities on the surface have been observed in fig. 7 (d and e).AFM micrograph fig 7(c) and
7 (f) also reveals that surface area after functionalization increases. AFM micrograph reveal that
morphological parameters calculated from the AFM micrograph are in proximity with HRTEM
recorded.
The Raman spectra of nanohorns in fig. 8 exhibits broad peak at 1593 cm-1
(“G-band”),
assigned to tangential vibrations in the sp2-bonded carbon network and another broad peak at 1341
cm-1
(‘‘D-band’’), attributed to the disruption of the basal plane lattice due to the conical
terminated tips of the nanohorns as well as to sp3 single bonding carbon atoms existing within
SWCNHs aggregates.
0 500 1000 1500 2000 2500 3000
0
200
400
600
800
1000
1200
1400
1600
exc=514.5 nm
Inte
ns
ity
(a
.u.)
Raman Shift (cm-1
)
WS-SWCNHs
SWCNHs
1341
1593
2620
2895
Fig. 8. Raman spectra of SWCNHs and water soluble SWCNHs

1720
The increased intensity around the D-band of water soluble SWCNHs compared with
pristine SWCNHs indicates the generation of sp3-hybridized carbon atoms in the SWCNHs
framework.[23-24] The recorded spectra show the G’ band (overtone of the D band) at 2620 cm-1
and a characteristic band at 2895 cm-1.
UV-Vis absorption spectra of water soluble SWCNHs exhibit sharp maxima at 220nm and
then decreases monotonically and similar to pristine SWCNHs and the same are revealed from fig.
9.
200 400 600 800 1000 1200
0.05
0.10
0.15
0.20
0.25
0.30
0.35
0.40
0.45
0.50
0.55
0.60 SWCNHs
WS-SWCNHsA
bs
orb
an
ce
(a
.u.)
(nm)
Fig. 9. UV-Vis absorption spectra of SWCNHs and water soluble SWCNHs
FTIR spectra of SWCNHs and water soluble SWCNHs is shown in fig. 10. Peaks at 1061,
1114, 1164cm-1
represent C-O stretching. All spectra show characteristic C-C stretching at 1633
cm-1
. Peaks at ~2914 cm-1
can be related to the symmetric and asymmetric vibrations of C-H
group. The peaks at around 3300-3500 cm-1
are ascribed to the O-H vibration.
4000 3600 3200 2800 2400 2000 1600 1200 800 400
20
40
60
80
100
120
140
160
180
Tra
ns
mit
tan
ce
(% T
)
wavenumber(cm-1
)
WS-SWCNHs
SWCNHs
2914
1633
609
1164
1114
1061
Fig. 10 .FTIR spectra of SWCNHs and water soluble SWCNHs
TGA has been widely used to evaluate the purity of the SWCNHs and this analysis has
been performed in air flow. Material combustion below 4000C is basically due to amorphous
carbon From fig. 11 in the derivative curves different phases are well observable: an amorphous
phase peak at 400°C, followed by peaks related to SWCNHs, and almost two peaks ascribable to
residual graphitic structures for gaint graphitic balls and graphene. Results clearly indicate no
metal impurity is present. Purity of water soluble carbon nanohorns have been evaluated in fig.
12. The weight loss up to 80oC is due to water molecules associated with the surface of SWCNHs
followed by removal of hydroxyl and carboxylic groups and then followed by peaks related to
SWCNHs.

1721
0 200 400 600 800 1000
-500
-400
-300
-200
-100
0
100
-100
-90
-80
-70
-60
-50
20
40
60
80
100
120
DS
C(m
W/m
g)
TEMP(oC)
DT
A(S
en
sit
./(u
V/m
W))
We
igh
t% (
%)
Fig. 11. TGA-DSC-DTA analysis of SWCNHs
0 200 400 600 800 1000
0
50
100
150
200
250
300
0
2
4
6
8
88
90
92
94
96
98
100
DS
C(m
W/m
g)
TEMP(oC)
We
igh
t% (
%)
DT
A(S
en
sit
./(u
V/m
W))
Fig. 12. TGA-DSC-DTA analysis of water soluble SWCNHs
From fig 13 (a) XPS survey results reveal that the O/C atomic ratio of water soluble-
SWCNHs (13.5:86.5) dramatically increases relative to that of the pristine SWCNHs (3.3:96.7)
and no other impurities were detected. Figs. 13 (b and c) show the high resolution C1s spectra of
both SWCNHs and water soluble SWCNHs revealing two types of major carbon peaks
corresponding to carbon atoms with different functional groups.

1722
0 200 400 600 800 1000 1200
0
20000
40000
60000
80000
100000
120000
140000
160000
180000
200000
220000
Inte
ns
ity
(a
.u.)
Binding Energy(eV)
water soluble SWCNHs
SWCNHsC1s
O1s
OKLL
(a)
274 276 278 280 282 284 286 288 290 292 294 296 298 300 302
0
2000
4000
6000
8000
10000
Inte
ns
ity
(a
.u.)
Binding Energy (eV)
Water soluble SWCNHs
SWCNHs
(b)
524 526 528 530 532 534 536 538 540 542 544
500
1000
1500
2000
2500
3000
3500
4000
4500
Inte
ns
ity
(a
.u.)
Binding Energy (eV)
water soluble SWCNHs
SWCNHs
(c)
Fig. 13 (a) XPS survey (b) C1s and (c) O1s spectra of SWCNHs and water soluble SWCNHs
Deconvoluted C1s spectrum of SWCNH and water soluble SWCNH shows the main peak
at 284.1ev which is attributed to the Sp2 carbon and the peaks observed for C1s of C-C Sp
3at
285.2ev, C1s of C=O at 288.1ev. All these peaks are suppressed when hydroxyl and carboxylic
groups are attached indicating water soluble SWCNH. Deconvoluted O1s XPS spectrum of water
soluble SWCNH which is wide and asymmetric, demonstrating that there was more than one
chemical state. The presence of lattice oxygen is confirmed from the most intense peak at
530.6ev.Other peaks at 534.2eV and 532.6eV are related to surface hydroxyl groups O–H and
single C–O bonds respectively and all these peaks are in stretched state as compared to SWCNH.
The additional peak at 533.2eV in suppressed condition appeared in case of water soluble SWCNH
confirming surface modification indicates both hydroxyl and carboxylic groups are attached.
Fig 14 reveals the texture property of pristine and water soluble SWCNHs. The surface
area and total pore volume as measured by the BET method (calculated by N2 gas adsorption on
the surface of the materials) of water soluble SWCNHs (1014.707 m2/g) is much higher than that
of pristine SWCNHs (125.616 m2/g).

1723
0.0 0.2 0.4 0.6 0.8 1.0
0.0
0.2
0.4
0.6
0.8
1.0
1.2
1.4
Vo
lum
e o
f a
ds
orb
ed
N2(c
ub
ic c
m p
er
g)
P/P0
(a)
0.0 0.2 0.4 0.6 0.8 1.0
10
15
20
25
30
35
40
45
Vo
lum
e o
f a
ds
orb
ed
N2(c
ub
ic c
m p
er
g)
P/P0
(b)
Fig. 14 Structural analyses of (a) SWCNHs and (b) water soluble SWCNHs
Total pore volume is 2.543e-01 cc/g for pristine SWCNHs with pores smaller than 1299.0
Å (Radius) at P/Po = 0.99257 where as in case of water soluble SWCNHs the total pore volume is
1.061e+00 cc/g with pores smaller than 756.5 Å (Radius) at P/Po = 0.98715. As for as average
pore size is concerned it is higher for SWCNHs as compared to water soluble SWCNHs. Analyzed
pore radius is 2.09068e+01 Å for water soluble SWCNHs and 9.15136e+02 Å for pristine
SWCNHs. Since the water soluble SWCNHs have largely maintained its structure, the surface area
of water soluble SWCNHs could be much higher than that of pristine SWCNHs.
A recorded room temperature PL spectrum for SWCNHs in fig 15 is tunable with
excitation wavelengths.
300 400 500 600 700 800
0
1
2
3
4
5
emission
Inte
ns
ity
(a
.u.)
emission
=524.3 nm
exc
=280 nm
Fig. 15. PL spectra of SWCNHs
When the samples are exposed to high intensity radiations, the electrons are raised from
the valence band to the excited states, and then these excited electrons return back to valence band
with the emission of characteristic luminescent radiations. The intensity ‘I’ of the luminescent
radiation at any time, t, is given by following equation
(2)
where I0 is the intensity of radiation at cut-off position and the constant p=1/τ is the transition
probability of the corresponding radiative transition. Here, τ is excited state lifetime, i.e. the time
spent by electron in the trapping state before recombination. From the slope of the ln (I) vs. t, one

1724
can easily calculate transition probability. Fig 16 show time resolved decay curves recorded for (a)
SWCNHs and (b) water soluble SWCNHs.(WS-SWCNHs)
10000 20000 30000 40000 50000
0
1000
2000
3000
4000
5000
Co
un
ts
time (ns)
(a)
4 6 8 10 12 14
0
250
500
750
1000
1250
1500
Co
un
ts
time (ns)
(b)
Fig. 16 (a) Time resolved decay curve for SWCNHs and (b) water soluble SWCNHs at room temperature
The Ln(I) vs. t graphs were plotted for all recorded decay curves. These Ln (I) vs. t graphs
did not show linear relationship because of the superposition of a number of exponential decays.
These graphs were peeled-off into maximum of three components using peeling-off method of
Singh et.al. [25]. The slope of each component gives the value of transition probability (p) and
hence the excited state lifetime ‘τ’. Trap-depth values ‘E’ had been calculated using Boltzmann
equation. All these values are listed in Tab 1
(3)
where p is transition probability; S, escape frequency factor 1910~ s ; k, Boltzmann’s constant
and T, the absolute temperature.. Distribution of traps within the phosphor bandgap can be
explained with the help of decay constant values. The decay constant value ‘b’ has been calculated
using the equation
(4)
Such types of decay curves due to superposition of number of exponential decays are
popularly known as hyperbolic decay curves or multi-exponential decay curves. If the value of, b,
is unity, one can say that the distribution of trapping states is uniform, otherwise, it is said to be
non-uniform. The Ln(I) vs. Ln(t) graph was plotted corresponding to emission wavelength; 525
nm for SWCNHs and WS-SWCNHs and decay constant ‘b’ value has been calculated from the
slope of these graphs according to Equation. (4).For SWCNHs and WS-SWCNHs this value
comes out to be more than one which means distribution of traps within the sample is uniform. In
terms of lifetime values so calculated, one can calculate the oscillator strengths and dipole
moments of the radiative transitions using well known equations. Electromagnetic radiation
interacts with an electronic centre through the electric or magnetic field of the radiation. The
oscillator strength ‘f’ of a transition is a dimensionless quantity that is useful for comparing
different radiative transitions. Classically, oscillator strength is used as a statistical weight
indicating the relative number of oscillators bound at each resonant frequency. In quantum
mechanics, oscillator strength is used as a measure of relative strength of the electronic transitions
within atomic and molecular systems. Oscillator strength is particularly useful as a technique for
comparing transition “strengths” between different types of quantum mechanical systems. The life
time values may also be used to calculate Einstein’s spontaneous (A), stimulated emission (B)
coefficients and dipole moment µ of the radiative transtion. Moreover the oscillator strength along
with absorption coefficients is often used as a method for calculating the concentration of

1725
impurities in a host. The oscillator strength of electric dipole allowed transitions [26-30] is given
by the following relation
.94 2
1.5 10 .2
22
pfed
n n
(5)
where λ is the emission wavelength, p is the transition probability of the corresponding radiative
transition and ‘n’ is the index of refraction of the material which is 1.586 in case of SWCNHs. The
spontaneous radiative life-time is seen to be related in a simple way to the integrated cross section
of the transition [26-30] by the following relation
(6)
The corresponding dipole-moment [26-30] is given by the relation
(7)
Dipole-moment values of SWCNHs were calculated by using equation (7) in terms of emission
wavelength, index of refraction and the excited state life-time values.
Einstein’s stimulated coefficient is given by following relation
(8)
where ‘μ’ is the dipole moment of transitions from the shallow trapping states of SWCNHs‘ε0’ is
the absolute permittivity of free space, ‘n’ is the index of refraction and ‘h’is Planck’s constant
Table 1. Transition Probability, Excited state life time and trap depth and other optical parameters of
pristine and water soluble SWCNHs
p1 (ns-1
) p2 (ns-1
) p3(ns-1
)
SWCNHs 7.70269X10⁻⁴
6.56664X10⁻⁴
8.72137X10⁻⁵
WS-
SWCNHs 2.54076 0.65586 0.25321
τ1(ns) τ2(ns) τ3(ns)
SWCNHs 1298.24 1522.84 11466.08
WS-
SWCNHs 0.3935 1.5247 3.9492
E1(eV) E2(eV) E3(eV)
SWCNHs 0.3113 0.3131 0.3356
WS-
SWCNHs 0.2209 0.2360 0.2466
Ic1(10-10
m2s
1)
Ic2(10-10
m2s
1)
Ic3(10-10
m2s
1)
SWCNHs 84.47 72.014 9.565
WS-
SWCNHs 278639.31 71926.65 27768.95
2 22
2 23
B
n ho
.
13 23
316
op
h
n
pIcs .8
2

1726
µ1 (X10-31
Cm)
µ2\ (X10-31
Cm)
µ3 (X10-31
Cm)
SWCNHs 157.79 145.78 53.09
WS-
SWCNHs 9045.35 4595.67 2855.51
f1(X10-5
) f2(X10-5
) f3(X10-5
)
SWCNHs 88.652 75.577 10.0376
WS-
SWCNHs 292422.18 75484.50 29142.54
B1(X1018
m3(rad/s)/Js)
B2(X1018
m3(rad/s)/Js)
B3(X1018
m3(rad/s)/Js)
SWCNHs 167.91 143.33 19.009
WS-
SWCNHs 547663.58 141371.14 54579.61
From the table 1 it is evident that average excited state life time for SWCNHs is 4762.38
ns where as for WS-SWCNHs the same is 1.9558 ns.
4. Conclusions
In summary, SWCNHs have been synthesized by submerged arc method and then
functionalized with carboxylic and hydroxyl groups to make them water soluble which constitutes
an efficient way for the chemical modification and solubilization of these materials. The method is
complementary to other existing functionalization routes. Because the nanohorns are not
deaggregated during the reaction and the round shaped aggregates remain intact in solution, the
water dispersible. SWCNHs may be used in biotechnological applications, such as drug and gene
delivery systems, as well as loading of the SWCNHs side-walls with desirable functional groups
for specific tissue-targeting. Functionalization in SWCNHs has been confirmed by FTIR, Raman
spectroscopy, Thermogravometric analysis and X ray photoelectron spectroscopy. Optical
properties of SWCNHs has been analysed through energy resolved and time resolved PL. Further
lifetime values calculated from decay curve have been used for the calculation of other important
optical parameters of optoelectronic industrial interest like trap-depths, transition probabilities,
oscillator strengths, Einstein’s coefficients, integrated cross-sections, etc., which will be beneficial
for optical calibration curves and detailed phosphor characterization for twenty-first century
industrial applications. In brief this method of synthesis and functionalization is best method
because high purity SWCNHs have been obtained through this method and the same has been
confirmed through energy dispersive X ray spectroscopy. Structural property evaluated using
BET-BJH technique reveals that functionalized SWCNHs have higher surface area and larger pore
size as compared to pristine SWCNHs
Acknowledgements
Authors are thankful to Mr. Narender Budhiraja, Assistant Professor, G.H.G. Khalsa
College, Gurusar Sadhar, Ludhiana for providing necessary facilities to bring this work in present
form.
References
[1] S. Iijima, M Yudasaka, R Yamada, S Bandow, K Suenaga, F Kokai, K Takahashi Chem.
Phys. Lett. 309(3), 165 (1999).
[2] S. Bandow, F Kokai, K Takahashi, M Yudasaka, LC Qin and S Iijima Chem. Phys.
Lett. 321(5–6), 514 (2000)

1727
[3] P J F Harris, S. C. Tsang, J. B. Claridge and M. L. H. Green J Chem Soc, Faraday Trans
90, 2799 (1994)
[4] H. Kroto, J. R. Heath, S. C. O'Brien, R. F. Curl, R. E. Smalley Nature 318, 162 (1995)
[5] S. Iijima, T. Ichihashi Nature 363, 603 (1993)
[6] M. Yodasaka, S. Iijima, V.H. Crespi Topics Appl. Physics. 111, 605 (2008)
[7] G. Pagona, G. Mountrichas, G. Rotas et al Int. J. Nanotechnology. 6, 176 (2009).
[8] SY Zhu and GB Xu Nanoscale 2(12), 2538 (2010)
[9] D Kasuya, M. Yudasaka, K. Takahashi, F Kokai and S Iijima J. Phys. Chem. B
106(19), 4947 (2002)
[10] K Ajima, M Yudasaka,T. Murakami ,A Maigné ,K Shiba and S Iijima Mol. Pharm
2(6), 475 (2005)
[11] K. Murata, A. Hashimoto, M. Yudasaka, D Kasuya and S Iijima. Adv.Mater.
16(17), 1520 (2004).
[12] T. Yoshitakea, Y. Shimakawaa, S. Kuroshimaa, H. Kimuraa ,K Takahashic, F Kokaic,
M Yudasakab, S Iijima Physica B 323, 124 (2002)
[13] T Yamaguchi;S Bandow, S Iijima Chem. Phys. Lett. 389, 181 (2004)
[14] G Pagona, A S D Sandanayaka ,Y Araki, J Fan, N Tagmatarchis, M Yuda, S Iijima,
O. Ito, J. Phys. Chem. B 110 (42), 20729 (2006)
[15] G Pagona, ASD Sandanayaka , A Maigne, J Fan, G C Papavassiliou, I D Petsalakis ,
B R Steele, M Yudasaka, S Iijima, N Tagmatarchis and O Ito Chem. Eur. J.
13(27), 7600 (2007) [16] M Zhang, M Yudasaka ,K Ajima, J Miyawaki and S Iijima ACS Nano 1(4), 265 (2007)
[17] C Cioffi, S Campidelli ,C Sooambar, M Marcaccio, G Marcolongo, M Meneghetti,
D Paolucci, F Paolucci, C Ehli, G M A Rahman, V Sgobba, D M Guldi and M Prato
J. Am. Chem. Soc. 129(13), 3938 (2007)
[18] ASD Sandanayaka, O Ito, MF Zhang, K Ajima, S Iijima, M Yudasaka, T Murakami,
K.Tsuchida Adv. Mater. 21(43), 4366 (2009)
[19] M Vizuete, M J Gomez-Escalonilla ,JLG Fierro, ASD Sandanayaka, T Hasobe, M Yudasaka,
S Iijima, O Ito and F Langa Chem. Eur. J. 16(35), 10752 (2010)
[20] T Itoh, K Urita , E Bekyarova , M Arai, M Yudasaka, S Iijima, T Ohba, K Kaneko,
H Kanoh J. Col. Interface Sci. 322, 209 (2008)
[21] G Mountrichas, T Ichihashi ,S Pispas, M Yudasaka, S Iijima and N Tagmatarchis J. Phys.
Chem. C 113(14), 5444 (2009)
[22] W Huang, J Zhang, H C Dorn, D Geohegan and C Zhang Bioconjugate Chem.
22(6), 1012 (2011)
[23] S Utsumi, H Honda, Y Hattori, H Kanoh, K Takahashi, H Sakai, M Abe, M Yudasaka,
S Iijima, K J Kaneko, Phys.Chem. C 111, 5572, (2007)
[24] E Miyako, H Nagata, K Hirano, Y Makita, K I Nakayama and T Hirotsu, Nanotechnology
18, 475103 (1-7), (2007)
[25] K Singh, N K Verma, H S Bhatti Physica B 404, 300 (2009)
[26] X L Wu, G G Siu, C L Fu, C H Ong, Appl.phys. Lett., 78, 2285 (2001)
[27] D Kumar, K Singh, V Verma, H S Bhatti Adv. Sci. Eng. Med. 6 (2014)
http://dx.doi.org/10.1166/asem.2014.1625
[28] D Kumar, K Singh, V Verma, H S Bhatti J. Bionanosci. 8 (2014)
http://dx.doi.org/10.1166/jbns.2014.1236
[29] D Kumar, K Singh, V Verma, H S Bhatti J. Nanoelectron. Optoelectron 9 458 (2014)
[30] D Kumar, Kavita, K Singh, V Verma, H S Bhatti Appl Nanosci (2014)
http://link.springer.com/article/10.1007/s13204-014-0386-2