Embed Size (px)
Citation preview
Journal of Electroanalytical Chemistry 693 (2013) 114–121
Contents lists available at SciVerse ScienceDirect
Journal of Electroanalytical Chemistry
journal homepage: www.elsevier .com/locate / je lechem
Investigation of the cathodic process influence on the electrochemical noisesignals arising from pitting corrosion of Al alloys using wavelet analysis
M. Shahidi a,⇑, R. Farrehi Moghaddam b, M.R. Gholamhosseinzadeh a, S.M.A. Hosseini b
a Department of Chemistry, Kerman Branch, Islamic Azad University, Kerman, Iranb Department of Chemistry, Shahid Bahonar University of Kerman, Kerman 76175, Iran
a r t i c l e i n f o a b s t r a c t
Article history:Received 19 September 2012Received in revised form 8 January 2013Accepted 17 January 2013Available online 9 February 2013
Keywords:Electrochemical noiseWavelet analysisCathodic processStandard deviation of partial signal (SDPS)Asymmetrical cell
1572-6657/$ - see front matter � 2013 Elsevier B.V. Ahttp://dx.doi.org/10.1016/j.jelechem.2013.01.020
⇑ Corresponding author. Tel.: +98 9133404366.E-mail address: [email protected] (M. Shah
The standard deviation of partial signal (SDPS) plot is obtained from wavelet analysis of electrochemicalnoise (EN) data. This paper employs the SDPS plots of EN current signals arising from pitting corrosion onthe symmetrical and asymmetrical cells of AA6061 and AA2024 alloys in 3.5% NaCl solution with differ-ent O2 concentrations (3–25 ppm) to obtain a better understanding of the influence of the cathodic reac-tion on the EN current signals. EIS measurements reveal that an increase of O2 concentration from 3 to5 ppm leads to the stronger passive oxide layer on the Al alloys. The time records and corresponding SDPSplots arising from symmetrical cells show an increase in the amplitude and the time width of EN currenttransients with increasing O2 concentration from 3 to 5 ppm. According to an earlier modeling of EN tran-sients this can be attributed to the enhancement of current noise detection. The EIS shows that the thick-ness of the passive oxide layer decreases with increasing O2 concentration from 5 to 25 ppm. Thus, anincrease in the time width of EN current transients with increasing O2 concentration from 5 to 25 ppmcan be assigned to an increase in the corrosion activity. The optimal O2 concentration for EN current mea-surements is 5 ppm (i.e. naturally aerated solutions).
� 2013 Elsevier B.V. All rights reserved.
1. Introduction
Recently electrochemical noise (EN) has been researched widelyfor the detection and evaluation of localized and general corrosionbehavior [1–8]. For EN technique, one of its principal advantages isthat it can be used without disturbing of the system under investi-gation. In addition, it is more sensitive to localized corrosion pro-cesses than some traditional techniques, which produce littleinformation.
EN is defined as the fluctuations of potential or current originat-ing from the corrosion events. As the standard method to measureEN a three electrode arrangement is used. Two nominally identicalworking electrodes (WEs), known as symmetrical cell, are con-nected via a zero-resistance ammeter (ZRA) monitoring the cou-pling current between the electrodes. The fluctuations in thepotential of the coupled electrode assembly are measured using athird electrode, either made of the same material or a referenceelectrode [3,4].
It was found recently that the asymmetrical cells with a largedifference in size between two WEs, which are otherwise identical,can enhance the current noise detection [8]. The asymmetrical
ll rights reserved.
idi).
cells can preserve the real time width and increase the amplitudeof EN current transients.
In spite of the advantages of the EN method, its analysis is oftendifficult because of various factors influencing the EN signal [1,3].One of these factors is the cathodic process [6,7]. Every electro-chemical corrosion process involves at least two partial reactions,anodic and cathodic, and either can exert a decisive influence onthe kinetics and mechanism of the overall process as well as onthe EN signals obtained from this process [6]. The cathodic reactioncan influence the corrosion process in the oxygen bearing solu-tions, because the electron consumption process is usually therate-determining step for the corrosion process in such solutions.Since the EN signal is generated from the release and the consump-tion of the free electrons, the cathodic process belongs to the mostimportant factors affecting it. The role of the cathodic process onthe EN signals has not been sufficiently investigated to date [7].
The oxygen reduction reaction (ORR) is one of the most relevantcathodic processes in different fields of the electrochemistry.Regarding to corrosion, the electrochemical reduction of oxygendissolved in neutral aqueous media is probably the most importantcathodic reaction. On the other hand, passivation as a phenomenonof technical relevance to the practical use of many metals andalloys requires a cathodic process, i.e., ORR to proceed so as toguarantee that metals such as aluminum are able to reach thepassive state and, just as importantly, that they will be able to
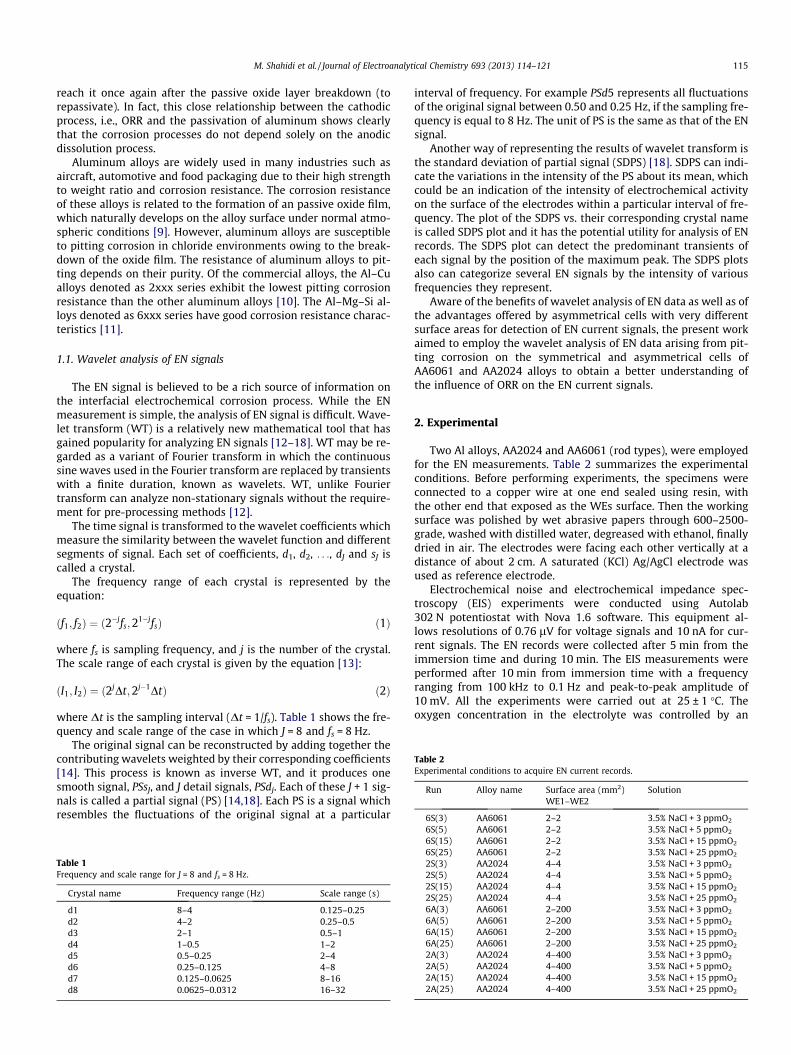
Table 2Experimental conditions to acquire EN current records.
Run Alloy name Surface area (mm2)WE1–WE2
Solution
6S(3) AA6061 2–2 3.5% NaCl + 3 ppmO2
M. Shahidi et al. / Journal of Electroanalytical Chemistry 693 (2013) 114–121 115
reach it once again after the passive oxide layer breakdown (torepassivate). In fact, this close relationship between the cathodicprocess, i.e., ORR and the passivation of aluminum shows clearlythat the corrosion processes do not depend solely on the anodicdissolution process.
Aluminum alloys are widely used in many industries such asaircraft, automotive and food packaging due to their high strengthto weight ratio and corrosion resistance. The corrosion resistanceof these alloys is related to the formation of an passive oxide film,which naturally develops on the alloy surface under normal atmo-spheric conditions [9]. However, aluminum alloys are susceptibleto pitting corrosion in chloride environments owing to the break-down of the oxide film. The resistance of aluminum alloys to pit-ting depends on their purity. Of the commercial alloys, the Al–Cualloys denoted as 2xxx series exhibit the lowest pitting corrosionresistance than the other aluminum alloys [10]. The Al–Mg–Si al-loys denoted as 6xxx series have good corrosion resistance charac-teristics [11].
1.1. Wavelet analysis of EN signals
The EN signal is believed to be a rich source of information onthe interfacial electrochemical corrosion process. While the ENmeasurement is simple, the analysis of EN signal is difficult. Wave-let transform (WT) is a relatively new mathematical tool that hasgained popularity for analyzing EN signals [12–18]. WT may be re-garded as a variant of Fourier transform in which the continuoussine waves used in the Fourier transform are replaced by transientswith a finite duration, known as wavelets. WT, unlike Fouriertransform can analyze non-stationary signals without the require-ment for pre-processing methods [12].
The time signal is transformed to the wavelet coefficients whichmeasure the similarity between the wavelet function and differentsegments of signal. Each set of coefficients, d1, d2, . . ., dJ and sJ iscalled a crystal.
The frequency range of each crystal is represented by theequation:
ðf1; f2Þ ¼ ð2�jfs;21�jfsÞ ð1Þ
where fs is sampling frequency, and j is the number of the crystal.The scale range of each crystal is given by the equation [13]:
ðI1; I2Þ ¼ ð2jDt;2j�1DtÞ ð2Þ
where Dt is the sampling interval (Dt = 1/fs). Table 1 shows the fre-quency and scale range of the case in which J = 8 and fs = 8 Hz.
The original signal can be reconstructed by adding together thecontributing wavelets weighted by their corresponding coefficients[14]. This process is known as inverse WT, and it produces onesmooth signal, PSsJ, and J detail signals, PSdj. Each of these J + 1 sig-nals is called a partial signal (PS) [14,18]. Each PS is a signal whichresembles the fluctuations of the original signal at a particular
Table 1Frequency and scale range for J = 8 and fs = 8 Hz.
Crystal name Frequency range (Hz) Scale range (s)
d1 8–4 0.125–0.25d2 4–2 0.25–0.5d3 2–1 0.5–1d4 1–0.5 1–2d5 0.5–0.25 2–4d6 0.25–0.125 4–8d7 0.125–0.0625 8–16d8 0.0625–0.0312 16–32
interval of frequency. For example PSd5 represents all fluctuationsof the original signal between 0.50 and 0.25 Hz, if the sampling fre-quency is equal to 8 Hz. The unit of PS is the same as that of the ENsignal.
Another way of representing the results of wavelet transform isthe standard deviation of partial signal (SDPS) [18]. SDPS can indi-cate the variations in the intensity of the PS about its mean, whichcould be an indication of the intensity of electrochemical activityon the surface of the electrodes within a particular interval of fre-quency. The plot of the SDPS vs. their corresponding crystal nameis called SDPS plot and it has the potential utility for analysis of ENrecords. The SDPS plot can detect the predominant transients ofeach signal by the position of the maximum peak. The SDPS plotsalso can categorize several EN signals by the intensity of variousfrequencies they represent.
Aware of the benefits of wavelet analysis of EN data as well as ofthe advantages offered by asymmetrical cells with very differentsurface areas for detection of EN current signals, the present workaimed to employ the wavelet analysis of EN data arising from pit-ting corrosion on the symmetrical and asymmetrical cells ofAA6061 and AA2024 alloys to obtain a better understanding ofthe influence of ORR on the EN current signals.
2. Experimental
Two Al alloys, AA2024 and AA6061 (rod types), were employedfor the EN measurements. Table 2 summarizes the experimentalconditions. Before performing experiments, the specimens wereconnected to a copper wire at one end sealed using resin, withthe other end that exposed as the WEs surface. Then the workingsurface was polished by wet abrasive papers through 600–2500-grade, washed with distilled water, degreased with ethanol, finallydried in air. The electrodes were facing each other vertically at adistance of about 2 cm. A saturated (KCl) Ag/AgCl electrode wasused as reference electrode.
Electrochemical noise and electrochemical impedance spec-troscopy (EIS) experiments were conducted using Autolab302 N potentiostat with Nova 1.6 software. This equipment al-lows resolutions of 0.76 lV for voltage signals and 10 nA for cur-rent signals. The EN records were collected after 5 min from theimmersion time and during 10 min. The EIS measurements wereperformed after 10 min from immersion time with a frequencyranging from 100 kHz to 0.1 Hz and peak-to-peak amplitude of10 mV. All the experiments were carried out at 25 ± 1 �C. Theoxygen concentration in the electrolyte was controlled by an
6S(5) AA6061 2–2 3.5% NaCl + 5 ppmO2
6S(15) AA6061 2–2 3.5% NaCl + 15 ppmO2
6S(25) AA6061 2–2 3.5% NaCl + 25 ppmO2
2S(3) AA2024 4–4 3.5% NaCl + 3 ppmO2
2S(5) AA2024 4–4 3.5% NaCl + 5 ppmO2
2S(15) AA2024 4–4 3.5% NaCl + 15 ppmO2
2S(25) AA2024 4–4 3.5% NaCl + 25 ppmO2
6A(3) AA6061 2–200 3.5% NaCl + 3 ppmO2
6A(5) AA6061 2–200 3.5% NaCl + 5 ppmO2
6A(15) AA6061 2–200 3.5% NaCl + 15 ppmO2
6A(25) AA6061 2–200 3.5% NaCl + 25 ppmO2
2A(3) AA2024 4–400 3.5% NaCl + 3 ppmO2
2A(5) AA2024 4–400 3.5% NaCl + 5 ppmO2
2A(15) AA2024 4–400 3.5% NaCl + 15 ppmO2
2A(25) AA2024 4–400 3.5% NaCl + 25 ppmO2
116 M. Shahidi et al. / Journal of Electroanalytical Chemistry 693 (2013) 114–121
Oxi 340 oximeter (WTW). In order to avoid the effect of hydro-dynamic noise on the signals, the bubbling was suspended dur-ing the EN and EIS measurements. Time intervals of 10 min weretherefore used for the EN measurements guaranteeing a negligi-ble change of the oxygen concentration in the solution. The oxy-gen concentration in the solution was varied by means ofbubbling oxygen or nitrogen to obtain an oxygen concentrationof 3, 15 or 25 ppm (mg/L). The oxygen concentration obtainedby saturation of the solution with air (5 ppm) was also consid-ered. Although EN studies tend to include both current and po-tential signals, this study concentrated on current signals only.The sampling frequency for the electrochemical noise data was8 Hz. Noise data were analyzed with wavelet technique usingthe orthogonal Daubechies wavelets of the fourth order (db4).The necessary calculations for construction of the SDPS plotswere performed using Matlab software.
3. Results and discussion
3.1. Symmetrical cells
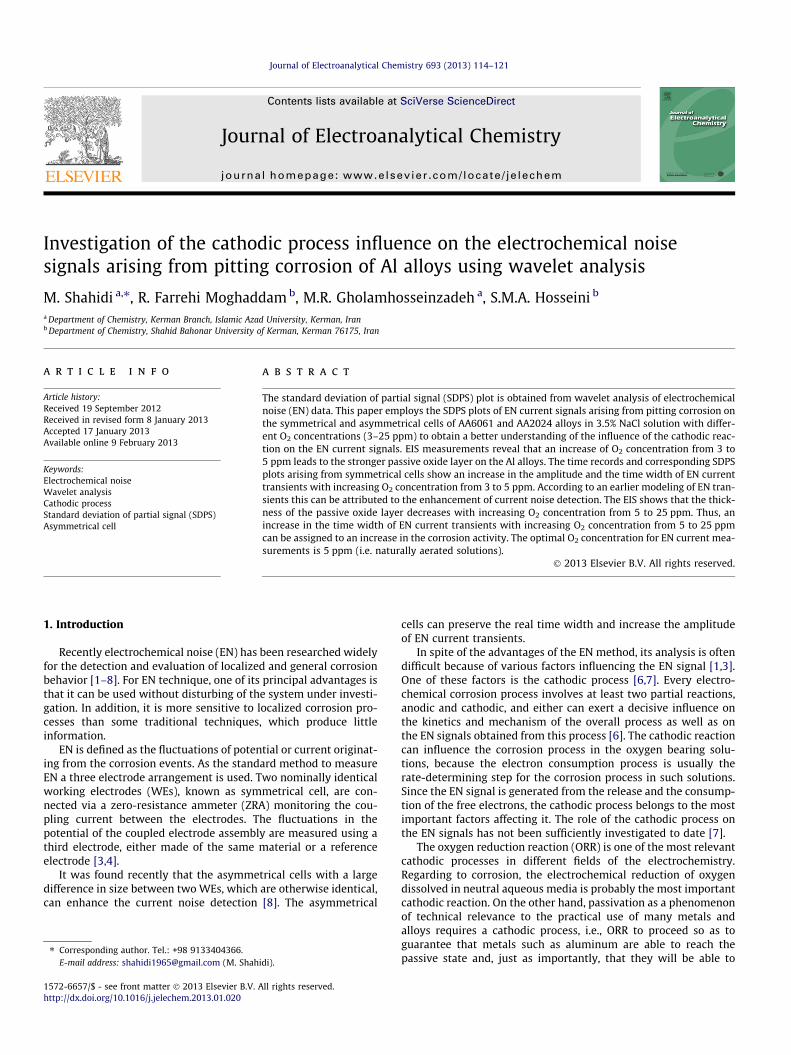
EN measurements were performed on symmetrical cells of Alalloys in a 3.5% NaCl solution having different oxygen concentra-tions. The EN time records obtained for AA6061 and AA2024 areshown in Figs. 1 and 2, respectively. The WT was employed todecompose each set of 4800 data points and then the SDPS plotsof the EN time records were obtained as shown in Figs. 3 and 4,respectively.
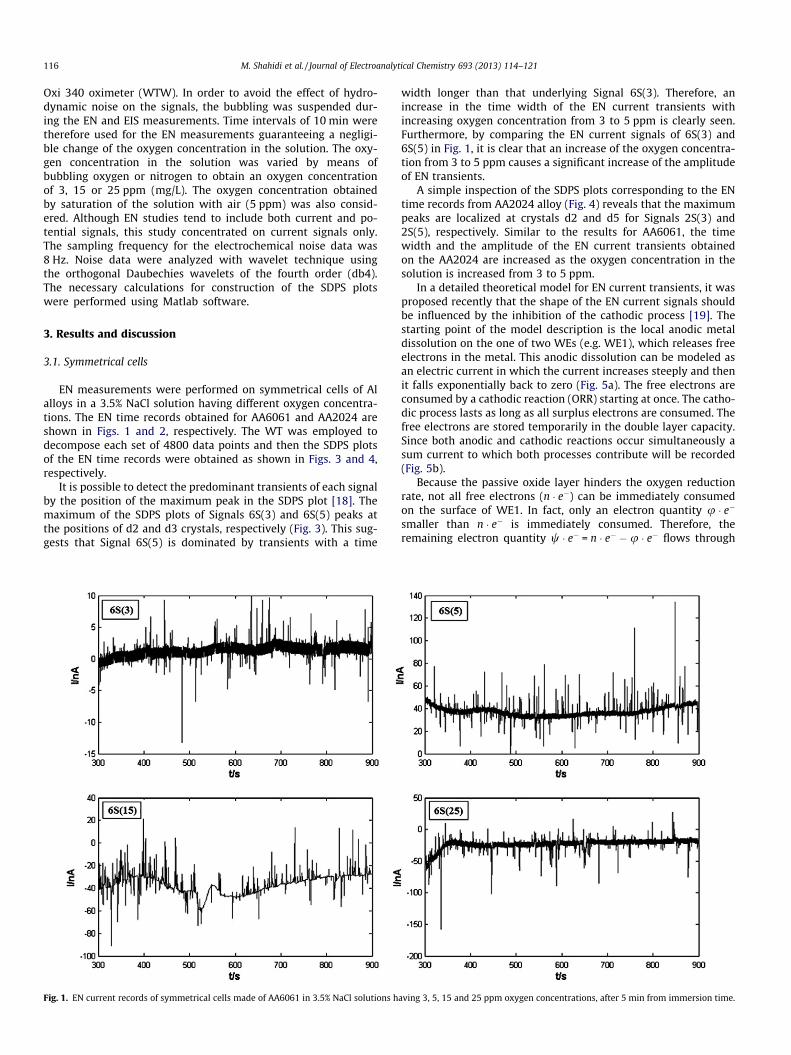
It is possible to detect the predominant transients of each signalby the position of the maximum peak in the SDPS plot [18]. Themaximum of the SDPS plots of Signals 6S(3) and 6S(5) peaks atthe positions of d2 and d3 crystals, respectively (Fig. 3). This sug-gests that Signal 6S(5) is dominated by transients with a time
Fig. 1. EN current records of symmetrical cells made of AA6061 in 3.5% NaCl solutions h
width longer than that underlying Signal 6S(3). Therefore, anincrease in the time width of the EN current transients withincreasing oxygen concentration from 3 to 5 ppm is clearly seen.Furthermore, by comparing the EN current signals of 6S(3) and6S(5) in Fig. 1, it is clear that an increase of the oxygen concentra-tion from 3 to 5 ppm causes a significant increase of the amplitudeof EN transients.
A simple inspection of the SDPS plots corresponding to the ENtime records from AA2024 alloy (Fig. 4) reveals that the maximumpeaks are localized at crystals d2 and d5 for Signals 2S(3) and2S(5), respectively. Similar to the results for AA6061, the timewidth and the amplitude of the EN current transients obtainedon the AA2024 are increased as the oxygen concentration in thesolution is increased from 3 to 5 ppm.
In a detailed theoretical model for EN current transients, it wasproposed recently that the shape of the EN current signals shouldbe influenced by the inhibition of the cathodic process [19]. Thestarting point of the model description is the local anodic metaldissolution on the one of two WEs (e.g. WE1), which releases freeelectrons in the metal. This anodic dissolution can be modeled asan electric current in which the current increases steeply and thenit falls exponentially back to zero (Fig. 5a). The free electrons areconsumed by a cathodic reaction (ORR) starting at once. The catho-dic process lasts as long as all surplus electrons are consumed. Thefree electrons are stored temporarily in the double layer capacity.Since both anodic and cathodic reactions occur simultaneously asum current to which both processes contribute will be recorded(Fig. 5b).
Because the passive oxide layer hinders the oxygen reductionrate, not all free electrons (n � e�) can be immediately consumedon the surface of WE1. In fact, only an electron quantity u � e�smaller than n � e� is immediately consumed. Therefore, theremaining electron quantity w � e� = n � e� � u � e� flows through
aving 3, 5, 15 and 25 ppm oxygen concentrations, after 5 min from immersion time.
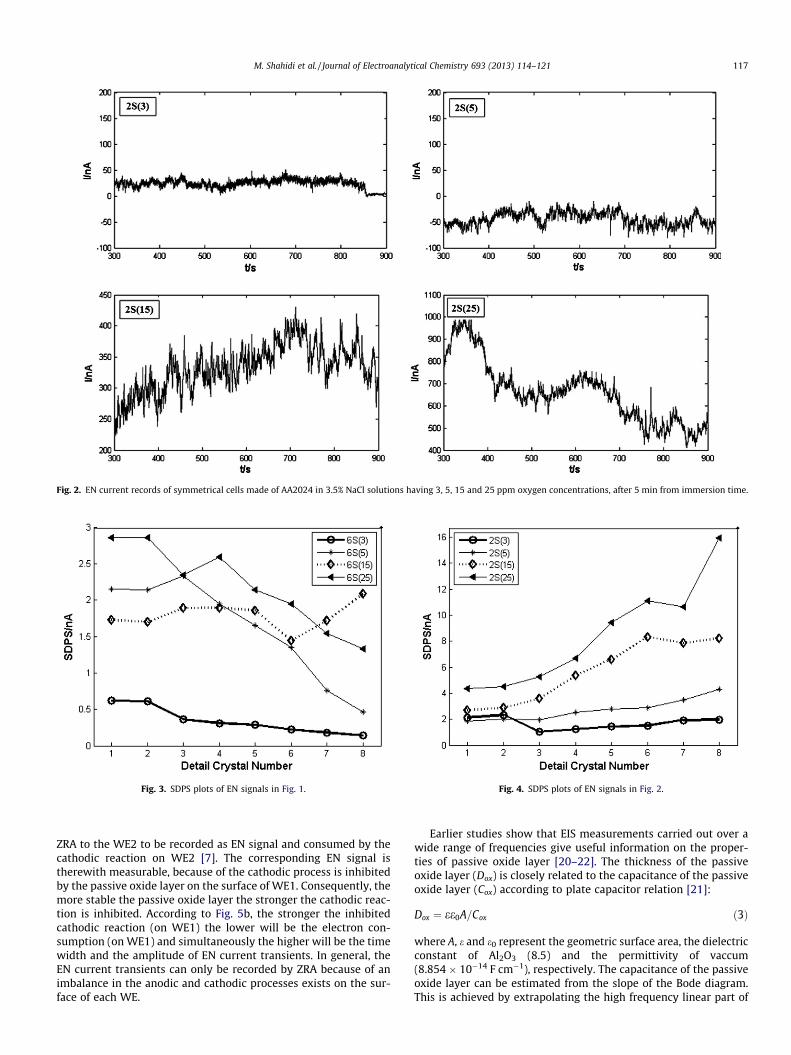
Fig. 2. EN current records of symmetrical cells made of AA2024 in 3.5% NaCl solutions having 3, 5, 15 and 25 ppm oxygen concentrations, after 5 min from immersion time.
Fig. 3. SDPS plots of EN signals in Fig. 1. Fig. 4. SDPS plots of EN signals in Fig. 2.
M. Shahidi et al. / Journal of Electroanalytical Chemistry 693 (2013) 114–121 117
ZRA to the WE2 to be recorded as EN signal and consumed by thecathodic reaction on WE2 [7]. The corresponding EN signal istherewith measurable, because of the cathodic process is inhibitedby the passive oxide layer on the surface of WE1. Consequently, themore stable the passive oxide layer the stronger the cathodic reac-tion is inhibited. According to Fig. 5b, the stronger the inhibitedcathodic reaction (on WE1) the lower will be the electron con-sumption (on WE1) and simultaneously the higher will be the timewidth and the amplitude of EN current transients. In general, theEN current transients can only be recorded by ZRA because of animbalance in the anodic and cathodic processes exists on the sur-face of each WE.
Earlier studies show that EIS measurements carried out over awide range of frequencies give useful information on the proper-ties of passive oxide layer [20–22]. The thickness of the passiveoxide layer (Dox) is closely related to the capacitance of the passiveoxide layer (Cox) according to plate capacitor relation [21]:
Dox ¼ ee0A=Cox ð3Þ
where A, e and e0 represent the geometric surface area, the dielectricconstant of Al2O3 (8.5) and the permittivity of vaccum(8.854 � 10�14 F cm�1), respectively. The capacitance of the passiveoxide layer can be estimated from the slope of the Bode diagram.This is achieved by extrapolating the high frequency linear part of
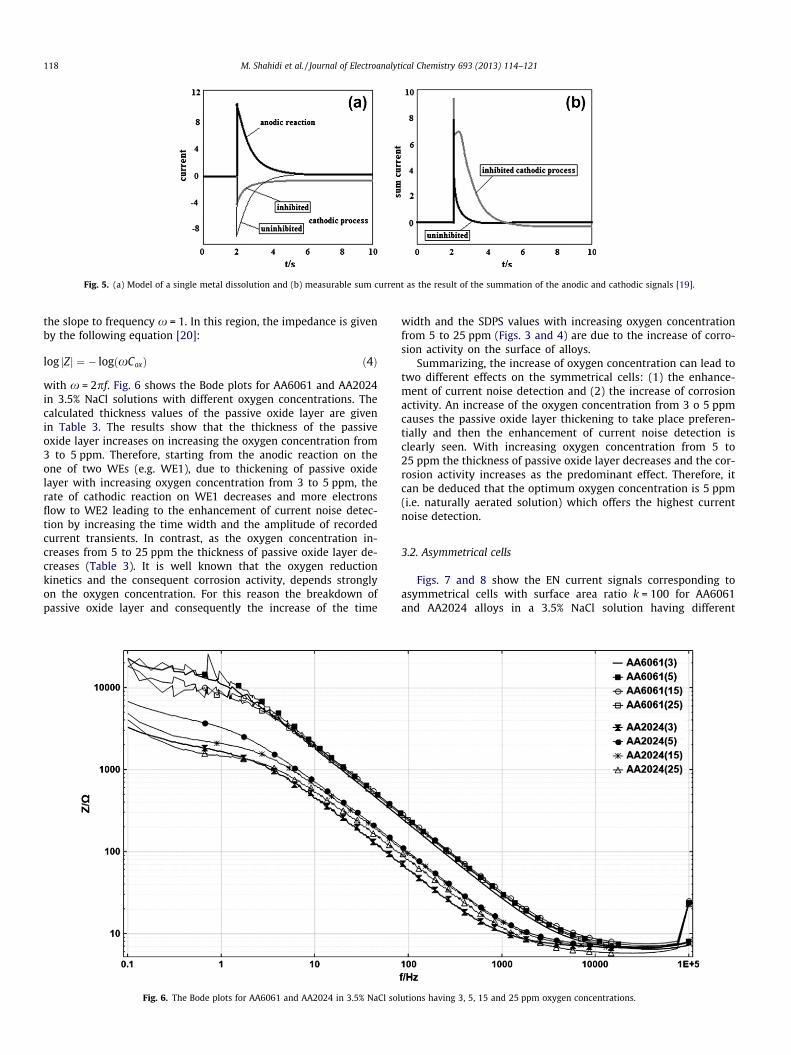
Fig. 5. (a) Model of a single metal dissolution and (b) measurable sum current as the result of the summation of the anodic and cathodic signals [19].
118 M. Shahidi et al. / Journal of Electroanalytical Chemistry 693 (2013) 114–121
the slope to frequency x = 1. In this region, the impedance is givenby the following equation [20]:
log jZj ¼ � logðxCoxÞ ð4Þ
with x = 2pf. Fig. 6 shows the Bode plots for AA6061 and AA2024in 3.5% NaCl solutions with different oxygen concentrations. Thecalculated thickness values of the passive oxide layer are givenin Table 3. The results show that the thickness of the passiveoxide layer increases on increasing the oxygen concentration from3 to 5 ppm. Therefore, starting from the anodic reaction on theone of two WEs (e.g. WE1), due to thickening of passive oxidelayer with increasing oxygen concentration from 3 to 5 ppm, therate of cathodic reaction on WE1 decreases and more electronsflow to WE2 leading to the enhancement of current noise detec-tion by increasing the time width and the amplitude of recordedcurrent transients. In contrast, as the oxygen concentration in-creases from 5 to 25 ppm the thickness of passive oxide layer de-creases (Table 3). It is well known that the oxygen reductionkinetics and the consequent corrosion activity, depends stronglyon the oxygen concentration. For this reason the breakdown ofpassive oxide layer and consequently the increase of the time
Fig. 6. The Bode plots for AA6061 and AA2024 in 3.5% NaCl sol
width and the SDPS values with increasing oxygen concentrationfrom 5 to 25 ppm (Figs. 3 and 4) are due to the increase of corro-sion activity on the surface of alloys.
Summarizing, the increase of oxygen concentration can lead totwo different effects on the symmetrical cells: (1) the enhance-ment of current noise detection and (2) the increase of corrosionactivity. An increase of the oxygen concentration from 3 o 5 ppmcauses the passive oxide layer thickening to take place preferen-tially and then the enhancement of current noise detection isclearly seen. With increasing oxygen concentration from 5 to25 ppm the thickness of passive oxide layer decreases and the cor-rosion activity increases as the predominant effect. Therefore, itcan be deduced that the optimum oxygen concentration is 5 ppm(i.e. naturally aerated solution) which offers the highest currentnoise detection.
3.2. Asymmetrical cells
Figs. 7 and 8 show the EN current signals corresponding toasymmetrical cells with surface area ratio k = 100 for AA6061and AA2024 alloys in a 3.5% NaCl solution having different
utions having 3, 5, 15 and 25 ppm oxygen concentrations.
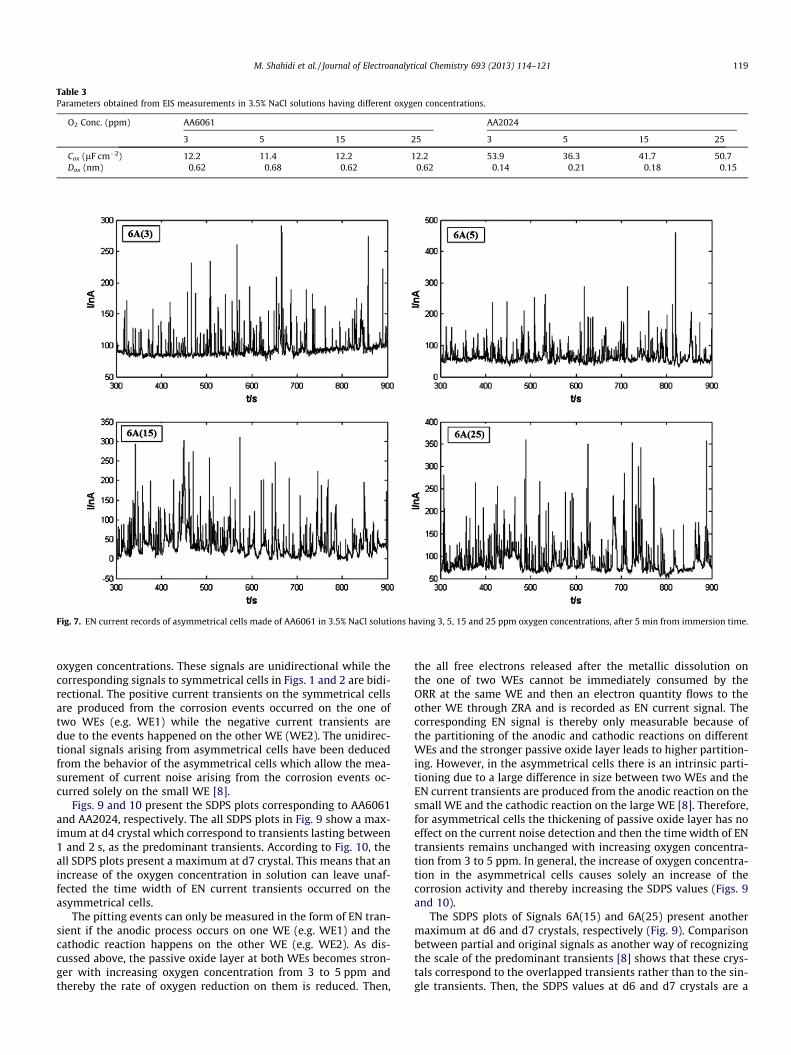
Table 3Parameters obtained from EIS measurements in 3.5% NaCl solutions having different oxygen concentrations.
O2 Conc. (ppm) AA6061 AA2024
3 5 15 25 3 5 15 25
Cox (lF cm�2) 12.2 11.4 12.2 12.2 53.9 36.3 41.7 50.7Dox (nm) 0.62 0.68 0.62 0.62 0.14 0.21 0.18 0.15
Fig. 7. EN current records of asymmetrical cells made of AA6061 in 3.5% NaCl solutions having 3, 5, 15 and 25 ppm oxygen concentrations, after 5 min from immersion time.
M. Shahidi et al. / Journal of Electroanalytical Chemistry 693 (2013) 114–121 119
oxygen concentrations. These signals are unidirectional while thecorresponding signals to symmetrical cells in Figs. 1 and 2 are bidi-rectional. The positive current transients on the symmetrical cellsare produced from the corrosion events occurred on the one oftwo WEs (e.g. WE1) while the negative current transients aredue to the events happened on the other WE (WE2). The unidirec-tional signals arising from asymmetrical cells have been deducedfrom the behavior of the asymmetrical cells which allow the mea-surement of current noise arising from the corrosion events oc-curred solely on the small WE [8].
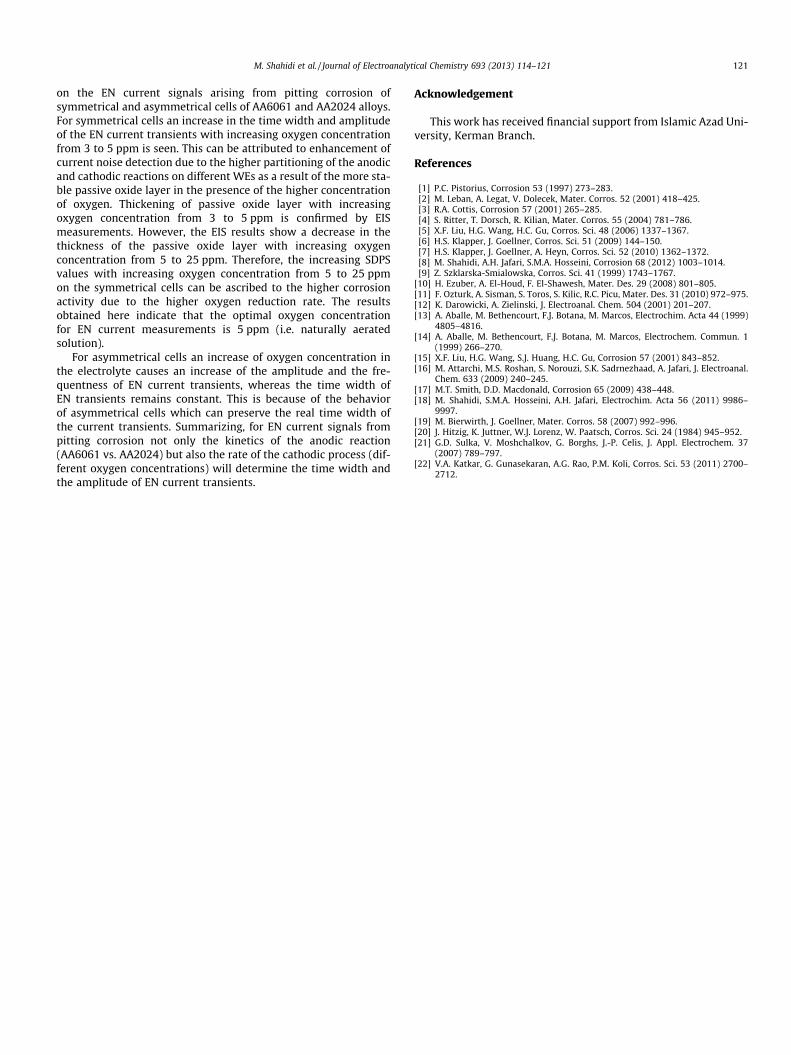
Figs. 9 and 10 present the SDPS plots corresponding to AA6061and AA2024, respectively. The all SDPS plots in Fig. 9 show a max-imum at d4 crystal which correspond to transients lasting between1 and 2 s, as the predominant transients. According to Fig. 10, theall SDPS plots present a maximum at d7 crystal. This means that anincrease of the oxygen concentration in solution can leave unaf-fected the time width of EN current transients occurred on theasymmetrical cells.
The pitting events can only be measured in the form of EN tran-sient if the anodic process occurs on one WE (e.g. WE1) and thecathodic reaction happens on the other WE (e.g. WE2). As dis-cussed above, the passive oxide layer at both WEs becomes stron-ger with increasing oxygen concentration from 3 to 5 ppm andthereby the rate of oxygen reduction on them is reduced. Then,
the all free electrons released after the metallic dissolution onthe one of two WEs cannot be immediately consumed by theORR at the same WE and then an electron quantity flows to theother WE through ZRA and is recorded as EN current signal. Thecorresponding EN signal is thereby only measurable because ofthe partitioning of the anodic and cathodic reactions on differentWEs and the stronger passive oxide layer leads to higher partition-ing. However, in the asymmetrical cells there is an intrinsic parti-tioning due to a large difference in size between two WEs and theEN current transients are produced from the anodic reaction on thesmall WE and the cathodic reaction on the large WE [8]. Therefore,for asymmetrical cells the thickening of passive oxide layer has noeffect on the current noise detection and then the time width of ENtransients remains unchanged with increasing oxygen concentra-tion from 3 to 5 ppm. In general, the increase of oxygen concentra-tion in the asymmetrical cells causes solely an increase of thecorrosion activity and thereby increasing the SDPS values (Figs. 9and 10).
The SDPS plots of Signals 6A(15) and 6A(25) present anothermaximum at d6 and d7 crystals, respectively (Fig. 9). Comparisonbetween partial and original signals as another way of recognizingthe scale of the predominant transients [8] shows that these crys-tals correspond to the overlapped transients rather than to the sin-gle transients. Then, the SDPS values at d6 and d7 crystals are a
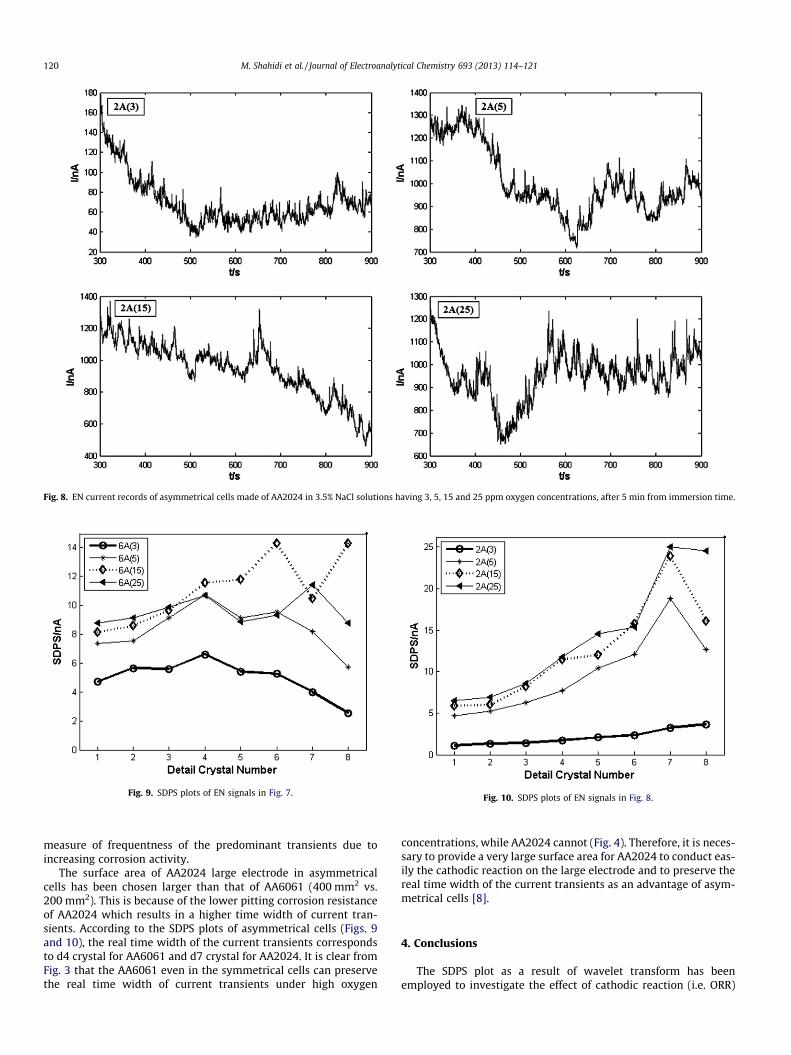
Fig. 8. EN current records of asymmetrical cells made of AA2024 in 3.5% NaCl solutions having 3, 5, 15 and 25 ppm oxygen concentrations, after 5 min from immersion time.
Fig. 9. SDPS plots of EN signals in Fig. 7. Fig. 10. SDPS plots of EN signals in Fig. 8.
120 M. Shahidi et al. / Journal of Electroanalytical Chemistry 693 (2013) 114–121
measure of frequentness of the predominant transients due toincreasing corrosion activity.
The surface area of AA2024 large electrode in asymmetricalcells has been chosen larger than that of AA6061 (400 mm2 vs.200 mm2). This is because of the lower pitting corrosion resistanceof AA2024 which results in a higher time width of current tran-sients. According to the SDPS plots of asymmetrical cells (Figs. 9and 10), the real time width of the current transients correspondsto d4 crystal for AA6061 and d7 crystal for AA2024. It is clear fromFig. 3 that the AA6061 even in the symmetrical cells can preservethe real time width of current transients under high oxygen
concentrations, while AA2024 cannot (Fig. 4). Therefore, it is neces-sary to provide a very large surface area for AA2024 to conduct eas-ily the cathodic reaction on the large electrode and to preserve thereal time width of the current transients as an advantage of asym-metrical cells [8].
4. Conclusions
The SDPS plot as a result of wavelet transform has beenemployed to investigate the effect of cathodic reaction (i.e. ORR)
M. Shahidi et al. / Journal of Electroanalytical Chemistry 693 (2013) 114–121 121
on the EN current signals arising from pitting corrosion ofsymmetrical and asymmetrical cells of AA6061 and AA2024 alloys.For symmetrical cells an increase in the time width and amplitudeof the EN current transients with increasing oxygen concentrationfrom 3 to 5 ppm is seen. This can be attributed to enhancement ofcurrent noise detection due to the higher partitioning of the anodicand cathodic reactions on different WEs as a result of the more sta-ble passive oxide layer in the presence of the higher concentrationof oxygen. Thickening of passive oxide layer with increasingoxygen concentration from 3 to 5 ppm is confirmed by EISmeasurements. However, the EIS results show a decrease in thethickness of the passive oxide layer with increasing oxygenconcentration from 5 to 25 ppm. Therefore, the increasing SDPSvalues with increasing oxygen concentration from 5 to 25 ppmon the symmetrical cells can be ascribed to the higher corrosionactivity due to the higher oxygen reduction rate. The resultsobtained here indicate that the optimal oxygen concentrationfor EN current measurements is 5 ppm (i.e. naturally aeratedsolution).
For asymmetrical cells an increase of oxygen concentration inthe electrolyte causes an increase of the amplitude and the fre-quentness of EN current transients, whereas the time width ofEN transients remains constant. This is because of the behaviorof asymmetrical cells which can preserve the real time width ofthe current transients. Summarizing, for EN current signals frompitting corrosion not only the kinetics of the anodic reaction(AA6061 vs. AA2024) but also the rate of the cathodic process (dif-ferent oxygen concentrations) will determine the time width andthe amplitude of EN current transients.
Acknowledgement
This work has received financial support from Islamic Azad Uni-versity, Kerman Branch.
References
[1] P.C. Pistorius, Corrosion 53 (1997) 273–283.[2] M. Leban, A. Legat, V. Dolecek, Mater. Corros. 52 (2001) 418–425.[3] R.A. Cottis, Corrosion 57 (2001) 265–285.[4] S. Ritter, T. Dorsch, R. Kilian, Mater. Corros. 55 (2004) 781–786.[5] X.F. Liu, H.G. Wang, H.C. Gu, Corros. Sci. 48 (2006) 1337–1367.[6] H.S. Klapper, J. Goellner, Corros. Sci. 51 (2009) 144–150.[7] H.S. Klapper, J. Goellner, A. Heyn, Corros. Sci. 52 (2010) 1362–1372.[8] M. Shahidi, A.H. Jafari, S.M.A. Hosseini, Corrosion 68 (2012) 1003–1014.[9] Z. Szklarska-Smialowska, Corros. Sci. 41 (1999) 1743–1767.
[10] H. Ezuber, A. El-Houd, F. El-Shawesh, Mater. Des. 29 (2008) 801–805.[11] F. Ozturk, A. Sisman, S. Toros, S. Kilic, R.C. Picu, Mater. Des. 31 (2010) 972–975.[12] K. Darowicki, A. Zielinski, J. Electroanal. Chem. 504 (2001) 201–207.[13] A. Aballe, M. Bethencourt, F.J. Botana, M. Marcos, Electrochim. Acta 44 (1999)
4805–4816.[14] A. Aballe, M. Bethencourt, F.J. Botana, M. Marcos, Electrochem. Commun. 1
(1999) 266–270.[15] X.F. Liu, H.G. Wang, S.J. Huang, H.C. Gu, Corrosion 57 (2001) 843–852.[16] M. Attarchi, M.S. Roshan, S. Norouzi, S.K. Sadrnezhaad, A. Jafari, J. Electroanal.
Chem. 633 (2009) 240–245.[17] M.T. Smith, D.D. Macdonald, Corrosion 65 (2009) 438–448.[18] M. Shahidi, S.M.A. Hosseini, A.H. Jafari, Electrochim. Acta 56 (2011) 9986–
9997.[19] M. Bierwirth, J. Goellner, Mater. Corros. 58 (2007) 992–996.[20] J. Hitzig, K. Juttner, W.J. Lorenz, W. Paatsch, Corros. Sci. 24 (1984) 945–952.[21] G.D. Sulka, V. Moshchalkov, G. Borghs, J.-P. Celis, J. Appl. Electrochem. 37
(2007) 789–797.[22] V.A. Katkar, G. Gunasekaran, A.G. Rao, P.M. Koli, Corros. Sci. 53 (2011) 2700–
2712.