Embed Size (px)
Citation preview
INVESTIGATION OF XENOBIOTIC METABOLISM IN MAMMALIAN CELLS IN CULTURE
By Geraldine Grant B.A. Mod. Hons.
A thesis submitted for the degree of Ph. D.
Dublin City University
The research work described in this thesis was carried out under the supervision of Professor M. Clynes Ph. D.
National Cell & Tissue Culture Centre,
School of Biological Sciences
AUGUST 1993.
I hereby certify that this material, which I now submit for assessment on the programme of study leading to the award of Ph D. is entirely my own work and has not been taken from the work of others save and to the extent that such work has been cited and acknowledged within the text of my work.
S i g n e d : D a t e : 3 D S ' 9 5
INVESTIGATION OF XENOBIOTIC METABOLISM IN CELLS INCULTURE.
By Geraldine Grant B A. Mod
The use of permanent cell lines in toxicity testing is a long established procedure Cell culture offers two major advantages over research conducted in vivo or with tissues, (1) it reduces the ethical difficulties, (2) allows environmental factors to be controlledHowever, many compounds e g premutagens and precarcinogens are metabolically converted by monooxygenases and other xenobiotic-metabolizmg enzymes into their ultimate mutagemc/carcinogemc form, cultured cells rapidly lose the ability to express many of these enzymes Therefore, a toxicological test system which intends to detect mutagens or carcinogens must be capable of producing these compounds in their ’active’ formTo overcome this lack of activation capability external activation systems have been employed (e g. hepatocytes and S9 fraction) but such systems show great variabilitySome established cell lines do, however, retain a degree of their original metabolic ability making them very useful tools in toxicity testing
This project involved A) the investigation of primary culture of Non Small Cell Carcinoma of the lung The aim of this investigation was to improve the success rate of establishing cultures, which may then be used in the determination of toxicity of chemotherapeutic agents on tumours, B) Determination of the levels of drug metabolizing activity (both phase 1 and phase 2) in a number of established cell lines under inductive pressure in order to establish the possible relevance of these lines to toxicity testing, C) To investigate the possible role of drug metabolizing enzymes in multiple drug resistance, D) To construct, by transfection, cell lines expressing the Cytochrome P4501A1 gene

This thesis is dedicated to my parents.

ACKNOWLEDGEMENTS
I would like to thank my supervisor Professor Martin Clynes for all his guidance and encouragement throughout this thesis
I would also like to thank Mr V Lynch and his staff (St Vmcent Hospital) for the samples they supplied to us. Dr J. Doehmer for his generous gift of the CYP1AI plasmid and transfected cell lines, Dr E Law, Dr D Farrell and Una Gilvarry-Quigley for their expertise in the histopathology and cytogenetics sections of this thesis and to Dr E Moran for her help with the Western blottmg
I am indebted to every member of the Lab, who all took time out from their busy schedules to help me and keep me sane, at various stages and especially in the final preparation, of this thesis. I would especially like to thank those who helped me at the proof reading stage - Irene Cleary, Gerald Doherty, Lorraine McElroy-O’Driscol, Shirley McBride, Mary Heenan, Joanne Keenan, Keara Hall, Anthony Woodman, Carmel Daly, Catherine Halligan-Cuffe, Eilis Corrigan, Margaret Dooley and Susan McDonnell, who trudged through the reference section with a fine toothed comb Thank-you also to Mohammad Saleh, who came to the rescue every time my computer "developed an attitude"
Finally and most especially to my parents Margaret and Joseph Grant for their unfaltering support and encouragement, above and beyond the call of duty To my sister Maire, my brothers Joseph and John and my niece Catherine who were simply the best They say it’s always darkest before the dawn and boy was it dark'
TABLE OF CONTENTS
SECTION TITLE PAGE
!
1.0 INTRODUCTION 1
1 1 Xenobiotic Metabolism - An overview 1
12 0 Phase I Metabolism 3
13 0 Phase II Metabolism 17
1 4 0 Induction of the xenobiotic metabolizing enzyme system 25
1 5 0 The cytochrome P450 mutigene family 29
16 0 The glutathione-S-transferase family of enzymes 47
17 0 Activation and cancer 51
1 8 0 Drug resistance in tumour cells 52
2.0 MATERIALS AND METHODS 58
2 0 Tissue culture techniques 58
2 0 4 3 Induction of cell lines 61
2 1 Primary culture 64
2 1 1 Fibroblast eradication 65
2 2 Serum batch testing 66
2 2 1 Pretreatment of cells 66
2 2 2 Acid phosphatase enzyme assay for cell growth 66
2 3 Toxicity testing 67
2 4 Immunofluroescence analysis 67
2 4 2 Procedure for surface membrane antigen Ep-16 68
2 4 3 Procedure for intracellular antigens 68
2 4 4 Immunohistochemistry to detect for expression of enzymes 68
2 5 Iso-enzyme analysis 69
2 6 Cloning in agar 70
2 7 Histopathology 70
2 8 Chromosomal analysis 71
2 9 DNA isolation 71
2 9 1 Preparation of competent cells for transformation 71
2 9 2 Transformation of bacteria with plasmid 71
2 9 3 Small scale preparation of plasmid DNA - mmiprep 72
2 9 4 Phenol equilibration 73
2 9 5 .Large-scale DNA preparation 73
2 9 7 Removal of contaiminating RNA from DNA samples 75
2 10 DNA analysis - Gel electrophoresis 76
2 11 Poly-acrylamide gel electrophoresis 77
2 12 Western blot analysis 78
2 13 Transfection of mammalian cells 80
2 13 1 Calcium phosphate mediated transfection 80
2 13 2 Electroporation mediated transfection 80
2 13 3 Cloning colonies 81
2 13 4 To test for frequency of transfection using plamid PCH110 81
2 14 Polymerase chain reaction for detection of plasmid 82
2 15 Enzymology 84
2 15 1 Spectrophotometric detection 85
2 15 2 Flurometric assays 88
2 16 Photography 91
2 17 Safety 92
3.0 RESULTS 94
3 1 Primary culture 94
3 1 1 Establishment of DLKP 100
3 1 1 2 Immunofluorescence 102
3 1 1 3 Isoenzyme analysis 110
3 1 1 4 DNA fingerprinting 111
3 1 1 5 Histopathology 113
3 1 1 6 Cloning in agar/colony forming efficiency 114
3 2 Analysis fo cell lines for xenobiotic metabolizing activity 115
3 2 1 Cytochrome P450IA1 analysis by western blot 131
3 3 Effect of antibodies on H411E expression of AHH 134
3 4 Transfection of mammalian cells in culture 136
3 5 Glutathione-S-transferase western blot analysis 140

3 6 Toxicity testing of a number of cell lines 143
3 7 Investigation of SKLU1A - adriamycin resistant cells 150
4.0 DISCUSSION 153
5.0 REFERENCES
Abbreviation
ABBREVIATIONS
Ah Aromatic hydrocarbon
AHH Aryl hydrocarbon hydroxylase
AMP Ampicillin
Arnt Aromatic hydrocarbon nuclear translocator
protein
ATCC American tissue culture collection
BA Benzanthracene
BCPI 5-Bromo-4-chloro-3-mdolyl phosphate
BTE Basal transcriptional element
CaCl2 Calcium chloride
CM Conditioned medium
CO Carbon monoxide
DMEM Dubeccos mininum essential medium
DMF Dimethyl formamide
DMSO Dimethyl sulfoximide
DNCB Dmitrochlorobenzene
EDTA Ethylenediaminetetraacetic acid
EGF Epidermal growth factor
EGTA Ethylene glycol-bis[/3-aminoethylether]-
N,N,N’,N’-tetraacetic acid
FCS Foetal calf serum
FITC Fluorescein Isothiocyanate
GH Growth hormone
GSH Glutathione
GST Glutathione-S-transferase
HBS HEPES balanced salts
HCL Hydrochloric acid
HEPES N -[2-H ydroxyethyl]piperazine-N ’-[2-
ethanesulfomc acid]
HSP90 Heat shock protein
L-Glut L-glutamine
MC 3-Methylcholanthrene
MDR Multiple drug resistance
MEM Minimum essential medium
MgCl2 Magnesium chloride
NaCl Sodium chloride
NADH Nicotinamide ademne dinucleotide
NADPH Nicotinamide adenine dinucleotide
phosphate
NaHC02 Sodium bicarbonate
NaOH Sodium hydroxide
NEAA Non essential ammo acids
PAH Polycyclic aromatic hydrocarbon
PB Phénobarbital
PBS Phosphate buffered saline
PCR Polymerase cham reaction
PIPES Piperazme-N,N’-bis[2-ethanesulfomc acid]
SDS Sodium dodecyl sulphate
SP Sodium pyruvate
TBS Tns buffered saline
TCA Trichloroacetic acid
TE Tris-EDTA
TEMED N,N,N’ ,N’ ,-Tetramethyl-ethylenediamine
TRIS Tr i s [hydroxym ethy l ]am inom ethane
hydrochloride
TV Trypsin versene
UP WATER Ultra pure water
UV Ultra violet
X-Gal 5 -B tp ,p - 4 - c h lo r o - 3 - in d o ly l - j 8 - D -
galactopyranoside
XPBS X phosphate buffered saline
XRE Xenobiotic regulatory element

1.0 INTRODUCTION.
1.1 XENOBIOTIC METABOLISM - An overview.
Our modern industrial society has achieved spectacular technological progress However, this
progress is often at the expense of our environment and health Exposure to toxic compounds
is not just a consequence of the modern era The cocktail of components, volcanic gases which
formed the original cell must also have contained a complement of noxious ingredients
Natural toxms may be considered as a successful evolutionary adaptation by species to
predators They are a form of chemical warfare practised by one species on another to ensure
their own subsistence Higher organisms have developed a sophisticated and flexible immune
systems to eliminate large foreign particles e g pathogens e t c , small molecules e g chemicals
are not dealt with by this pathway The survival of man and all other species depends on their
ability to successfully adapt to the presence of these chemicals in our food and the environment
The ultimate problem facing organisms is a hmitless number of small molecules of all possible
physicochemical descriptions, inert, reactive, electrophilic, nucleophilic, lipophilic, hydrophillic
etc These properties dictate how a molecule is absorbed and distributed in addition to the type
of biotransformation necessary for detoxication The lipophilic compounds pose the greatest
problem as they can penetrate the physical barriers of skin and cell membrane Both reactive
and inert lipophilic molecules must be transformed into hydrophillic species so that they can be
eliminated Otherwise these molecules will remain in the cell exerting their effect indefinitely,
as occurs with chemicals that are resistant to metabolism and detoxication e g polychlorinated
biphenyls and dioxins
To deal with this problem species have adapted This adaptation comes m the form of two
highly efficient biological defence systems which have evolved over millions of years for this
purpose, along with the obvious physical barriers (Gonzalez and Nebert, 1990) They are (1)
the anti-oxidant system which protects against ionizing radiation, oxygen radicals and oxidants,
and (2) the detoxication enzymes system These two biological defence systems are closely
related, as products of the detoxication system e g (qumones) may become oxygen radical
generators - substrates for the anti-oxidant system (Kappus, 1986) Cytochrome P450 is
prominent in both systems absorbing dioxygen and its more dangerous singlet form m the
antioxidant system and as a reductase and oxygenase in the detoxication system
1
The anti-oxidant system contains cytochrome P450 as mentioned above, superoxide dismutase
and catalase which remove excess dioxygen and superoxide anion, Glutathione-S-Transferase
(GST), Glutathione (GSH) peroxidase and phospholipid glutathione peroxidase which remove
epoxides and lipid peroxides, GSH and GSH reductase, ascorbate, tocopherols and ubiquinone
which protect tissues component from oxidants The detoxication system is made up of the
cytochrome P450-dependent and independent oxygenases, flavoprotein oxidoreductase, oxidases,
glutathione-S-transferase, epoxide hydrolase, sulphotransferases and glucuronlytransferases etc
(Parke et a l , 1990)
These enzymes are capable of catalyzing a diverse group of chemical transformations They
are extremely flexible where substrate structure is concerned, have loose constraints on substrate
recognition, overlap, of activity between these enzymes is often observed This lack of
selectivity is the key to the success of these enzymes in detoxifying a vast library of structurally
diverse compounds To achieve this flexibility multiple forms or isozymes of these enzymes
have evolved Each isoform can display different substrate preferences, but may also share
some substrates
Exposure of an organism to certain compounds (e g benzo[a]pyrene) results in an induction
response akin to that of the immune response, which induces the production of groups of
enzymes which deal with the metabolism of that compound
The transformations catalyzed by detoxication enzymes are divided into two classes, Phase I
which modifies xenobiotics resulting in the insertion of a polar functional group into that
molecule Phase II enzymes recognise these newly exposed functional groups and conjugates
hydrophilic moieties to them These transformed molecules can then be transported by the
cell’s regular transport mechanism out of the cell (Eckert et a l , 1986)
However a guaranteed scheme for the detoxication of every xenobiotic is not possible due to
the limited resources available to the cell As a result the detoxifying enzyme system can
accidentally catalyze the activation of some foreign compounds to their more toxic forms,
rather than their less toxic forms For example, in the case of vinyl chloride a single metabolic
step catalysed by a cytochrome P450 enzyme leads to the mutagen - chloroethylene oxide, 1,2-
bromoethane on conjugation with glutathione via Glutathione-S-Transferase, produces 1-bromo-
2-(S’-glutathionyl)ethane an unstable intermediate which degenerates to a reactive episulfomum
ion The activation of the polycyclic aryl hydrocarbon benzo[ajpyrene to the highly
tumoungemc 7,8-diol-9,10-epoxide is carried out by the combined efforts of cytochrome
P4501A1 and epoxide hydroxylase (Armstrong, 1987)
2
Over two dozen enzymes can reasonably be said to be involved in the detoxication of foreign
compounds to the extent that it is their primary function Of these, those of importance to this
work are the cytochrome P450 dependent enzymes, UDP-gluconyltransferase and Glutathione-S-
Transferase(
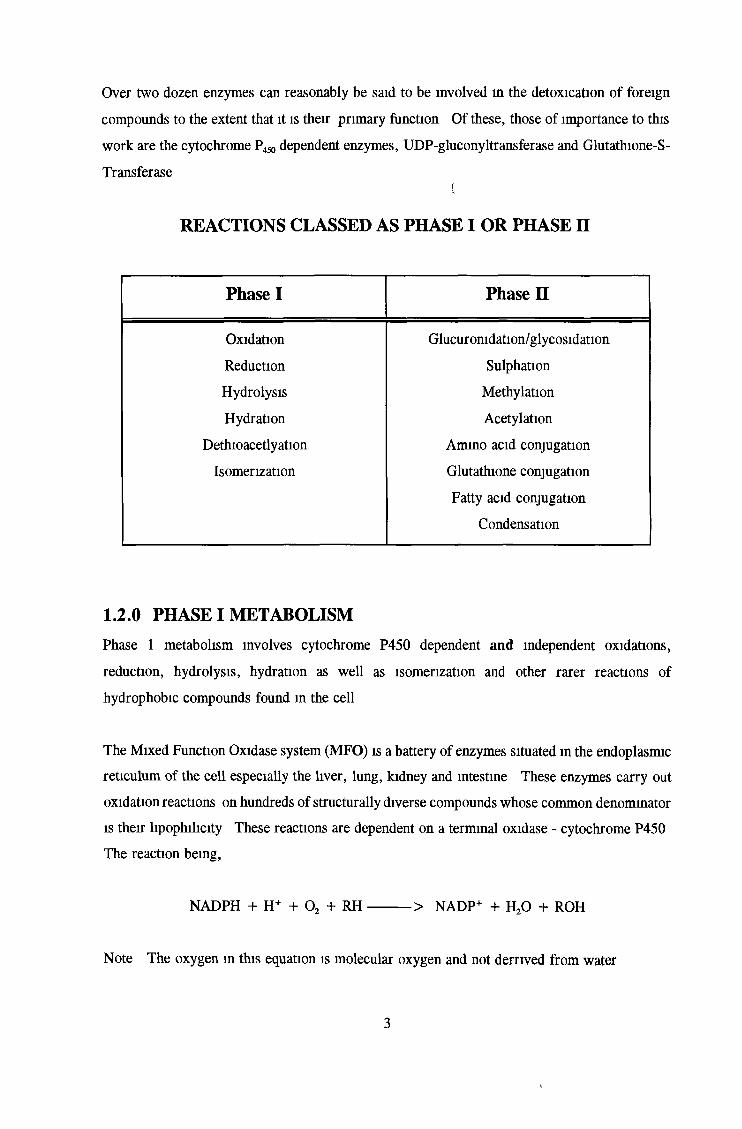
REACTIONS CLASSED AS PHASE I OR PHASE II
Phase I Phase II
Oxidation Glucur omdation/glycosidation
Reduction Sulphation
Hydrolysis Méthylation
Hydration Acétylation
Dethioacetlyation Ammo acid conjugation
Isomerization Glutathione conjugation
Fatty acid conjugation
Condensation
1.2.0 PHASE I METABOLISM
Phase 1 metabolism involves cytochrome P450 dependent and independent oxidations,
reduction, hydrolysis, hydration as well as isomerization and other rarer reactions of
hydrophobic compounds found in the cell
The Mixed Function Oxidase system (MFO) is a battery of enzymes situated in the endoplasmic
reticulum of the cell especially the liver, lung, kidney and intestine These enzymes carry out
oxidation reactions on hundreds of structurally diverse compounds whose common denominator
is their kpophilicity These reactions are dependent on a terminal oxidase - cytochrome P450
The reaction being,
NADPH + H+ + 0 2 + R H > NADP+ + H20 + ROH
Note The oxygen in this equation is molecular oxygen and not derrived from water
3
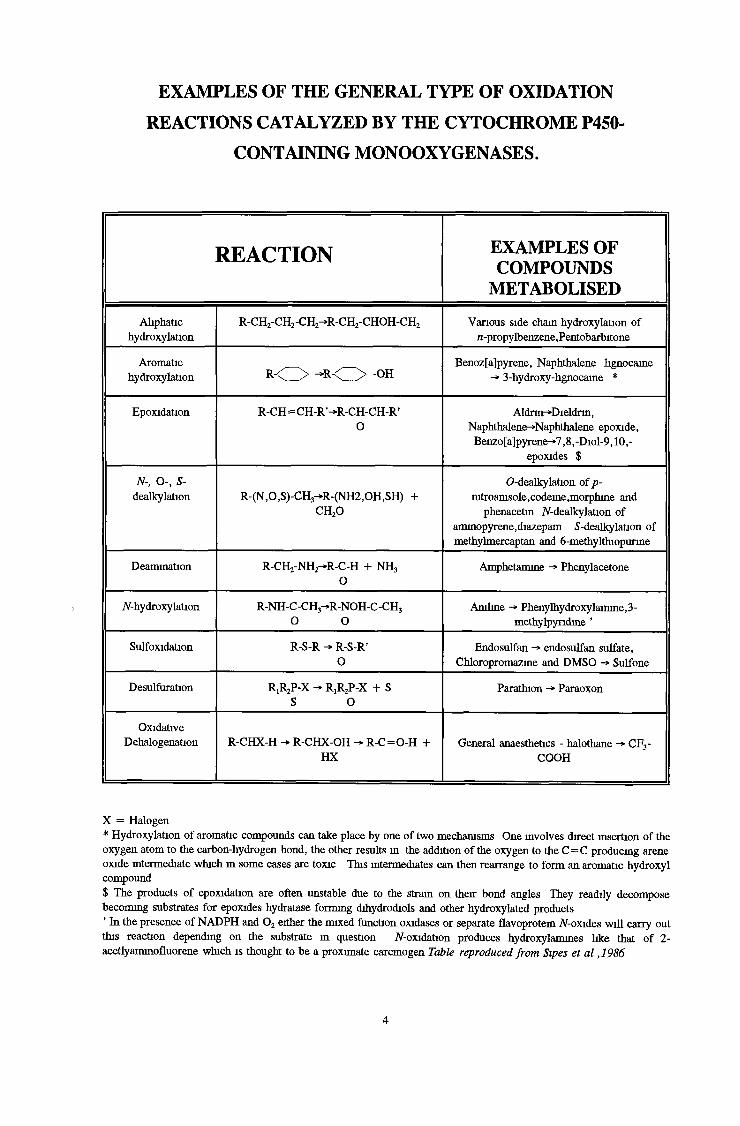
EXAMPLES OF THE GENERAL TYPE OF OXIDATION
REACTIONS CATALYZED BY THE CYTOCHROME P450-
CONTAINING MONOOXYGENASES.
REACTION EXAMPLES OF COMPOUNDS
METABOLISED
Aliphatichydroxylation
R-CH2-CH2-CH2̂ R-CH2-CHOH-CH2 Various side chain hydroxylation of n-propylbenzene, Pentobarbitone
Aromatichydroxylation R < d > -* R < ^ > -OH Benoz[a]pyrene, Naphthalene hgnocame
-► 3-hydroxy-hgnocame *
Epoxidation R-CH= CH-R’-»R-CH-CH-R’ O
Aldnn-»Dieldnn, Naphthalene->Naphthalene epoxide,
Benzo[a]pyrene->7,8, -Diol-9,10, - epoxides $
N-, O-, S- dealkylation R-(NAS)-CH3-»R-(NH2,OH,SH) +
CH20
O-dealkylation of p- nitroamsole,codeme,morplnne and
phenacetm iV-dealkylation of aminopyrene,diazepam i-dealkylation of methylmercaptan and 6-methylthiopunne
Deamination R-CH2-NH2-»R-C-H + n h 3 o
Amphetamme -* Phenylacetone
TV-hydroxylatioii r -n h -c -c h 3-»r -n o h -c -c h 3 0 o
Aniline -» Phenylhydroxylamme,3- methylpyndme ’
Sulfoxidation R-S-R -» R-S-R’o
Endosulfan -» endosulfan sulfate, Chloropromazme and DMSO -» Sulfone
Désulfuration RjR2P-X -> R,R2P-X + s S 0
Parathion -* Paraoxon
OxidativeDehalogenation R-CHX-H -* R-CHX-OH -» R-C=0-H +
HXGeneral anaesthetics - halothane -» CF3-
COOH
X = Halogen* Hydroxylation of aromatic compounds can take place by one of two mechanisms One involves direct insertion of the oxygen atom to the carbon-hydrogen bond, the other results m the addition of the oxygen to the C =C producmg arene oxide intermediate which in some cases are toxic This intermediates can then rearrange to form an aromatic hydroxyl compound$ The products of epoxidation are often unstable due to the strain on their bond angles They readily decompose becoming substrates for epoxides hydratase forming dihydrodiols and other hydroxylated products ’ In the presence of NADPH and 0 2 either the mixed function oxidases or separate flavoprotem iV-oxides will carry out this reaction depending on the substrate in question TV-oxidation produces hydroxylamines like that of 2- acetlyaminofluorene which is thought to be a proximate carcinogen Table reproduced from Sipes et al ,1986
4
1.2.1 THE COMPONENTS OF THE MFO SYSTEM
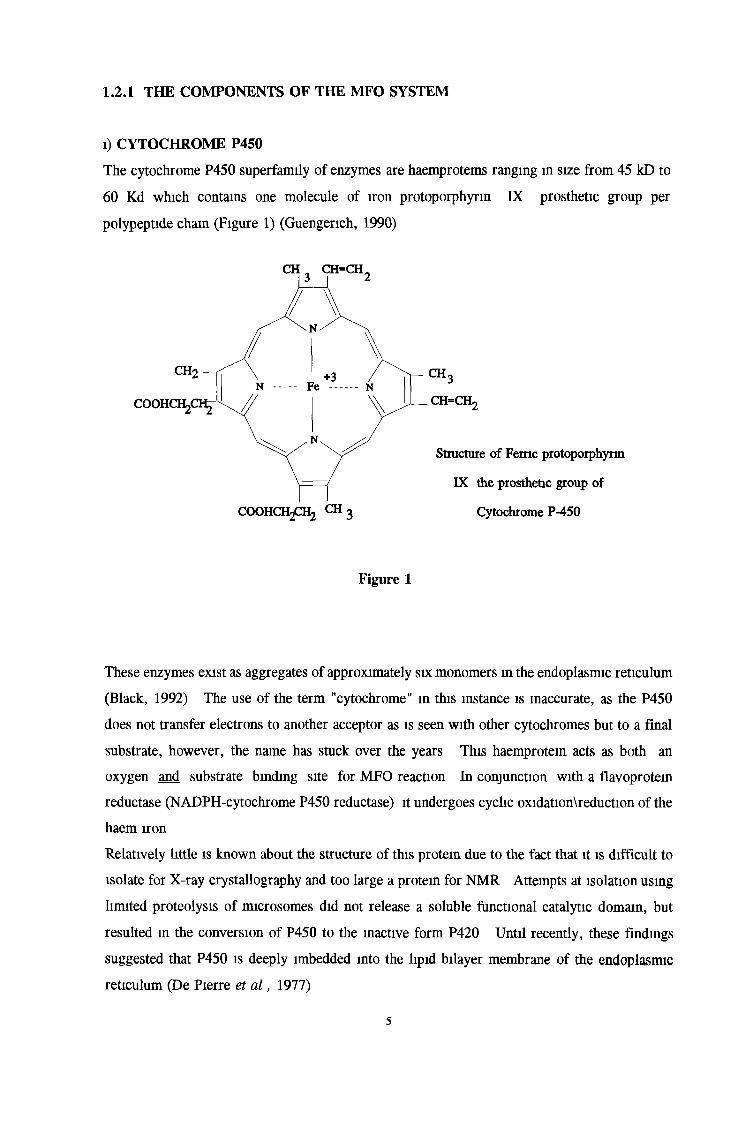
1) CYTOCHROME P450
The cytochrome P450 superfamily of enzymes are haemprotems ranging in size from 45 kD to
60 Kd which contains one molecule of iron protoporphyrin IX prosthetic group per
polypeptide chain (Figure 1) (Guengerich, 1990)
Figure 1
These enzymes exist as aggregates of approximately six monomers in the endoplasmic reticulum
(Black, 1992) The use of the term "cytochrome" in this instance is inaccurate, as the P450
does not transfer electrons to another acceptor as is seen with other cytochromes but to a final
substrate, however, the name has stuck over the years This haemprotein acts as both an
oxygen and substrate binding site for MFO reaction In conjunction with a flavoprotein
reductase (NADPH-cytochrome P450 reductase) it undergoes cyclic oxidation\reduction of the
haem iron
Relatively little is known about the structure of this protein due to the fact that it is difficult to
isolate for X-ray crystallography and too large a protein for NMR Attempts at isolation using
limited proteolysis of microsomes did not release a soluble functional catalytic domain, but
resulted in the conversion of P450 to the inactive form P420 Until recently, these f ind ings
suggested that P450 is deeply imbedded into the lipid bilayer membrane of the endoplasmic
reticulum (De Pierre et a l , 1977)
5
©
ncoo V y coo Cytosol
Lumen
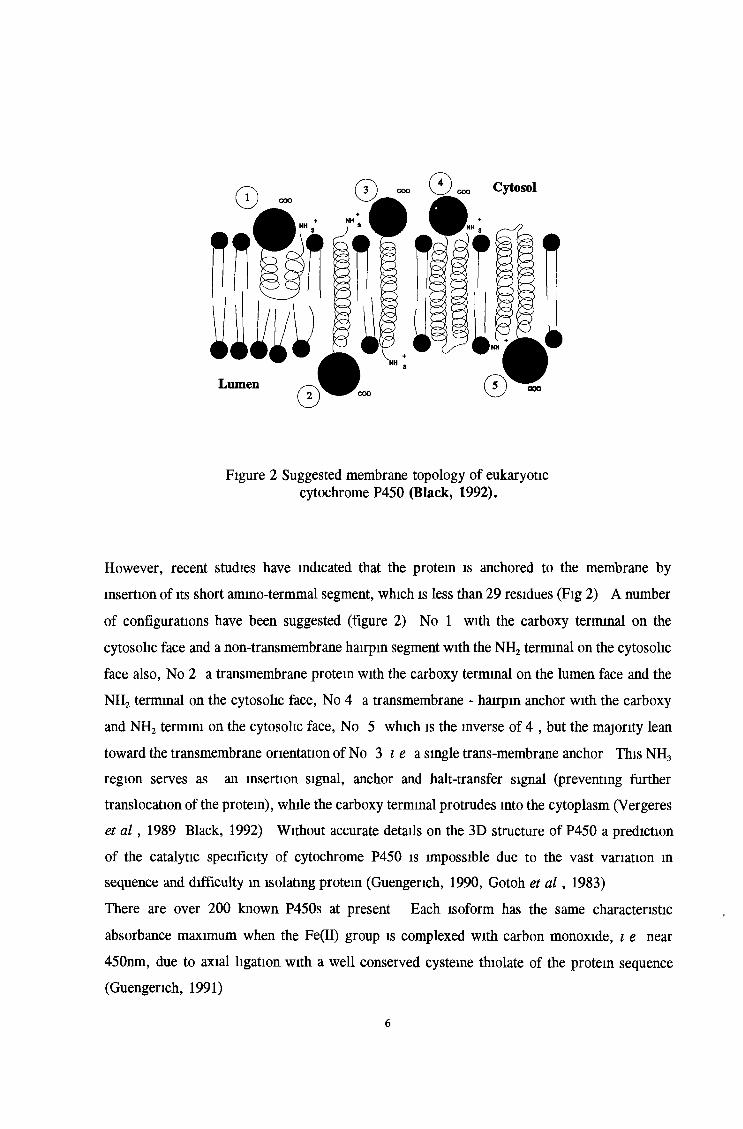
Figure 2 Suggested membrane topology of eukaryotic cytochrome P450 (Black, 1992).
However, recent studies have indicated that the protein is anchored to the membrane by
insertion of its short amino-termmal segment, which is less than 29 residues (Fig 2) A number
of configurations have been suggested (figure 2) No 1 with the carboxy terminal on the
cytosolic face and a non-transmembrane hairpin segment with the NH2 terminal on the cytosolic
face also, No 2 a transmembrane protein with the carboxy terminal on the lumen face and the
NH2 terminal on the cytosolic face, No 4 a transmembrane - hairpin anchor with the carboxy
and NH2 termini on the cytosolic face, No 5 which is the inverse of 4 , but the majority lean
toward the transmembrane orientation of No 3 i e a single trans-membrane anchor This NH3
region serves as an insertion signal, anchor and halt-transfer signal (preventing further
translocation of the protein), while the carboxy terminal protrudes into the cytoplasm (Vergeres
et a l , 1989 Black, 1992) Without accurate details on the 3D structure of P450 a prediction
of the catalytic specificity of cytochrome P450 is impossible due to the vast variation in
sequence and difficulty in isolating protein (Guengerich, 1990, Gotoh et a l , 1983)
There are over 200 known P450s at present Each isoform has the same characteristic
absorbance maximum when the Fe(II) group is complexed with carbon monoxide, i e near
450nm, due to axial ligation with a well conserved cysteme thiolate of the protein sequence
(Guengerich, 1991)
6
The NH3 anchor terminal is conserved to a large degree, but the molecular and structural design
which governs the specificity of the P450 enzymes has yet to be uncovered Small changes in
the protein sequence change the specificity dramatically e g in the P450 associated with
progesterone 21-hydroxylase activity any two substitutions within the three sites 113, 115 and
118, result in a change to estradiol 2-hydroxylation (Guengerich, 1991)
Therefore it is difficult to assign catalytic activity based purely on protein structure P450s
which are 90% identical still have over 50 substitutions to alter catalytic profile, and P450s
which are structurally diverse may carry out identical reactions Also small changes in in vitro
conditions may also effect substrate specificity
l) NADPH CYTOCHROME-P450 REDUCTASE (NADPH cytochrome c reductase)
This reductase contains one molecule of FAD and FMN per mole of apoprotein In humans
this molecule has a molecular weight of 76,656 D and is anchored to the endoplasmic reticulum
(next to the cytochrome P450) by a hydrophobic amino terminal peptide with the remainder of
the molecule protruding onto the cytoplasmic surface of this membrane (Yamano et a l , 1989)
The human cDNA displays 83% similarity with that of the rat The gene is located on
chromosome 7 in humans (7pl5-q35) (Yamano et a l , 1989) Cytochrome P450 accepts its
reducing equivalents from the flavoprotein as follows
N ADPH-C YP450 REDUCTASE
NADPH + H+ (FAD -------------- > FMN) ---------> CYP450
This reaction requires the presence of Mg++ (Peters et a l , 1970)
The reductase acts as a transducer i e moving reducing equivalents sequentially on to
Cytochrome P450, one electron at a time The exact electron flow has yet to be determined
The redox state of the flavoprotems during oxidation is not known however it is believed that
FAD accepts the reducing equivalents from NADPH + H+ and FMN donates them to
CYP450 (Poulos et a l , 1992)
n) LIPID
A Lipid component is essential for the function of P450 Reconstitution experiments which
lacked a lipid component, resulted in non-functional protein
7
The Lipid component is believed to be involved in substrate binding, electron transfer,
conformational change and providing an anchor for the interaction of Cytochrome P450 and
its NADPH reductase (Nisimoto et a l , 1983, Vergeres et a l , 1989)
in) Cytochrome b5
As far as is known cytochrome b5 has no uniform effect on P450-dependent oxidations It has
been reported in many roles but the precise function of this element here is unknown
The mam biological function of hepatic microsomal b5 is to participate in the desaturation of
long-chain fatty acid acyl-CoA derivatives, providing reducing equivalents for the desaturase
enzymes Unlike P450 it is relatively insensitive to induction by exogenous drugs and
chemicals In unmduced liver microsomes, the molar ratio of P450 to b5 is approximately
2 1, during induction this increases to 6 1
ROH RH
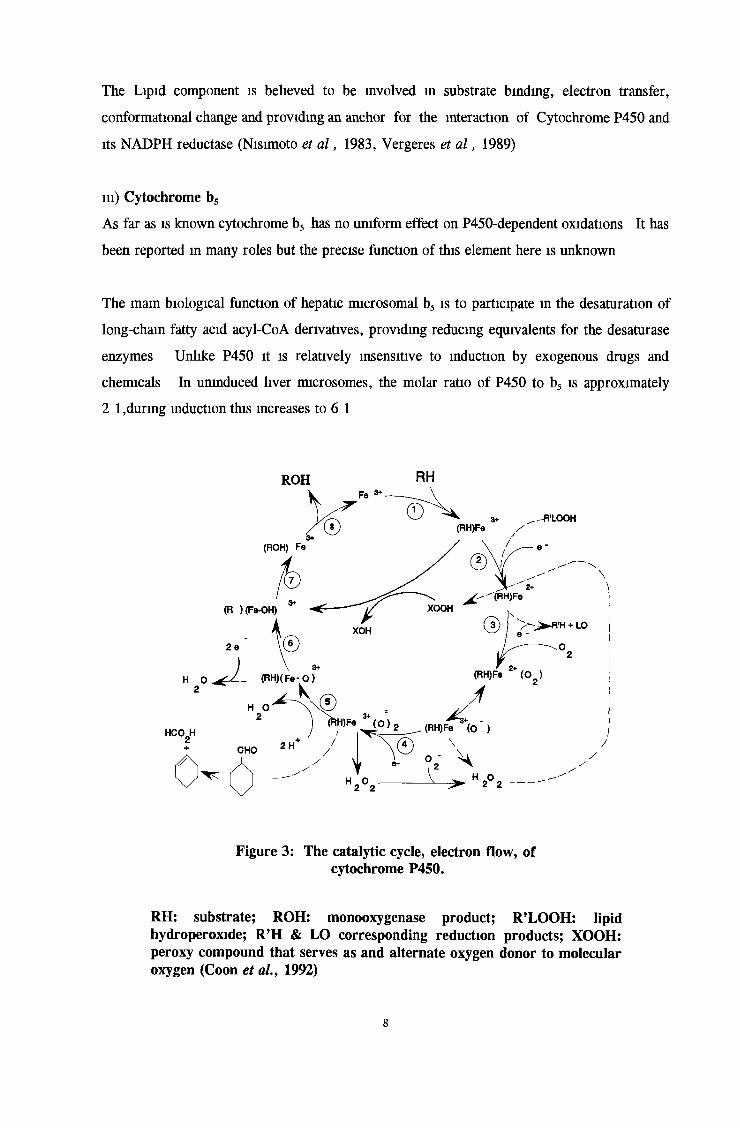
Figure 3: The catalytic cycle, electron flow, of cytochrome P450.
RH: substrate; ROH: monooxygenase product; R’LOOH: lipidhydroperoxide; R’H & LO corresponding reduction products; XOOH: peroxy compound that serves as and alternate oxygen donor to molecular oxygen (Coon et al., 1992)
8
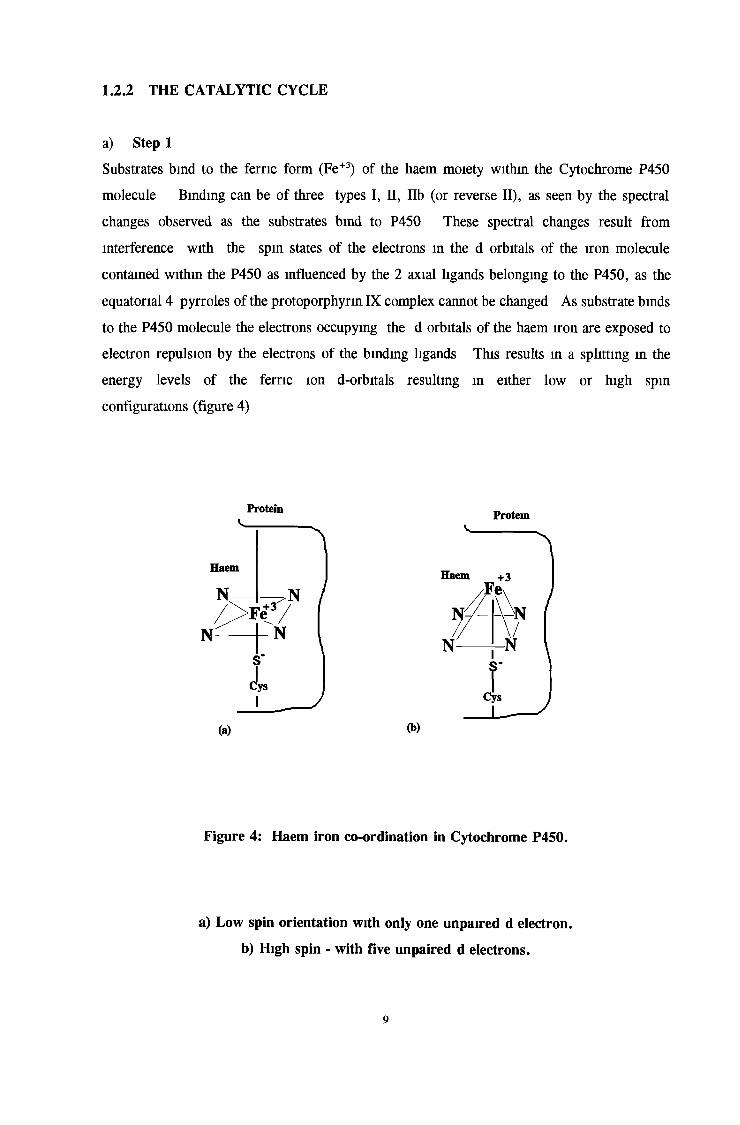
1.2.2 THE CATALYTIC CYCLE
a) Step 1
Substrates bind to the ferric form (Fe+3) of the haem moiety within the Cytochrome P450
molecule Binding can be of three types I, II, lib (or reverse II), as seen by the spectral
changes observed as the substrates bind to P450 These spectral changes result from
interference with the spin states of the electrons in the d orbitals of the iron molecule
contained within the P450 as influenced by the 2 axial ligands belonging to the P450, as the
equatorial 4 pyrroles of the protoporphyrin IX complex cannot be changed As substrate binds
to the P450 molecule the electrons occupying the d orbitals of the haem iron are exposed to
electron repulsion by the electrons of the binding ligands This results in a splitting in the
energy levels of the ferric ion d-orbitals resulting in either low or high spin
configurations (figure 4)
Protein
(a)
Protein
(b)
Figure 4: Haem iron co-ordination in Cytochrome P450.
a) Low spin orientation with only one unpaired d electron,
b) High spin - with five unpaired d electrons.
9
Cytochrome P450 exist mainly m the low spin state demonstrating an absorbance peak at 418
nm Type I substrates e g benzphetamine, caffeine and DDT, bind to the protein moiety and
induce conformational change This change in environment affects the haem iron d orbital
electrons resulting in a change from low-spin to high-spm and a corresponding absorbtion
maximum at 390 nm Binding to the haem iron as in the case of type II nitrogenous substrates
e g aniline, nicotine and type lib ligands e g ethanol and acetamlide, results in low-spin
configuration and an absorbance max at 418 nm
The catalytic activation of oxygen occurs on the iron atom at the site of the exchangeable sixth
ligand (White and Coon, 1980)
The importance of the axial ligands as determinants of haemoprotein function is highlighted
when it is considered that P450, haemoglobin, peroxidases and catalase, all contain
protoporphyrin IX as their prosthetic group, the orientation of the haem relative to the fifth
ligand is the same and yet each performs different biological functions (Ortiz de Montellano
et al , 1983)
b) Step 2
This is the first electron reduction, by NADPH cytochrome P450 reductase, of the substrate-
bound ferric form of cytochrome P450, resulting in the ferrous form
At this stage the first reductive reaction is also observed The peroxide shunt, where peroxy
compounds e g alkyl hydroperoxide, donate an oxygen atom for substrate hydroxylation This
pathway dose not require molecular oxygen or NADPH for its electrons The stepwise one
electron transfer has also been proposed Lipid and xenobiotic hydroperoxides (R’LOOH) are
cleaved, resulting in hydrocarbon formation e g Cumyl hydroperoxide undergoes this reductive
metabolism yielding acetophenone and methane (R’H and LO) The ethanol inducible P450 2E1
has been strongly implicated in this reaction (Coon et a l , 1992)
In adrenal mitochondria, which are more concerned with endogenous metabolism than
xenobiotic metabolism, the sequence of events is different A further carrier iron-sulphur
protein, adrenodoxin, is required, before the electrons reach the P450 molecule
NADPH + H+/Adrenodoxin NADPH reductase -» Adrenodoxin -» Cyto P450
The spin-redox coupling in steps 1 + 2 is complex due to the fact that the NADPH
cytochrome P450 reductase contains FAD and FMN and has the capacity to carry 4
electrons
10
However, it is believed that the fully reduced state of the low potential flavin, is the
electron-donating species (Gibson and Skett, 1986)
c) Step 3
Binding of molecular oxygen to ferrous cytochrome P450-substrate complex, producing an
unstable oxy-ferrous substrate complex
d) Steps 4 - 8
These steps involve, electron rearrangement, introduction of the second electron, oxygen
insertion into substrate, followed by product release The origin of the second electron is
debatable It may originate from the NADPH Cytochrome P450 reductase once again, or
NADH Cytochrome b5 reductase
Uncoupling of the P450 electron cycle occurs when the reducing equivalents (the electrons) are
short circuited away from substrate hydroxylation to oxygen reduction
This produces superoxide (02_) hydrogenperoxide and 4e' reduction of water at the 6th step
The peroxide shunt donates an oxygen atom for hydroxylation requiring neither molecular 0 2
or NADPH electrons (Coon et a l , 1992) These radicals may convert xenobiotics into
products, some of which may be of a toxic nature (Bast, 1986)
REDUCTIVE METABOLISM
Under certain conditions of low oxygen tension cytochrome P450 enzymes will donate one or
even two of their electrons ( as seen in Fig 1 above) to certain xenobiotics Both the
flavoprotein enzyme, NADPH-cytochrome P450 reductase, and the terminal oxidase,
cytochrome P450, are involved in these reductions This alternative action of P450 can result
in activation of compounds to their more toxic products or reactive intermediates e g carbon
tetrachloride and halothane Intestinal microflora also carry out reductive metabolism, often
resulting in reactivation of previously deactivated xenobiotics
Reduction catalysed by the NADPH-cytochrome P450 reductase results in the activation of
some quinone anticancer agents These compounds undergo one-electron reduction of their
quinone group to produce the semiquinone free radical species This semiquinone metabolite
is unstable in the presence of air and is rapidly re-oxidized to form the parent quinone and the
superoxide anion radical It is this amon which binds with the DNA delivering the cytotoxic
effect Drugs like adriamycm and mitomycin C are activated this way (Gibson and Skett,
1988)
l l
ETHANOL METABOLISM
Ethanol metabolism is usually carried out by alcohol dehydrogenase, however on induction
with ethanol, 80% of its clearance is carried out by the P450-dependent enzymes
This phase I battery of enzymes also contains a number of non P450-dependent enzymes as can
be seen below
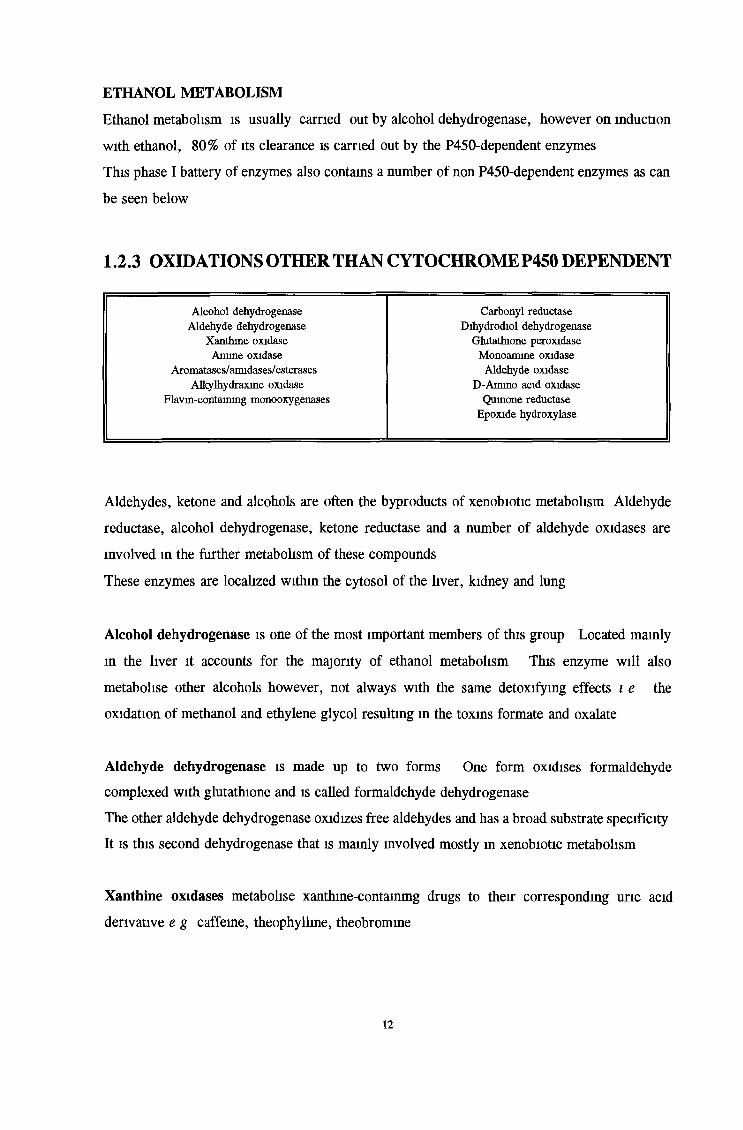
1.2.3 OXIDATIONS OTHER THAN CYTOCHROMEP450 DEPENDENT
Alcohol dehydrogenase Carbonyl reductaseAldehyde dehydrogenase Dihydrodiol dehydrogenase
Xanthine oxidase Glutathione peroxidaseAmine oxidase Monoamine oxidase
Aromatases/amidases/esterases Aldehyde oxidaseAlkylhydraxine oxidase D-Amino acid oxidase
Flavin-containing monooxygenases Quinone reductaseEpoxide hydroxylase
Aldehydes, ketone and alcohols are often the byproducts of xenobiotic metabolism Aldehyde
reductase, alcohol dehydrogenase, ketone reductase and a number of aldehyde oxidases are
involved in the further metabolism of these compounds
These enzymes are localized within the cytosol of the liver, kidney and lung
Alcohol dehydrogenase is one of the most important members of this group Located mainly
in the liver it accounts for the majority of ethanol metabolism This enzyme will also
metabolise other alcohols however, not always with the same detoxifying effects i e the
oxidation of methanol and ethylene glycol resulting in the toxins formate and oxalate
Aldehyde dehydrogenase is made up to two forms One form oxidises formaldehyde
complexed with glutathione and is called formaldehyde dehydrogenase
The other aldehyde dehydrogenase oxidizes free aldehydes and has a broad substrate specificity
It is this second dehydrogenase that is mainly involved mostly in xenobiotic metabolism
Xanthine oxidases metabolise xanthine-contammg drugs to their corresponding uric acid
derivative e g caffeine, theophylline, theobromine
12
Amine oxidases are a group of enzymes which require NADPH and molecular oxygen, but they
are not mixed-function oxidases They can be subdivided into
1) monoamine oxidases (MAO) responsible for the metabolism of endogenous
catecholamine
2) diamine oxidases responsible for the deamination of endogenous diamine e g
histamine and are not primarily involved in drug metabolism
3) Finally the microsomal flavin containing monooxygenase.
Also known as microsomal mixed function amine oxidase and iV-oxygenase (Jakoby and Ziegier,
1990) The broad substrate specificity and wide tissue distribution of this enzyme makes it a
major participant in the oxidative metabolism of drugs and xenobiotics It is a polymeric
protein made up of monomers of Mw 65 Kd, containing one molecule of FAD per mole of
protein monomer It is present in all tissue with substantial concentrations in the liver It can
utilize both NADH and NADPH The reaction sequence is flavm reduction, oxygen binding,
electron transfer to oxygen forming a peroxy-flavin complex, substrate binding, oxygenated
product release and dissociation of NADP+ yielding the oxidized enzyme This sequence can
be short circuited to H20 2 when an oxidizable substrate is not present
Many endogenous nucleophiles contain 1 or more anionic groups Nucleophiles such as these
are not metabolised by this enzyme which suggests a self-preservmg mechanism of the body as
their metabolism would be unfavourable
This is the only known mammalian flavoprotein hydroxylase
Aromatases convert cyclohexanecarboxylic acid containing xenobiotics to their corresponding
benzoic acid This enzyme is expressed in the liver and kidney For metabolism to occur the
substrate must first be converted to its Coenzyme-A derivative FAD and oxygen are also
required as co-factors
HYDROLYSIS
Nonspecific hydrolysis reactions occur in the blood plasma Specific esterases /amidases
reactions are reserved to the liver Ester and amide hydrolysis reactions release a carboxylic
group, in the case of esters, an alcohol group is released, whereas amides produce an
ammonium group
Esterase can be categorized into four mam classes
1) arylesterases - which act mainly on aromatic esters
2) carboxylesterases - which hydrolyse aliphatic esters
13
3) acetylesterases where the acid m the ester is acetic acid and
4) cholinesterases - where the alcohol in the ester is choline
HYDRATION
A large number of xenobiotics, such as esters, amides and substituted phosphates that are
composed of ester-type bonds, are susceptible to hydrolysis The precarcmogemc polycyclic
hydrocarbon epoxides in particular undergo this reaction forming trans-diol compounds e g
benzo[a]pyrene
OTHER REACTIONS OF PHASE I INVOLVED IN DRUG METABOLISM
Reaction ExampleRing cyclization ProguamlTV-Carboxylation Toxamide
Dimerization N-OH-2-AcetylaminofluroeneTransamidation PropiramIsomerization a-MethylQuroene-2-acetic acid
Decarboxylation L-DopaDethiacetylation Spironolactone
Some of these Phase I enzymes are primarily involved in endogenous metabolism
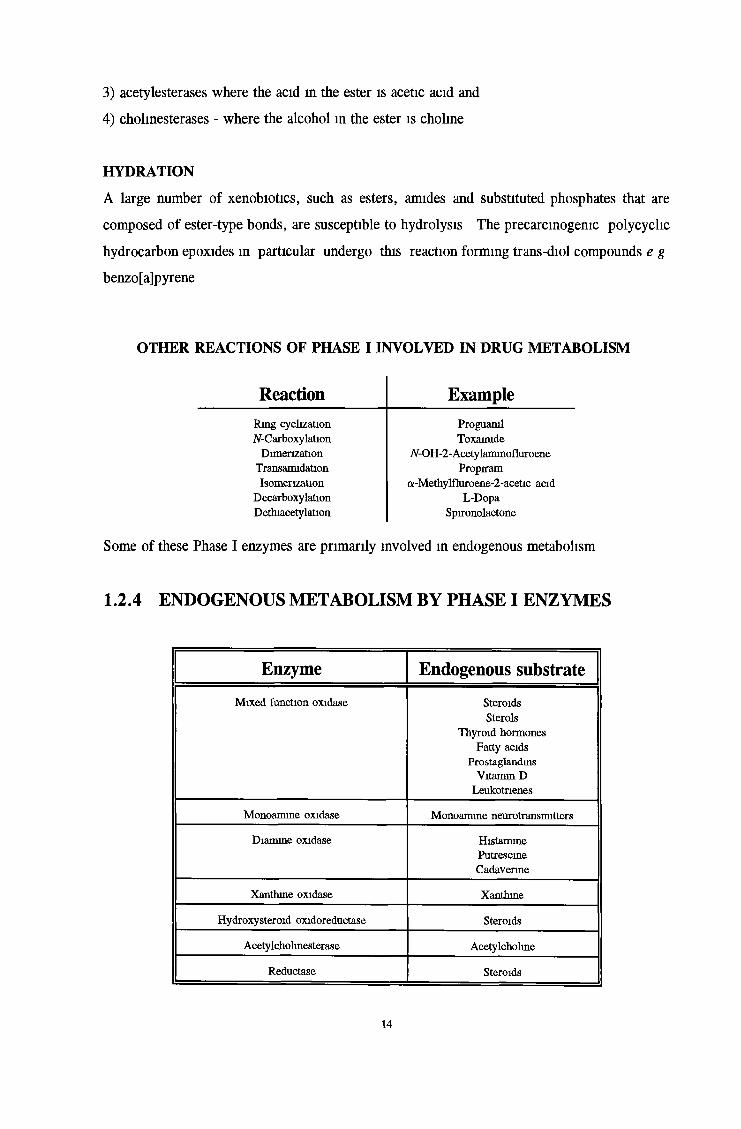
1.2.4 ENDOGENOUS METABOLISM BY PHASE I ENZYMES
Enzyme Endogenous substrate
Mixed function oxidase Steroids Sterols
Thyroid hormones Fatty acids
Prostaglandins Vitamin D
LeukotnenesMonoamine oxidase Monoamine neurotransmitters
Diamine oxidase HistaminePutrescmeCadavenne
Xanthine oxidase XanthineHydroxysteroid oxidoreductase Steroids
Acetylcholinesterase AcetylcholineReductase Steroids
14
PROSTAGLANDIN SYNTHETASE DEPENDENT CO-OXIDATION OF DRUGS
Prostaglandin synthetase is present in most mammalian cell types
This enzyme catalyses the formation of prostaglandins from arachidomc acid (AA) via a two
step pathway functioning as both a fatty acid cyclooxygenase to form prostaglandin G2 and a
hydroperoxidase, reducing prostaglandin G2 to form prostaglandin H2 Many xenobiotics and
drugs are co-oxidized during the prostaglandin specific hydroperoxidase action of this enzymes
The mechanism of this reaction is unknown but it is believed in the case of paracetamol to
involve a 1-electron oxidation followed by the formation of a quinone radical which can either
reacts with glutathione, or is reduced along with glutathione to reform paracetamol (Gibson and
Skett 1986) Compounds like aminopyrme, benzphetamine, oxyphenbutazone, paracetamol and
chemical carcinogens like benzo[a]pyrene etc are metabolised by this pathway The overall
contribution of this co-oxidation to the elimination of these compounds is not known
NON-P450 DEPENDENT REDUCTIVE METABOLISM
This form of reductive metabolism takes place using cytochrome b5 as the transducer and
NADH + H Substrates like epoxides, heterocyclic azo and Nitro compounds, and
halogenated hydrocarbons utilize this pathway Reduction can convert some epoxides back to
their original compounds e g benzo[a]-anthracene-8,9-epoxide to benzanthracene
EPOXIDE HYDROXYLASE
This enzyme is found in almost all tissues investigated, with highest concentrations found m the
liver endoplasmic reticulum, nuclear membrane and cytosol This is a> monomeric protein
composed of units of MW 48,000-54,000 daltons Epoxide hyroxylase contains no flavin It
is inducible by a variety of hepatocarcinogens, barbiturates and fluorenes e g DEN an
alkylmtrosamine elevates the mRNA levels of microsomal epoxide hydroxylase (Kondo, et a l ,
1990)
Epoxides formed by the microsomal mixed function oxidase system follow a number of paths
in the body
l) in vivo nonenzymic rearrangement to phenols
n) irreversible binding to nucleic acids and phenols
111) glutathione conjugation
iv ) enzymic hydration to dihydrodiol or further oxidation to diol epoxide
Epoxides are reactive electrophilic species
15

Epoxides hydratase catalyses the nucleophilic attack of water on one of the two electron
deficient carbon atoms of the oxirane ring, a reaction which is sterio specific and regio
selective Epoxide Hydroxylase plays a major role in the activation of compounds to their toxic
metabolites This enzyme is also believed to be a pre-neoplastic antigen and as such an early
cancer marker (Sipes et a l , 1985) This protein in rat nodules and cancer cells is believed to
be effected by constitutive internal stimuli associated with cell growth (Kondo et a l , 1990)
16
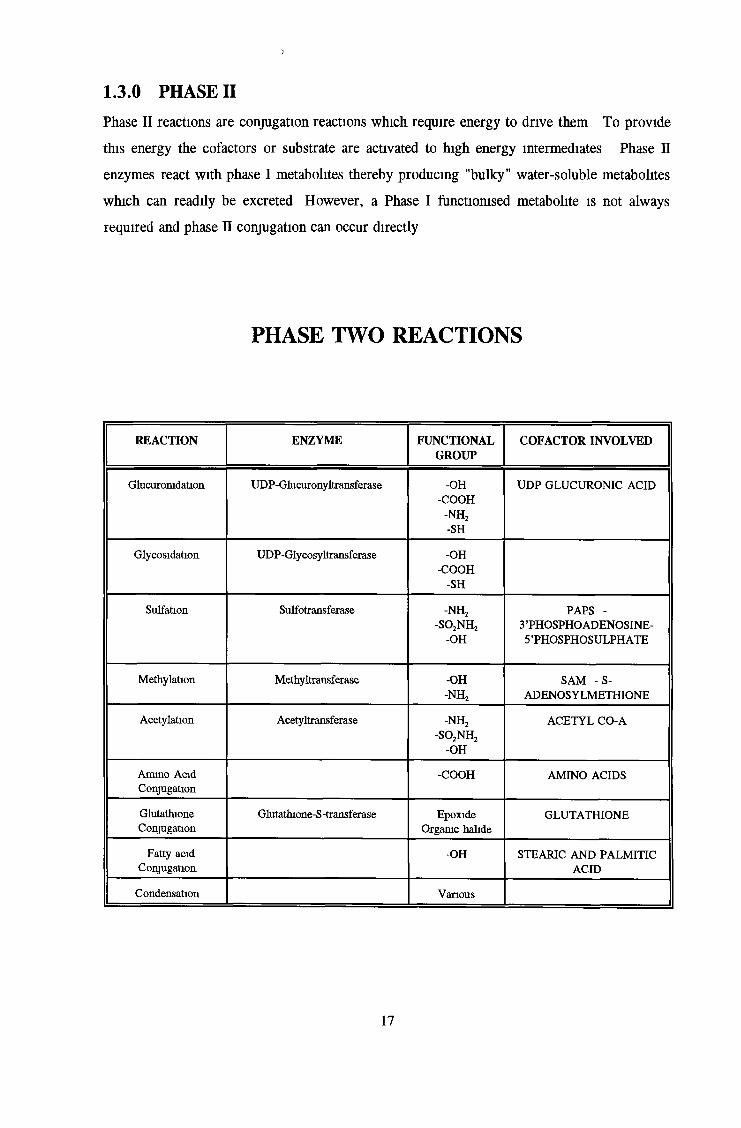
Phase II reactions are conjugation reactions which require energy to drive them To provide
this energy the cofactors or substrate are activated to high energy intermediates Phase II
enzymes react with phase I metabolites thereby producing "bulky" water-soluble metabolites
which can readily be excreted However, a Phase I functiomsed metabolite is not always
required and phase II conjugation can occur directly
1.3.0 PHASE II
PHASE TWO REACTIONS
REACTION ENZYME FUNCTIONALGROUP
COFACTOR INVOLVED
Glucuromdation UDP-Glucuronyltransferase -OH-COOH
-n h 2-SH
UDP GLUCURONIC ACID
Glycosidation UDP-Glycosyltransferase -OH-COOH
-SHSulfation Sulfotransferase -n h 2
-so 2n h 2-OH
PAPS - 3 ’PHOSPHO ADENOSINE- 5 ’PHOSPHOSULPH ATE
Méthylation Methyltransferase -OH-n h 2
SAM -S - ADENOSYLMETHIONE
Acétylation Acetyltransferase -n h 2-so 2n h 2
-o h
ACETYL CO-A
Ammo Acid Conjugation
-COOH AMINO ACIDS
GlutathioneConjugation
Glutathione-S-transferase Epoxide Organic halide
GLUTATHIONE
Fatty acid Conjugation
-OH STEARIC AND PALMITIC ACID
Condensation Various
17
1.3.1 GLUCURONIDATION: CONJUGATION WITH SUGARS
Glucuromdation is the conjugation of a compound with the co-factor UDP-glucuromc acid
which is a product of intermediary metabolism This reaction is carried out on both endogenous
and exogenous compounds by the isoenzymes UDP-glucuronosyltransferases and is one of the
major conjugation reactions in drug metabolism The resulting glucuromdes are then
transported from the cell and ekmmated from the body in the normal manner
These enzymes are expressed in many species and have a broad range of substrates This
quality makes conjugation with glucuronic acid an important conjugation reaction
Glucuromdation conjugates alcohols, phenols, hydroxylamines, carboxylic acids, amines,
sulfonamides and thiols
These isoenzymes are glycoproteins which range m molecular weight between 50,000-60,000
daltons They are endoplasmic-reticulum and nuclear envelope-bound, which allows for closer
association with phase 1 metabolites Substrate specificity varies from isoform to isoform, with
some displaying activity toward a single compound and others having a broad substrate band
(Burchell, 1991) The liver is the most important tissue with regard to UDP-
glucuronosyltransferase activity, but activity has also been noted in the kidney, intestine, skin,
brain and spleen Due to their membrane orientation these transferases demonstrate latency on
examination i e the enzyme requires activation e g freeze thawing before it will demonstrate
its full activity They are believed to be transmembrane molecules, consisting of four domains
A) a conserved UDP-glucuromc acid binding site, B) a variable substrate binding region, C)
a conserved NH3 terminal and D) a transmembrane anchor Catalysis is believed to take place
on the lumen side of the endoplasmic reticulum i e behind a membrane It is this membrane
barrier which may explain the latency of this enzyme in vitro (Burchell, 1991) As already
mentioned in connection with P450, with deactivation, there is also often activation The
susceptibility of certain glucuromdes to enzymatic and chemical degradation makes them ideal
candidates to transport potentially reactive compounds from the liver to the target tissue For
example iV-glucuromdes of TV-hydroxy-arlyammes have been implicated in bladder cancer,
compounds kke 2-naphthylamine, 4-ammo-biphenyl, and related compounds which, having
reached the bladder are unstable m the acidic environment and are thus hydrolysed to their
unstable carcinogenic iV-hydroxylamine (Sipes et a l , 1986)
Comparable to the P450 superfamily, the UDPGT superfamily is subject to induction by the
same PAH inducers i e via the Ah receptor
18
This induction ties m with the observation that cells appear to respond to the presence of a given
toxin by inducing a battery of enzymes involved in the metabolism of that compound in this
case e g PAH However, these enzymes also display antioxidant induction, a phenomenon
not observed in P450 This induction is mediated through ARE (antioxidant responsive
elements) identical to those upstream of the GST Ya subunit (Bock, 1991) There are four mam
classes of glucuromde conjugates
1) O-Glucuronides
Formed from phenols, alcohols, and carboxylic acids The carboxylic acids form ester
glucuromdes and the phenols and alcohols form ether glucuronides During these reactions
the a-glucuromc acid is inverted to the j8-glucuromde /J-glucuromdes which are excreted into
the intestine become substrates for the /3-glucuronidases which hydrolyse the conjugate back
to its original compound As a result of this hydrolysis the plasma half kfe of some drugs is
increased
u) N-Glucuronides
Formed from amines (usually aromatic, and some tertiary) amides and sulphonamides
Some N-glucuromdes form spontaneously i e they do not need the presence of an enzyme
iii) S-GIucuronides
Thiols which react with UDPGA in the presence of UDP-gluconyltransferase forming
S-Glucuronides
iv ) C-Glucuromdes
Direct attachment of UDPGA to the carbon skeleton has also been observed Most species use
UDPGA conjugation as their major conjugation sugar, with the exception of Insects where
glucose is employed more readily The reactions and products are analogous with UDP-glucose
being the conjugate rather than UDPGA UDP-glucose reactions have also been seen in plants
and mammals to a small extent UDP-xylose and UDP-nbose also contribute to conjugation
N-ribosides are the most prevalent and may be spontaneous, but O-xylosides need the
involvement of a microsomal transferase
19
1.3.2 SULPHOTRANSFERASES
Sulphation is the major conjugation pathway chosen by phenols, and aliphatic alcohols and
amines Thiols also use this pathway but only to a small extent The sulfotransferases are
found m the cytosol of liver, kidney, intestinal tract and lungs Their primary function is to
transfer inorganic sulfate to hydroxyl groups present to it Many low-molecular-weight
endogenous compounds e g catecholamine, hydroxy steroids, and bile acids are conjugated in
this way
Where as UDPGA is the active donor in glucuromdation, PAPS is the active donor m sulfation
i e 3’-phosphoadenosine- 5’-phosphosulfate This cofactor is synthesized from inorganic
sulfate and ATP m a two stage process in the cell cytosol
There are many different sulphotransferases isoenzymes e g phenol-, alcohol-, steroid-, and
arylamine-sulphotransferase With the exception of those involved in steroid metabolism
sulphotransferases are relatively non-specific and vary in activity due to the age and sex of the
animal in question In general sulphate conjugation predominates at low substrate
concentration and glucuromdation at high concentration due to substrate inhibition of the
transferases (Sipes et a l , 1986, Gibson and Skett, 1986)
1.3.3 METHYLTRANSFERASE
This reaction is mainly involved in endogenous metabolism However, some exogenous
compounds are conjugated by non-specific methyltransferases, in lung and by the physiological
methyltransferases
The nature of the methyltransferase reaction is similar again to that of other conjugation
reactions, in that the methyl group is transferred to the xenobiotic from a high-energy cofactor,
S-adenosylmethiomne or SAM
Methylation differs from most other conjugation reactions m that it can lead to the masking of
functional groups, reducing their water solubility and preventing further conjugation and
reducing their ability to be excreted This property can lead to the reprecipitation of the
compound thereby increasing its exposure time
20
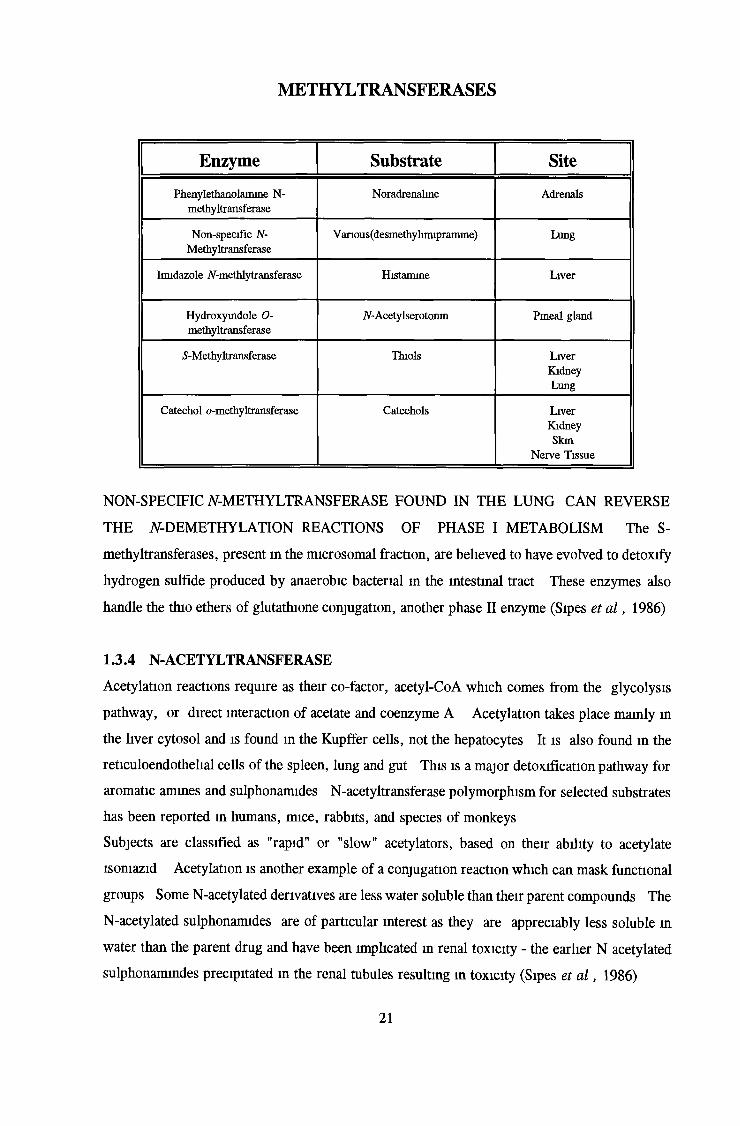
METHYLTRANSFERASES
Enzyme Substrate Site
Phenylethanolamine N- methyltransferase
Noradrenaline Adrenals
Non-specific N- Methyltransferase
V anous(desmethylimiprarmne) Lung
Imidazole /V-methlytransferase Histamine Liver
Hydroxyindole 0- methyltransferase
iV-Acetylserotonin Pineal gland
S-Methyltransferase Thiols LiverKidneyLung
Catechol o-methyltransferase Catechols Liver Kidney Skin
Nerve Tissue
NON-SPECIFIC Af-METHYLTRANSFERASE FOUND IN THE LUNG CAN REVERSE
THE iV-DEMETHYLATION REACTIONS OF PHASE I METABOLISM The S-
methyltransferases, present in the microsomal fraction, are believed to have evolved to detoxify
hydrogen sulfide produced by anaerobic bacterial m the intestinal tract These enzymes also
handle the thio ethers of glutathione conjugation, another phase II enzyme (Sipes et a l , 1986)
1.3.4 N-ACETYLTRANSFERASE
Acetylation reactions require as their co-factor, acetyl-CoA which comes from the glycolysis
pathway, or direct interaction of acetate and coenzyme A Acetylation takes place mainly in
the liver cytosol and is found in the Kupffer cells, not the hepatocytes It is also found in the
reticuloendothelial cells of the spleen, lung and gut This is a major detoxification pathway for
aromatic amines and sulphonamides N-acetyltransferase polymorphism for selected substrates
has been reported in humans, mice, rabbits, and species of monkeys
Subjects are classified as "rapid" or "slow" acetylators, based on their ability to acetylate
isoniazid Acetylation is another example of a conjugation reaction which can mask functional
groups Some N-acetylated derivatives are less water soluble than their parent compounds The
N-acetylated sulphonamides are of particular interest as they are appreciably less soluble in
water than the parent drug and have been implicated m renal toxicity - the earlier N acetylated
sulphonamindes precipitated m the renal tubules resulting in toxicity (Sipes et a l , 1986)
21
1.3.5 AMINO ACID CONJUGATION
Ammo acid conjugation is a specialized form of N-acylation, where the drug and not the
endogenous co-factor is activated (in this case the amino acid) Glycme, glutamine, ornithine,
arginine and taurine are usually involved as follows,
R-COOH + A T P > R-CO-AMP + PPi
R-CO-AMP + CoASH > R-CO-S-CoA + AMP
R-CO-S-CoA + R’-NH2 -> R-CO-NH-R’ + CoASH
The ammo acid chosen for conjugation is related to the intermediary metabolism of the species
i e Ureotelic animals (those that excrete urea) tend to use glycme, and uricotelic species
(those that excrete uric acid) use ornithine This pathway displays a high affinity for substrate,
but a low capacity As the pathway is saturated by substrate other mechanisms are employed
e g methylation etc (Sipes et a l , 1986)
1.3.6 GLUTATHIONE CONJUGATION
Glutathione is a tripeptide made up of glutamate, cysteine and glycme The function of this
molecule is to conjugate with electrophilic compounds which may be harmful to the body
Many of the drugs metabolized by the Phase I enzymes result m strong electrophiles These
metabolites then react with glutathione to form, in most instances, non-toxic conjugates
The list of compounds which are conjugated with glutathione includes
HaloalkanesEpoxidesNitroalkanesAlkenesAromatic Halo-Aromatic Nitro- Compounds
Glutathione-S-transferases the family of enzymes responsible for these conjugation reactions,
are located in the cytosol of liver, kidney, gut and other tissues They consist of three classes
of isoenzymes with differing substrate specificity See section 1 6 0, for more information on
Glutathione-S-Transferase
22
1.3.7 FATTY ACID CONJUGATION
The fatty acids involved in this process are stearic and palmitic acid These enzymes are
situated in the liver microsomal fraction Little is known about this mechanism, except that it
has been implicated in the metabolism of 11-hydroxy-delta 9 tetrahydrocannabinol (Gibson and
Skett, 1986)
1.3.8 CONDENSATION REACTIONS
Condensation reactions have been observed with amines and aldehydes, eg dopamine These
reactions are important from the point of view that condensation of e g dopamine results in
the alkaloid tetrahydropapaveroline, a potent dopamine antagonist However, it remains to be
proven whether these reactions are mediated enzymatically or if they are purely chemical
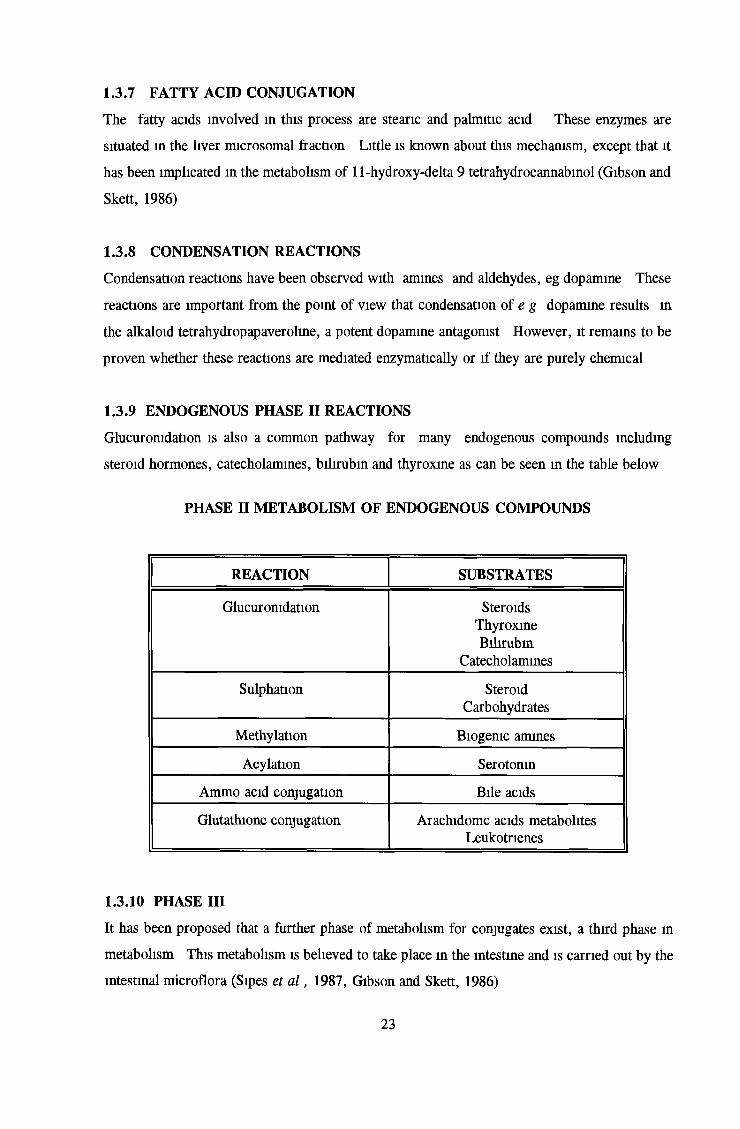
1.3.9 ENDOGENOUS PHASE II REACTIONS
Glucuronidation is also a common pathway for many endogenous compounds including
steroid hormones, catecholamines, bilirubin and thyroxine as can be seen in the table below
PHASE II METABOLISM OF ENDOGENOUS COMPOUNDS
REACTION SUBSTRATES
Glucuronidation SteroidsThyroxineBilirubin
Catecholamines
Sulphation SteroidCarbohydrates
Méthylation Biogenic amines
Acylation Serotonin
Ammo acid conjugation Bile acids
Glutathione conjugation Arachidomc acids metabolites Leukotrienes
1.3.10 PHASE III
It has been proposed that a further phase of metabolism for conjugates exist, a third phase in
metabolism This metabolism is believed to take place in the intestine and is carried out by the
intestinal microflora (Sipes et a l , 1987, Gibson and Skett, 1986)
23

SUMMARY
The ultimate action of the phase I battery of enzymes is to expose -OH, -COOH, -NH2 and -SH
moieties on lipophilic xenobiotics This action results in increased polarity of these molecules
and makes them ideal substrates for the phase II enzyme system These enzyme have broad
substrate overlap capabilities Unlike many of the Phase I metabolites, Phase II metabolites
have no common link Their one common feature is the requirement for an energy-rich
’activated’ intermediate i e co-factors like UDPGA, PAPS, SAM, Acetyl-CoA, or an
activated drug m the case of ammo acid conjugation Phase II metabolites are usually more
water soluble and more readily excreted
24
1.4.0 INDUCTION OF THE XENOBIOTIC METABOLIZING
ENZYME SYSTEM
The induction of xenobiotic metabolism was originally observed (before the discovery of
cytochrome P450) in rats which had been chronically dosed with barbiturates It was observed
that the sleeping time of pre-dosed animals was reduced by half in comparison to animals
which were not pre-dosed Reduction in the carcinogenicity of the amino-azo dyes when
administered together with 3-Methylcholanthrene (MC) was also noted The effect of these
compounds was recognized to be of importance, due to the fact that biological responses were
altered by their presence
After the discovery of cytochrome P450 in the early 60s (Omura and Sato, 1964) further
analysis of this phenomenon in the presence of PB (phenobarbital) demonstrated that the
concentration of cytochrome P450 and most importantly P450 associated enzymatic activity,
increased two to three fold (Nebert & Gonzalez, 1987) Later studies using a number of other
inducers e g 3-MC, also demonstrated increases in P450 In some cases the characteristic
cytochrome P450 carbon monoxide spectral peak at 450nm was observed to shift from 450
to 448nm This observation indicated that a single protein/mechanism was not involved, but
probably a number of proteins and mechanisms, which has shown to be the case
1.4.1 MECHANISMS OF INDUCTION.
A number of modes of induction have been documented to date They are increased
transcription of mRNA, increased stabilization of mRNA, increased protein
synthesis/mRNA translation, and increased protein stabilization The early work in this area
was mainly carried out on the PB and 3-MC-like inducers At least five inducer categories
are known, e g polycyclic aromatic compounds (PAH), phenobarbital (PB), glucocorticoids,
ethanol, and peroxisome proliferators Not all P450s are inducible and not all members of the
same P450 family are necessarily inducible Many of these inducers have been reported to
aid their own elimination by inducing those P450 enzymes responsible for their metabolism,
e g Polycyclic hydrocarbons, some of which also induce the phase II conjugating enzymes
which completes their metabolism (Coon et a l , 1992) Often the phase I enzymes are induced
to a greater extent than the phase II, which can lead to an increased concentration of reactive
intermediates awaiting conjugation In some instances this may not be of benefit to the cell
Induction is not an exclusively mammalian trait and has been reported in other species
25
1.4.2 GENERAL MECHANISM OF INDUCTION for P450.
No single mechanism accounts for P450 induction, not even within any single major inducer
category Every stage from transcription-elongation through to incorporation of the haem
molecule into P450 protein is subject to regulation The combined effects of these stages leads
to increased enzyme activity (Okey, 1990)
Not all inductions draw the same cellular response, but de novo protein synthesis is required
for there to be true induction, not simply activation of an already present inactive enzyme
In order for de novo protein synthesis to occur there must be increased levels of mRNA coding
for functional protein
There are some methods of induction which do not involve increased transcription,
however the steady state mRNA levels are altered (Conney, 1967) Other systems concentrate
at the post transcriptional level, increasing the stabilization of the current mRNA and on the
stability of the protein
The haem moiety also plays a role in regulating induction at the post transcriptional level As
drug induced P450 apoprotein incorporates haem into new P450, the haem pool is reduced
This reduction results in increases expression of 5-amino-levulmate synthase (responsible for
the first step m haem synthesis) thereby allowing the haem supply to keep pace with its
utilization (Okey, 1990)
1.4.3 SITES OF INDUCTION
The majority of research to date has been carried out using liver derived cell lines and
hepatocytes However, induction does occur to some extent in every mammahan tissue studied
(Okey, 1990)
1.4.4 RECEPTOR MEDIATED INDUCTION - PAH:
The most extensively studied receptor-mediated method of induction is that seen m the P450IA
family - the induction of CYP1A1 - see section 1 5 1 2 - Genetic regulation
1.4.5 PHENOBARBITAL LIKE INDUCTION:
Phenobarbital and phenobarbital-like inducers work in liver more so than in extra-hepatic tissue
Induction by this category results in an overall increase in P450 levels and smooth endoplasmic
reticulum (Remmer & Merker, 1983) The mam family of enzymes effected are the cytochrome
P450IIB family, IIC6 and IIIA1 As is the case with the receptor mediated induction,
phenobarbital induction also requires de novo protein synthesis
26
However, unlike the receptor mediated induction pathway, a mechanism or mode of recognition
for this induction has not yet been discovered This is mainly due to the fact that there are, in
addition to phenobarbital, a number of phenobarbital-like inducers All these compounds have
different structures, making a common receptor hard to envisage Further hampering the
investigations is the low level of response to induction by all these compounds, even
phenobarbital itself This weak response makes a model system for study difficult to develop
A potent mducer which gives maximum response has yet to be found
In cell culture, phenobarbital and PB-like compounds have been found to act in an
uncharacteristic manner They have been implicated in the induction of enzymes normally
associated with PAH and PCN/glucocorticoid induction The reason for this behaviour is
unknown, but may be a result of culture conditions (Okey et a l , 1990)
1.4.6 PCN/GLUCOCORTICOID - type induction.
Pregnenalone-16a-carbomtrile (PCN), macrolide antibiotics, antifungal agents, some PB-like
inducers, steroid antagonists, endogenous and synthetic glucocorticoids, produce a spectrum of
induction unlike that of 3MC/PB (Lu et a l , 1972) These compounds induces CYP2A1 gene
by increasing mRNA and by stabilizing current IIA1 proteins However, the catalytic role of
this enzyme has not yet been uncovered It is thought that it may play a role in some steroid
hydroxylation and metabolism of some of its inducers, it may also be involved in the
metabolism of cyclosporin (Kronbach et a l , 7988)
1.4.7 ETHANOL INDUCTION:
Exposure to ethanol increases the rate of oxidation of several drugs as well as oxidation of
ethanol itself (Peterson et a l , 1982) The P450 induced by ethanol is a member of the II
family, IIE1 This family has been reported to be PB inducible, however, IIE1 is not PB
inducible This induction is not via increased mRNA transcription, but by stabilization of
mRNA and protein
Induction of IIE1 has been observed in unchecked diabetic rats, where the ketone level is
increased, this is unusual as drug metabolism normally decreases in diabetes (Bellward et a l ,
1988)
27
1.4.8 MIXED INDUCTION:
There are many examples of compounds that induce P450 overlap i e inducing species
belonging to more than one category or gene family Compounds like PCBs (polychlorinated
biphenyls) along with mono-ortho or di-ortho chlorine substituent are capable of acting both as
PB and 3-MC inducers However the entire complement of induction is not achieved, as some
genes normally induced by one or other of these compounds will not be induced by a mixed
inducer Isosafrole induces P450IA1, IA2, III and IIB2 in rat liver, but will only induce
P450IA2 in mouse
The mechanism of this induction is not mediated via the Ah receptor, but isosafrole has been
reported to bind tightly to IIB2 resulting in the stabilization of this protein
The mducer Aroclor 1254 induces a broad spectrum of drug metabolising enzymes However,
this compound is not made up of one mducer, it is a cocktail of a number of Pb and 3-MC
inducers compiled for maximum effect
1.4.9 THE CONSEQUENCES OF INDUCTION:
There are a number of practical concerns about P450 induction
(1) it may alter the efficiency of clinically administered drugs
(2) it may alter the balance between toxification and detoxification
Patients treated with PB show increased clearance rates for several other unrelated drugs e g
antipyrme, phenytoin, oral contraceptives and warfarin (Park & Breckenridge, 1981) The
severity of this increased clearance and whether an increased clearance may compromise
treatment, depends upon the therapeutic index of the drug in question For example, theI
administration of the anticoagulant warfarin in conjunction with PB, results in a requirement for
increased warfarin concentration due to the accelerated clearance rate of the compounds,
induced by PB When PB administration is stopped, the warfarin metabolism rates return to
their normal levels and the resulting concentrations of warfarin m the bloodstream could result
in fatal haemorrhage
Similar effects have been recorded with phenytoin and PB administration resulting m increased
cyclosporin metabolism (Okey, 1990)
28
1.5.0 THE CYTOCHROME P450 MULTIGENE FAMILY
The P-450 superfamily includes many different genes and their gene products. To date the
superfamily contains more than 80 members and 30 sub-families (Gonzalez, 1992). Individual
P450 protein sequences are very different from each other, apart from a 26-residue region near
the carboxy-terminus of the protein which is essentially conserved (Nebert et al., 1989). This
common denominator suggests a single shared ancestral gene dating back 2 billion years, from
which all P450s diverged, by gene duplication and mutation (Nebert, 1989). The cytochrome
P450 multigene family has evolved a great many new genes in the past 800 million years. This
new development especially in the class II family coincides with the commencement of "animal-
plant warfare". As animals began to ingest plants, the plants developed toxins as a form of self
defence. Under this pressure, animals developed new enzymes to metabolise these toxins as can
be seen in the cytochrome II sub-family. The number of genes present in the sub-families
of particular species seems to be a function of the environment in which the species finds
itself, i. e. the compounds that it comes in contact with and its necessity to metabolise them.
It is also believed to be a function of the generation time i. e. the time which has elapsed
since one species, diverged from another.
Therefore, the human sub-family should not contain identical genes or numbers of sub-families
to other species, in some cases a corresponding human gene may not exist (Nebert et al.,
1989).
As particular P450s become obsolete, the corresponding gene can accumulate mutations and
become inactive. The early stages of gene inactivation can lead to genetic polymorphism, a
major issue in P450-dependent metabolism. This polymorphism can result in clinical difficulties
e.g. in administration of drugs which have low therapeutic indices and in individuals being
resistant or sensitive to environmentally based diseases e.g. cancer (Gonzalez, 1990).
The mammalian P450 superfamily can be subdivided into two classes; those exclusive to
synthesis of steroids and bile acids and those which are involved in metabolism of xenobiotics.
The cytochrome P450 subgene families exclusively involved in steroid metabolism are the
CYP11, 17, 21 and 19. Their sequences are well conserved and display rigid substrate and
product specificities. Mutations in the CYP21A2 gene results in serious birth defects, indicating
the importance of these genes and their conservation (Gonzalez, 1992).
The P450 families I, II and III metabolize drugs and carcinogens, with some steroid
29
metabolism overlap
The P450IV family carries out metabolism of fatty acids and prostaglandins The remaining
genes contribute mainly to steroid metabolism, are expressed m extra-hepatic tissue, or are
expressed in bacteria, yeast or other organisms
1.5.1 NOMENCLATURE
A strict consensus as to the nomenclature of the cytochrome P450 has not evolved until
recently As a result there is confusion as to the classification of the genes and their protein
products For example the Aryl Hydrocarbon Hydroxylase enzyme has been described as
AHH, P-450c, P450form 6, P I-450, CYP1, CYP2, P(l)450, P450DX, Cyp-1, P450C1,
P450C1A1 and CYPIA1 To resolve this identification problem, the following system was
proposed For chromosomal loci, the root symbol is "CYP" for human, and "cyp" for mouse
This is followed by an arable numeral denoting the P450 family, a capital letter for the
subfamily (lowercase for mouse), followed by an Arabic numeral for the specific gene For
the gene product l e the protein, the gene family is represented by Roman numerals
Therefore, referring to the phenobarbital 2B gene family in humans, the correct nomenclature
would by for the gene CKP2B1, and the protein P450IIB1 (Nebert et a l , 1989, Gonzalez,
1990)
As new genes are being discovered constantly and new information about already classified
genes comes to light, regular revision of the nomenclature is essential to avoid confusion
To belong to the same family a protein must be more than 40% homologous to the other genes
of that family For an enzyme to be allocated withm a particular family, it must exhibit
less than 40% homology to genes from any other family There are two exceptions to this
rule 1) The microsomal enzymes of the XI family, see and 11/5, These two proteins are only
37 5 - 38 8% homologous 2) The other exception is the II family, which contains a
subfamily IID which lowers the homology of the family from greater than 41 6% to greater\
than 32 1 % when it is included
When mammalian genes are accounted for alone, sequences within the same subfamily are
greater than 59% homologous However, when other species and allelic variants are included
this value drops to less than 47 %
30
1.5.2 THE IA FAMILY
This sub-family contains two members, P450IA1 and IA2
- ENZYME ACTIVITY:
This family of enzymes is involved in oxidative metabolism of exogenous chemicals e g
polycyclic hydrocarbons, aromatic amines, heterocyclic amines etc Both enzymes have
overlapping specificities, but their shared activities are slower than their specific reactions
The P450IA1 enzyme mainly carries out the metaboksm of PAH (polycyclic hydrocarbons),
noticeably the hydroxylation of benzo[a]pyrene which leads to its carcinogenic metabokte
benzo[a]pyrene-7,8-diol-9,10-epoxide (Pelkonen and Nebert, 1982)
P450IA2’s preferred hydroxylation activity is towards aryl ammes and amides e g
6-naphthylamine and 2-acetamidofluorene (Ikeya et a l , 1989) IA2 also participates in the
metabolism of aromatic ammes, caffeine, oestradiol and certain drugs e g phenacetin (Fisher
e t a l , 1992)
- TISSUE DISTRIBUTION AND INDUCTION.
The P450IA1 enzyme levels are low in both liver and extra-hepatic tissue Enzyme levels are
not uniform in the liver acinus, demonstrating highest levels in the cells surrounding the
terminal hepatic venules and intercalated veins (McKinnon e t a l , 1991) This family possesses
a unique mode of induction by compounds like PAH i e benzo[a]pyrene and 3-
methylcholanthrene (3-MC) IA1 also exhibits a high degree of activity toward these PAH
compounds
IA2 is constitutively expressed in liver and comprises 5% of the total cytochrome i e
mitochondria electron transport etc , in that tissue There is very little expression of this gene
in extra-hepatic tissue It is inducible in liver and to some extent in kidney, lung, spleen,
small intestine, large intestine and foetal tissue, but this induction of enzymic activity is variable
and low except when induced with high levels of TCDD (2,3,7,8-tetrachlorodibenzo-/?-doxm)
Isosafrole is the most potent CYP1A2 gene inducer which is surprising as it is not a 1A1
inducer (Nebert et a l , 1987, Fujii-Kuriyama et a l , 1992)
31
- GENE STRUCTURE:
The CYP1A genes have been assigned to chromosome 9 m the mouse, with the genes lying
in tandem between the Mpi-1 and Pkm-3 loci (Hildebrand et a l , 1985a) and to chromosome
15 in humans 15q22-qter near MPI (Jaiswal et a l , 1985a) Each gene has seven exons and
contains a noncoding first exon (Gonzalez et a l , 1985, Tukey et a l , 1984, Hildebrand et a l ,
1985) The two forms, P450IA1 and IA2, are 75% homologous at the ammo acid level The
human CYP1A1 gene was sequenced and shown to span 6 3 kbp with a 1,569 bp mRNA This
gene has a translation start codon 27 bp into the second exon and is composed of 523 ammo
acid residues with a molecular weight of 59,300 daltons (Yabusaki et a l , 1984, Jaiawal et a l ,
1985b) The CYP1A2 human gene spans 7 8 kb with a 3 3 kbp mRNA, encoding 515 ammo
acids to give a molecular weight of 58,294 daltons (Ikeya et a l , 1989)
Conservation of nucleotides and number of bases between human CYP1A1 and 1A2 in the
regions of exons 2,4,6 and 5 is very strong Comparison of human 1A2 regulatory
upstream exon 1 with that of mouse or rat reveals 68% similarity in the 150 bases 5’ from
the mRNA cap site, 80% similarity between -841 to -758 in human and -1529-1439 m mouse
The pnbnow/canomcal (involved in binding RNA polymerase) 5 bp box (CACGC) which is
found upstream in all mammalian 1A1 genes so far, is believed to interact with the
PAH-receptor complex This region is absent m the 1A2 gene There are however highly
conserved regions in human 1A2 mtron 1 in rat and mouse This conservation possibly indicates
a different location for the regulatory elements of 1A2 (Ikeya et a l , 1989)
- GENETIC REGULATION OF 1A1:
The genetic regulation of the rat CYP1A1 gene is the best characterised of the cytochrome
P450s This regulation consists of at least two different m-acting regulatory DNA sequences,
which are located 5’ upstream of the gene and their associated, trans-acting DNA binding
factors The upstream DNA elements are, The XRE or inducible enhancer xenobiotic
responsive element, is present in multiple copies (up to five) The other element BTE (basal
transcriptional element) is present m only one copy, close to the TATA box (25 bp upstream
of the RNA polymerase II start site) and is concerned with constitutive expression (Fujn-
Kuriyama et a l , 1992) The presence of both elements is required for constitutive and
inductive expression The associated binding proteins are the Ah receptor (section 1 4 0), the
Ah receptor nuclear translocator protein (arnt), both associated with the XRE
32
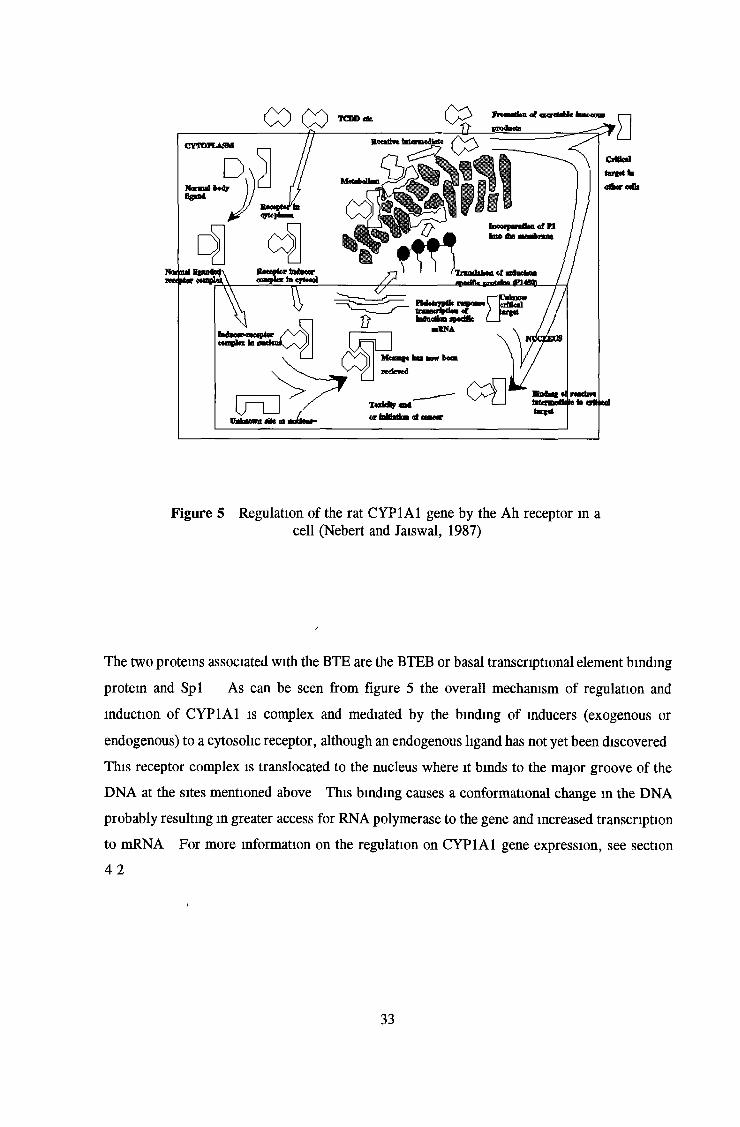
Figure 5 Regulation of the rat CYP1A1 gene by the Ah receptor in a cell (Nebert and Jaiswal, 1987)
The two proteins associated with the BTE are the BTEB or basal transcriptional element binding
protein and Spl As can be seen from figure 5 the overall mechanism of regulation and
induction of CYP1A1 is complex and mediated by the binding of inducers (exogenous or
endogenous) to a cytosolic receptor, although an endogenous ligand has not yet been discovered
This receptor complex is translocated to the nucleus where it binds to the major groove of the
DNA at the sites mentioned above This binding causes a conformational change in the DNA
probably resulting in greater access for RNA polymerase to the gene and increased transcription
to mRNA For more information on the regulation on CYP1A1 gene expression, see section
4 2
33
-REGULATION OF CYP1A2:
In contrast to CYP1A1 gene regulation of CYP1A2 is not well known or understood Study
of this regulatory mechanism was hampered until recently by the lack of an expression system
Now, however expression has been achieved in HepG2 and V79 Cells
Induction of CYP1A2 is not always simply a case of increased rates of transcription CYPIA2
mRNA is stabilized by inducer compounds like 3-Methylcholanthrene and TCDD in rat
liver in vivo, and in vitro as seen in rat hepatocytes On the other hand, m mouse liver
transcriptional rates of mRNA are increased by induction Post-transcriptional mechanisms
may be involved, e g mRNA processing, mRNA transport, and mRNA stability MCF-7
(a human breast carcinoma cell line) and HepG2 (a human hepatoma cell line) were negative
when probed for 1A2 activity However following transfection of the full IA2 gene coupled
to CAT activity, the MCF-7 line remained negative whereas HepG2 were now positive This
implies a possible tissue-specific regulatory mechanism, or a specific inhibition in MCF-7
(Jaiswal et a l , 1985c, Tukey et a l , 1988)
It has been reported that hepatic induction of IA2 mRNA occurs at lower TCDD levels
than those required for IA1 induction and that IA2 has been detected in the centrilobular
hepatocytes of untreated "nonresponsive" mice in the absence of IA1 As these genes are
both believed to be regulated by the Ah receptor and lie in tandem, it is hard to explain why
they should respond differently to the same inducer It is possible that the TCDD-Ah
receptor complex may have greater affinity for regulatory regions, as yet unidentified, in the
IA2 gene than for the regulatory regions in the IA1 gene (Tuteja et a l , 1985) since the 5’
flanking region of the CYP1A2 gene appears not to contain the same regulatory sequences as
CYP1A1 gene (Ikeya et a l , 1989) It has also been suggested that the transcriptional factor,
which is sensitive to protein synthesis inhibition and plays an important role in supermduction
of CYP1A1 via the Ah receptor, is not important m 1A2 regulation, this again highlights the
differing modes of regulation of these two family members (Teifeld et a l , 1989)
34
1.5.3 THE CYPIIA SUBFAMILY
The CYP2A gene family in the rat has 3 members, CYP2A1,2A2 and 3A3, coding for 3
proteins There are 2 in the human family closely associated with the rat CYP2A3 which are
CYP2A6 and 2A7 There is one mouse gene, encoding two proteins, also associated with
CYP2A3
- ENZYME ACTIVITY:
The P450IIA1 protein in rat (al), is associated with hydroxylation of testosterone at the l a
and the 6a position, the latter being the less potent of the two reactions IIA2 (a2) also
metabolises testosterone, but to a lesser extent
In the mouse the corresponding IIA subfamily - type I and type II carry out testosterone
15a-hydroxylation (Gonzalez 1990)
The two human partial cDNAs have been isolated to date CYP2A6 is believed to be
synonymous with the rat IIA3 protein, and carries out the metabolism of Coumarin and
diethylmtrosamine Little is known about the P450IIA7 protein (Gonzalez, 1992)
- TISSUE DISTRIBUTION AND INDUCTION:
Both P450IIA1 and IIA2 are expressed only m the liver, where as IIA3 m rat is expressed only
in lung The CYP2A1 gene in rats is expressed in immature male and female, but is absent
m male rats at puberty P450IIA2 is expressed only in males at the onset of puberty
Control of these developmental and sex specific expressions is carried out by hormones of the
pituitary gland, the exact regulation of these genes has not yet been identified (Gonzalez 1990)
P450IIA1 and IIA3 are induced by 3-Methylcholanthrene (MC) where as IIA2 is not
The mouse IIA genes type I and type II and are expressed in kidney and liver
Type I is expressed in male mice and type II in female kidney (Gonzalez, 1990) To date the
human forms have only been found to be present in the liver (Gonzalez 1992)
- GENE STRUCTURE:
In the rat CYP2A1 and 2A2 genes have been isolated and sequenced They exhibit an 88%
degree of homology and have 9 exons The third gene CYP2A3 has been sequenced and
expresses 71 % and 73% homology with 2A1 and 2A2 respectively This suggests that 2A1
and 2A2 diverged at a later date than 2A3 The mouse 2A gene subfamily contains two genes
which have been assigned to chromosome 7
35
The two mouse genes, type I and type II, are 98% homologous to each other, 90%
homologous to CYP2A3 and 70% and 75% similar to CYPA1 and CYPA2 respectively
Types I and II are expressed in the liver and kidney, where as IIA3 is found only in lung
(Gonzalez 1990)
In humans this subfamily has been located on the long arm of chromosome 19 The human
CYP2A7 gene displays 85% homology to rat 2A3, 69% homology with 2A1 and 65% with
2A2 (Miles et a l , 1989, Yamano et a l , 1989) The regulation of these genes has yet to be
decided
1.5.4 THE P450IIB SUBFAMILY
The P4502B subfamily of genes has been isolated in man, mouse and rabbit In the rat this
subfamily contains three forms CYP2B1 (b), 2B2 (e) and 2B3 In the rabbit there are 2 forms,
CYP2B5, IIB4 and its pseudogene CYP2B4p The human subfamily contains three forms,
CYP2B6, 2B7 and 2B8, and the mouse subfamily contains 2B9 and 2B10
- ENZYME ACTIVITY:
The IIB family of enzymes demonstrate broad substrate overlap carrying out the following
reactions, O-dealkylation of 7-pentoxyresorufm, benzphetamine Af-demethylation, aflatoxin B1
metabolism, cyclohexane oxidation, chloroethylnitrosourea hydroxylation, oestradiol-2
hydroxylase, ammopyrene demethylation, 7-ethoxycoumarin demethylation, 4-ipomeanol
activation, /7-xylene activation, parathion oxidation, pentoxy-resorufin metabolism, and 1-
mropropane denitrification (Wolf et a l , 1990, Platt et a l , 1989) The P450IIB1 in rats
demonstrated 2-10 times the activity of IIB2 in these reactions Rat IIB1 has also been reported
to selectively carry out the stereospecific D-ring hydroxylation of the steroids, androstenedione
and testosterone (Waxman et a l , 1989) IIB1 is also reported to activate aflatoxin B, to its
mutagenic form, N-methyl-A^’-nitro-N-nitrosoguamdine (Doehmer et a l , 1988) IIB1 also
activates the anticancer agent cyclophosphamide to its toxic anti-tumor form and also activates
rfosfamide to its mutagenic form
The human form P450IIB6 also carries out the activation of the anticancer agent
cyclophosphamide to its anti-tumongemc form 4-hydroperoxycyclophosphamide (Gonzalez
1992)
36
- TISSUE DISTRIBUTION:
The rat P450IIB1 is constitutively expressed in lung and testis and only inducible by
phénobarbital in the liver P450IIB2 is constitutive in the small intestine and liver, but
this activity cannot be induced in that tissue, suggesting that these genes have different control
mechanisms P450IIB3 is constitutively expressed and is not inducible
The human forms IIB6 and IIB7 are expressed m the liver and lung respectively P4502B8 is
expressed in liver and intestine (Gonzalez 1990)
- GENE STRUCTURE:
The rat CYP2B1 and 2B2 genes contain nine exons These genes are located on chromosome
19cen-ql3 3 in humans and Proximal 7 (Coh) in mice
CYP2B1 and 2B2 genes display 97% homology in the rat CYP2B3 is 77% homologous to
both 2B1 and 2B2, implying that 2B3 diverged from the root gene of 2B1 and 2B2
In the rabbit the two CYP2B genes recorded exhibit 95% homology Expression of several other
rabbit 2B cDNA’s has been reported, but these have not been fully studied and may be allelic
variants (Gonzalez 1990)
- GENE REGULATION:
Induction of enzyme activity by phénobarbital is via the activation of transcription (Okey 1990)
It has been reported that thyroid and pituitary and especially growth hormone (GH), suppress
the constitutive and phénobarbital induced expression of the rat CYP2B1 and 2B2 proteins The
levels of both CYP2B mRNAs are suppressed by the presence of GH
However thyroid hormone has a differential effect on the suppression of P450IIB1 and IIB2
Suppression of P450IIB1 by TH is not as strong as that of GH whereas P450IIB2 demonstrates
equal levels of inhibition by both GH and TH Simultaneous induction of GH and phénobarbital
results m similar suppression profiles However, pretreatment with TH is required before
addition of PB to witness this TH mediated suppression This TH suppression only can be
reversed by addition of cycloheximide suggesting de novo synthesis of a repressor protein
(Yamazoe et a l , 1987, Murayama et a l , 1991) (see section 1 4 0 )
37
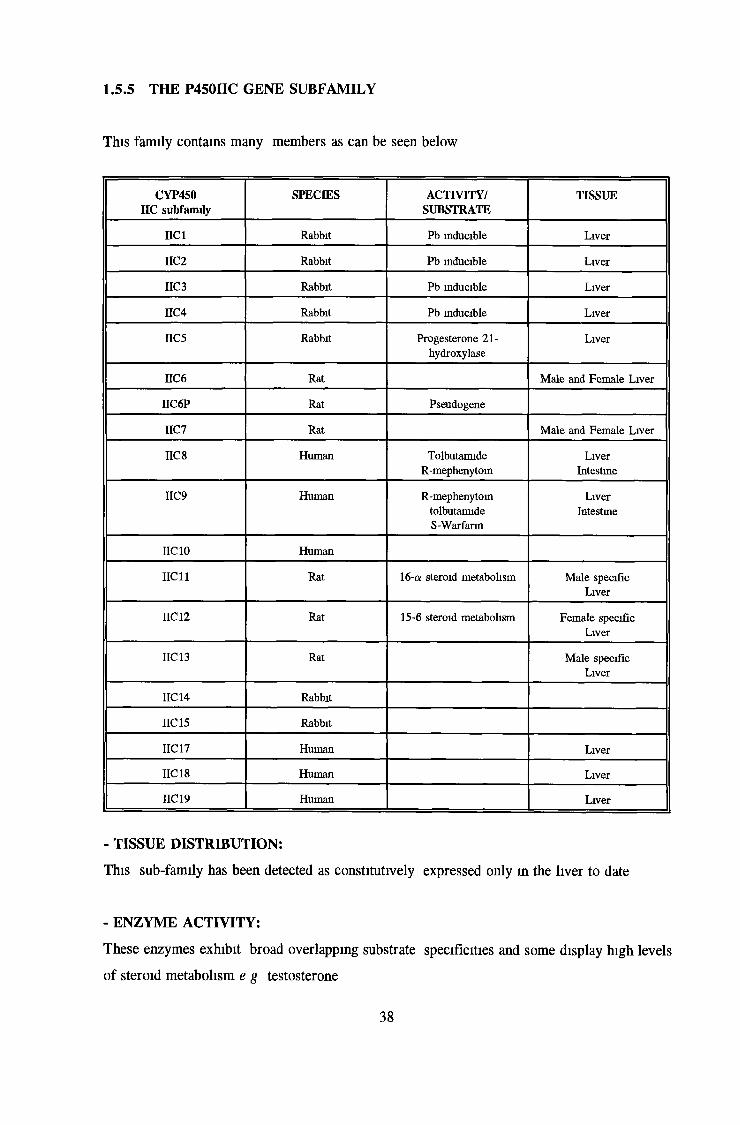
1.5.5 THE P450IIC GENE SUBFAMILY
This family contains many members as can be seen below
CYP450 IIC subfamily
SPECIES ACTIVITY/SUBSTRATE
TISSUE
IIC1 Rabbit Pb inducible LiverIIC2 Rabbit Pb inducible LiverIIC 3 Rabbit Pb inducible LiverIIC4 Rabbit Pb inducible LiverIIC5 Rabbit Progesterone 21-
hydroxylaseLiver
IIC6 Rat Male and Female LiverIIC6P Rat PseudogeneIIC7 Rat Male and Female LiverIIC 8 Human Tolbutamide
R-mephenytoinLiver
IntestineIIC9 Human R-mephenytoin
tolbutamideS-Warfann
LiverIntestine
IIC10 HumanIIC 11 Rat 16-a steroid metabolism Male specific
LiverIIC 12 Rat 15-6 steroid metabolism Female specific
LiverIIC13 Rat Male specific
LiverIIC 14 RabbitIIC 15 RabbitIIC 17 Human LiverIIC18 Human LiverIIC19 Human Liver
- TISSUE DISTRIBUTION:
This sub-family has been detected as constitutively expressed only in the liver to date
- ENZYME ACTIVITY:
These enzymes exhibit broad overlapping substrate specificities and some display high levels
of steroid metabolism e g testosterone
38
They also as a group carry out the metabolism of benzo[a]pyrene, benzphetamin demethylation,
aflatoxin B1 activation, tiemhc metabolism, 2-hydroxylation of oestradiol and progesterone,
dimethylbenzanthracene activation, warfarin 7-hydroxylation and tnacetyloleandomycin
metabolism (Wolf et a l , 1990)
In the rat there are two adult male-specific P450s IIC13 and IIC11, a female specific IIC12
and two which are nonspecific IIC6 and IIC7
The rabbit expresses seven genes in total, 4 of which are phenobarbital inducible enzymes P450
2C 1, 2, 3 and 4 (see table on previous page) The three remaining rabbit forms are IIC5, (a
progesterone 21-hydroxylase) and two others, IIC 14 and IIC 15 These enzymes carry out
aminopyrene, ethylmorphine and chlorcyclizine metabolism
Human liver expresses two enzymes P450IIC8 and IIC9, these enzymes catalyze the
hydroxylation of S-mephenytion and S-warfarin Metabolism of this latter anticoagulant is
deficient in some individuals i e P450IIC9 is polymorphic in some people and is therefore of
clinical importance These human enzymes also carry out mrvanol metabolism, benzphetamine
demethylation, tolbutamide, hexobarbital, ethotoin mephobarbital, methsuzimide and
phensuximid metabolism
- GENE STRUCTURE:
The CYP2C subfamily is made up of 9 exons The gene cluster, has been located on
chromosome 10 10q24 1-24 3 in man and on chromosome 19 in mice In the rat these
enzymes are under developmental and sex-specific control, however this is not the case in
humans (Gonzalez 1990)
-GENETIC REGULATION:
Regulation of the CYP2C genes is complex, as can be seen in the rat The CYP2C6 and the
2C7 genes are only activated at puberty in the rat The 2C11 and 2C12 genes are controlled
by testosterone levels to a degree, but this has no effect on the rat CYP2C6 and 2C7
CYP2C11 is expressed in mature male rats, only when they have been exposed to
testosterone during the neonatal period (Waxman et a l , 1985)
CYPIIC12 expression is effected partially by oestradiol Exposure during the neonatal period
to sex-hormones results in development which could be attributed to growth hormone
secretions For example exposure to androgen results in the pattern of growth hormone
secretion as seen in adult males which is pulsatile whereas m females this pattern is constant
(Jansson et a l , 1985)
39
Hypophysectomy (removal of the pituitary gland) of male rats resulted in a loss of IIC11
mRNA, and this was only restored on intermittent i e pulsatile, injection of growth hormone
Constant exposure to growth hormone resulted in increased mRNA levels of the female specific
gene IIC12 Each of these treatments required a 2-6 day period before an effect was seen
suggesting the involvement of an intermediary protein factor to elicit the response This
response may be in the form of mRNA stabilisation (Gonzalez 1990)
1.5.1.6 THE P450IID GENE SUBFAMILY
-ENZYME ACTIVITY AND TISSUE DISTRIBUTION:
In rat and human these enzymes carry out the oxidation of the drugs debrisoquine in the
intestine, bufuralol in the liver and sparteine m the kidney It has been reported that 5-10%
of all CYP2D6 alleles are defective in Caucasians, resulting m the condition called
debrisoquine/sparteine polymorphism, these individuals being poor metabolisers (PMs) of the
debrisoquine molecule This polymorphism is believed to be linked with susceptibility to
leukaemia, bladder and malignant melanoma (Smith et a l , 1991, Wolf 1991) This enzyme
also oxidizes at least 20 other drugs, all basic ammes, including the vasodilator perhexiline
(Guengench 1989)
The human locus also codes for 2 other IID forms, CYP2D7 and 2D8P Both of these genes
lie upstream of 2D6 but are defective and not expressed The 2D6 protein also carries out the
metabolism of a number of clinical cardiovascular and psychiatric drugs e g metroprolol,
despramme, MPTP, codeine etc , (Wolf, 1991)
The mouse CYPIID9 and IID 10 do not carry out debrisoquine metabolism, or share any of the
above mentioned metabolic traits, demonstrating strong species variation However mouse does
exhibit a male specific 16a-testosterone hydroxylase (Gonzalez, 1992)
-GENE STRUCTURE:
To date there are five cytochrome P450 genes identified m this sub-family in rats - CYP2D1,
2, 3, 4 and 5 These genes show 75%-95% homology and lie in tandem on a 60 Kb segment
of DNA The male specific testosterone 16a hydroxylase belongs to this sub-family of
enzymes and exhibits 70-82% homology with the five genes found in rat discussed above
40
The human sub-family IID has three members, two of which lie in tandem on the long arm of
chromosome 22 These genes are 92%-97% homologous and are detectable in only some
human livers This is due to the fact that these genes have potential for non-lethal inactivation
mutations
The human gene CYP2D8 has potential for non-lethal gene-inactivation mutations CYP2D7
contains a base deletion which gives rise to a protein-coding frame shift In liver samples
where debrisquinone metabolism was not detected, the IID6 gene has been found to contain
three distinct mutations (1) partial or complete deletion of the coding sequences, (2) a base pair
deletion at position 2637 in exon 5 which leads to premature termination, and (3) a G-A
transition at the mtron 3/exon 4 junction which results in incorrect splicing of the mRNA
The mouse genes cyp2D9 and 2D 10 have been located on chromosome 15 (Gonzalez 1990)
1.5.7 THE P450IIE GENE SUB-FAMILY
The HE sub-family contains four genes to date, one human CYP2E1 (j), one rat CYP2E1 and
two rabbit CYP2E1 (3 a) and 2E2
-ENZYME ACTIVITY:
The P450IIE1 enzyme is inducible by ethanol and also carries out the metabolism of ethanol,
acetone, acetoacetate, acetol, N-mtrosodimethylamine, paracetamol, and ketone bodies
The human P450IIE1 form also carries out oestradiol and ethinlyloestradiol 2-hydroxylation
(Wolf et a l , 1990) P450IIE1 demethylation of N-mtrosodimethylamine results in metabolites
which may be involved in carcinogenesis P450IIE1 has also been reported to be involved in
the activation of numerous low-molecular weight toxins and carcinogens e g /V-mtrosammes,
benzene, and urethane (Gonzalez, 1992, Kato et a l , 1992)
-TISSUE DISTRIBUTION:
P450IIE1 is constitutively expressed in the human liver where its expression is influenced by
inducers, many of which are substrates for the enzyme Studies m rodents have also shown
extrahepatic expression especially after induction, noticeably in the leucocytes of uncontrolled
diabetics (Gonzalez 1992)
41
-GENE STRUCTURE:
These genes like all other CYP2 genes have 9 exons They are approximately 10 Kb long The
CYP2E genes have been localized to chromosome 7 in the mouse and chromosome 10 in
humans These genes are among the best conserved P450 isoforms m the CYP2 family
-GENETIC REGULATION
Induction of 2E by ethanol, acetone, pyrazole or methylpyrazole causes an increase in protein
synthesis without increasing mRNA level (Gonzalez 1990) It is believed that increased
stabilization of the protein combined with a decrease in protein turnover accounts for the
overall induction of this enzyme Starvation or diabetes induction does however increase
mRNA levels of HE sub-family in rats How this occurs is unknown Combination of
acetone treatment and starvation in rats resulted in synergistic effect on HE induction
Genetic polymorphisms and racial variation in distribution have been detected with regard to
the CYP2E gene in humans These polymorphisms have been suggested to be linked with
increased susceptibility to lung cancer in Caucasians and to gastric or oesophageal cancer among
Japanese (Kato et a l , 1992)
1.5.8 THE P450III FAMILY
The CYPIII family of enzymes was first isolated by induction with the synthetic
glucocorticoid pregnenolone 16a-carbomtrile PCN There are two known forms expressed in
the rat, P450IIIA1 and IIIA2, three forms in human IIIA3, A4, A5 and one known form in
rabbit IIIA6
-TISSUE DISTRIBUTION:
In the rat there are currently known to be two P450III isoforms in the liver They are
P450IIIA1(PCN1, P-450p) which is expressed only on induction with glucocorticoids and
phenobarbital (Okey 1990) P450IIIA2(PCN2) is the constitutively expressed in male rat liver
and transiently expressed in young female rats, this enzyme is not detectable in foetal rats
(Gonzalez et a l , 1986) P450IIIA2 is not inducible by PCN, but mRNA concentrations are
increased in the presence of phenobarbital There are three human adult forms of IIIA family
which are expressed in the liver and one form expressed in fetal liver (Kitada et a l , 1987,
Gonzalez 1992) The human forms are IIIA3(HLp), IIIA4(nf-25,pcnl,nf-10) and IIIA5(pcn3)
42
Rabbit liver also constitutively expresses a P450IIIA6 (3c) form which is equally similar to rat
P450IIIA1 and IIIA2
-ENZYME ACTIVITY:
The rat form P450IIIA1 is involved in the hydroxylation of testosterone at the 6-/3 position,
ethylmorphine N-demethylation, erythromycin N-demethylation and mephenytom
4-hydroxylation (Gonzalez et a l , 1990) The human equivalent, P450IIIA4, carries out
testosterone 6/3-hydroxylation, 17, 2- and 4- a-estradiol, d-benzphetamine déméthylation, aldrm
epoxidation and nifedipine oxidation These human enzymes are also involved in
dehydroepiandrosterone 3-sulfate, benzo[a]pyrene and 7-ethoxycoumarin hydroxylations
(Guengerich et a l , 1986, Gonzalez et a l , 1990)
-GENE STRUCTURE
The structure of this gene family has yet to be examined The human III loci has been located
on chromosome 7 7q21 3-q22 and the mouse loci on chromosome 6 (Gonzalez 1990)
- GENE REGULATION:
These genes are induced by the presence of glucocorticoids (Elshourbagy et a l , 1980) The
rat form CYP3A1 is induced by glucocorticoids and phénobarbital, whereas the constitutively
expressed form CYP3A2 is inducible only by phénobarbital
This suggests that these genes are regulated differently (Gonzalez 1990) Triacetyloleandomycin
(TAO) has been reported to induce the CYP3A6 form in rabbit, by stabilization of the mRNA
In rats this induction is mediated by increased transcription of both CYP3A1 and CYP3A2 In
vitro however this induction by TAO is not seen, however dexamethazone will induce the same
pattern in vivo and in culture possibly through a different mechanism (Watkins et a l , 1986)
1.5.9 THE P450 IVA FAMILY
There are seven members of this sub-family, three rat genes CYP4A1, 4A2, 4A3 and four in
rabbit, CYP4A4, 4A5, 4A6 and 4A7 These enzymes were discovered due to their mducibility
by hypolipidemic drugs like clofibrate (Gonzalez, 1990)
43
-ENZYME ACTIVITY
In the rat, the P450IVA1 protein has been associated with the metabolism of arachadonic acid
and the metabolism of lauric acid at the a> position (Tamburim et a l , 1984) In lung of
pregnant and progesterone treated rabbits this family is associated with the w-hydroxylation of
prostaglandin, possibly the IVA4 protein (Matsubara et a l , 1987)
-TISSUE DISTRIBUTION:
This family of enzymes is expressed m the liver and kidneys of nonpregnant rabbits (Matsubara
et a l , 1987) In rats P450IVA1 is inducible in liver and kidney (Hardwich et a l , 1987)
P450IVA2 is inducible in liver only and constitutive in kidney (Gonzalez 1990)
- GENE STRUCTURE:
The IVA1 gene has 13 exons, and as such is believed to have evolved early in P450 gene
superfamily development (Gonzalez, 1990)
- REGULATION:
Addition of clofibrate results in rapid transcription of the CYP4A1 gene It is possible that
these enzymes are part of a family of peroxisomal enzymes which are inducible by
hypolipidemic drugs It has been reported that this response may be via a receptor (Lalwam
et a l , 1987)
1.5.10 THE P450 IVB SUBFAMILY
IVB genes have been isolated m humans, rat and rabbit CYP4B1 in humans is constitutively
expressed in lung however, it is not well expressed in liver Rabbit P450IVB1 (form 5)
activates 2-ammofluorene, whereas human P450IVB1 does not This difference in metaboksm
illustrates how important it is to recognise species variation (Nhamburo et a l , 1989)
1.5.11 METABOLIC P450s INVOLVED IN STEROID SYNTHESIS.
There are five families of Cytochrome P450 which are solely involved m the metabolism of
steroids and are not involved in xenobiotic metabolism The distribution of these enzymes
is governed by the steroid requirements of the tissue (Gonzalez, 1992)
44
The P450XI family contains two mitochondrial enzymes, P450 XIA1 which encodes for steroid
11-6-Hydroxylase and 2 forms of XIB1 which codes for cholesterol side-cham cleavage The
bovine XIB1 was sequenced and found to express a 39 residue signal peptide similar to other
mitochondrial proteins (Gonzalez, 1990)
The Human CYP11B1 gene has been reported to contain nine exons and is induced on addition
of the peptide hormone ACTH (adrenocorticotropin) through a cAMP mediated mechanism
(John et a l , 1986) The Human CYP11A1 and 11B1 genes have been located to
chromosomes 15 and 8 respectively (Gonzalez 1990)
The P450XVIIA1 protein codes for steroid 17-a-hydroxylase and 17,20-lyase activities This
protein has been isolated in human, pig, rat and chicken (Nebert et a l , 1989) The human
form of XVIIA1 contains eight exons and spans 7 kbp It is located on chromosome 10 and
its expression is also ACTH responsive (Gonzalez, 1990)
The P450XXIA1 protein codes for progesterone 21-hydroxylase It is the best known of the
P450s involved in steroid metabolism because of it clinical relevance Deficiency of this
enzyme is a major contributor to congenital adrenal hyperplasia (Miller et a l , 1987) The
CYP21 gene locus contains two genes which code for proteins P450XXIA1 and XXIA2 In
mouse, pig and cow, the enzyme activity is associated with the XXIA1 gene product, the
XXIA2 gene is non functional Whereas in humans, this activity is coded for by the XXIA2
gene with the XXIA1 gene inactive (Parker et a l , 1985) In humans these genes are located
m tandem on the short arm of chromosome 6
The P450 aromatase - XIXA1, originally isolated from human placenta, is involved in
aromatization of C19 androgens to C18 estrogens This gene has been assigned to
chromosome 15 There is very little other information on this family (Gonzalez, 1992)
1.5.12 CYTOCHROMES EXPRESSED IN YEAST
Saccharomyces cerevisiae expresses a P450LI (14DM) which demethylates lanosterol at the
14a position This enzyme is very similar to mammalian P450, for example it expresses a
hydrophobic membrane binding protein which anchors the protein to the membrane Candida
tropicalis also contains a P450 which is 66% similar to the CYPLI protein Exposure of
Candida tropicalis to n-alkanes results in increased transcription of a P450alk gene, however
this protein is less than 30% similar to CYPLI This enzyme was assigned to a separate family
P450LII (Chen et a l , 1988)
45
1.5 .13 C Y TO CH R O M ES EX PRESSED IN BACTERIA:P450CI -P450cam isolated from Pseudomonas puttta is a soluble enzymes which converts camphor to 5-exohydroxycamphorThis enzyme was used extensively in the elucidation o f the electron transport pathways and oxygen metabolism To function correctly this enzyme requires putidaredoxin reductase-a flavoprotein and a sulphur containing protein-putidaredoxm (similar to the mitochondrial P450 which require the presence adrenodioxin) for the transfer o f electrons from NA DPH to its active site (Unger et a l , 1986)The P450cam gene is located only 22 base pairs from the gene coding for putidaredoxin reductase, implying the presence o f an operon (Gonzalez 1990)Bacillus megaterium contains a unique P450 - P450LII, in that this enzyme is self-sufficient, consisting o f a protein incorporating both hame-P450 and NA DPH -P450 This gene carries out the hydroxylation o f long chain fatty acids and is inducible by barbiturates via cis- and trans- acting elements (Wen et a l , 1989)
1 .5 .1 4 C Y TO CH R O M E P450 C O M PA N IO N PR O TEIN S W H IC H A R E R E Q U IR ED FO R A C TIV E PRO TEIN:
1 .5 .1 4 .1 N A D PH -P450-(O X ID O )R ED U C T A SE is the endoplasmic reticulum membrane bound flavoprotein responsible for the transfer o f electrons from NADPH to Cytochrome P450 There is only one form of P450 oxidoreductase and it is compatible with all P450s NADPH-P450-oxidoreductase has been isolated from rat, yeast, p ig, rabbit, trout and humans In each o f these species FA D , FM N binding sites are strongly conserved, even when the remainder o f the sequence bears as little as 33% similarity (Yabusaki et a l , 1988) Phenobarbital exposure results m induction o f the reductase, along with P450IIB1, IIB2, IIIA1 and IIIA2 (Hardwick et a l , 1983, Gonzalez et a l , 1986) Dexamethazone and3-Methylcolanthrene do not have an effect on reductase levels (Gonzalez, 1990)
1 .5 .1 4 .2 A D R E N O D O X IN AN D A D R E N O D O X IN R E D U C TA SE support the mitochondrial P450s The Adrenodoxin molecule accepts electrons from the reductase and passes them onto the mitochondrial P450 The gene coding for adrenodoxin reductase is located on chromosome 17 Adrenodoxin is expressed in the adrenal cortex, testicular Leydig cells, ovary, placenta and areas o f the brain This iron-sulphur protein is expressed as a pre-protem from which a 19-kD signal protein is removed on transport into the mitochondria
46
Adrenodoxin is the product o f a single gene There are number o f mRNAs produced but not all o f these are translated to mRNA (Gonzalez 1990)
1.6.0 THE GLUTATHIONE-S-TRANSFERASE FAMILY OF ENZYMES.
The G-S-T family o f enzymes were first discovered in 1961 by Booth et a l , (1961) The sole function o f these enzymes was originally believed to be intracellular transport o f proteins and endogenous ligands which were marginally insoluble They transported compounds such as bilirubin, hame bile acids, steroid hormones, leukotriene A 4, and prostaglandins These compounds were not substrates for the GST enzymes but simply bound to them for transport This original assumed function lead to the name ligandin (Litwack et a l , 1971) H owever, it is now known that these enzymes are also involved in the detoxication o f foreign compounds, mutagens, etc , by conjugation with the tripeptide - glutathione (Glutathione is a tripeptide made up o f Glutamate, Cysteine and glycine which is synthetised by glutathione synthetase - see figure 6 ) Glutathione is present at a concentration o f approximately 5mM in cells GSTs are also believed to confer cellular protection against reactive electrophiles in the same conjugation manner (Oesch et a l , 1991) There are three mam classes o f GSTs 7r, /x and a, which are made up o f subunits arranged as hetero- or homo- dimers o f 25-29 kD The classification is based on the enzymes N-terminal ammo acid sequence, substrate specificity, sensitivity to inhibitors and immunological response ' A fourth class, 6 also exists which is an endoplasmic reticulum-bound timer, made up o f 17 kD subunits (Tsuchida and Sato, 1992, Hayes et a l , 1991)Little is known about the exact structure o f the subunits, but it is believed that in each subunit there are two domains One o f these is the COOH terminus, which is known as the "H-site" where the electrophilic substrates bind, this site is specific for each subunit The other site is the glutathione binding site called the "G-Site", which is common to each unit This ’G -site’ domain has been localised to amino acid residues 53-72 m GST it m pig (Gulick et a l , 1992) Each subunit contains its own "H" and "G" sites Homo- and heterodimers are made up o f subunits from the same class, with the homodimeric reaction rate being faster than that o f the heterodimer (Tsuchida and Sato, 1992) The /x and 7r classes have proven particularly efficient in the detoxication o f K-region and bay-region diol epoxide carcinogens from polycyclic aromatic hydrocarbons like benzo[a]pyrene (Oesch et a l , 1991, H esse and Jernstrom, 1984) The a class o f enzymes are more efficient at conjugating with cytotoxic and mutagenic lipid
)47

peroxidation products (Osech et al., 1991).
(RS)OXIDATION REDUCTION / 0 H2°2̂
\ o 2
GSSH
ADP + Pi
Y-glutamyl ' ATPcycle GLY r ^ \ i nX y-GLU-CYSH^ * \ w / PROTEINS
/ ' " * ADP + Pi
CYSH . - ' ®CYSH-GLY,
/ /
GLUx ©
X t) \ 5-OX\TROLLNE atpy-GLU-CYS-X N-AC-CYS-X
ATP
ADP + Pi
Figure 6 Glutathione metabolism cycle.
Reactions: 1: 7 -G LU-C YSH synthetase; 2:G SH synthetase; 3 + 3a:glutam yltranspeptidase; 4:Y-glutamyl cyclotransferase; 5: 5-oxyproline; 6 + 6 a: dipeptidase; 7: G SH S-transferase; 8 : N-acetylase; 9: GSH peroxidase; 10: transhydrogenase; 11: GSSG reductase; 12: oxidation o f GSH by 0 2 conversion o f G SH to G SSG m ediated by free radicals. (M eister and A nderson, 1983).
The most extensive studies o f the GST enzymes have been on rat tissue. There are 19 known molecular forms o f cytosolic GST and 14 different subunits have been reported (Tsuchida and Sato, 1992). In subunit 1, three 5 ’ flanking regulatory regions have been identified. The region including -867 to -857 ensures constitutive expression o f the gene; -908 to -899 contains an XRE (xenobiotic responsive element); and -722 to -682 is an ARE (antioxidant responsive element) similar to that found upstream from UDP-glucuronosyltransferase (Tsuchida and Sato, 1992). In human five a forms, two ir and eleven /x forms have been identified.GSTs have been reported in human kidney, lung, brain, skin, intestine, adrenal glands, testis, prostate, uterus, heart blood vessels and skeletal muscle (Tsuchida and Sato, 1992).
48
The expression o f the various îsoforms is tissue specific and, in the case o f it and a, developmentally regulated, if is expressed in most organs, with the exception o f adult liver The molecular regulatory mechanism o f these enzymes remains to be identified, but a TRE-like sequence has been reported upstream of GST 7r which is involved in basal expression o f the gene, similar to subunit 1 in rat (Tsuchida and Sato, 1992)The expression and regulation o f GST isoforms found in mouse are different to those found in rat and human tissue Tw o a forms, comprising o f dimeric combinations o f 3 subunits, have been reported, one it and four /x forms have also been described
1.6.1 GLUTATHIONE-S-TRANSFERASE AND CANCER:
Chemical carcinogenesis is thought to be initiated by the covalent modification o f D N A with electrophilic metabolites derived from carcinogens For many toxic xenobiotics and electrophiles, GST conjugation represents a major detoxification pathway The role o f GST here is to eliminate electrophiles by conjugation, thereby preventing their carcinogenic and mutagenic roles However, it has been observed that some glutathione and cysteine conjugates are o f toxicological concern (Pickett et a l , 1989, Bladern et a l , 1988) The conjugates produced can form unstable thiols which degenerate to alkylating agents and toxic metabolites For example, 1,2 Dibromoethane on conjugation with glutathione becomes S-[2-(N 1- guanyl)ethyl]-glutathione which binds to D N A Trichloroethene also, in its conjugated form is unstable and more susceptible to breakdown into unstable D N A binding thiol metabolites (Tsuchida and Sato, 1992)Altered expression o f GST has been reported m tumours in a variety o f organs and species GST 7r has been noted as a marker in rat hepatocarcinogensis (Sato, 1988), as its expression increases in parallel w ith the progression of the disease H owever, this elevation m expression is not seen m human hepatocarcinogensis (Hayes et a l , 1991), except in liver tumours resulting from metastasis (Tsuchida and Sato, 1992) The a class of GST is the predominant form expressed in normal human hepatocytes, with expression being localized to adult bihary epithelium Increases m a subunit Bj expression have been noted in liver damage brought on by alcohol abuse, hepatitis and paracetamol poisoning Levels o f 7r are increased in bile, secreted by the Kupffer cells, sinusoidal macrophages and hepatocytes in alcohol abused livers (Hayes et a l , 1991)
49
Altered expression o f the isoform GST 7r has also been implicated in colon (Kodate et a l , 1986), stomach, bladder (Singh et a l , 1990), squamous uterine cervix (Riou et a l , 1991), oesophagus and pancreatic adenocarcinomas (Hayes et a l , 1991) and in leukaemic bone marrow (Tidefelt et a l , 1992, Hall et a l , 1990) In some breast cancers GST it has been noted to mirror oestrogen receptor levels (Hayes et a l , 1991)Decreased expression was also noted in liver and kidney tumours (H owie et a l , 1990)The basis o f elevated GST % levels in "cancer" has been the subject o f some speculation Tsuchida and Sato (1992) have commented on the coinciding increased GST ir expression in large colonic polyps with the activation o f the "ras" oncogene and the loss o f tumour suppressor genes which are also seen in these larger polyps H owever, it has also been proposed that these elevations o f GST tt are due to the multiple biochemical changes on going within the cancer cells (Riou, 1991) Hayes et a l , (1991), also suggested that elevated expression may be due to clonal expansion o f those particular cells which express 7r, e g pancreatic cancer arise form acini and ductular cells which express GST tt in their normal state, the elevated expression reported in pancreatic cancer could be due simply to the increase in the number o f these cells They also noted that the use o f serum detection for marker GST it m neoplasia has inherent problems, since in the clotting process GST w is released from platelets, and GST a subunit B 1 is released from red blood cells For this reason, a plasma detection system was introduced The results suggested that GST tt levels were elevated in the plasma o f patients suffering with gastrointestinal malignant growths, especially those that had metastasised, and also in adenocarcinoma o f the lung However, due to the implication o f GST 7r in so may diseases, the results obtained from plasma or serum test may be difficult to interpret accurately for a single diseaseThe GST a class constitutes 3 % o f the total cytosolic protein o f hepatocytes The half life of these subunits is 60 mins and as such they are used as markers o f liver damage (Hayes et a l ,1991) Elevation o f the B, subunit has been noted in paracetamol poisoning, cirrhosis and thyrotoxicosis However the reason for this fluctuation is unclear In contrast, diminished GST a levels have been reported in stomach and kidney tumours (Tsuchida and Sato, 1992) Expression o f class n activity towards trans-stilbene has been reported to be decreased in lung cancer patients (Seidegard et a l , 1990, Tsuchida and Sato, 1992) A survey o f patients with lung cancer revealed that levels o f GST ¡x were lower in lung cancer patients who smoked than in smokers with no lung cancer They also reported that levels o f GST n were lower in patients with squamous cell carcinoma than those with adenocarcinoma
50
The GST /x gene is dominantly inherited and may be a marker o f susceptibility to lung cancer and adenocarcinoma of the stomach and colon (Tsuchida and Sato, 1992)
Over all, the involvement o f GST isoforms in cancer debatable As already mentioned, elevation and depression o f individual isoforms may simply be a reflection o f the biochemical changes occurring within a tumour due to clonal expansion, or they may play an intrinsic role in the mechanism and progression o f the disease As yet, only a few isoforms have been investigated with respect to their part in cancer The involvement o f other forms needs to be clarified before a conclusion as to the role o f GST in cancer can be made
1 .7 .0 A C T IV A T IO N A N D CANCER:
A s already mentioned, some P450s activities lead to activation o f certain compounds to their toxic carcinogenic metabolites e g benzo[a]pyrene-lA l, aromatic am m es-lA 2 and the food derived 2-amino-3-methylimidazo[4,5-/|-quinoline - 3M C-like inducers (Parke et a l , 1990) The induction process therefore, 1) may lead to an increased activation o f compounds or, 2) at the opposite end o f the scale induction may lead to increased clearance o f the toxic metabolites The balance between toxification and detoxification very much depends on the time and the place o f induction, where the compound finds itself during that time and the genetic variance o f the individual involved Genetic variability in the oxidative activation o f chemical carcinogens may explain the mter-mdividual differences in response to carcinogens (Nakachi et a l , 1991)Activation o f P450 is involved at the therapeutic level The chemotheraputic agent cyclophosphamide requires activation before it can effect its toxic anti-tumor activities (Doehmer et a l , 1989) Pretreatment with PB results in an increased activation o f this agent The clinical administration o f different inducers may allow for increased toxification or detoxification depending on the reaction required In essence it may be possible to exploit P450 induction as a method for increasing the efficacy or reducing the side effects o f therapeutic agent The induction process has been maintained throughout evolution This adaptive response is necessary in a constantly changing enviroment
51
1.8.0 DRUG RESISTANCE IN TUMOUR CELLS.
Tumour resistance to chemotherapy may be a primary or secondary phenomenon Tumour cells which show no initial response to therapy are deemed to be primarily resistant Others, which exhibit an initial response o f tumour remission, can relapse and present with secondary resistance This resistance may be due to extracellular or intracellular factors Extracellular factors influence the drug before it reaches its target The timing and frequency o f drug administration is critical to ensure that as many tumour cells as possible, at the correct point m the cell cycle are exposed to drug Inaccessibility o f tumour is a problem for larger tumours in that the drug cannot reach the cells at the centre o f the tumour The blood brain barrier also poses a major problem as drugs cannot pass through it to exert their effect Other extracellular mechanisms o f drug resistance have also been reported e g drug antagonism and antibody production (Priestman, 1980) However, it is the intracellular mechanisms o f drug resistance which are o f interest here This form o f resistance can be due to a variety o f mechanisms, for example altered xenobiotic metabolism e g an increase in aldehyde dehydrogenase as seen in cyclophosphamide resistance (Waxman, 1990), increased P450 dependent metabolism of procarbanzine, etoposide and the P450 reduction o f adriamycin and mitomycin C (Doehmer, to be published), and increased D N A repair by enzymes such as guanine Cf -methyltransferase (Waxman, 1990) Classical multiple drug resistance (MDR) involves either primary or secondary resistance and cross resistance to particular subsets o f structurally unrelated drugs Those drugs normally associated with classical M DR are large molecules with hydrophobic and hydrophilic moieties adriamycin, vinca alkaloids, peptide antibiotics like actinomycin D and epipodophyllotoxins like V P -16 and VM -26 This multiple drug resistance does not involve nucleotide analogues or metabolic inhibitors e g 5-fluorouracil and methotrexate or the alkylating agents bleom ycin or cisplatin (Clynes et a l , 1990) The mechanism most frequently associated with this classical resistance is the overexpression o f the membrane glycoprotein with a molecular weight o f 170kd - the "P-glycoprotein" The proposed function o f this protein is as an "active transport system", an efflux pump which results in decreased accumulation o f toxins within the cell (Endicott and Ling, 1989) This protein is associated with a broad range o f structurally unrelated drugs as mentioned above and is expressed in a variety o f normal tissue as w ell as resistant tumoursThe possiblity that the drug metabolising battery o f enzymes may be involved in drug resistance is logical when the function o f these enzymes is considered
52
V.
Som e o f the drugs involved in chemotherapy require metabolic activation before they can exert their toxic affect e g cyclophosphamide which requires activation by liver cytochrome P450 2B enzymes for toxicity (Doehmer et a l , 1990) and aldehyde dehydrogenase for its detoxification (Hilton et a l , 1982, 1984) Altered expression o f either o f these enzymes would effect the ce ll’s response to the presence o f cyclophosphamide Decreased expression o f the enzyme CYP1A1 activity in adriamycin resistant MCF-7 cells has also been reported by Ivy et a l , (1988) However, given their potential for a role in resistance, very few reports have actually cited the involvement o f such enzymes in in vitro models o f M DRThe in vivo situation may be different, as the expression o f these enzymes would be as per normal, however, the levels o f these enzymes are depleted in culture, so that in vitro models may not reflect the in vivo situation accuratelyA s mentioned above, the cytosolic, phase II, glutathione-S-transferase conjugating family o f enzymes and the associated enzymes display altered expression in a number o f tumours This transformation has also been reported in many resistant tumour cell lines (Waxman, 1990, M oscow , to be published) Waxman suggested that the possible function o f these enzymes in alkylating agent resistance are1) enhanced inactivation o f electrophilic alkylating agents e g melphalan by direct conjugation2) demtrosation o f mtrosurea by e g GST ¡i in rats3) scavenging o f reactive organic peroxides by selenium dependant GSH peroxidase and,4) quenching o f chloroethylated - D N A monoadducts, platinum -D N A adducts and D N A hydroperoxides (Waxman, 1990)Increased expression o f GST ¡i and a is believed to be involved m resistance to nitrogen mustards, mtrosureas, benzo[a]pyrene and alkylating agents (M oscow et a l , 1989, Hosking et a l , 1990) For example, resistance in the CHO (Chinese hamster ovary) cell line to the alkylating agent, chlorambucil is attributed to a greater than 40 fold increased expression o f GST a than its parental line CHO, as inhibition o f GST a circumvented resistance, using the nonsteroidal antiinflammatory drug mdomethancin (Hall et a l , 1989) Manoharan et a l , (1987) noted that transfection o f the GST a class Ya subunits into COS cells resulted m chlorambucil resistance attributable to GST a In 1991, the same authors also noted that tandem expression o f Ya (an a subunit) with Yb (a -it subunit) resulting in a heterodimer with subunits from each class, also conferred resistance to this agent Yang et a l , (1992) also found that in NIH-3T3 chlorambucil-resistant N 50-4 cells, elevated levels o f G STa and GSH played major roles in the mechanism o f resistance Transfection o f GST a cD N A into BL-10 cells resulted in increased resistance to bleom ycin (Giaccia et a l , 1991)
53
H ow ever, Townsend et a l , (1992) found that although transfection o f GST a and /x. into MCF-7 cells resulted in increased resistance to ethracrynic acid, it did not confer cross resistance to any other agentsThe enzymes associated with the glutathione cycle have also been implicated in the mechanisms o f resistance (Fig 6 ) Increased expression o f GSH-peroxidase and GSH-reductase along with increased and also decreased GSH concentration, have been reported to play a role in resistance to adriamycin, cisplatin or x-ray irradiation in a variety o f cell lines (Hoskmg et a l , 1990, Batist et a l , 1987, Cole et a l , 1990)H owever, the isoform mostly associated with the resistance phenomena is GST ir Elevated expression o f this isoform has been connected with increased resistance to CDDP (cis- diaminodichloroplatinum) in CHO cells tranfected with the cD N A o f this isoform and in a head and neck squamous cell carcinoma cell line (Miyazaki, et a l , 1990, Teicher et a l , 1987), to alkylating agents in the resistant selected human melanoma cell lines from G3361 (Wang et a l ,1989), and to BC NU (l,3-b is(2-chloroethyl-l nitrosourea) in a human malignant astrocytoma cell line (interestingly, this resistance is due to GST ¡i rat astrocytomas)(Ali-Osman et a l ,1990) In NIH 3T3 c-H-rai-transformed cells, transfection o f GST ir resulted in resistance to ethracrynic acid and adriamycin, but not the alkylating agents (Nakagawa et a l , 1990) Combined elevation o f GST ir and its selenium-independent peroxidase activity has also been reported in a human adriamycin-resistant breast carcinoma cell line M CF-7, although the exact mechanism o f resistance is unknown (Batist et a l , 1987)A number o f cell lines made resistant to adriamycin display increased GST ir expression Adriamycin-resistant colon cancer and lung cancer cells with increased GST ir expression have also been reported, but the controlling mechanism o f resistance was once again undecided (Chato et a l , 1992, Cole et a l , 1990, M oscow , 1993) Kuroda et a l , (1991) follow ed the expression o f GST 7r in cell lines developed from a neuroblastoma before and after chemotherapy treatment and found increased levels in the treated cell line Fairchild et a l , (1990) transfected a variety o f GST isoforms into the cell line M CF-7 with no significant effect on the level o f resistance to adriamycin, cisplatin or melphalan, except when co-transfected with the MDR1 gene Nonetheless, GST ir did confer resistance to the carcinogen benzo[a]pyrene
Transfection with GST ir seems only to confer low levels o f resistance to adriamycin but no cross resistance i e it does not confer multiple drug resistance (M oscow et a l , 1993) It is possible that the increased level o f GST ir that is observed in some M DR cell lines may be a symptom rather than the cause o f resistance
54
The GST it may conjugate and transport the toxins to the P-glycoprotem for export and these genes may be regulated together (Fairchild et a l , 1990) Evidence for the conjugation or binding o f drugs commonly associated w ith M DR has not been reported (M oscow, 1993, Black et a l , 1990) Increased GST expression levels have been reported in many cases o f single compound resistance, but cross resistance to other agents does not seem to be involved Overall, the GST isoenzymes seem to play an important role m the phenotype o f resistance They are overexpressed in many single-agent resistant and multiple drug resistant lines In som e instances they play a major role in single agent resistance, but in the majority o f cases they appear to be distantly involved and are not capable o f supporting resistance alone
In this thesis w e w ere interested in examining the xenobiotic metabohc pathways associated with the lung The liver is the organ most often associated with this form o f metabolism due to is high concentrations o f the enzymes involved and its central role m the regulation o f the blood content The lung is also o f importance as it is the port o f entry for many airborne and gaseous compounds Metabolism o f xenobiotics within the lung often leads to toxicity, although certain pulmonary cells are readily damaged than others (Baron and V oigt, 1990) The compartmental nature o f the lung, its many cell types each expressing different isoforms at variable concentrations, make an accurate picture o f the xenobiotic metabolizing profile o f this tissue difficult (Guengerich, 1990) It is believed that many o f the xenobiotic pathways previously reported to be absent m the total lung are probably present, but have not been detected as of yet H owever, recent studies by Baron and V oigt, (1990) have detected varying xenobiotic metabolizing activity to different extents in bronchial epithelial cells, Clara and ciliated bronchiolar epithelial cells and type II pneumocytes and other alveolar wall cells
In the rabbit lung four isoforms o f P450 have been isolated They are P450-2 (IIB4), 5(IVB1), and 6 (IA1) and IVA4 The P450-2 form carries out d-benzphetamine N-demethylation, P4505 , carries out 2-aminofluorene N-hydroxylation and P450 6 , carries out benzo[a]pyrene hydroxylation and 7-ethoxyresorufin O-dethylation IVA4 carries out the hydroxylation of prostaglandin E l The activity o f this enzymes is greatly induced in pregnant rabbits m the liver as w ell as in the lung (Yamamoto et a l , 1984) P4502 and 5 are not inducible, but P450-6 , w hose activity in normal circumstances is low is greatly induced in the presence o f PAH, however polyhalogenated biphenyl inducers appear to inhibits induction, as does Aroclor 1260 inhibit normal expression o f P4502 and 5
55
Immunohistochemical staining o f rat cells revealed the presence o f NADPH-cytochrom e P-450 reductase and cytochromes P450 BNF(IAI), PB-B(IIB 1) and PCN-E(IIB4) in bronchial epithelial cells, both ciliated and nonciliated (Clara) bronchiolar epithelial cells, and type II pneumocytes as w ell as other cell in the alveolar wall Higher concentrations o f reductase and PB-B were detected in Clara cells Benzoapyrene was hydroxylated in situ by bronchial and bronchiolar epithelial cells and alveolar wall cells, especially type II pneumocytes (Voigt et a l , 1990) Three other forms were also detectable CYP2A3, 3A and 2F Hamster lungs have also been reported to contain inducible CYP1A1 and 4B form has also been detected in Guinea pigs (Shimada et a l , 1992)
In humans lung no isoform o f P450 has been purified, however, the presence o f three major forms o f P450 have been detected, which are P450IA1 and P4502F1 and 4B1 (Shimada et a l ,1992) The importance o f these enzymes, especially P450IA1 is apparent due to their possible involvement in the etiology o f lung cancer, especially that associated with tobacco (Kawajiri and Fujii-Kuriyama, 1991) P450IA1 mRNA has been detected in human lung, lymphocytes and placenta In lung tissue from active cigarette smokers levels o f P450IA1 are m RNA elevated m comparison with nonsmokers (McLemore et a l , 1989, 1990) This increased expression is linked with increased activity o f this enzyme, resulting in activation of benzo[a]pyrene, a precarcinogen found in cigarette smoke, to its tumourogemc form This CYP1A1 gene demonstrates genetic polymorphism in its 3 ’ -flanking region, resulting in 3 phenotypes Individual with genotype C (homozygous rare allele) were at a higher risk o f developing lung cancer than those with genotypes A (homozygous) or B (heterozygous) due to the fact that their CYP1A1 gene is far more inducible than A or B (Nakachi et a l , 1991)
Other phase I xenobiotic enzymes have been reported in lung tissue, NADPH cytochrome P450 reductase, flavin-containing monooxygenase, epoxide hydroxylase, alcohol dehydrogenase and aldehyde dehydrogenase (Guengerich 1990)The phase II enzymes N-methyltransferase, acetyltransferase and GST have also been detected m the lung As already discussed, the polymorphic GST ¡x isoform is m ost relevant with respect to lung cancer, as expression o f this isoform is linked with successful ehmination o f the toxic metabolites o f benzo[a]pyrene (Tsuchida and Sato, 1992)
56
aims o f this project wereto examine and improve the techniques employed m this laboratory for primary culture o f human lung tumoursTo investigate the xenobiotic metabolising profile o f a number o f continuous lung cell lines with a view to their application in in vitro toxicity testing To research the introduction o f cD N A coding for specific P450 into continuous cell lines and to apply them to in vitro toxicity testing, and to compare their ability to activate certain compounds (as would be seen in vivo) with the parental nonexpressing lines, andTo investigate the possible role o f xenobiotic metabolising enzyme in the phenomon o f drug resistance, as seen in the adriamycin resistance lines developed in this laboratory
SECTION 2: MATERIALS AND METHODS.
2.0 TISSUE CULTURE TECHNIQUES.
2.0.1 Preparation of glassware:
A ll glassware used m cell culture was maintained for that purpose only This was to ensure that no other laboratory chemicals (which maybe residual on general glassware) interfered with the preparations which came in contact w ith the cells A ll glassware and lids were soaked in hot tap water containing 2% (v/v) RBS 25 (Chemical products, Belgium) for 1-2 hours The glassware was then scrubbed clean and rinsed thoroughly m tap water to remove all RBS residue Follow ing this the glassware was rinsed three times with deionised water (M illipore M illiRO 10 - reverse osm osis treated water This water is 99% free o f particulate matter, bacterial and orgamcs and has 90% of monovalent ions and 95% polyvalent ions removed) The glassware was then rinsed once with ultrapure water (ElgaStat U H P - reagent grade water produced by organic absorption, îonexchange, ultra microfiltration and photo-oxidation)- For spinner cell flasks Units for suspension cell culture were washed m the manner mentioned above and allowed to dry at 50°C The spmner flask was then coated with a film of "repelcote" (BDH 63216) by rotating 10 mis o f the liquid around the flask until all the surface area had been covered, including the central spmner bar The flask was then allow to dry completely m a fume hood and then rinsed three times with ultrapure water
A ll glassware was then autoclaved wet (to ensure steam generation) at 120"C and 21 lb per cm2
pressure for 2 0 mins
2.0.2 Basal media preparation:
A ll media i e powder and liquid was prepared from 10X concentrate from Gibco stocks m 5 litre quantities and diluted using freshly-autoclaved cooled ultrapure water Basic medium were used and supplemented with the follow ing components 1M HEPES (Sigma H 9136) pH 7 3 - Autoclaved, 7 5% N aH C 03 (RdeH 31437) - Autoclaved, 5N NaOH (RdeH 30620) Autoclaved, 1 5 M HC1 (BDH 10125) - AutoclavedEach medium was made up according to the follow ing appropriate recipe, the medium pH was brought to between pH 7 44 and 7 55 using sterile 1 5 N NaOH and 1 5 M HC1
58
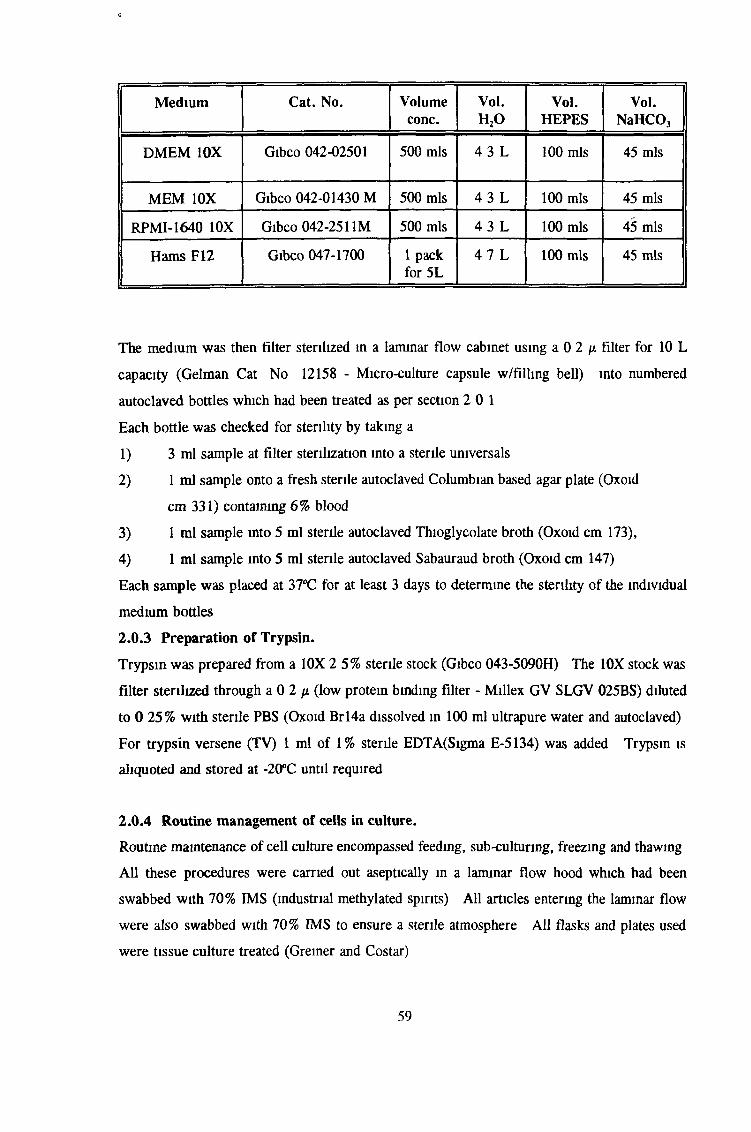
M edium C at. No. Volum econc.
V ol.h 2o
V ol.H EPES
Vol.NaHCOj
D M EM 10X Gibco 042-02501 500 mis 4 3 L 1 0 0 mis 45 mis
M EM 10X Gibco 042-01430 M 500 mis 4 3 L 1 0 0 mis 45 misRPM I-1640 10X Gibco 042-2511M 500 mis 4 3 L 1 0 0 mis 45 mis
Ham s F12 Gibco 047-1700 1 pack for 5L
4 7 L 1 0 0 mis 45 mis
The m edium was then filter sterilized in a laminar flow cabinet using a 0 2 /* filter for 10 L capacity (Gelman Cat N o 12158 - Micro-culture capsule w /filhng bell) into numbered autoclaved bottles which had been treated as per section 2 0 1
Each bottle was checked for sterility by taking a1) 3 ml sample at filter sterilization into a sterile umversals2) 1 ml sample onto a fresh sterile autoclaved Columbian based agar plate (Oxoid
cm 331) containing 6% blood3) 1 ml sample into 5 ml sterile autoclaved Thioglycolate broth (Oxoid cm 173),4) 1 ml sample into 5 ml sterile autoclaved Sabauraud broth (Oxoid cm 147)Each sam ple w as placed at 37°C for at least 3 days to determine the sterility o f the individual medium bottles2.0.3 Preparation of Trypsin.
Trypsin w as prepared from a 10X 2 5% sterile stock (Gibco 043-5090H ) The 10X stock was filter sterilized through a 0 2 n (low protein binding filter - M illex GV SLGV 025BS) diluted to 0 25% w ith sterile PBS (Oxoid B rl4a dissolved in 100 ml ultrapure water and autoclaved)For trypsin versene (TV) 1 ml o f 1% sterile EDTA(Sigma E-5134) was added Trypsin isaliquoted and stored at -20°C until required
2.0.4 Routine management of cells in culture.
Routine maintenance o f cell culture encompassed feeding, sub-culturing, freezing and thawing A ll these procedures were carried out aseptically in a laminar flow hood which had been swabbed w ith 70% IMS (industrial methylated spirits) A ll articles entering the laminar flow were also swabbed with 70% IMS to ensure a sterile atmosphere A ll flasks and plates used w ere tissue culture treated (Greiner and Costar)
59
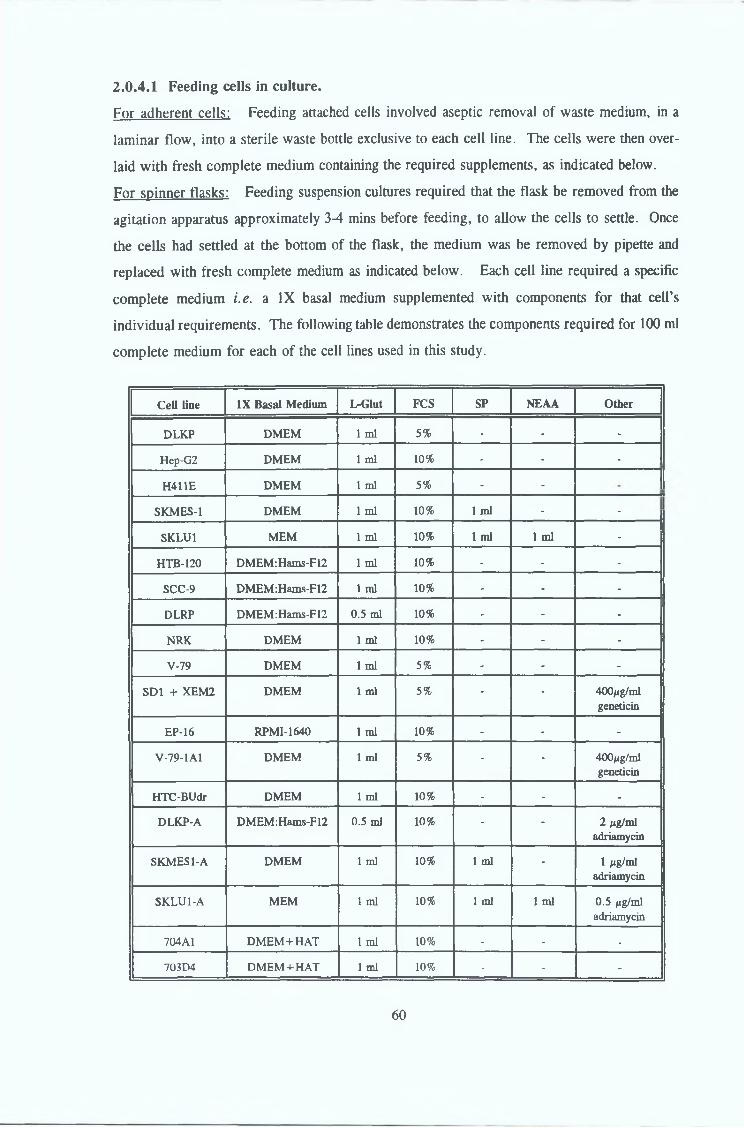
2 .0 .4 .1 Feeding cells in culture.For adherent cells: Feeding attached cells involved aseptic removal o f waste medium, in alaminar flow , into a sterile waste bottle exclusive to each cell line. The cells were then overlaid w ith fresh com plete medium containing the required supplements, as indicated below.For spinner flasks: Feeding suspension cultures required that the flask be removed from theagitation apparatus approximately 3-4 mins before feeding, to allow the cells to settle. Once the cells had settled at the bottom o f the flask, the medium was be removed by pipette and replaced with fresh complete medium as indicated below. Each cell line required a specific com plete medium i.e. a IX basal medium supplemented with components for that cell’s individual requirements. The following table demonstrates the components required for 100 ml com plete medium for each o f the cell lines used in this study.
Cell line IX Basal Medium L-Glut FCS SP NEAA Other
DLKP DMEM 1 ml 5% - - -
Hep-G2 DMEM 1 ml 10% - - -
H411E DMEM 1 ml 5% - -
SKMES-1 DMEM 1 ml 10% 1 ml -.
SKLU1 MEM 1 ml 10% 1 ml 1 ml -
HTB-120 DMEM:Hams-F12 1 ml 10% - - -
SCC-9 DMEM:Hams-F12 1 ml 10% - - -
DLRP DMEM:Hams-F12 0.5 ml 10% - - -
NRK DMEM 1 ml 10% - - -
V-79 DMEM 1 ml 5% - - -
SD1 + XEM2 DMEM 1 ml 5% - - 400/ig/mlgeneticin
EP-16 RPMI-1640 1 ml 10% - - -
V-79-1A1 DMEM 1 ml 5% - - 400jig/ml geneticin
HTC-BUdr DMEM 1 ml 10% - - -
DLKP-A DMEM: Hams-F 12 0.5 ml 10% - - 2 /¿g/ml adriamycin
SKMES1-A DMEM 1 ml 10% 1 ml - 1 /¿g/ml adriamycin
SKLU1-A MEM 1 ml 10% 1 ml 1 ml 0.5 /ig/ml adriamycin
704A1 DMEM+ HAT 1 ml 10% - - -
703D4 DMEM+ HAT 1 ml 10% - - -
60
N E A A 100X Non essential ammo acids, Gibco 043-01140 H, SP 100 mM Sodium pyruvate, G ibco 043-01360 H , Dulbecco’s HAT medium (Hypozanthene, aminopterm and thymidine) IX stock, Gibco 041-00170 M , L-glut 200 mM L-glutamine, Gibco 043-05030 H,
2 .0 .4 .2 Experimental constituents of media:
Geneticin G148 Sigm a (G-5103) was dissolved at 100X stock in complete medium and filter sterilized PB Phenobarbital (Clonmel Chemicals) was dissolved at 100X in 5N NaOH and filter sterilized The phenobarbital was then diluted in complete medium and the pH adjusted to 7 44-7 55 range B[a]P (Sigma B-1760) Benzo[a]pyrene was dissolved as 2m g/m l in D M SO and used directly at 5/xl per 2 ml o f medium Benzanthracene (Sigma B-2750) was dissolved in neat DM SO (Sigma D -5879) and used directly at a concentration o f 0 01% in the medium Cyclophosphamide (Sigma C 0768) was dissolved in medium and filter sterilized before use
2 .0 .4 .3 Induction of cell lines:
The cells to be examined were seeded into 100 mm petri-dishes at a concentration o f 5 x 10s cells/m l 20 mis complete medium was added to each plate After incubating the plates overnight at 37°C in 5% C 0 2, the waste medium was removed and the inducer contining medium added (inducer were made up in complete medium as per section 2 0 4 3) The plates were then returned to the incubator for the appropriate length o f time For benzanthracene and D M SO induction the exposure lenght was for 18 hours at 5% C 0 2 and 37°C For phenobarbital, exposure time was for 72 hours at 5% C 0 2 and 37°C Cell lysates were then isolated as per section 2 1 2 1
2 .0 .4 .4 Subculturing cells in culture.
For adherent cells in a 25 cm* flask 1) W aste medium was removed from the flask (as for feeding cells) into a waste bottle and the cells were overlaid with 2 mis o f TV pre-warmed to 37°C The flask was gently rotated and the T V then remove to a waste bottle To the rinsed flask, 4 mis o f warmed TV was then added and the flask removed to the incubator at 37°C for 3-5 mins The cells w ere monitor under the m icroscope constantly, as some cells required less tim e to become trypsimzed than others W hen the cells had become detached from the flask bottom and had formed a single cell suspension, 2 mis o f complete medium was added and the total 6 mis removed to a sterile universal (Greiner) which had been labelled with the name of the cell line
61
The universal was centrifuged for 5 mins at 1000 rpm The supernatant was poured o ff and the pellet was resuspended in complete medium A fresh flask was re-seed with the required number o f cells, feed with complete medium and return to the incubator (LEC 37°C incubator)
For suspension cultures The suspension was removed aseptically from the spinner flask, by pipette to sterile 50 ml umversals and centrifuge at 1000 rpm for 5 mins The pellet was then rinse with 3 mis o f pre-warmed TV and re-pellet at 1000 rpm for 5 mins The resulting second pellet was resuspend in 10 mis o f fresh warmed TV and place at 37°C for 5 mms, or until the cells had attained a single cell suspension To this was added 4 mis o f complete medium and the suspension centrifuged at 1000 rpm for 5 mms The supernatant was removed to a sterile waste bottle and the pellet resuspended in fresh complete medium The spinner flask was then re-seeded with the required density o f cells and the appropriate volum e o f complete medium was added
2.0.4.5 Freezing cells in culture.
Purpose To allow long term storage o f cultured cells and ensure adequate stocks o f cells are available, within a given passage number range, for particular workA large quantity o f cells was required for this procedure Cells were grown to 80% confluence having been fed 12-24 hours previous to this procedure to ensure they were in good condition
Cells were trypsimzed and pelleted as per section 2 0 4 3 The cell pellet was resuspended m a volum e o f 100% serum which ensured a single cell density o f 5 x 10⁷ viable cells/m l (as determined by trypan blue (Gibco 043-05250 H) exclusion) 10% v /v DM SO in 100% serum was added drop-wise, w ithcontim ous shaking o f the cell suspension, to give a final 1 1 dilution This suspension was removed to a sterile labelled cryovial (Greiner 122 278) and placed in the
vapour phase o f a liquid nitrogen container for 3 hours After 3 hours the vials were placed directly into the liquid nitrogen where they were stored A vial o f cells was thawed 2-5 daysafter freezing to determine the sterility and viabihty o f the stocks
2.0 .4 .6 Testing viability of cells.
It is very important to test cell suspensions before and after freezing and also before seeding toxicity plates to determine the exact number o f viable cells available for study This is quantified by trypan blue exclusion
62
\
Viable cells did not stain strongly in trypan blue however, damaged or dead cells will and stained dark blue, which can be viewed under the microscope To determine the number of viable cells a 250/il sample o f the cell suspension was mixed with 50^1 o f trypan blue dye This m ix is allowed to stand for 2-3 mins and a 100 /¿I aliquot placed in the 0 01 mm deep depression o f a haemocytometer The four sets o f 16 squares at the corners o f the central graded area o f the slide were counted, taking account o f the total number o f cell (clear and blue) and the viable (clear) cell so as to determine the percentage survival The number achieved was multiphed by 1 2 X 10* (the 1 2 takes into account the dilution caused by the trypan blue) to g ive the number o f cells per ml
2.0.4.7 Thawing frozen stocks.
The vial required was removed from the liquid phase o f the liquid nitrogen container and placed in a shatter p roof container (ELKA/50 ml tube 00-2094) at 37°C for 2-3 mins until the contents had thawed The vial was then removed to the laminar flow , swabbed with 70% IMS and opened aseptically The contents was placed into a sterile universal containing 5 mis complete mediumThe umversal w as centrifuged at 1000 rpm for 5 mins and the pellet resuspened m 10 mis fresh cold complete medium A 1 ml ahquot o f the suspension was taken to determine viability by trypan blue exclusion (section 2 0 4 5) and the remainder o f the suspension re-seeded into a 25 cm 2 flask The cells were monitor by microscope for 1-2 hours and the medium replaced with fresh complete medium 24 hours later to ensure all traces o f DM SO are removed
2 .0 .4 .8 Mycoplasma testing using the Hoechst DNA staining method.
This method used the cell line NRK as an indicator, due to its maintenance o f morphology during fixationThis procedure was carried out away from routine cell culture designated areas, to avoid possible contamination o f clean cell stocks
1) Cells to be tested were subcultured a minimum o f three times out o f antibiotics, after thawing and resistant lines were fed and subcultured three times in medium not containing drug
2) 5 mis o f conditioned medium (CM) from these lines i e medium that has been in contact with the cells for 2-3 days, was removed asceptically
63
3) 1 ml o f the cleared CM was added asceptically to a 35 mm petri dish containing a coverslip (pre-treated as for lmmunofluroscence slides) on which NRK cells had previously been seeded at 2 x 1 0 3 cells/m l (1 day prior to testing)
4) The slides were incubated at 37°C and 5% C 0 2 for 2-5 days until the cells had reached 50% confluence
5) The waste medium was removed and the slides washed m PBS tw ice, ensuring that the slides did not dry out at any time
6 ) Slides were then wash once with cold fresh 50 50 v /v PBS/Carnoys fixative (1 3 glacial acetic acid (BDH 27013), methanol (BDH 10158) at -20°C)
7) To this 2 mis o f carnoys fixative was added and left for 10 mins8 ) The fixative was removed and the samples allowed to air dry9) 2 mis o f Hoechst was then added (50 ng/m l m PBS, filtered through a 0 22 n
filter and stored in aliqouts at -20°C away from light) for 10 mins at low kght intensity
10) Slides were then washed with distilled water and mounted m mounting medium (0 022M citric acid, 0 055M disodium phosphate and 50% glycerol - pH 5 5 and filter sterilised usinng a 0 2 2 ¡i filter)
11) The slides were viewed by mercury fluorescent microscopy - extranuclear staining indicated a positive contaminated sample
2.1 PRIMARY CULTURE:
Samples were transported from surgery in sterile complete medium at 4° C, which containedDM E/Hams F12 50 /50 v /v 1% L-glutamine,2% Pen/strep (Gibco 5000 IU/m l pem cillm /5000U g/m l streptomycin), 250 ng/ml fungizone (Gibco 043 05290 D) and 10% FCS (Foetal calfserum)1) In the laboratory, samples were removed asceptically from the collection
medium, in the laminar flow and placed in sterile PBS (The collection medium was retained)
2) U sing sterile scalpels the samples were then dissected into 1-4 mm3 pieces3) The dissection medium was retained and the remainder o f the sample placed m
0 2% Disphase (Boehringer Mannheim - Neurtal Protease - 165-859) and 200 units Collagenase type IV (Sigma C-5138), for up to 4 hours with constant agitation
64
For single cell cultures Collection medium, dissection media and enzymatic desegregated medium were all pelleted at 1000 rpm for 4 mtns to retrieve cells Pellets were resuspended in complete medium and seeded into 25 cm2 flasks at a density o f no less than 1 x 10® cells/m l and placed at 37° C
For exolant culture At stage 2, using a sterile forceps individual 1-2 mm3 samples o f pure tumour w ere placed in a 25 cm2 flask which had been pre-wetted with 0 5 ml o f com plete medium Once the explants had been placed, the flask was placed upright with the cap loosely closed for 30 mins in a laminar flow to allow the samples to settle After the 30 m ins, 1 ml o f com plete medium was gently added to the flask, taking care not to disturb the fragments The cap was then secured and the flask moved to 37°C
Each sample was recorded and re-fed with complete medium every 3-4 days depending on its growth progress This growth was traced by m icroscopic evaluation Samples were kept for at least 3 weeks, longer when growth was substantial
2.1.1 Fibroblast eradication:
Over growth by normal fibroblasts within these cultures was a major obstacle to the success o f primary epithelial tumour culture growthThe follow ing procedures were employed to attempt to elevate this problem
1) Differential attachment Fibroblasts cells are believed to attach at a faster rate to tissue culture flasks (Freshney, 1987) Therefore 2-4 hours after initial seedmg o f the samples when the fibroblasts have attached, the supernatant was removed and reseeded into a new flask
2) Differential detachment Epithelial cells grow m close association with each other via desm osom es Therefore they are more resistant to detachment than fibroblastCultures o f mixed epithelial and fibroblasts were exposed to a) 0 02% ED TA at room temperature for 3-5 mins, or b) 0 02% EDTA and 0 01 % Trypsin for 5-6 mins at 37° C
3) Selective toxicity o f Geneticin G 148 Sulfate M ixed populations o f cells were exposed to 100 ¿ig/ml geneticm for 48 days
65
A ll cultures were contimously monitored by m icroscope through out the procedure, then rinsed vigorously by pipetting with PBS, followed by 3 rinses with PBS to remove the detached cells Cultures were re-fed with complete medium and returned to 37°C
2.2 SERUM BATCH TESTING:
One o f the major problems associated with the use o f FCS in cell culture, is the batch to batch variation that exists In extreme cases this variation may result m a serum which w ill not support the growth o f cells, in more moderate cases growth may be retarded In instances where growth is the determining characteristic this factor becomes very important T o avoid artifactual results screening o f a number o f batches for growth o f the particular cells is recommended
2 .2 .1 Pretreatm ent o f cellsCells were pre-treated to ensure all cells were at the same stage o f growth by, seeding cells into tissue culture treated vessels, at low density, four days prior to experimentation On day four cells were fed with complete medium Cells were required to be approximately 75 % confluent on the day subculturmg for experimentationCells were seeded at low density 104 cells/m l in medium containing no FCS, into 96 w ell tissue culture treated plates ( 1 0 0 /¿1/w ell)FCS batches were added to the pre-seeded w ells over the range 2%, 10% and 20% (v/v) complete medium in 100 /¿I quantities, resulting m a 1/2 dilution o f the FCS samples and a final concentration range o f 1 %, 5% and 10% FCS, m each w ell Plates were placed in a 5% C 0 2
humid environment at 37°C for 5 days Growth was ascertained by the acid phosphatase enzyme activity (Martin et a l , 1991)
2.2.2 A cid phosphatase enzym e assay for cell growth:1) After mcubation with the desired compound for the required length o f time, 96
w ell plates were removed from the incubator and the medium removed2) The w ells were washed with PBS (100/xl) tw ice and the PBS removed3) To each o f the rinsed now empty w ells 100 id o f 10 mM para-
nitrophenolphosphate (Sigma Substrate 104) in pH 5 5 buffer (0 1 M sodium acetate 0 1% triton X -100 (BDH 30632)) was added
4) Plates were then covered in aluminium foil and placed in the dark at 37°C for 2 hours
66
5) After 2 hours 50 /¿I o f 1 N NaOH w as added to each w ell6 ) Growth was determined by the absorbance at 405 nm and 620 nm in a dual
wavelength elisa plate reader (Titertek Multiskan plus at 405 and 620 nm)
Results were recorded as a percentage o f a control i e cells grown in a FCS with known acceptable growth pattern The FCS w hich performs within the required growth profile is ordered in bulk for a block o f work to avoid artifactual variation which may result due to the FCS
2.3 TOXICITY TESTING:
Procedure for the detection o f toxicity o f chemicals on continuous cell lines in culture
Day 1 Pre-treated Cells (see section 2 3 1) were seeded into 96 w ell tissue culture plates at 1 0 3 ce lls/w ell i e 104 cells/m l in 1 0 0 /¿1/m l as for serum batch testing and allowed to attach overnight in 5% C 0 2, in a 37°C humid environment (Jouan C 0 2 incubator)D ay 2 Test compounds were added dissolved in the appropriate solvent, pH returned to appropriate 7 45-7 55, diluted to 2x the desired concentration and filter sterilised (ensuring that the solvent concentration is below 0 01% o f the final volume) Test compounds w ere then added in 100/il quantities to the test w ells and the plates returned to the C 0 2 incubator
- T oxicity tests were monitored each day until the controls growth i e cells not exposed to com pound, had reached approximately 80 % confluence At this point the test is terminated and growth determined by acid phosphatase test as in section 2 3 2
2.4 IMMUNOFLUORESCENCE ANALYSIS
2 .4 .1 Pretreatm ent o f slidesSlides w ere soaked in a solution o f 5% (v/v) o f RBS for 1-2 hours followed by rinsing m distilled (RO) water for 10 mms The slides w ere then kept in methanol at 4° C until required Slides w ere flamed and placed m sterile petri dishes just prior to use Cells w ere seeded at a concentration o f 105 cell/m l o f complete medium!, 20/il per w ell, on eight w ell H T C blue, autoclavable, 6 mm sterile slides The slides were then mcubated at 37° C in a humidified, 5% C 0 2 atmosphere for 24 hours For non adherent cells cells were mounted on non-sterile Gold star m icroslide at a concentration o f 10s cell/m l in PBS and allowed to air dry on the day
67
2.4.2 Procedure for surface membrane antigen Ep-16:
The incubated slides w ere washed in phosphate-buffered saline (PBS) three times and excess saline was removed using filter paper, taking care not to disturb the attached cells Slides were then placed in 3% (v /v ) formaldehyde at room temperature for 5 mins The slides were then submerged in acetone at -20° C for a further 5 mins Aliqouts o f 20 /xl o f EP16 conditioned medium (from an anti-human epithelium hybridoma (A T C C HB 155)) which contained the primary antibody, w ere added to each well Slides were then incubated at 37° C in a humid environment for 1 hour Follow ing this, the slides were washed with PBS for 10 mins , three times Secondary antibody (FITC-labelled antimouse IgM (1/30 dilution)Sigma) was added to each w ell m 20 /xl aliqouts and incubated at 37° C, in a humid environment, in the dark, for 1 hour Slides were then washed in PBS for 10 mins , three times keeping the light intensity low M ounting was m glycerol PBS 90 10 (v/v) and coverslips were sealed using clear nail varnish
2.4.3 Procedure for intracellular antigen
Slides were washed m PBS three times and excess saline removed using filter paper, as described above The slides w ere placed in methanol at -20° C for 7 mins and then removed to acetone at -20° C for 2 minsPrimary antibodies (conditioned medium from the lines 704A 1, 703D 4 expressing two murine IgG2Ak monoclonal antibodies and Anti-cytokeratin N° 18 (Bohreingher Mannheim 1 /ig/ml)) was added to each w ell m 20 fil quantities Slides were then incubated m a humid environment at 37° C for 1 hour. F ollow ing incubation the slides were rinsed three times for 10 mm each time m PBS The secondary antibody (goat anti-mouse FITC- as above) was added in 20 /¿I quantities and the slides were then incubated m the dark for 1 hour Sbdes were washed in PBS three tim e after incubation and mounted as above mentionedA ll slides were view ed both with and without oil immersion on a fluorescent microscope
2.4.4 Immunohistochemistry to detect for expression of enzyme:
This procedure was used to screen transfectants for gene expressionAhqouts o f 5 x 10* cells/m l in com plete medium were seeded on to slides (as described above) in growth medium and allowed to attach over night at 37° C, 5 % C 0 2, m a humid environment Follow ing this, slides w ere rinsed with PBS (15 mM sodium phosphate pH 7 4 , 0 15 M NaCl), fixed m acetone methanol (1 1) at -20° for 5 - 1 0 mins , and allowed to air dry for 5 mins at room temperature
68
Slides were then incubated with 400/xl quantities o f complete medium containing 5/ig //il of specific antibody (O xygene 001A1-P-RT polyclonal - rabbit anti-Rat Cytochrome P450IA1), at room temperature, in a humid environment for 35 mins Excess primary antibody was removed by washing in PBS for 10 mins , three times, shaking slowly Excess PBS was removed and 400/*1 o f full medium containing secondary antibody (goat anti-rabbit FITC (1 80)Sigm a F-0511) is applied Slides were then incubated at room temperature in a humidified atmosphere for 35 mins Excess secondary antibody was removed by rinsing for 10 mins in PBS three tim es, shaking slowlySlides were mounted in PBS/glycerol (Sigma G5516) (as above)"and viewed within one week
2.5 ISO-ENZYME ANALYSIS:
Iso-enzym e analysis was carried out using the Corning Authentikit System2.5.1 Cell extraction procedure:
1) A pellet o f 107 cells was resuspended m 10 ml cold Ca(II)-free, Mg(II)-free Earl’s Balanced Salt solution and re-pelleted at 1000 rpm for 5 mins
2) The resulting pellet was resuspended in 1 ml extraction buffer (50 mM Tris, pH 7 5 , 1 mM ED T A , 2 0% Triton X-100) and left to stand for 15 mins or until all the cells had been lysed (as determined by microscopic analysis)
3) The Cells w ere then sheared by continuous vigorious pipetting, ensuring that excessive foaming o f the samples did not occur, as this could lead to denaturing o f the protein
4) The suspension was then centrifuged at 2000g for 10 mins at 4°C5) 100 /¿L o f the resulting supernatant was removed and a 100 /¿I of authentiKit
stabilization buffer was added (This extract could be stored at -20°C for up to 6 months)
2 .5 .2 To test the extracts for enzyme activity
a) A vial o f each o f the six lyophilized enzyme substrates was reconstituted m 2 5ml o f 0 1 M PHAB AuthentiKit buffer and placed on ice for use withm 30 mins
The enzyme activities for which the cell extracts were tested were NP - Nucleoside phosphorylase, G-6 -P - G lucose-6 -phosphase dehydrogenase, MD - Malate dehydrogenase, MPI - M annose phosphate isomerase, PEP-B - peptidase B, LDH - Lactate dehydrogenase
69
For each enzymeb) 0 2 mis o f the reconstituted reagent was transferee! to a test tube and heated to
37°C m a water bathc) 1 0 /¿I o f cell extract was added to each o f the tubes 1 0 ¿¿1 deionised water was
added m place o f cell extract as a controld) The sample tubes were incubated for 10 minutes at 37°Ce) The reaction was stopped by addition o f 1 0 ml o f stoppmg reagent (0 05 N
HC1, 1 % Triton X -100 in distilled H^O) and the absorbance o f the samples read at 565 nm within 30 nuns Each sample was required to give an absorbance reading between 0 1 and 0 5 units, to carry out electrophoresis
Electrophoresis was carried out according to the AuthentiKit proceedure using the prepared agarose gels After electrophoresis gels were overlaid with the individual substrates and incubated for 20 mins , except for Pep B which required 40 mins incubation at 37°C in the incubator chamber After incubation the gels were rinsed in deionized H20 for 15- 30 mins to ensure that residual substrate was removed and to give a clear background The gels were then left to dry for 30 mins at below 65°C
2.6 CLONING IN AGAR
C ells were seeded at a range of densities from 103 to 2x10s cells/m l in DM E medium containing 10% FCS, and 2% P/S in 30mm plates The lower 1 5 ml agar layer contained 0 6 % Difco Bacto-agar (Detroit, U S A ) and was poured at 44°C The upper layer in which the cells w ere suspended contained 0 3% agar (this agar was at 40 5°C due to the presence o f cells and FC S) Cultures were incubated at 37° C, 5% C 0 2 in a humid atmosphere Colonies were allow ed to develop over a period o f 10 - 14 days Colonies greater than 50 mm m diameter w ere counted on an inverted microscope (CK Olympus Tokyo) at lOOx or 40x
2.7 fflSTOPATHOLOGY
C ells were analyzed for characteristic properties o f mahgnancy as seen m tissue sections, such as multiple nucleoli and tri- or multipolar mitoses (Gilvarry et a l , 1990) Cells w ere trypsmized and seeded on sterile 8 -well slides (Dynatech) at a concentration o f 2 5 x 10³ ce lls/w ell Slides were incubated for 24-48 hours at 37° C, 5% C 0 2 in a humid atmosphere Slides were rinsed in phosphate-buffered saline and the cells were fixed with absolute alcohol before staining with Carazzi’s haematoxylin and 0 5% eosm Glass slides w ere fixed in xylene for 1 hour followed by mounting in DPX (BDH Chemicals)
70
V

2.8 CHROMOSOMAL ANALYSIS
Chromosome harvest was achieved by addition o f colcemid (0 02 ug/ml) to log phase cultures for the first two hours o f incubation Culture flasks were shaken, the detached cells collected in centrifuge tubes and centrifuged at 1000 rpm for five minutes The cells were then subjected to hypotonic treatment which consisted o f exposure to 0 075 M KCl for 20-35 minutes Initial fixation in methanol acetic acid (3 1) was followed by three washes in fresh fixative Air-dried preparations were either stained conventionally m 3% giem sa (Gurr
35086) or incubated overnight at 60° C and G banded according to the method o f Seabright (1971)
2.9 DNA ISOLATION:
2.9.1 Preparation of competent cells for transformation:
1) 20 ml sterile L-broth (Oxoid cm l) was inoculated with either JM109 or C600 E coll, in a 50 ml universal and grown over night at 37° C in a shaking incubator at 250 rpm
2) 4 mis o f this overnight culture was mnoculated into 400 ml sterile L-Broth m a sterile 2 Litre baffled flask and placed at 250 rpm at 37°C until the absorbance at 590 nm was exactly 0 375
3) This culture was then ahquotted mto pre-chilled 50 ml umversals and left on ice for 5-10 mins
4) The cells were then centrifuged at 3000 rpm @ 4°C for 7 mins5) The supernatant was removed and the pellet resuspended in 10 mis ice-cold
sterile CaCLj (60 mM CaCLj (Sigma C 7902), 15% Glycerol, 10 mM PIPES (Sigma P9291) @ pH 7 0
7) Cells were centrifuged again for 5 mins at 2500 rpm @ 4°C, the resulting pellet was resuspended m 2 ml ice-cold CaC^
8 ) This suspension was left on ice for 12 - 24 hours9) After the 12-24 hours cooling the suspension was dispensed in batches into -
70°C pre-chilled sterile eppendorfs and stored at -70°C
2 .9 .2 Transformation of bacteria with plasmid:
1) 10 ng o f D N A to be transformed was placed in a sterile eppendorf
71
2 ) 1 0 0 jtl competent cells were taken directly from the freezer, thawed quickly and added to the D N A , the contents o f the eppendorf were swirled gently
3) This eppendorf was placed on ice for 30 mins4) 1ml L-broth was added to this suspension, mixed gently by inversion and
incubated at 37°C and 250 rpm for 1 hour5) The cells were then pelleted for 1-2 mins at 13,000 rpm and resuspended in 200
/il L-Broth6 ) 2 0 0 /il o f this culture was then lawned on "resistance plates" containing the
selective agent coded for in the plasmid which had been transformed7) These plates were then incubated at 37°C overnight8 ) Colonies were checked for plasmid by mim-prep
2.9.3 Small scale preparation of plasmid DNA - miniprep:
1) One colony (from the transformed plates, section 2 7 2) was removed to 2 ml selective L-broth (i e containing ampicilhn (amp Sigma A-9393)), 100 /¿g/ml if the plasmid expresses amp resistance) and incubated over-night at 250 rpm and 37°C
2) 1 5 ml o f this overnight culture was placed into a sterile eppendorf and the cells pelleted at 12,000 rpm for 30 seconds at 4°C (the remaining 0 5 ml was stored at 4°C until required)
3) The supernatant was removed completely and the pellet resuspended in 100 fi 1 o f ice cold solution 1 (50mM glucose, 25mM Tris-HCl pH 8 0 (Sigma T8524) 10 mM EDTA pH 8 0 , autoclaved and stored at 4°C
4) 200 /il o f fresh solution 2 (0 2 N NaOH, 1 % SDS (Sigma L-5125)) was addedto the eppendorf
5) To this was added 150 /¿I ice cold solution 3 (60 ml 5M potassium acetate /1 1 5ml glacial acetic acid (BDH 27013) made up to 100ml with UPH20 ) and the eppendorf was inverted for 10 seconds and stored on ice for 3-5 mins
6 ) This solution was then centrifuged at 12,000 for 5 mins at 4°C and thesupernatant removed to a clean eppendorf
7) To this was added an equal volum e o f equikbrated (see section 2 7 4)phenol(SigmaP-1037) chloroform (BDH 10077) Isoamylalcohol (RdeH 60217) (25 24 1 v/v/v)
72
After mixing the solution was then centrifuged for 2 nuns at 12,000 rpm The upper clear layer was transferee! to a clean eppendorf and this process was repeated with chloroform isoamylalcohol (50 1 v /v ) tw ice more to remove all phenol
8 ) 2 volumes o f 1 0 0 % ethanol were then added and the solution allowed to stand at room temperature for 2 mins
9) This was followed by centrifugation at 12 ,000 g for 5 mins 4°C10) The supernatant was removed and the tube inverted on tissue paper and allowed
to dry11) The semi-dry pellet was rinsed once with 1ml 70% ethanol at 4°C - to remove
the supernatant and allowed to dry at room temperature for 1 0 mins12) The pellet was resuspended m 50 /¿I TE (lOmM Tris-H Cl, pH 8 0, ImM
EDTA pH 8 0) and stored at -20° C
2.9 .4 Phenol equilibration:
1) Frozen phenol was melted at 6 8 ° C in a water bath in a fume hood To the phenol was added an equal volum e o f 0 5 M Tris-H Cl, pH 8 0 and the mixture was stirred using a magnetic stirrer for 15 mins The phases were left to settle and the upper aqueous layer was then removed by pipette
2) An equal volume o f 0 1 M Tris-HCl, pH 8 0 was added and stired for 15 mins, the layers were allowed to settle and the upper aqueous layer removed again This process was repeated with 0 1 M Tris-H Cl, pH 8 0 until the phenol reached pH 8 0, tested using litmus paper
3) 0 1 M Tris-HCl pH 8 0 containing 0 2% /8 -mercapto-ethanol (Sigma M 7154) was then added to a volume o f on tenth o f the total volum e and the phenol was then stored in a dark bottle at 4° C for 1 month only
2.9 .5 Large-scale DNA preparation:
1) 10 mis sterile selective L-broth was inoculated with a loop of transformed bacteria and incubated at 37°C at 250 rpm overnight
2) 1 Litre sterile selective L-broth was then inoculated with the overnight culture and incubated overnight at 250 rpm and 37°C
3) The cells were centrifuged for 20 mins at 4°C at 12,000 g
73

4) The resulting pellet was resuspended in 3 mis o f Solution 1 (25% sucrose in 0 05 M Tris-HCl pH 8 0) and transfered to a 30 ml sorvell tube
5) To this was added 1ml solution 2 - 0 25 M Tris-HCl containing 25g/l lysozyme (Sigma L6876, prepared just prior to use) and the resulting solution was left on ice for 15 nuns
6 ) When this time had elasped, 7 mis o f solution 3 (2% Triton X-100 in 0 05 M Tris-HCl, 0 0625 M EDTA pH 8 0) was added and the container was placed on ice for a further 15 mins
7) This solution was then spin-cleared at 48 ,0 0 0 g for 45 mins at 4°C and removed to a sterile universal
8 ) 1 g per ml o f solution o f CsCl (C4036) was added per ml o f supernatant and then 0 5 m l ethidium bromide (10 mg/m l)
9) To clear the solution the univeral was spun at 8000 g for 5 mins and the supernatant transferred to a 20 ml heat seal tube (Beckman)
10) The tubes were balanced to within 0 01 g and centrifuged for 40 hours at 125,000g and 21°C in a Beckman 70iTi rotor
11) The heat seal tube was viewed in front o f a UV source The lower plasmid band was removed using a 2 0 gauge syringe taking care not to contaminate this band with the upper genom ic band
12) In the case o f D N A used for transfection, this band was mixed with CsCl/TE pH 8 0 (lg /m l) and recentrifuged at 125,000g for 40 hours at 21°C in a Beckman 70iTi rotor in a Beckman X L 80 ultracentrifuge After this centrifugation the lower plasmid band was reisolated as above - this ensured very clean D N A for transfection
13) The isolated band was then added to an equal volume o f isopropanol and the upper layer removed, this process was repeated until the lower layer was clear This removed the ethidium bromide from the sample
14) The resulting sample was then dialysed against TE (pH 8 0) for 40 hours with regular changes o f the buffer
15) The dialysed sample was then phenol extracted as in section 2 7 3 steps 7-12
2 .9 .6 P lasm id isolation using PZ523™ spin colum ns:Extraction was carried out according to the procedure supplied with the columns - (5 prime -*3 prim e, Inc , Boulder, CO U S A )
74

2 .9 .7 Removal of contaminating RNA from DNA samples:
2.9.7.1 RNAse procedure:
1) D N A was disolved m 5 ml o f TE pH 8 02) To the disolved pellet was added 10 /¿I o f 10 m g/ml DNAase-free RN A se (5 ’-3 ’
Inc , Boulder, CO, U S A , 5305-461036) and the resulting solution incubated for 30 mins at 37°C
3) After incubation the D N A solution was extracted once with 5 mis o fphenol chlorofrom isoam ylalcohol (25 24 1, v /v /v)
4) The aqueous phase was removed and extracted with 5 mlchloroform isoam ylalcohol (24 1 v/v)
5) The aqueous phase w as isolated again and 10 M ammonium acetate added (RdeH 32301) to a concentration o f 2 0 M
6 ) 0 6 volum e o f 1 0 0 % isopropanol was then added at room temperature and mixed by inversion The resulting solution was left at room temperature for 30 mins
7) After 30 mins the solution was centrifuged at 13,000 rpm for 30 mins at 20PC and the pellet washed with 5-10 ml ice cold 70% ethanol (Merck 986)
8 ) The sample was repelleted at 13,000 rpm for 5 mins and the pellet was allowed to air dry
2.9 .7 .2 Polyethylene glycol (PEG) procedure:
1) The D N A pellet was resuspended in 20 /xl TE pH 8 0 and add 4 /¿I o f 4 M NaCl were added follow ed 20 /il 13% PEG (Polyethylene glycol RdeH 32309)
2) The resulting mixture was placed on ice for 20 mins and centrifuged at 13,000 for 30 mins
3) The pellet was washed with 70% ethanol twice and allowed to air dry4) The washed pellet was resuspended in TE pH 8 0 and stored at -70PC
2 .9 .2 .3 Sephadex G-50 (Superfine Pharmacia) procedure:
1) Sephadex G -50 (Pharmacia 17-0041-01) was equilibrated with sterile H20 andI
allowed to settle
75
2) The water was removed and replaced with TE, the suspension was allowed to settle the process was and repeated
3) The equilibrated G -50 was added to a 1 5 ml eppendorf which had previously been punctured, plugged with glass w ool which had been coated with repelcote as per section 2 0 1 and autoclaved The filled column was centrifuged for 4 mins at 1600 g and this step repeated until the height o f the column remained constant at 1 m l A layer o f TE was placed on top o f the column, the eppendorf was sealed with parafilm and stored at 4°C until required
4) Just prior to use the colum n was spun dry, and 100 /¿I o f contaminated DN A sample diluted in TE was layered on top o f the G-50 The column was centrifuged at 1600 g for 4 mins The eluate which contained the cleaned DNA was recovered
2.10 DNA ANALYSIS - GEL ELECTROPHORESIS:
A nalysis o f D N A samples was carried out using 1% Agarose which was dissolved in IX TBE (5 X , 5g-Tris 27 5 g Boric acid 20 ml 0 5M EDTA, pH 8 0) and the solution was brought to the b oil When the molten ge l had cooled to approximately 37°C, 3/il o f lOmg/ml ethidium brom ide were added and the gel was poured into to the casting well o f the a BRL Horizon 58 m ini gel system, the combs w ere then inserted and the gel was left to solidify T he samples are diluted 6 1 w ith 6 X loading buffer (0 25 % Bromophenol blue (Sigma B5525), 40% sucrose)in an eppendorf Samples were then centrifuged down to ensure all the volume w as at the bottom o f the eppendorf The gel was loaded using a Gilson P-10, overlaid with IX T B E and run at "low" for approximately 1-2 hours The D N A was then visualized as bright pink bands by placing the gel on a transilluminator (U V P transilluminator) Samples were compared with lambda markers cut with the appropriate restriction enzyme to ensure bands o f the desired size The D N A was illuminated by the UV hght due to the presence o f the ethidium brom ide in the gel which attaches in the grooves o f the D N A
2 .10 .1 . Restriction digestion o f DNA.
Restriction enzyme digestion o f D N A was carried out m this work to kneanse plasmid D N A for transfection, for diagnostic purposes to ensure the identity of a plasmid and to produce lambda markers for gel electrophoresis
76
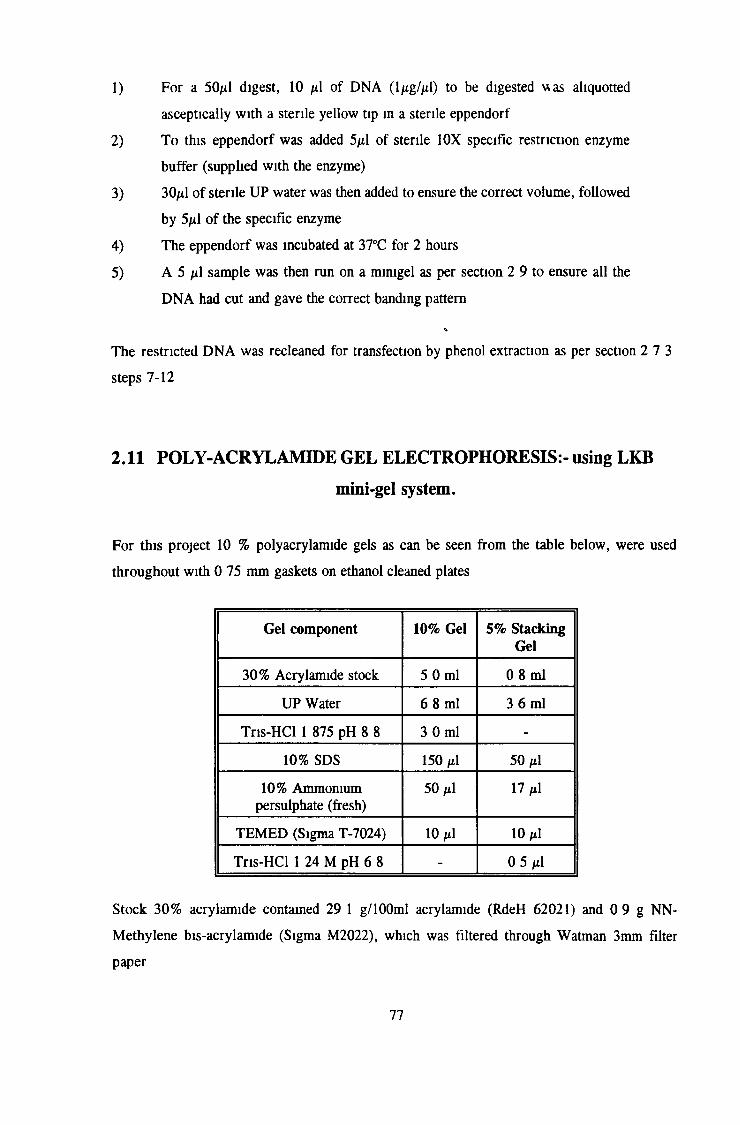
1) For a 50/il digest, 10 /xl o f DN A (l/xg//xl) to be digested was aliquotted asceptically w ith a sterile yellow tip in a sterile eppendorf
2) T o this eppendorf was added 5/xl of sterile 10X specific restriction enzyme buffer (supplied with the enzyme)
3) 30/zl o f sterile UP water was then added to ensure the correct volume, followed by 5/xl o f the specific enzyme
4) The eppendorf was incubated at 37°C for 2 hours5) A 5 /xl sample was then run on a minigel as per section 2 9 to ensure all the
D N A had cut and gave the correct banding pattern
The restricted D N A was recleaned for transfection by phenol extraction as per section 2 7 3steps 7-12
2.11 POLY-ACRYLAMIDE GEL ELECTROPHORESIS:- using LKB
mini-gel system.
For this project 10 % polyacrylamide gels as can be seen from the table below, were usedthroughout with 0 75 mm gaskets on ethanol cleaned plates
Gel com ponent 10% Gel 5% Stacking Gel
30% Acrylamide stock 5 0 ml 0 8 mlUP Water 6 8 ml 3 6 ml
Tris-HCl 1 875 pH 8 8 3 0 ml -
10% SDS 150 /xl 50 /xl10% Ammonium
persulphate (fresh)50 /xl 17 /xl
TEM ED (Sigma T-7024) 1 0 /xl 1 0 /xl
Tris-HCl 1 24 M pH 6 8 - 0 5 /xl
Stock 30% acrylamide contained 29 1 g/100m l acrylamide (RdeH 62021) and 0 9 g NN- M ethylene bis-acrylamide (Sigma M 2022), which was filtered through Watman 3mm filter paper
77
rEqual protein concentration o f samples were made up 50 50 with loading buffer (2 5 ml 1 25 M Tris-H Cl pH 6 8 , 10% SD S, 2 5 ml /3-mercaptoethanol, 2 9 ml glycerol, 0 1 % bromphenol blue - made up to a total o f 50 mis with water) Samples were boiled for 2 mms and loaded onto the gels Gels were run according to the procedure o f Laemmli (1970) for 50 mins at 250 M 45 mA for 2 gels m IX running buffer (10X - 1 9 M glycine (RdeH 33226), 0 25 M Tris, 0 1% S D S -p H 8 3)
2 . 1 2 W ESTER N BLOT ANALYSIS:
2.12.1 Sample preparation:
Membrane and cytosolic preparations for western blot analysis were prepared by the following procedure The cell lines to be tested were grown m their specific medium until they were 80% confluent Cells were fed the evening prior to extraction
1) Cells were trypsmized in the usual manner and the pellet rinsed three times with PBS containing 2 mM PMSF (Phenylmethylsulfonyl Fluoride Sigma 7626)
2) Cells were ruptured by sonication on ice at 045 mA, 20 pulses followed by a 1 0 second rest, three times
3) Homogenate was spun at 4000g for 10 mins at 4°C4) Supernatant was then centrifuged at 100,000 g for 1 hour at 4°C5) Both pellet and supernatant were retained The pellet was resuspended in PBS-
PM SF and lyophihsed Supernatant was used directly
G els w ere run according to section 2 11
2.12 .2 Blotting:
1) The acrylamde gel was removed after electrophoresis to blotting buffer (20 mM Tris, 150 mM glycine -make up fresh each mne)(Towbin et a l , 1979)
2) The nitrocellulose (Hybond- C Amersham) was soaked in blotting buffer for 5 mins
3) 4 sheet of Watman 3mm filter paper which were the same size as thenitrocellulose piece to be blotted, were stacked and soaked in blotting buffer The filter paper was placed on the cathode plate o f the semi dry blotter
78
The nitrocellulose was placed over the filter paper stack, ensuring that no bubbles had developedThe gel was placed on the nitrocellulose and covered with 4 more sheets of filter paper treated as before, once again ensuring that no bubbles have entered the systemThe transfer took place at 0 34 mA/015 V for 15-30 mins (or as long as was required for the size protein to be transfer and the thickness o f the gel)20-25 mms was the required transfer time for the proteins transfered in this studyThe filter paper was removed and the was nitrocellulose marked at the location o f the gels lanes and the molecular weight markersThis blot was placed in blocking buffer (TBS (500m M NaCl, 20 mM Tris - pH 7 5), 3% Marvel (Cadbury’s Marvel Skimmed milk) for at least 1 hour or over night at 4°C
After blocking the buffer was removed and primary anti-body (1 200 dilution for GST anti a , n and v anti-bodies (BioTrin) and 1 100 for Oxygene P450IA1 anti-body) was added in TBS with 1 % Marvel for 1 hour at room temperature After incubation the blot was washed for 10 mms three times in TBS containing 0 05% tween 20 (Aldrich 9005-64-5) at room temperature Secondary anti-body - Goat anti-rabbit IgM 1 18,000 dilution with TBS containing 1 % marvel, was then added for 1 hourThe blot was washed again for 10 mms three tim es in TBS containing 0 05% tween - 2 0The blot was then removed from TBS 0 05% tw een-20 and placed in 100 ml solution X - (10 ml (a), 4 ml (b), 400 /¿I (c) and 8 8 6 ml ( d ) )a) 0 1% Nitroblue tetrazohum (NBT)(Sigma H 5514) in 10 mM
Tris-HCl pH 8 9 (1 tablet in 10 mis)b) 5m g/m l 5-bromo-4-chloro-3-mdolylphosphate- BCIP (Sigma
B0274) m DM F (Dimethyl formamide Sigm a D 8654)c) 1M MgCl2d) 0 5 M Tris-HCl pH 8 9This proceedure developed the colour of the blot, which was then rinsed in distilled water and stored dry away from the light
2.13 TRANSFECTION OF MAMMALIAN CELLS:
2.13.1 Calcium Phosphate mediumed transfection:
Day 1 Pre-treated cells (see section 2 3 1) were seeded in complete medium at 5 x 10⁵ cells per 10 mm petri dish, so as to ensure that the cells are 70% confluent on day 2 Plasmid DNA was diluted to 1 /¿g/ml in TE The required quantity o f prepared D N A (see section 2 7 5) (10/ig) was diluted with 410 /il sterile H20 m a sterile 3 ml tube and stored overnight at 4°C
Day 2 1) The tubes containing the D N A were incubated at 37°C for 1 hour 480 /il 2X HBS (2X HBS pH 7 12 (280 mM NaCl, 1 5 mM N a ^ P O ,, 50 mM HEPES) filter sterilizd and stored at 4°C) was placed into a sterile tube and left at room temperature2) 60 /il 2 M CaCl2 was added dropwise into the tube containing the D N A with continual mixing using a vortexImmediumtely after the DNA-CaCl^ mixture was added to the 2X HBS dropwise with continuous mixing using a vortex and allowed to stand at room temperature for 30 mins in the laminar flow3) After 30 mins DNA-CaC^ mixture was added to the cells drop by drop with constant gentle aggitation o f the universal, to ensure even mixing4) The plate was returned to the incubator for 4 hours5) To aid the entry o f D N A the cells were glycerol shocked after the 4 hour incubation The DNA-CaClj was removed and 5 ml o f 10 % sterile glycerol in 1 x HBS was added The glycerol was left on the cells for exactly 3 mins and then removed by repeated washing with serum free medium6 ) The transfected cells were fed with complete medium and returned to the incubator
Day 3 The plates were passaged to low density and allowed to attach Day 4 The plates were fed with complete medium containing the selective agent - see
section 2 0 4 3Surviving colonies were cloned out by cloning cylinders after 10-15 days
2.13.2 Electroporation mediated transfection:
1) Pre-treated cell were isolated (after rinsing twice in ice cold XPBS) at aconcentration of 1 x 10⁷ cells/m l in XPBS(137 mM NaCl, 2 7 mM KC1, 4 3mM N a^P O * 7H20 , 1 4 mM KH2P 0 4 - pH 7 3)
80
2) 0 5 ml o f cell suspension was removed to a precooled electroporation cuvette (BioRad 165-2088) and placed on ice
3) 10 ng o f prepared D N A (2 9 5) was added to the cell suspension and the cuvette "flicked" to ensure correct mixing The cuvette was then left to stand on ice for 5 mins
4) The cuvette was placed in the electroporation apparatus and one pulse was delivered (for DLKP - resistance = infinity, capacitance 2000, one pulse only required)
5) The cuvette was then returned to ice for a farther 10 mins6 ) The transfected cells were diluted 20 fold in nonselective complete medium7) These cells were grown for 48 hours after which time the medium was replaced
with complete medium containing selective agent and sruvivmg colonies were isolated as described in 2 13 3
2.13.3 CLONING COLONIES:
To clone out the plasmid containing colonies,1) The colonies to be cloned w ere located by microscopy and marked A sterile
steel cloning cylinder ( 6 mm) (which had been dipped m sterile silicon grease to create a seal with the base o f the petri dish) was placed over the colony to isolate it
2) The medium inside the cloning ring was removed aseptically and replaced with 100 n\ prewarmed trypsin using a 200 /xl G ilson A second 100 ¡A trypsin was added and the plate left at 37°C for 2-3 mins
3) The trypsin was gently pipetted in the cyknder and removed to a 24 w ell plate 3 mis complete medium was added and the cells were allowed to attach overnight
4) The next day the medium was replaced with fresh complete medium and the clones left to grow
2.13.4 To test for frequency of transfection using plasmid PCH110.
1) Cells were transfected with PC H 110 as m sections 2 13 1 and 2 13 2 A sampleo f the transfected cells, o f a known quantity, were kept separate for this test
81
2) At the 48 hour point these cells were rinsed tw ice with 10 mis PBS3) The cells were placed m fixative for 10 mins, twice, by adding 10 ml fixing
solution (25% gluteraldehyde-0 4ml (Sigma G -6257, 0 5 M sodium phosphate buffer pH 7 3-10ml, 0 1 EGTA (Sigma E-4378), pH 8 0-2 5ml, 1 0 M M gCl2- 0 1 ml and 37 0 ml deionised water)
4) After fixation the cells were washed twice for 10 mins, with rinsing solution (40 ml 0 5M phosphate buffer pH 7 3, 0 4 ml 1 0 M MgCl2 (Sigma M 0250),20 mg Sodium deoxycholate, 40/zl N P-40, 160 nl deionised water)
5) The cells were stained overnight at 37°C, with 2 5 ml staining solution (10m l rinsing solution, 25m g/m l in D M F o f X-Gal, 16 5 mg potassium ferricyanide (Sigm a P8131), 16 5 m g potassium ferrocyamde (Sigma P9387))
6 ) After staining the cells were rinsed with rinsing solution for 10 mins twice and stored in rinse solution at 4°C sealed with parafilm to prevent evaporation
7) The stained colonies were view ed under an inverted microscope - colonies containing the plasmid stained bright blue, plasmid negative colonies remained transparent
2.14 POLYMERASE CHAIN REACTION FOR DETECTION OF
PLASMID:
The plasmid PSVP4501A1 contains no gene for a selective agent Therefore it was necessary to co-transfect this plasmid with p SV 2N eo, w hich contains geneticin G-418 resistance, to enable selection o f the cell containing the plasmid T o achieve this the plasmids were transfected at a ratio o f 2 0 1 PSV450IA1 PSV 2N eo This proceedure operates on the principle that, i f a cell takes up and expresses geneticin resistance, then due to the twenty times greater concentration o f PSV450LA.1, then it is assumed that the PSV P450 plasmid was also taken up H ow ever, expression o f the PSV 2N eo was detected in DLKP co-transfected cells, PSV450IA1 was not detected It was essential to investigate the PSV 2N eo positive cells to see if they had taken up the PSV450IA1 plasmid or not The method chosen to carry this out was Polymerase Chain Reaction (PCR) Primers coding for 20-30 bp o f the CYP1A1 cDNA segm ent which is present m the plasmid were chosen, from the cD N A sequence o f rat CYP1A1, previously published sequence o f Yabusaki et a l , 1984, primers o f 20-30 bp were chosen and sent by E- M ail for verification to "Genebank" at Heidlberg
82
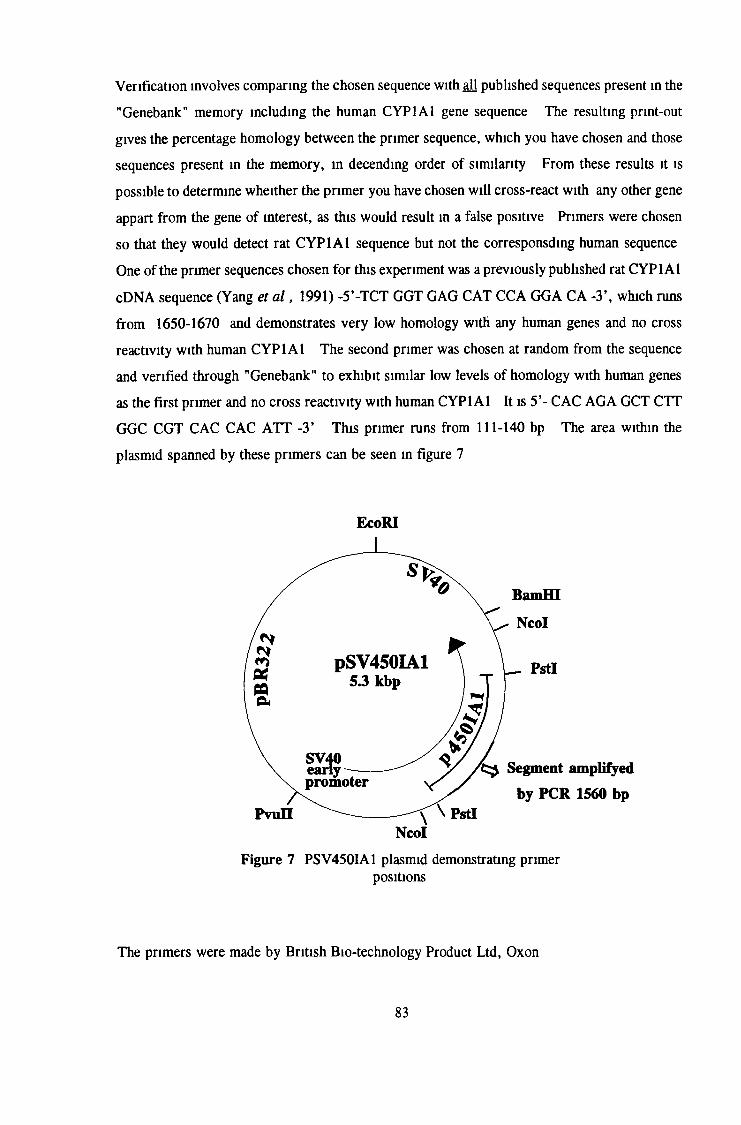
Verification involves comparing the chosen sequence with aU published sequences present in the "Genebank" memory including the human CYP1A1 gene sequence The resulting print-out gives the percentage hom ology between the primer sequence, which you have chosen and those sequences present in the mem ory, in decending order o f similarity From these results it is possible to determine wheither the primer you have chosen w ill cross-react with any other gene appart from the gene o f interest, as this would result in a false positive Primers were chosen so that they would detect rat CYP1A1 sequence but not the corresponsding human sequence One o f the primer sequences chosen for this experiment was a previously published rat CYP1A1 cD N A sequence (Yang et a l , 1991) -5 ’-TCT GGT GAG CAT CCA GGA CA -3 ’, which runs from 1650-1670 and demonstrates very low homology witli any human genes and no cross reactivity with human CYP1A1 The second primer was chosen at random from the sequence and verified through "Genebank" to exhibit similar low levels o f hom ology with human genes as the first primer and no cross reactivity with human CYP1 A l It is 5 ’- CAC AG A GCT CTT GGC CGT CAC CAC ATT -3 ’ This primer runs from 111-140 bp The area within the plasmid spanned by these primers can be seen in figure 7
EcoRI
Pvuü ~ PstI
Segment amplified by PCR 1560 bp
BamHI
Ncol
PstI
NcolFigure 7 PSV450IA1 plasmid demonstrating primer
positions
The primers were made by British Bio-technology Product Ltd, Oxon
83
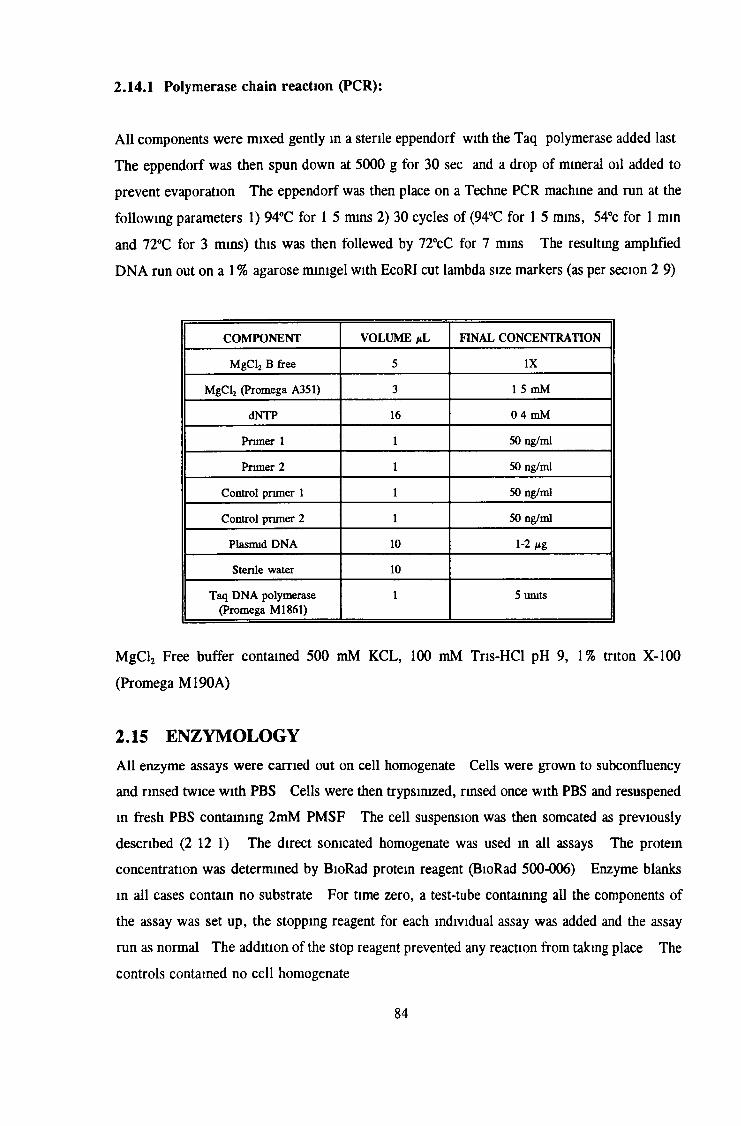
2.14.1 Polymerase chain reaction (PCR):
A ll components w ere mixed gently in a sterile eppendorf with the Taq polymerase added last The eppendorf was then spun down at 5000 g for 30 sec and a drop o f mineral oil added to prevent evaporation The eppendorf was then place on a Techne PCR machine and run at the follow ing parameters 1) 94°C for 1 5 mins 2) 30 cycles o f (94°C for 1 5 mins, 54°c for 1 min and 72°C for 3 mins) this was then follewed by 72°cC for 7 mins The resultmg amplified D N A run out on a 1 % agarose m im gel with EcoRI cut lambda size markers (as per secion 2 9)
COMPONENT VOLUME itL FINAL CONCENTRATIONMgCl2 B free 5 IX
MgCl2 (Promega A351) 3 1 5 mMdNTP 16 0 4 mM
Primer 1 1 50 ng/mlPrimer 2 1 50 ng/ml
Control primer 1 1 50 ng/mlControl primer 2 1 50 ng/ml
Plasmid DNA 10 1-2 /igSterile water 10
Taq DNA polymerase (Promega M l861)
1 5 units
M gCl2 Free buffer contained 500 mM KCL, 100 mM Tris-HCl pH 9, 1% triton X-100 (Promega M l90 A)
2.15 ENZYMOLOGY
A ll enzyme assays w ere carried out on cell homogenate Cells were grown to subconfluency and rinsed tw ice w ith PBS Cells were then trypsimzed, rinsed once with PBS and resuspened m fresh PBS containing 2mM PM SF The cell suspension was then somcated as previously described (2 12 1) The direct sonicated homogenate was used in all assays The protein concentration was determined by BioRad protein reagent (BioRad 500-006) Enzyme blanks in all cases contain no substrate For time zero, a test-tube containing all the components o f the assay was set up, the stopping reagent for each individual assay was added and the assay run as normal The addition o f the stop reagent prevented any reaction from taking place The controls contained no cell homogenate
84
2.15.1 Spectrophotometric detection:
2.15.1.1 Aminopyrine N-demethylation
The N-demethylation o f aminopyrine results in the stochiometric production o f one molecule formaldehyde per molecule o f aminopyrine which can be detected using the Hantszch reaction (N ash, 1953)1) Reaction contained 1 0 ml o f co-factor solution as follows 0 1 M Tris-HCl pH
7 4 -8 5 ml, 0 15 M M gCl2/0 1 M semicarbazide- 1 0 ml, 0 5 M nicotinamide - 1 0 ml (BDH 44068), 40 m g glucose-6 -phosphate(Sigma G -7879), 2 Units glucose-6 -phosphate dehydrogenase, 8 mg NA DP+
2) 1 ml o f co-factor solution was added to 0 5 ml 20 mM aminopyrine (Sigma D - 8015) and pre-warm at 37°C for 2 mins
3) To start the reaction 0 5 m l o f cell homogenate was added and incubated at 37°C for 30 mins
4) To terminate the reaction 0 5 ml 25% zinc sulphate (Sigma Z-4750) was added and the tubes placed on ice for 5 mins
5) 0 5 ml o f saturated barium hydroxide (Sigma B-2507) was then added and the solution allowed to stand for 5 mins, then centrifuged for 5 mins at 1000 rpm
6 ) 1 ml o f supernatant was then removed and added to 2m l Nash reagent (30g ammonium acetate (RdeH 32304), 0 4 ml acetylactone (Sigma A -3511), made up to 100 ml with water) followed by incubation at 6°C for 30 mins
7) The tubes were then cooled and read at 415 nm
Results were determined relative to a formaldehyde (BDH 10113) standard curve
2.15 .1 .2 Assay for the glucuronidation of 2-aminophenol.
T his assay is based on the principle that a diazomum salt is formed on the addition o f a sodium nitrite to an acidified solution o f an aromatic amine This diazonums salt reacts with N- naphthyethylene diamine and produces an coloured azo compound, the concentration o f which can be determined spectrophotometrically at 540 nm1) 1 ml o f co-factor solution (0 1 M Tris-HCl pH 8 0 - 8 0 m l, 0 15 M gCl2 - 0 1
ml, 1 % w /v Triton X -100 - 0 5 ml, 0 02 M Ascorbic acid 1 0 ml, 10 mg U D P- glucuromc acid (Sigma U -6751)) was added to 0 5 ml o f 1 mM 2-aminophenol(BDH 26008) The reaction was initiated with 0 5 ml cell homogenate andincubated at 37°C for 30 mins with constant shaking
85
2) To stop the reaction 1 ml of ice-cold 20% (w /v) Trichloroacetic acetic (RdeH 27242) in 0 1 M phosphate buffer pH 2 7 was added and the tubes placed on ice for 5 nuns
3) The resulting solution was centrifuged at 1000 rpm for 5 mins and 1 ml o f the supernatant removed to 0 5 ml (fresh) 0 1 % sodium nitrite and left to stand for 2 mins
4) To this 0 5 ml o f 0 5% ammonium sulfamate was added and left to stand for a further 3 mins
5) 0 5 ml o f 0 1% N-naphthylethylene diamine (Sigm a N -9125) was then added and the solution left to stand at room temperature in the dark for 60 mins
6 ) The absorbance was read at 540 nm An aniline (BDH 27229) standard curve was used to determine the concentration o f azo produced
2.15.1.3 Assay for Glutathione-S-transferase:
This assay is based on the conjugation o f glutathione to 2 ,4-di-nitrochlorobenzene forming 2,4- dimtrophenyl-glutathione which absorbs light at 340 nm and has an extinction co-efficient o f 9 6
mM '1 c m 1 (Gibson et a l , 1987)1) 2 cuvettes containing 0 1 ml 30 mM glutathione (Sigm a G -4251), 0 1 ml of 30
mM dmitrochlorobenzene (m ethanol) and 2 2 ml o f 100 mM potassium phosphate buffer pH 6 5 for 2 mins, were placed in the constant temperature chamber o f a dual beam (Shimadzu UV 160A) spectrophotometer
2 ) 0 6 m l o f water was added to the reference cuvette and 0 6 ml of cellhomogenate to the sample cuvette
3) The reaction was then followed at 340 mm over 3 mins giving a change inabsorbance per mm which is related to conjugation by the extinction coefficient
2.15.1.4 Determination of NADPH-cytochrome-c-reductase
This reaction is based on the reduction o f the ferric cytochrome to the ferrous form which has a characteristic absorbance at 550 nm and an extinction co-efficient o f 19 6 /¿moles conjugated per mm per mg o f cell homogenate protein (Gibson et a l , 1987)
86
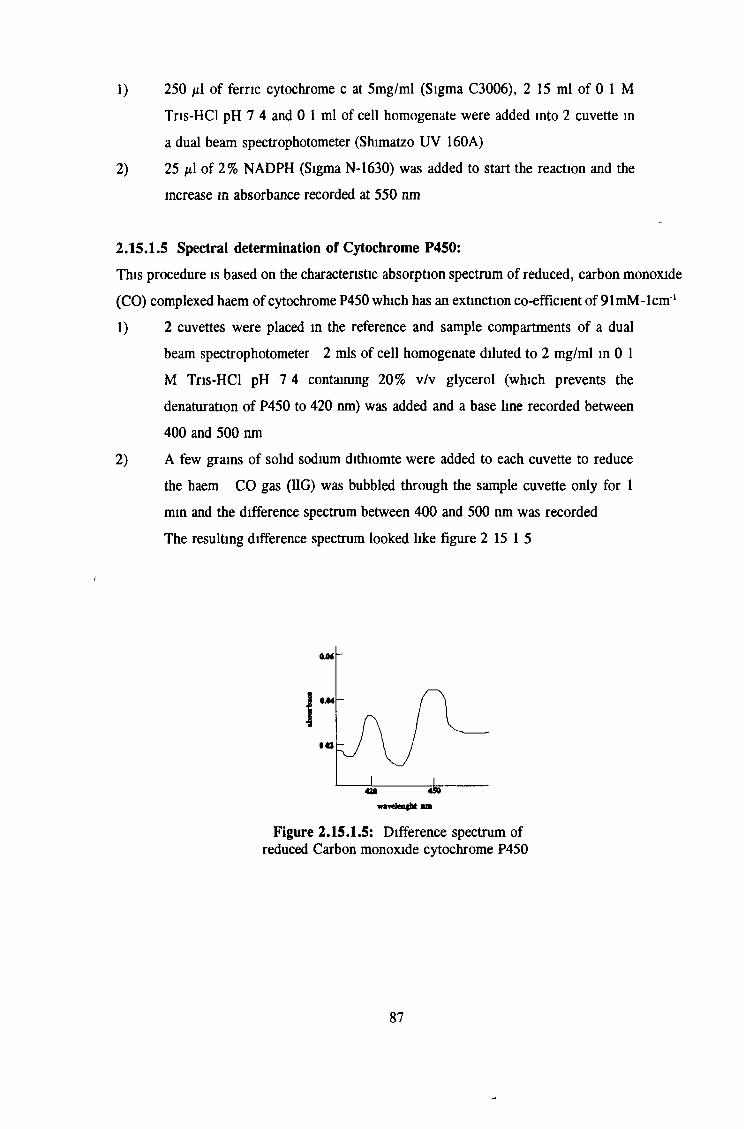
1) 250 ¡il o f ferric cytochrome c at 5m g/m l (Sigm a C3006), 2 15 ml o f 0 1 MTris-HCl pH 7 4 and 0 1 ml o f cell homogenate were added into 2 cuvette in a dual beam spectrophotometer (Shimatzo U V 160A)
2) 25 ¡il o f 2% N A D PH (Sigma N-1630) was added to start the reaction and the increase m absorbance recorded at 550 nm
2 .1 5 .1 .5 Spectral determ ination o f Cytochrom e P450:This procedure is based on the characteristic absorption spectrum o f reduced, carbon monoxide(CO) complexed haem o f cytochrome P450 which has an extinction co-efficient o f 91m M -lcm ''1) 2 cuvettes were placed in the reference and sample compartments o f a dual
beam spectrophotometer 2 mis o f cell homogenate diluted to 2 mg/m l in 0 1 M Tris-HCl pH 7 4 containing 20% v /v glycerol (which prevents the denaturation o f P450 to 420 nm) was added and a base line recorded between 400 and 500 nm
2) A few grains o f solid sodium dithiomte were added to each cuvette to reducethe haem CO gas (EG) was bubbled through the sample cuvette only for 1 mm and the difference spectrum between 400 and 500 nm was recordedThe resulting difference spectrum looked hke figure 2 15 1 5
Figure 2 .15 .1 .5 : Difference spectrum of reduced Carbon monoxide cytochrome P450
87
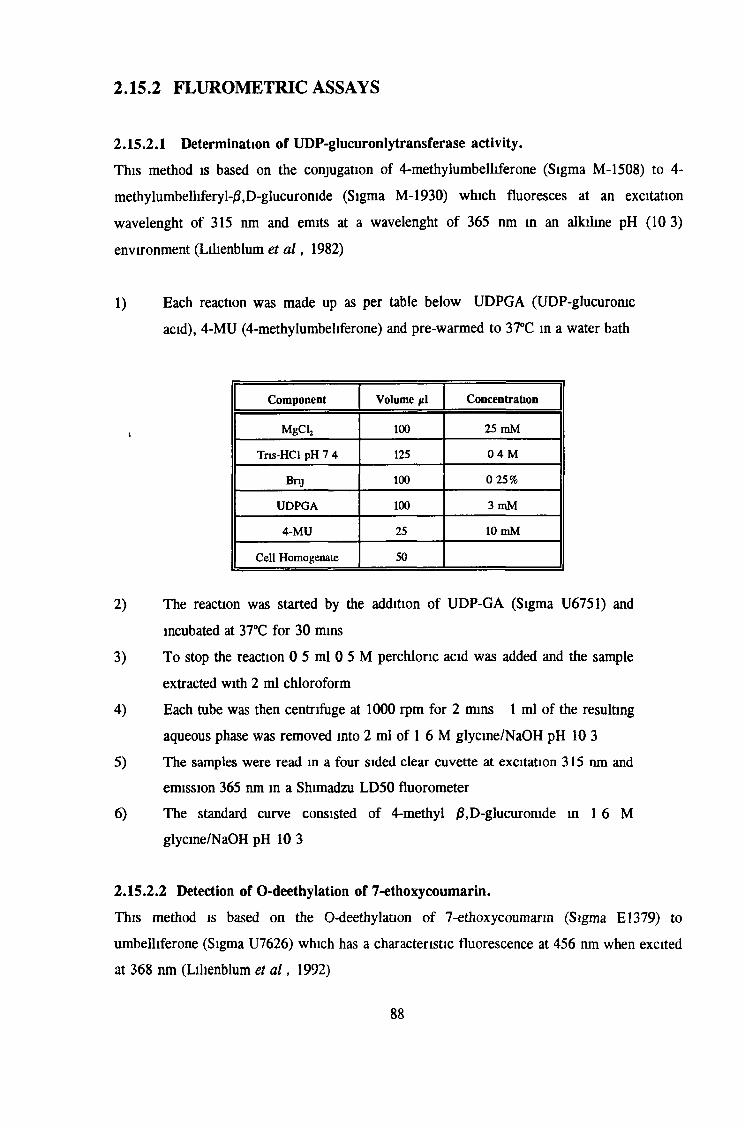
2.15.2 FLUROMETRIC ASSAYS
2.15.2.1 Determination o f UDP-glucuronlytransferase activity.
This method is based on the conjugation o f 4-methylumbelliferone (Sigma M -1508) to 4- methy lumbellifery 1-/3,D-glucuronide (Sigma M -1930) which fluoresces at an excitation wavelenght o f 315 nm and emits at a wavelenght o f 365 nm in an alkiline pH (10 3) environment (Ldienblum et a l , 1982)
1) Each reaction was made up as per table below UD PG A (UDP-glucuronic acid), 4-M U (4-methylumbeliferone) and pre-warmed to 37°C in a water bath
Component Volume /tl Concentration
MgCl2 100 25 mMTns-HCl pH 7 4 125 0 4 M
Bnj 100 0 25%UDPGA 100 3 mM
4-MU 25 10 mMCell Homogenate 50
2) The reaction was started by the addition o f U D P-G A (Sigma U6751) and incubated at 37°C for 30 mins
3) T o stop the reaction 0 5 ml 0 5 M perchloric acid was added and the sample extracted with 2 ml chloroform
4) Each tube was then centrifuge at 1000 rpm for 2 mins 1 ml o f the resulting aqueous phase was removed into 2 ml o f 1 6 M glycm e/NaO H pH 10 3
5) The samples were read in a four sided clear cuvette at excitation 315 nm and em ission 365 nm in a Shimadzu LD 50 fluorometer
6 ) The standard curve consisted o f 4-methyl /3,D-glucuromde in 1 6 M glycine/NaOH pH 10 3
2.15.2 .2 Detection of O-deethylation of 7-ethoxycoumarin.
This method is based on the O-deethylation o f 7-ethoxycoumarm (Sigma E l379) toum belliferone (Sigma U7626) which has a characteristic fluorescence at 456 nm when excitedat 368 nm (Lilienblum et a l , 1992)
88
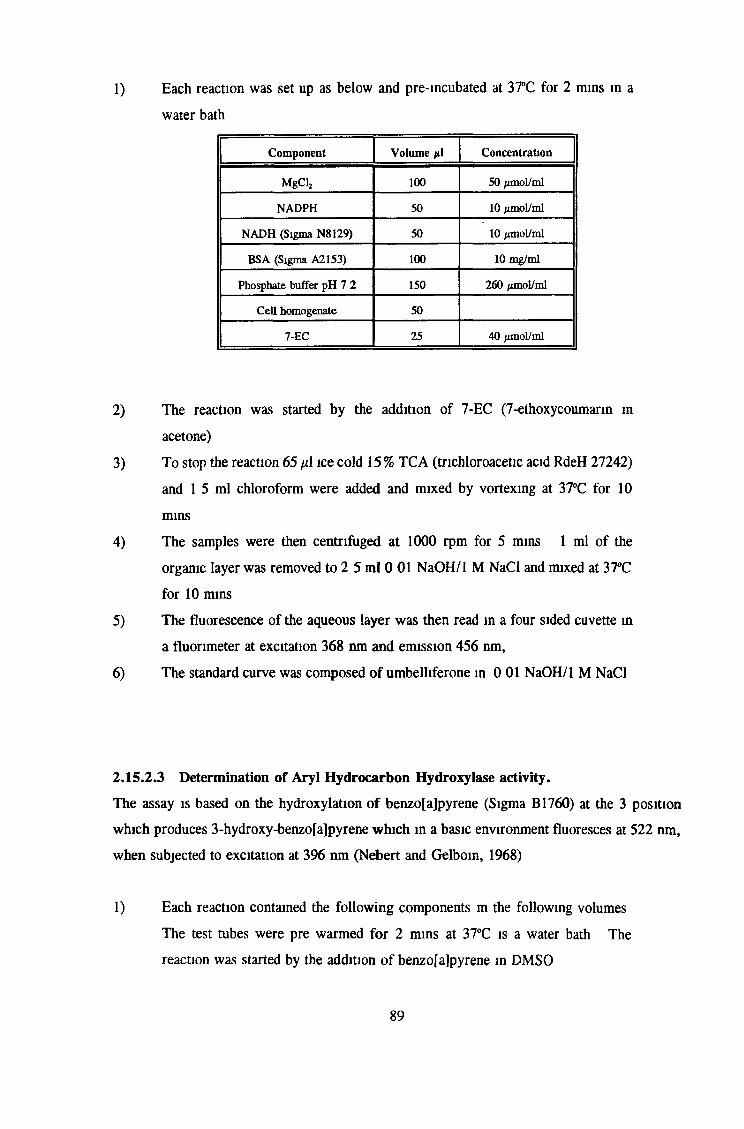
1) Each reaction was set up as below and pre-mcubated at 37°C for 2 mins in a water bath
Component Volume p\ Concentration
MgCl2 100 50 /¿mol/mlNADPH 50 10 /imol/ml
NADH (Sigma N8129) 50 10 /imol/mlBSA (Sigma A2153) 100 10 mg/ml
Phosphate buffer pH 7 2 150 260 /imol/mlCell homogenate 50
7-EC 25 40 ¿¿mol/ml
2) The reaction was started by the addition o f 7-EC (7-ethoxycoumarin in acetone)
3) To stop the reaction 65 ¿¿1 ice cold 15% TCA (trichloroacetic acid RdeH 27242) and 1 5 ml chloroform were added and mixed by vortexing at 37°C for 10 mins
4) The samples were then centrifuged at 1000 rpm for 5 mins 1 ml o f the organic layer was removed to 2 5 ml 0 01 NaOH/1 M NaCl and mixed at 37°C for 10 mins
5) The fluorescence o f the aqueous layer was then read in a four sided cuvette in a fluorimeter at excitation 368 rnn and em ission 456 nm,
6 ) The standard curve was composed o f umbelliferone in 0 01 NaOH/1 M NaCl
2.15.2.3 Determination of Aryl Hydrocarbon Hydroxylase activity.
The assay is based on the hydroxylation o f benzo[a]pyrene (Sigma B1760) at the 3 position which produces 3-hydroxy-benzo[a]pyrene w hich in a basic environment fluoresces at 522 nm, when subjected to excitation at 396 nm (Nebert and Gelboin, 1968)
1) Each reaction contained the follow ing components m the following volumes The test tubes were pre warmed for 2 mins at 37°C is a water bath The reaction was started by the addition o f benzo[a]pyrene in DM SO
89
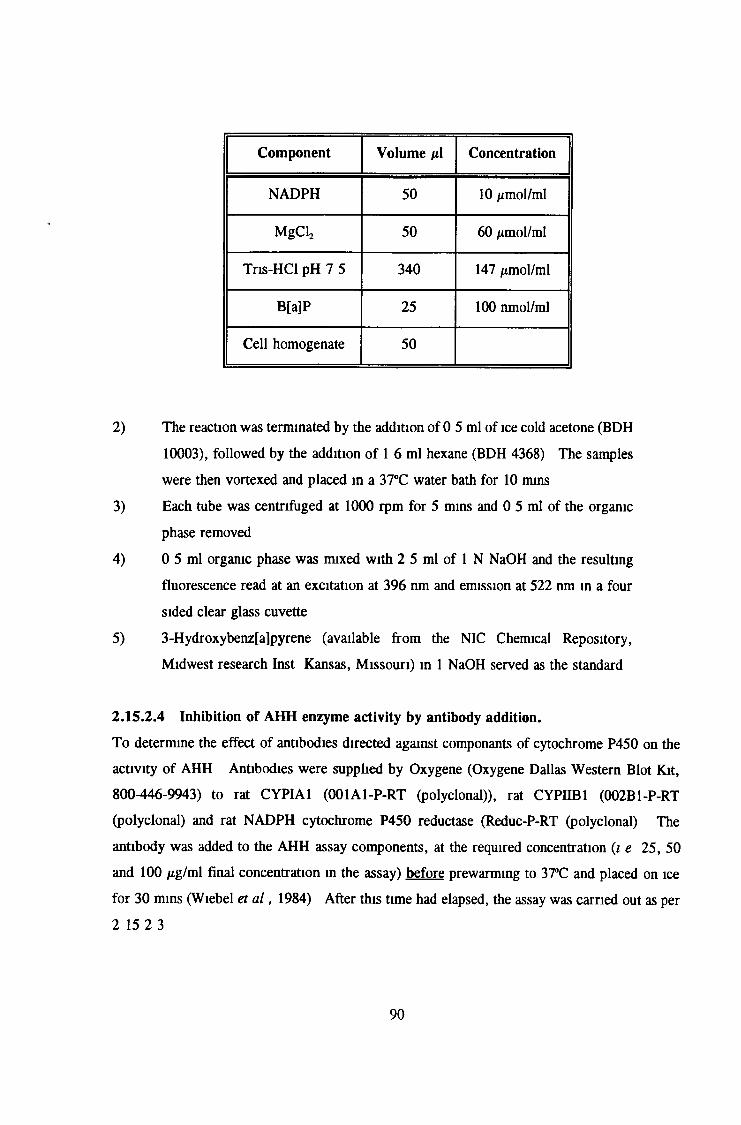
C om ponent V olum e /tl Concentration
NA DPH 50 1 0 /xmol/ml
M gCl2 50 60 /imol/ml
T ns-H C l pH 7 5 340 147 /¿mol/ml
B[a]P 25 1 0 0 nmol/ml
Cell homogenate 50
2) The reaction was terminated by the addition o f 0 5 ml o f ice cold acetone (BDH 10003), followed by the addition o f 1 6 ml hexane (BDH 4368) The samples were then vortexed and placed in a 37°C water bath for 10 mins
3) Each tube was centrifuged at 1000 rpm for 5 mins and 0 5 ml o f the organic phase removed
4) 0 5 ml organic phase was mixed with 2 5 ml o f 1 N NaOH and the resulting fluorescence read at an excitation at 396 ran and emission at 522 n m in a four sided clear glass cuvette
5) 3-Hydroxybenz[a]pyrene (available from the NIC Chemical Repository, M idwest research Inst Kansas, M issouri) in 1 NaOH served as the standard
2 .1 5 .2 .4 Inhibition o f A H H enzym e activ ity by antibody addition.T o determine the effect o f antibodies directed against componants o f cytochrome P450 on the activity o f AHH Antibodies were suppbed by Oxygene (Oxygene Dallas W estern Blot Kit, 800-446-9943) to rat CYPIA1 (001A1-P-RT (polyclonal)), rat CYPIIB1 (002B1-P-RT (polyclonal) and rat NA DPH cytochrome P450 reductase (Reduc-P-RT (polyclonal) The antibody was added to the AHH assay components, at the required concentration (i e 25 , 50 and 100 /¿g/ml final concentration in the assay) before prewarming to 37°C and placed on ice for 30 mins (W iebel et a l , 1984) After this time had elapsed, the assay was carried out as per 2 15 2 3
90
2.16 PHOTOGRAPHY.
2.16.1 Photomicrography.
1) The camera was loaded with the appropriate film and the ASA set to the appropriate number according to the films specifications
2) A halogen lamp and a green filter were used for black and white photography A halogen lamp and a blue N D 10 filter were used for colour photograph
3) The microscope w as adjusted to ensure that there was no vibration which would interfere with the picture
4) The shot was focused through the camera, switching the microscope to camera and increasing the bght to 6 V (in the green range) A range of exposures were used on each occasion to ensure a good photograph
2 .16 .2 Fluorescence photomicrography.
1) The mercury lamp was switched on 15 nuns before use2) The Heochst B2 filter was used for FITC staining3) The shot was focused using the halogen lamp, then turned off and the mercury
lamp shutter opened4 ) The photograph was taken as per section 2 16 15) Fluorescent photographs in this thesis were taken usmg a UFX photomicrograph
attachment with a photomultipber which is automatic giving clear intense shots
2.16.3 Black and white film processing.
In this thesis Kodak - TriX-pan film was used for black and white photography and processedas fo llow s1) The film was removed in total darkness from its container and wound onto the
reel of the developing tank2) The developing tank was secured ensuing that it was bght sealed and 300 mis
o f D-79 (Kodak dilute stock 1 1 with tap water) was added for 11 mins3) To stop the developing the D -76 was removed and tap water added4) The tank was then emptied and 300 mis o f Kodak umfix liquid at 1 3 dilution
o f stock was added to the developing tank to fix the film for 11 mins in the dark
5) The film was then rinsed in Kodak Photoflo 1 capful dduted to 300 mis in tap water and air dried
91
2.16.3 Paper processing
U sing the film developed in the section 2 15 21) The chosen negative was placed in the enlarger and the lights switched off2) The negative was focoused by adjusting the lens in the enlarger (Meopta) with
the aperture fully open to ensure maximum light3) When the image produced was at the desired size and focus, the light were
switched to red - safe light
4) A test strip o f photographic paper was placed over the image and covered with a piece o f card The enlarger was switched on and the paper exposed in 1 second time units, piece by piece resulting in a gradient o f exposure
5) The enlarger was switched off and the paper placed in the developer bath (Kodak Dektol Stock diluted 1 2 with tap water) for 1 min
6 ) This test strip was placed in a stop bath containing tap water to stop thedeveloping
7) The film was then fixed in Kodak unifix stock diluted 1 7 with tap water for 2-5 mins
8 ) The paper was rinsed in water containing photoflo for at least 10 mins9) Prints were dried m a print drier at medium heatThe resulting gradient indicated the correct length o f exposure required to achieve the best prints from the negativeIf the gradient was too dark, the aperture was decreased step by step, testing each time, in the above manner for the best exposureOnce the correct parameters had been chosen, the complete negative was enlarged using this procedure replacing step 4 with one complete exposure at the chosen time and aperture size The paper was then processed as in steps 5-9
2.17. Safety.
In this body o f work a number o f hazardous chemicals were used In all instances when chemicals were ordered, the company’s data sheet was also requested which contained their recommendations for laboratory use and disposalA ll solvents were stored in a fire-proof cabinet and used only in the fume hood Solvent waste was stored in a coo l, dark, isolated building and removed by Minchem , Dun Laoghaire A ll hazardous chemicals were stored in a locked cupboard.
92
The lowest possible concentrations o f chemicals were used and mital dilutions o f hazardous chem icals were carried out m the fume-hood Highly toxic chemicals e g PAH - benzo[a]pyrene, benzanthracene and ethidium bromide, were dealt with individually The quantities o f PAH waste were recorded, stored m isolation and all articles which came in contact with them were disposed o f by incineration by BiobumW hen working with ethidium bromide a white coat and double gloves were worn, and the work area covered w ith a disposable bench top Ethidium bromide waste was isolated and either incinerated by Bioburn, or treated with hyperchlorite which is believed to deactivate it (Sambrook et a l , 1989)General cell culture waste which contained FCS, medium which had been in contact with cells, articles which came in contact with these solutions, and medium which contained anticancer drugs e g adnam ycin, VP-16 etc , were autoclaved at 121°C and 21 lb per cm2 pressure for 2 0 m ins, to render them safe When working with ultra violet light, a protective face-visor was worn together with a closed, long sleeved white coat and disposable gloves to prevent exposure to the lightDuring routine work m the laboratory a white coat and gloves were worn
93
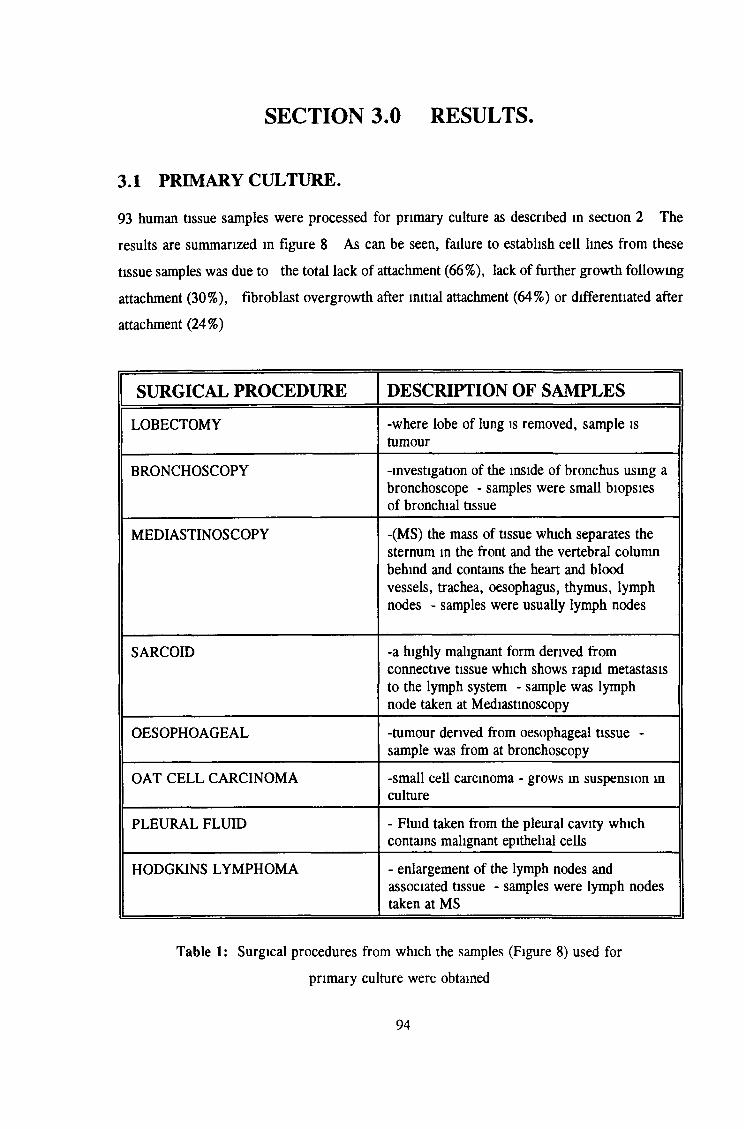
SECTION 3.0 RESULTS.
3.1 PRIMARY CULTURE.
93 human tissue samples were processed for primary culture as described in section 2 The results are summarized in figure 8 As can be seen, failure to establish cell lines from these tissue samples was due to the total lack o f attachment (6 6 %), lack o f further growth follow ing attachment (30% ), fibroblast overgrowth after initial attachment (64%) or differentiated after attachment (24%)
SURGICAL PROCEDURE DESCRIPTION OF SAMPLES
LOBECTOMY -where lobe of lung is removed, sample is tumour
BRONCHOSCOPY -investigation of the inside o f bronchus using a bronchoscope - samples were small biopsies of bronchial tissue
MEDIASTINOSCOPY -(M S) the mass o f tissue which separates the sternum in the front and the vertebral column behind and contains the heart and blood vessels, trachea, oesophagus, thymus, lymph nodes - samples were usually lymph nodes
SARCOID -a highly malignant form derived from connective tissue which shows rapid metastasis to the lymph system - sample was lymph node taken at Mediastinoscopy
OESOPHOAGEAL -tumour derived from oesophageal tissue - sample was from at bronchoscopy
OAT CELL CARCINOMA -small cell carcinoma - grows in suspension m culture
PLEURAL FLUID - Fluid taken from the pleural cavity which contains malignant epithelial cells
HODGKINS LYMPHOMA - enlargement o f the lymph nodes and associated tissue - samples were lymph nodes taken at MS
Table 1: Surgical procedures from which the samples (Figure 8 ) used for primary culture were obtained
94
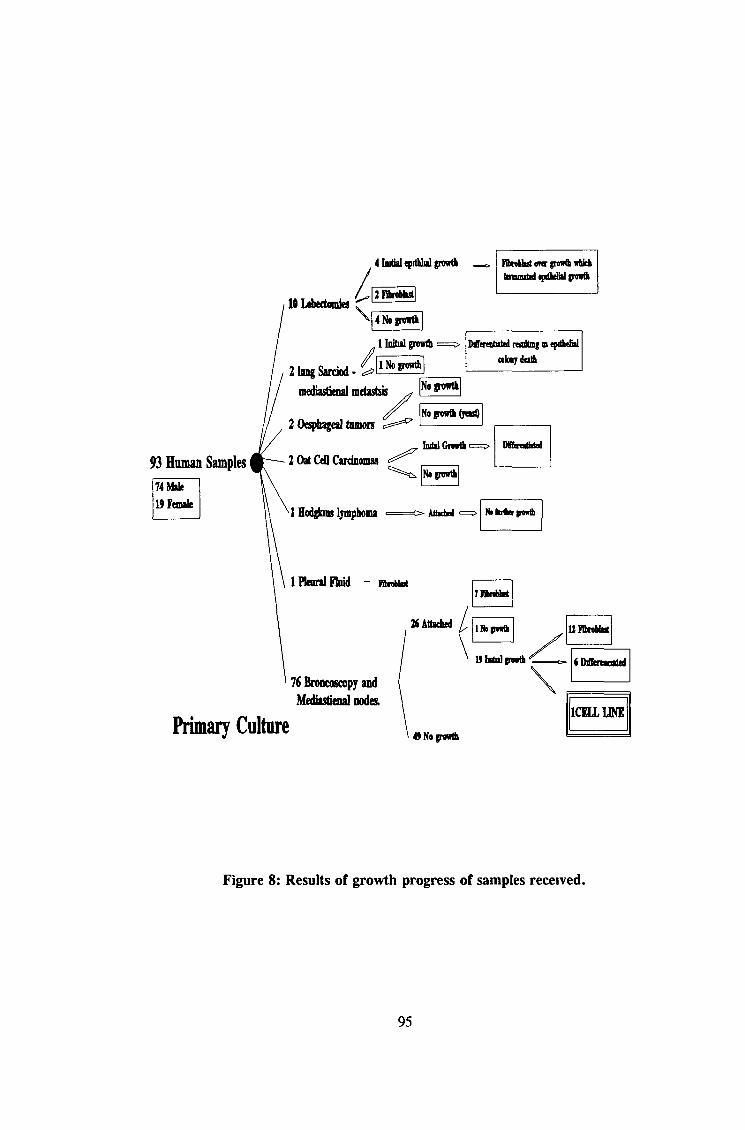
Figure 8: Results of growth progress of samples received.
95
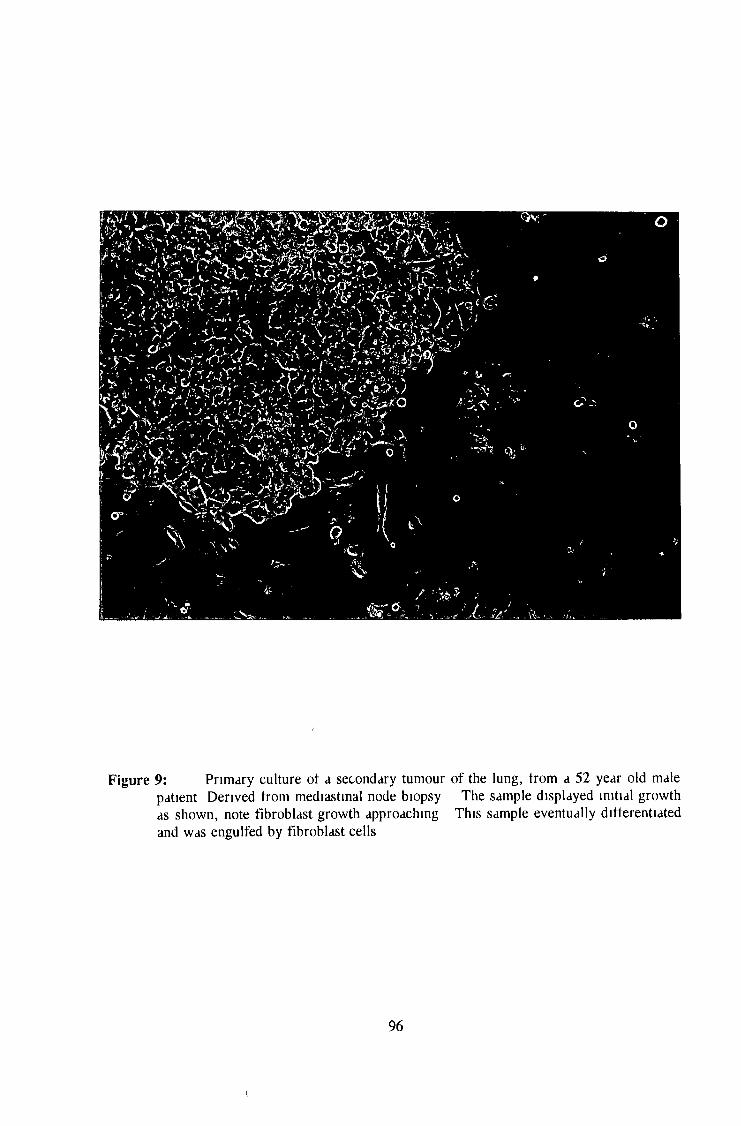
Figure 9: Primary culture of a secondary tumour o f the lung, from a 52 year old malepatient Derived from mediastinal node biopsy The sample displayed initial growth as shown, note fibroblast growth approaching This sample eventually differentiated and was engulfed by fibroblast cells
96
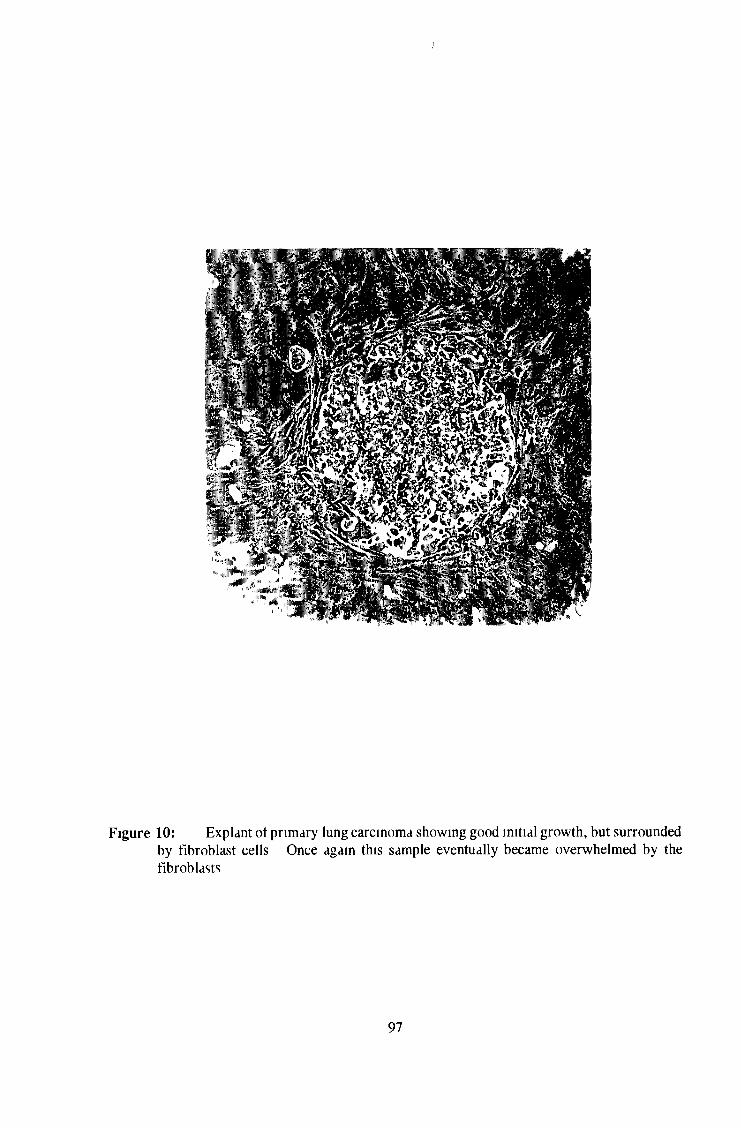
Figure 10: Explant ot primary lung carcinoma showing good initial growth, but surroundedby fibroblast cells Once again this sample eventually became overwhelmed by the fibroblasts
97
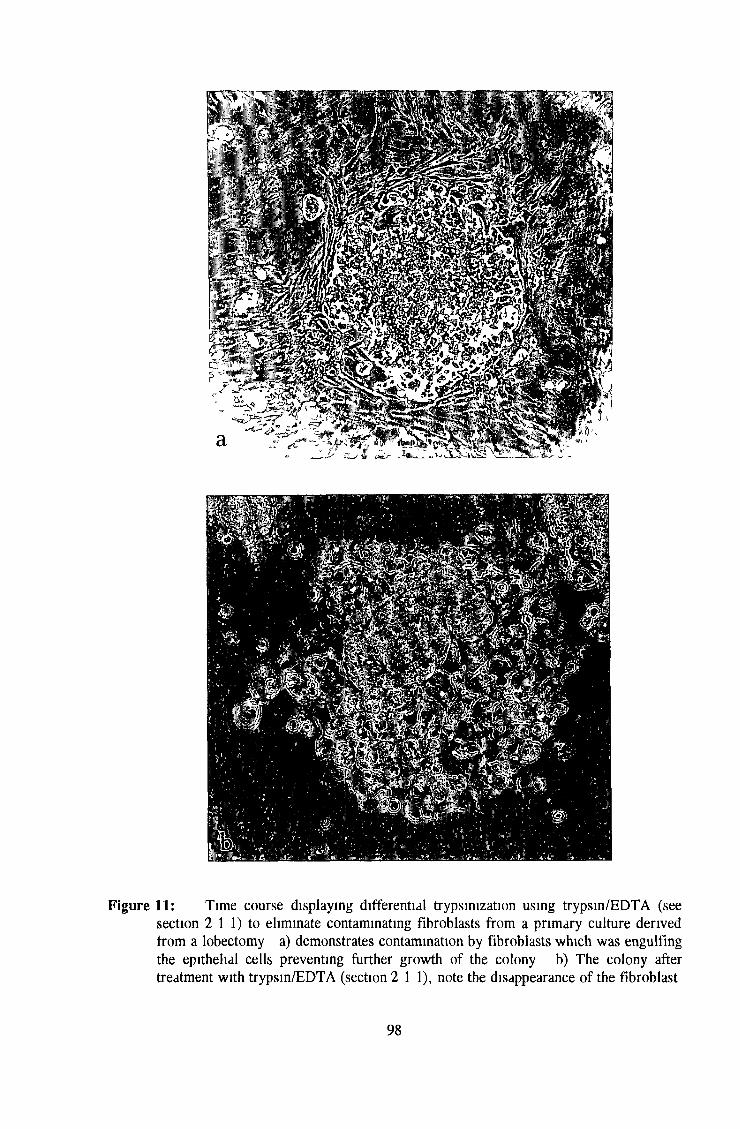
F igure 11: Time course displaying differential trypsinization using trypsin/EDTA (seesection 2 1 1) to eliminate contaminating fibroblasts from a primary culture derived from a lobectomy a) demonstrates contamination by fibroblasts which was engulfing the epithelial cells preventing farther growth o f the colony b) The colony after treatment with trypsin/EDTA (section 2 11 ) , note the disappearance o f the fibroblast
98
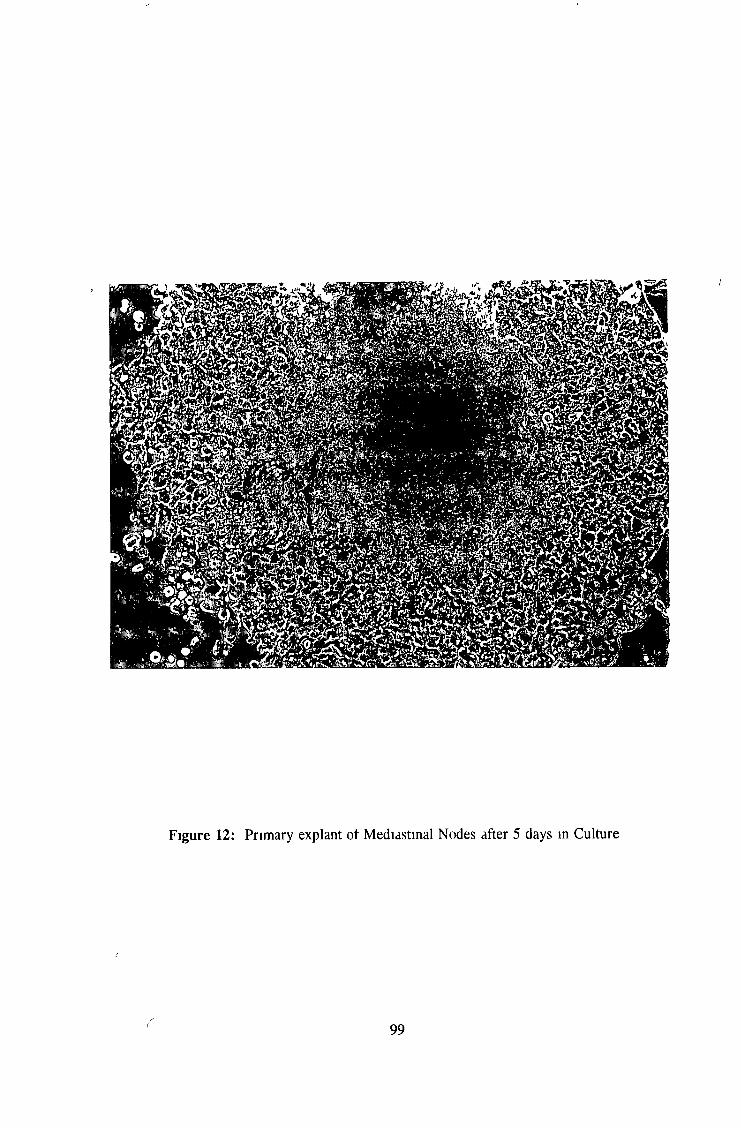
99

I
3.1.1 ESTABLISHMENT OF DLKP
3 .1 .1 .1 CLINICA L H ISTO R Y
Biopsies o f tumour were taken from a male patient, aged 52 years w ith a history o f smoking Samples were taken from the mediastinum and a lymph node metastasis Patient presented with possible poorly differentiated squamous cell Carcinoma o f the Lung and had received no prior treatmentD ay 1: The sample was a large intact piece o f tumour with no viable
necrotic tissue, or red blood cell contamination Sample was set up as per methods i e mechanically using scalpels and enzymatically using a combination o f 200 units collagenase/2% dispase in PBS Four 25cm2 were seeded with the dissection media on day 1 T o test the effect o f initial cell density on growth, two flasks each at the following densities 106 cells, 5 x 10⁵ cells, 2 5 x 10⁵ cells were used
D ay 4: in culture, most o f the cells had attached in each flask, butwere not actively dividing One flask was changed from DM E/Hams F12 with 10% FCS to MEM with 10% FCS to see if decreasing the nutrient level would encourage the cells to divide
D ay 7: The flasks which were seeded at lower than 5 x 10s cell haveshown no growth indicating that the cell density is too low to support growth at this early stage in estabkshment
D ay 10: A ll flasks with initial cell densities greater than 5 x 10s cell hadbegun to grow i e those flasks seeded at 106 cells/flask
By w eek 10 this sample had been passaged 12 times and could be designated a cell bne (Figure13) To estabbsh the characteristics o f these cells the following experiments were carried out
100
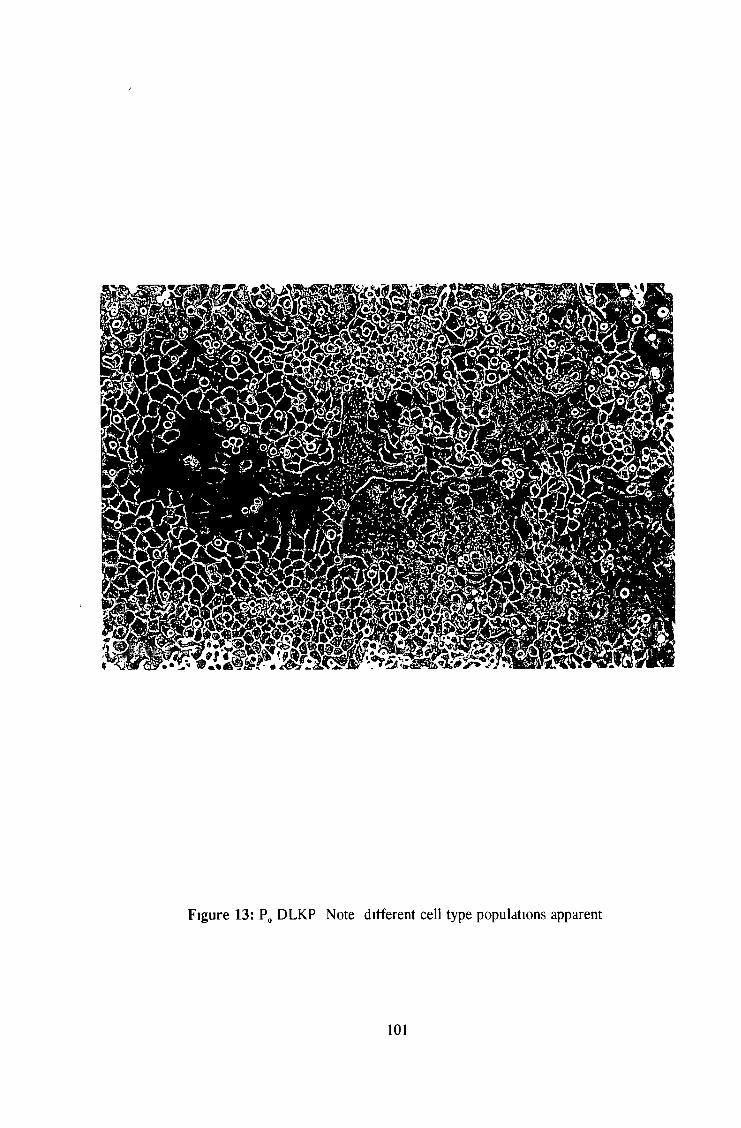
Figure 13: P0 DLKP Note different cell type populations apparent
101
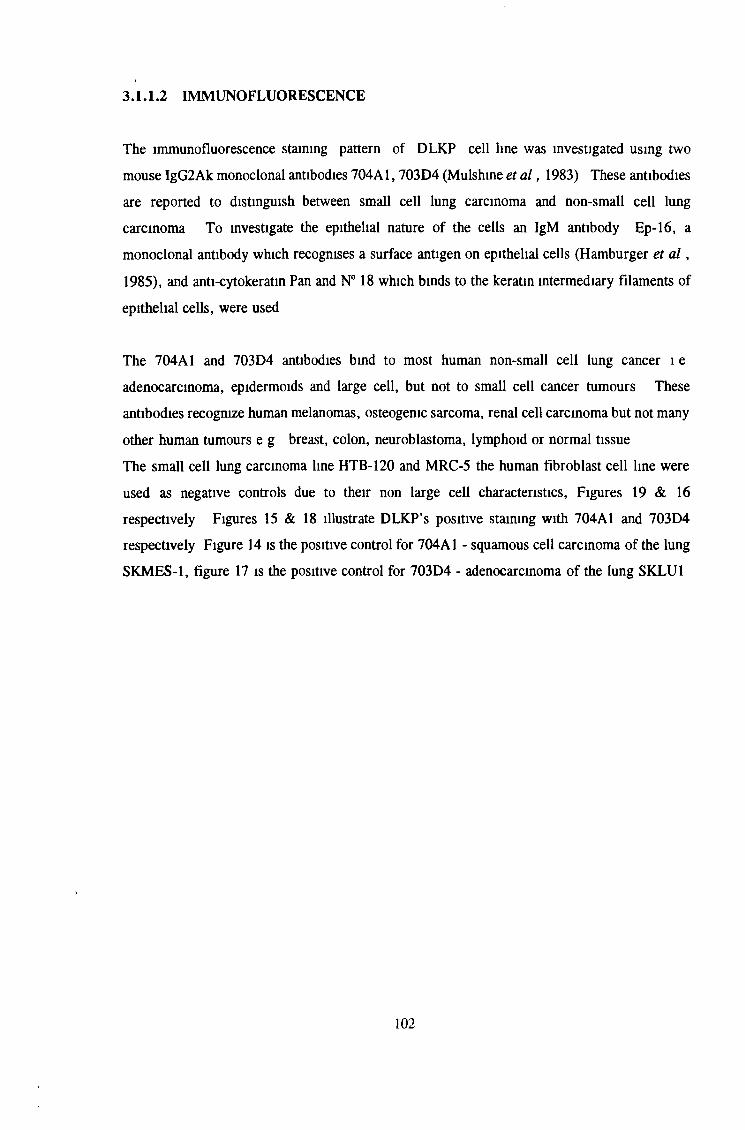
!3.1.1.2 IMMUNOFLUORESCENCE
The immunofluorescence staining pattern o f DLKP cell line was investigated using two m ouse IgG2Ak monoclonal antibodies 704A 1, 703D 4 (Mulshine et a l , 1983) These antibodies are reported to distinguish between small cell lung carcinoma and non-small cell lung carcinoma To investigate the epithelial nature o f the cells an IgM antibody Ep-16, a monoclonal antibody which recognises a surface antigen on epithelial cells (Hamburger et a l , 1985), and anti-cytokeratin Pan and N° 18 which binds to the keratin intermediary filaments o f epithelial cells, were used
The 704A1 and 703D 4 antibodies bind to most human non-small cell lung cancer i e adenocarcinoma, epidermoids and large cell, but not to small cell cancer tumours These antibodies recognize human melanomas, osteogenic sarcoma, renal cell carcinoma but not many other human tumours e g breast, colon, neuroblastoma, lymphoid or normal tissue The small cell lung carcinoma line HTB-120 and MRC-5 the human fibroblast cell line were used as negative controls due to their non large cell characteristics, Figures 19 & 16 respectively Figures 15 & 18 illustrate DLKP’s positive staining with 704A1 and 703D 4 respectively Figure 14 is the positive control for 704A1 - squamous cell carcinoma o f the lung SKM ES-1, figure 17 is the positive control for 703D 4 - adenocarcinoma o f the lung SKLU1
102
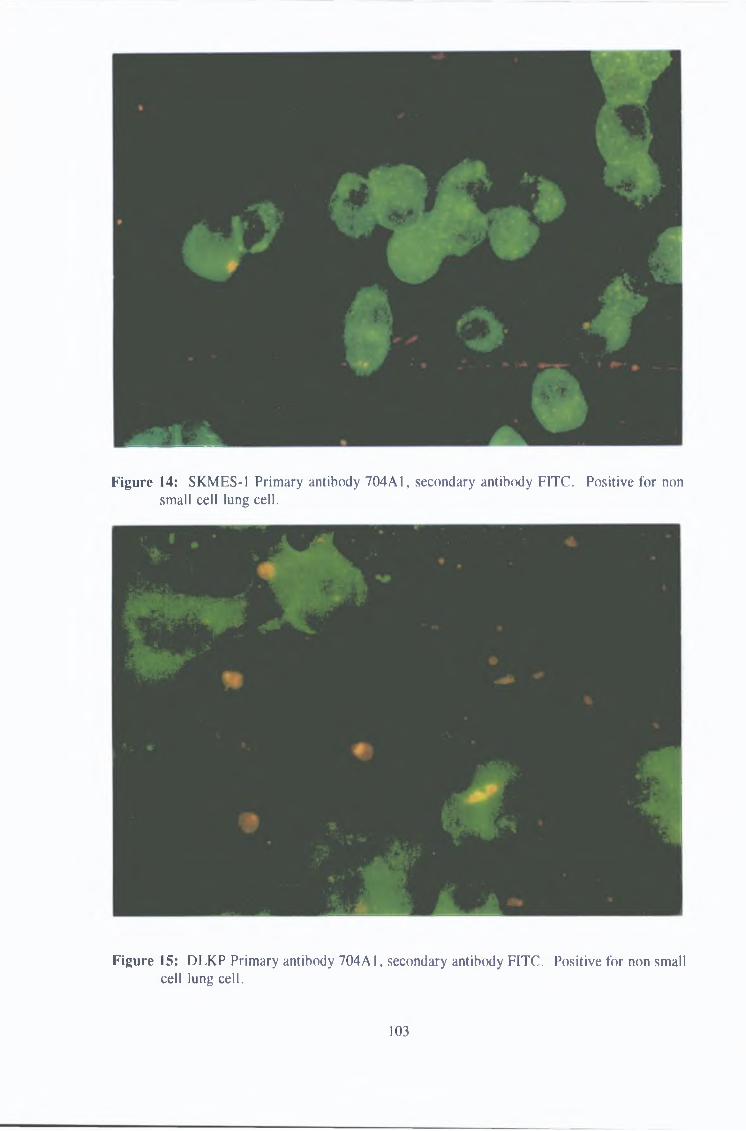
Figure 14: SKMES-1 Primary antibody 704A 1, secondary antibody FITC. Positive for non small cell lung cell.
F igure 15: DLKP Prim ary antibody 704A 1, secondary antibody FITC. Positive for non smallcell lung cell.
103
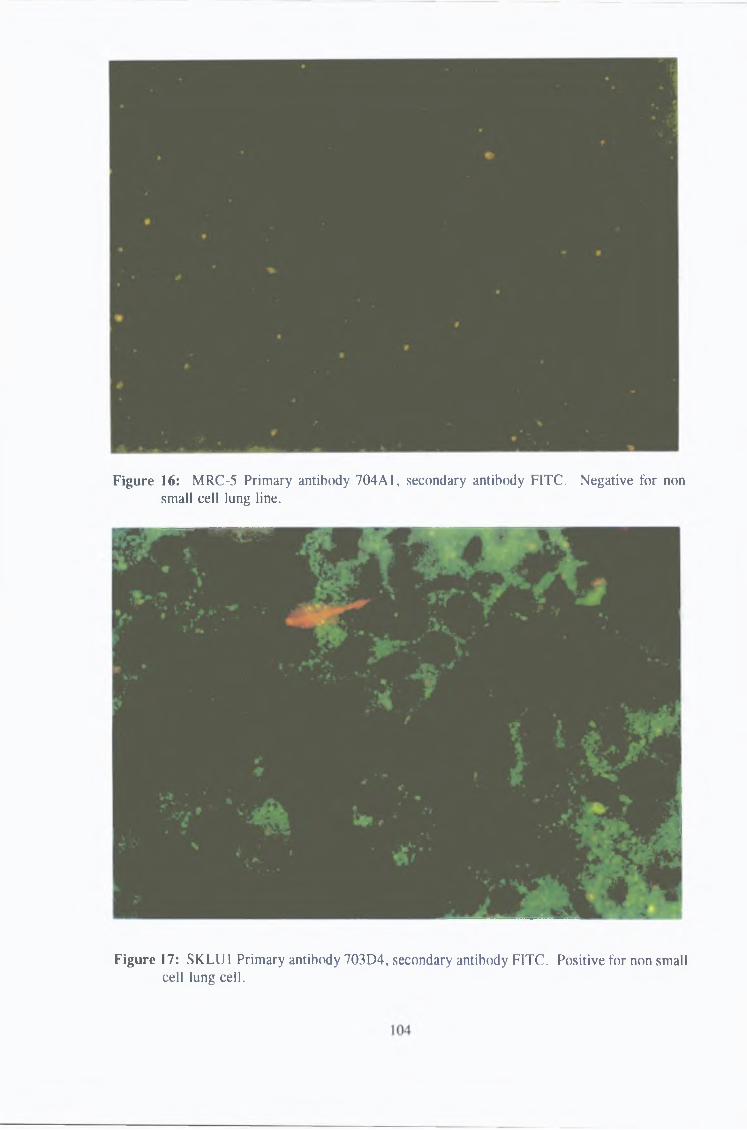
Figure 16: M RC-5 Prim ary antibody 704A1, secondary antibody FITC. Negative for nonsmall cell lung line.
Figure 17: SKLU1 Prim ary antibody 703D4, secondary antibody FITC. Positive for non smallcell lung cell.
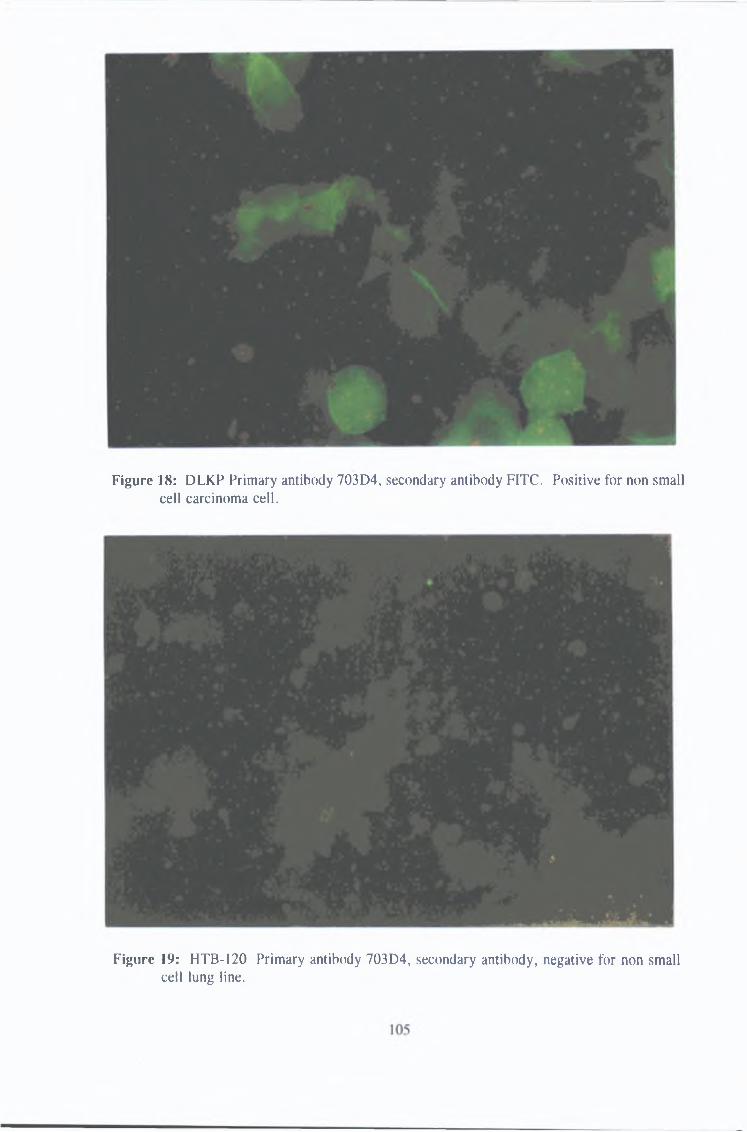
F igure 18: DLKP Prim ary antibody 703D 4, secondary antibody FITC. Positive for non smallcell carcinom a cell.
F ig u re 19: HTB-120 Prim ary antibody 703D4, secondary antibody, negative for non smallcell lung line.
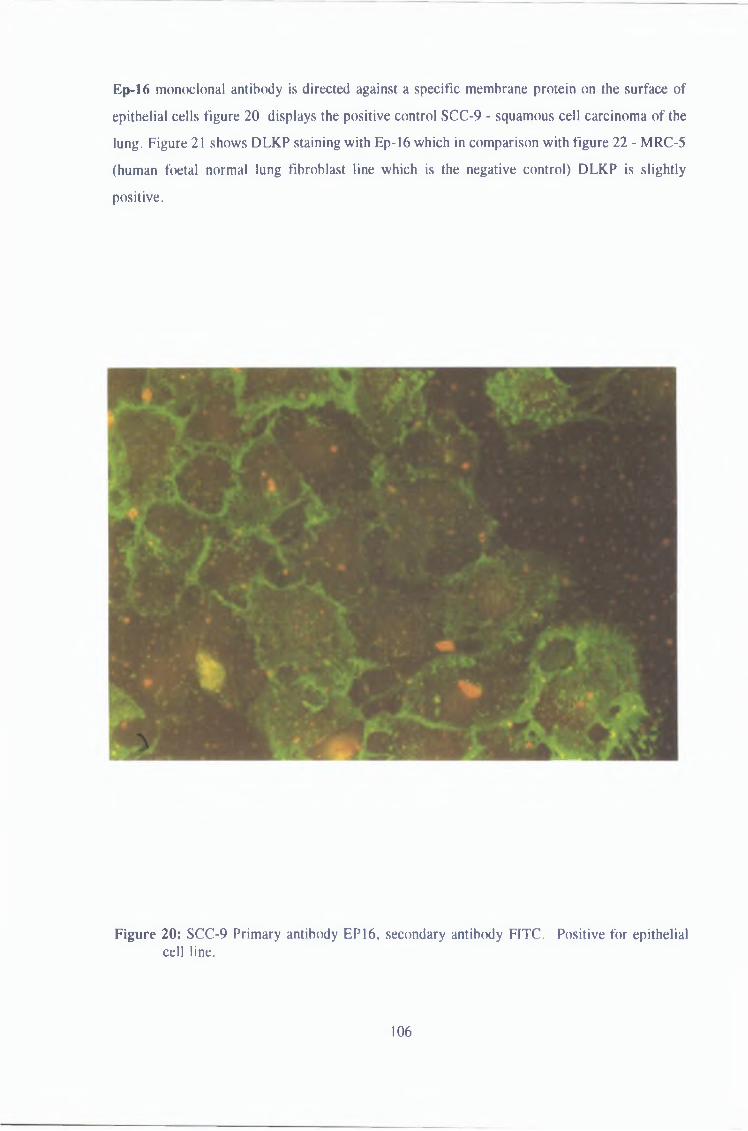
Ep-16 monoclonal antibody is directed against a specific membrane protein on the surface o f epithelial cells figure 20 displays the positive control SCC-9 - squamous cell carcinoma o f the lung. Figure 21 shows DLKP staining with Ep-16 which in comparison with figure 22 - MRC-5 (human foetal normal lung fibroblast line which is the negative control) DLKP is slightly positive.
F igure 20: SCC-9 Primary antibody EP16, secondary antibody FITC. Positive for epithelial cell line.
106
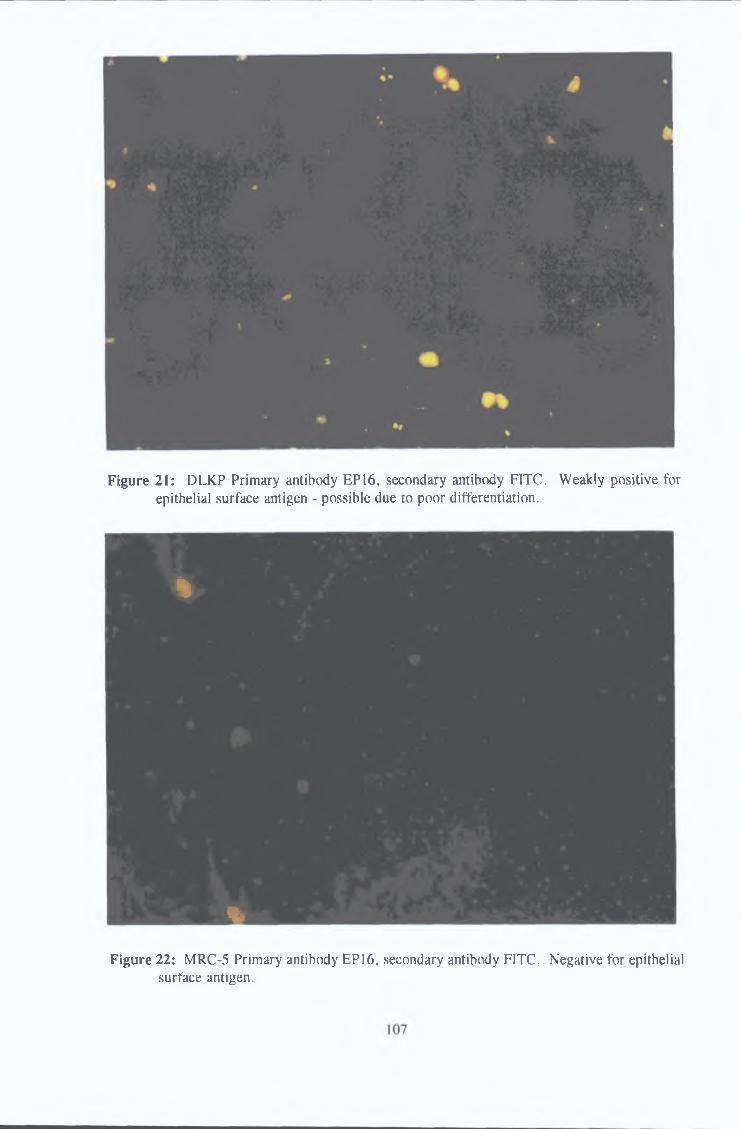
Figure 21: DLKP Prim ary antibody EP16, secondary antibody FITC. W eakly positive forepithelial surface antigen - possible due to poor differentiation.
*
*
Figure 22: MRC-5 Primary antibody EP16, secondary antibody FITC. Negative for epithelial surface antigen.
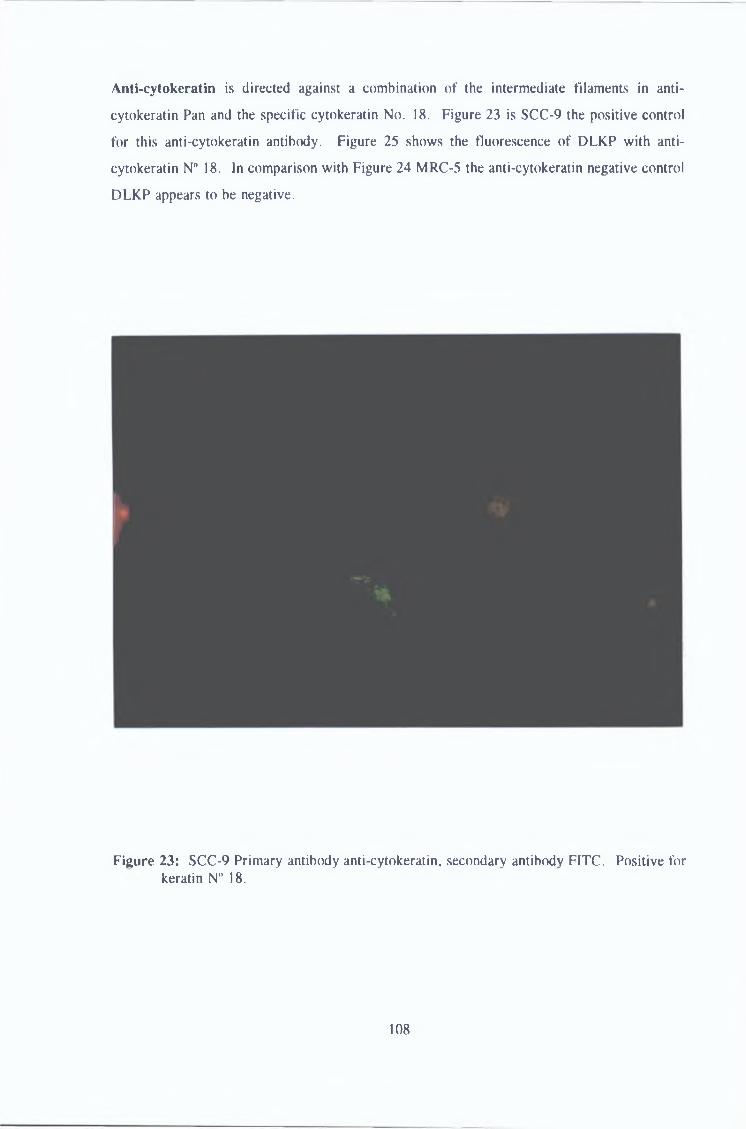
Anti-cytokeratin is directed against a combination of the intermediate filaments in anti-
cytokeratin Pan and the specific cytokeratin No. 18. Figure 23 is SCC-9 the positive control
for this anti-cytokeratin antibody. Figure 25 shows the fluorescence of DLKP with anti-
cytokeratin NH 18. In comparison with Figure 24 MRC-5 the anti-cytokeratin negative control
DLKP appears to be negative.
Figure 23: SCC-9 Primary antibody anti-cytokeratin, secondary antibody FITC. Positive for keratin N° 18.
108
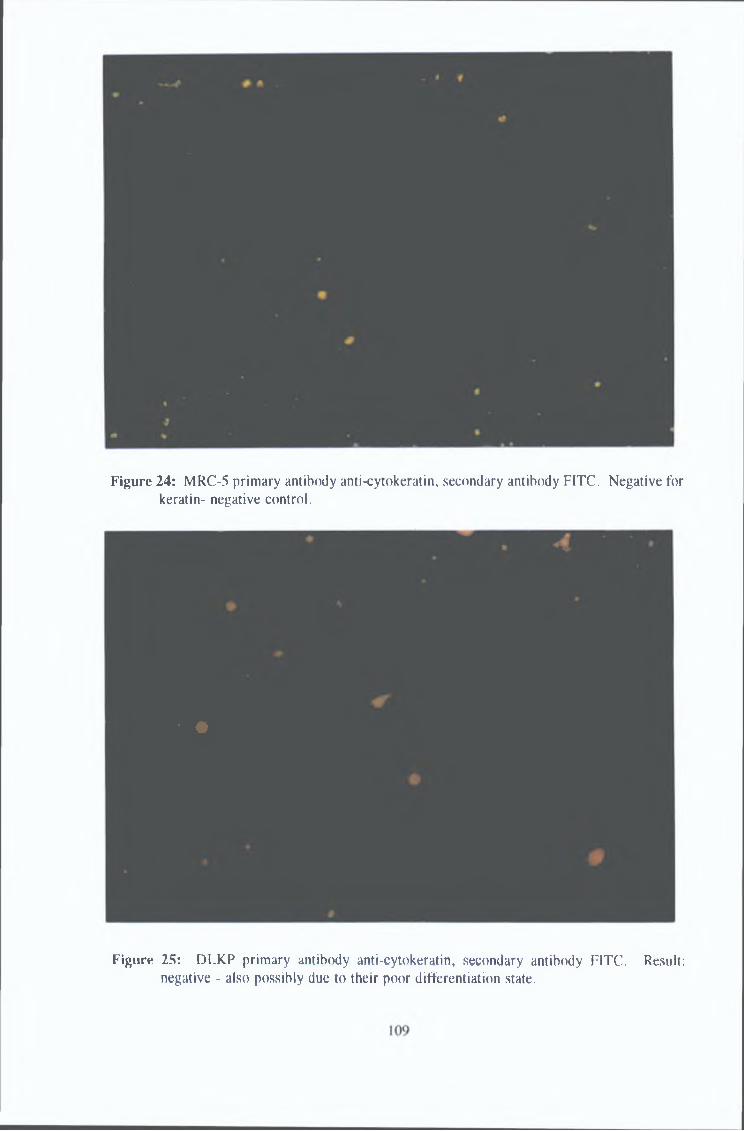
Figure 24: MRC-5 primary antibody anti-cytokeratin, secondary antibody FITC. Negative forkeratin- negative control.
»
Figu re
*, #
25: DLKP primary antibody anti-cytokeratin, secondary antibody FITC. Result: negative - also possibly due to their poor differentiation state.
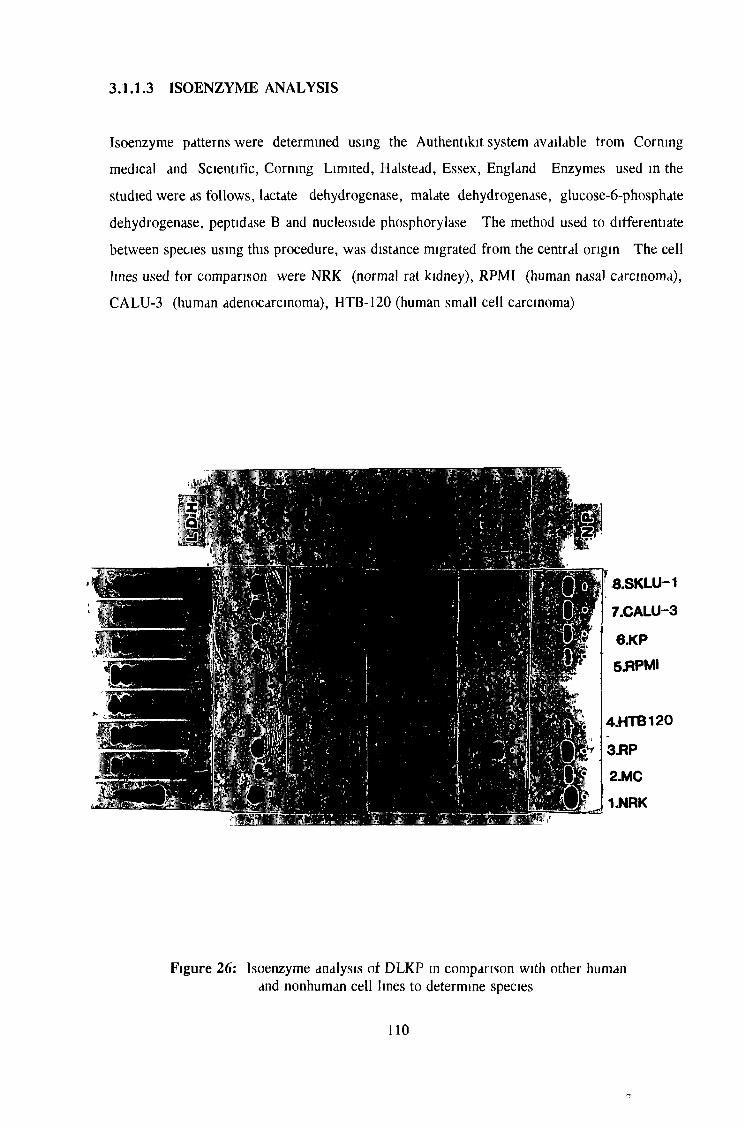
3 .1 .1 .3 ISOENZYM E ANALYSIS
Isoenzyme patterns were determined using the Authentikit system available from Corning
medical and Scientific, Corning Limited, Halstead, Essex, England Enzymes used in the
studied were as follows, lactate dehydrogenase, malate dehydrogenase, glucose-6-phosphate
dehydrogenase, peptidase B and nucleoside phosphorylase The method used to differentiate
between species using this procedure, was distance migrated from the central origin The cell
lines used for comparison were NRK (normal rat kidney), RPMI (human nasal carcinoma),
CALU-3 (human adenocarcinoma), HTB-120 (human small cell carcinoma)
Figure 26: Isoenzyme analysis of DLKP in comparison with other human and nonhuman cell lines to determine species
3 .1 .1 .4 DNA FINGERPRINTING
DLKP was analyzed by DNA fingerprinting to establish its genetic distinction from other cell
lines and its genetic identity with the tumour from which it was established The DNA
fingerprinting was carried out by Cellmark diagnostics, Abmgdon, Oxforshire DNA from
DLKP and the original tumour were restricted and resolved by electrophoresis and blotted The
blots were exposed to Mix A which contained a cocktail of 3 single locus probes and in the Mix
B containing two single locus probes The results were as figure 27a and b
In the report which was received with the autoradiographs from Cellmark it was pointed out that
the bands in the tumour sample were not very clear due to the fact that the sample had degraded
to a large extent In Mix B three strong bands were visualised and matched in the DLKP
extract Mix A is not as clear and demonstrates a high molecular weight band in the DLKP
sample which is not present in the tumour However, this may be explained by the fact that
tumour sample was quite degraded on arrival at Cellmark and that high molecular weight
alleles are degraded preferentially in DNA samples Mix A and B both displayed three bandI
of low molecular weight in the tumour sample, two of which are also visible in the DLKP
extract It was decided that the possibihty of 9 bands matching purely by chance between the
cell line and the tumour samples were very large and that the tumour and cell line DLKP
matched
Note In order to show all the minor bands present in the DLKP lanes (figure 27 a+b) it would
have been necessary to overdevelop the photograph In this case it would not have been
possible to see any of the bands present in the tumour lanes The photograph of the
autoradiographs presented is a compromise showing as many bands from both tumour and cell
line samples as possible
i
111
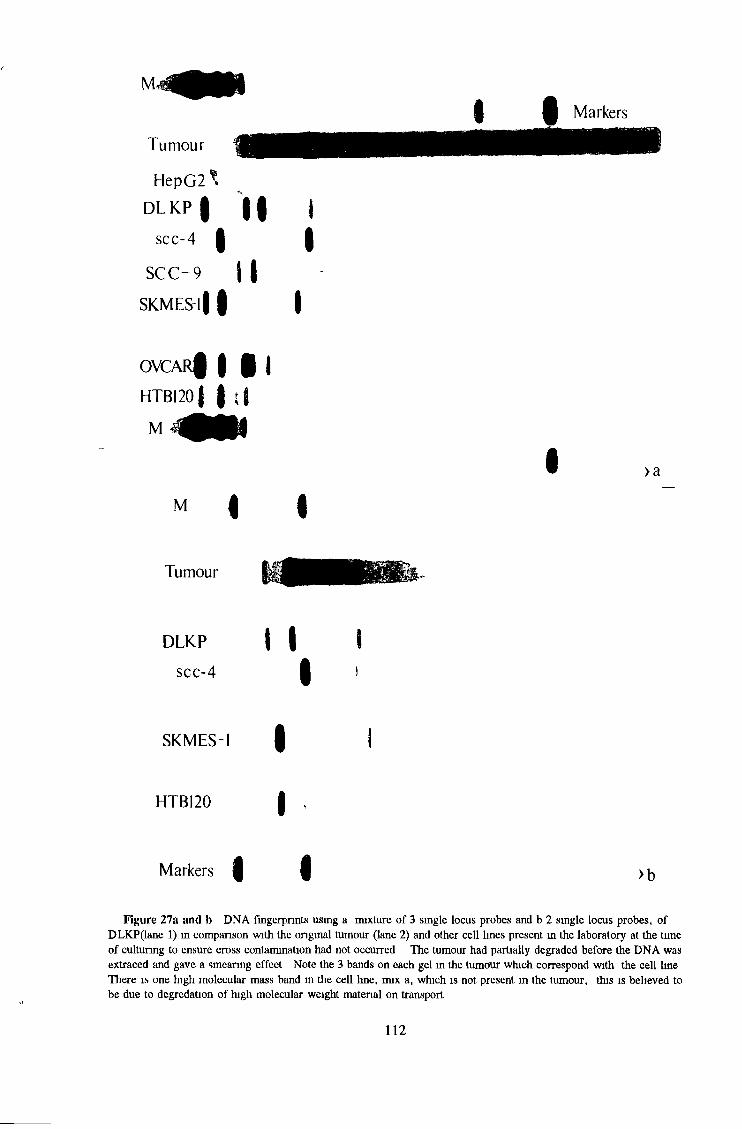
TumourHepG2 *
DLKP |scc-4 |
s e e -9
SKMESlf |
I I
III
o \ c a r | | 1 1HTB1201 | i f
M
MI >a
I <
Tumour
DLKPscc-4
I II
SKMES-1 I
HTB120 I
Markers ( I >bFigure 27a and b DNA fingerprints using a mixture of 3 single locus probes and b 2 single locus probes, of
DLKP(lane 1) m comparison with the original tumour (lane 2) and other cell lines present in the laboratory at the time of cultunng to ensure cross contamination had not occurred The tumour had partially degraded before the DNA was extraced and gave a smearing effect Note the 3 bands on each gel in the tumour which correspond with the cell lme There is one high molecular mass band in the cell lme, mix a, which is not present in the tumour, this is believed to be due to degredation of high molecular weight material on transport
112
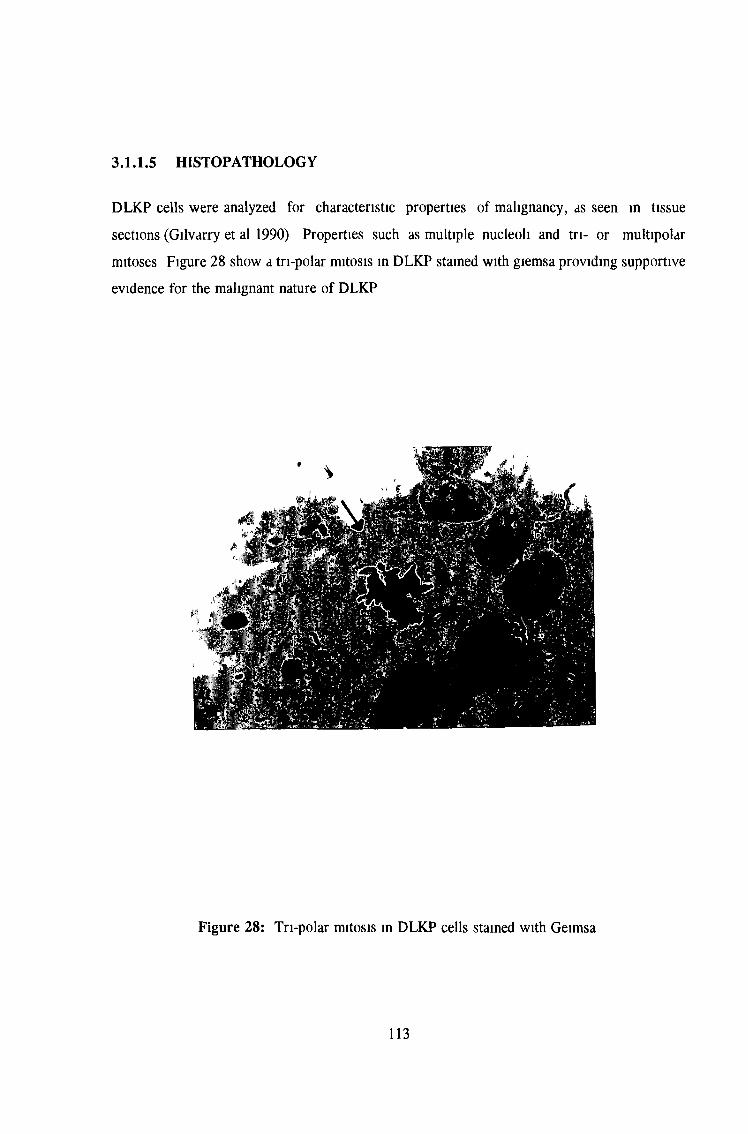
3 .1 .1 .5 HISTOPATHOLOGY
DLKP cells were analyzed for characteristic properties of malignancy, as seen in tissue
sections (Gilvarry et al 1990) Properties such as multiple nucleoli and tri- or multipolar
mitoses Figure 28 show a tri-polar mitosis in DLKP stained with giemsa providing supportive
evidence for the malignant nature of DLKP
Figure 28: Tri-polar mitosis in DLKP cells stained with Geimsa
113

3.1.1.6 CLONING IN AGAR / COLONY FORMING EFFICIENCY
Another test employed to determine the malignant nature ot cells in culture is their ability to
grow in agar DLKP cells were seeded into soft agar at 103, 104, and 105 cells per ml as
described in section 2 6 Colonies were allowed to develop over a period ot 10 - 14 days
Colonies greater than 50 /xm in diameter were counted on an inverted microscope (CK Olympus
Tokyo) at lOOx or 40x The resulting colony forming efficiency is 7 3 ± 1 4 % at 103 cells/ml
and 7 5 ± 2 4 % at 10* cells/ml
Figure 29: DLKP cell colony in agar - a characteristic of malignant cells
3.2 ANALYSIS OF CELL LINES FOR XENOBIOTIC METABOLIZING ACTIVITY.
The following cell lines in the induced and uninduced form, were investigated for their
expression of CYP1A1, UDP-Gluconyltransferase, 7-Ethoxycoumarin-O-Deethylase, total
Glutathione-S-Transferase activities and NADPH Cytochrome P450 Reductase Initially these
tests were to be carried out using spectrophotometric analysis, however after the assays had
been set up and cakbrated using rat bver - an abundant source of cytochrome P450 and other
drug metabolising enzymes, it was found that these assays were not sensitive enough to be used
on cell line At that point we changed to the above mentioned assays which are of a
fluorometric form and capable of detection into the nanomolar range As further conformation
of the results obtained for enzymes activities, western analysis was also carried out
Each cell lines was treated with inducers as follows Cells were seeded at a density of 5 X 10⁵
cell/ml into 100 mm2 petri dishes in the appropriate media (see section 2 0 4 1) and placed in
a 5% C02 incubator at 37°C overnight Benzanthracene (BA) (dissolved in DMSO) and DMSO
was diluted in complete media at 20 /¿molar and 0 01 % respectively and the cells fed with this
media After 18 hours the cells were harvested and assayed as per section 2 15 Phenobarbital
(PB) was dissolved 0 5 N NaOH and diluted to 2mM m complete media The pH of the media
was corrected to 7 44 - 7 55 and the cells were exposure as for benzanthracene, over 72 hours
After the 72 hours the cells were harvested and assay as per section 2 15
The following abbreviations are used m these tables - GST Glutathione-S-transferase, DNCB
Di-mtro-chloro-benzene conjugation, GST activity is expressed in nmoles of DNCB conjugated
per min per mg of protein
NADPH cytochrome c reductase activity is expressed as the rate of reduction of cytochrome
c per min per mg of cell homogenate i e nmoles reduced per mm per mg of protem N A -
No activity N D not determined
Each assay is the result of two sets of three assays, carried out on different days
115
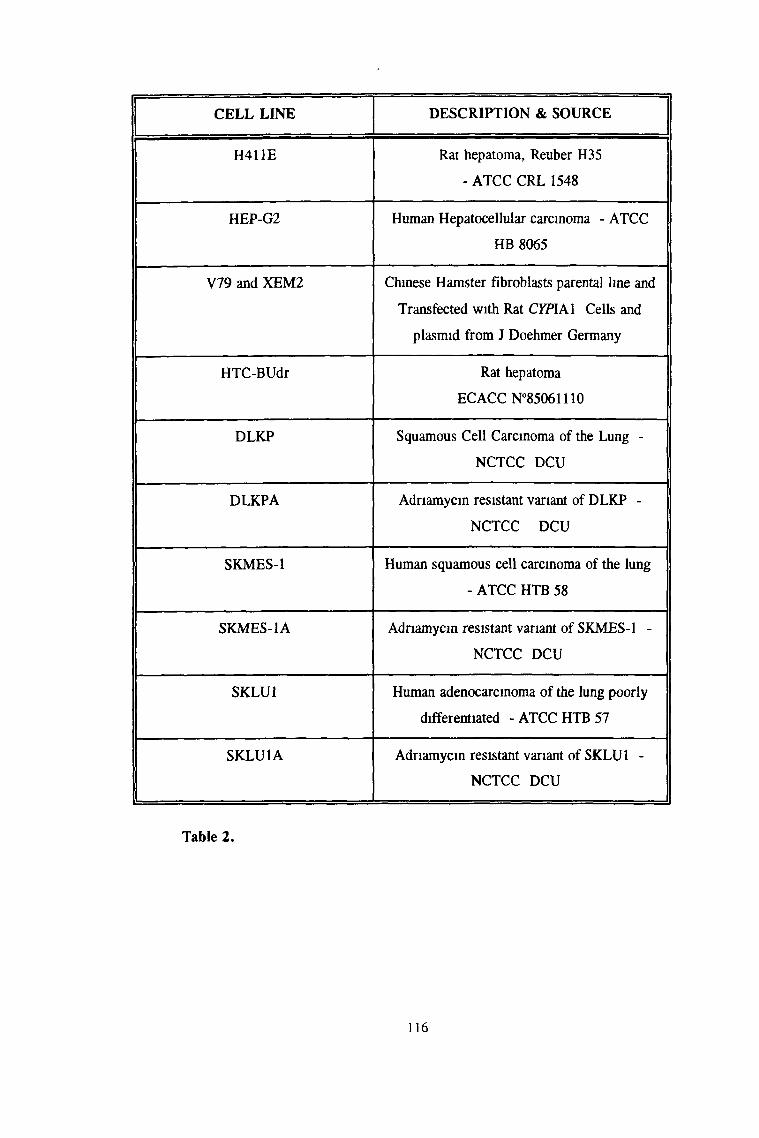
CELL LINE DESCRIPTION & SOURCE
H411E Rat hepatoma, Reuber H35
- ATCC CRL 1548
HEP-G2 Human Hepatocellular carcinoma - ATCC
HB 8065
V79 and XEM2 Chinese Hamster fibroblasts parental kne and
Transfected with Rat CKPIA1 Cells and
plasmid from J Doehmer Germany
HTC-BUdr Rat hepatoma
ECACC N°85061110
DLKP Squamous Cell Carcinoma of the Lung -
NCTCC DCU
DLKPA Adriamycin resistant variant of DLKP -
NCTCC DCU
SKMES-1 Human squamous cell carcinoma of the lung
- ATCC HTB 58
SKMES-1A Adriamycin resistant variant of SKMES-1 -
NCTCC DCU
SKLU1 Human adenocarcinoma of the lung poorly
differentiated - ATCC HTB 57
SKLU1A Adriamycin resistant variant of SKLU1 -
NCTCC DCU
Table 2.
116

ARYLHYDROCARBON HYDROXYLASE ACTIVITYIN H411E CELLS EXPOSED TO INDUCERS.
cmaa!oaa
160
50
40
30
uu0.CO
20
10
Benzanthracene DMSO P hénobarbital Control
Figure 30 Aryl Hydrocarbon Hydroxylase activity in H41 IE cells exposed to a number of inducers - see section 2 15 2 3
ARYLHYDROCARBON HYDROXYLASE ACTIVITY IN HEPG2 CELLS EXPOSED TO INDUCERS.
1
N.D.1 1
N.A.
Benzanthracene DMSO Phénobarb ital Control
Figure 31 Aryl Hydrocarbon Hydroxylase in HepG2 cells exposed to a number of inducers - see section 2 15 2 3
117
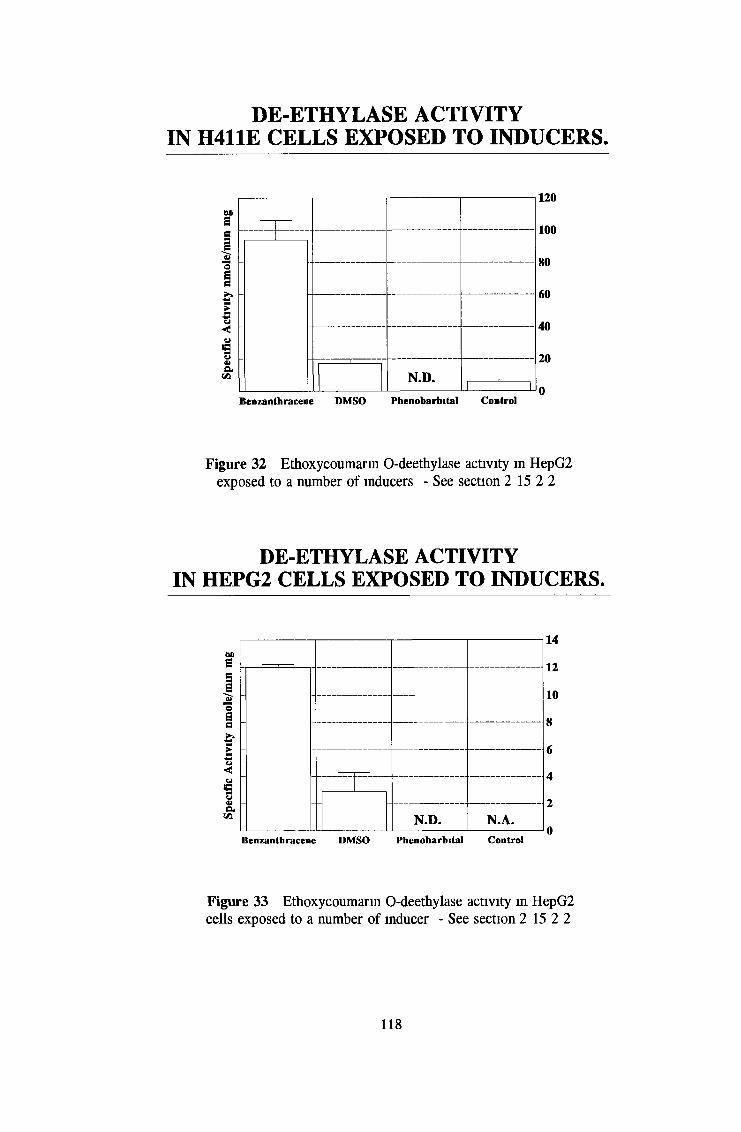
120
100
80
60
40
20
0Benzanthracene DMSO Phénobarbital Control
Figure 32 Ethoxycoumarin O-deethylase activity in HepG2 exposed to a number o f inducers - See section 2 15 2 2
DE-ETHYLASE ACTIVITYIN H411E CELLS EXPOSED TO INDUCERS.
DE-ETHYLASE ACTIVITY IN HEPG2 CELLS EXPOSED TO INDUCERS.
14
12
10
8
6
4
2
0Benzanthracene DMSO Phénobarb ital Control
Figure 33 Ethoxycoumarin O-deethylase activity in HepG2 cells exposed to a number of inducer - See section 2 15 2 2
N.D.
&0ee|'aa0
<OCPNU4>euui
118
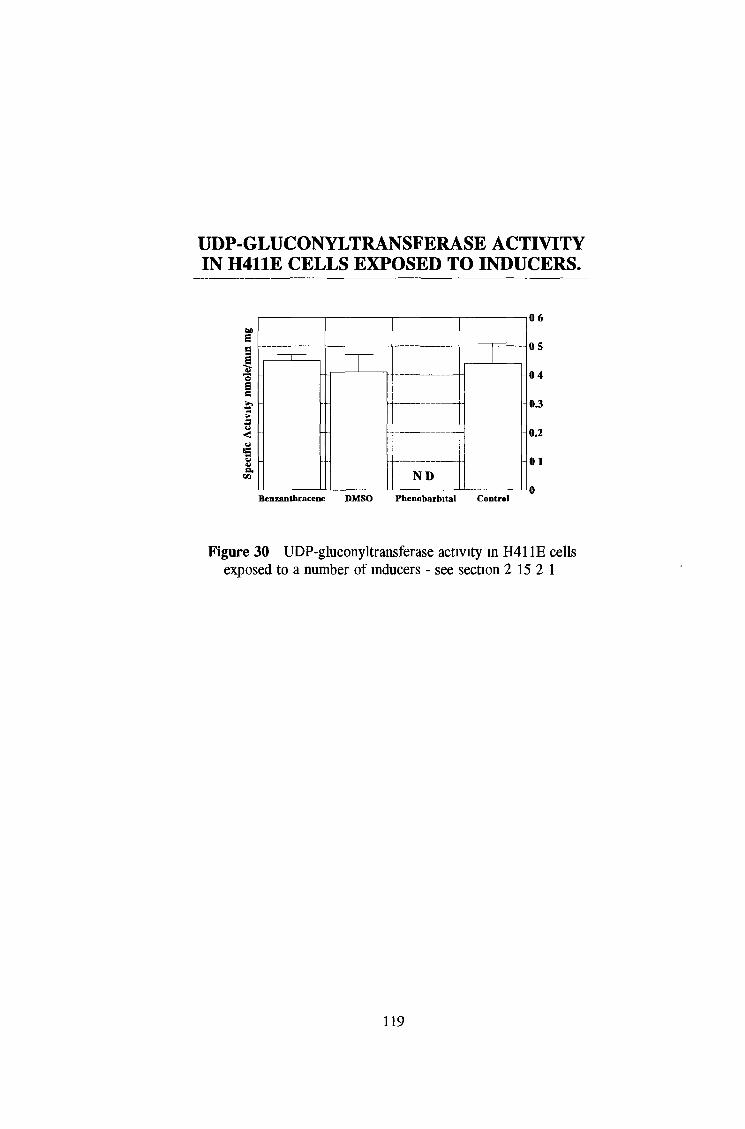
UDP-GLUCONYLTRANSFERA SE ACTIVITYIN H411E CELLS EXPOSED TO INDUCERS.
60S01 « ’oSe
euCfl
B enzanthracene DMSO
NDP h én o b arb ita l C ontrol
■j 0 6
OS
04
03
0.2
01
0
Figure 30 UDP-gluconyltransferase activity in H41 IE cells exposed to a number o f inducers - see section 2 15 2 1
119
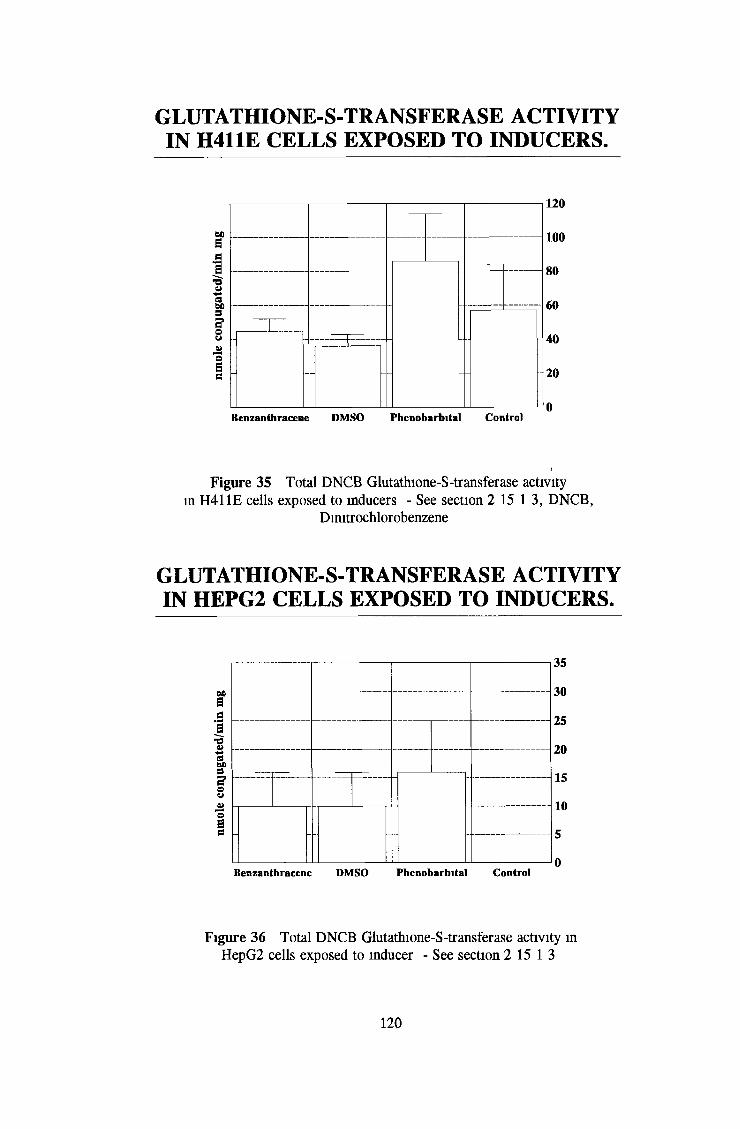
GLUTATHIONE-S-TRANSFERASE ACTIVITYIN H411E CELLS EXPOSED TO INDUCERS.
B enzanthracene DMSO P h én o b a rb ita l C ontro l
/Figure 35 Total DNCB Glutathione-S-transferase activity
in H411E cells exposed to inducers - See section 2 15 1 3, DNCB, Dinitrochlorobenzene
GLUTATHIONE-S-TRANSFERASE ACTIVITY IN HEPG2 CELLS EXPOSED TO INDUCERS.
35
aaa■oa>abC9S’ou—"osc
30
25
20
15
105
B enzanthracene DM SO P h é n o b a rb ita l C ontro lJ0
Figure 36 Total DNCB Glutathione-S-transferase activity in HepG2 cells exposed to inducer - See section 2 15 1 3
120
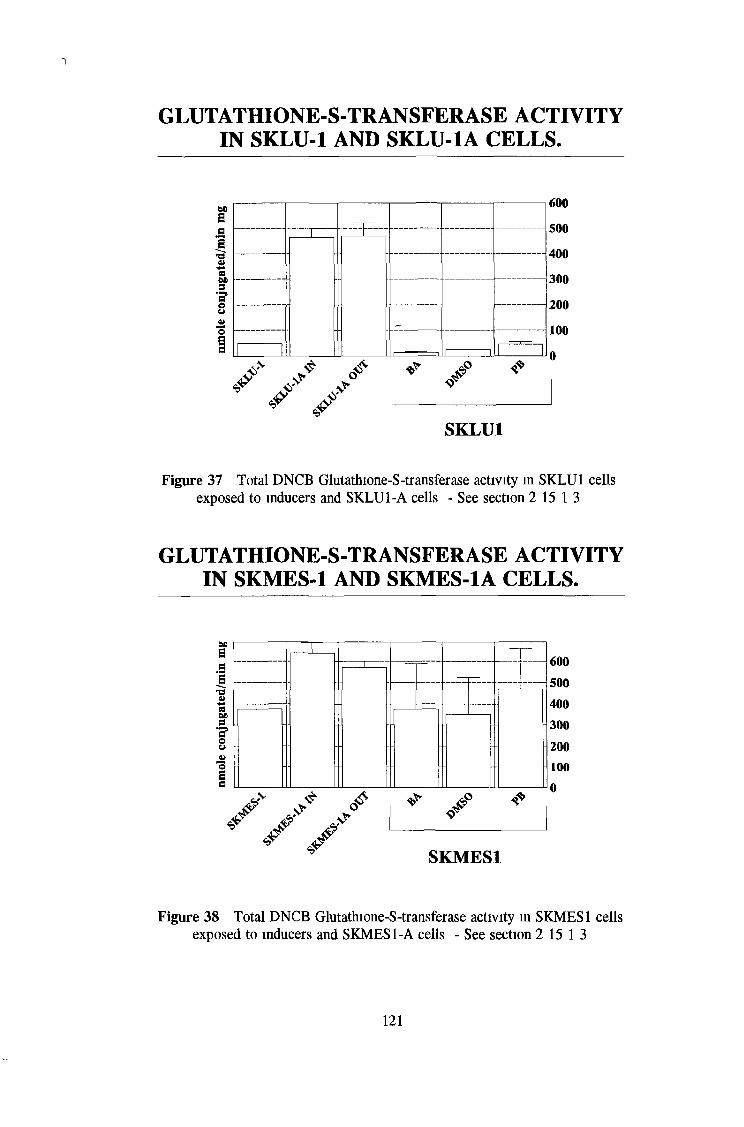
1
GLUTATHIONE-S-TRANSFERASE ACTIVITY IN SKLU-1 AND SKLU-1A CELLS.
odSa]34)CBOfi9oo
600
500
400
300
200
1000
SKLU1
Figure 37 Total DNCB Glutathione-S-transferase activity in SKLU1 cells exposed to inducers and SKLU1-A cells - See section 2 15 1 3
GLUTATHIONE-S-TRANSFERASE ACTIVITY IN SKMES-1 AND SKMES-1A CELLS.
Figure 38 Total DNCB Glutathione-S-transferase activity in SKMES1 cells exposed to inducers and SKMES1-A cells - See section 2 15 1 3
121
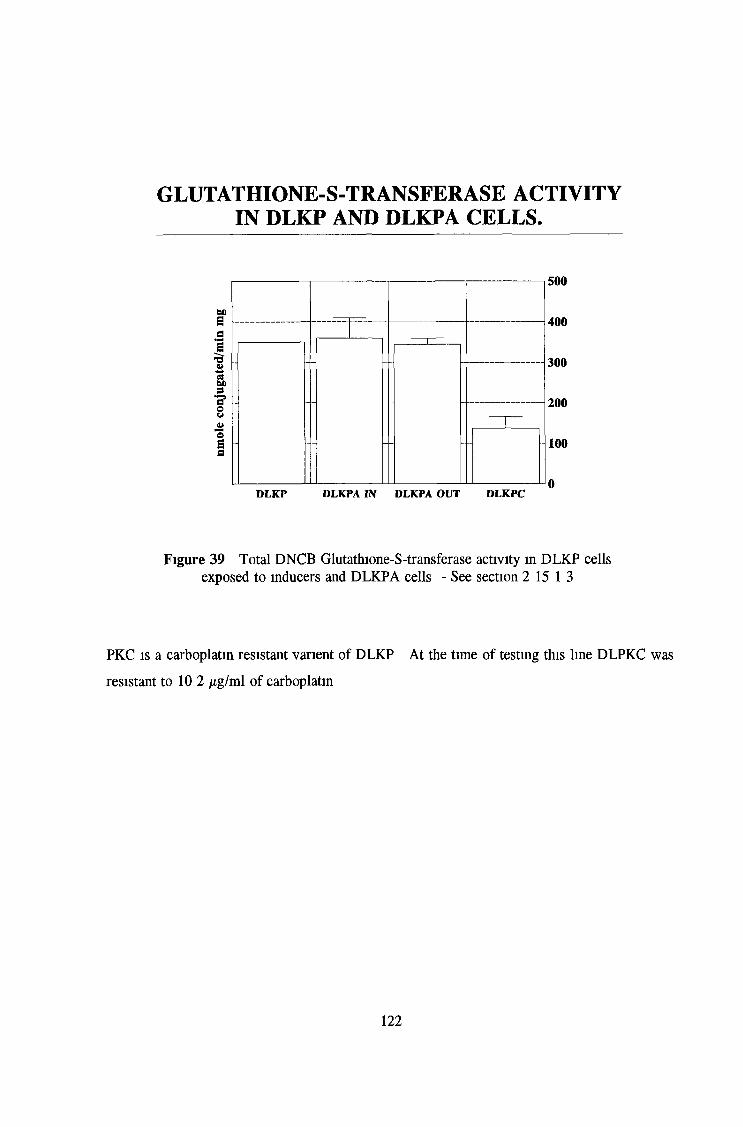
GLUTATHIONE-S-TRANSFERASE ACTIVITY IN DLKP AND DLKPA CELLS.
500
bosoa■s
bes•S’ou
400
300
200
oSc 100
D LKP DLKPA I N DLKPA OUT DLK PC
Figure 39 Total DNCB Glutathione-S-transferase activity in DLKP cells exposed to inducers and DLKPA cells - See section 2 15 1 3
PKC is a carboplatin resistant varient o f DLKP At the time o f testing this line DLPKC was
resistant to 10 2 /xg/ml o f carboplatin
122
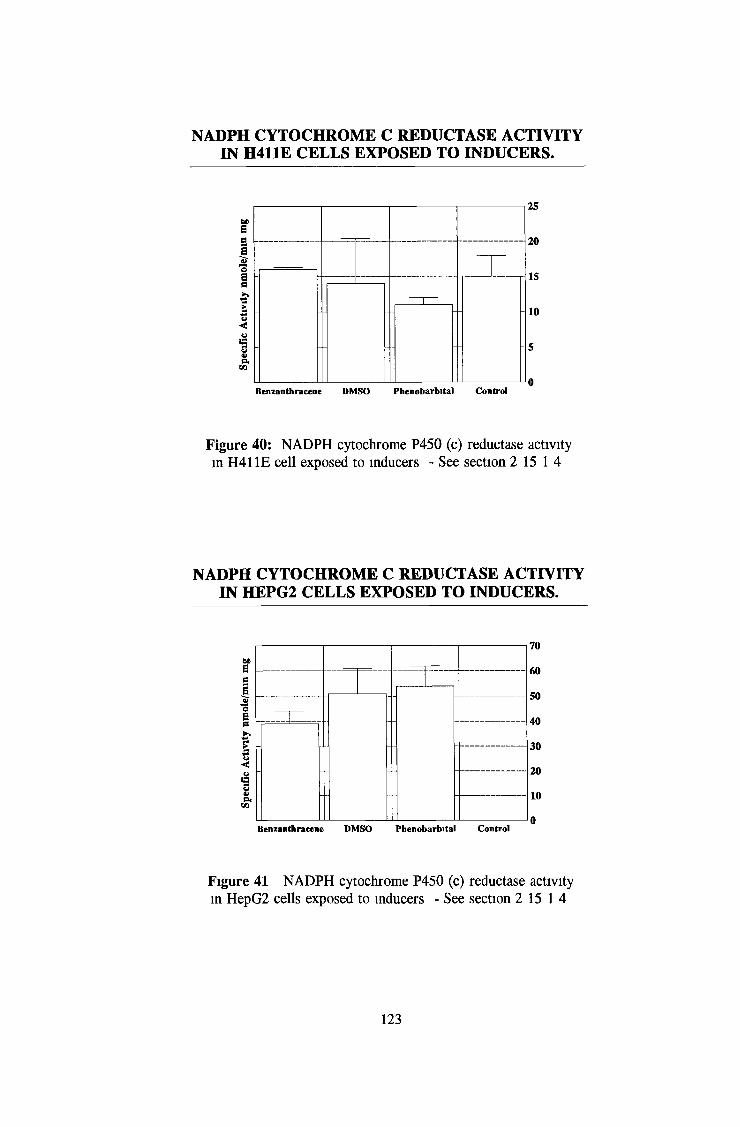
NADPH CYTOCHROME C REDUCTASE ACTIVITYIN H411E CELLS EXPOSED TO INDUCERS.
U>aca
125
20
IS
B enzanthracene DMSO P h én o b arb ita l C ontrol
10
Figure 40: NADPH cytochrome P450 (c) reductase activity in H411E cell exposed to inducers - See section 2 15 1 4
NADPH CYTOCHROME C REDUCTASE ACTIVITY IN HEPG2 CELLS EXPOSED TO INDUCERS.
B enzanthracene DMSO P hénobarb ita l C ontrol
Figure 41 NADPH cytochrome P450 (c) reductase activity in HepG2 cells exposed to inducers - See section 2 15 1 4
123
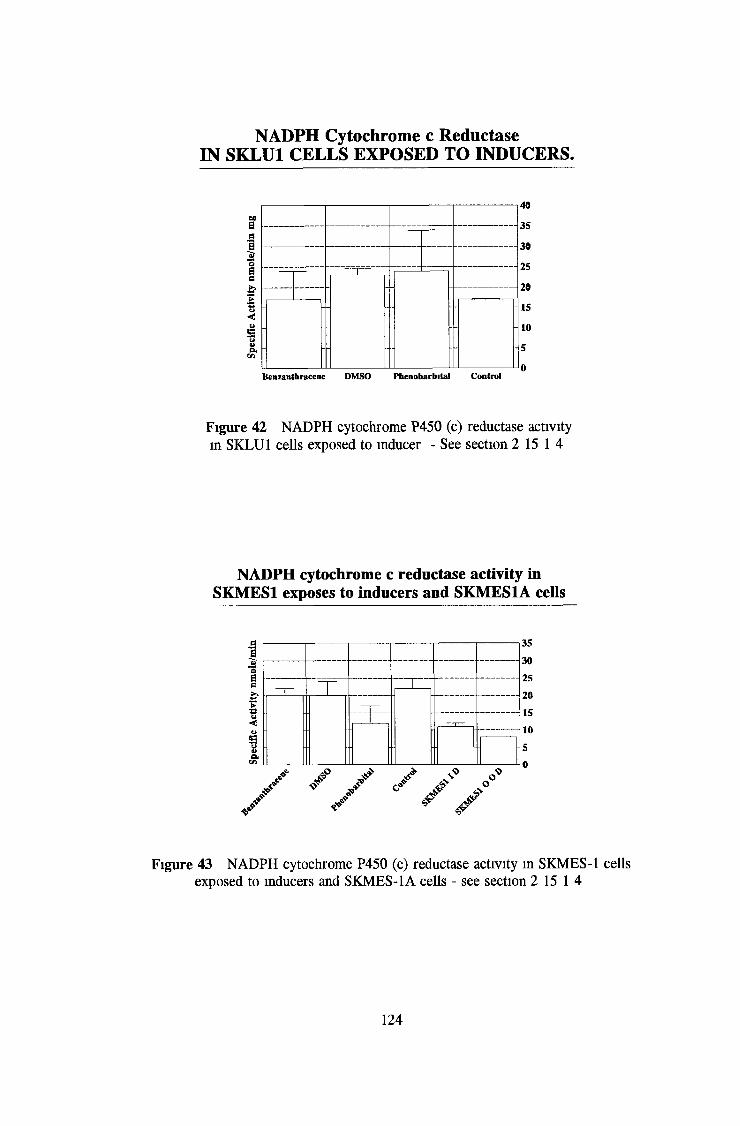
NADPH Cytochrome c Reductase IN SKLU1 CELLS EXPOSED TO INDUCERS.
40
35
30
25
20
15
10
5
Benzanthracene DMSO Phénobarbital Control
Figure 42 NADPH cytochrome P450 (c) reductase activity in SKLU1 cells exposed to inducer - See section 2 15 1 4
NADPH cytochrome c reductase activity in SKMES1 exposes to inducers and SKMES1A cells
Figure 43 NADPH cytochrome P450 (c) reductase activity in SKMES-1 cells exposed to inducers and SKMES-1A cells - see section 2 15 1 4
124
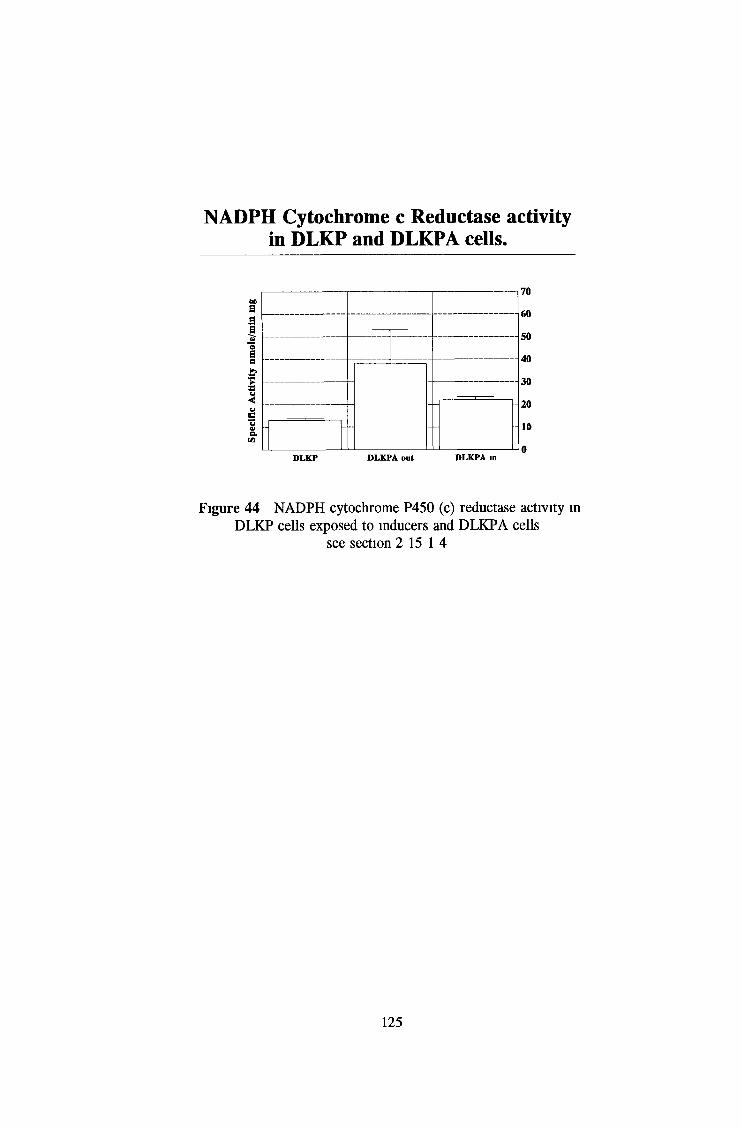
NADPH Cytochrome c Reductase activity in DLKP and DLKPA cells.
DLKP DLKPA. out DLKPA in
Figure 44 NADPH cytochrome P450 (c) reductase activity in DLKP cells exposed to inducers and DLKPA cells
see section 2 15 1 4
125
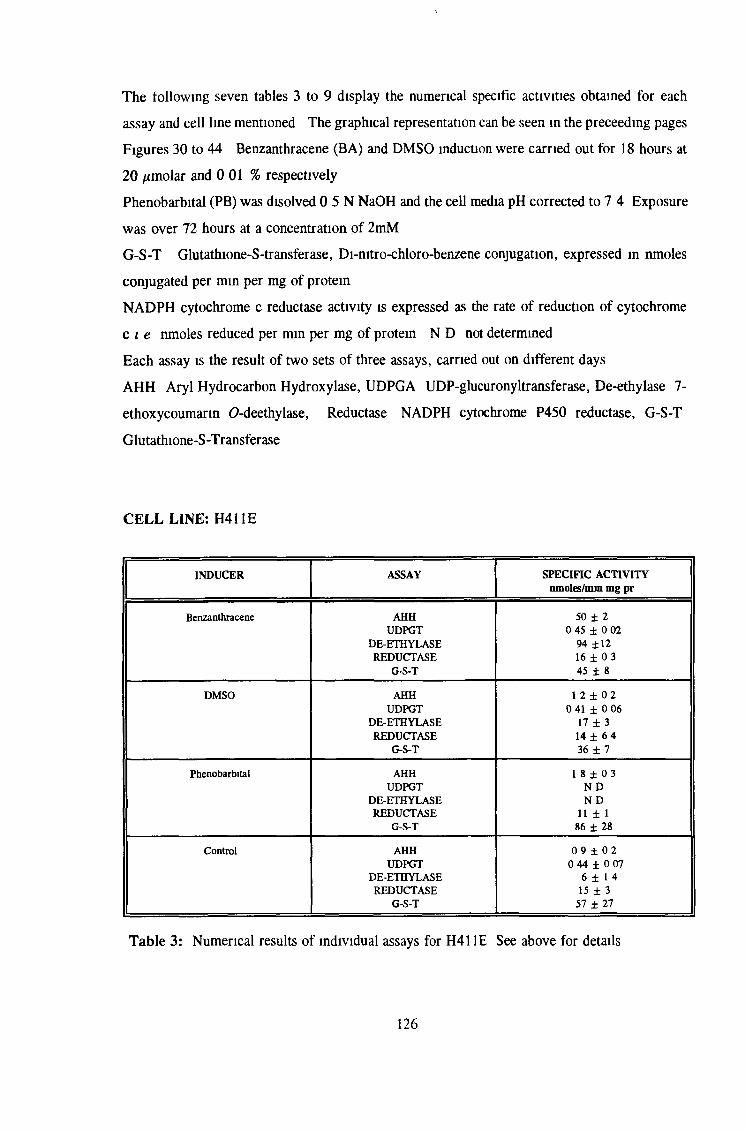
The following seven tables 3 to 9 display the numerical specific activities obtained for each
assay and cell line mentioned The graphical representation can be seen in the preceeding pages
Figures 30 to 44 Benzanthracene (BA) and DMSO induction were carried out for 18 hours at
20 /¿molar and 0 01 % respectively
Phénobarbital (PB) was disolved 0 5 N NaOH and the cell media pH corrected to 7 4 Exposure
was over 72 hours at a concentration of 2mM
G-S-T Glutathione-S-transferase, Di-nitro-chloro-benzene conjugation, expressed in nmoles
conjugated per min per mg of protein
NADPH cytochrome c reductase activity is expressed as the rate of reduction of cytochrome
c i e nmoles reduced per min per mg of protem N D not determined
Each assay is the result of two sets of three assays, carried out on different days
AHH Aryl Hydrocarbon Hydroxylase, UDPGA UDP-glucuronyltransferase, De-ethylase 7-
ethoxycoumarin 0-deethylase, Reductase NADPH cytochrome P450 reductase, G-S-T
Glutathione-S -T ransferase
CELL LINE: H411E
INDUCER ASSAY SPECIFIC ACTIVITY nmoles/nun mg pr
Benzanthracene AHH 50 ± 2UDPGT 0 45 ± 0 02
DE-ETHYLASE 94 ±12REDUCTASE 16 ± 0 3
G-S-T 45 ± 8
DMSO AHH 1 2 ± 0 2UDPGT 0 41 ± 0 06
DE-ETHYLASE 17 ± 3REDUCTASE 14 ± 6 4
G-S-T 36 ± 7
Phénobarbital AHH 1 8 ± 0 3UDPGT N D
DE-ETHYLASE N DREDUCTASE 11 ± 1
G-S-T 86 ± 28
Control AHH 0 9 ± 0 2UDPGT 0 44 ± 0 07
DE-ETHYLASE 6 ± 1 4REDUCTASE 15 ± 3
G-S-T 57 ± 27
Table 3: Numerical results of individual assays for H41 IE See above for details
126
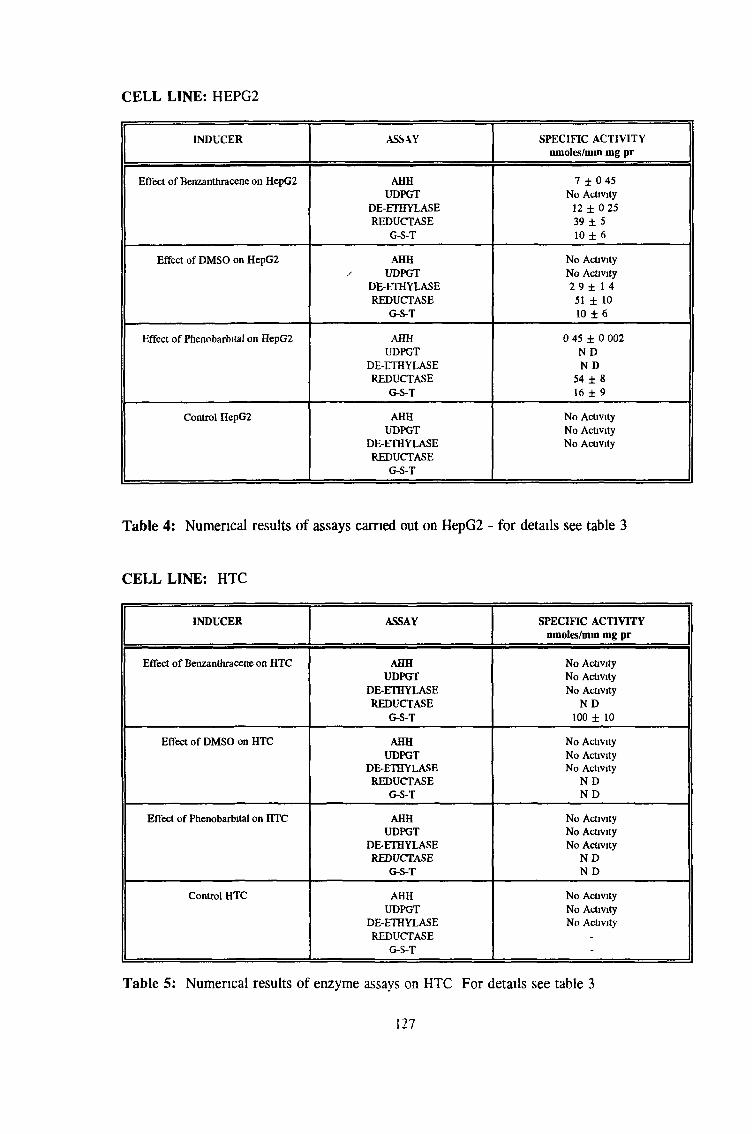
CELL LINE: HEPG2
INDUCER ASSAY SPECIFIC ACTIVITY nm oles/m u mg pr
Effect o f Benzanthracene on HepG2 AHH 7 ± 0 45UDPGT No Activity
DE-ETHYLASE 12 ± 0 25REDUCTASE 39 ± 5
G-S-T 10 ± 6
Effect of DMSO on HepG2 AHH No Activity' UDPGT No Activity
DE-ETHYLASE 2 9 ± 1 4REDUCTASE 51 ± 10
G-S-T 10 ± 6
Effect o f Phenobarbitai on HepG2 AHH 0 45 ± 0 002UDPGT N D
DE-ETHYLASE N DREDUCTASE 54 ± 8
G-S-T 16 ± 9
Control HepG2 AHH No ActivityUDPGT No Activity
DE-ETHYLASEREDUCTASE
G-S-T
No Activity
Table 4: Numerical results of assays carried out on HepG2 - for details see table 3
CELL LINE: HTC
INDUCER ASSAY SPECIFIC ACTIVITY nmoles/min mg p r
Effect o f Benzanthracene on HTC AHH No ActivityUDPGT No Activity
DE-ETHYLASE No ActivityREDUCTASE N D
G-S-T 100 ± 10
Effect o f DMSO on HTC AHH No ActivityUDPGT No Activity
DE-ETHYLASE No ActivityREDUCTASE N D
G-S-T N D
Effect o f Phenobarbitai on HTC AHH No ActivityUDPGT No Activity
DE-ETHYLASE No ActivityREDUCTASE N D
G-S-T N D
Control HTC AHH No ActivityUDPGT No Activity
DE-ETHYLASE No ActivityREDUCTASE -
G-S-T -
Table 5: Numerical results o f enzyme assays on HTC For details see table 3
127
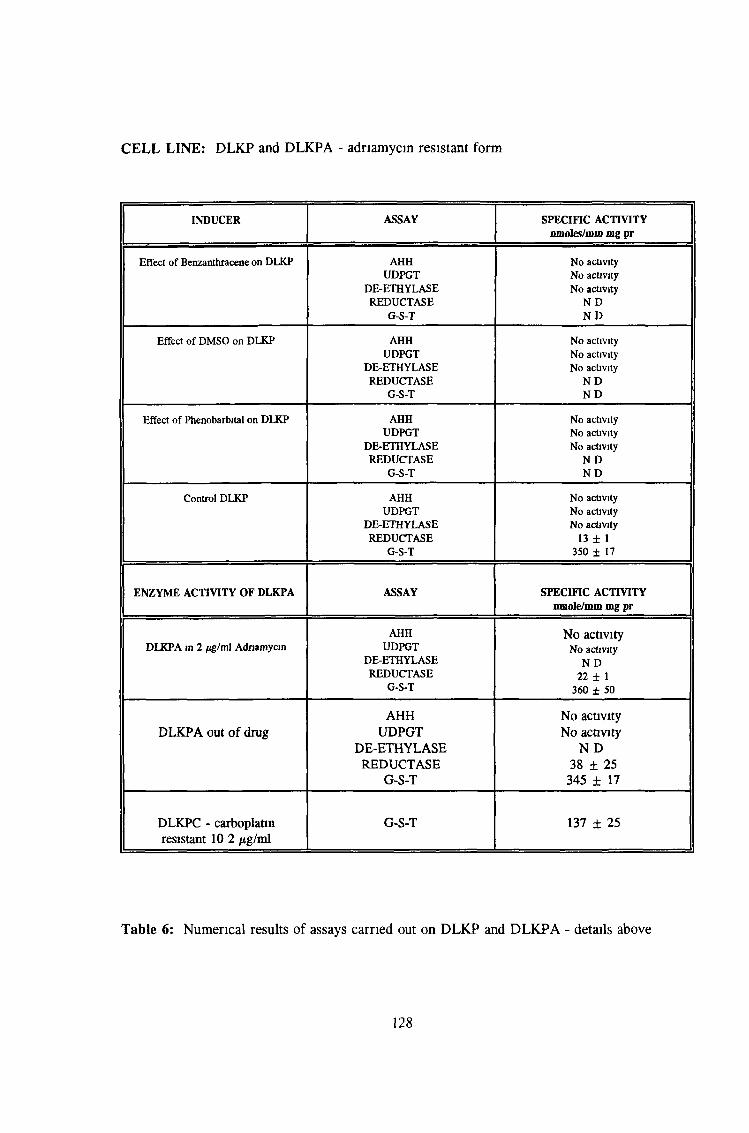
CELL LINE: DLKP and DLKPA - adriamycin resistant form
INDUCER ASSAY SPECIFIC ACTIVITY nmoles/nun mg pr
Effect of Benzanthracene on DLKP AHH No activityUDPGT No activity
DE-ETHYLASE No activityREDUCTASE N D
G-S-T N D
Effect o f DMSO on DLKP AHH No activityUDPGT No activity
DE-ETHYLASE No activityREDUCTASE N D
G-S-T N D
Effect o f Phénobarbital on DLKP AHH No activityUDPGT No activity
DE-ETHYLASE No activityREDUCTASE N D
G-S-T N D
Control DLKP AHH No activityUDPGT No activity
DE-ETHYLASE No activityREDUCTASE 13 ± 1
G-S-T 350 ± 17
ENZYME ACTIVITY OF DLKPA ASSAY SPECIFIC ACTIVITY nmole/mm mg pr
AHH No activityDLKPA m 2 pg/ml Adnamycm UDPGT No activity
DE-ETHYLASE N DREDUCTASE 22 ± 1
G-S-T 360 ± 50
AHH No activityDLKPA out of drug UDPGT No activity
DE-ETHYLASE N DREDUCTASE 38 ± 25
G-S-T 345 ± 17
DLKPC - carboplatm resistant 10 2 ¿tg/ml
G-S-T 137 ± 25
Table 6: Numerical results of assays carried out on DLKP and DLKPA - details above
128
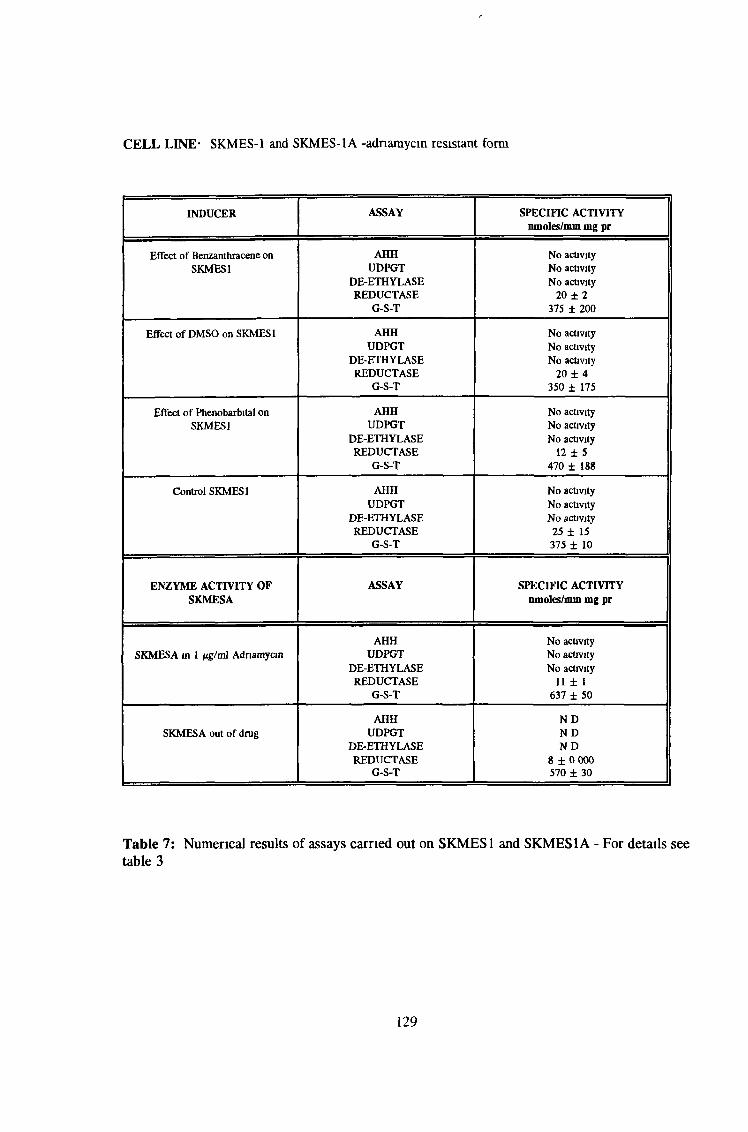
CELL LINE- SKMES-1 and SKMES-1A -adnamycm resistant form
INDUCER ASSAY SPECIFIC ACTIVITY nmoles/nun mg pr
Effect of Benzanthracene on AHH No activitySKMES1 UDPGT No activity
DE-ETHYLASE No activityREDUCTASE 20 ± 2
G-S-T 375 ± 200
Effect of DMSO on SKMES1 AHH No activityUDPGT No activity
DE-ETHYLASE No activityREDUCTASE 20 ± 4
G-S-T 350 ± 175
Effect of Phénobarbital on AHH No activitySKMES1 UDPGT No activity
DE-ETHYLASE No activityREDUCTASE 12 ± 5
G-S-T 470 ± 188
Control SKMES1 AHH No activityUDPGT No activity
DE-ETHYLASE No activityREDUCTASE 25 ± 15
G-S-T 375 ± 10
ENZYME ACTIVITY OF ASSAY SPECIFIC ACTIVITYSKMESA nmoles/nun mg pr
AHH No activitySKMESA in 1 fxg/ml Adnamycm UDPGT No activity
DE-ETHYLASE No activityREDUCTASE 11 ± 1
G-S-T 637 ± 50
AHH NDSKMESA out of drug UDPGT ND
DE-ETHYLASE NDREDUCTASE 8 ± 0 000
G-S-T 570 ± 30
Table 7: Numerical results of assays carried out on SKMES1 and SKMES1A - For details see table 3
129
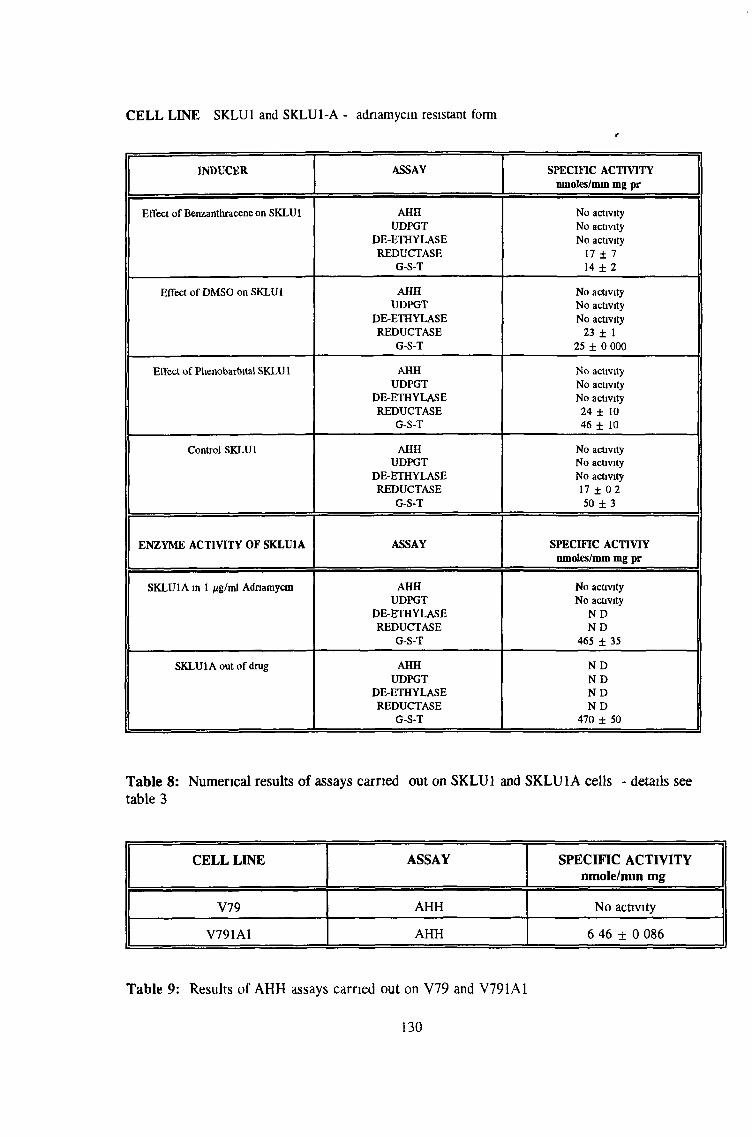
CELL LINE SKLU1 and SKLU1-A - adnamycm resistant form
INDUCER ASSAY SPECIFIC ACTIVITY nmoles/min mg pr
Effect of Benzanthracene on SKLU1 AHH No activityUDPGT No activity
DE-ETHYLASE No activityREDUCTASE 17 ± 7
G-S-T 14 ± 2
Effect of DMSO on SKLU1 AHH No activityUDPGT No activity
DE-ETHYLASE No activityREDUCTASE 23 ± 1
G-S-T 25 ± 0 000
Effect of Phénobarbital SKLU1 AHH No activityUDPGT No activity
DE-ETHYLASE No activityREDUCTASE 24 ± 10
G-S-T 46 ± 10
Control SKLU1 AHH No activityUDPGT No activity
DE-ETHYLASE No activityREDUCTASE 17 ± 0 2
G-S-T 50 ± 3
ENZYME ACTIVITY OF SKLU1A ASSAY SPECIFIC ACTIVIY nmoles/mm mg pr
SKLU1A in 1 ixg/ml Adnamycm AHH No activityUDPGT No activity
DE-ETHYLASE NDREDUCTASE N D
G-S-T 465 ± 35
SKLU1A out of drug AHH N DUDPGT N D
DE-ETHYLASE N DREDUCTASE N D
G-S-T 470 ± 50
Table 8: Numerical results of assays earned out on SKLU1 and SKLU1A cells - details see table 3
CELL LINE ASSAY SPECIFIC ACTIVITY nmole/min mg
V79 AHH No activity
V791A1 AHH 6 46 ± 0 086
Table 9: Results o f AHH assays carried out on V79 and V791A1
130
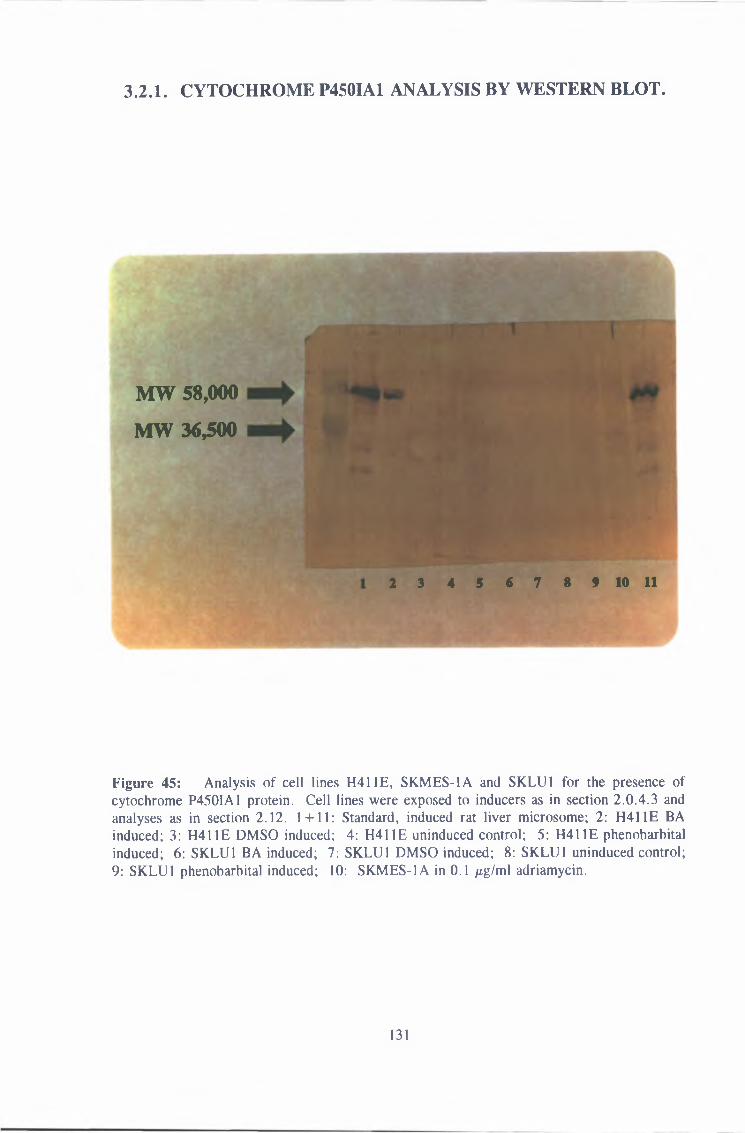
3 .2 .1 . C Y T O C H R O M E P 450 IA 1 A N A L Y S IS B Y W E S T E R N B L O T .
MW 58,000 MW 36,500
2 3 4 5 6 7 8 9 10 11
Figure 45: Analysis o f cell lines H411E, SKMES-1A and SKLU1 for the presence ofcytochrome P4501A1 protein. Cell lines were exposed to inducers as in section 2 .0 .4 .3 and analyses as in section 2.12. 1 + 11: Standard, induced rat liver microsome; 2: H411E BA induced; 3: H411E DMSO induced; 4: H411E uninduced control; 5: H411E phénobarbital induced; 6: SKLU1 BA induced; 7: SKLU1 DMSO induced; 8: SKLU1 uninduced control; 9: SKLU1 phénobarbital induced; 10; SKMES-1A in 0.1 /ig/ml adriamycin.
131
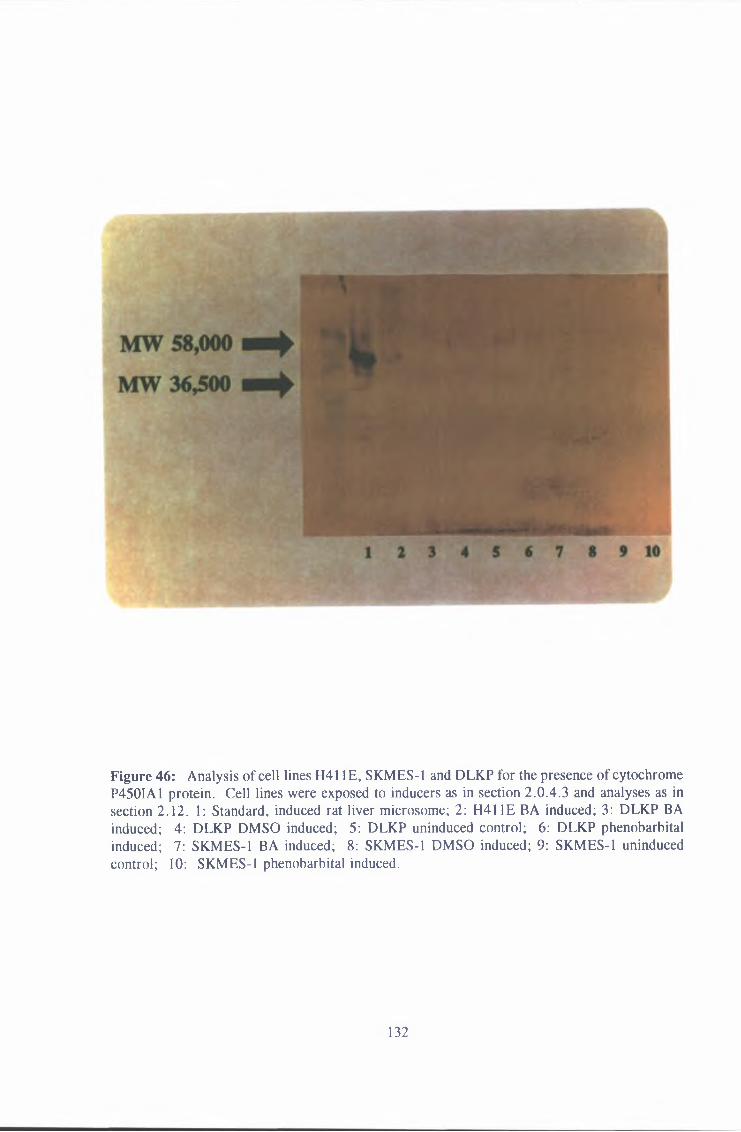
Figure 46: Analysis of cell lines H41 IE, SKMES-1 and DLKP for the presence of cytochrome P4501A1 protein. Cell lines were exposed to inducers as in section 2.0.4.3 and analyses as in section 2.12. 1: Standard, induced rat liver microsome; 2: H411E BA induced; 3: DLKP BA induced; 4: DLKP DMSO induced; 5: DLKP uninduced control; 6: DLKP phénobarbital induced; 7: SKMES-1 BA induced; 8: SKMES-1 DMSO induced; 9: SKMES-1 uninduced control; 10: SKMES-1 phénobarbital induced.
132
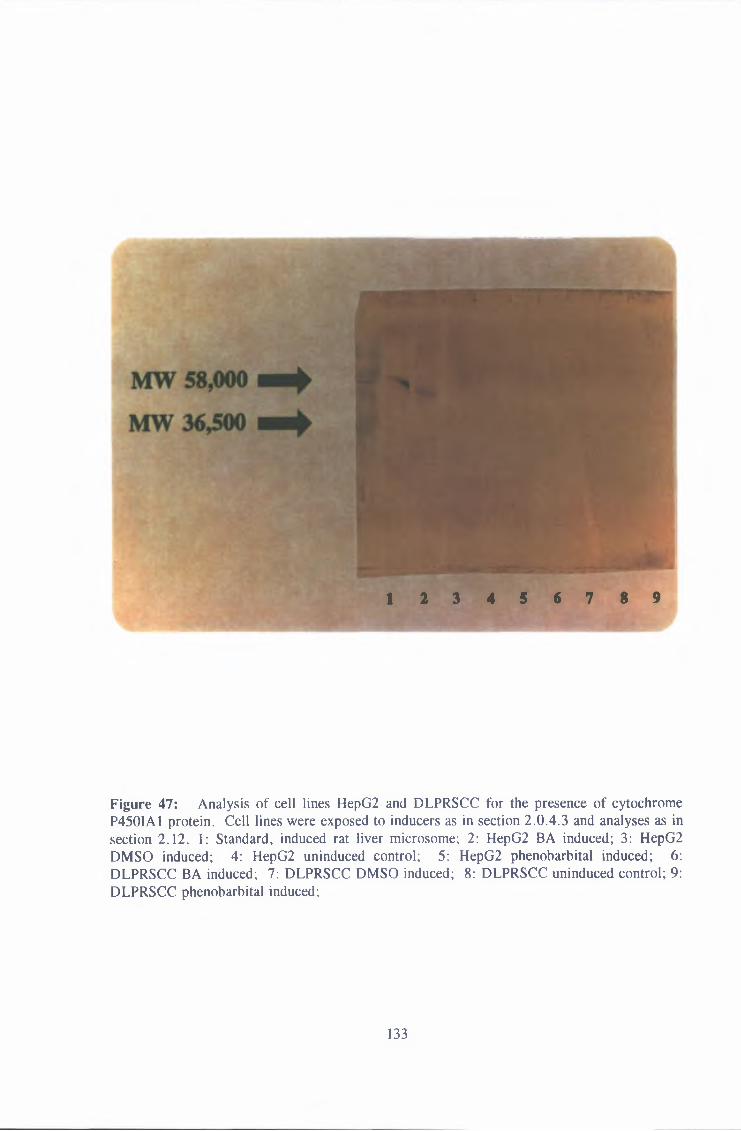
1 2 3 4 5 6 7 8 9
Figure 47: Analysis of cell lines HepG2 and DLPRSCC for the presence of cytochromeP450IA1 protein. Cell lines were exposed to inducers as in section 2.0.4.3 and analyses as in section 2.12. 1: Standard, induced rat liver microsome; 2: HepG2 BA induced; 3: HepG2 DMSO induced; 4: HepG2 uninduced control; 5; HepG2 phénobarbital induced; 6: DLPRSCC BA induced; 7: DLPRSCC DMSO induced; 8: DLPRSCC uninduced control; 9: DLPRSCC phénobarbital induced;
133

3.3 EFFECT OF ANTIBODIES ON H411E EXPRESSION OF AHH.
The effect of addition of antibodies Rat CYP1A1, Rat CYPIIB1 and cytochrome P450 reductase
on Aryl Hydrocarbon Hydroxylase and cytochrome P450 reductase, is seen in Figure 48
Antibody was introduced into the assay mixture before the sample and allowed to stand on ice
for 30 mm before assay The assay was then run as per usual - see section 2 15 2 3 As can
be seen the greater majority of AHH activity in the induced H411E cells can be attributed to
CYP1A1, however there is a 20% portion of this activity which is carried out by other
enzymes Addition of CYP2B1 antibody results in a decrease in AHH activity in these cells
also, further enforcing the CYP1A1 results These results demonstrate the shared enzyme
activity and broad substrate specificity characteristic of the different CYP families
134
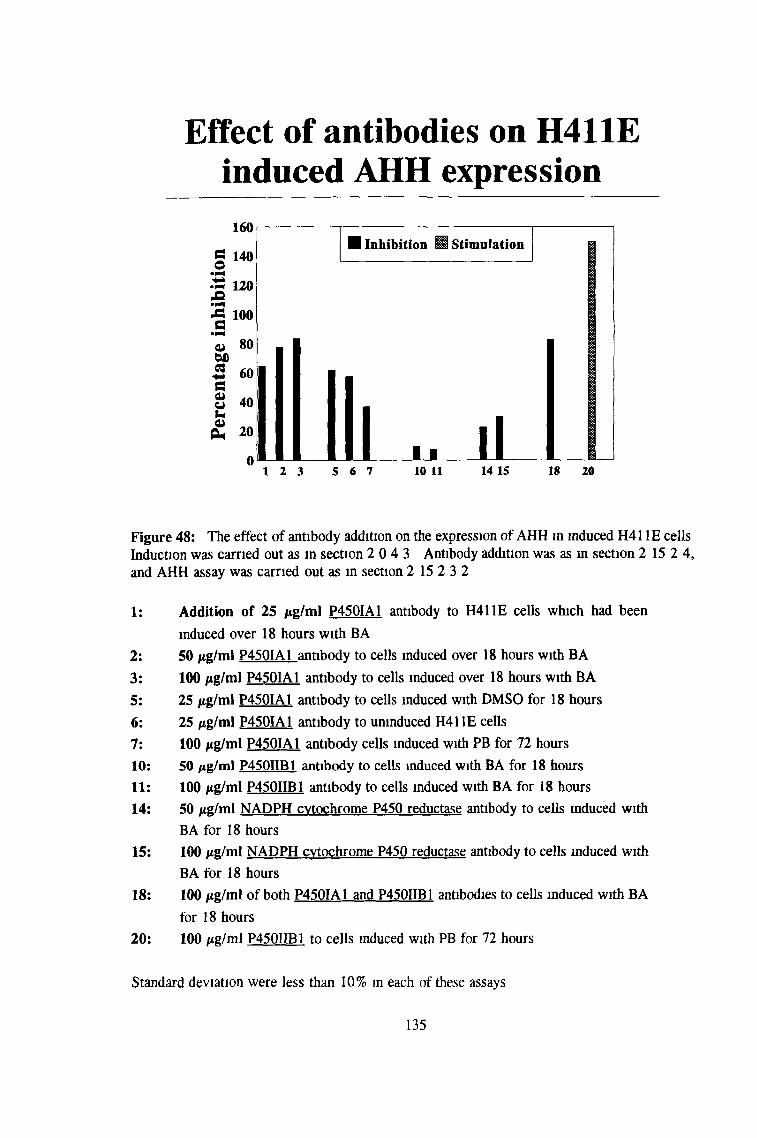
Effect of antibodies on H411E induced AHH expression
160
5 6 7 10 11 14 15
Figure 48: The effect of antibody addition on the expression of AHH in induced H41 IE cells Induction was carried out as in section 2 0 4 3 Antibody addition was as in section 2 15 2 4, and AHH assay was carried out as in section 2 15 2 3 2
1: Addition of 25 /xg/ml P450IA1 antibody to H411E cells which had beeninduced over 18 hours with BA
2: 50 /ig/ml P450IA1 antibody to cells induced over 18 hours with BA3: 100 jig/ml P450IA1 antibody to cells induced over 18 hours with BA5: 25 /ig/ml P450IA1 antibody to cells induced with DMSO for 18 hours6 : 25 /ig/ml P450IA1 antibody to uninduced H41 IE cells7: 100 /ig/ml P450IA1 antibody cells induced with PB for 72 hours10: 50 /ig/ml P450IIB1 antibody to cells induced with BA for 18 hours11: 100 /ig/ml P450IIB1 antibody to cells induced with BA for 18 hours14: 50 /tg/ml NADPH cytochrome P450 reductase antibody to cells mduced with
BA for 18 hours15: 100 /xg/ml NADPH cytochrome P450 reductase antibody to cells mduced with
BA for 18 hours18: 100 /ig/ml of both P450IA1 and P450IIB1 antibodies to cells mduced with BA
for 18 hours20: 100 /ig/ml P450IIB1 to cells induced with PB for 72 hours
Standard deviation were less than 10% in each of these assays
135
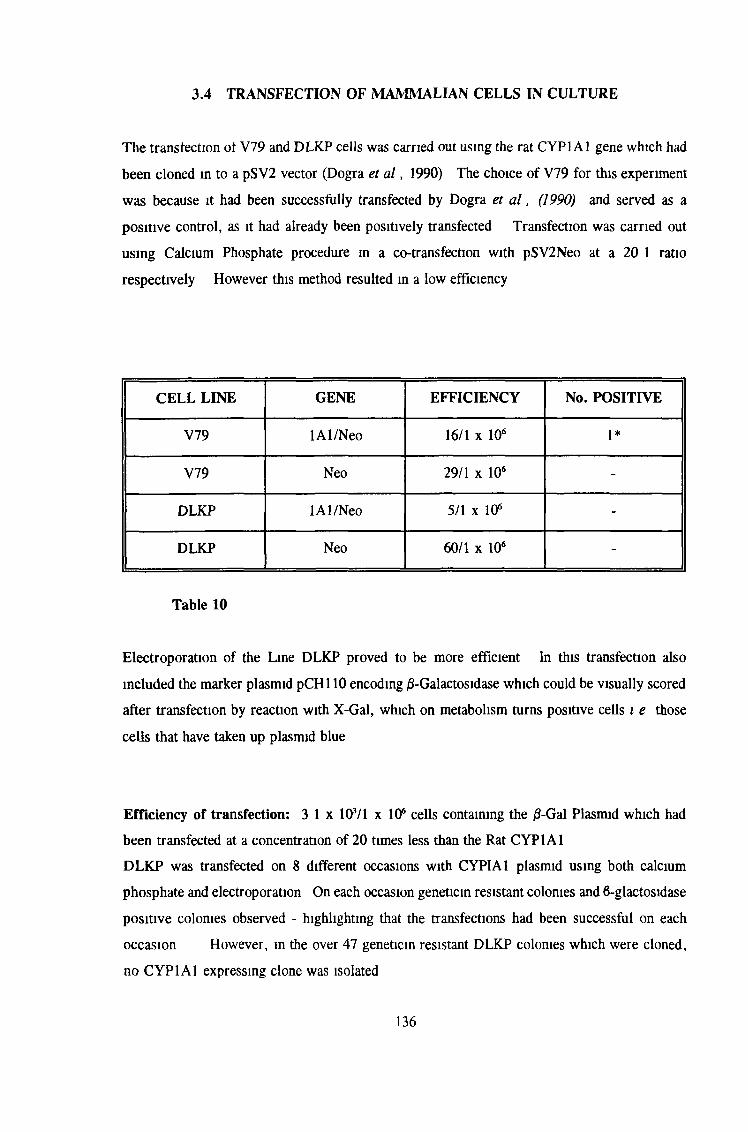
3.4 TRANSFECTION OF M AMMALIAN CELLS IN CULTURE
The transfection of V79 and DLKP cells was carried out using the rat CYP1A1 gene which had
been cloned in to a pSV2 vector (Dogra et a l , 1990) The choice of V79 for this experiment
was because it had been successfully transfected by Dogra et a l , (1990) and served as a
positive control, as it had already been positively transfected Transfection was carried out
using Calcium Phosphate procedure in a co-transfection with pSV2Neo at a 20 1 ratio
respectively However this method resulted in a low efficiency
CELL LINE GENE EFFICIENCY No. POSITIVE
V79 1A 1/Neo 16/1 x 106 1*
V79 Neo 29/1 x 106 -
DLKP lAl/Neo 5/1 x 106 -
DLKP Neo 60/1 x 106 -
Table 10
Electroporation of the Line DLKP proved to be more efficient In this transfection also
included the marker plasmid pCHl 10 encoding /3-Galactosidase which could be visually scored
after transfection by reaction with X-Gal, which on metabobsm turns positive cells i e those
cells that have taken up plasmid blue
Efficiency of transfection: 3 1 x 1071 x 106 cells containing the /3-Gal Plasmid which had
been transfected at a concentration of 20 times less than the Rat CYP1A1
DLKP was transfected on 8 different occasions with CYPIA1 plasmid using both calcium
phosphate and electroporation On each occasion geneticin resistant colonies and 6-glactosidase
positive colonies observed - highlighting that the transfections had been successful on each
occasion However, m the over 47 geneticin resistant DLKP colonies which were cloned,
no CYP1A1 expressing clone was isolated
136
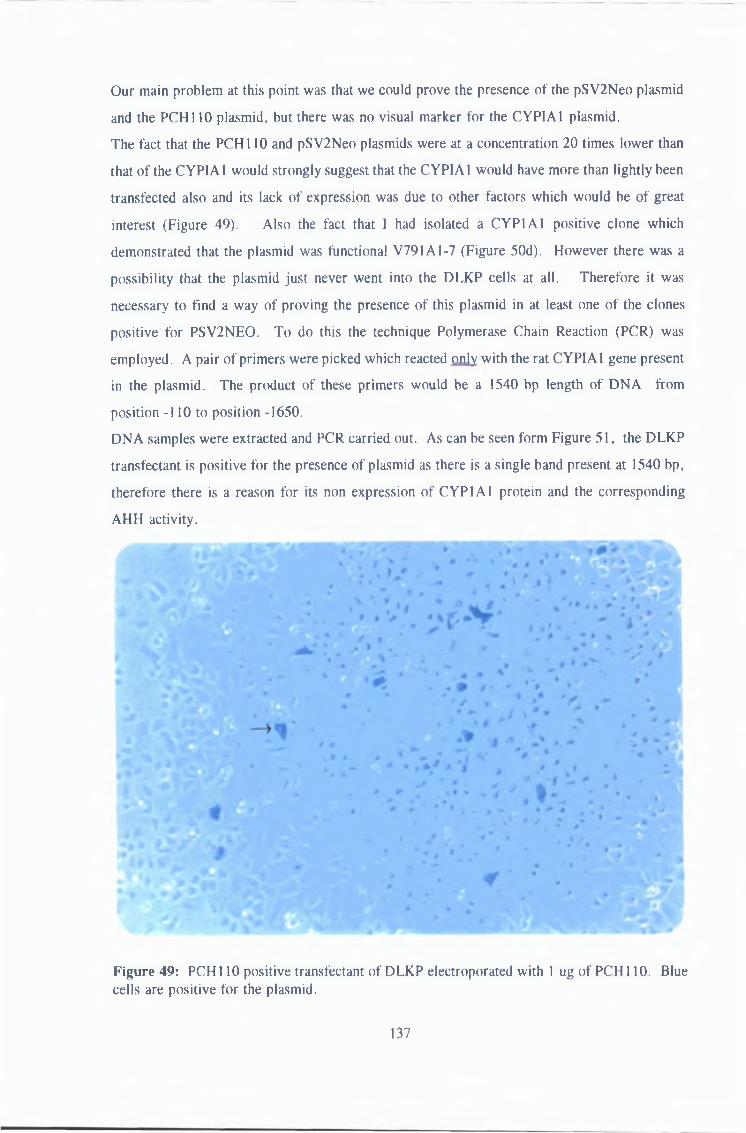
Our main problem at this point was that we could prove the presence of the pSV2Neo plasmid
and the PCH110 plasmid, but there was no visual marker for the CYP1A1 plasmid.
The fact that the PCH 110 and pSV2Neo plasmids were at a concentration 20 times lower than
that of the CYP1A1 would strongly suggest that the CYPIA1 would have more than lightly been
transfected also and its lack of expression was due to other factors which would be of great
interest (Figure 49). Also the fact that I had isolated a CYP1A1 positive clone which
demonstrated that the plasmid was functional V791A1-7 (Figure 50d). However there was a
possibility that the plasmid just never went into the DLKP cells at all. Therefore it was
necessary to find a way of proving the presence of this plasmid in at least one of the clones
positive for PSV2NEO. To do this the technique Polymerase Chain Reaction (PCR) was
employed. A pair of primers were picked which reacted only with the rat CYP1A1 gene present
in the plasmid. The product of these primers would be a 1540 bp length of DNA from
position -110 to position -1650.
DNA samples were extracted and PCR carried out. As can be seen form Figure 51, the DLKP
transfectant is positive for the presence of plasmid as there is a single band present at 1540 bp,
therefore there is a reason for its non expression of CYP1A1 protein and the corresponding
AHH activity.
Figure 49: PC H 110 positive transfectant of DLKP electroporated with 1 ug of PCH 110. Blue cells are positive for the plasmid.
137
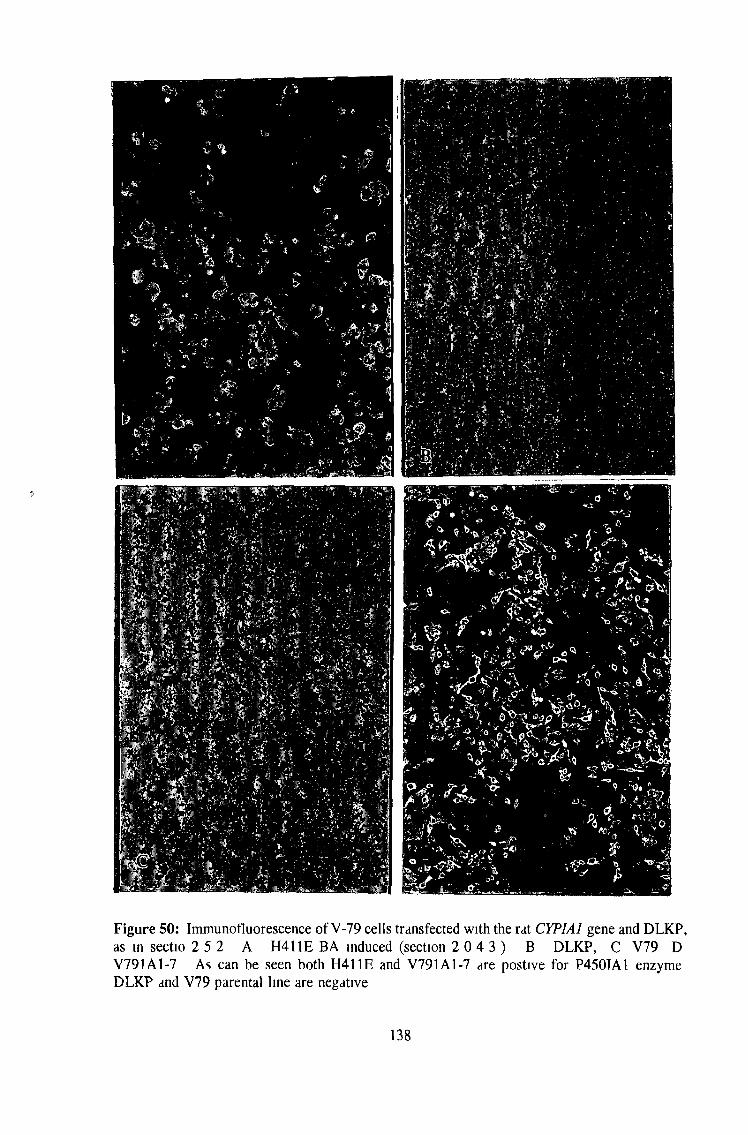
Figure 50: Immunofluorescence of V-79 cells transfected with the rat CYPIA1 gene and DLKP, as m sectio 2 5 2 A H411E BA induced (section 2 0 4 3 ) B DLKP, C V79 D V791A1-7 As can be seen both H411E and V791A1-7 are postive for P450IA1 enzyme DLKP and V79 parental line are negative
138
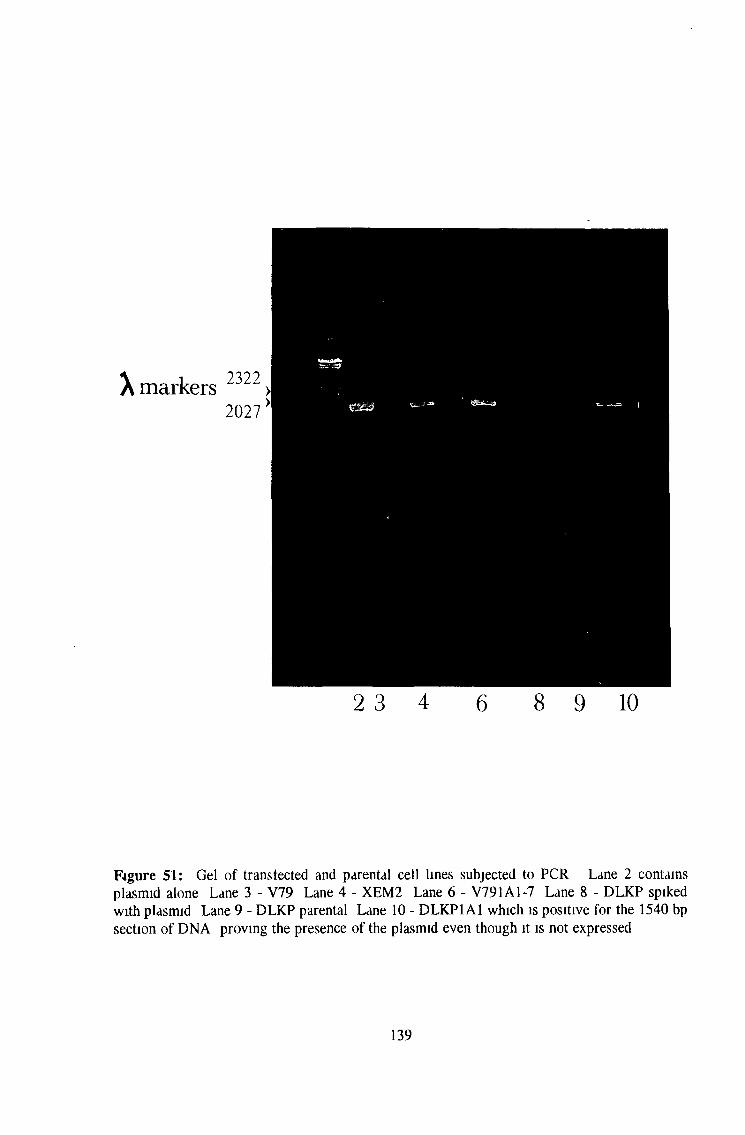
X markers 2322 2027
2 3 4 6 8 9 10
Figure 51: Gel of transfected and parental cell lines subjected to PCR Lane 2 contains plasmid alone Lane 3 - V79 Lane 4 - XEM2 Lane 6 - V791A1-7 Lane 8 - DLKP spiked with plasmid Lane 9 - DLKP parental Lane 10 - DLKP1A1 which is positive for the 1540 bp section of DNA proving the presence of the plasmid even though it is not expressed
139
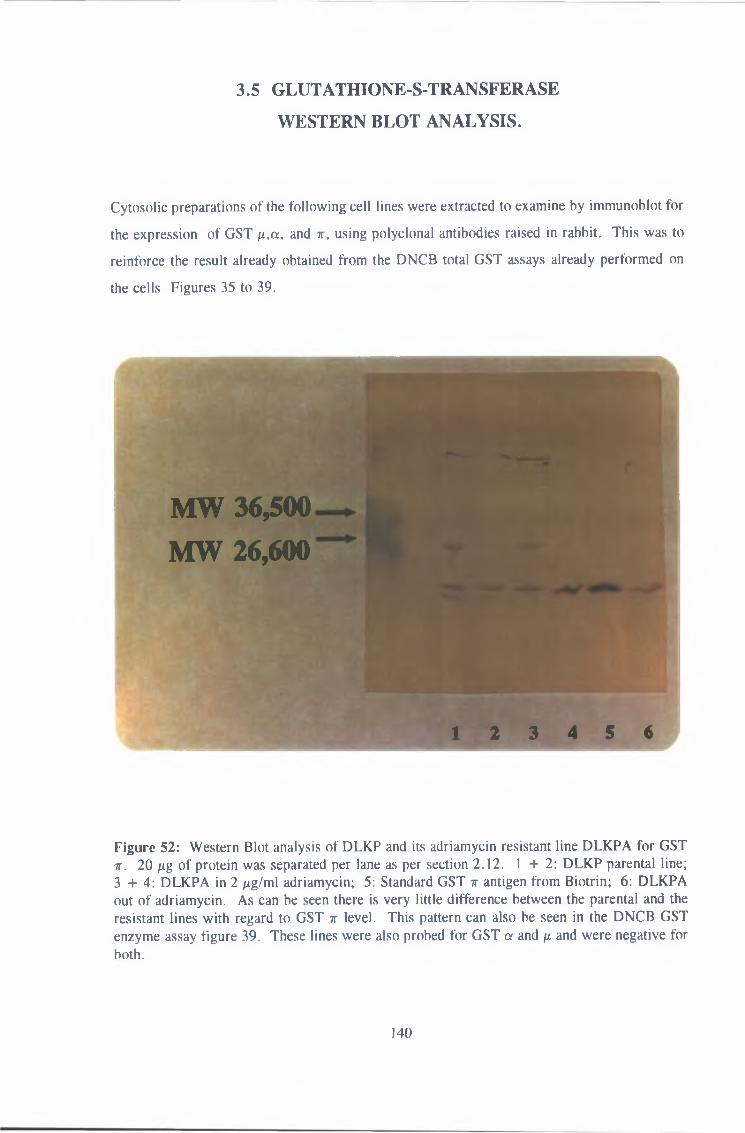
3 .5 G L U T A T H IO N E -S-T R A N S F E R A S E
W E S T E R N B L O T A N A L Y S IS .
Cytosolic preparations of the following cell lines were extracted to examine by immunoblot for
the expression of GST ¡i,a, and it, using polyclonal antibodies raised in rabbit. This was to
reinforce the result already obtained from the DNCB total GST assays already performed on
the cells Figures 35 to 39.
MW 36,500 MW 26,600
1 2 3 4 5 «
Figure 52: Western Blot analysis of DLKP and its adriamycin resistant line DLKPA for GST 7T. 20 /xg of protein was separated per lane as per section 2.12. 1 + 2: DLKP parental line; 3 + 4 : DLKPA in 2 ¿¿g/ml adriamycin; 5: Standard GST 7r antigen from Biotrin; 6: DLKPA out of adriamycin. As can be seen there is very little difference between the parental and the resistant lines with regard to GST n level. This pattern can also be seen in the DNCB GST enzyme assay figure 39. These lines were also probed for GST a and /x and were negative for both.
140
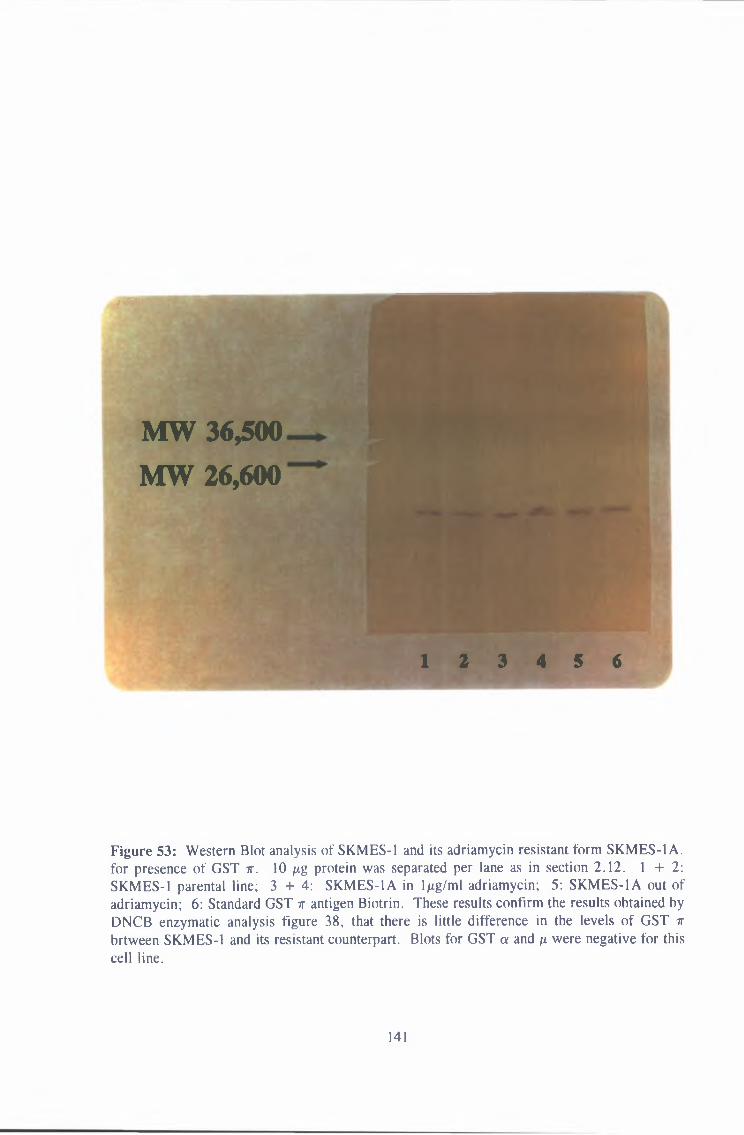
rt-sm
MW 36,500 MW 26,600
1 2 3 4 5 6
Figure 53: Western Blot analysis of SKMES-1 and its adriamycin resistant form SKMES-1 A. for presence of GST n. 10 fig protein was separated per lane as in section 2.12. 1 + 2:SKMES-1 parental line; 3 + 4: SKMES-1A in 1/ig/ml adriamycin; 5: SKMES-1A out of adriamycin; 6: Standard GST 7r antigen Biotrin. These results confirm the results obtained by DNCB enzymatic analysis figure 38, that there is little difference in the levels of GST n brtween SKMES-1 and its resistant counterpart. Blots for GST a and fi were negative for this cell line.
141

M W 36,500 M W 26,600
St 1 2 3 4 5 6
Figure 54: Western Blot analysis of SKLU1 and its adriamycin resistant form SKLU1A forGST 7T. St standard is the GST % antigen. 1 + 2: SKLU1 parental line; 3 + 4 : SKLU1-A in 0.5 /xg/ml adriamycin; 5 + 6: SKLU1-A out of adriamycin. These results confirm those of figure 37, that there is an elevated level of expression GST n protein and activity in SKLU1- A cells in comparison with the parental sensitive line. It is possible that this elevated level of expression is affecting the resistance of the SKLU1-A cell lines. Blots for GST a and n were negative for this cell line.
142
3 .6 TOXICITY TESTING OF A NUM BER OF CELL LINES.
The Chinese Hamster cell line V79 or the human squamous cell carcinoma DLKP contains no
detectable Cytochrome P450 activity The V79 line was transfected with the Rat Cytochrome
P450 1A1 gene (Dogra et a l , 1990) The line that resulted XEM2 expressed Aryl Hydrocarbon
Hydroxylase activity V79 was also transfected with rat P450IA1 m this laboratory and a clone
V791A1-7 was isolated which expressed higher activity of AHH than XEM2 The connection
between CYP1A1 activity with Multiple Drug Resistance (MDR) has been made on a number
of occasions It has been suggested that depression of CYP1A1 and elevation of expression of
CYP1A1 could contribute to MDR It was decided to investigate the toxicity of a number of
anticancer agents on these three lines, V79, XEM1, V791A1-7, using adriamycin, vincristine,
and VP 16 Figures 55-57
To demonstrate the activating ability of the transfected lines XEM2 and V791AI-7 over the
parental line, the toxicity profile of these three lines on exposure to benzo[a]pyrene is seen in
figure 58
The activation ability of CYP2B1 is investigated in figure 59 Cyclophosphamide is an
anticancer agent which requires activation before it becomes toxic The cytochrome P450
dependent enzymes 2B1 is largely responsible for this action The SD1 cell line is V79
transfected with the CYPIIB1 gene and expressing the protein CYP2B1 To show its activation
ability the toxicity profile of V79 was compared with SD1 DLKP and DLKPA were also
exposed to cyclophosphamide and appear to activate this drug to the same degree as SD1
Figure 60 displays the resistant nature of SKLU1A over its parental line SKLU1 Figures 61
and 62 demonstrate the effect of BSO, which inhibits glutathione production and prevents GST
action on this resistance As already demonstrated in figure 37, SKLU1A displays a different
pattern of GST 7r than its parental line SKLU1 and it was possible that this elevation m GST
activity played a part in the resistance of the cells
143
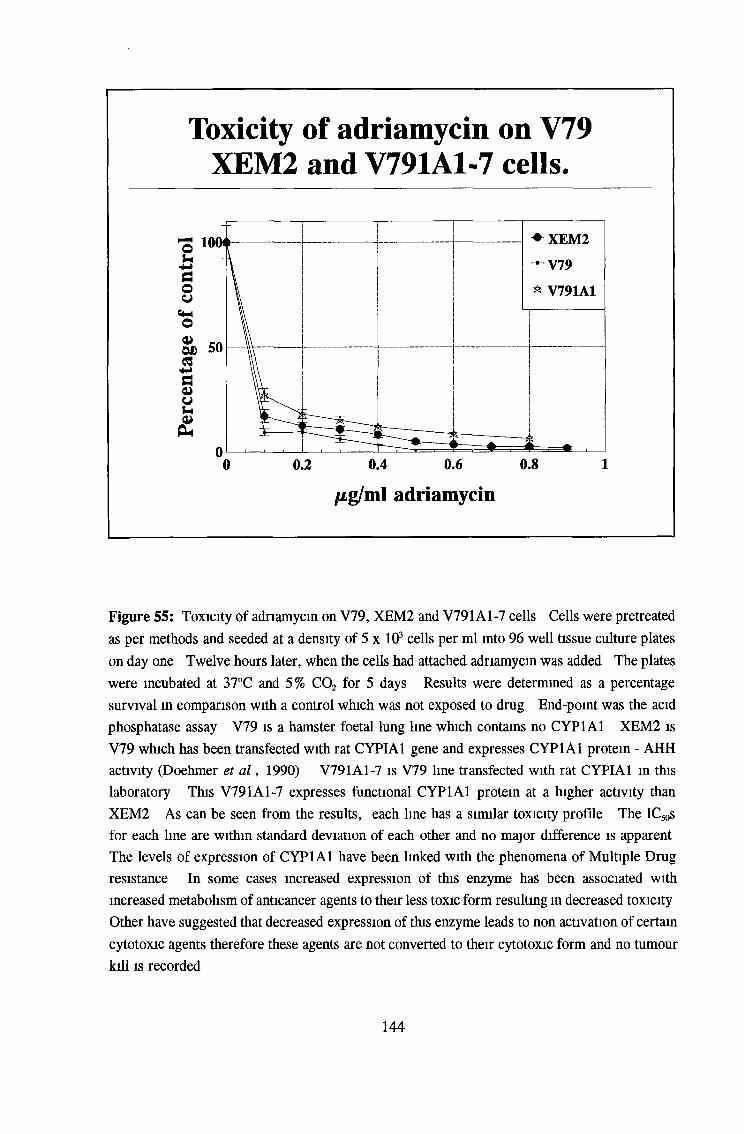
Figure 55: Toxicity of adriamycin on V79, XEM2 and V791A1-7 cells Cells were pretreated as per methods and seeded at a density of 5 x 10³ cells per ml into 96 well tissue culture plates on day one Twelve hours later, when the cells had attached adriamycin was added The plates were incubated at 37°C and 5% C02 for 5 days Results were determined as a percentage survival in comparison with a control which was not exposed to drug End-point was the acid phosphatase assay Y79 is a hamster foetal lung line which contains no CYP1A1 XEM2 is V79 which has been transfected with rat CYPIA1 gene and expresses CYP1A1 protein - AHH activity (Doehmer et a l , 1990) V791A1-7 is V79 line transfected with rat CYPIA1 m thislaboratory This V791A1-7 expresses functional CYP1A1 protein at a higher activity than XEM2 As can be seen from the results, each line has a similar toxicity profile The IC50s for each line are withm standard deviation of each other and no major difference is apparent The levels of expression of CYP1A1 have been linked with the phenomena of Multiple Drug resistance In some cases increased expression of this enzyme has been associated with increased metabolism of anticancer agents to their less toxic form resulting in decreased toxicity Other have suggested that decreased expression of this enzyme leads to non activation of certain cytotoxic agents therefore these agents are not converted to their cytotoxic form and no tumour kill is recorded
144
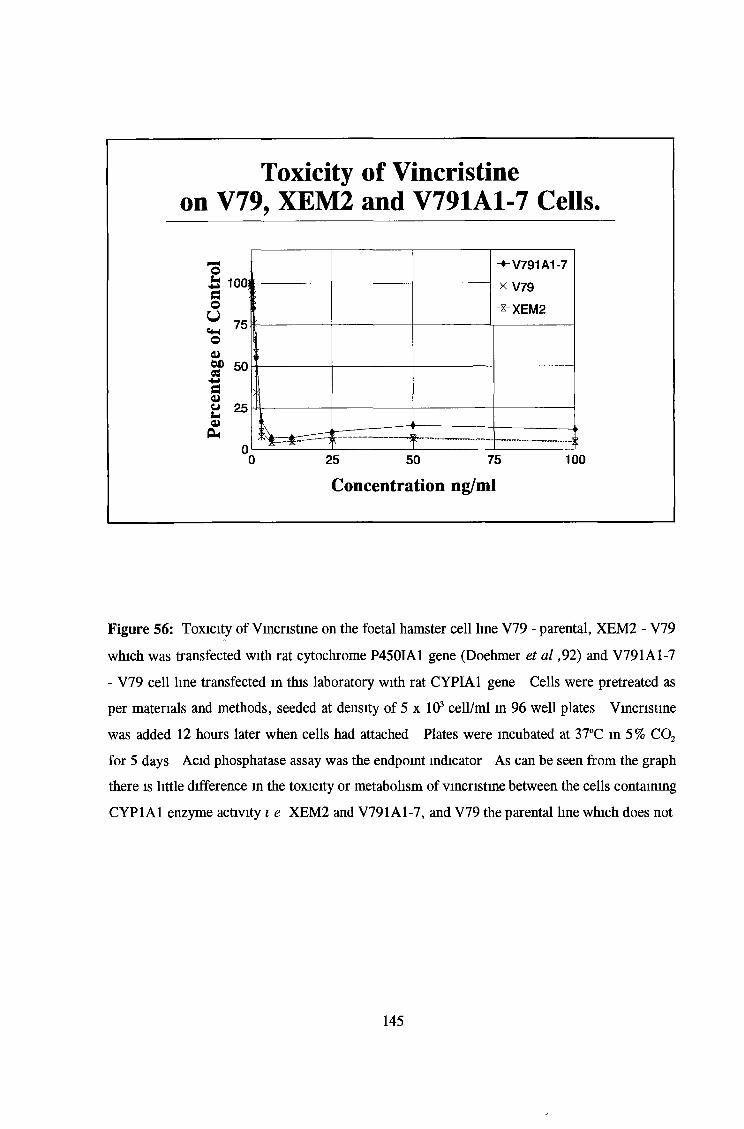
Toxicity of Vincristine
0 2 5 5 0 7 5 1 00
Concentration ng/m l
Figure 56: Toxicity of Vincristine on the foetal hamster cell line V79 - parental, XEM2 - V79
which was transfected with rat cytochrome P450IA1 gene (Doehmer et al ,92) and V791A1-7
- V79 cell line transfected in this laboratory with rat CYPIA1 gene Cells were pretreated as
per materials and methods, seeded at density of 5 x 10³ cell/ml in 96 well plates Vincristine
was added 12 hours later when cells had attached Plates were incubated at 37°C m 5 % C02
for 5 days Acid phosphatase assay was the endpoint indicator As can be seen from the graph
there is little difference in the toxicity or metabobsm of vincristine between the cells containing
CYP1A1 enzyme activity i e XEM2 and V791A1-7, and V79 the parental bne which does not
145
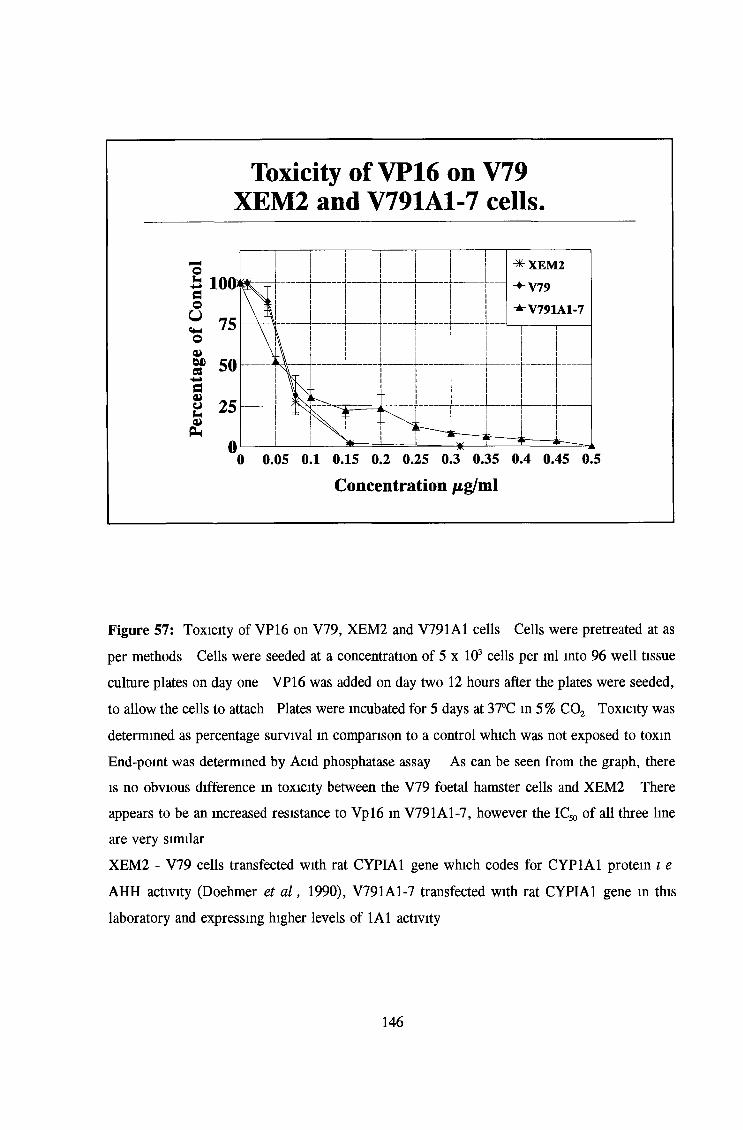
Figure 57: Toxicity of VP16 on V79, XEM2 and V791A1 cells Cells were pretreated at as
per methods Cells were seeded at a concentration of 5 x 10³ cells per ml into 96 well tissue
culture plates on day one VP 16 was added on day two 12 hours after the plates were seeded,
to allow the cells to attach Plates were incubated for 5 days at 37°C in 5 % C02 Toxicity was
determined as percentage survival in comparison to a control which was not exposed to toxin
End-point was determined by Acid phosphatase assay As can be seen from the graph, there
is no obvious difference in toxicity between the V79 foetal hamster cells and XEM2 There
appears to be an increased resistance to Vpl6 in V791A1-7, however the IC50 of all three line
are very similar
XEM2 - V79 cells transfected with rat CYPIA1 gene which codes for CYP1A1 protein i e AHH activity (Doehmer et a l , 1990), V791A1-7 transfected with rat CYPIA1 gene in this
laboratory and expressing higher levels of 1A1 activity
146
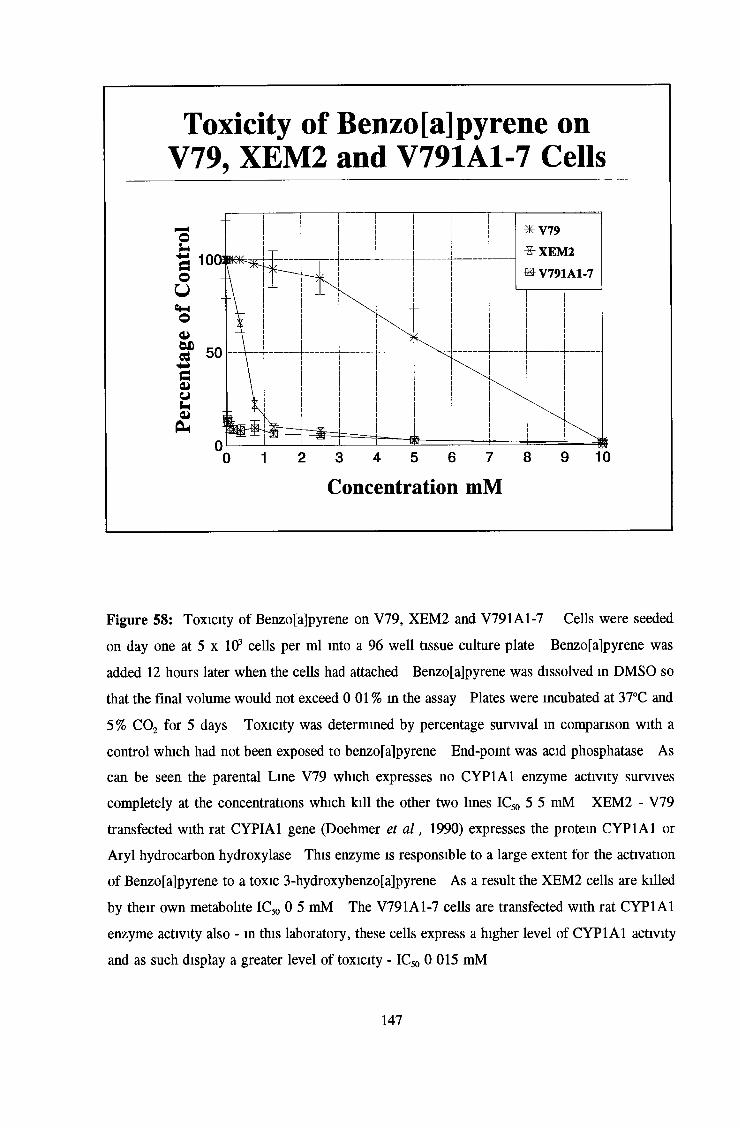
Toxicity of Benzo[a]pyrene on V79, XEM2 and V791A1-7 Cells
3fV79-X-XEM2
»V791A1-7
2 3 4 5 6 7 8
Concentration mM10
Figure 58: Toxicity of Benzo[a]pyrene on V79, XEM2 and V791A1-7 Cells were seeded
on day one at 5 x 10³ cells per ml into a 96 w ell tissue culture plate Benzo[a]pyrene was
added 12 hours later when the cells had attached Benzo[a]pyrene was dissolved in DMSO so
that the final volume would not exceed 0 01 % in the assay Plates were incubated at 37°C and
5% C 0 2 for 5 days Toxicity was determined by percentage survival in comparison with a
control which had not been exposed to benzo[a]pyrene End-point was acid phosphatase As
can be seen the parental Line V79 which expresses no CYP1A1 enzyme activity survives
completely at the concentrations which kill the other two bnes IC50 5 5 mM XEM2 - V79
transfected with rat CYPIA1 gene (Doehmer et a l , 1990) expresses the protein CYP1A1 or
Aryl hydrocarbon hydroxylase This enzyme is responsible to a large extent for the activation
of Benzo[a]pyrene to a toxic 3-hydroxybenzo[a]pyrene As a result the XEM2 cells are killed
by their own metabobte IC50 0 5 mM The V791A1-7 cells are transfected with rat CYP1A1
enzyme activity also - in this laboratory, these cells express a higher level of CYP1A1 activity
and as such display a greater level of toxicity - IC*, 0 015 mM
147
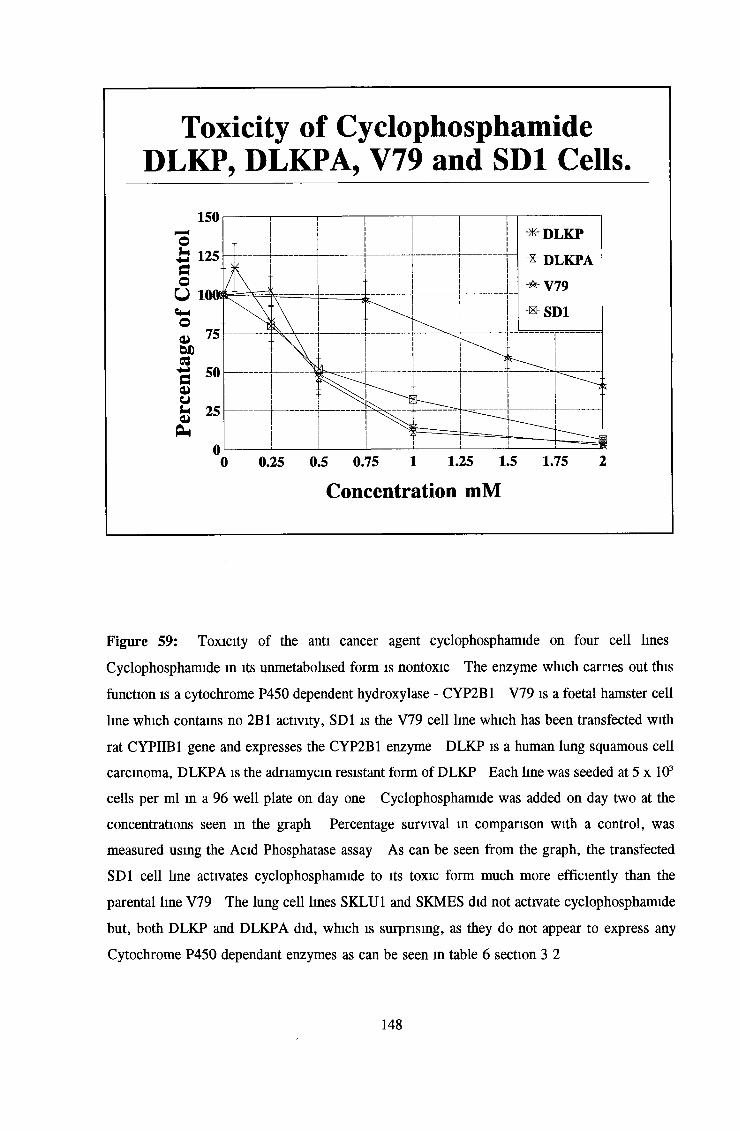
Figure 59: Toxicity o f the anti cancer agent cyclophosphamide on four cell lines
Cyclophosphamide in its unmetabolised form is nontoxic The enzyme which carries out this
function is a cytochrome P450 dependent hydroxylase - CYP2B1 V79 is a foetal hamster cell
line which contains no 2B1 activity, SD1 is the V79 cell line which has been transfected with
rat CYPIIB1 gene and expresses the CYP2B1 enzyme DLKP is a human lung squamous cell
carcinoma, DLKPA is the adriamycin resistant form of DLKP Each line was seeded at 5 x 10³
cells per ml in a 96 w ell plate on day one Cyclophosphamide was added on day two at the
concentrations seen in the graph Percentage survival in comparison with a control, was
measured using the Acid Phosphatase assay As can be seen from the graph, the transfected
SD1 cell line activates cyclophosphamide to its toxic form much more efficiently than the
parental line V79 The lung cell lines SKLU1 and SKMES did not activate cyclophosphamide
but, both DLKP and DLKPA did, which is surprising, as they do not appear to express any
Cytochrome P450 dependant enzymes as can be seen in table 6 section 3 2
148
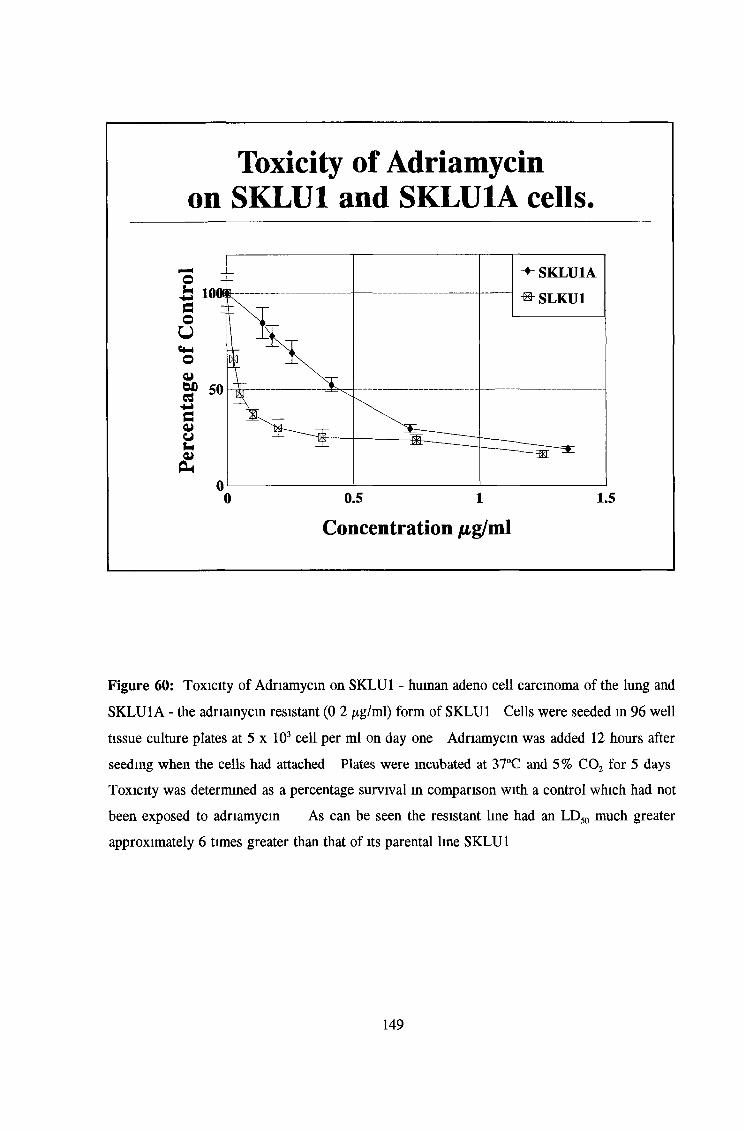
Toxicity of Adriamycin on SKLU1 and SKLU1A cells.
Concentration /ig/ml
Figure 60: Toxicity o f Adriamycm on SKLU1 - human adeno cell carcinoma o f the lung and
SKLU1A - the adriamycm resistant (0 2 /ig/ml) form of SKLU1 Cells were seeded in 96 well
tissue culture plates at 5 x 10³ cell per ml on day one Adriamycm was added 12 hours after
seeding when the cells had attached Plates were incubated at 37°C and 5% C 0 2 for 5 days
Toxicity was determined as a percentage survival in comparison with a control which had not
been exposed to adriamycm As can be seen the resistant line had an LD50 much greater
approximately 6 times greater than that of its parental line SKLU1
149
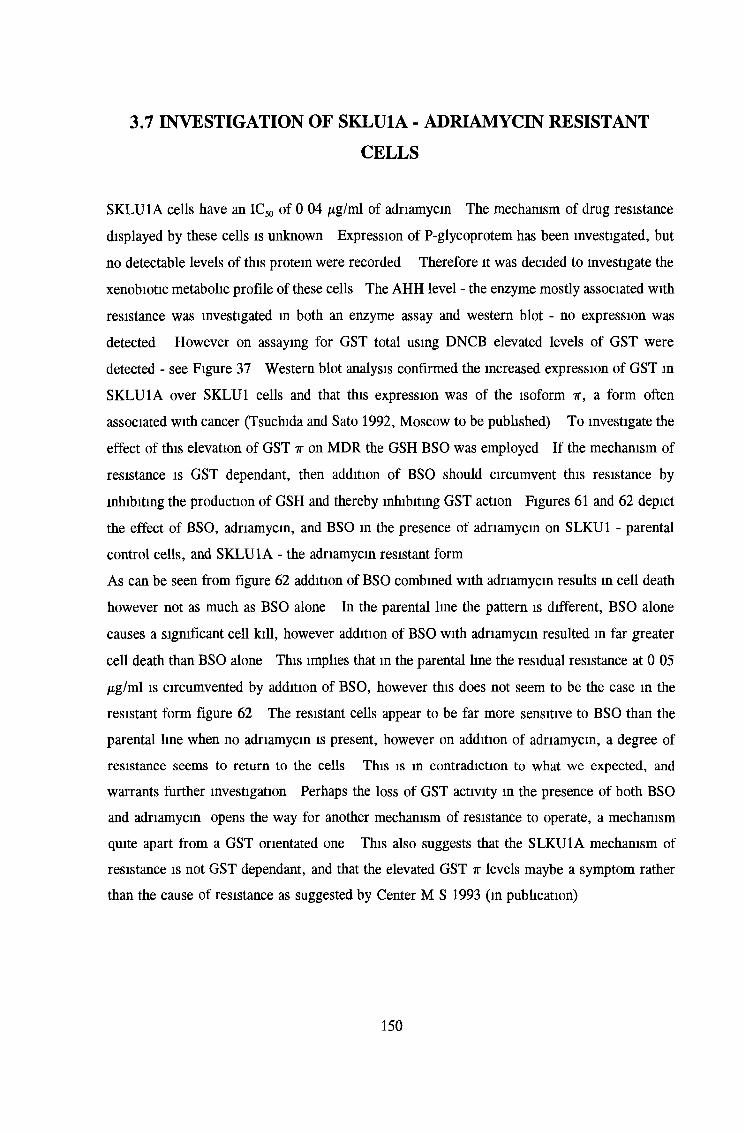
3.7 INVESTIGATION OF SKLU1A - ADRIAMYCIN RESISTANT
CELLS
SKLU1A cells have an IC50 of 0 04 /xg/ml of adnamycin The mechanism of drug resistance
displayed by these cells is unknown Expression of P-glycoprotem has been investigated, but
no detectable levels o f this protein were recorded Therefore it was decided to investigate the
xenobiotic metabolic profile o f these cells The AHH level - the enzyme mostly associated with
resistance was investigated in both an enzyme assay and western blot - no expression was
detected However on assaying for GST total using DNCB elevated levels o f GST were
detected - see Figure 37 Western blot analysis confirmed the increased expression o f GST in
SKLU1A over SKLU1 cells and that this expression was o f the isoform 7r, a form often
associated with cancer (Tsuchida and Sato 1992, Moscow to be published) To investigate the
effect of this elevation of GST ir on MDR the GSH BSO was employed If the mechanism of
resistance is GST dependant, then addition o f BSO should circumvent this resistance by
inhibiting the production o f GSH and thereby inhibiting GST action Figures 61 and 62 depict
the effect of BSO, adriamycin, and BSO in the presence of adriamycin on SLKU1 - parental
control cells, and SKLU1A - the adriamycin resistant form
As can be seen from figure 62 addition of BSO combined with adriamycin results in cell death
however not as much as BSO alone In the parental line the pattern is different, BSO alone
causes a significant cell kill, however addition o f BSO with adriamycin resulted in far greater
cell death than BSO alone This implies that in the parental line the residual resistance at 0 05
¿ig/ml is circumvented by addition of BSO, however this does not seem to be the case in the
resistant form figure 62 The resistant cells appear to be far more sensitive to BSO than the
parental line when no adriamycin is present, however on addition o f adriamycin, a degree of
resistance seems to return to the cells This is in contradiction to what we expected, and
warrants further investigation Perhaps the loss of GST activity in the presence of both BSO
and adriamycin opens the way for another mechanism of resistance to operate, a mechanism
quite apart from a GST orientated one This also suggests that the SLKU1A mechanism of
resistance is not GST dependant, and that the elevated GST ir levels maybe a symptom rather
than the cause of resistance as suggested by Center M S 1993 (in publication)
150
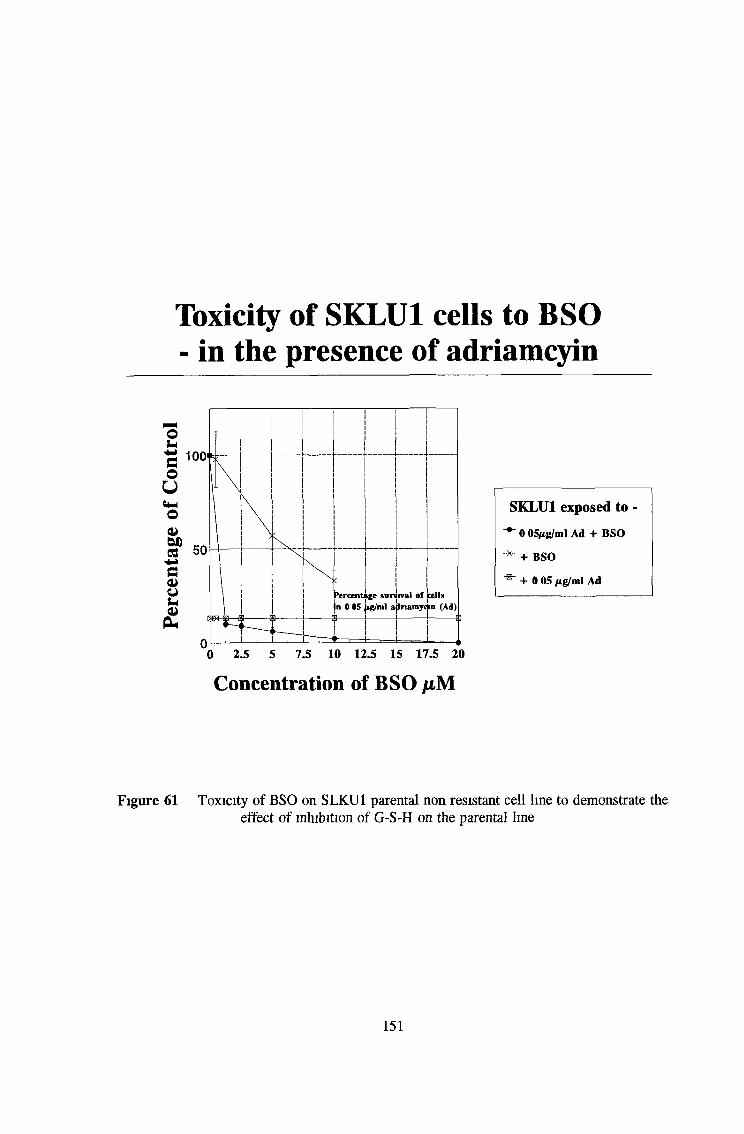
Toxicity of SKLU1 cells to BSO - in the presence of adriamcyin
Concentration of BSO juM
SKLU1 exposed to -
0 05/ig/ml Ad + BSO
"*■ + BSO
_B" + 0 05 /ig/ml Ad
Figure 61 Toxicity of BSO on SLKU1 parental non resistant cell line to demonstrate the effect o f inhibition o f G-S-H on the parental line
151
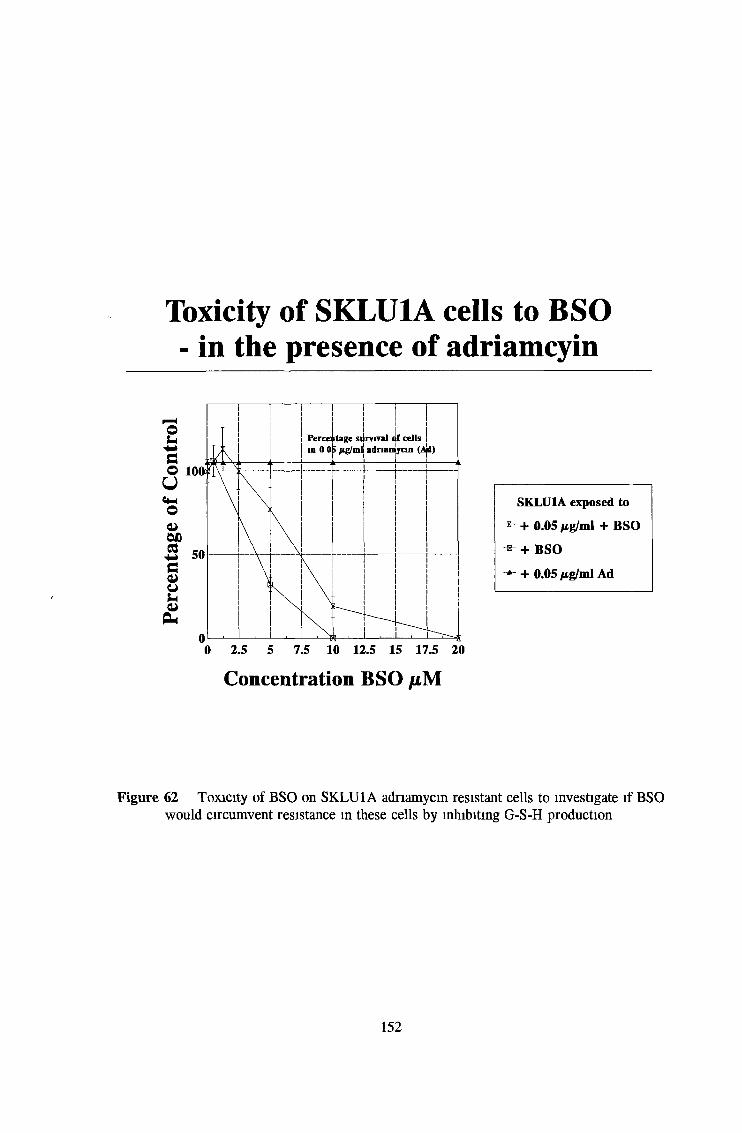
Toxicity of SKLU1A cells to BSO - in the presence of adriamcyin
Concentration BSO juM
SKLU1A exposed to
+ + 0.05 fig/ml + BSO
+ BSO
+ 0.05 Mg/ml Ad
Figure 62 Toxicity of BSO on SKLU1A adriamycin resistant cells to investigate if BSO would circumvent resistance in these cells by inhibiting G-S-H production
152
4.0 DISCUSSION
"The objective o f toxicity testing is to develop an adequate database to make reasonable and
reliable judgments concerning the safe use o f chemicals for societal needs" (Frazier et a l ,
1991) However, due to the sheer volume of new chemicals which require testing, the cost and
ethical implication involved with whole animal studies, other methods for the determination of
toxicity are required
The advancement o f cell, tissue and organ culture in the last few years has provided a feasible
solution to this problem Cell culture is not only a valuable tool in the assessment o f general
toxicity, but also has important implications in experimental and clinical situations
Different forms o f cancer react with varying degrees o f success to chemotherapy and in
different people, similar cancers also exhibit individual degrees of sensitivity Primary culture
provides the possibility for individual toxicological and chemosensitivity prediction and a model
of the disease for study (Salmon et a l , 1978, Yamashita et a l , 1989, Kobayashi et a l , 1989,
Von Hoff, 1990)
In vitro chemosensitivity predictive assay technology i e the use o f primary culture on biopsies
to predict a course of chemotherapy, has been applied, for a number of tumours e g bladder
tumours using trypan blue dye exclusion (Irisawa et a l , 1992), renal, urothelial and testicular
tumours assaying intracellular ATP levels (Yamada et a l , 1992), small cell lung cancer using
the MTT assay (Camphng et a l , 1991), Gastrointestinal tumours using a combination o f a
three-dimensional histoculture and MTT endpoint and cell suspension assay with MTT endpoint
(Furukawa, et a l , 1992, Yamaue et a l , 1992)), Osteosarcoma using ABA - Adriamycin
binding assay (Baldim et a l , 1992)
In the case of lung cancer the development of a reliable in vitro system which w ill further the
investigation o f the disease is required For Small Cell Lung Cancer (SCLC) patients there is
an accepted chemotherapeutic regime due to the in vivo sensitivity of the disease to these agents
However, many patients who initially respond to chemotherapy, develop resistance to this
treatment over time, whilst a percentage of the population are resistant at the onset (Gazdar et
a l , 1990) For Non Small Cell Lung Cancer - adeno-, squamous and large cell undifferentiated
carcinoma o f the lung surgery is the only course normally followed, as these cancers are
relatively chemo-resistant (Vescio et a l , 1990, Gazdar et a l , 1992)
4.1 In Vitro toxicity testing - application to Cancer therapy.
153
As a result o f resistance presenting during treatment, precious time is lost because the patient
is following a course o f therapy to which their cancer is insensitive
To address this problem the use o f in vitro primary cell culture has been implemented This
involves toxicity testing with chemotherapeutic agents, using the patient’s own tumour cells
obtained at biopsy (Salmon et a l , 1978, Kobayashi et a l , 1989) The results obtained should
in principle enable the oncologist to tailor the chemotherapeutic agent to which the individuals
tumour is most sensitive, assuming a direct correlation with the in vivo behaviour (Van H off
et al 1990, Gazdar et a l , 1990, Wilbur et a l , 1992)
Our interest in this area was to improve the longevity o f samples so that as much work as
possible may be carried out on each sample W e concentrated on non-small cell lung carcinoma
for a number o f reasons, 1) the fact that therapy for this particular cancer has remained static
for a number o f years (Wilbur et a l , 1992), 2) the inherent chemo-resistance displayed by
nonsmall cell carcinomas 3) and (probably the most important factor) - the availabihty of
samples Over the three years of this part o f the project, the majority o f the samples received
were small sobd biopsies These samples were either from bronchoscopy or mediastinoscopy,
or pure samples o f tumour taken during lobectomy (Figure 8) The samples were immediately
placed in 4°C DM E/Ham’s F12 (50/50 v/v) medium containing 10% FCS (see section 2)
Samples were then removed to the laboratory where they were enzymatically disaggregated,
seeded into flasks and placed at 37°C
There are many problems associated with the primary culture o f tumour biopsies and the
subsequent toxicity tests These include heterogeneity of the cell population within the tumour
i e a mixed population o f normal, tumour and blood cells etc , clump artifacts which result
from difficulties in dissociating the tissue, density of cells required to assay, length o f incubation
(before results become available) inconclusive end point determination, destruction o f the cell
cell interaction as experienced in the in vivo situation (Hoffman, 1991) W e encountered a
number o f these problems in our endeavours to establish new non small cell lung carcinoma cell
lines, with a major problem being that a great many of the samples received through
bronchoscopy/mediastinoscopy were necrotic Of these samples only 34% (26) attached, the
remaining 66% (49) displayed no attachment and no growth Of the 26 samples that did attach,
1 showed no further signs o f growth, 7 were purely fibroblasts The remaining 69 2%
continued to grow 12 o f these sample became fibroblastic, 6 differentiated and died off in
culture However one sample was passaged to nontransformed cell line status, a poorly
differentiated squamous cell carcinoma o f the lung derived from a mediastinal node biopsies
The cell line was designated DLKP
154
Fibroblast invasion of epithelial colonies is a fundamental problem with primary culture
Generally the tumour samples we obtained were heterogenous i e made up of many cell types
including normal epithelial and fibroblast These fibroblasts are activated in vitro when the
tissue becomes traumatized to protect it (analogous to scar tissue formation in vivo) The
surgical procedure and mechanical disaggregation which the samples were subjected to is likely
to have activated these cells in vitro In the normal course o f events these cells should die off
within a few passages due to the fact that they are normal cells and normal untransformed cells
do not survive in continuous culture beyond about 12 passages at a maximum However,
except in the case o f very large samples, the number of surviving epithebal tumour cell is
severely compromised by these rapidly proliferating normal cells (figure 9 and 10) The result
is over-growth of the culture by the fibroblasts cells which surround any malignant epithelial
colonies that have developed, preventing them form expanding and leading to colony death
It has also been reported that fibroblast produce a soluble anti-tumour substance that is active
against a wide range o f cell lines established from human and mouse solid tumours, thereby
inhibiting epithebal development (Kirk et a l , 1993)
A number o f avenues were explored to prevent fibroblasts killing off potential cell lines 1)
Differential attachment i e fibroblast cells are believed to attach at a faster rate than epithelial
cells (Freshney, 1987) Due to the fact that the samples were small, the large number o f cells
required for the work was not often available, however on those occasions when there were
enough cells, we observed no difference in attachment time 2) Differential trypsmization
using 0 02% EDTA + 0 01% Trypsm at 37°C (figure 11) In theory the fibroblasts detach
faster than the epithelial cells because they have less inter cell association through desmosome
W e found that the fibroblast were selectively removed but they returned, often resulting in
complete over-run o f the culture 3) Treatment of cultures with the antibiotic Geneticin, G-418
sulphate, at a concentration of 100/ig/ml for 2 days was found to select melanocytes from
fibroblast by Halaban and Alfano (1984) While the samples which showed fibroblast
contamination did show a reduced fibroblast population using this procedure, due to the inherent
variability o f each individual sample, many epithelial samples were also terminated
W e had bmited success with fibroblast eradication, but there are several procedures which we
did not have time to explore e g selective coating of plates, anti-fibroblast anti-body treatment
(Paradkeva et a l , 1985) and growth on polypropylene (Wilbur et a l , 1992)
As can be seen from figure 8, 40% (4) of the lobectomy samples showed initial growth, but in
each case this resulted in fibroblast-associated termination o f the culture
155
50%(1) o f the metastatic sarcoid tumours attached and displayed initial growth, but
differentiated within 2 weeks
Neither o f the Oesophageal tumours or the Hodgkins Lymphoma sample received showed
growth of any form i e epithehal or fibroblast
O f the two oat cell carcinomas (small cell carcinoma) one was promising and displayed initial
growth but after 3 weeks it was apparent that the cells were not dividing and had differentiated,
(there was no attachment as these cells grow in suspension) The environment into which the
cells were introduced - a tissue culture treated 25 cm2 flask, favours attachment dependant cell
Squamous cell carcinoma are attachment-dependent but so too are normal cells and normal
fibroblast Tumour cells w ill support their own growth in suspension and in agar, while normal
cells w ill not The DST - drug sensitivity test, capillary cloning system, employed by Van
Hoff, requires less cells than a 96 well plate assay and was extendable to multiple tumour types
This procedure involves the growth of the cells in a suspension culture in a capillary tube, the
end point o f the assay is determined by the number o f colonies which result (Van H off et a l ,
1990) As this system is a toxicity assay further growth of the cells is not required However,
we want to keep cultures growing for longer periods of time, perhaps this system would serve
as an initial starting culture Primary single cell sample cultures could in principle be
established without the threat of fibroblast and normal cell contamination due to the suspension
nature of the culture The sample could then moved on to larger flasks for continued culture
Wilbur et al employed polypropylene culture tubes which inhibits the attachment and growth
of normal cells (Wilbur et a l , 1992) Gazdar and Campbng established cultures directly into
flasks and plates but restricted their work to suspension culture o f small cell lung carcinoma,
for which a serum free medium has been developed (Gazdar et a l , 1990, Campling et a l ,
1991)
Disaggregation o f the sample using a less aggressive approach may reduce the activation o f
fibroblast and increase the viability of the epithehal tumour cells At present we use a
combination of collagenase IV and diaphase, other enzymes bke hyuromdase or other forms of
collagenase maybe more effective at dissociating the tissue, and less activating of fibroblasts
Reducing the amount o f mechanical disaggregation using scalpels and the use o f magnetic
stirrers to break up the sample There are many angles from which to approach the many
problems attached to this area The possible clinical ramification o f this work makes it important
that each alternate possibility is explored
156
4.1.1 CHARACTERISATION OF DLKP
As can be seen from figure 8, of the 93 human biopsies samples obtained, one non-small cell
poorly differentiated squamous cell carcinoma cell line was developed This sample was from
a secondary metastasis from the lung, obtained from a mediastinal investigation from a male
patient aged 54, with a history o f smoking, who had been diagnosed with poorly differentiated
squamous cell carcinoma On transfere to culture, immediate growth was observed and there
was httle to no fibroblast involvement The sample has been in continuous culture in the
laboratory and has reached passages upward of 60
To characterise this cell line it was decided to investigate a number o f features which are
characteristic o f squamous cell carcinomas o f the lung
4 .1 .1 .1 CLONING IN AGAR
Our first objective was to ensure that the cell line showed malignant behaviour in vitro Normal
cells cannot grow in agar whereas tumour cells can (Bergh et a l , 1981, Luster et a l , 1985)
DLKP cells were seeded at varying density and cultured for 10 days, after which a colony
forming efficiency o f 7 4% was observed at 10s cell per ml (Figure 29)
4 .1 .1 .2 HISTOLOGY AND CYTOGENETICS:
Histological analysis also identified multiple nucleoli, tri- and multipolar mitosis (figure 28),
features normally associated with malignancy (Gilvarry et al, 1991) Cytological analysis also
revealed eleven structurally abnormal chromosomes or marker chromosomes, three o f which
d e l( l) (q ll) , del(2)(p ll 1) and del(2)(q ll 1) are m common with another non small cell
squamous carcinoma line, DLRP, also developed in this laboratory Abnormalities of
chromosome 1 are often associated with mahgnancy Over-representation o f chromosome 7 was
also observed along with duplicate copies o f markers 1,4 and 5 DLKP exhibits two
populations with modal numbers of 56 and 115 (Law et a l , 1992)
- The sum of these results confirms the malignant nature o f DLKP
Once this was established, it was necessary to prove that this line was 1) of human origin, and
2) derived form the biopsy we had received and not a contaminant derived from another cell
line m the laboratory
157
4.1.1.3 ISOENZYME ANALYSIS:
To verify the human origin o f the sample isoenzyme analysis was carried out (Figure 26) This
consisted of comparing six enzymes which displayed varying gel electrophoresis patterns depend
on species The enzymes chosen were Lactate Dehydrogenase (LDH), Glucose-6-phosphate
Dehydrogenase (G-6-D), Malate Dehydrogenase (MD), Mannose Phosphate Isomerase (MPI),
Peptidase B (PB) and Nucleoside Phosphorylase (NP) LDH is a tetramer made up o f 2
subunits A and B These subunits can be arranged as LD1-5, AAA A, which migrates to the
cathode, AAAB, AABB, ABBB, BBBB which migrate to the anode (another form CCCC is
seen only in testis and sperm) LDH isoenzymes are present in all tissues but the ratio o f the
different form varies In some instance not all isoforms can be detected As can be seen from
the figure 26 the enzyme LDH in the rat demonstrated by the cell line NRK (normal rat
kidney), only 3 isoenzymes are detectable, whereas the other lines tested all 5 isoenzymes are
detectable MD is composed of two isoenzymes, one form migrates to the anode which is the
cytosolic form, the other mitochondrial form migrates to the cathode Migrational distance is
the deciding factor with this enzyme Once again NRK line shows different migration distances
from the human lines tested From these results we can conclude that our line is not o f rat
origin G-6-P is made up of 2 identical subunits and migrates towards the anode In humans
there are two forms A & B Type B is mainly expressed in the Caucasian population and
migrates slower than type A which is expressed in all other populations This particular
isoenzyme is useful in detecting HeLa contamination in cell lines As can be seen there is no
HeLa contamination due to the slow migration o f this enzyme in the DLKP sample MPI, PEP-
B and NP all exhibit species-dependent migrational profiles In comparison with other cell lines
assayed for these enzymes as seen in Figure 26, SKLU-1 human adenocarcinoma,CALU-3
human adenocarcinoma,RPMI human nasal carcinoma,HTB-120 human small cell
carcinoma,and NRK rat kidney,it can be concluded that DLKP is o f human origin
4.1.1.4 DNA FINGERPRINTING:
To confirm that the exact origin of DLKP was the surgical sample obtained, D N A from DLKP
and the original tumour which had been frozen in liquid nitrogen, were subjected to DN A
fingerprinting by Cellmark Diagnostics (Figure 27a + b ), using cocktails o f single locus probes
Due to poor condition o f the samples when they arrived for analysis the bands in the profile
from the tumour sample are not very clear and there is an amount o f background due to
extensive D N A degradation There is one high molecular weight band in the cell line which
is not present m the tumour
158
This may be an artifact of degradation as high molecular weight alleles are degraded
preferentially in D N A samples However, 9 bands m total can be matched between the tumour
and in the cell line Based on these results Cellmark determined that tumour sample and cell
lines were the same
- To this point we have concluded that the cell line DLKP is a malignant bne, o f human origin,
and derived form the surgical samples we received To determine the cell type we used
immunofluorescent labelbng
4.1.1.5 IMMUNOFLUORESCENCE ANALYSIS:
Cytokeratin is a component o f the intermediate filaments m epithelial cells Keratins are
particularly prominent in cells which are subjected to mechanical stress e g epithelial cells
There are 19 distinct forms o f keratin in human epithehal cells and different cell types display
individual patterns o f keratins This provides a distinctive "fingerprint" which can then be used
to trace cells, especially metastatic tumour cells to their tissue o f origin
In characterization o f DLKP, this technique was employed DLKP was exposed to anti-
cytokeratm No 18 and compared with SCC-9 (derrived form a squamous carcinoma o f the
tongue) and MRC-5 a human foetal lung cell line As seen from the results Figure 23 SCC-9
is positive for cytokeratin, MRC-5 is negative (figure 24) DLKP stained negatively (figure 25)
for this form o f cytokeratin This experiment was repeated using anti-cytokeratin Pan (a
combination of all the cytokeratins) as the primary antibody, the result obtained was the same,
negative for DLKP, which is surprising The premises for using these antibodies is that a
given epithelial cell type generally retains its specific cytokeratin polypeptide patterns in
neoplasms derived from those cells, irrespective to the degree o f differentiation and distance
metastasized However, it has been reported that cytokeratins are not present in all epithelial
cell types or m all poorly differentiated carcinomas arising from epithelial cells that contain
these filaments (Erlandson, 1984, Wheater et a l , 1985) Erlandson also reported that ther
cytokeratin patterns may vary with different stages of differentiation o f a given cell type and
that some cells may produce other intermediary filament, vimentin, instead o f cytokeratin
Another study on intermediary filaments of lung tumour cell lines over a four year period,
reported that 1) classic small cell lung cancer cell lines normally expressed cytokeratins 8, 18
and occasionally 19, however, variant-type SCLC, however, expressed no cytokeratins, but did
express neurofilaments In non small cell lung cancer cell bnes, expression o f cytokeratins 7,
8, 18 was detected and in some cases anti-cytokeratins 4, 10 and 13 were also noted(Broers,
et a l , 1988) They also noted that in the four years some o f the variant SCLC reverted to
159
classic demonstrating a corresponding re-expression o f cytokeratins Boyer et a l , (1990)
reported that remodelling of tumour cells cytoskeleton may be involved in the detachment of
malignant cells from the primary tumour allowing for invasion of neighbouring tissues They
found that exposing a rat bladder carcinoma cell line to a soluble inducer (acidic FGF) or to
collagen resulted in transformation of the cell into a fibroblast like cell with the ability to
penetrate into the collagen gel
These reports indicate that not all tumour cells behave in the same manner with respect to
cytokeratm expression and that over time in culture and during progression o f the disease
especially metastsis rearrangement of cell components may occur
DLKP was originally diagnosed as a poorly differentiated squamous cell carcinoma o f the lung
which has metastasized to the lymph nodes It is possible that in the progression o f disease the
tumours cell’s original intermediate filament protein expression may have been rearranged, or
it is also possible that similar to the varient SCLC lines mentioned by Broers et a l , (1988),
DLKP may simply not express cytokeratm However, before coming to any final conclusion
it would be necessary to test DLKP with the complete range o f specific monoclonal antibodies
specific for the different forms o f cytokeratm
EP-16 antibody is specific for antigen on the surface epithelial cells (Hamburger et a l , 1985)
Once again SCC-9 stained positive (figure 20) and MRC-5 negative (figure 22) In this instance
DLKP stained positive (figure 21), but weakly positive which reinforces the result obtained from
the anti-cytokeratin results
704A1 and 703D4 are IgG monoclonal antibodies developed by Mulshine et a l , (1983), which
are specific for non small cell lung carcinoma
Comparison o f DLKP with the established Squamous cell carcinoma o f the lung -SKMES-1
which is positive (Figure 14), the Adenocarcinoma o f the lung -SKLU1 also positive (Figure
17) and HTB-120 the small cell carcinoma of the lung - the negative control (figure 19), DLKP
stains positively for both antibodies 704A1 and 703D4 (Figures 15 & 18)
Together all these results confirm the poorly differentiated non small cell carcinoma o f the lung
histology, as per the pathology report
4.1.1.5 ENZYMATIC ANALYSIS OF DLKP.
Analysis o f xenobiotic metabolism in DLKP revealed no detectable expression o f P450-
dependent Ethoxycoumarin O-deethylase (table 6),UDP-Gluconyltransferase (table 6 ),or the
Cytochrome P450 1A1 enzyme (table 6), on induction with known inducers or in the controls
160
by the fluorescence assay techniques used
Glutathione-S-Transferase class ir is the only isoform o f GST expressed using a DNCB
conjugation assay, confirmed by western blot analysis (Figure 52)
There is no detectable expression of the ju. or a isoforms o f GST The absence o f the isoform
H is o f particular interest in that the loss of GST-/x expression has been implicated a marker for
greater susceptibihty to lung cancer among smokers (Tsuchida and Sato, 1992, Campell et a l ,
1990, Peters et a l , 1990, Seidegard et a l , 1990)
In conclusion DLKP is a human poorly differentiated squamous cell carcinoma o f the lung,
which resulted from a metastasis to the lymph nodes This line has been in culture at present
to passage 95 and has a doubling time of 17 hours It expresses no detectable cytochrome P450
dependant xenobiotic metabolising enzymes The phase II GST isoenzyme 7r is expressed, but
GST ¡1 linked with improved resistance to lung cancer, is not expressed
161
4.2 EXPRESSION OF ENZYMES OF XENOBIOTIC METABOLISM IN CELL LINES
4.2.1The aim o f this section of the project was to investigate the drug metabolising profile o f a panel
o f lung cell lines 1) DLKP the novel human squamous lung cell line which was established and
is characterised as part o f this thesis, as in the previous section, 2)SKMES1 a human squamous
cell carcinoma lung cell line obtained from the ATCC and 3) SKLU1 an adenocarcinoma o f the
lung also from the ATCC As has been mentioned in the introduction the xenobiotic status of
cells in culture is very different to that in vivo Cytochrome P450 levels and their response to
inducers, decbne within the first 24-48 hours of culture for unknown reasons (Grant et a l ,
1985,86,87, Bolluinne et a l , 1987, Guillouzo et a l , 1985) This decbne in expression results
in a severely compromised xenobiotic metabolizing profile for these cells and a frustrating
problem for those wishing to employ them in in vitro toxicity testing
In principle cell culture provides an ideal substitute for whole animal experimentation It
eradicates the problem of mterspecies variation of xenobiotic metabolism and allows for
parameters to be varied with a greater degree o f accuracy than whole animal tests However,
as has been discussed, cultured cells do not behave exactly as their in vivo counterparts
Although in culture the xenobiotic metabolizing profile is severely altered, some cell lines do
retain the abibty to express particular enzymes e g H411E, the rat hepatoma cell line which
on exposure to the polycyclic aromatic hydrocarbon (PAH) - benzanthracene, expresses
CYP1A1 (figure 30) (Wiebel et a l , 1984, Zacharewshi et al 1989) Most human cells in
continuous culture retain some degree o f P450 mducibility, generally the PAH-type induction
e g the human liver line HepG2 (figure 31) and the human breast carcinoma cell line MCF-7
(Pasco, 1988, Tukey, 1988)
It is this residual expression that interested us and it was decided to investigate other cell bnes
for their abibty to express xenobiotic metabolising enzymes The reasoning behind this was that
if the metabolic pathway(s) available in a cell line were known, then a compound could be
exposed to this/these enzymes and the resulting metabolites either isolated or allowed to
exercise their toxicity on the cells which had metabobsed that compound Therefore if a single
pathway was expressed in a given cell bne, such a cell line would be useful in determining if
a given compound was A) metabolised by that particular enzyme or B) a candidate for activation
by that enzyme to a more toxic form
162
The analysis encompassed both phase one and phase two enzymes and especially those enzymes
linked with activation and carcinogenesis, e g AHH - phase one P450 enzyme associated with
activation o f polycyclic hydrocarbons in lung cancer The lung as a whole in vivo expresses
considerable levels o f xenobiotic metabolising enzymes This expression is essential for the
survival o f the tissue due to its direct exposure to the environment The xenobiotic metabolising
enzymes reported so far in the lung are, cytochrome P450s including AHH, NADPH
cytochrome P450 reductase, epoxide hydrolase, glutathione S-transferase, UDP-
gluconyltransferase and sulfotransferase Each individual lung cell type contributes a different
degree or assortment o f activities e g bronchial epithelial cells, Clara and ciliated bronchiolar
epithelial cells and type II pneumocytes etc , (Baron 1990) Clara cells have been reported on
immunocytochemical analysis to be positive for two cytochrome famihes IIB, IVB and NADPH
cytochrome P450 reductase However they were negative for CYP1A1 (Chichester et a l ,
1991) CYPIA activity was localised m the peripheral airways m alveolar epithelium o f types
I and II and in ciliated columnar and cuboidal bronchiolar epithelium This activity is of
particular importance given its imphcation in the activation of the polycyclic hydrocarbons
present in cigarette smoke and smog - benzo[a]pyrene, to its active carcinogenic form (Anttila
et a l , 1991a, Koun et a l , 1982, McLemore et a l , 1989, 1990, Pelkonen et a l , 1986,
Nakachi, et a l , 1991)
Elevated expression o f GST it has been reported in several forms of cancer (compared with the
corresponding normal tissue which also expressed tt) GST ir has also been impbcated in
multiple drug resistance (Tsuchida and Sato, 1992, Hayes et a l , 1991, Tidefelt et a l , 1992,
M oscow et a l , 1989) In the case o f lung tumours, GST tt is expressed in both
adenocarcinomas and squamous cell carcinomas, but not in small cell lung cancers (Tsuchida
and Sato, 1992)
In order to investigate xenobiotic metabolism we initially chose to use a spectrophotometric
method for detection the cytochrome P450 dependent activity and UDP-gluconyltransferase
activity, as these were simple quick assays For the P450 dependent activity the assay chosen
was the 7V-Demethylation o f antipyrene (Nash et a l , 1953) based on the formation of
formaldehyde, UDP-gluconyltransferase activity was detected using 2-ammophenol (Bratton and
Marshall 1939) Both o f these methods were set up using rat liver microsomes However,
when the cell samples were subjected to analysis by these methods, no activity was detectable,
even in the positive controls At this point it was decided that perhaps these methods were not
sensitive enough for the purposes which we intended Therefore three alternative fluorometric
assays were investigated.
163
The P450 dependent 3-hydroxylation of benzo[a]pyrene (AHH) (Nebert and Gelboin, 1968),
the P450 O-de-ethylation o f 7-ethoxycoumarin (ECOD) and the phase II glucuromdation o f 4-
methylumbelliferone (Liliemblum et a l , 1982) All assays detected product formation in the
nmolar to pmolar range which was essential for analysing cultured cells due to the nominal
levels present
As can be seen from the results in figures 30 to 33 the liver lines H411E and HepG2, on
induction, exhibited elevated levels o f AHH and ECOD which was expected as had previously
been described above These result were then confirmed by western analysis (Figures 45 &
47) The phase II enzyme UDP-gluconyltransferase was also detectable in H41 IE but the level
was extremely low and unaffected by the presence of inducers as shown in figures 34
Tables 5 to 8 show the results obtained for the other lines tested, none of the other lung lines
or the rat hepatoma HTC demonstrated detectable levels of these three enzymes This
deficiency of AHH activity in these lines even under induction was confirmed by western
analysis as shown in figures 45-47
This lack of expression, although not unexpected, was interesting due to the fact that lung cells
do express xenobiotic metabolising enzymes extensively in vivo However judging by the
reactions o f many other cell types on transfer into culture as already mentioned, the profile of
these lung lines is not exceptional
To overcome the lack o f expression o f xenobiotic metabolising enzymes by the lung cell lines
we had chosen, it was decided to investigate the possibility o f transfecting a xenobiotic
metabolising enzyme in an expression vector into DLKP This procedure has been explored
using a number o f cell line (Crespi et a l , 1991, Aoyama et a l , 1990, Battula et a l , 1987,
Ellard et a l , 1991, Puga et a l , 1990, Montisano et a l , 1985) Initially cDNAs were hosted
in yeast and COS cells, but expression was found to be variable and unstable (Odea et a l ,
1985) Vaccinia Virus infection was also examined and successfully expressed a number of
P450s Using this procedure Aoyama expressed five of twelve forms of human hepatic
cytochrome P450, IA2, IIA3, IIB7, IIIA3 and IIIA4 in HepG2 cells Each transfectant was
capable o f activating aflatoxin Bi to its mutagenic metabolite (Aoyama et a l , 1990) The
mouse forms IA1 and IA2 were also actively expressed in HeLa cells (Battula et a l , 1987)
However these transfectants by their nature are only short lived and useful only on an
immediate basis
164
Stable transfection of a xenobiotic metabolising enzyme into a human lung line had not been
attempted The vector which we decided to use was the rat cytochrome P450IA1 (courtesy of
J Doehmer) which had been cloned into the PBR322 plasmid by Dr J Doehmer
This plasmid had been successfully expressed in Chinese hamster cell V-79 (Dogra et a l ,
1990) As the plasmid contained no selective gene it was therefore co-transfected with the
pSV2Neo plasmid (which codes for resistance to the antibiotic G418 (geneticin), and the
PCH110 a plasmid which contains the /3-galactosidase gene, which allows visual conformation
o f transfection) at a ratio o f 20 CYPIA1 1 pSV2Neo PCH110 It was decided to transfect
this plasmid into DLKP, and to include V79 in the procedure as a positive control - as it had
been successfully transfected with this plasmid before As can be seen from Table 10, the use
o f calcium phosphate technique to transfect the V79 and DLKP cells produced poor efficiency
of transfection Two positive V79 control transfectants were isolated, out o f 63 geneticin
resistant transfectants tested, however, only one was stable in culture and resulted in the line
V791A1-7 O f the 47 DLKP1A1 - geneticin resistant clones which were isolated, none
expressed the AHH protein as detectable by immunofluorescence and AHH activity After a
number o f attempts to improve the efficiency of the CaP02 technique it was decided to apply
another technique - electroporation The efficiency o f transfection increased dramatically for
the PCH110 and geneticin when electroporated at 25 ¡jlF , as can be seen from Table 10
Efficiency o f transfection increased from 0 0016% using calcium phosphate precipitation to
0 31% efficiency with electroporation However, cloning of the transfectants and analysis of
their CYP1A1 expression once again yielded no positive clones
DLKP transfection was repeated eight times and 47 geneticin resistant clones were isolated and
tested for AHH expression At this stage we began to wonder that perhaps there was another
element (an endogenous element) preventing expression
Regulation of the CYP1A gene family has been studied extensively in cultured cells The 1A1
gene has been focused on due to its unique method of regulation, induction and expression in
cell culture
Transcription o f the 1A1 gene is governed by interaction o f cis-acting factor(s) (i e DNA
elements within the locus which effect the expression of the gene) with D N A sequence
elements lying within 1 kilobase upstream of the RNA polymerase II start site (see figure 63)
These elements can only increase the transcription o f the 1A1 gene in the presence o f inducer
e g PAH
165

The xenobiotic regulatory element (XRE) (also known as the DRE (dioxin responsive element)
and AhRE (aromatic hydrocarbon responsive element) in the mouse), is believed to be the
most effective The XRE has the following sequence
5 ’ CGTGCTGTCACGCTA3 ’
This sequence bears some similarity to the GRE (glucocorticoid regulatory element) but the
XREs are not responsive to glucocorticoid hormones (Fujii-Kuriyama, et a l , 1992)
Homan
-3 -2 -1
Rat
XRE BTE TATA SINE-R [ ■ 1 '"'l ALu Seq
Figure 63 Regulatory D N A elements m the upstream region o f human and rat CYP1A1 gene Numbers represent
sizes in kb (Kubota et a l , 1991)
There are 5 copies of this XRE element at -537, -1010, -1089, -1233, and -3586 bp positions
The effect o f these elements is additive and independent of their orientation around the gene
(Kubota et a l , 1991) These XRE elements are also known to regulate a number o f other
inducible genes as well as the 1A1, e g the phase II enzymes UDP-Gluconyltransferase and
Glutathione-S-transferase (Negishi and Nebert, 1979)
A second regulatory element believed to be involved m constitutive expression o f the CYP1A1
gene is the BTE (basal transcriptional element) This element, is situated close to the TATA
sequence (conserved AT rich septamer found approximately 25 bp before the startpoint o f each
eucaryotic RNA plolymerase II transcription unit Probably involved in positioning RNA
ploymerase II enzyme for correct initiation of genes)
166
The BTE is believed to play a common regulatory role in many genes, predominantly P450
genes, all of which demonstrate different modes of regulation, see figure 63 (Yanagida et a l ,
1990) Regulatory elements similar to XRE and BTE, have been found in the mouse, rat and
humans In humans the two intermediately repetitive sequences (Alu and SINE-R) are located
at -3068, -2116, and -1876 bp for the Alu sequence and from -3126 bp for the SINE-R
element, figure 63 (Kubota, et a l , 1991)
XRE induced expression of the 1A1 genes requires the presence o f the BTE sequence, i e both
sequences must be present This implies a possible co-operation between the trans-acting factors
of XRE and BTE
Trans-acting protein factor(s) bind to the DN A at the XRE and BTE sites i e the cis-acting
elements, in the nucleus (Durrin & Whitlock 1987, Fukjisawa-Sehara et a l , 1987, Denison et
al 1988, Fukjisawa-Sehara et a l , 1988) The XRE binding proteins were isolated from nuclear
extracts from 3MC-treated Hepa-1 cells
In untreated cells these proteins were found in the cytoplasm and they demonstrated no XRE
binding abibty However, on addition o f 3MC, binding was seen Specific binding o f an
125I-labelled ligand to a factor that interacts with the XRE suggests that this factor is the
TCDD(Ah) receptor complex, leading to the possibihty that the XRE binding protein/factor and
the hitherto uncharacterised Ah receptor are the same factor The Ah (TCDD) receptor is a
soluble intracellular protein which regulates the induction of CYP1A1 by recognizing and
binding Aromatic hydrocarbon type mducers which results in the transformation o f the mducer-
receptor complex This complex is then moved to the nucleus in a heat sensitive step, binds
to specific DN A sites and stimulates mRNA production (Okey, 1990)
Ah receptor is very similar to receptors for steroid hormones and may be a member o f this
family o f receptors However, evolutionary data suggests that this receptor is much older than
the receptors for steroid hormones (Okey, 1990) This receptor has also been impbcated in the
induction of other proteins apart from those involved in drug metabolism It has been suggested
that these proteins may be fundamental in the regulation of cell proliferation and differentiation
(Poland and Knutson, 1982 Paulson, et a l , 1990) The Ah locus in mouse is believed to be
made up of at least three genes and lies on chromosome 12 (Okey, 1990)
The unbound cytosolic XRE binding factor is associated with a HSP90 (heat shock protein)
On induction, the inducer binds to the XRE binding factor/HSP90 complex causing a
conformational change and resulting in the dissociation o f the HSP90 (Perdew, 1988a).
167
The newly liganded factor is then translocated to the nucleus Exactly how this translocation
is achieved is unknown Ah receptor-positive and translocator-negative (cells that could form>
receptor-ligand complexes but could not translocate the complex to the nucleus) cells were
investigated in fusion-complementation studies with receptor negative cells Fully functional
i e inducible cells resulted, indicating the involvement of a trans-acting translocator factor -
(the Arnt protein, Fujn-Kuriyama et a l , 1992) - the Ah receptor nuclear translocator protein
The Arnt protein is 789 ammo acids in length, has the potential to form helix-loop-helix
domains and is comparable with a family of homo and heterodimeric transcription factors It
is proposed that this Arnt protein dimerizes with the XRE/liganded factor and translocates the
entire complex to the nucleus
The receptor-complex binds within the major groove o f the DN A helix causing a structural
change in chromatin This conformation change results in increased access to the chromatin and
increased transcription (Durrin and Whitlock, 1989, Whitlock et a l , 1989, Hankinson et a l ,
1991, Reyes et a l , 1992) Cytosine methylation at this recognition site diminishes the
response to dioxin by impeding the Ah receptor-enhanced interaction thereby eliminating
expression o f the gene (Shen et a l , 1989) Methylation of D N A ’s cytosine resulting in 5-
methylcytosine has been associated with the silencing of genes in cell culture (Holliday, 1989)
This activation takes place without the synthesis of new protein and is sensitive to in vitro
methylation o f DN A (Shen and Whitlock, 1989, Fujn-Kuriyama et a l , 1992) Isolation of the
Ah receptor is an on-going project Partial purification o f the receptor has been achieved,
which should lead to a better understanding of the entire mechanism (Bradfield, et a l , 1990,
Poland et a l , 1987, Perdew & Poland, 1988b)
Unlike the XRE binding protein which is found in the cytosol as well as the nucleus, the BTE
binding factor is found only m the cell nucleus To date two different cDNAs for rat BTE
binding proteins have been cloned One, designated Spl due to its 98% homology with the
human S p l, is a 788 ammo acid transcription factor The other, is a novel 224 ammo acid
protein called BTEB or BTE-binding protein Both these proteins possess the ’basal’
transcription factor - zinc finger domain, which are arranged in a tri-repeating pattern It is
these domains which are believed to be responsible for recognizing specific GC rich binding
sites for these proteins in the BTE Both the BTE-binding protein and Spl demonstrate
independent transcriptional activity with respect to CAT activity from pSV2CAT, when the
promoter contains tamdem repeats of GC box sequence Expression of P450IA1 in a vector
containing a single GC box and the BTE, is activated by the Spl protein alone
168
The introduction o f the BTE-binding protein gene into this vector along with CYP1A1 and the
single GC box, seems to partially inhibit the Spl induction, perhaps by competition for the
BTE BTE-binding protein requires the presence o f tandem GC boxes before it can produce a
response (Fujn-Kunyama et a l , 1992)
In the absence of a purified Ah receptor and knowledge o f exact sequence of induction, other
possible regulatory mechanisms have been studied The presence o f a labile inhibitor protein
which represses transcription of CYP1A1 in vitro, was proposed when the phenomenon of
"superinduction" was observed in cells which were induced with PAH combined with the
protein synthesis inhibitor cycloheximide (Bhat et a l , 1987, Foldes and Bresmck, 1989, Israel
et a l , 1985) The mechanism of this "superinduction" is believed to include the alteration in
the protein-protein interactions involved in the activation o f the CYP1A1 transcription by the
ligated Ah receptor (Lusska et a l , 1992) and post-transcriptional mRNA stabilization (Nemoto
and Sakurai, 1991)
As can be seen in the above paragraphs, the sequence of events which lead to CYPIA1
regulation and induction are complex and to date not all the component or stages have been
realised This ever increasing hst o f documented factors, both cis- and trans- acting, cytosolic
and nuclear, which have been reported to act as regulators o f CYP1A1 expression, any one of
these factors or a concert o f them may be the reason for the decline of this particular enzyme
m culture
Labile protein(s) in the nucleus which bind to the Ah liganded receptor site preventing the action
of the XRE regulatory system and the initiation of transcription were reported by Foldes et a l ,
(1988), and Lusska et a l , (1991) Similarly a repressor protein which interferes with liganded
Ah-receptor binding to the XRE by binding to the Ah-receptor, was also noted in dominant
Hepa-1 mutants by Watson et a l , (1992)
Ivy et al 1988, also reported in the breast cancer cell line MCF-7 induction o f AHH activity
was observed when the potent inducer TCDD was used, however, in a variant o f this line
(which had been selected for resistance to adriamycin), this induction of AHH activity using the
same inducer (TCDD) was no longer observed To uncover the possible mechanism of this
inhibition they followed the expression o f the reporter gene CAT linked to the CYP1A1 control
region o f the plasmid which was transfected into the wild type MCF-7 and the resistant MCF-7
cells They found that CAT activity was detectable only in the wild type cells, suggesting that
the defect in the resistant cell was not due to a structural P4501A1 gene mutation, but involved
a product o f the resistant bne which was regulating the AHH-inducible expression
169
Puga et a l , (1989) observed that on transfection of the Cyplal murine cDNA into the mouse
hepatoma Hepa-lclc7 c37 cell line the construct must contain the AhRD -aromatic hydrocarbon
responsive domain, for a sizable level of expression It was also noted that the expression of
endogenous Cyplal mRNA in the c37 parental line is decreased by the presence of exogenous
CYP1A1 or 1A2 enzyme activity, but that induction of endogenous mRNA for cypla\ was
restored by the presence of the exogenous genes Puga et a l , concluded that a functional
product or post-transcriptional signal of either the cyplal gene or the CYP1A2 gene may play
a role in an autoregulatory loop controlling the constitutive expression of the Cyplal gene
Hankinson et a l , (1991) found that a dominant induction defective mutant of Hepa-1 when
fused with wild type Hepa-1 cells resulted in prevention of induction They proposed that a
repressor protein which these dominant mutants express, effects the P4501A1 induction process
and that this protein is involved in the translocation of Ah receptor-ligand complexes from
cytoplasm to nucleus As a result there is no induction of this protein
As can be seen from these reports there are a number of elements believed to be affecting
endogenous P450IA1 production and at a number of levels
It is possible that a form of inhibitory regulation of this gene may be m operation in DLKP
The fact that PCH110 and Geneticin resistance are substantially expressed in each of the
transfections, even though their concentration is 20 times lower than that of the CYP1A1
plasmid indicates that some specific regulator controlling factor may be involved
But before we can ask questions about the lack of expression of CYP1A1 it is necessary to
prove that the plasmid actually entered the cell As this plasmid contains no selective gene
within itself e g geneticin or colchicine resistance, it was necessary to co-transfect it with
pSV2Neo so as the transfection positive cells could be selected over the non transfected This
was also the purpose of the PCH110 plasmid, as this plasmid contains /3-galactosidase activity
cells which had taken up this gene could be visualised as they turn blue on metabolism of X-Gal
by the (3-galactosidase At this point we could positively say that the transfection had worked
due to the visualization of PCH110 blue cells and the presence of geneticin resistant cells
Therefore since the CYPIA1 plasmid was at a concentration 20 times that of either of the other
two plasmids it is assumed that it too will be present in those clones selected for This is an
accepted system and had we recorded expression no further investigation would have been
required However expression was not recorded and there was the very real possibihty that the
plasmid had simply never entered the cell or had failed to integrate and had been degraded
Accordingly no expression would be recorded Therefore it was necessary to prove the
presence of the plasmid m the DLKP transfectant To do this it was decided to carry out PCR
170
using one primer previously chosen by Yang et a l , (1991) and one primer chosen by myself
from the sequence of CYP1A1 recorded by Yabusaki et a l , (1984) These primers spanned
a distance of 1540 bp from 110 to 1650 bp within the gene segment present in the plasmid
pSVP4501Al As can be seen in figure 51 the DLKP transfected with CYP1A1 reacted
positively therefore proving that the plasmid had actually entered the cell
With this result confirmed the next question which arises is why there is no expression of this
plasmid There are a number of possible reasons for this lack of expression The plasmid may
have integrated at a site in the chromosome which would not allow its transcription But for
this to happen 47 times is hard to accept Another possibihty is that the plasmid itself may be
damaged The full inserted sequence spans 2 2 kb (Dogra et a l , 1990), the segment chosen
for PCR spans 1 54 kb and was intact however the plasmid may have mutated upstream of the -
110 start site for the PCR sector, perhaps within the SV40 promoter site The V791A1-7
transfectant expresses activity demonstrating that the plasmid can actually produce protein but
the efficiency of transfection with the V-79 was also very low, only 2 transfectants out of 63
tested, one of which was unstable
It is possible that in the endogenous situation the gene may be have been methylated (as
reported by Shen et a l , 1989) thereby preventing binding of transcription factors, the
incorporating plasmid may have also been methylated which would result in its silence
To uncover possible reasons for the silence of this endogenous and plasmid gene in DLKP, cell
fusion experiments could be carried out, where DLKP is fused with another line which
expresses AHH activity This experiment would highlight the presence of a trans-acting
inhibitor if expression m the AHH positive line is prevented Treatment of DLKP with 5-
azacytidme which would remove the methyl groups on the DNA which might be preventing
access of transcription factor Treatment of DLKP with cycloheximide (thereby preventing
production of new protein) may uncover the presence of an inhibitor which may be preventing
transcription of this protein
Sequencing of the plasmid would be of interest to ensure that no mutations which may affect
expression may have occurred Cloning the rat CYP1A1 gene into another vector with a
different promoter would also demonstrate if the SY40 promoter was damaged or unresponsive
in this instance
However, as the expression of the gene within the plasmid is governed by the SY40 promoter,
it is unlikely that the upstream elements of the endogenous gene would affect transcription of
the plasmid gene In preliminary RT-PCR experiments carried out by Lorraine McElroy in this
laboratory, it has been discovered that mRNA encoding for endogenous cytochrome P450IA1
171
is present in DLKP However, a functional translation product of this mRNA has not been
detected by either enzyme activity or lmmunoanalysis, as can be seen in table 6 and figure 46
This suggests that regulation of this gene in DLKP may be taking place at some post-
transcriptional level and that this regulation is affecting both endogenous and plasmid
expression mRNA turnover is determined in part by the structure of each mRNA molecule
and a host of substances extrinsic to an mRNA itself e g translational factors, hormones and
occasionally viruses, issue direct or indirect regulatory signals that affect mRNA turnover
(Ross, 1989) In the V79 cell, the mRNA produced by the plasmid appears to be mtact, as it
produces functional aryl hydrocarbon hydroxylating protein m the transfected V791A1-7 cells
Therefore, the plasmid and its independent promoter is capable of producing mature mRNA in
V79 cells However, RT-PCR tells us only of the presence of the mRNA sequence which lies
between the chosen set of primers and not the size or condition of the full specific mRNA To
ascertain this information, it would be necessary to carry out Northern Blot analysis to
investigate if mRNA present is the correct size to produce P450IA1 At that point it would be
possible to determine if the regulation was occurring at the mRNA processing level, or at a later
stage e g interference at the translation stage, or alteration in the stabilization of the mRNA
e g increased turnover of the mature mRNA by elevated levels of ribonuclease which would
degrade the specific mRNA before it is translated, or decreased binding to the poly(A) tail of
the mRNA by PABB (poly(A) binding protein) thereby increasing the instability of the mRNA
(Shapiro et a l , 1987) Futher analyses would result in a better understanding of the regulation
of this gene and its expression m cell culture
172
4.2.2 Glutathione-S-Transferase in cell culture
The aim of this section of the project was to investigate the expression of the phase II enzyme
family, the Glutathione-S-transferases, in cell culture, with special interest in their expression
and their connection with Multiple Drug Resistance
The glutathione-S-transferases are a family of multifunctional proteins which act as enzymes and
binding proteins in various detoxication processes GST catalyze the reaction of nucleophilic
reduced glutathione with electrophilic compounds, often biotransformed compounds from
xenobiotics including carcinogens and endogenous substances This conjugation m some cases
prevents micitation of the carcinogenic process by inactivation of the electrophilic product or
ultimate carcinogen However, recent studies have shown that some glutathione and cysteine
conjugates can be more toxic than their original compounds (Tsuchida and Sato, 1992)
The expression and role of the GST classes /x,tt and a in cell culture and in cancer is a complex
issue It has been reported that m pre-neoplastic cells and neoplastic cells, specific molecular
isoenzymes of GST are expressed and that these isoforms participate in the mechanisms of their
resistance to drug (Tsuchida and Sato, 1992, Moscow - to be published) Increased expression
of a and /x GST isoenzymes during rat chemical hepatocarcinogensis have been observed (Sato
et a l , 1988) GST 7r has been identified as a marker for rat hepatic pre-neoplastic and neo
plastic lesions (Sato et a l , 1989), but human hepatocellular carcinomas do not express GST
7r Increased expression of human GST tt has also been demonstrated in pre-neoplastic and
neoplastic lesions in a variety of tissues A significant increase in GST it expression levels is
evident in metastatic liver tumours which originate from the gall bladder, stomach, and colon
Increased levels of GST it expressed in colon carcinomas and squamous cell carcinomas of the
uterine cervix have also been reported (Soma et a l , 1986, Kodate et a l , 1986, Shiratori et a l ,
1987) In primary human lung cancers elevated levels of ir have been observed in
adenocarcinomas and squamous cell carcinomas, but not m small cell lung cancers (Di ILio et
a l , 1988)
Expression levels of GST-/x have also been imp heated as a possible marker for increased
susceptibility to lung cancer, especially among the smoking population This is due to the
isoforms 7r and fi which are known to have high activity towards epoxides of Benzo[a]pyrene,
and these epoxides are associated with an increased incidence of lung cancer (Anttila et a l ,
1991) Deletion of the gene coding for GST /x could result is a greater concentration of toxic
benzo[a]pyrene metabolites in circulation (Seidegard et a l , 1988,1990)
173
This phenotype expressed in combination with the cytochrome P450IA1 C phenotype which
codes for increased mducibility of the P450IA1 protein which metabolises Benzo[a]pyrene
would result in severely increased susceptibility to lung cancer (Nakachi et a l , 1991) At the
other end of the scale reduction m expression of GST isoforms has also been implicated in
greater risk of adenocarcinoma of the stomach and colon (Strange et a l , 1991)
In the analysis presented in this thesis as can be seen from the results Table 3-8 and Figures 35-
39 total GST activity as determined by conjugation with 2,4-Dmitro-chlorobenzene, varies from
cell line to cell line Without samples of normal tissue from the original source it is impossible
to say if this expression is as a result of culture conditions or the malignancy of the cells
Increased expression of GST total was noted on induction with Phenobarbital (PB) in all the cell
lines tested This phenomenon had been previously reported in rat hepatocytes In these cells
PB induced the transcription of ir,ii and a This increase in expression is attributed to increased
transcription in the short term and stabilization of the GST mRNA in longer term cultures
(Vandenberghe et a l , 1991) This induction indicated that although the CYPIA1 gene and
the UDP-gluconyltransferase induction mechanism (which share common XRE upstream from
their genes) had been effected by culture conditions, that this PB mechanism of induction
continued to operate in vitro an it had in vivo
With respect to multiple drug resistance, the expression of GST has been studied extensively
in MDR cancer cell lines Elevated levels of GSTs have been recorded in MDR cell lines and
several mechanism of their action have been proposed, 1) enhanced activation of electrophikc
alkylating agents by direct conjugation, 2) GSH dependent demtrosation of nitrosoureas thereby
decreasing mtrosurea toxicity, 3) removal of reactive peroxides, 4) quenching of
chloroethylated-DNA monoadducts, platinum-DNA adducts, and DNA hydroperoxides
(Waxman 1990), 5) and working in concert with the P-170 glycoprotein by conjugating with
anticancer agents and transporting them to the endoplasmic reticulum for export out of the cell
(Moscow et a l , 1993) GST isoforms a , y. have been associated with the in vitro development
of resistance to nitrogen mustard, nitrosoureas, and benzo[a]pyrenes (Moscow et a l , 1989)
However, it is the it form that is present in most human tumours
The detection of high levels of GST tt in most established cell lines and in many cancer tissues
as well as m drug resistant cell lines, would suggests an important role for the enzyme in
acquired and natural resistance
174
GST ir expression in the adriamycin resistant lung lines in (figures 37 - 39) as confirmed by
immunoblot analysis (figures 52 - 54) highbghts this statement These results are in agreement
with the previously mentioned reports of GST tt expression in lung cancer
Elevation of ir expression was seen in the two adriamycin resistant lines SKLU1-A and SKMES-
1A, with the former demonstrating the greatest increase of 10 fold over its parental line and the
latter displaying only 2 fold increase This result is of great interest in that the mechanism of
resistance in this line has yet to be uncovered However, to date even though GST levels are
increased in a number of MDR lines, no conclusive evidence exist that any of the anticancer
drugs normally associated with MDR are conjugated with GSH Adriamycin, VP 16 and
vincristine, are conjugated by the cytosolic GSTs normally associated with cancer (Black et a l ,
1990, Moscow et a l , 1993) In an attempt to uncover the relevance of GSTs in MDR,
transfection of GST tt subunit cDNA into MCF-7 human breast carcinoma cell line, which
contain very low levels of endogenous GST, did not stimulate significant resistance, even on
co-transfection with P-glycoprotein (Tsuchida and Sato, 1992, Moscow et a l , 1993)
If the resistance of the cell line SKLU1A is mediated by the GST isoform tt then inhibition of
the action of this enzyme should circumvent this resistance
Buthiomne sulfoximime (BSO) is an inhibitor of gamma-glutamyl cysteine synthase, the enzyme
which produces glutathione (GSH) the substrate essential for GST to function (Waxman 1990,
Moscow et a l , to be published)
To investigate the possible role of GST m the mechanism of SKLU1-A resistance, SKLU1A
(the adriamycin resistant cell line) and SKLU1 (the parental non-resistant line) were exposed
to BSO The results are represented in figures 61 and 62 As can be seen from the graphs, the
treatment of SKLU1A with BSO alone resulted m and IC50 of 3 75 /¿M, for SKLU1 the IC»
in the presence of BSO alone was 6 25 /¿M
The SKLU 1A cells demonstrated 100% survival in 0 05 /¿g/ml of adriamycin, whereas the
parental line displayed a survival of only 11 % (possibly demonstrating a basal level of resistance
to adriamycin), in comparison with an untreated control These test were to identify the
concentrations of adriamycin and BSO which could be used m the mam experiment
To test the effect BSO on resistance both lines were exposed to non toxic BSO in the presence
of 0 05 ¿ig/ml adriamycin The parental bne demonstrated a decrease in survival below the
11 % survival already reported in 0 05/xg/ml adriamycin when a range of BSO was used This
pattern of increasing circumvention of basal resistance displayed by SKLU1 can be seen (figure
61)
175
The resistant line on the other hand on exposure to BSO in the presence of 0 05 /¿g/ml
adriamycin displays a decrease in sensitivity rather than an increase as expected for BSO - the
combination of the two drugs seemed to confer a type of resistance for BSO on the SLKU1A
cells, a result simdar to that found in the BSO treatment of GST transfected yeast (Moscow et
a l , 1993) These finding imply that in the SLKU1A cells which have acquired resistance to
adriamycin, that the over-expression of GST tt is perhaps a symptom of its MDR phenotype,
rather than the cause, as has been suggested recently by a number of groups (Moscow et
a l , 1993, Tsuchida and Sato, 1992, Waxman 1990)
176
4.2.3 TOXICITY TESTING of V-79, XEM2 and V791A1
This final section of my project was to investigate the consequences of the presence of CYP1A1
and CYPIIB1 in V79 cell lines.
The cytochrome P450 superfamily and in particular the CYP1A1 - AHH enzyme, have been
implicated in carcinogenesis and MDR (Guerngerich, 1988; Levine et al., 1984; Manson et al.,
1981;Kawajiri et al., 1991;McLemore et al., 1989, 1990; Kouri, et al., 1982; Anttila et al.,
1991; Clynes, 1993). It is also suggested that the MDR and cytochrome P450 gene families
may have overlapping regulatory elements and that induction of the mdr gene can be mediated
via by the CYP inducers 3MC (3-Methylcolanthrene) and AAF (2-Acetlyaminofluorene) but not
via the Ah receptor (Burt et al., 1988; Gant et al., 1991).
The connection between xenobiotic drug metabolism and MDR is one that as a concept is not
hard to accept, given that the aim of these enzymes is to rid the cell of exogenous and harmful
compound. Therefore as with their accidental activation of compounds, it is to be expected that
these enzymes should be involved in the expulsion of agents that are detrimental to the cell, but
beneficial to the whole body. Both elevated and depressed levels of xenobiotic metabolising
enzymes have been reported. Ivy et al., (1988) reported that an adriamycin resistant MCF-7
cell line expresses a trans acting inhibitor of CYPIA1 expression thereby preventing any
metabolism by this enzyme and resulting in a level of resistance to benzo[a]pyrene. Over
expression of xenobiotic metabolising enzymes in vitro results in increased metabolism of
anticancer agents which might decrease their plasma half-life in vivo (Doehmer, to be
published).
It has been reported that in toxicity tests using adriamycin on V-79 and XEM2, that a degree
of resistance approximately 10% was observed in XEM2 (J. Doehmer unpublished results)
XEM2 as mentioned previously contains the transfected rat cytochrome P450IA1 cDNA and
expresses AHH activity.
As can be seen from Figures 55 - 57 toxicity test were carried out on three lines containing rat
CYPIA1 using three chemotherapeutic agents, adriamycin, vincristine and VP-16. The three
lines were V79 (the parental non expressing line), XEM2 (the rat CYPIA1 expressing line
transfected by J. Doehmer) and V79IA1-7 (the V79 line which was successfully transfected with
rat CYPIA1 in this laboratory). The figures show that for vincristine there is essentially no
difference between the lines. For Adriamycin (figure 55) I found that there was once again
very little difference between the cell lines with V79IA1-7 displaying slightly more resistance
than XEM2, but when the error is taken into account once again the sensitivity is very similar.
177

For VP16 (figure 57), however, there is a difference in IC25 between V79IA1-7 at 0 125 /xg/ml
and the other two lines both at 0 75 /xg/ml (An IC25 was used here as it was a more sensitive
range) Overall the presence of P450IA1 in these lines has little effect on their sensitivity for
the drugs tested However, when these lines were exposed to benzo[a]pyrene figure 58 the
effect of the presence of P450IA1 is obvious Where V79, the parental cell line displays a IC50
of 5 75 mM both of the transfected-lines are much more sensitive (IC50 0 5mM for XEM2 and
0 0025mM for V791A1-7) due to their metabohsm of benzo[a]pyrene to its toxic metabolites
This toxicity profile demonstrates the value of transfection mediated xenobiotic metabolising
expressing cell lines as they expose the toxic nature of potential toxic compounds that m normal
in vitro experiments may have gone undetected due to the lines lack of expression of CYP1A1
Figure 59 also highbghts the transfection mediated activation of a drug - cyclophosphamide,
which in its unmetabolised form, as demonstrated by V79 cells, is not toxic except at very high
concentrations However, in the presence of CYP2B1 (transfected into V79 cells resulting in
the line SD1 (Doehmer et a l , 1988)) it is hydroxylated to its toxic form as it would be in vivo
Figure 59 also includes the toxicity profile of cyclophosphamide to DLKP and DLKPA As can
be seen from this graph both DLKP and DKLPA activate cyclophosphamide This was a
surprising result as to this point neither line had displayed any other xenobiotic metabolising
enzyme other than glutathione-S-transferase The fact that both the resistant and the parental
hnes display similar toxicity profile suggests that this expression is not as a result of exposure
to adriamycin, or linked with the MDR phenotype of DLKPA It does suggest to me that this
expression of this enzyme (which is phenobarbital inducible) is endogenous to DLKP and
DLKPA, it is of interest that the phenobarbital-induction of GST is also expressed in these
cells Perhaps the phenobarbital inducible enzymes have survived translocation into culture in
this line - DLKP Another possibility is spontaneous breakdown of cyclophosphamide,
however the activation is uniform and comparable to the transfected line SD1 I would expect
if spontaneous breakdown were occurring, that this activation should also be observed in V-79,
SKMES-1 and SKLU1 cells which were also tested, this however did not occur Therefore
there is an agent actively metabobsing cyclophosphamide in DLKP possibly P450IIB1
178
5.0 Conclusions and suggestions for further work.
The aims of this project were to 1) improve the methods for primary cultures of non-small cell
lung carcinomas, with a view to in vitro chemosensitivity testing 2) Investigate the possible
use of existing cell lines as activation system for in vitro toxicity testing 3) To establish a cell
line expressing activation ability and prove that lines value in in vitro toxicity testing and
finally 4) to investigate the possible connection between MDR as seen in SKLU1A adriamycin
resistant cell and expression of xenobiotic metabolising enzymes in these cell
Along the way these goal have changed sbghtly The primary culture of non-small cell lung
carcinoma evolved into a larger project than had been intended The overall success rate of this
section of the project was low The survival rate of samples was small and as time moved on
the mam emphasis changed from in vitro chemosensitivity testing to improving the survival time
of the sample However a poorly differentiated squamous cell carcinoma of lung line - DLKP,
was established, which is characterised and is being applied for other work in this laboratory
There are many parameters which could be varied in attempt to achieve this which time did not
allow for m my project For future work the use of polypropylene coated dishes could be
investigated This compound is reported to inhibit the attachment of normal - fibroblast cells,
as a result the malignant tumour cells will be selected The use of ’start up cultures’ in
capillary tubes which would keep the density of cells high and the volume low is another
possibility This method would allow for any autocrine growth factors being expressed by the
malignant cells to exert their effect on the cells in a suspension environment more akin to the
in vivo situation This method would also favour the growth of malignant cells over the normal
fibroblast which are so devastating to malignant growth in the attachment-dependent system
currently in use
Section two covered the investigation of established lung cell lines for expression of xenobiotic
metabolising enzymes This investigation was carried out on the cells in the absence and
presence of known inducers of xenobiotic metabolising enzyme As already mentioned some
cells on transfer into culture do retain their inductive ability, however none of the cell lines
tested in this section expressed this facility, in activity assays or immunocytochemical analysis
As a result of this lack of expression of xenobiotic metabolising enzyme these cells line were
perfect candidates for transfection of xenobiotic metabolising enzyme cDNA, as they had
retained their ability to express NADPH cytochrome P450 reductase
179

DLKP was chosen as the recipient of the gene - cytochrome P450IA1 the gene coding for aryl
hydrocarbon hydroxylase, the activity associated with the activation of a carcinogen present in
cigarette smoke and smog - benzo[a]pyrene and the induction of lung cancer However, even
though the cells took up the plasmid (as seen by PCR of the gene) and incorporated it into its
DNA, no expression of protein was seen There are a number of reasons why this could have
happened If the plasmid is incorrectly orientated m the cells DNA then transcription would
not occur, but for this to have happened consistently is difficult to accept If the plasmid was
damaged or mutated then no protein would be produced, however, a functional Y79 transfectant
was produced using the same plasmid which demonstrates the competence of the plasmid and
rules out damage to the plasmid This leaves the possibility of factors within DLKP which
effect the expression of this gene These factors may include methylation of the DNA after
incorporation, which could be investigated using 5-azacytidine, a chemical which removes the
methyl groups from cytosines An inhibitory trans acting factor may also be present which
would prevent the expression of this gene, cell fusion of DLKP with a CYPIA1 expressing line
would demonstrate this possibility, if inhibition of expression resulted in the fused cells, then
it could be concluded that a trans acting inhibitor of CYPIA1 expression exist within DLKP
Also the preliminay RT-PCR which has demonstrated the presence of CYP1A1 mRNA in the
parental bne indicating that transcription is taking place, however the size and condition of this
mRNA needs to be ascertained before we can speculate as to the possible mechanism of
regulation of this protein These studies would hopefully lead to the expression of CYPIA1
in DLKP - a human lung line They would also lead to a greater understanding of the
mechanism of this gene which is of great importance in lung cancer If successful these studies
would also result in an activating lung line which would be of importance in in vitro toxicity
testing - one of the mam aims of this project
The final section of this project involved the investigation of the adnamycin resistant human
adenocarcinoma SKLU1A to decide if the resistance in these cells is GST 7r mediated, as the
resistant form of this cell line displays increased expression of this GST isoform The results
obtained suggested that the mechanism is not GST mediated Therefore the resistance in this
cell line must be due to some other factor e g altered topoisomerase activity, or altered drug
transport Future work on these aspects may reveal the mechanism of resistance operating in
the cell line
180
SECTION 5
REFERENCESAli-Osman, F , Stein, D E and Renwick, A (1990) Glutathione content and GST expression in 1,3- Bis(2-chloroethyl)-l-nitrosourea-resistant human malignant atsrocytoma cell lines Cancer Res 50, 6976-6980
Anttila, S , Hietanen, E , Vaimo, H , Camus, A , Gelbom, H V , Park, S S , Heikkila, L , Karjalainen, A and Bartsch, H (1991) Smoking and Peripheral Type of Cancer are Related To High Levels of Pulmonary Cytochrome P450IA m Lung Cancer Patients Int J Cancer 47,681-685
Aoyama, T , Yamano, S , Guzelain, P S , Gelbion, H V , Gonzalez, F J (1990) Five of 12 form of vaccinia virus-expressed human hepatic cytochrome P450 metabolically activate aflatoxin B, Proc Natl Acad Sci USA 87, 4790-4793
Armstrong R N (1987) Enzyme-catalyzed detoxication reactions Mechamsms and stereochemistry CRC Cnt Rev Biochem 22, 39-88
Baldim, N , Scodandi, K , Serra, K , Dusuzake, K , Dhikita, T , Manara, M C , Maunci, D , Campamcci, M (1992) Adnamycin binding assay a valuable chemosensitmty test m human osteosarcoma J Cancer Res Clin Oncol 119, 121-126
Baron J , Voigt, J M (1990) Localization, distribution and induction of xenobiotic-metabohzing enzymes and aryl hydrocarbon hydroxylase activity within lung Pharmacol Therap 47, 419-445
Bast, A (1986) Is formation of reactive oxygen by cytochrome P-450 perilous and predictable? Trends Pharm Sci , 7, 266-270
Batist, G , Tulpules, A , Sinha, B K , Katki, A G , Myers, C E and Cowan, K H (1987) Overexpression of a novel anionic gluatathione transferase in multidrug resistant human breast cancer cell J Biol Chem 261, 15544-15549
Battula, N , Sagara, J , and Gelbion, H V (1987) Expression of P,-450 and P3-450 DNA coding sequences as enzymatically active cytochromes P-450 in mammalian cells Proc Natl Acad Sci USA 84, 4073-4077
Bellward, G D , Chang, T , Rodngues, B , McNeill, J H , Mames, S , Ryan, D E , Levm, W and Thomas, P W (1988) Hepatic cytochrome P-450] induction in the spontaneously diabetic BB rat Mol Pharmacol 33, 140-143
Bergh, J , Nilsson, K , Zech, L , and Giovanella, B (1981) Establishment and Characterization of a Continuous Lung Squamous Cell Carcinoma Cell Line (U-1752) AntiCancer Res 1, 317-322
Bhat, J G , Rangarajan, P N and Padmanaban, G (1987) Differential effects of cycloheximide on rat liver cytochrome P-450 gene transcription in the whole animal and hepatoma cell culture Biochem Biophys Res Com 148, 1118-1123
Black, S M , Beggs, J D , Hayes, J D , Bartoszek, A , Muramatsu, M , Sakai, M and Wolf, C R(1990), Expression of human glutathione S-transferases m Saccaromyces cerevisiae confers resistance to the anticancer drugs adnamycin and chlorambucil Biochem J 268,309-315
Black, S D (1992) Membrane topology of the mammalian P450 cytochromes FASEB Journal 6, 680- 685
181
Bladem Van P J (1988) Formation of toxic metabolites from drugs and other xenobiotics by glutathione conjugates Trends Pharm Sci 9, 295-299
Bock K W , Bock-Henmg, B S , Fischer, G , Lilenblum, W and Wllnch, D (1984) Role of glucuromdation and sulfation m the control of reactive metabolites In Biochemical basis of chemical carcinognesis 13-22
Bock, K W (1991) Roles of UDP-glucuronosyltransferase in chemical carcinogensis Cnt Rev in Biochem Mol Bio 26, 129-150
Bollinne, A , Kremers, P , Kolodzici, C , and Gieln, J E (1987) Long-term maintenance of monooxygenase activities in cultured foetal rat hepatocytes Cell Differentiation 21, 239-246
Booth, J , Boyland, E and Suns, P (1961) An enzyme form rat liver catalysing conjugations with glutathione Biochem J 79,516-526
Boyer, B , Valles, A M , Tucker, G C , Jouhanneau, J , Moens, G , Thiery, J P , (1990) Modulation of epithelial differentiation of cultured rat bladder carcinoma Pathol Biol 38, 10, 982-7
Bradfield, C A , Glover, E , and Poland, A (1990) Purification an N-temunal amino acid sequence of the Ah receptor from C57BL/6J mouse Mol Pharmacol 39, 13-19
Bratton A C and Marshall, E K , (1939) A new couphfig component for sulfanilamide determination J Biol Chem 128,537-550
Broers, J L , Rot, M K , Oostendorp, T , Bepler, G , De Ley, L , Carney, D N , Vooijs, G P , and Ramaekers, F C , (1988) Spontaneous changes in intermediate filament protein expression patterns in lung cancer cell lines J Cell Sci 91,91-108
Burchell B (1991) Characterisation and regulation of UDP-Glucuronoslytransferase Molecular Aspect of monooxygenase and bioactivation of toxic compounds Ed Annie, E, Schenkman, J B , Hodgson, E
Burt, R K and Thorgeirsson, S S (1988) Co-induction of MDR-1 Multidrug-Resistance and Cytochrome P-450 Genes in Rat Liver by xenobiotics J Natl Cancer Inst 80, 1383-1386
Campbell E , Takahashi, Y , Abramovitz, M , Peretz, M , and Listowsky, I (1990) A distinct Human Testis and Brain ¡x - Class Glutathione S-Transferase J Biol Chem 265, 9188-9193
Campling B G , Pym, J , Baker, H M , Cole, S P C and Lam Y -M (1991) Chemosensitivity testing of small cell lung cancer using the MTT assay Bnt J Cancer 63, 75-83
Chakrabarti, S , Brechling, K , and Moss, B (1985) Vaccinia Virus expression vector co-expression of /Jgalactosidase provides visual screening of recombinant virus plaques Mol Cell Biol 5,3403-3409
Chato, C C K , Huang, Y-T , Ma C M , Chou, W-Y , and Lin-Chao, S (1992) Overexpression on GST and elevation of thiol pools in a multidrug-resistant human colon cancer cell line Mol Pharm 41, 69-75
Chen, C , Kalb, V F , Tun, T G and Loper, J C (1988) Primary structure of the cytochrome P450 lanosterol 14a-demethylase gene from Candida tropicalis DNA 7, 617-626
Chichester, C H , Philpot, T M , Weir, A J , Buckpitt, A R and Plopper, C G (1991) Characterization of the cytochrome P450 monooxygenase system in nonciliated bronchiolar epithelial (Clara) cells isolated from mouse lung Am J Respir Cell Mol Biol 4, 179-86
182
Clynes, M , Redmond, A , Heenan, M (1990) Recent developments in research on multiple drug- resistance in cancer cell Cancer J 3,34-39
Clynes, M (1993) Cellular models for multiple drug resistance in cancer In Vitro 29, 171-179
Cole, S P C , Downes, H F , Mirski, S E L and Clements, D J (1990) Alteration in glutathione and glutathione-related enzymes in a multidrug-resistant small cell lung cancer cell line Mol Pharma 37, 192-197
Conney, A H (1967) Pharamacological implications of microsomal enzyme induction Pharma Rev 19, 317-366
Coon, M J , Ding, X , Pemecky, S J , and Vaz, A D N (1992) Cytochrome P450 progress and predictions FASEB J 6, 669-673
Crespi, C L , Langenbach, R , Rudo, K , Chen, Y T , and Davies, R L (1989) Transfection of a human cyto P450 gene into the human lymphoblastoid cell line AHH-1, and use of the recombinant cell line in gene mutation assays Carcinogenesis 10, 295-301
Crespi, C L , Steimel, D T , Aoyama, T , Gelboin, H V , and Gonzalez F J (1990) Stable expression of human cytochrome P450IA2 cDNA m human lympoblastoid cell line role of the enzymes in the metabolic activation of aflatoxin B, Mol Carcinogenesis 3,5-8
Crespi, C L , Gonzalez, F J.,Steimel, S T , Turner, T R , Gelboin, H V , Penman, B W and Langenbach, R (1991) A metabolically Competent Human Cell Line Expressing Five cDNAs Encoding Procarcinogen-Activating Enzymes Application to Mutagenicity Testing Chem Res Toxicol 4, 566- 572
Demson, M S , Fisher, J M and Whidock, J P Jr (1988) Inducible, receptor-dependent protein-DNA interactions at a dioxin-responsive transcriptional enhancer Proc Nad Acad Sci U SA 85, 2528- 2532
De Pierre, J W and Emster L (1977) Enzyme topology of intracellular membranes Annu Rev Biochem , 46, 210-262
Di Dio, C , Del Boccio, G , Aceto, A , Casaccia, R , Mucilli, R , and Fedenci, G (1988) Elevation of glutathione transferase activity in human lung tumour Carcinogenesis 9, 335-340
Doehmer, J , Dogra, S , Fnedbery, T , Momer, S , Adesmk, M , Glatt, H , and Oesch, F (1988) Stable expression of rat cytochrome P0450HB1 cDNA in Chinese hamster cells (V79) and metabolic activation of aflatoxin B, Proc Nad Acad Sci USA 85, 5769-5773
Doehmer, J , Dogra, S , Edigkaufer, M , Mobtor, E , Siegert, P , Fnedberg, T , Glatt, H , Platt, K , Seidel, A , Thomas, H , and Osech, F (1989) Introduction to cytochrome P-450 genes into V79 Chinese hamster cell to generate new mutagenicity test systems Biological Monitoring of Exposure and the Response at the Subcellular Level to Toxic Substances Arch Toxicol , Suppl 13, 164-168
Doehmer, J , Seidel, A , Oesch, F and Glatt, H R (1990) Genetically engineered V79 Chinese hamster cells metabolically activate the cytostatic drugs cyclophosphamide and lfosfamide Environmental Health Perspectives 88, 63-65
Dogra, S , Doehmer, J , Glatt, H , Molders, H , Siegert, P , Fnedberg, T , Seidel, A , Oesch, F(1990) Stable expression of Rat cytochrome P-4501A1 cDNA in V79 Chinese hamster cells and their use m mutagenicity testing Mole Pharm 37, 608-613
183

Donato M T , Gomez-Lechon, M J , Castell, J V (1990) Drug metabolizing enzymes in rat hypothecates co-cultured with cell lines In Vitro Cell Dev Biol 26, 1057-1062
DumnLK .Whitlock,J P Jr (1989) 2,3,7,8-Tetrachlorodibenzo-p-Dioxin-InducibleAryl Hydrocarbon Receptor-Mediated Change in CYP1A1 Chromatin Structure Occours Independently of Transcription Mol Cell Biol 9, 5733-5737
Durnn, L K and Whitcock, J P Jr (1987) In situ protem-DNA interactions at a dioxin-responsive enhancer associated with the cytochrome P,450 gene Mol Cell Biol 7, 3008-3011
Eckert, K G and Eyer, P (1986) Formation and transport of xenobiotic glutathione-S conjugates in red cells, Biochem Pharmacol 35, 325-329
Ellard, S , Mohammed, Y , Dogra, S , Wolfel, C , Doehmer, J , and Parry, J M (1991) The use of genetically engineered V79 Chinese hamster cultures expressing rat liver CYP1A1, IA2 and 2B1 cDNAs in micronucleus assays Mutagenesis 6, 461-470
Elshourbagy, N A and Guzelian, P S (1980) Separation, purification and characterization of a novel form of hepatic cytochrome P-450 from rats treated with pregnenolone 16a carbomtnle J Biol Chem 255, 1279-1285
Endicott, J A and Ling, V (1989) The biochemistry of P-glycoprotein mediated Multidrug resistance Ann Rev Biochem 58, 137-171
Erlandson, R A , (1984) Diagnostic immunohistochemistry of human tumors The American J of Surgiacal Path 8, 8, 615-621
Fairchild, C R , Moscow, J A , O’Bnen, E E and Cowan, K H (1990) Multidrug reisitance in cells transfected with human genes encoding a variant P-glycoprotein and glutathione S-transferase ir Mol Pharma 37, 801-809
Fisher, C W , Caudle, D L , Martin-Wixtrom C , Quattrochi, L C , Tukey, R H , Waterman, M R and Estabrook, R W (1992) High-level expression of functional human cytochrome P450 1A2 in Escherichia coll FASEB J 6, 759-764
Foldes, R L , Bresmck, E (1989) Inducibility of rat liver cytochrome P-450IA1 (P-450c) mRNA during the partial inhibition of protein synthesis Biochem Pharma 38,1017-1019
Frazier, J M (1991) General perspectives on in vitro toxicity testing In In Vitro Toxicity Testing - application to safety evaluation 1-11
Frenshney, R I (1987) Culture of animal cells - a manual of basic techniques 1987 Published by Alan R Lis, Inc , New York
Fuhr, U , Doehmer, J , Battula, N , Wolfel, C , Kudla, C , Keita, Y , and Staib H A (1991) Biotransformation of caffeine and theophylline in mammalian cell lines genetically engineered for expression of single cytochrome P450 isofonns Biochem Pharm 42,2, 225-235
Fuju-Kunyama, Y , Imataka, H , Sogawa, K , Yasumoto, K-I and Kikuchi, Y (1992) Regulation of CYP1A1 expression FASEB 6, 706-710
Fukjisawa-Sehara, A , Sogawa, K , Yamane, M , and Fujn-Kunyama, Y (1987) Characterization of xenobiotic responsive elements upstream from the drug-metabolizing cytochrome P-450c gene a similarity to glucocorticoid regulatory elements Nucl Acids Res 15, 4179-4191
184
Fukjisawa-Sehara, A , Yamane, M , and Fujn-Kunyama, Y , (1988) A DNA-binding factor specific for xenobiotic responsive elements of P450c gene exists a cryptic form in cytoplasm Its possible translocation to nucleus Proc Natl Acad Sci U SA 85, 5859-5863
Furukawa, T , Kubota, T , Watanage, M , Kase, S , Takahara, T , Yamaguchi, H , Takeuchi, T , Tennaoto, T , Ishibila, K , Kitajimia, M (1992) Chemosensitivity testing of clinical gastrointestinal cancers using hisoculture and the MTT end-point Anticancer Res 12, 1377-1382
Gant, T W , Silverman, J A , Bisgaard, H H , Burt, R K , Manno, P A and Thorgersson, S S (1991) Regulation of 2-AcetyIaminofluorene-and 2-Methylcholanthrene-Mediated Induction of Multidrug Resistance and Cytochrome P450IA gene Family Expression in Primary Hepatocyte Cultures and Rat Liver Mol Carcinogensis 4, 499-509
Gazdar, M F , Steinberg, S M , Russel, E K , Linnoila, R I , Oie, H K , Ghosh, B C , Cotelmgam, J D , Johnson, B E , Minna, J D , Ihde, D C (1990) Correlation of In Vitro Drug-Sensidvity Testing Results With Response to Chemotherapy and Survival in Extensive-Stage Small Cell Lung Cancer A prospective Clinical Tnal J Natl Cancer Inst 82,117-124
Gazdar, A F , Kodayama, C , Venzon, D , Park, J G , Tsai, C M , Linnoila, R I , Mulshine, J L , Ihde,D C , andGiaccone, G (1992) Association between histological type and neuroendocrine differentiation on drug sensitivity of lung cancer cell lines Monogr Nad Cancer Inst 13,191-196
Giaccia, A J , Lewis, A D, Denko, N C , Cholon, A , Evans, J W , Waldren, C A , Stamato, T D andBrown, J M (1991) The hypersiensitivity of the Chinese hamster ovary variant BL-10 to bleomycinkilling is due too a lack of GST-a activity Cancer Res 51,4463-4469
Gibson, G G , Skett, P (1986) Introduction to drug metabolism Cambridge Press
Gilvarry, U , Farrell, D , Lynch, V , Monarty, M , Dooley, M , Law, E and Clynes, M (1990)Cytological differences between normal and malignant human cell populations in culture Cancer Res 50, 3390-3393
Gonzalez, F J , Kimura, S , and Nebert, D W (1985) Comparison of the Flanking Regions and Introns of the Mouse 2,3,7,8-tetrachlorodibenzo-p-dioxin-induciblecytochrome PI 450 and P3450 Genes J of Biol Chem 260, 5040-5049
Gonzalez F J , Song, B J ,and Hardwick, J P (1986) Pregnenolone 16 a-carbomtnle-mducible P-450 gene family gene conversion and differential regulation Mol Cell Biol 6, 2969-2976
Gonzalez, F J , Schmid, B J , Umeno, M , Me Bride, W O , Hardwich, J P , Meyer, U A , Gelboin, H V , Idle, J R (1988) Human P450CN1 Sequence, Chromosome Localization, and Direct Evidence through cDNA Expression That P450PCNCN1 Is Nifedipine Oxidase , DNA 7, 79-86
Gonzalez, F J , Skodo, R C , Kimura, S , Umeno, M , Zanger, U M , Nebert, D W , Gelboin, H V , Hardwich, J P , Meyer, U A (1988) Characterization of the common genetic defect m humans deficient in debnsoquimne metabolism Nature 331, 422-446
Gonzalez, F J (1990) Molecular Genetics of the P-450 Superfamily Pharmac Ther 45, 1-38
Gonzalez, F J , and Nebert, D W (1990) Evolution of the P-450 gene superfamily ammal-plant warfare, molecular drive and human genetic differences in oxidation Trends in Genetics 6, 182-186
Gonzalez F J , Crespi, C L , and Gelboin H V (1990) cDNA-expressed human cytochrome P450s a new age of molecular toxicology and human risk assessment Mutant Res 247, 113-127
185
Gonzalez, F J (1992) Human cytochrome P450 problems and prospects Trends Phann Sci 13,346- 52
Gotho, 0 , Tagashira, Y , Iizuka, T , and Fujn-Kunyama, Y (1983) Structural Characteristics of Cytochrome P-450 Possible location of the heme-binding cysteine in determined amino-acid sequences J Biochme 93, 807-817
Grant, H M , Burke, D M , Hawksworth, G M , Duthie, S J , Engeset, J , Petne, J C (1987) Human adult hepatocytes in primary monolayer culture Biochem Phann 36, 2311-2316
Grant, H M , Melvin, W T , Burke, M D (1986) Maintenance of cytochrome P-450 and dependent enzymes in cultured rat hepatocytes Fd Chem Toxic 24, 759-760
Grant, H M , Melvin, M A L , Shaw, P , Melvin, W T , and Burke, M D (1985) Studies on the maintenance of cytochromes P-450 and b5 monooxygenases and cytochrome reductases in primary culture of rat hepatocytes FEBS 190, 99-103
Guengench, F P , Martin, M V , Beaune, P H Kremer, P , Wolff, T and Waxman, D J (1986) Characterization of rat and human liver microsomal cytochrome P450 form involved in nifedipine oxidation, a prototype for genetic polymorphism in oxidative drug metabolism J Biol Chem 261, 5051-5060
Guengench, P F (1988) Polymorphism of Cytochrome P450 in humans Trends Phann Sci 10,107-109
Guengench, P F (1988) Roles of Cytochrome P-450 Enzymes m Chemical Carcinogensis and Cancer Chemotherapy Cancer Res 48, 2946-2954
Guengench, P F (1990) Enzymatic oxidation of xenobiotic chemicals Cnt Rev Biochem Mol Biol 25, 97-153
Guengench, P F (1991) Molecular advances for the cytochrome P-450 superfamily Trends Phann Sci 12, 281-282
Guillouzo, A , Beaune, P , Gascoin, M , Begue, J , Campion, J , Guengench, P F , Guguen-Guillouzo, G (1985) Maintenance of cytochrome P-450 in cultured adult human hepatocytes Biochem Phann 34, 2991-2995
Gulick, A M , Goihl, A L , Fahl, W E (1992) Structural Studies on Human Glutathione S-transferase 7T J Biol Chem 267, 18946-18952
Halaban, R and Alfano, F D (1984) Selective elimination of fibroblasts from cultures of normal human melanocytes In Vitro 20, 447-450
Hall A , Robson, C N , Hickson I D , Hams, A L , Proctor, S J and Cattan, A R (1989) Possible role of inhibition of glutathione s-transferase in the partial reversal of chlorambucil resistance by îndomethacm m a Chinese hamster ovary cell line Cancer Res Vol 49, 6265-6268
Hall, A , Foster, S , Proctor, S J and Cattan, A R (1990) Purification and characterization of a pi class glutathione S-transferase from human leukaemxc cells Bnt J Haematol 76, 494-500
Hamburger, A W , Reid, Y A , Pelle, B , Milo, G E , Noves, I , Krakaver, H and Führer, J P (1985) Isolation and charactensation of a monoclonal anti-body specific for epithelial cell Cancer Res 45, 783- 790
186
Hankjnson, 0 and Bannister, R M (1988) Genetic analysis of the Ah receptor and cytochrome P,450 expression m the mouse hepatoma cell line, Hepa-1 Microsomes and Drug oxidations, pp39-46, Miners, J 0 , Birkett, D J , Drew, R and McManus, M (eds) Taylor & Francis, London
Hankinson, O , Brooks, BA , Weir-Brown, KI , Hoffman, EC , Johnson, BS , Nanthur, J , Reyes, H ,Watson, AJ (1991) Genetic and molecular analysis of the Ah receptor and of cyplal gene expression Biochimie 73, 61-66
Hardwick, J P , Gonzalez, F J and Kasper, C B (1983) Transcriptional regulation of rat liver epoxide hydratase, NADPH-cytochrome P-450 oxidoreductase, and cytochrome P-450b genes by phenobarbital, J Biol Chem 258, 8081-8085
Hardwick, J P , Song, B J , Huberman, E and Gonzalez, F J (1987) Isolation, complementary DNA sequence, and regulation of rat hepatic launc acid w-hydroxylase (cytochrome P-450LAgj), identification of a new cytochrome P-450 gene family J Biol Chem 262, 801-810
Hayes, P C , Bouchier, A A D and Beckett, G J (1991) Glutathione S-transferase in humans inhealth and disease Gut 32, 813-818
Heinntz, H , Doehmer, J , Oesch, F (1987) Search for cell culture systems with diverse Xenobiotic- metabolizing activities and their use in toxicological studies Mol Tox 1,313-334
Hesse, S and Jemstrom, B (1984) Role of GST Detoxification of reactive metabolites of benzo[a]pyrene-7,8-dihydrodiol by conjugation with glutathione pp5-11 In Biochmeical basis of chemical carcmogensis Ravens Press
Higashi, Y , Tanae, A , Inque, H , Hiromasa, T and Fujn-Kunyama, Y (1988) Aberrant splicing and missense mutations cause steroid 21-hydroxylase (P-450 (c21)) deficieny in man Possible gene conversion products Proc Natl Acad Sci USA 85, 7486-7490
Hildebrand, E C , Gonzalez, F J , McBnde, W O , and Nebert, D W (1985) Assignment of the human 2,3,7,8,-tetrachlorodibenzo-p-dioxm-inducible cytochrome Pl-450 gene to chromosome 15 Nucl Acid Res 13, 2009-2016
Hilton, J , Cohen, D , (1982) Role of aldehyde dehydrogenase in response of L1210 cells to cyclophosphamide and 4-methylcyclophosphamide Proc Am Assoc Cancer Res 23, 169
Hilton, J (1984) Deoxyribonucleic acid crosshnking by 4-hydroxycyclophosphamide in cyclophosphamide-sensitive and -resistant L1210 cells Biochem Pharma 33, 1867
Hoffinan R M , Connors, K M , Meerson-Monosov, A Z , Herrera, H and Price, J H (1989) A general native-state method for determination of proliferation capacity of human normal and tumor tissues in vitro Proc Natl Acad Sci USA 86, 2013-2017
Hoffinan, R M (1991) In vitro sensitivity assay in cancer a review, analysis, and prognosis J Clin Lab Anal 5, 133-143
Holliday, R (1989) A Different Kind of Inheritance Sci Amer 260,40-48
Holme, J A (1985) Xenobiotic metabolism and toxicity m primary monolayer cultures of hepatocytes Nat Inst Pub Health Ann (Oslo) 8, 49-63
Holmes, J , Wareing, C , Jacobs, A , Hayes, J D , Padua, R A and Wolf, C R (1990) Glutathione-s- transferase pi expression in leukaemia a comparative analysis with mdr-1 data 62, 2, 209-212
187

Hosking, L K , Whelan, R D H , Shellard, S A , Bedford, P and Hill, B T (1990) An evaluation of the role of Glutathione and its associated enzymes m the expression of differential sensiuvities to antitumour agents shown by a range of human tumour cell lines Bio Pharma 40, 1833-1842
Howie, A F , Forrester, L M , Glancey, M J , Schlager J J , Powis G , Beckett, G J , Hayes, J D and Wolf, C R (1990) Glutathione S-transferase and glutathione peroxidase expression in normal and tumour human tissues Carcmogensis 11, 451-458
Ikeya, K , Jaiswal, A K , Owens, R A , Jones, J E , Nebert, D W , and Kimura, S (1989) Human CXP1A2 Sequence, Gene Structure, Comparison with the Mouse and Rat Orthologous Gene, and Differences in Liver 1A2 mRNA Expression Mol Endocrinol 3,1399-1408
Insawa, C , Aikawa, K , Ogihara, M , Hashimoto, T , Yamaguchi, 0 , Shiraiwa, Y , Koseki, K (1992) Clinical results of porphylactic intravesical chemotherapy on superficial bladder cancer using the dye exclusion assay Nippon Hinyokika Gakkai Zasshi (Japan) 83, 11, 1828-1834
Israel, D I , Estolano, M G , Galeazzi, S R and Whitlock, J P , Jr (1985) Supennduction of cytochrome P,-450 Gene Transcription by Inhibition of Protein Synthesis in Wild Type and Variant Mouse Hepatoma Cells J Biol Chem 260, 5648-5653
Ivy, P S , Tupule, A , Fairchild, C R , Avebuch, S D , Myers, C E , Nebert, D W , Baird, W M , and Cowan, K H (1988) Altered regulation of P-450IA1 expression m a Multidrug-resistant MCF-7 Human Breast Cancer Cell Line J Biol Chem 263,19119-19125
Jaiswal, A K , Nebert, D W (1985a) Two RFLPs associated with the human P,450 gene linked to the MPI locus on chromosome 15 [HGM8 D15S8], Nucl Acids Res 13, 4376
Jaiswal, A K , Gonzalez, F J , and Nebert, D W (1985b) Human P,-450 gene sequence and correlation of mRNA with genetic differences in benzo[a]pyrene metabolism Nucl Acids Res Vol 13, 4503-4520
Jaiswal, A K , Nebert, D W and Eisen, H W , (1985c) Comparison of aryl hydrocarbon hydroxylase and acetamlide 4-hydroxylase induction by polycyclic aromatic compounds inhuman and mouse cell lines Biochem Pharma 34, 2721-2731
Jakoby, W B and Ziegier, D M (1990) The Enzymes of Detoxication J Biol Chem 265, 20715- 20718
Jasson, I , Mole, J and Schenkman, J B (1985) Purification and characterization of a new form (RLM2) of liver microsomal cytochrome P450 from untreated rat J Biol Chem 260, 7084-7093
John M E , Okamura, T , Dee, A , Adler, B , John, M C , White, P C , Simpson, E R and Waterman, M R (1986) Bovine steroid 21-hydroxylase regulation of biosynthesis Biochemistry 25, 2846-2853
Kappus, H (1986) Overview of enzyme systems involved in bio-reduction of drugs and in redox cycling Biochem Pharmacol 35, 1-6
Kato, S , Shields, P G , Caporaso, N E , Hoover, R N , Trump, B F , Sugimura, H , Weston, A , and Hams, C C (1992) Cytochrome P450IIE1 Genetic Polymorphisms, Racial Variation, and Lung Cancer Risk Cancer Res 52, 6712-6715
Kawajin, K and Fujn-Kunyama, Y (1991) P450 and Human Cancer, Jpn J Cancer Res 82,1325- 1335
Kirk, D , Brober, T , Irwin, J C , Kenney, W CM and Jones, L. W. (1993) Fibroblast mhibiotn of tumour cells may be mediated by TGF-/J1 In vitro cell dev biol 29A, 1, 4-8
188
Kitada, M , Kamatala, T, Itahashi, K , Rikihisa, T and Kanakubo, Y (1987) P450 HFLa, a form of cytochrome P450 punfied form human fetal livers, is the 16ahydroxylase of dehydroepiandrosterone 3- sulfate J Biol Chem 262, 13534-13537
Kitada, M , Kamatala, T , Itahashi, K , Rikihisa, T and Kanakubo, Y (1987) Significance of cytochrome P450 (P450HFLa) of human foetal livers in the steroid and drug oxidations Biochem Pharma 36,453- 456
Kitahara, A , Satoh, K , Nishimura, K , Isikawa, T , Ruike, K , Sato, K , Tsuda, H and Ito, N (1984) Changes in molecular forms of rat hepatic GST during chemical hepatocarcinogensis, Cancer Res 44, 2698-2703
Kobaysahi, S , Inaba, H , Okada, S and Nakada, T (1989) Culture and Changes in Dynamics of Proliferation of Pulmonary Small Cell Carcinoma Cells Tohoku J Exp Med 159,1-14
Kocarek, T A , Suchuetz, E G , and Guzelian, P S (1993) Transient induction of cytochrome P450 1A1 mRNA by culture medium component in primary cultures of adult hepatocytes In Vitro Cell Dev Biol 29A, 62-66
Kodate, C , Fukushi, A , Nanta, T , Kudo, H , Soma, Y and Sato, K (1986) Human placental form of the GST 7r as a new immunohistochemical marker for human colonic carcinoma, Jpn J Cancer Res 77, 226-229
Kondo, S , Carr, B I , Takagi, K , Huang, T H , Chou, Y , Yokoyama, K and Itakura, K (1990) Expression of trace microsomal epoxide hydrolase gene during liver chemical carcinogenesis Cancer Res 50, 6222-6228
Koun, R E , McKinney, E , Slomiany, D J , Snodgrass, D R , Wray, N P and McLemore, T L (1982) Positive Correlation between High Aryl Hydrocarbon Hydroxylase Activity and Primary Lung Cancer as Analyzed in Cryopreserved Lymphocytes Cancer Res 42, 5030-5037
Kronbach,T , Fischer, V and Meyer, U A (1988) Cyclosponne metabolism in human liver identification of a cytochrome P-450III gene family as the major cyclosponne-metabolizmg enzyme explains interactions of cyclosponne with other drugs Clin Pharma Ther 43, 630-635
Kubota, M , Sogawa, K , Kaizu, T , Sawaya, T , Watanabe, J , Kawajin, K , Gotoh, O and Fujn-Kunyama, Y (1991) Xenobiotic Responsive Element m the 5’-upstream Region of the Human P-450c Gene J Biochem 110,232-236
Kuroda, H , Sugimoto, T , Ueda, K , Tsuchida, S , Hon, Y , Inazawa, J , Sato, K and Sawada, T (1991) Different drug sensitivity in two neuroblastoma cell lines established from the same patient before and after chemotherapy Int J Cancer 47, 732-737
Laemmli, U R , (1970) Nature, 227, 680
Lalwam, N D , Alvares, K , Reddy, M K , Reddy, M N , Pankh, I and Reddy, J K (1987) Peroxisome prohferator-binding protein identification and partial charactenzatio of nafenopin-, clofibnc acid- and profibrate-binding proteins form rat hver Proc Nad Acad Sci USA 84, 5242-5246
Law, E , Gilvarry, U , Lynch, V , Gregory, B , Grant, G and Clynes, M (1992) CytogenticComparison of two poorly differentiated human lung squamous cell carcinoma lmes Cancer Genet Cytogenet 59, 111-118
Lee, F.Y F , Flannery, D J , and Siemann, D W (1991) Prediction of tumour sensitivity to 4- hydroperoxycyclophosphamide by a glutathione-targeted assay Br J Cancer 63 , 217-222
189
Legraverend, C , Hannah, R R , Eisen, H J , Owen, I S , Nebert, D W and Hankinson, 0 (1982) Regulatory gene product of the Ah locus Characterization of receptor mutants among mouse hepatoma clones J Biol Chem 257, 6402-6407
Levine, A S , McKinney, C E , Kchelberger, C K , Koun, R E , Edwards, B K and Nebert, D W (1984) Aryl Hydrocarbon Hydroxylase inducibility among Primary Relatives of children with Leukemia or Solid Tumors Cancer Res 44, 358-362
Lilienblum, W , Walli, A K and Bock, K W (1982) Differential Induction of Rat Liver Microsomal UDP-Glucuronosyltransferase Activities by various inducing Agents Biochem Pharma 31,907-913
Litwack, G , Ketterer, B , and Anas, I M (1971) Ligandin a hepatic protein which binds steroids, bilirubin, carcinogen and a number of exogenous orgamc anions Nature (London) 234, 466
Loquet, C , and Wiebel, F J (1982) Geno- and cytotoxicity of mtrosamine, aflatoxin B, and benzo[a]pyrene m continuous culture of rat hepatoma cells Carcinogenesis 3, 1219-1222
Lu, A Y H , Somogyi, A , West, S , Kuntzman, R and Conney, A H (1972) Pregnenolone-16-alpha- carbomtnle A new type of inducer of drug metabolizing enzymes Arch Biochm Biophys 152, 457- 462
Lusska, A , Jones, K W , Elfennk, L W , Shen, E S , Wen, L-P and Whitlock, J P Jr (1991) 2,3,7,8-Tetracholordibenzo-p-dioxin induces cytochrome P450IA1 enzyme activity by activating transcnptm of the corresponding gene Adv Enz Reg 31,307-317
Lusska, A , Wu L and Whitlock, J P Jr (1992) Supennduction of CYP1A1 Transcnption by Cycloheximide J Biol Chem 267, 15146-15151
Luster, W , Gropp, C , Kern, H F and Havemann, K (1985) Lung tumour cell lines synthesizing pettide hormones established from tumours of four histological types Charactenzation of the cell lines and analysis o f their peptide hormone production Bnt J Cancer 51, 865-875
Manoharan, H T , Welch, P J , Gluick, A M , Puchalski, R B , Lathrop, A L and Fahl, W E (1991)Expression of tandem glutathione S-transferase recombinant genes in COS cells for analysis of efficiency fo protein expression and assocaiated drug resistance Mol Pharma 39, 461-467
Martin, A J , Clynes, M , (1991) Acid phosphatase - endpoint in in vitro toxicity tests In vitro celldevel , 27, 183-185
Mason M E and Okey, A B (1981) Aryl Hydrocarbon Hydroxylase Activity in Mouse, Rat and Human Mammary Tumours Cancer Res 41, 2778-2782
Masuda, N , Fukuoka, M , Matsui, K , Kusunoki, Y , Kudoh, S , Negoro, S , Takifiiji, M , Fujisue, M , Monno, H , Nakagawa, K , Nishioka, K , Takada, M (1991) Establishment of Tumour Cell Lines as an Independant Prognostic Factor for Survival Time in Patients With Small-cell Lung Caner J Natl Cancer Inst 83, 23, 1743-1748
Matsubara, S , Yamanoto, S , Sogawa, K , Yokotam, N , Fujii-Kunyama, Y , Hamu, M , Shively, J I , Gothe, O , Kusunose, E and Kusunose, M (1987) cDNA clomng and inducible expression dunng pregnancy of the mRNA for rabbit pulmonary prostaglandin w-hydroxylase (cytochrome P-450) J Biol Chem 262,23366-23371
McKinnon, R A , Hall, P De La M , Quattrochi, L C , Tukey, R H ,and McManus M E (1991) Localization of CYP1A1 and CYP1A2 messenger RNA m Normal Human Liver and in Hepatocellular Carcinoma by In Situ Hybndization Hepatology 14, 5, 848-856
190
McLemore, T L , Adelberg, S , Czerwinski, M , Hubbard, W C , Yu, S J , Storeng, T , Wood, T G , Hines, R N and Boyd M R (1989) Altered Regulation of the Cytochrome P4501A1 Gene Novel Inducer-Independent Gene Expression in Pulmonary Carcinoma Cell Lines J Natl Cancer Inst 81, 1787-1794
McLemore, T L , Adelbery, M C , Liu, M C , McMahon, N A , Yu, S J , Hubbard, W C , Czerwinski, M , Wood, T G , Storeng, R , Lubet, R A , Eggleston, J C , Boyd, M R , Hines, R N (1990) Expression of CYP1A1 Gene in Patient with lung Cancer Evidence for Cigarette Smoke-Induced Gene Expression m Normal Lung Tissue and For Altered Gene Regulation in primary Pulmonary Carcinomas J Natl Cancer Inst 82, 16, 1333-1339
Meister, A , and Anderson, M E , (1983) Glutathione Ann Rev Biochem 52,711-160
Miles, J S , Bnckmore, W , Brooke, J D , McLaren, A W , Meehan, R , and Wolf, C R (1989) Close linkage of the human cytochrome P450IIA and P450HB gene subfamilies implication for the assignment substrate specificity Nucl Acids Res 17, 2097-2917
Miller, W and Levine, L S (1987) Molecular and clinical advances in congenital adrenal hyperplasia J Pediatr 111, 1-17
Miyazaki, M , Kohno, K , Sabun, Y , Matsue, K-i, Ono, M , Kuwano, M , Tsuchida, S , Sato, K , Sakai, M and Muramatsu, M (1990) Drug resistance to cis-diamminedochloroplatinum(II) in Chinese hamster ovary cell lines transfected with GST ir gene Biochem Biophys Res Comm 166, 1358- 1364
Montisano, D F , Hankmson, O (1985) Transecaon by Genomic DNA of Cytochrome P‘-450 Enzymatic Activity and Inducibihty Mol Cell Biol 5, 698-704
Moscow, J A , Fairchild, C R , Madden, M J , Tansom, D T , Wieand, H S , O’Brien, E E , Poplack D G , Cossman J , Myers C E and Cowan K H (1989) Expression of anionic glutathione-stransferases and P-glycoprotem genes m human tissues and tumours Cancer Res 49, 1422-1428
Moscow, J R , Fairchild, C R , Madden, M J , Ransom, D T , Wieand, H S , O’Brien, E E , Poplack, D G , Cossman, J , Myers, C E and Cowan K H (1989) Expression of Anionic Glutathione-S- transferase and P-Glycoprotien Genes in Human Tissues and Tumours Cancer Res 49, 1422-1428
Mulshme, J L , Cuttitta, R , Bibro, M , Fedorko, J , Fargion, S , Little, C , Carney, D N , Gazadar, A F and Minna, J D (1983) Monoclonal Antibodies that Distinguish Non-small cell frome small cell lung Cancer J Immunol 131,497-502
Murayama, N , Shimada, M , Yamazoe, Y and Kato, R (1991) Difference m the susceptibility of two phenobarbital-mducible forms, P450IIB1 and P450HB2, to Thyroid hormones- and Growth hormone- induced suppression in Rat liver Phenobarbital-Inducible P450IIB2 suppression by thyroid hormone acting directly, but not through the pituitary system Mol Pharma 39,811-817
Nakachi, K , Imai, K , Hayashi, S , Watanabe, J and Kawajin, K (1991) Genetic susceptibility to squamous cell carcinoma of the lung m relation to cigarette smoking dose Cancer Res 51, 5177-5180
Nakagawa, K , Saijo, M , Tsuchida, S , Sakai, M , Tsunokawa, Y , Yokota, J , Muramatsu, M , Sato, K , Terada, M and Tew, K D (1990) Glutathione-S-transferase ir as a dereminant of drug resistance an transfectant cell lines, J Biol Chem 265, 8, 4296-4308
Nash, T (1953) The Colorimetric Estimation of Formaldehyde by means of the Hantzsch Reaction Biochem 55, 416-421
191
Nebert, D W and Gelbom, H V (1968) Substrate-inducibel Microsomal Aryl Hydrocarbon Hydroxylase in Mammaliam Cell Culture J Biol Chem Vol 243, 6242-6249
Nebert, D W (1978) Genetic differences in microsomal electron transport The Ah locus In Methods in Enzymology, Biomembranes Part C Biological Oxidations, Microsomal, Cytochrome P-450, and other Hemoprotein Systems, Vol LH, pp 226-240, Fleischer, S and Packer, L (eds) Academic Press,New York
Nebert, D W , Makamoura, M , Tukey, R H , and Metishi, M (1984) Cloning genes that encode enzymes which metabolize drugs and chemical carcinogens In Biochemical basis of chemical carcinogensis Edited by Greim, H , Jung, R , Kramer, M , Marquardt, H , and Oesch, F , Raven Press 1984
Nebert, D W and Gonzalez, F J (1987) P450 genes Structure, evolution, and regulation Ann Rev Biochem 56, 945-933
Nebert, D W , Jaiswal, A K (1987) Human Drug Metabolism Polymorphism use of recombinant DNA techniques Pharm Ther 33, 11-17
Nebert, D W , Nelson, D R , and Feyereisen, R (1989) Evolution of the Cytochrome P450 genes Xenobiotica 19, 1149-1160
Negishi, M , and Nebert, D W (1979) Structural gene Products of the Ah locus J Biol Chem 234, 11015-11023
Nemoto, N , Sakurai, J (1991) Proline is required for transcriptional control of the aromatic hydrocarbon-mducible P,450 gene in C57BL/6 mouse monolayer-cultured hepatocytes Jpn J Cancer Res 82,901-908
Nemoto, N and Sakurai, J (1991) Increase of CYP1A1 mRNA and AHH activity by inhibitors of either protein or RNA synthesis in mouse hepatocytes in primary culture Carcinogenesis 12, 2115-2121
Nhamburo, P T , Gonzalez, F J , McBnde, O W , Gelboin, H V , and Kimura, S , (1989)Identification of a new P450 expressed in human lung complete cDNA sequence, cDNA-directedexpression and chromosome mapping Biochemistry, 28, 20, 8060-8066
Nisimoto, Y , K Kinosita Jr , A Ikegami, N Kawai, Ichihara, I and Shibata, Y (1983) Possible association of NADPH-cytochrome P-450 reductase and cytochrome P-450 in the reconstituted phospholipid vesicles Biochemistry 22, 3586-3594
Odea, K , Sakaki, T , and Ohkawa, H (1985) Expression of rat liver cytochrome P450MC cDNA in saccharomycese cerevisiae DNA 4, 203-210
Okey, A B , Denison, M S , Harper, P A and Prokipcak, R D (1988) The Ah receptor First step in the mechanism of response to 3-methylcholanthrene-type chemicals in rodents and m man, In Microsomes and Drug oxidations, pp 31-38, Miners, J O , Birkett, D J , Drew, R and McManus, M (eds) Taylor & Francis, London
Okey, A B (1990) Enzyme induction in the cytochrome P-450 system Pharma Thera 45, 241-298
Omuro, T and Sato, R (1964) The carbon monoxide-bmding pigment of liver microsomes J Biol Chem 229,2379-2390
Ortiz de Montellano, P R , K L and Beilan, H S (1983) Chiral orientation of prosthetic heme in thecytochrome P-450 active site J Biol Chem 258, 45-47
192
Osech, F , Gath, I , Igarashi, T , Glatt, H , Thomas, H (1991) Role of the well-known and the recently discovered acidic GST in the control of genotoxic metabolites, in Molecular Aspects of monoxygenases and bioactivation of toxic compounds NATO Conference, Plenum Press
Paraskeva, C , Buckle, B G and Thorpe, P E (1985) Selective Sillmg of contaiminatmg human fibroblasts in epithelial cultures derived form colorectal tumours using and anti Thy-1 antibody-ncin conjugate Brit J Cancer 51, 131-134
Park, B K and Breckenndge, A M (1981) Clinical implications of enzyme induction and enzyme inhibition Clin Pharmacokinet 6, 1-24
Parke, D V , Ioanmdes, C , and Lewis, D F V (1990) The 1990 Pharmaceutical Manufacturers Association of Canada Keynote Lecture The role of the cytochromes P450 m the detoxication and activation of drugs and other chemicals Can J Physiol Pharmacol 69, 537-549
Parker, K L , Chaplin, D D , Wong, M , Seidman, J G , Smith, J A and Schunmer, B P (1985)Expression of murine 21-hydroxylase in mouse adrenal glands and in transfected Y1 adrenocortical tumor cells Proc Natl Acad Sci USA 82, 7860-7864
Pasco, D S , Boyum, K W , Merchant, S N , Chalbery, S C , Fagan, J B (1988) Transcriptional andpost-transcnptional regulation of the genes encoding cytochromes P-450c and P-450d in vivo in primary hypothecates cultures J Biol Chem 263, 8671-8676
Paulson, K E , Darnell, J E , Jr , Rushmore, T , and Pickett, C B (1990) Analysis of the upstream elements of the xenobiotic compound-inducible and positionally regulated glutathione-S-Transferase Ya gene Mol Cell Biol 10, 1841-1852
Pelkonen, Olavi andNebertsD W (1982) Metabolism ofPolycyclic Aromatic Hydrocarbons Etiologic Role in Carcinogenesis Pharm Rev 34, 189-222
Pelkonen, P , Pasanen, M , Kuha, H , Gachalyi, B , Kairaluoma, M , Sotamemi, E A , Park, S S , Fnedman, F K and Gelboin, H V (1986) The effects of cigarette smoking on 7-ethoxyresorufine O- deethylase and other momoxygenase activnties m human liver analyses with monoclonal antibodies Bnt J Clin Pharmac 22, 125-134
Perdew, G H (1988a) Association of the Ah receptor with the 90-KDa heat shock protein J Biol Chem 263, 13802-13805
Perdew, G H and Poland, A (1988b) Purification of the Ah receptor from C57BL/6J mouse liver, J Biol Chem 263, 9849-9852
Peters, M A , and Fouts, J R (1970) A study of some possible mechanisms by which magnesium activates hepatic microsomal drug metabolism in vitro J Pharma Exper Therap 173, 233-241
Peters, W H , Kock, L , Nagengast F M and Roelofs, H M J (1990) Immunodetection with a monoclonal antibody of glutathione S-transferase mu in patients with and without carcinomas Biochem Pharma 39, 3, 591-607
Peterson, D R , Atkinson, N and Hjelle, J J (1982) Increase in hepatic microsomal ethanol oxidation by a single dose of ethanol J Pharmacol Exp Thera 221, 275-281
Pickett, C B , and Lu, A Y H (1989) Glutathione S-transferases gene structure, regulation, and biological function Annu Rev Biochem 58, 747-764, 1989
193
Platt, K L , Molitor, E , Doehmer, J , Dogra, S , and Oesch, F (1989) Genetically engineered V79 Chinese hamster cell expression of purified cytochrome P-450IIB1 monooxygenase activity, J Biochem Toxicol 4, 1, 1-6
Poland, A and Knutson, J C (1982) 2,3,7,8-Tetrachlorodibenzo-/)-dioxin and related halogenated aromatic hydrocarbons Examination of the mechanism of toxicity Ann Rev Pharmacol Toxicol 22, 517-554
Poland, A , Glover, E and Taylor, B A (1987) The munne Ah locus a new allele and mapping to chromosome 12 Mol Pharmac 32, 471-478
Poulos, T L andRaag, R (1992) Cytochrome P450Mm Crystallogyraph, oxygen activation and electron transfer FASEB J 6, 674-679
Pnestman, T J (1980) In "Cancer chemotherapy - an introduction" Publishers Farmitalia Carlo Erba Ltd , 1980)
Puga, A , Raychaudhun, G , Salata, K , Zhang, Y , and Nebert D W (1990) Stable expression of Mouse cyp la l and Human CYP1A2 cDNAs transfected into mouse hepatoma cells lacking detectable P450 enzyme activity DNA Cell Biol 9, 425-436
Rannug, A , Rannug, U , Rosenkranz, H S Winqvist, L , Westerholm, R , Agurell, E and Grafstrom A K (1987) Certain photoxidized derivatives of tryptophan bind with very high affinity to the Ah receptor and are likely to be endogenous signal substances J Biol Chem 262,15422-15427
Remmer, H and Merker, H J (1983) Drug-induced changes in the liver endoplasmic reticulum association with drug-metabolizing enzymes Science 142, 1657-1658
Reyes, H , Reisz-Porszasz, S , Hankinson, O (1992) Identification fo the Ah receptor nuclear Translocator Protein (Amt) as a component of the DNA binding form of the Ah receptor Science 256, 1193-1195
Rhodes, T and Twentyman, P R (1992) A study of ethacrymc acid as a potential midifier of melphalan and cisplatin sensitivity in human lung cancer parental and drug-resistant cell lines Bnt J Cancer 65, 684-690
Riou, G , Barrois, M and Zhou, D (1991) Expression of anionic glutathione S transferase (GSTt) gene in carcinomas of the uterine cervix and in normal cervicies Bnt J Cancer 63, 191-194
Rodnques, N R , Dunham, I , Yu, C UY , Carroll, M C , Porter, R R and Campbell R D (1987) Molecular charactenzatio of the HLA-linked steroid 21-hydroxylase B gene from an individual with congenital adrenal hyperplasia EMBO J 6, 1653-1661
Ross, J , (1989) The turnover of messenger RNA 260, Sci Am 28-35
Saad, B, Schawalder, H , and Maier, P (1993) Crude hver membrane fractions as substrate preserve liver-specific functions m long-term , serum-free rat hepaocyte cultures In Vitro Cell Dev Biol 29A, 32-41
Sakaki, T , Shibata, M , Yabusaki, Y , Murakami, H , Ohkawa, H (1990) Expression in saccharomycese cemsiae o f chimeric cytochrome P450 cDNA constructed from cDNAs for rat cytochrome P450c and P450d DNA Cell Biol 9, 8, 603-614
Salmon S E , Hamburger, A W , Soehnlen, B , et al (1978) Quantitation of differential sensitivity of human tumour stem cell to anticancer drugs N Engl J Med 298, 1321-1327
194
Sambrook, J , Fntsch, E S and Mamatis, T , (1989) Molecular clomng - a laboratory manual 2nd ed Publishers Cold Spring Harbour Press
Sato, K (1988) Glutathione S-Transferase and Hepatocarcinogensis Jpn J Cancer Res 79, 556-572
Sato, K. (1989) Glutathione transferases as markers of pre-neoplasia and neoplasia, Adv Cancer Res 52, 205-255
Schuetz, E G , and Wnghton, S A , Safe, S H and Guzwlian, P S (1986) Regulation of cytochrome P~450p by phenobarbital and phenobarbital-hke inducers in adult rat hypothecates m primary monolayer culture and in vivo Biochemistry 25, 1124-1133
Seabnght,M , A rapid banding technique for human chromosomes Lancet, 2, 971, 1971
Seidegard, J , Vorachek, W R , Pero, R W and Pearson, W R (1988) Hereditary differences m the expression of the human glutathione transferase active on Trani-Stilbene oxide are due to a gene deletion Proc Natl Acal Sci USA 85, 7293-7297
Seidegard, J , Vorachek, W R , Pero, R W and Pearson, W R (1988) Hereditary differences in the expression o f the human glutathione transferase active on fra/u-stilbene oxide are due to a gene deletion Proc Natl Acad Sci USA 85, 7293-7297
Seidegard, J , Pero, R W , Markowitz, M M , Roush, G , Miller, D G , and Beattie, E J (1990) Isoenzyme(s) of glutathione transferas (class Mu) as a marker o f the susceptibility to lung cancer a follow up study Carcinogenesis 11, 33-36
Shapiro, D J , Blume, J E and Nielson, D A , (1987) Regulation of messenger RNA stability in eukaryotic cells BioEssays, 6,5, 221-226
Salmon, S E (1990) Chemosensitivity Testing Another Chapter J Natl Cancer Inst 82,82-83
Shen, E S , Whitlock, J P Jr (1989) The potential role of DNA méthylation in the response to 2,3,7,8- tetrachlorodibenzo-p-dioxin J Biol Chem 264, 17754-17758
Shimada, T , Yun, C H , Yamazaki, H , Gautier, J C , Beaune, P H and Guengench, R P (1992) Characterization of human lung microsomal cytochrome P-450 1A1 and its role in the oxidation of chemical carcinogens Mol Pharma 41, 856-864
Shiraton, Y , Soma, Y , Maruyama, H , Sato, S , Takano, A and Sato, K (1987) Immunohistochemical detection of the placental for of Glutathione S-transferase in dysplastic and Neoplastic Human Uterine Cervix lesions Cancer Res 47, 6806-6809
Singh, S V , Nair, S , Ahamd, H , Awasthi, Y C, and Knshan, A (1989) Glutathione S-transferase and glutathione peroxidase in doxorubicin-resistant munne leukemic p388 cells Brio Pharma 38, 3505- 3510
Singh, S V , Ahamad, H and Knshan, A (1990) Expression of Glutathione-related enzymes in human bladder cancer cell lines Biochemical Pharma 39, 1817-1820
Sipes, G and Gandolfi (1986) Biotransformation of toxicants In Casarett and Doulls toxicoloyg - the basic science of poisions "Toxicology" Casarett, J , Doull, J , Klaassen, C D , Amdur, M O , pp 64- 100
195
Sirica, A E , and Pitot, H C (1980) Drug metabolism and effects of carcinogens in cultured hepatic cells Pharmacol Rev 31, 205-228
Smith G L , Moss, D (1984) Vaccima Virus expression vector construction, properties and applications Bio Techniques 2, 306-312
Smith, C A D , Gough, A C , Moss, J E , Vallis, K A , Howard, G C W , Spur, N K and Wolf, C R(1991) Molecular and genetic analysis of the CYP2D6 Loocus and cancer susceptibility Cytochrome P- 450 Biochemistry and Biophysics, Proceedings of the 7th International Conference Ed Archakov, A I , and Bachamonova, G I pp 437-439
Soma Y , Satoh, K and Sato, K (1986) Purification and subunit-structural and immunological characterisation of five glutathine S-transferases in human liver, and the acidic form as a hepatic tumor marker Biochim Biophys Acta 869,247-258
Strange, R C , Matharoo, B , Faulder, G C , Jones, P , Cotton, W , Elder, J B , and Deakin, M(1991) The human glutathione S-transferase a case-control study of the incidence of the GST 1 0 phenotype in patients with adenocarcinoma Carcmogensis 12, 25-28
Suolinna, E M (1982) Isolation and culture of liver cells and their use in the biochemical research of xenobiotics Med Biol 60, 237-254
Suolinna, E M , and Pitkaranta, T (1986) Effect of culture age on drug metabolizing enzymes an their induction in primary cultures of rat hypothecates Biochem Pharmacol 35, 2241-2245
Tambunm, P P , Masson, H A , Bains, S K , Makowski, R J , Moms, B and Gibson, G G (1984) Multiple forms of hepatic cytochrome P-450 purification, characterization and comparison of a novel clofibrate induced isozyme with other forms of cytochrome P450 Eur J Biochem 139, 235-246
Teicher, B A , Holden, S A , Kelly, M J , Shea, T C , Cucchi, C A , Rosowshy, A , Henner, D W and Frei HI, E (1987) Characterization of a human squamous carcinoma cell line resistant to cis- diamminedichloroplatinum(II) Cancer Res 47, 388-393
Teifeld, R M , Fagan, J B and Pasco, D, S (1989) Transient supennducibility of cytochrome P450c (CYP1A1) mRNA and Transcription DNA 8, 329-338
Thomsen, J S , Nissen, L , Stacey, S N , Hines, R N and Autrup, H (1991) Differences m 2,3,7,8- tetrachlorodibenzo-p-dioxin-inducible CYP1A1 expression in human breast carcinoma cell lines involve altered ira/is-actmg factors Eur J Biochem 197, 577-582
Tidefelt, U , Elmhom-Rosenborg, A , Paul, C , Hao, X-Y , Mannervik, B , and Eriksson, L C (1992) Expression of glutatione Transferase Pi as a predictor for treatment results at different stages of Acute Nonlymphoblastic Leukemia Cancer Res 52, 3281-3285
Towbm, H , et a l , Proc Natl Acad Sci U S A , 76, 4350-4354, 1979
Townsend, A J , Tu, C-P, D and Cowan, K H (1992) Expression of human piora closs GST in stably transfected human MCF-7 breast cnacer cells Effect on cellular sensitivity to cytotoxic agents Mol Pharma 41,230-236
Tsuchida, S and Sato, K (1992) Glutathione Transferases and Cancer Cnt Rev Biochem Mol Biol 27, 337-384
Tukey, R H, Lalley, P A and Nebert, D W (1984) Localization of cytochrome P,-450 and P3-450 genes to mouse chromosome 9 Proc Natl Acad Sci USA 81,3163-3166
196
Tukey, R H , Okino, S , Pendurthi, U R , Johnson, E F , Quattrochi, L (1988) Differential regulation of human cytochrome P450 genes In Microsomes and Drug Oxidations 55-62, Miner, J 0 , Birkett, D J , Drew, T and Me Manus, M (eds) Taylor & Francis, London
Tuteja, N , Gonzalez, F J and Nebert, D W (1985) Development and tissue-specific differential regulation of the mouse dioxm-inducible P,450 and P3450 genes Develop Biol 112, 177-184
Unger B P , Gunsalus, I C and Sligar, S G (1986) Nucleotide sequence of the Pseudomonas putida cytochrom P450CJim gene and its expression in Escherichia coll J Biol Chem 261,1158-1163
Vandenberghe, Y , Tee, L , Morel, F , Rogiers, V , Guillouzo, A and Yeoh, G (1991) Regulation of glutathione S-transferase gene expression by phenobarbital m cultured adult rat hepatocytes FEBS letts 284, 103-108
Verger6s , G , Winterhalter, K H , Richter, C (1989) Microsomal Cyto P-450 Substrate binding, membrane interactions, and topology Mutation Res 213, 83-90
Vescio, R A , Connors, K M , Bordin, G M , Robb, J A , Youngkin, T , Umbreit, J N and Hoffman, R M (1990) The Distinction of Small Cell and Non-Small Cell Lung Cancer by Growth in Nativie-State Histoculture Cancer Res 50, 6095-6099
Voigt, J M , Kawabata, T T , Burke, J P , Martin, M V , Guengench, T P , and Baron, J (1990) In situ localization and distribution of xenobiotic-activating enzymes and aryl hydrocarbon hydroxylase activity m lungs of untreated rate Mol Pharma 37, 182-91
Volm, M , Mattem, T and Samsel, B (1991) Over espression of P-glycoprotein and GST it in resistant non-small cell lung carcinomas of smokers Bnt J Cancer 64, 700-704
Von Hoff, D D (1990) He’s Not Going to Talk About In Vitro Predictive Assays Again, Is He? J Natl Cancer Inst 82, 96-101
Von Hoff, D D , Sandbach, J F , Clark, G M , Turner, J N , Forseth, B F , Piccart, M J , Colombo, N and Muggia, F M (1990) Selection of Cancer Chemotherapy for a Patient by and In Vitro Assay Versus a Clinician J Nad Cancer Inst 82,110-116
Waithe, W I , Trottier, Y , Labbe, D , and Anderson, A (1986) Aryl hydrocharbon hydroxylase activity and cytochrome P,450 gene expression in newly established human lymphoblastoid lines Biochem Pharmacol 35, 2069-2072
Wang, Y, Teicher, B A , Shea, T C , Holden, S A , Rosbe, K W , Al,-Achi, A and Henner D W (1989) Cross-resistance and GST it levels among four human melanoma cell lines selected for alkylating agent resistance Cancer Res 49, 6185-6191
Watkins, P B , Wnghton, S A , Schuetz, E G , Maurel, P and Guzelian, P S (1986) Macrolide antibiotics inhibit the degradation of the glucocorticoid-responsive cytochrome P-450p in rat hepatocytes in vivo and in primary monolayer culture J Biol Chem 261, 6264-6271
Watson, A J , Weir-Brown, K I , Bannister, R M , Chu, F F , Reisz-Porszasz, S , Fujn-Kunyama, T , Sogawa, K and Hankinson, O (1992) Mechanism of action fo a repressor of dioxm-dependent induction of Cyplal gene transcription Mol Cell Biol 12,2115-2123
Waxman, D J , Dannan, G A and Guengench, F P (1985) Regulation of rat hepatic cytochrome P-450 age-dependant expression, hormonal impnnting and xenobiotic mducibility of sex-specific isoenzymes Biochemistry 24, 4409-4417
197
Waxman, D J , LeBlanc, G A , Momssey, J J , Stauton, J and Lapenson, D P (1988) Adult male- specific and neonatally programmed rat hepatic P450 forms RLM2 and 2a are not dependent on pulsatile plasma growth hormone for expression J Biol Chem 263, 11396-11406
Waxman, D J , Attisoano, C , Guengench, F P , and Lapenson, D P (1988) Human liver microsomal steroid metabolism identification of the major microsomal steroid hormone 6 0-hydroxylase cytochrome P450 enzymes Archs Biochem Biophys 263, 424-436
Waxman, D J , Lapenson, D P , Momssey, J J , Park, S S , Gelbom, H V , Doehmer, J , and Osech, F (1989) Androgen hydroxylation catalysed by a cell line (SD1) that stable expresses rat hepatic cytochrome P-450 PB (IIB1) Biochem J 260, 81-85
Waxman, D J (1990) Glutathione S-Transferase Role in Alkylating Agent Resistance and Possible Target for Modulation Chemotherapy - Review Cancer Res 50, 6449-6454
Wen, L P , Ruettinger, R T , and Fulco, A J (1989) Requirement for a 1-kelobase 5’flanking sequence for barbiturate-inducible expression of the cytochrome P-450bM 3 gene in Bacillus megatenum J Biol Chem 264, 19, 10996-11003
Wheater, P R , Burkitt, H G , Steven, A and Lowe, J S , (1985) Neoplasia Basic histopathology, A colour adas and text Chapter 6 Publishers Church Livingstone
White, R E and Coon M J (1980) Oxygen activation by cytochrome P-450, Annu Rev Biochem 49, 315-356
Whidock,J P Jr , Cooper, H L and Gelbom, H V (1972) Aryl hydrocarbon (benzp[a]pryene) hydroxylase is stimulated in human lymphocytes by mitogens and benz[a]anthracene Science 177, 618- 619
Whitlock,! P Jr , Demson, M S , Fisher, J M , Shen, E S (1989) Induction fo Hepatic Cytochrome P450 Gene Expression by 2,3,7,8-Tetrachlorodibenzo-p-dioxin Mol Biol Med 6,169-178
Wiebel, F J , Park, S , Kiefer, F and Gelbom, H V (1984) Expression of Cytochrome-P450 in rat hepatoma cells Eur J Biochem 145, 455^462
Wilbur, S W , Camacho, E S , Hilliard, D A , Dill, P L and Weisentahal, L M (1992) Chemotherapy of non-small cell lung carcinoma guided by and in vitro drug resistance assay measuring total tumour cell kill Brit J Cancer 65, 27-32
Williams, R T (1947) Detoxication mechanisms - The metabolism and detoxication of drugs, toxic substances and other organic compounds Chapman and Hall, London
Wolf, C R , Miles, J S , Gough, A , and Spurr, N K (1990) Molecular genetics of the human cytochrome P450 system Biochem Soc Trans 18, 21-24
Wolf, C R (1991) Individuality in cytochrome P450 expression and its association with the nephrotoxic and carcinogenic effects of chemicals I ARC, Sci Pub 115,281-287
Yabusaki, Y , Shimizu, M , Maurakami, H , Nakamura, K , Oeda, K , and Ohkawa, H (1984) Nucleotide sequenc of a full-lenghtcDNA coding for 3-methylcholanthrene-induced rat liver cytochrome P-450MC Nucl Acids Res 12,2929-2938
198
Yabuski, Y , Murakami, H and Ohkawa, H (1988) Primary structure of Saccharomyces cervisiae NADPH-cytochroem P450 reductase deduced from nucleotide sequence of its cloned gene J Biochem 103, 1004-1010
Yamada, S , Deguchi, T , Nezasa, S Tamala, M , Shara, H , Okano, M , Kawada, Y (1992) Study on chemosensitivity test of urogenital tumors by ATP assay Nippon Hinyokika Gakkai Zasshi, (Japan) 83,20022-20028Yamamoto, S , Kusunose, E , Ogita, D , Kaku, M , Ichihara, K and Kusunose, M , (1984) Isolation of cytochrome P-450 highly active prostaglandin w-hydroxylation from lung microsomes of rabbits treated with progesterone J Biochem 96, 593-603
Yamano, S , Nhamburo, P T , Aoyama, T , Meyer, U A , Inaba, T , Kalow, W , Gelboin, H V , Me Bride, W O , Gonzalez, F J (1989) cDNA Cloning and sequence and cDNA-Directed Expression of Human P450 IIB1 Identification of a Normal and Two Variant cDNAs Derived from the CYP2B Locus on Chromosome 19 and Differential Expression of the IIB mRNAs in Human Liver Biochemistry 28, 7340-7348
Yamano, S , Nagata, K , Yamazoe, Y , Kato, R , Gelbion, H V , and Gonzalez, F J (1989) cDNA and deduced amino acid sequences fo human P450 IIA3 (CYP2A3) Nucl Acids Res 17, 12, 4888
Yamashita, Y , Nara, N and Aoki, N (1989) The Effects of Vincristine and Doxorubicin on the Clonogemc Cell of a Human Lung Cancer Cell Line in Methylcellulose and Suspension Culture Jpn J Cancer Res 80, 277-282
Yamaue, H , Tammura, H , Noguchi, K , Hotta, T , Tam, M , Tsunoda, T , Iwahashi, M , Tamai, M , Iwakura, S (1992) Chemosensitivity testing of fresh human gastnc cancer with highly purified tumour cells using the MTT assay Brit J Cancer 66, 794-799
Yamazoe, Y , Shimada, M , Murayama, N and Kato, R (1987) Suppression of livels of Phenobarbital- mduced rat liver cytochrome P-450 by pituitary hormone J Biol Chem 262, 7423-7428
Yamazoe, Y , Murayama, N , Shimada, M , Yamauchi, K , Nagata, K , Imaoke, S , Funae, Y and Kato, R (1988) A sex specific form of cytochrome P-450 catalyzing propoxycoumann O-depropylation and its identity with testosterone 66-hydroxylase in untreated rat livers reconstitution of the activity with microsomal lipids J Biochem 104, 739-734
Yang, Hsueh-Ying L , Zelus, B D , Juchau, M R (1991) Organogensis-stage cytochrome P450 isoforms Utilization fo PCR for Detection fo CYP1A1 mRNA in rat conceptal tissues Biochem and Biophy Res Comm 178, 236-241
Yang, W Z , Begleiter, A , Johnston, J B , Israels, L G and Mowat, M R A (1992) Role of Glutathione and glutathione S-transferase in chlorambucil resistance Mol Pharma 41, 625-630
Yanagida, A , Sogawa, K , Yasumoto, K , and Fujn-Kunyama, Y (1990) A novel cis-acting DNA element required for a high level of inducible expression of the rat P-450c gene Mol Cell Biol 10, 1470-1475
Zacharewsla, T , Hams, M and Safe, S (1989) Induction of Cytochrome P450-Dependent Monooxygenase Activities in Rat Hepatom H-4-1 IE Cells in Culture by 2,3,7,8,-Tetraclhlorodibenzo-p- Dioxin and Related Compounds Mechanistic Studies Using Radiolabeled Congener Arch Biochem Biophy 272, 344-355
Zuber, M X , Simpson, E R Waterman, M R (1986) Expression of bovine 17ahydroxylase cytochrome P-450 cDNA in non-stenodogemc (COS) cells Science 234, 1258-1261
199
i

Zuber M X , Mason, J I , Simpson, E R , Waterman, M V (1988) Simultaneous transfection of COS 1 cells with mitochondrial and microsomal steroid hydroxylase incorporation of steroidogenic pathway into nonsteroidogemc cells Pro Natl Acad Sci USA 85, 699-703
200