Embed Size (px)
Citation preview

Investigation on Geotechnical
Engineering Properties of Coal
Mine Spoil Subjected to
Slaking
David Vosolo
Principle supervisor: Dr Chaminda Gallage
Associate supervisor: Dr Jay Rajapakse
Submitted in fulfilment of the requirements for the degree of
Master of Engineering (Research)
SCHOOL OF CIVIL ENGINEERING & BUILT ENVIRONMENT
SCIENCE AND ENGINEERING FACULTY
QUEENSLAND UNIVERSITY OF TECHNOLOGY
2017

i
Keywords
Keywords: Coal Mine Spoil, Slaking, Slaking Chamber, Testing, Shear Strength,
Permeability, Large Direct Shear, Soil Water Characteristic Curve, Grain Size
Distribution

ii
List of Publications
(1) Gallage, C., Mostafa G., Vosolo, D., and Rajapakse, J. (2016) A new
laboratory model of a slaking chamber to predict the stability of on-site coal mine
spoil, International Journal of GEOMATE, 10(22), pp. 2065-2070
(2) Gallage, C., Mostofa, G., Vosolo, D., and Rajapakse, J. (2015)
Laboratory investigation on the effects of overburden pressure, water, and time on
slaking induced material property degradation of coal mine spoil. In Hossain, Zakaria,
Kobayashi, Akira, & Inazumi, Shinya (Eds.) Geotechnique, Construction Materials
and Environment, The Geomate International Society, Osaka, Japan, pp. 395-400.

iii
Abstract
This research project has led to the development of a new approach to assess the
saturated and unsaturated properties of soil material subjected to slaking. Coal mine
spoil was collected from a coal mine in North Queensland, then first subjected to
slaking in laboratory designed slaking chambers. The most common slope failure of
spoil piles was observed when the mine strip was filled with water and then dewatered,
specifically a drop in the water level at the base of a slope from the dewatering process.
As most of these slope failures can be caused at the base of the slope this research
looks exclusively at category-3 material since it is used in the base of the coal mine
spoil piles.
The spoil material was first compacted into a slaking chamber to achieve dry
unit weight of 18kN/m3 which is the typical unit weight of spoil piles in the mine where
the material was collected. The spoil was then saturated and subjected to different
confining pressures (e.g.: 300kPa, 600kPa, 900kPa) and maintained for 12 months. To
mimic the conditions occurring in the field one additional test was conducted at
900kPa overburden pressure for 4 months, but under a cyclic saturation. Cyclic
saturation was chosen to see if a wetting and drying period would influence the mine
spoil slaking.
The results indicate that material slaking was occurring due to saturation and
overburden pressure, and that constant saturation along with overburden pressure
resulted in a larger vertical deformation of the slaking chambers (which is indicative
of slaking).
It is clear from these results that permeability constantly decreases as slaking
increases which can introduce a problem that is all too common in mine spoil failures,
where a drop in the water level at the base of a slope from the dewatering process.
External water pressure acting on the lower part of a slope provides a stabilizing effect.
If the water level drops, the stabilizing influence is reduced and the shear stress within
the soil increases. When this occurs rapidly, and the pore pressures within the slope do
not decrease in concert with the drop in the outside water level due to the increased
permeability, the slope becomes less stable. This condition is called rapid drawdown

iv
or sudden draw-down, and is exacerbated by the fact that the mine spoil primary
material properties, which it has been designed to have, changed as slaking has
occurred. If dewatering is needed, a specific rate of dewatering can be nominated and
the corresponding permeability can be extrapolated. This will have a substantial
benefit to the mining operations with distinctive interest associated to safety of the
mine spoil slopes, limiting failures to protect workers, equipment, and operational
costs.
.
v
Table of Contents
Keywords .................................................................................................................................. i
List of Publications .................................................................................................................. ii
Abstract ................................................................................................................................... iii
List of Figures ........................................................................................................................ vii
List of Tables ............................................................................................................................x
Statement of Original Authorship ........................................................................................... xi
Acknowledgements ................................................................................................................ xii
Chapter 1: Introduction ...................................................................................... 1
1.1 Background .....................................................................................................................1
1.2 Aim and Objectives ........................................................................................................4
1.3 Significance of the Study ................................................................................................4
1.4 Scope of Research Project ..............................................................................................5
1.5 Thesis Structure ..............................................................................................................5
Chapter 2: Literature Review ............................................................................. 7
2.1 Introduction ....................................................................................................................7
2.2 Mine Spoil Pile Failures and Failure Mechanisms .........................................................7
2.3 Properties of Mine Spoil and their Determination ........................................................11
2.4 Laboratory Testing of Soil Water Characteristic Curves ..............................................14
2.5 Stability Analysis of Mine Spoil Piles ..........................................................................18
2.6 Counter Measures to Minimise Risk of Failure of Mine Spoil Piles ............................19
2.7 Summary .......................................................................................................................20
Chapter 3: Research Methodology ................................................................... 21
3.1 Introduction ..................................................................................................................21
3.2 Methodology .................................................................................................................21
3.3 Apparatus Used in this Research ..................................................................................23
3.3.1 Slaking Chamber ................................................................................................23
vi
3.3.2 Triaxial Apparatus ..............................................................................................25
3.3.3 Direct Shear Apparatus.......................................................................................26
3.3.4 Soil Water Characteristic Curve .........................................................................28
3.3.5 Constant Head Permeability ...............................................................................30
3.4 Material .........................................................................................................................31
Chapter 4: Results and Discussion ................................................................... 34
4.1 Introduction ..................................................................................................................34
4.2 Effects of Overburden Pressure on Coal Mine Spoil Slaking.......................................35
4.3 Basic Geotechnical Properties of Slaked Coal Mine Spoil ...........................................37
4.4 Shear Strength Properties of Slaked Coal Mine Spoil ..................................................40
4.4.1 Triaxial Tests ......................................................................................................41
4.4.2 Direct Shear Tests Results ..................................................................................47
4.5 Hydraulic Conductivity of Slaked Coal Mine Spoil .....................................................51
4.6 Soil Water Characteristic Curves (SWCCs) of Slaked Coal Mine Spoil ......................52
Chapter 5: Conclusions and Recommendations ............................................. 54
5.1 Conclusions ..................................................................................................................54
5.2 Recommendations.........................................................................................................56
References ................................................................................................................. 57

vii
List of Figures
Figure 1-1 Typical Open Cut Mine Cross Section (Okagbue, 1981) ........................... 2
Figure 1-2 Typical Spoil Characterization (J. V. Simmons & McManus, 2004) ........ 3
Figure 2-1 Damaged Zones in the Critical State (El-Zafrany, 1997) ........................... 8
Figure 2-2 Contour Plot of the Effective Strain of the Slope in the Critical State (El-
Zafrany, 1997) .............................................................................................................. 8
Figure 2-3 Open Cut Mine Failure (Kasmer et al., 2006) ............................................ 9
Figure 2-4 FEM Mine Spoil Failure (Kasmer et al., 2006) .......................................... 9
Figure 2-5 Side View of Model (Manesh, 1983) ......................................................... 9
Figure 2-6 Modes of Main Slope Failures (Forward, 2002) ...................................... 10
Figure 2-7 Large Direct Shear Machine (Bradfield et al., 2013) ............................... 12
Figure 2-8 Estimated Values of Displacement in x, y and z Directions (Shu, 2014) 13
Figure 2-9 Column Testing Apparatus (Lins et al., 2009) ......................................... 15
Figure 2-10 Modified Pressure Plate Apparatus (Lins et al., 2009)........................... 15
Figure 2-11 Schematic Details of Experiment Setup (Roshani & Sedano, 2016) ..... 16
Figure 2-12 Oedometer-type Pressure Plate SWCC Apparatus (Perez-Garcia et al.,
2008) .......................................................................................................................... 17
Figure 2-13 Low-Suction SWCC Device (Li et al., 2009) ........................................ 17
Figure 2-14 Dynamic Water Characteristic Curve Apparatus (Rassam & Williams,
2000) .......................................................................................................................... 18
Figure 3-1 Cyclic Saturation ...................................................................................... 22
Figure 3-2 Pressure Cell Saturation ........................................................................... 24
Figure 3-3 - Cross Section of Pressure Cell ............................................................... 24
Figure 3-4 Triaxial Apparatus .................................................................................... 26
Figure 3-5 Large Direct Shear.................................................................................... 27

viii
Figure 3-6 Large Direct Shear Boxes......................................................................... 28
Figure 3-7 SWCC Apparatus with Control Panel ...................................................... 28
Figure 3-8 - Cross Section of SWCC Apparatus ....................................................... 29
Figure 3-9 Constant Head Permeability Apparatus ................................................... 31
Figure 3-10 Schematic Diagram of Constant Head Permeability Apparatus ............ 31
Figure 3-11 Fresh Material......................................................................................... 32
Figure 3-12 Fresh Sample Sieve Analysis ................................................................. 33
Figure 4-1 Vertical Deformation of Spoil Over Time Under Constant Overburden
Pressure ...................................................................................................................... 36
Figure 4-2 Vertical Deformation of Spoil Over the First 2 Hours After Applying the
Overburden Pressure .................................................................................................. 36
Figure 4-3 Particle Size Distribution of Slaked Spoil Material ................................. 38
Figure 4-4 Deviator Stress Versus Axial Strain for Fresh Sample ............................ 41
Figure 4-5 Excess Pore Pressure Versus Axial Strain for Fresh Sample ................... 41
Figure 4-6 Deviator Stress Versus Axial Strain for Sample B................................... 42
Figure 4-7 Excess Pore Pressure Versus Axial Strain for Sample B ......................... 42
Figure 4-8 Deviator Stress Versus Axial Strain for Sample C................................... 43
Figure 4-9 Excess Pore Pressure Versus Axial Strain for Sample C ......................... 43
Figure 4-10 Effective Stress Mohr’s Circle for Fresh Sample ................................... 44
Figure 4-11 Total Stress Mohr’s Circle for Fresh Sample ......................................... 44
Figure 4-12 Effective Stress Mohr’s Circle for Sample B ......................................... 45
Figure 4-13 Total Stress Mohr’s Circle for Sample B ............................................... 45
Figure 4-14 Effective Stress Mohr’s Circle for Sample C ......................................... 46
Figure 4-15 Total Stress Mohr’s Circle for Sample C ............................................... 46
Figure 4-16 Direct Shear Tests Results for Sample B Spoil ...................................... 48
Figure 4-17 Strength Envelope for Sample B ............................................................ 49
Figure 4-18 Non-Linear Shear Strength Envelopes ................................................... 51
ix
Figure 4-19 Decrease in Permeability Due to Material Slaking ................................ 52
Figure 4-20 Soil Water Characteristic Curve of Fresh Sample and Sample C .......... 53

x
List of Tables
Table 2-1 Typical Mine Spoil Strength Properties (J. V. Simmons & McManus, 2004)
.................................................................................................................................... 11
Table 2-2 Comparison of overall performance of proposed method with other one-
point methods (Chin et al., 2010) ............................................................................... 18
Table 4-1 Slaking Conditions and Sample Identification .......................................... 35
Table 4-2 Physical Properties of Slaked Spoil Samples ............................................ 39
Table 4-3 Initial Stress Conditions Maintained for Triaxial Tests ............................. 40
Table 4-4 Vertical Normal Stress Values Used in Direct Shear Tests ....................... 40
Table 4-5 Triaxial Results .......................................................................................... 47
Table 4-6 Large Direct Shear Results Using Linear Strength Envelope ................... 49
Table 4-7 Cohesion Values Obtained Considering Non-Linear Failure Envelopes .. 51

xi
Statement of Original Authorship
The work contained in this thesis has not been previously submitted to meet
requirements for an award at this or any other higher education institution. To the best
of my knowledge and belief, this thesis contains no material previously published or
written by another person except where due reference is made.
Signature: QUT Verified Signature
Date: _________________________ 31 / 07 / 2017

xii
Acknowledgements
I would like to express my gratitude to the guidance, support, and invaluable
knowledge of my supervisor Dr Chaminda Gallage and associate supervisor Dr Jay
Rajapakse. I am very thankful for their time and effort.
I would also like to express my appreciation to Glen Barnes, a senior technician
at Queensland University of Technology (QUT) for his support and assistance. I am
also very grateful to my family and partner for their unconditional support, and
encouragement that they have always shown me not only through this degree.

References 1
Chapter 1: Introduction
1.1 BACKGROUND
Open cut-mining or open-pit mining is a mining technique of extracting rock or
minerals from the earth by excavating a large pit on the surface. Open-cut mining can
be more effective than underground methods, generally recovering more than 90% of
a mineral deposit (Wali, Evrendilek, & Fennessy, 2009). The waste material generated
during the coal mining process in open-cut mines is generally piled up in the mine pit;
this is known as the mine spoil or spoil piles. Generally mine spoil is heaped with a
slope angle of 350 ~ 400 (D. J. Williams, 2001) to reduce operational cost and
environmental foot print.
There are economic regards and significances to consider when endeavour to
understand the importance of the height and slope of coal mine spoils. For high value
commodities such as coking-coal, economic depths in excess of 275 metres are
currently underway in Australian coal mines, with plans to progress to 350m,
potentially reaching heights of up to 450m (Bradfield, Simmons, & Fityus, 2013).
There are several reasons why financially higher spoil piles are more efficient. In open-
pit and underground mining, areas where mine spoil is dumped can be limited and cost
large amounts of money. Size of mine location is a major constraint, as companies are
forced to contain all work to within a section of land. Forcing mine spoil piles to reach
maximum sizes and potentially exceed previously understood safe heights, as shallow
coal seams are exhausted. This is especially true, considering current understandings
of the effects of height and slope angle, regarding the stability of spoil piles fall
supremely short in terms of research and comprehension. It is presently believed that
current methods of discerning the stability of high spoil piles are overestimated
(Bradfield et al., 2013). This lack of knowledge could cause economic risks in terms
of legal, operational practices and such risks cannot accurately be appraised.
In open cut coal mining or open pit coal mining spoil is heaped behind the strip
as mining begins and continuously moves forward with the strip as illustrated below
in Figure 1-1. There is a large interest in mining communities to maximise their height

References 2
and slope angle to not only minimise the foot print they take up but to ensure a higher
level of productivity (as machinery and trucks will have a smaller distance to travel
and not waste time and money by having to travel long distances between spoil dumps
and current mining areas). It can therefore be economically beneficial to increase both
spoil height and slope angle, if it is deemed safe and functional, as well as financially
productive to do so.
Figure 1-1 Typical Open Cut Mine Cross Section (Okagbue, 1981)
Coal mine spoil is categorised into four separate categories as seen in Figure 1-2;
category-1, category-2, category-3, and category-4 (J. V. Simmons & McManus,
2004). These categories are defined by the properties that the mine spoil possess, for
example category-1 is the designated term for fine grained tertiary spoil with high
plasticity. Category-2 however refers to fine grained tertiary or Permian spoil with low
plasticity or malleable properties. In the mining area where the sample has been taken
from top surface material is category-2 type material which has high concentration of
siltstone and mudstone. The foundation of spoil pile normally comprised of category-
3 or category-4 type materials. This is more stable due to the presence of stable rock
type materials like shale or limestone in higher concentrations than in category-2.
Category-1 and category-2 are therefore placed last on the spoil pile as they have a
lower strength.

References 3
Figure 1-2 Typical Spoil Characterization (J. V. Simmons & McManus, 2004)
It is well known that the shear strength of the soil must be greater than the shear
stress required for equilibrium otherwise a slope will be unstable (J Michael Duncan,
Wright, & Brandon, 2014). There are many processes that can lead to this reduction in
the shear strength. Most commonly slope failure of spoil piles is observed when the
mine strip is filled with water and is then dewatered, specifically a drop in the water
level at the base of a slope from the dewatering process.
In order to minimize operational costs, open cut mines are increasing their spoil
heights and slope angle, in an attempt to take up less land and travel less distance to
deposit the spoil material, as explained before. This will in turn lead to slope failures
occurring more often if safe limitations are not made to height and slope angles. To
create a safe design for the mine spoil pile the new decreased value of shear strength
and decreased value of permeability, must be implemented. With these new values a
safe working slope angle can be developed for a given working period and if
dewatering is needed a specific rate of dewatering can be used, which can be
extrapolated by the corresponding permeability. This will have a substantial difference
References 4
to the mining operations associated with safety of the mine spoil slopes, limiting
failures to protect workers, equipment, and operational costs
1.2 AIM AND OBJECTIVES
This research aims to develop a procedure and methodology to assess
geotechnical engineering properties of coal mine spoil subjected to slaking. This
investigation specifically considers the saturated and unsaturated properties of slaked
spoil material. The research methodology has been developed to achieve the aim
through the following objectives:
• Investigate the effects of overburden pressure and cyclic wetting-drying on
spoil slaking, along with slaking chamber modification to reduce air leaks
• Investigate shear strength properties of slaked spoil
• Investigate hydraulic properties of slaked spoil
• Investigate the soil-water characteristic properties (unsaturated properties) of
slaked spoil
1.3 SIGNIFICANCE OF THE STUDY
There is an economic and procedural need for an increase in soil heights that are
resulted in mining construction. As the increase in soil heights inevitably increase the
slope inclinations, it is important to precisely assess the behaviour of soil subjected to
slaking for safe stability assessments. The current research investigates the behaviour
of soil subjected to slaking using detailed laboratory investigation program. The results
from this study could be utilised by practitioners not only to reduce the operational
cost of running a mine site, but also to ensure safe slopes by improving the reliability
of slope stability assessments.

References 5
1.4 SCOPE OF RESEARCH PROJECT
In this study, a new laboratory apparatus (see Section 3.3.1 Slaking Chamber)
has been developed to simulate time dependent slaking of mine spoil under different
overburden pressures for fully saturated spoil materials. Using this apparatus, saturated
spoil is subjected to different overburden pressures then the slaked spoil materials are
tested for material classification, permeability, and shear strength properties to
understand the slake induced material properties and degradation of base material of
mine spoil piles. The limitations of this research are:
• The spoil material collected for this study is limited to one coal mine in
Northern Queensland.
• Only category-3 spoil material has been chosen since this is the material
placed at the bottom of the spoil pile, where a large number of failures
occur.
• Overburdened pressure was limited to 900kPa as this was the maximum
pressure allowed through the compressed air system available in the
laboratory.
• Spoil material was slaked for one year before material testing, as this
study was conducted over two year including testing time.
1.5 THESIS STRUCTURE
Chapter 1 – Begins by presenting the relevant background information followed
by establishing the aims and objectives of the research. The significance and scope of
the research subject is then outlined.
Chapter 2 – Is a review of all relevant literature surrounding the researched topic
and any gaps in existing literature reveal. These reviews are then separated into several
information categories; mine spoil pile failures and failure mechanisms, properties of
mine spoil and their determination, stability analysis of mine spoil piles, laboratory
References 6
testing of soil water characteristic curves (SWCC) and countermeasures to minimise
risk of failure.
Chapter 3 – Based on the research design and material used for the research. This
section is broken down into methodology of research, an explanation and reasoning of
laboratory equipment used, as well as apparatus designs and usage and the material
that was tested.
Chapter 4 – Underlines the results of the testing and discussions. This is split
into sections beginning with an introduction; the impacts of overburden pressure to
compress coal mine spoil to induce slaking, slaked coal mine spoil material properties,
shear strength properties of coal mine spoil due to slaking, hydraulic conductivity of
coal mine spoil due to slaking and finally soil water characteristic curve (SWCC).
Chapter 5 – Highlights the substantial elements of the study and concludes the
findings made in this research. Future research for this specific field is also discussed.

References 7
Chapter 2: Literature Review
2.1 INTRODUCTION
A literature review was conducted into mine spoil by way of understanding spoil
pile failures and failure mechanisms. This has helped to identify the causes of possible
future collapses and provided a basis for the research undertaken. The literature review
was limited to; mine spoil pile failures and failure mechanisms, properties of mine
spoil and their determination, stability analysis of mine spoil piles, laboratory testing
of soil water characteristic curves and counter measures to minimise risk of failure of
mine spoil piles. These topics have been thoroughly researched and any research gaps
are identified.
2.2 MINE SPOIL PILE FAILURES AND FAILURE MECHANISMS
A study defines popular slope failure criteria as non-convergence also known as
limit equilibrium state (Zheng, Liu, & Li, 2008). In this technique when the slope
arrives at the critical state, non-convergence would occur. The convergence is
controlled by the magnitude of the tolerance of out of balance forces and/or nodal
displacements specified by the user. Non-convergence consequently does not mean
failure of the slope. Elastic-perfectly plastic models are created by assuming that the
stress strain response can be simplified and represented as two straight lines, the plastic
zone can also intercept the slope from the toe to the top as seen in Figure 2-1, showing
damage zones were soil strength has been reduced. Another slope failure criteria
defined in the same research is ‘limit shear’ calculated by finite element method (FEM)
(Figure 2-2), which uses actual shear strength parameters by considering the condition
of elastic-perfect plasticity (Zheng et al., 2008).

References 8
.
Figure 2-1 Damaged Zones in the Critical State (El-Zafrany, 1997)
Figure 2-2 Contour Plot of the Effective Strain of the Slope in the Critical State (El-Zafrany,
1997)
The method also computes a factor of safety (FOS) which is defined as ‘‘the
factor by which the shear strength of the soil would have to be divided to bring the
slope into a state of barely stable equilibrium’’ (James Michael Duncan, 1996).
A separate study specifically for an open cut mine in Turkey showed that the
failure (seen in Figure 2-3) mode was caused predominantly because the interface
between the floor and spoil material dumped by dragline has a negligible cohesion and
is the most critical plane of weakness for spoil pile instability (Illustrated in FEM
Figure 2-4) (Kasmer, Ulusay, & Gokceoglu, 2006). The study also noted that pore
water pressure ratios (ratio between pore pressure and the total vertical stress) of about
0.25 satisfy limiting equilibrium condition and that high rainfall about one month
before the failure may be a contributing factor to the instability (Kasmer et al., 2006).

References 9
Figure 2-3 Open Cut Mine Failure (Kasmer et al., 2006)
Figure 2-4 FEM Mine Spoil Failure (Kasmer et al., 2006)
Research noted that a slope will remain stable unless a failure surface extension
appears which intersects the plane of weakness (Manesh, 1983). The study conducted
by Manesh (1983) designed a physical model and loading apparatus to create a generic
situation (shown in Figure 2-5).
Figure 2-5 Side View of Model (Manesh, 1983)

References 10
Other research has noted that serious slope instabilities are usually accompanied
by the gradual development of tension cracks behind the slope crest and measurable
displacements (Vaziri, Moore, & Ali, 2010). The main slope failure modes are plane
shear, wedge and circular failures illustrated below in Figure 2-6 (Forward, 2002).
Figure 2-6 Modes of Main Slope Failures (Forward, 2002)
The investigation by Forward (2002) supports other research stating that major
factors that influence slope stability include; mechanical properties of the rock, the
geological structure of the rock mass, groundwater and rainfall (Forward, 2002).
Small (1989) indicates that failure mechanisms consists of several components
such as failure mode, pore pressures and strength; in addition without knowing all
associated components solutions to improve stability may not be realized (Small,
1989). This research looked at soft sedimentary rock in highwalls.
One research by Okagbue (1981) reviewed past mine spoil pile failures in an
attempt to determine types and causes of slope instability. The study carried out in the
Appalachian Plateau region reviewed failures across three mine sites presenting

References 11
reasons for the failures as; interaction of geomorphologic, hydrologic, and man-
induced factors are collectively responsible for the entry and accumulation of water
within the sliding spoil. A cause for one slope failure was defined as a primary cause.
That is to say the cause was due to expansive clays within the soil; it is important to
note that the research also states that water was usually an activating agent for the
instability (Okagbue, 1981). This dissertation was however limited to three mine sites
within the same region.
2.3 PROPERTIES OF MINE SPOIL AND THEIR DETERMINATION
Basic strength properties required for slope stability analysis of mine spoil piles
can be seen in Table 2-1 for different categories (J. V. Simmons & McManus, 2004).
Issues have been raised in the same research that looks at the validly of standard shear
stress machines in the fear that samples will be overestimated, as during the diagnostic
testing oversized particles are usually excluded to accommodate the device capacity
and proposes that a Large Direct Shear Machine (LDSM) (see Figure 2-7) should be
used (Bradfield et al., 2013). The LDSM used can contain a sample of 720mm by
720mm and 520mm tall, giving the machine an advantage of little to no boundary
effect.
Table 2-1 Typical Mine Spoil Strength Properties (J. V. Simmons & McManus, 2004)

References 12
Figure 2-7 Large Direct Shear Machine (Bradfield et al., 2013)
One study that also looked at mine spoil settlement has found that the shale
portion of the spoil slaked dramatically with the effect of water infiltration, which
created an impermeable surface layer (Karem, 2005). The research was however
limited to mine spoil fill, as a result no slope stability was calculated.
An individual thesis examined the stability of a spoil pile and looked at
improving its handling and strength properties. These properties were determined on
site by use of piezocone and complimented by triaxial laboratory test. The study also
recorded mine spoil failures to enable back calculations, the impact of adding fly ash
to improve the working level and slope stability was also recorded. (Yoesoef, 1993)
Material testing of one study was extensive and listed as; tensile strength,
uniaxial compressive strength, Young’s modulus, Poisson’s ratio, cohesion, friction
angle and Hoek-Brown material constants were obtained for intact rocks (Shu, 2014).
The research then used these values to create a specific and accurate numerical analysis

References 13
for the given mine site (seen in Figure 2-8). This research only looked at large intact
rocks (known as category -4), for the material properties.
Figure 2-8 Estimated Values of Displacement in x, y and z Directions (Shu, 2014)
A lot of testing doesn’t use a large direct shear, and for gravel type material
SWCC properties are extrapolated from grain size distribution data (Fredlund, Wilson,
& Fredlund, 2002). The more important thing to note about the previous research done
on mine spoil is that it is usually taken from site as fresh or slaked. A systematic
approach is needed to measure and investigate slake induced material properties
degradation by which a controlled slaking can be carried out.
New research shown by Williams (2015) into test the mechanical behaviour of
a range of coal mine spoil types has been undertaken. The geotechnical parameter
tests included standard compaction, direct shear strength testing of dry and wet
specimens, consolidation testing of dry and wet specimens, and degradation testing on
exposure to weather. The results are then used for the development of a spreadsheet-
based model for predicting the settlement of high spoil piles of mixed composition (D.
Williams, 2015). This study does not look at the base of the spoil pile and what is
occurring but rather spoil pile material composition and its effect on settlement.

References 14
2.4 LABORATORY TESTING OF SOIL WATER CHARACTERISTIC
CURVES
There have been many researches into finding simplified methods to estimate
Soil Water Characteristic Curve (SWCC) for both coarse and fine grained soils, as the
process of determining SWCC is usually very time intensive (depending on the soils,
and method of tests). In an effort to simplify the procedure, Fredlund et al., (2002)
presented a method for estimating the SWCC from grain size distribution and volume
mass properties from the soil (Fredlund et al., 2002). It is important to note that this
study does not address the effects of stress history, particle arrangement, or confining
pressure and hysteresis. This research found that this prediction is accurate for sand
and silts, but to predict air-entry values for clays, tills, and loams from grain size
distribution undependable.
As described earlier, other research has looked at column testing (Figure 2-9)
and modifying pressure plate (Figure 2-10) for measuring SWCC. The testing
apparatus shown in Figure 2-9 used a soil column of 540mm specimen height and
305mm specimen diameter, of sand material with the use of tensiometers and time
domain reflectometry sensors to measure suction and water content at multiple depths.
While the modified pressure plate was much smaller to validate results (Lins, Schanz,
& Fredlund, 2009) having a diameter of 71mm and a sample height of 20mm, which
does limit the sample particle size considerably.

References 15
Figure 2-9 Column Testing Apparatus (Lins et al., 2009)
Figure 2-10 Modified Pressure Plate Apparatus (Lins et al., 2009)
The effect of temperature on the SWCC has also been investigated and has
shown a good comparison between the measured data and the estimated SWCC in two
samples of coarse sand and two clay soils (Roshani & Sedano, 2016). The test was
conducted by lowering a pressure cell in a bath where water temperature could be

References 16
controlled (see Figure 2-11). The effect of temperature on SWCC was predicted and
tested to prove this relationship. This research like many others only looked at fine
particles (below 1mm in diameter).
Figure 2-11 Schematic Details of Experiment Setup (Roshani & Sedano, 2016)
An oedometer type pressure plate SWCC apparatus has also been used to
measure SWCC values much like many other devices, however this type allows
simulation of overburden pressure, and tracking vertical movement (Perez-Garcia,
Houston, Houston, & Padilla, 2008). The apparatus used in this test also allows
specimens of up to 75mm in diameter and 25mm high, the largest particle size used
were greater than 9.5 for a well-grated soil. The tests were run as per Figure 2-12 where
the volume of water exiting the sample was measured on the burettes on the panel.
This however as talked about in the report can lead to an error at low pressure values
where the water in the burette can flow back into the sample, as there is no attempt to
minimise the head difference.

References 17
Figure 2-12 Oedometer-type Pressure Plate SWCC Apparatus (Perez-Garcia et al., 2008)
Water content of coarse materials change rapidly with suction, therefore it is
important to measure very low suctions ranges when conducting a SWCC of coarse
material. One study has used an axis translation technique with a modified water head
control in order to control the test at very low suctions of 0.01kPa increments (Li,
Zhang, & Li, 2009). The capable specimen size of this apparatus (Figure 2-13) is
300mm in diameter and 150mm in height, although for the purpose of the low-pressure
test sample diameter and size was reduced to 232mm and 50mm.
Figure 2-13 Low-Suction SWCC Device (Li et al., 2009)
A dynamic method for determining coarse grained material up to 1mm SWCC
has also been used where by a slow drying cycle and can be measured up to 80 kPa
with the use of tensiometer and a soil probe (Rassam & Williams, 2000). Total

References 18
specimen size of this apparatus is 100mm in diameter and 75mm tall (illustrated in
Figure 2-14) and has the advantage of easy repeatability.
Figure 2-14 Dynamic Water Characteristic Curve Apparatus (Rassam & Williams, 2000)
One study looked at the reliability and accuracy of completing a SWCC test by
only using one suction point along with basic index properties (Chin, Leong, &
Rahardjo, 2010). This research evaluated 62 soil samples (31 coarse and 31 fine) and
found that the most reliable location for this one point test was 10kPa for coarse and
500kPa for fine soils. The reliability was determined by validating the results with
other testing methods and results are shown below (Table 2-2). The results have shown
that with relative accuracy a one point test is possible for the samples testing, greatly
speeding up testing.
Table 2-2 Comparison of overall performance of proposed method with other one-point methods
(Chin et al., 2010)
2.5 STABILITY ANALYSIS OF MINE SPOIL PILES
Open-cut mine wall stability analysis has been calculated via utilising discrete
fracture networks (Elmouttie, Poropat, & Soole, 2012). This study has shown that the
fracture networks present can help predict the failure of the slope. Another study
looked closer at the ground water conditions and how they affect the stability of the

References 19
pile which then looked at finite element modelling (Surana, 1989). This research was
limited to one site with its own independent rainfall.
Traditionally, researchers have monitored the spoil pile slope for open cut coal
mines, using equipment such as a Slope Stability Radar (SSR) to analyse the
deformation (Cabrejo & Harries, 2012). However, this only depicts what is happening
on and near the surface of the spoil pile but not at the base. Research by Simmons has
been conducted to investigate extension strain fracture processes within highwalls in
Queensland mines to predict the failure process. The research looks at field monitoring
data collected by a field array, SSR and core hole property data. The data obtained
from these sources were used to create a 2D finite element code (J. Simmons, 2011).
A limited research into slope stability of a specific mine has been conducted
where material properties have been investigated of a 32 meter high cut slope and
analysed using two dimensional numerical simulation (Verma, Kainthola, Thareja, &
Singh, 2013). This study in India was limited to one single slope only. Another
research looked into new methods of testing slope stability of spoil material in open
pit mines, as the research states traditional slope stability analysis and design methods
have limitations when investigating three dimensional large scale rock slope stability
(Shu, 2014). Shu (2014) used laboratory testing along with special surveying
equipment to build a 3DEC model (numerical modelling code) with all fault geometry.
2.6 COUNTER MEASURES TO MINIMISE RISK OF FAILURE OF MINE
SPOIL PILES
Research has been targeted at the effectiveness of monitoring systems and in turn
proposed methods for evaluating the effectiveness and reliability of monitoring
systems. This is accomplished by constructing a monitoring reliability maps for the
slope by evaluating two key slope parameters; expected deformation to failure and
critical reading frequency (Vaziri et al., 2010). Forward (2002) discusses thirteen
different methods of monitoring slope stability and broadly classifies them as
instrumentation techniques and observational techniques.
One study monitored both ground and surface water systems in an attempt to
protect the open cut mine from ground water inflow (Polomcic & Bajic, 2015). The

References 20
results from this study may be used to develop effective dewatering system by using
numerical analysis. This research was only focused on keeping water out of the mine
site under three different scenarios, but not for conditions of dewatering after the mine
has been filled.
A more recent research has looked at an open pit mine in Mississippi with
regards to ground water. They have implemented prefabricated vertical drains (PVD)
to increase the stability (Jover, 2012). The PVD’s have been inserted into the layers
below the spoil dragline bench, identified as the critical layer. There have also been
studies to review different filling methods of the spoil pile to increase the strength
(Hume, 1997). However; these filling methods have been aimed mainly at reducing
costs not strengthening spoil piles.
2.7 SUMMARY
The literature review has analysed multiple resources on the main topics of; mine
spoil pile failures and failure mechanisms, properties of mine spoil and their
determination, stability analysis of mine spoil piles, laboratory testing of soil water
characteristic curves and counter measures to minimise risk of failure of mine spoil
piles. There have been many reports and indeed material testing on coal mine spoil,
however, some of the studies are incomprehensive. The most important aspect of slope
stability is the material, most of these studies look at the material after a failure has
occurred or taken from the site as fresh or slaked for an unknown period, pressure, and
other constraints. A systematic approach is needed to measure and investigate slake
induced material properties degradation by which a controlled slaking can be carried
out. Numerous material testing of mine spoil testing doesn’t use a large direct shear
box for the calculation of shear properties. Also for gravel type material SWCC
properties are usually over looked and extrapolated from grain size distribution data if
at all. By addressing these research gaps, it will lead to reduced operational costs for a
mine site and most importantly ensuring less slope failures and an overall higher level
of mine safety.

References 21
Chapter 3: Research Methodology
3.1 INTRODUCTION
This research project aims to develop methods which assist in evaluating the
saturated and unsaturated properties of soil material subjected to slaking. In this
research, coal mine spoil collected from a coal mine in North Queensland was first
subjected to slaking in laboratory designed slaking chambers under different loading
conditions. The slaked material was first tested for saturated properties by using
equipment commonly used in most geotechnical laboratories. The key unsaturated
property “Soil-Water Characteristic Curve – SWCC” was obtained using a newly
designed apparatus.
The research design consists of two components: overall research methodology
and description as well as testing procedure of apparatus used in this research project.
In addition to research design, this chapter also deals with the test materials used in
the research and presents the results of preliminary material characterization carried
out for the testing material.
3.2 METHODOLOGY
To achieve the objectives of this research, the following steps were undertaken;
Step -1:
Spoil material collected from a coal mine in North Queensland was subjected to
slaking in a slaking chamber. The spoil material was first compacted into the slaking
chamber to achieve dry unit weight of 18kN/m3 which is the typical unit weight of
spoil piles in the mine where the material was collected. The spoil was then saturated
and subjected to different confining pressures (of 300kPa, 600kPa, 900kPa) and
maintained for 12 months. Once again to mimic extreme field conditions one of the
tests was conducted at 900kPa overburden pressure for a period of 4 months under a
cyclic water saturation regime. Cyclic saturation was chosen to see if a wetting and
drying period would influence the mine spoil slaking, and as such the material from
the cyclic saturation was used for sieve analysis. To achieve this cyclic saturation the

References 22
sample was loaded in the Pressure Cell in a similar manner to other tests, however
after a month of constant saturation both water pipes were disconnected to the water
tank and left open for another month. This cycle was continued as illustrated below in
Figure 3-1.
Figure 3-1 Cyclic Saturation
Step -2:
All slaked samples were subjected to numerous types of testing. The
classification tests that were conducted included grain size distribution (AS 1289.3.6.1
(Australian Standards, 2009b) washing method was followed) which was a measure
of individual particle sizes within the sample. Atterberg limits examine water content
and subsequent changes in consistency and behaviours within the sample. These
behaviours are defined by the following conditions; liquid limit (AS 1289.3.9.1
(Australian Standards, 2015)), plastic limit (AS 1289.3.2.1 (Australian Standards,
2009a)), shrinkage limit (AS 1289.3.4.1 (Australian Standards, 2008)) and plasticity
index.
Step -3:
The slaked samples were also subjected to shear strength tests using the Triaxial
apparatus under undrained conditions at three different confining pressures to
investigate the cohesion of the soil and the friction angle. The large direct shear
apparatus under saturated conditions, which also assesses shear strength properties.

References 23
Step -4:
Another type of material property that the slaked samples underwent included
constant head permeability testing which examines the porosity of the given samples
defined in section 3.3.5.
Step -5:
Finally, the slaked samples were tested in the Soil-Water Characteristic Curve
(SWCC) apparatus for establishing the water storage within different aspects of the
soil, using suction described in section 3.3.4.
3.3 APPARATUS USED IN THIS RESEARCH
3.3.1 Slaking Chamber
The slaking chamber consists of a clear acrylic cylinder with an internal diameter
and height of 360mm and 400mm respectively, with the wall thickness of 20mm. The
top and bottom plates (which are made out of aluminium) are fastened by eight bolts
to seal the chamber. The chamber can accommodate about 60 kg of spoil when
assuming an initial dry unit weight of 18kN/m3 and allowing room for the piston plate.
During compaction, the total sample height for 60 kg was marked and divided
evenly in ten sections on the side of the pressure cells. The dry fresh material was then
placed at 6 kg increments and more samples were added once the desired level was
reached. Since 60 kg was a very large sample this procedure ensured that individual
sections were not over compacted in the process.
It was estimated that the amount of material was more than sufficient to perform
the series of tests proposed for the spoil sample. The pressure was applied to the spoil
by controlling air pressure in the top chamber which then compressed the spoil in the
lower camber with the applied pressure. The slaking chamber underwent a
modification to limit air leaking in the top chamber by adding a latex bladder, the air
bladder works under the same principle by converting the air pressure into a force on
the piston evenly. The sample can be saturated by sending water from the bottom and
excess can freely flow through the sample and exit at the top (see Figure 3-2), this also
ensures that air pressure does not increase in the lower chamber. The consolidation of
the spoil over the period of time under the applied constant overburden pressure can

References 24
be measured directly from the linear variable differential transformer (LVDT) on the
piston shaft. This is all illustrated in Figure 3-3 below.
Figure 3-2 Pressure Cell Saturation
Figure 3-3 - Cross Section of Pressure Cell

References 25
3.3.2 Triaxial Apparatus
One of the most significant testing apparatus (see Figure 3-4) for this project is
the triaxial test used for calculating material properties. The triaxial test will quantify
the cohesion of the soil and the angle of shear resistance (friction angle) for the mine
spoil. The effect of disintegration should show a decrease in both cohesion and angle
of shear resistance as time increases.
The triaxial testing involves subjecting a cylindrical soil sample to radial stresses
(confining pressure) and controlled increases in axial stresses or axial displacements
(Geotechdata, 2010). The samples size used for these tests were 100mm in diameter
and 200mm in height. The mine spoil was placed in a mould that was connected to the
base of the triaxial, where they could be compacted to the required unit weight of
18kN/m3. The mould also held the latex membrane and lower porous disc, the upper
porous disc is then placed after compaction and the sample is loaded into the triaxial
cell, where the upper plate is attached to the specimen. The cell is filled with water
and the confining pressure is controlled by the increase of this water pressure that
surrounds the specimen. The axial strain/stress is transferred to the specimen by
controlling the actuator that is connected to the top of the specimen. The specimen can
be saturated by the air-water interface, where pressurized air inside of a bladder
increases in a separate camber that is also full of water with a LVDT. This has been
designed so that very fine increments of water can be importantly measured, but also
pressurized.
For all the tests the various specimens were tested under un-drained conditions
following AS 1289.6.4.2 (Australian Standards, 2016). The Triaxial tests were
performed as a multi-stage test meaning three shearing stages were applied to the same
specimen with different confining pressures once again in accordance with AS
1289.6.4.2 (Australian Standards, 2016).

References 26
Figure 3-4 Triaxial Apparatus
3.3.3 Direct Shear Apparatus
The large direct shear apparatus (seen in Figure 3-5) can be set up for 150mm or
300mm shear box size (seen in Figure 3-6), however, for this research 150mm shear
box size was chosen with a height of 160mm. The apparatus also controls over burden
pressure (vertical load) by use of a hydraulic system and horizontal displacement by a
high-resolution stepper motor, with both controls having a 100kN load cell. Along
with the load cells to record data are two linear potentiometric transducers to measure
vertical and horizontal displacement. Testing procedure of the large direct shear
closely followed AS 1289.6.2.2 (Australian Standards, 1998) although the Australian
Standards only apply to small shear boxes of 60mm up to 100mm.
1. Material is oven dried and a sample is measured out so that bulk density
of 18kN/m³ is achieved. The sample once cooled is then mixed with
water up to 10% water content to allow compaction.
2. The material is placed in the shear box and is compacted in three even
layers. Once that is completed water will be introduced to the
surrounding container of the shear box (not on top of the sample) up to
the shear line to ensure that water enters the sample from the base
reducing the amount of trapped air allowing for faster saturation.

References 27
Depending on the samples permeability (minimum 3 hrs max 24hrs)
water is then filled to the top of the container (once again not on the
sample) and then left over night.
3. The test can then run as normal with different overburden pressure for
different samples with horizontal load controlled at 1 mm per minute
until a failure envelop is shown. The machine will record vertical
displacement, horizontal displacement, overburden pressure (keep at a
constant for each test perimeter) and horizontal load at the fastest record
time of six seconds.
Figure 3-5 Large Direct Shear

References 28
Figure 3-6 Large Direct Shear Boxes
3.3.4 Soil Water Characteristic Curve
The Soil-Water Characteristic Curve (SWCC) has been defined as the variation
of water storage capacity within the macro and micro pores of a soil, with respect to
suction (Zapata, 1999). The water storage between the pores of the soil material can
cause suction within the sample. The SWCC apparatus (Figure 3-7) has a control panel
and importantly a ceramic disc with an air entry value of 300 kPa.
Figure 3-7 SWCC Apparatus with Control Panel

References 29
Figure 3-8 - Cross Section of SWCC Apparatus
The process used for capturing SWCC data is detailed below and illustrated by
Figure 3-8;
1. Make sure the porous stone is saturated by removing it and place it in a vacuum
bath.
2. Place the porous stone back in the base of the apparatus and connect the first
lower half of the cell and place lower outer ring so that bolts can be tightened.
The lower cell section will provide the total filling height of 75mm (cell is
100mm in diameter) and fill sample material at desired density of 18kN/m³.
3. Place the next cell layer and next outer ring then tighten bolted section.
Saturation can now commence by forcing pressurized water from the base,
underneath the porous stone, and flushing prior to this step to ensure no trapped
air under the porous stone. Depending on sample this may take some time until
a small amount of water pools on top of the sample. It is important to note that
100% saturation cannot be guaranteed, however by saturating from the bottom
Platform for
Overburden Pressure
Air Pressure
Connection
Perforated
Loading Plate
Sample
Water
Connections
Porous Stone (High
Air Entry Value)

References 30
and having an open top (open to atmosphere 0kPa) trapped air in sample is
minimised.
4. Place the top plate onto the sample and tighten the next layer of the bolts.
Connect air pressure to the sample, linear variable differential transformer
(LVDT) and bottom water connection to a balance scale or burette. Flush
underneath the porous stone not only to remove trapped air but insure that from
the bottom of the connection to the balance scale or burette to make sure the
connecting tube is full of water, once that is completed close the value of the
other connection used for flushing.
5. The test can now begin. Increase air pressure in steps, increment of pressure
and duration of the steps, all of which is subject to the material. The value of
water leaving the sample must be recorded with respect to time.
3.3.5 Constant Head Permeability
The constant head permeability test is a common laboratory testing method used
to determine the permeability of a given sample and for this Australian Standard
1289.6.7.1. (Australian Standards, 2001) was used.
The constant head permeability test involves flow of water through a column of
cylindrical soil samples under a constant pressure difference. The test was carried out
with a purpose build permeability cell (Figure 3-9) with a diameter of 150mm. This
cell allows a maximum particle size of 20mm as per clause 4(a) in AS1289.6.7.1.
(Australian Standards, 2001) Each sample is loaded with its design unit weight of
18kN/m3. The testing apparatus is equipped with an adjustable constant head reservoir
and an outlet reservoir which allows maintaining a constant head during the test
illustrated in Figure 3-10. Water used for testing is at constant temperature and was
recorded. The permeability cell also has a weight that applies a constant surcharge of
3kPa as per clause 6(j) in AS 1289.6.7.1. (Australian Standards, 2001) During the test,
the amount of water flowing through the soil column is measured for given time
intervals.

References 31
Figure 3-9 Constant Head Permeability Apparatus
Figure 3-10 Schematic Diagram of Constant Head Permeability Apparatus
3.4 MATERIAL
Sample materials for testing have been collected from Peak Downs Coal mining
area in Winchester QLD. For the selection of sample locations, BMA & QUT team
members visited the Peak Downs open cut mining area for a site inspection from 18th
September 2013 to 20th September 2013 and identified the location for the category-
3 materials to be collected. As category-3 type spoil materials are base materials for

References 32
most of spoil foundation, it was considered that these category-3 materials to be the
substance of greatest concern in this project.
In order to understand this degradation of the mine spoil, initial spoil properties
have been taken and referred to as fresh sample, meaning that the sample has not slaked
through the load cells or other means. The material was put through a 19mm sieve to
ensure that the material diameter for all tests will be at least five times smaller than the
test apparatus diameters, to negate sampling error. This value of five times smaller was
set from the condition for the smallest testing apparatus diameter of 100mm for the
Triaxial (AS 1289.6.4.2-2016 (Australian Standards, 2016)). The material can be
initially defined as silty gravel as can be seen in Figure 3-11 and shown in the sieve
analysis below (Figure 3-12).
Figure 3-11 Fresh Material

References 33
Figure 3-12 Fresh Sample Sieve Analysis
Additionally to the standard sieve analysis which has followed AS 1289.3.6.1
(Australian Standards, 2009b) the Malvern particle size analyser was used to determine
the size distribution of the spoil material under 75 microns.
The fresh sample has a plastic limit (PL) of 22.04% and a shrinkage limit (SL)
of 4.86%. The coefficient of permeability (k) is 7.00E-06m/second and the cone liquid
limit is 34% (LL). Using these material properties the fresh spoil sample has been
classified according to Unified Soil Classification System (USCS), as well-graded -
clayey gravel (GW-GC).
0.00
20.00
40.00
60.00
80.00
100.00
120.00
0.0001 0.001 0.01 0.1 1 10 100
% F
inn
er
Sieve Size (mm)
Particle Size Distribution of Spoil Material
Fresh
References 34
Chapter 4: Results and Discussion
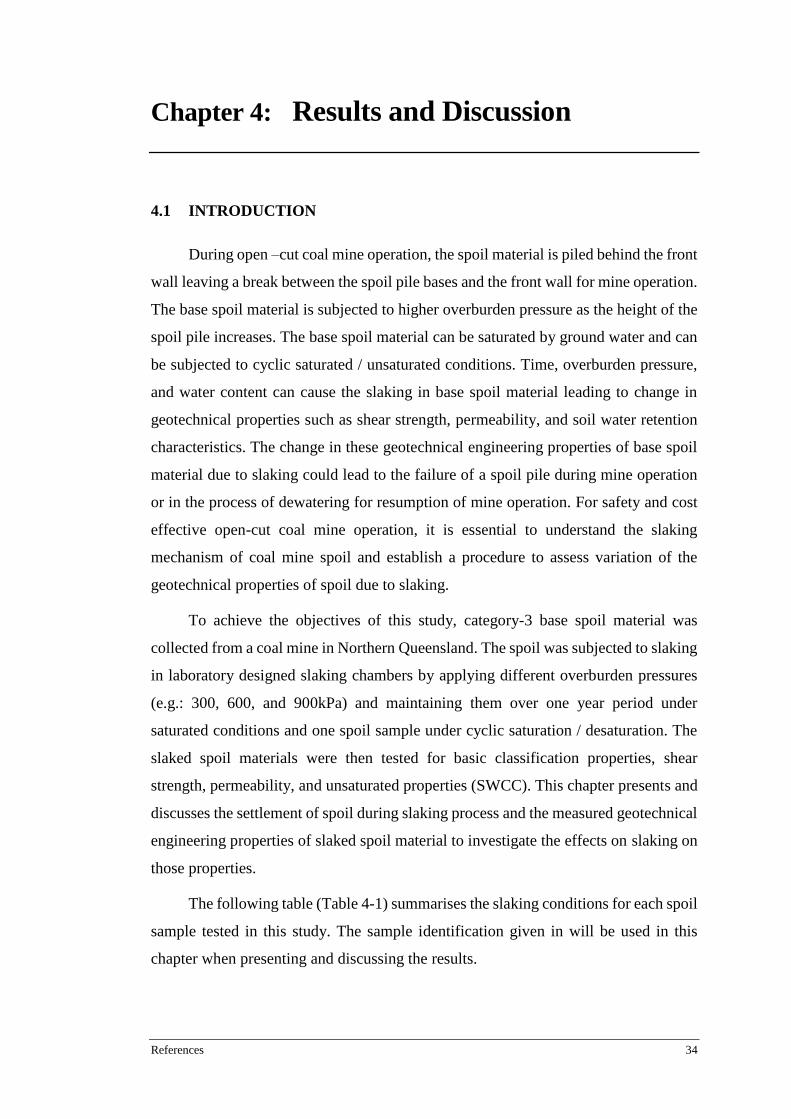
4.1 INTRODUCTION
During open –cut coal mine operation, the spoil material is piled behind the front
wall leaving a break between the spoil pile bases and the front wall for mine operation.
The base spoil material is subjected to higher overburden pressure as the height of the
spoil pile increases. The base spoil material can be saturated by ground water and can
be subjected to cyclic saturated / unsaturated conditions. Time, overburden pressure,
and water content can cause the slaking in base spoil material leading to change in
geotechnical properties such as shear strength, permeability, and soil water retention
characteristics. The change in these geotechnical engineering properties of base spoil
material due to slaking could lead to the failure of a spoil pile during mine operation
or in the process of dewatering for resumption of mine operation. For safety and cost
effective open-cut coal mine operation, it is essential to understand the slaking
mechanism of coal mine spoil and establish a procedure to assess variation of the
geotechnical properties of spoil due to slaking.
To achieve the objectives of this study, category-3 base spoil material was
collected from a coal mine in Northern Queensland. The spoil was subjected to slaking
in laboratory designed slaking chambers by applying different overburden pressures
(e.g.: 300, 600, and 900kPa) and maintaining them over one year period under
saturated conditions and one spoil sample under cyclic saturation / desaturation. The
slaked spoil materials were then tested for basic classification properties, shear
strength, permeability, and unsaturated properties (SWCC). This chapter presents and
discusses the settlement of spoil during slaking process and the measured geotechnical
engineering properties of slaked spoil material to investigate the effects on slaking on
those properties.
The following table (Table 4-1) summarises the slaking conditions for each spoil
sample tested in this study. The sample identification given in will be used in this
chapter when presenting and discussing the results.

References 35
Table 4-1 Slaking Conditions and Sample Identification
Sample ID
Overburden
Pressure
(kPa)
Period
of
Slaking
Saturation Conditions
Sample A 300 12
Months Continuous
Sample B 600 12
Months Continuous
Sample C 900 12
Months Continuous
Sample D 900 4
Months
Cyclic:
Saturated (1 Month)
Desaturated (1 Month)
Saturated (1 Month)
Desaturated (1 Month)
(Note: Fresh – Spoil material collected from a coal mine and not subjected to slaking
in the lab)
4.2 EFFECTS OF OVERBURDEN PRESSURE ON COAL MINE SPOIL
SLAKING
As explained in Chapter 3, the fresh spoil material was compacted into four
slaking chambers to achieve the dry unit weight of 18kN/m3. After saturating the spoil
compacted into slaking chambers, the materials in the first three cells (Sample A, B,
and C) were subjected to overburden pressure 300, 600, and 900 kPa, respectively, and
maintained over a period one year (12 months). Sample D was recorded for a sorter
time period and is discribed below. During this slaking period, the vertical
deformations of spoil in the chambers were continously recorded and plotted as shown
in Figure 4-1.
Vertical cell deformation was recorded over the entire twelve month test and is
illustrated in Figure 4-1. Figure 4-1 indicates a positive correlation of overburden
pressure and cell deformation. Most settlement occurred within the first 1-2 hours after
the overburden pressure was applied (between 70 and 76% settlement) as shown in
Figure 4-2, which indicates the settlement followed a mainly elastic deformation of
the material as well as the break down of material (slaking). After the initial
deformation, vertical deformation gradually increased with time at a constant rate, the
degree of deformation was larger for higher overburden pressure (the total
deforamtions were 1.7mm, 4.5mm, and 6.4mm for Sample A, B, and C repectivly for

References 36
twelve month samples). The gradual deformation increase after the initial settlement
could be a result of further material slaking (disintegration) and creep deformation of
the mine spoil.
Figure 4-1 Vertical Deformation of Spoil Over Time Under Constant Overburden Pressure
Figure 4-2 Vertical Deformation of Spoil Over the First 2 Hours After Applying the Overburden
Pressure
0
1
2
3
4
5
6
0 0.2 0.4 0.6 0.8 1 1.2 1.4 1.6 1.8 2
Ver
tica
l Def
orm
atio
n (
mm
)
Time (hrs)
Sample A Sample B Sample C Sample D
0
1
2
3
4
5
6
7
0 1000 2000 3000 4000 5000 6000 7000 8000 9000
Ver
tica
l Def
orm
atio
n (
mm
)
Time (hrs)
Sample A Sample B Sample C Sample D

References 37
The spoil in the fourth slaking chamber (Sample D) was subjected to 900 kPa
overburden pressure after saturation. After maintaining saturation for one month, the
sample was desaturated and maintained for one month. This saturation-desaturation
process was repeated over another 2 months. The vertical deformation of the soil in
the fourth cell was recorded over four-month period and are also plotted as shown in
Figure 4-1.
It is also significant to note the effect of cyclic saturation on the vertical
deformation of the sample, since cyclic was only tested for four months (seen in Figure
4-1) we must compare the deformation of the same overburden pressure with constant
saturation. The initial deformation (after 1-2 hours of loading) for Sample C and
Sample D, should be the same value since for this initial period as both samples
experienced the same overburden pressure and were both saturated. Initial deformation
of Sample D was 4.3mm at two hours compared to 5.1mm for Sample C at two hours.
This difference in vertical deformation could be attributed to compaction or sampling
error. The rate of deformation after this initial deformation (illustrated in Figure 4-2)
demonstrates all the samples deformation as a linear relationship as time is increased.
4.3 BASIC GEOTECHNICAL PROPERTIES OF SLAKED COAL MINE
SPOIL
To investigate whether the slaking process implemented in this research is
simulating the field slaking process, the grain size distributions of Sample A, B, C, D
and Fresh were obtained by combining results of sieve analysis and Malvern apparatus.
As shown in Figure 4-3, grain size distribution curves of Sample A, B, C, and D
lie on the left of the grain size distribution of “Fresh” sample suggesting slaking
(particle breakdown) in Sample A, B, C, and D compared to Fresh sample. The slaking
increases with increasing overburden pressure. The correlation is also validated by the
total deformation of the pressure cell (Figure 4-1), as total deformation is increased
sample volume is decreased representing material slaking.

References 38
Figure 4-3 Particle Size Distribution of Slaked Spoil Material
To further verify the effects of overburden pressure on spoil material slaking,
percentage of fines (particles smaller than 0.075 mm), percentage of particles greater
than 2.36 mm, D10, D30, and D50 for Fresh, Sample A, Sample B, and Sample C were
obtained from their grain size distribution curves given in Figure 4-3 and tabulated as
shown in Table 4-2. As shown in Table 4-2, compared to Fresh sample, the percentage
of fines increases and other parameters (percentage of particles greater than 2.36 mm,
D10, D30, and D50) decrease with increasing overburden pressure. These findings
suggest that these chambers can be used to slake material under controlled parameters
as the slaking appears to increase with increasing overburden pressure under saturated
conditions.
Atterberg limit tests were also conducted for these spoil samples and the results
are tabulated in Table 4-2. No significant variation in Atterberg limits can be observed
for these slaked samples. These findings suggest that the slaking does not significantly
change the mineralogy/chemical composition of fresh soil.
0.00
10.00
20.00
30.00
40.00
50.00
60.00
70.00
80.00
90.00
100.00
110.00
0.01 0.1 1 10 100
% F
inn
er
Sieve Size (mm)
Fresh Sample A Sample B Sample C Sample D

References 39
The results given in Table 4-2 display key physical properties of the mine spoil
for both slaked and un-slaked samples. The percentage of finer particles in samples
increased as the subjected overburden pressure increased. The percentage of fines
(smaller than 0.075mm) steadily increased form 7.53% (Fresh) to the slaked material
increase of Sample A by a factor of 1.7 to 12.6%, 1.9 times increase for Sample B
(14.42%), and finally 2.4 times increase for Sample C (17.87%). Basic properties of
the mine spoil conducted by testing the liquid limit, plastic limit, plasticity index or
shrinkage limit show no significant effect in terms of slaking. This can be inferred that
the fine particles that are already present in the Fresh (un-slaked) material are the same
composition as the fine particle from the slaked material (Sample A, B, C, and D). The
material properties were classified by the Unified Soil Classification System (USCS),
the Fresh sample is designated as well-graded gravel - clayey gravel (GW-GC) while
the slaked mine spoil (Sample A, B, C, and D) is denoted as clayey gravel (GC).
Table 4-2 Physical Properties of Slaked Spoil Samples
Properties Spoil Samples
Fresh Sample A Sample B Sample C Sample D
0.075mm>(%) 7.53 12.60 14.42 17.87 13.55
(%)<2.36 75.39 52.01 42.61 38.33 53.55
D10 (mm) 0.3 0.03 0.027 0.02 0.035
D30 (mm) 3 1 0.6 0.4 1
D60 (mm) 8 3.5 1.6 1.2 3.7
Coefficient of Curvature (Cc) 3.75 9.52 8.33 6.67 7.72
Coefficient of Uniformity (Cu) 26.67 116.67 59.26 60.00 105.71
Liquid Limit (%) 34.09 32.6 33 31.2 Plastic Limit (%) 22.04 19.39 22.3 23.28 Plasticity Index (%) 12.05 13.21 10.7 7.92 Shrinkage Limit (%) 4.86 4.34 4.97 4.10 USCS Classification GW-GC GC GC GC

References 40
4.4 SHEAR STRENGTH PROPERTIES OF SLAKED COAL MINE SPOIL
In order to investigate the effects of slaking on shear strength properties of the
spoil material, triaxial and direct shear tests were performed on fresh and slaked spoil
samples. The initial dry unit weight of 18kN/m3 were maintained for all test specimens.
Multi-stage consolidated undrained (CU) triaxial tests were performed on spoil
samples using initial stress conditions (just before shearing) given in Table 4-3. A
diameter of 100 mm and a height of 200 mm cylindrical specimens were in triaxial
tests.
Table 4-3 Initial Stress Conditions Maintained for Triaxial Tests
Sample ID
Stage -1 Stage -2 Stage -3
Confining
Pressure
(3) [kPa]
Backpressure
(kPa)
Confining
Pressure
(3) [kPa]
Backpressure
(kPa)
Confining
Pressure
(3) [kPa]
Backpressure
(kPa)
Fresh 350 300 400 300 450 300
Sample A No triaxial tests were conducted on Sample A spoil material
Sample B 500 300 600 300 700 300
Sample C 500 300 600 300 700 300
A series of saturated direct shear tests were performed on fresh and slaked spoil
samples using a medium size shear box (150 mm x 150 mm x 150 mm depth). Each
sample was tested under three different vertical stresses as summarised in Table 4-4.
The rate of shearing was controlled at 1 mm per minute until a failure envelop
developed.
Table 4-4 Vertical Normal Stress Values Used in Direct Shear Tests
Test No
Sample ID
Fresh Sample A Sample B Sample C
1 300 100 200 300
2 600 200 400 600
3 900 300 600 900

References 41
4.4.1 Triaxial Tests
Figures 4-4 to 4-9 depict the results obtained during shearing of multi-stage CU
triaxial tests on Fresh, Sample B, and Sample C, respectively. Each of these figures
has two parts: (a) – Deviator stress vs Axial strain and (b)- Excess pore-water pressure
vs Axial strain. For each graph, the peak deviator stress was considered as failure and
the failure deviator stress and the pore-water pressure at failure were obtained.
Figure 4-4 Deviator Stress Versus Axial Strain for Fresh Sample
Figure 4-5 Excess Pore Pressure Versus Axial Strain for Fresh Sample
0.0
50.0
100.0
150.0
200.0
250.0
300.0
350.0
0.00 2.00 4.00 6.00 8.00
De
viat
or
Stre
ss (
kPa)
Axial Strain (%)
σ3 = 350kPa
σ3 = 400kPa
σ3 = 450kPa
-10
0
10
20
30
40
50
60
70
0.00 2.00 4.00 6.00 8.00
Exce
ss P
ore
Pre
ssu
re (
kPa)
Axial Strain (%)
σ3 = 350kPa
σ3 = 400kPa
σ3 = 450kPa

References 42
Figure 4-6 Deviator Stress Versus Axial Strain for Sample B
Figure 4-7 Excess Pore Pressure Versus Axial Strain for Sample B
0
50
100
150
200
250
300
350
400
450
500
0 2 4 6 8
De
viat
or
Stre
ss (
kPa)
Axial Strain (%)
σ3 = 500kPa
σ3 = 600kPa
σ3 = 700kPa
-50
0
50
100
150
200
250
0 2 4 6 8
Exce
ss P
ore
Pre
ssu
re (
kPa)
Axial Strain (%)
σ3 = 500kPa
σ3 = 600kPa
σ3 = 700kPa

References 43
Figure 4-8 Deviator Stress Versus Axial Strain for Sample C
Figure 4-9 Excess Pore Pressure Versus Axial Strain for Sample C
Mohr circles were drawn for each sample in terms of effective and total stresses
at failure to determine drained (c’ and ’) and undrained (ccu and cu) shear strength
parameters. Figures 4-10 to 4-15 show the Mohr circles drawn for Fresh, Sample B,
and Sample C, respectively. Each of the above figures has two parts: (a) Mohr circles
in terms of total stresses and (b) Mohr circles in terms of effective stresses.
-100
0
100
200
300
400
500
600
700
800
900
0 2 4 6 8
De
viat
or
Stre
ss (
kPa)
Axial Strain (%)
σ3 = 500kPa
σ3 = 600kPa
σ3 = 700kPa
-20
0
20
40
60
80
100
120
140
160
180
200
0 2 4 6 8
Exce
ss P
ore
Pre
ssu
re (
kPa)
Axial Strain (%)
σ3 = 500kPa
σ3 = 600kPa
σ3 = 700kPa

References 44
Figure 4-10 Effective Stress Mohr’s Circle for Fresh Sample
Figure 4-11 Total Stress Mohr’s Circle for Fresh Sample
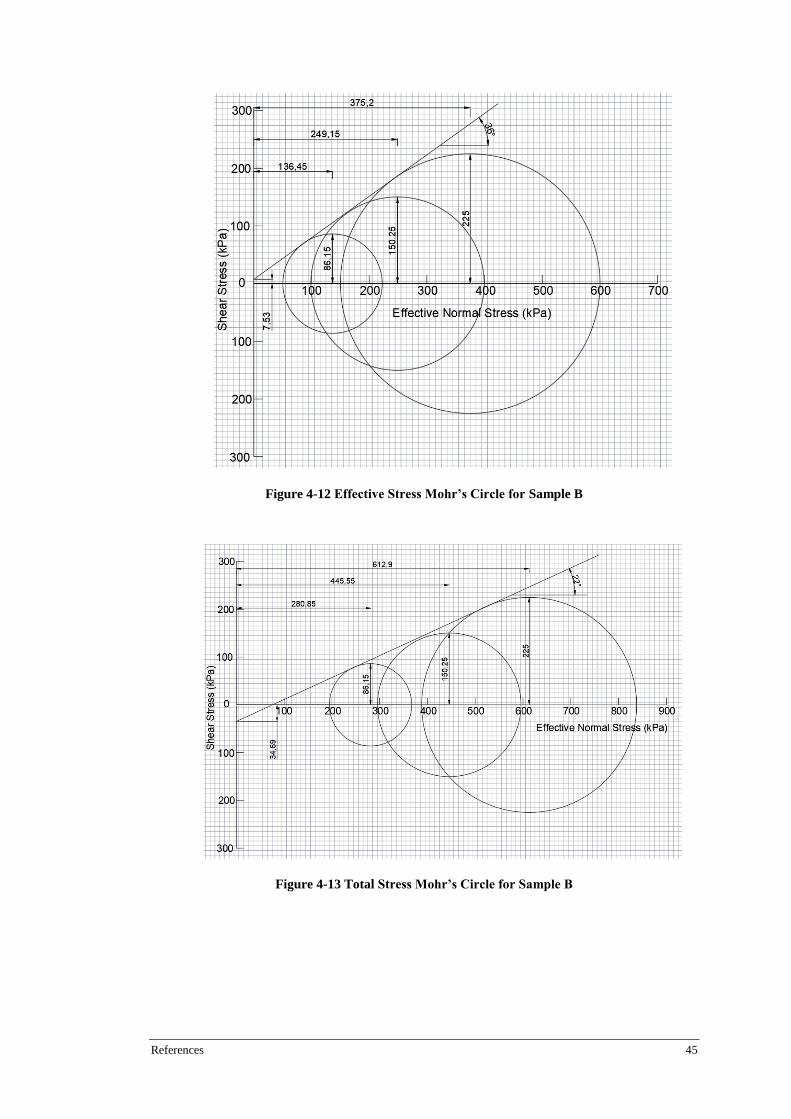
References 45
Figure 4-12 Effective Stress Mohr’s Circle for Sample B
Figure 4-13 Total Stress Mohr’s Circle for Sample B

References 46
Figure 4-14 Effective Stress Mohr’s Circle for Sample C
Figure 4-15 Total Stress Mohr’s Circle for Sample C

References 47
Table 4-5 Triaxial Results
Sample Effective Cohesion (c') [kPa]
Effective Friction
Angle (')
Total Cohesion (ccu) [kPa]
Total Friction
Angle (cu)
Fresh 3.71 38° 12.08 27°
Sample A Untested with Triaxial
Sample B 7.53 36° -34.69 22°
Sample C 0 41° 63.51 28°
Table 4-5 depicts the summary of shear strength parameters of spoil samples
obtained from Triaxial tests. Hypothetically, it can expect to decrease in internal
friction angle and increase in cohesion as slaking increases. However, the results
shown in Table 4-5 are not entirely following the above hypothesis. The shear strength
parameters of Fresh and Sample B are following this hypothesis except negative
undrained cohesion obtained for Sample B. In overall, the shear strength results are
not aligned with the hypothesis and sometimes give unrealistic values for cohesion
which is negative. The possible reason for these unexpected values and trends of shear
strength parameters is: “The shear strength of spoil will be stress dependant and it will
be non-linear failure envelope rather than linear Mohr -coulomb envelope which was
used in this study to determine shear strength parameters”
4.4.2 Direct Shear Tests Results
As summarised in Table 4-4, all spoil samples (Fresh, A, B, C) were tested in a
medium size direct shear apparatus to determine their effective shear strength
parameters. Figure 4-16 depicts “Shear stress vs shear displacement” and Vertical
displacement vs Shear displacement” curves obtained for Sample B under three
different vertical normal stresses (e.g.: 100, 200, and 300kPa). Further, spoil is more
contractive (volume decrease) during shearing with higher vertical stresses. These
behaviours are consistent with the typical shear behaviour of soils/sand. The similar
behaviours were observed in the direct shear test results of Fresh, Sample A, and
Sample C.

References 48
Peak shear stress or the shear stress at 20 mm shear displacement was considered
as the failure and then the failure shear stress and corresponding normal vertical stress
were plotted as shown in Figure 4-17 (Figure 4-17 shows Failure stress conditions of
three tests conducted using Sample B spoil material) to obtain shear strength
parameters for Sample B. To mimic the Mohr-Coulomb failure envelop, these three
failure points were best fitted with a line to obtain the effective cohesion (intercept of
Shear axis (Y-axis)) and the effective friction angle (the slope of the best fit line).
Using Figure 4-17, the effective shear strength parameters for Sample B were obtained
as c’ = -75 kPa and ’=430. The same procedure was followed with direct shear test
results of Fresh, Sample A, and Sample C and the obtained shear strength parameters
are tabulated in Table 4-6.
Figure 4-16 Direct Shear Tests Results for Sample B Spoil

References 49
.
Figure 4-17 Strength Envelope for Sample B
Table 4-6 Large Direct Shear Results Using Linear Strength Envelope
Sample Fresh 12 Month
300kPa 12 Month
600kPa 12 Month
900kPa
Cohesion (c) 65 -10.33 -75.33 -101.33
Friction Angle (ɸ)
35.33° 30.37° 42.97° 46.03°
As shown in Table 4-6, the cohesion obtained for Sample A, B, and C are negative
and that is not acceptable (realistic). Further, as discussed in Section 4.4.1, it is
expected to observe the decrease in friction angle with increasing slaking (increasing
in overburden pressure for slaking) but the results in Table 4-6 shows the opposite trend
(increasing friction angle with increasing the amount of slaking). This opposite trend
of the friction angle and unaccepted cohesion can be due to the reason given in Section
4.4.1 and the following reasons:
• The shear strength could be provided by Van der Waals attraction, double
layer repulsion, cementation, and capillary attraction (Lu & Likos, 2013).
• The cementation of soil during consolidation and shearing process
(Cruz, Rodrigues, & Viana Da Fonseca, 2013) (Lade & Trads, 2014)
(Tang, Sang, Deng, Luo, & Chen, 2015)

References 50
• The number of shear tests and the normal stresses used in direct shear
tests have a significant impact on the shear strength parameters. (Greco,
2016).
• The shear strength error could also be due to imperfections in the test and
sampling of the mine spoil, however since this test was conducted in a
medium direct shear box (150x150mm) sampling error was minimal.
Considering that maximum particle size must be less than or equal to
1/6th of the height of the sample (AS 1289.6.2.2 (Australian Standards,
1998)), the height of the sample was 160mm therefore the maximum
particle size to negate error is 26mm.
As shown in Figure 4-18, an attempt was made to consider non-linear failure
envelopes for failure stress conditions of each spoil sample obtained from direct shear
tests. In this analysis, the failure shear stress was defined as the shear at 10% shear
strain (at 15 mm shear displacement). A non-linear strength envelope is very prevalent
in rock strength properties (Kumar, 1998; Shen, Karakus, & Xu, 2012).
The non-linear failure envelope for each spoil sample was defined by fitting the
failure stress conditions using a second order polynomial function to achieve R² value
above 0.98. The shear strength at zero vertical stress was considered as the effective
cohesion and it can be obtained by substituting zero for x in the polynomial equation.
The effective cohesion values obtained for spoil samples considering non-linear failure
envelopes are given in Table 4-7. As shown in Table 4-7, the effective cohesion values
obtained considering non-linear failure envelopes are positive but does not clearly
show the increasing trend as the slaking increases. This could be due to lack of failure
points (specially at low vertical normal stresses such as 25, 50, 100kPa) to best-fit non-
linear failure envelopes. The effective friction angle corresponding to a given vertical
stress value can be obtained by drawing a tangent line to the non-linear failure
envelope at the given normal stress value.

References 51
Figure 4-18 Non-Linear Shear Strength Envelopes
Table 4-7 Cohesion Values Obtained Considering Non-Linear Failure Envelopes
Sample Fresh 12 Month
300kPa 12 Month
600kPa 12 Month
900kPa
Cohesion (C) 31.1 40 9 20
4.5 HYDRAULIC CONDUCTIVITY OF SLAKED COAL MINE SPOIL
The saturated hydraulic conductivity (permeability) of spoil is a key property
when analysing the stability of spoil pile during dewatering in mine pits. To investigate
the effects of spoil slaking on its permeability, the constant head permeability tests
(outlined in Section 3.3.5) were conducted using Fresh, Sample A, B, and C spoil
samples. The measured permeability values are given in Figure 4-19.
As shown in Figure 4-19, the permeability decreases with increase in spoil
slaking. Figure 4-19 also demonstrates that difference from the permeability of the
Fresh sample to 12 month slaked sample at 900kPa of overburden pressure (Sample
C) is by a factor of 24. The fresh mine spoils permeability is 1.42E-06 m/sec, while
Sample A is 1.2 times less permeable than fresh (1.23E-06 m/sec), Sample B is 2. 2
times less permeable than fresh (6.62E-07) and Sample C is 24.3 times less permeable
than its staring condition (5.86E-08). The higher the overburden pressure is the greater
the particle breaking/disintegration (slaking). As the amount of slaking increases, the
number of fines increases (refer to Table 4-2) reducing the volume of voids as finer

References 52
particles fill the gaps that facilitate water flow in un-slaked. This will have a significant
effect on the shear strength of the mine spoil pile as it can create an undrained condition
under de-watering.
Figure 4-19 Decrease in Permeability Due to Material Slaking
4.6 SOIL WATER CHARACTERISTIC CURVES (SWCCS) OF SLAKED
COAL MINE SPOIL
Details of this new testing apparatus and its testing procedure are given in section
3.3.4. Figure 4-20 depicts the laboratory measured (using the new SWCC apparatus)
SWCC for the Fresh and the Sample C. As expected, after the air entry value, the Fresh
sample desaturates with much faster rate than the slaked spoil sample (Sample C) as
the suction increases. The slaked sample has more fines than fresh spoil and therefore
the slaked sample can retain more water at a given suction value (value greater than
the air-entry value). The higher amount of fines in the sample can create many small
voids in the sample, the smaller voids have a larger capacity to retain water at high
suction. However, it is contrasting to obverse greater air-entry value for the Fresh
sample than that of slaked sample (Sample C). More data points are required to better
understand why the Fresh sample has a higher air entry value. It is important to note
that Figure 4-20 shows the gradient of curve for the Fresh sample to be steeper than
1.42E-06
1.23E-06
6.62E-07
5.86E-08
0.00E+00
2.00E-07
4.00E-07
6.00E-07
8.00E-07
1.00E-06
1.20E-06
1.40E-06
1.60E-06
Fresh Sample Sample A Sample B Sample C
Per
mea
bili
ty, k
(m
/sec
)
Overburden pressure applied for material slaking (kPa)

References 53
the curve for sample C, this shows that the Fresh sample consists of larger granular
material as it was unable to retain the water like the slaked sample.
Figure 4-20 Soil Water Characteristic Curve of Fresh Sample and Sample C
0.06
0.07
0.08
0.09
0.1
0.11
0.12
0.13
0.14
0.15
0.16
0.1 1 10 100 1000
Vo
lum
etri
c W
ater
Co
nte
nt
Suction (kPa)
Sample C Fresh Sample

References 54
Chapter 5: Conclusions and Recommendations
5.1 CONCLUSIONS
The stability of coal mine spoil piles in open-cut miming is essential for the
safety of workers in the pit and as well as for economical mine operation. The change
in spoil properties due to slaking is one of the major challenges in designing spoil piles
ensuring their long-term stability. The main research gap found in the extensive
literature was the lack of laboratory procedure/methodology to determine the
geotechnical properties slaked spoil material. Therefore, the objectives of this were
defined to develop and validate the laboratory procedure to assess the geotechnical
engineering properties of slaked spoil required for assessing the stability of the mine
spoil piles. This section concludes the findings of this research to ensure the
achievements of objectives defined in Chapter 1.
The results from grain size distribution on Sample A, B, and C all show that
slaking increases with larger overburden pressure using the slaking chamber
demonstrated in Section 3.3.1. The correlation is also validated by the total
deformation of the pressure cell, as total deformation is increased sample volume is
decreased representing material slaking. Compared to the Fresh sample, the percentage
of fines increases and other parameters (percentage of particles greater than 2.36 mm,
D10, D30, and D50) decrease with increasing overburden pressure. These findings
suggest that these chambers can be used to slake material under controlled parameters
as the slaking appears to increase with increasing overburden pressure under saturated
conditions.
In theory, it can be expected to decrease internal friction angle and increase
cohesion as slaking increases. However, the results of the triaxial tests are not entirely
following the above hypothesis. The shear strength parameters of Fresh and Sample
B are following this hypothesis except negative undrained cohesion obtained for
Sample B. In overall, the shear strength results are not aligned with the hypothesis and
sometimes give unrealistic values for cohesion which is negative. The possible reason
for these unexpected values and trends of shear strength parameters is: “The shear
strength of spoil will be stress dependant and it will be non-linear failure envelope

References 55
rather than linear Mohr -coulomb envelope which was used in this study to determine
shear strength parameters”. The shear strength parameters obtained from the direct
shear under a non-linear failure envelope are positive but does not clearly show the
increasing trend as the slaking increases. This could be due to lack of failure points
(specially at low vertical normal stresses such as 25, 50, 100kPa) to best-fit non-linear
failure envelopes. The effective friction angle corresponding to a given vertical stress
value can be obtained by drawing a tangent line to the non-linear failure envelope at
the given normal stress value.
The saturated hydraulic conductivity (permeability) of spoil is a key property
when analysing the stability of spoil pile during dewatering in mine pits. The
permeability of coal mine spoil decreases with an increase in slaking. It is also
important to note that the coal mine spoil’s permeability has changed by a factor of 24
when comparing Fresh (1.42E-06 m/sec) to Sample C (5.86E-08 m/sec). As the
amount of slaking increases, the number of fines increases reducing the volume of
voids as finer particles fill the gaps that facilitate water flow in un-slaked. This will
have a significant effect on the shear strength of the mine spoil pile as it can create an
undrained condition under de-watering.
The Soil Water Characteristic Curve (SWCC) has also shown that after the air
entry value, the Fresh sample desaturates at a much faster rate than the highest slaked
spoil sample (Sample C) as the suction increases. The slaked sample has more fines
than fresh spoil and therefore the slaked sample can retain more water at a given
suction value (value greater than the air-entry value).
It is evident from the results that slaking at the base of the spoil material over
time is due to the increase in overburden pressure (increase in spoil height) and
saturation levels, as these factors both increase the effect of disintegration. However
further research is required for material strength properties of this slaked coal mine
spoil.

References 56
5.2 RECOMMENDATIONS
To fulfil the limitations of this research and to make the research outcomes
readily applicable in coal mine spoil pile design, the following future research studies
are recommended:
• Slaking spoil under cyclic saturation-desaturation over longer period
(e.g.: 1-2 years) to replicate the actual field conditions
• Slaking spoil under higher pressure is needed to better replicate higher
spoil piles as some coal mines are looking to reach 450m or more. For
this an air system will not be satisfactory, and running other systems such
as hydraulic will be costly for a long-time period. As seen with this
research over 70% of the total deformation occurs within the first couple
of hours. Because of this a hydraulic system might be viable if it was run
for a sort period and values of further deformation extrapolated.
• Further investigate the shear strength of spoil by testing them under the
same stress conditions to see the effects of slaking and then investigate
the effects of high confining pressure on shear strength parameters (non-
linear failure envelope)
• Using numerical slope stability analyses, develop stability charts that can
be used to design spoil piles which are stable under spoil slaking and
dewatering process

References 57
References
Australian Standards. (1998). AS 1289.6.2.2-1998 : Methods of testing soils for
engineering purposes - Soil strength and consolidation tests - Determination of
shear strength of a soil - Direct shear test using a shear box.
Australian Standards. (2001). AS 1289.6.7.1-2001 (R2013) : Methods of testing soils
for engineering purposes - Soil strength and consolidation tests - Determination
of permeability of a soil.
Australian Standards. (2008). AS 1289.3.4.1-2008 (R2016) : Methods of testing soils
for engineering purposes - Soil classification tests - Determination of the linear
shrinkage of a soil - Standard method.
Australian Standards. (2009a). AS 1289.3.2.1-2009 : Methods of testing soils for
engineering purposes - Soil classification tests - Determination of the plastic
limit of a soil - Standard method.
Australian Standards. (2009b). AS 1289.3.6.1-2009 : Methods of testing soils for
engineering purposes - Soil classification tests - Determination of the particle
size distribution of a soil - Standard method of analysis by sieving.
Australian Standards. (2015). AS 1289.3.9.1:2015 : Methods of testing soils for
engineering purposes - Soil classification tests - Determination of the cone
liquid limit of a soil.
Australian Standards. (2016). AS 1289.6.4.2:2016 : Methods of testing soils for
engineering purposes - Soil strength and consolidation tests - Determination of
compressive strength of a soil - Compressive strength of a saturated specimen
tested in undrained triaxial compression with measurement of pore water
pressure.
Bradfield, L., Simmons, J., & Fityus, S. (2013). Issues related to stability design of
very high spoil dumps. Paper presented at the 13th Coal Operators' Conference,
University of Wollongong.
Cabrejo, A., & Harries, N. (2012). Effective Slope Monitoring for Open Cut Coal
Mines. Retrieved from
Chin, K.-B., Leong, E.-C., & Rahardjo, H. (2010). A simplified method to estimate
the soil-water characteristic curve. Canadian Geotechnical Journal, 47(12),
1382.
Cruz, N., Rodrigues, C., & Viana Da Fonseca, A. (2013). Detecting the presence of
cementation structures in soils, based in DMT interpreted charts.
Duncan, J. M. (1996). State of the Art: Limit Equilibrium and Finite-Element Analysis
of Slopes. Journal of Geotechnical Engineering, 122(7), 577-596.
Duncan, J. M., Wright, S. G., & Brandon, T. L. (2014). Soil strength and slope
stability: John Wiley & Sons.

References 58
El-Zafrany, A. (1997). Non-Linear Finite Element Analysis of Solids and Structures:
Volume 2: Advanced Topics. Proceedings of the Institution of Mechanical
Engineers, 211(6), 489.
Elmouttie, M., Poropat, G., & Soole, P. (2012). Open Cut Mine Wall Stability Analysis
Utilising Discrete Fracture Networks. Retrieved from
Forward, T. A. (2002). Quasi-continuous GPS steep slope monitoring: a multi-
antenna array approach: Curtin University of Technology.
Fredlund, M. D., Wilson, G. W., & Fredlund, D. G. (2002). Use of the grain-size
distribution for estimation of the soil-water characteristic curve. Canadian
Geotechnical Journal, 39(5), 1103-1117.
Geotechdata (Producer). (2010, 10 10). Triaxial Test. Geotechdata.info. Retrieved
from http://www.geotechdata.info/geotest/triaxial-test.html
Greco, V. R. (2016). Variability and Correlation of Strength Parameters Inferred from
Direct Shear Tests. Geotechnical and Geological Engineering, 34(2), 585-603.
doi:10.1007/s10706-015-9968-3
Hume, R. (1997). Improved Recovery in Highwall Mining Using Backfill. Retrieved
from
Jover, M. L. (2012). Slope stability analysis of spoil dragline bench in lignite coal
mine, Choctaw County, Mississippi. (1516375 M.S.), Mississippi State
University, Ann Arbor.
Karem, W. A. (2005). Development of a predictive model to evaluate mine spoil fills
for industrial development. (3189437 Ph.D.), University of Kentucky, Ann
Arbor.
Kasmer, O., Ulusay, R., & Gokceoglu, C. (2006). Spoil pile instabilities with reference
to a strip coal mine in Turkey: mechanisms and assessment of deformations.
Environmental Geology, 49(4), 570-585.
Kumar, P. (1998). Shear failure envelope of Hoek-Brown criterion for rockmass.
Tunnelling and Underground Space Technology, 13(4), 453-458.
Lade, P. V., & Trads, N. (2014). The role of cementation in the behaviour of cemented
soils. Geotechnical Research, 1(4), 111-132. doi:10.1680/gr.14.00011
Li, X., Zhang, L. M., & Li, J. H. (2009). Development of a Modified Axis Translation
Technique for Measuring SWCCs for Gravel Soils at Very Low Suctions.
GEOTECHNICAL TESTING JOURNAL, 32(6), 478-488.
Lins, Y., Schanz, T., & Fredlund, D. G. (2009). Modified Pressure Plate Apparatus
and Column Testing Device for Measuring SWCC of Sand. GEOTECHNICAL
TESTING JOURNAL, 32(5), 1-15. doi:10.1520/GTJ101318
Lu, N., & Likos, W. J. (2013). Origin of Cohesion and Its Dependence on Saturation
for Granular Media (pp. 1669-1675).
Manesh, A. N. (1983). Stability Of The Working Highwall In A Strip Mining Operation
And Comparison Of The Failure In A Physical Model With That Of A Two-
Dimensional Finite Element Analysis (Oklahoma). (8404561 Ph.D.), The
University of Oklahoma, Ann Arbor.

References 59
Okagbue, C. O. (1981). GEOLOGIC AND ENGINEERING ASPECTS CONCERNING
SLOPE STABILITY OF SURFACE COAL MINE SPOILS. (8210241 Ph.D.),
Purdue University, Ann Arbor.
Perez-Garcia, N., Houston, S. L., Houston, W. N., & Padilla, J. M. (2008). An
oedometer-type pressure plate SWCC apparatus. GEOTECHNICAL TESTING
JOURNAL, 31(2), 115-123.
Polomcic, D., & Bajic, D. (2015). Application of Groundwater modeling for designing
a dewatering system: Case study of the Buvac Open Cast Mine, Bosnia and
Herzegovina. Geologia Croatica, 68(2), 123-137.
Rassam, D. W., & Williams, D. J. (2000). A Dynamic Method for Determining the
Soil Water Characteristic Curve for Coarse-Grained Soils. GEOTECHNICAL
TESTING JOURNAL, 23(1), 67-71. doi:10.1520/GTJ11124J
Roshani, P., & Sedano, J. Á. I. (2016). Incorporating Temperature Effects in Soil-
Water Characteristic Curves. Indian Geotechnical Journal, 46(3), 309-318.
doi:10.1007/s40098-016-0201-y
Shen, J., Karakus, M., & Xu, C. (2012). Direct expressions for linearization of shear
strength envelopes given by the Generalized Hoek–Brown criterion using
genetic programming. Computers and Geotechnics, 44, 139-146.
Shu, B. (2014). Rock slope stability investigations in three dimensions for a part of an
open pit mine in USA. (3667788 Ph.D.), The University of Arizona, Ann Arbor.
Simmons, J. (2011). ESFC-Based Trigger Levels For Monitoring Pit Wall Stability.
Retrieved from
Simmons, J. V., & McManus, D. A. (2004). Shear strength framework for design of
dumped spoil slopes for open pit coal mines.
Small, C. A. (1989). Failure in mine highwall in soft sedimentary rock. (ML55408
M.Sc.), University of Alberta (Canada), Ann Arbor.
Surana, D. M. (1989). Time-dependent analysis of stability of surface coal mine spoil
slope under groundwater pressure. (8922132 Ph.D.), The Pennsylvania State
University, Ann Arbor.
Tang, L. S., Sang, H. T., Deng, X. B., Luo, Z. G., & Chen, H. K. (2015). Experimental
study on cementation strength of unsaturated granite residual soil.
Vaziri, A., Moore, L., & Ali, H. (2010). Monitoring systems for warning impending
failures in slopes and open pit mines. Natural Hazards, 55(2), 501-512.
Verma, D., Kainthola, A., Thareja, R., & Singh, T. N. (2013). Stability analysis of an
open cut slope in Wardha valley coal field. Journal of the Geological Society
of India, 81(6), 804-812.
Wali, M. K., Evrendilek, F., & Fennessy, M. S. (2009). The Environment: Science,
Issues, and Solutions. Boca Raton: CRC Press.
Williams, D. (2015). Bulking and Subsequent Self-Weight and Saturation Settlements,
and Geotechnical Stability, of High Coal Mine Spoil Piles.
Williams, D. J. (2001). Prediction of erosion from steep mine waste slopes.
Environmental Management and Health, 12(1), 35-50.
doi:doi:10.1108/09566160110381913

References 60
Yoesoef, A. F. (1993). A case study of utilizing piezocone for determining soil shear
parameters in spoil slope instability assessment at Air Laya Mine. (0573726
Ph.D.), University of New South Wales (Australia), Ann Arbor.
Zapata, C. E. (1999). Uncertainty in soil-water-characteristic curve and impacts on
unsaturated shear strength predictions. (9950269 Ph.D.), Arizona State
University, Ann Arbor.
Zheng, H., Liu, D. F., & Li, C. G. (2008). On the Assessment of Failure in Slope
Stability Analysis by the Finite Element Method. Rock Mechanics and Rock
Engineering, 41(4), 629-639.