Embed Size (px)
Citation preview
Investigations on Sulfated Zirconia Model Systems: from
Nanocrystalline Thin Films to Rational Design of Powder Catalysts
Inaugural-Dissertation
to obtain the academic degree Doctor rerum naturalium (Dr. rer. nat.)
submitted to the Department of Biology, Chemistry and Pharmacy of Freie Universität Berlin
by
Rhys W. Lloyd from Bristol
March, 2008

1st Reviewer: Prof. Dr. Klaus Christmann
2nd Reviewer: Prof. Dr. Robert Schlögl
Date of defence: 20 June 2008
Acknowledgements
i
Acknowledgements
I would like to express my gratitude to Prof. Robert Schlögl for his guidance and the
opportunity to work on such an interesting project within the department of Inorganic
Chemistry at the Fritz Haber Institute. The assessment of this thesis by the Freie
Universität Berlin is gratefully acknowledged, in particular the time and effort given by
the chair, Prof. Klaus Christmann, and committee members of my doctorial board is
appreciated. I would, also, like to thank my supervisors, Dr. Friederike Jentoft and Dr.
Wolfgang Ranke, for their advice and assistance. During my time in Berlin I have learnt a
great deal from their enlightening teaching.
My sincere thanks to all the members of the department of Inorganic Chemistry,
especially those of my group: Functional Characterisation, for creating a friendly
atmosphere and an enjoyable place in which to work. I am indebted to all the members of
the department that have aided me with my research, including:
− Pradnya Joshi, for assisting with the planning and synthesis of the rationally
designed powder sulfated zirconia samples.
− Achim Klein-Hoffmann, for preparing cross sections of the thin films, and Dr.
Thomas Hansen and Hermann Sauer, for investigating the cross sections using
transmission electron microscopy.
− Gisela Weinberg, for analysing numerous thin film samples via scanning electron
microscopy and her valued interpretation of the results.
− The members of the Surface Analysis group, especially Dr. Elaine Vass and Dr.
Michael Hävecker, for their help measuring and analysing the data obtained at the
Berliner Elektronenspeicherring - Gesellschaft für Synchrotronstrahlung.
− Bernd Steinhauer, for his assistance performing the thermal desorption studies on
the thin films.
− Manfred Swoboda, Abed Taha and the Mechanical Workshop of the Fritz Haber
Institute for their help designing and the construct of the thin film reactor.
− Edith Kitzelmann and Ming-Hong Looi for performing X-ray diffraction on
powder samples and Dr. Frank Girgsdies for fitting the diffractograms.
− Dr. Andreas Furche, for running thermal analyses of the powder samples.
Acknowledgements
ii
− Gisela Lorenz, for measuring the surface areas of the powder samples.
− Ute Wild, for performing X-ray photoelectron spectroscopy on powder samples.
− Dr. Kristina Chakarova, for measurements performed on the powder samples
using diffuse reflectance infra-red Fourier transform spectroscopy.
− Jutta Kröhnert, for constructing a reactor on which the catalytic activity of the
powder catalysts could be measured and her general help with technical
difficulties.
− Dr. Sabine Wrabetz, for discussion of and providing the powder calorimetry data.
In addition, I would like to thank Prof. F. Aldinger's department at the Max Planck
Institute for Metals Research, Stuttgart, for kindly providing the surfactant for forming
the self-assembled monolayer and Wacker Siltronic AG for donation of the silicon wafers
(100, p-type) used to produce the thin films.
The project funding of this doctorial study as part of the DFG priory program (SPP) 1091
‘‘Bridging the Pressure and Material Gap in Heterogeneous Catalysis’’, individual
project Je 267/1, is gratefully acknowledged. Discussions and input from the fellow
members of this priory program; Prof. H. Papp and Dr. C. Breitkopf from the Universität
Leipzig; Prof. J. A. Lercher, Dr. R. Olindo and X. Li from the Technische Universität
München; Prof. W. Widdra, Dr. K. Meinel and Dr. K.-M. Schindler from the Martin-
Luther-University Halle-Wittenberg; Prof. J. Sauer and Dr. A. Hofmann from the
Humboldt-Universität zu Berlin; are highly appreciated.
Personal financial support and development programs from the International Max Planck
Research School are also gratefully acknowledged.
Furthermore, I would like to thank my friends and family who have encouraged and
supported me throughout my studies.
Abstract
iii
Abstract
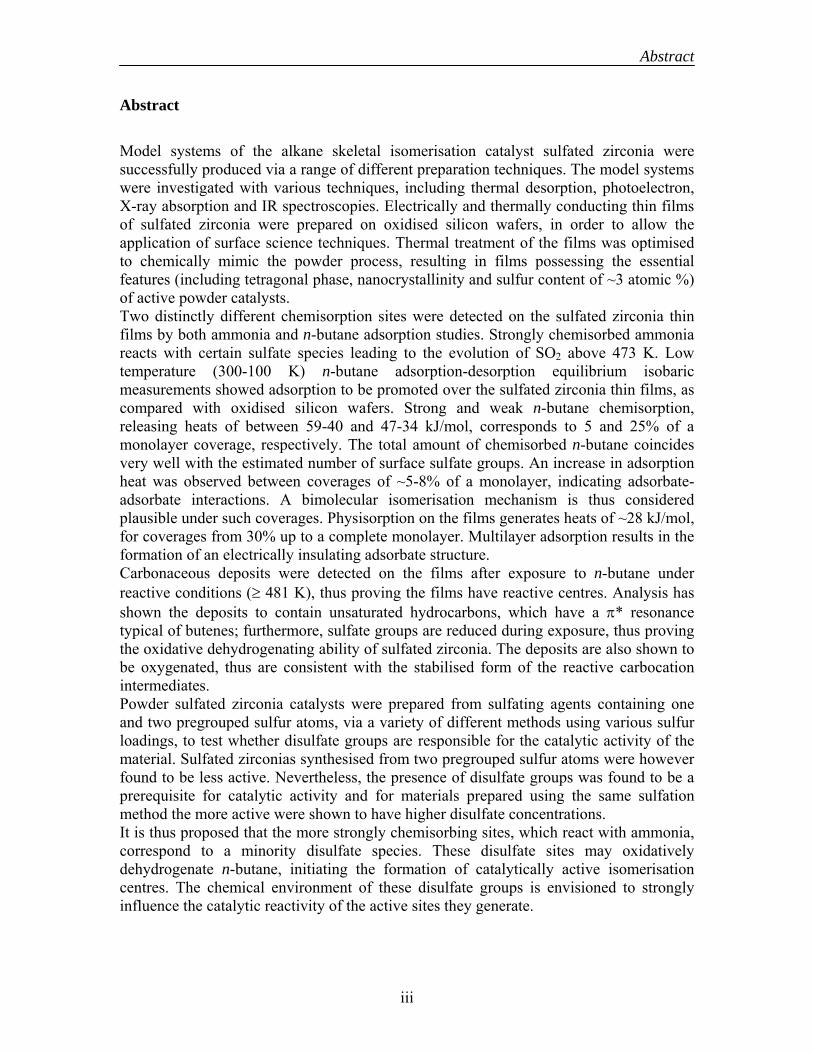
Model systems of the alkane skeletal isomerisation catalyst sulfated zirconia were successfully produced via a range of different preparation techniques. The model systems were investigated with various techniques, including thermal desorption, photoelectron, X-ray absorption and IR spectroscopies. Electrically and thermally conducting thin films of sulfated zirconia were prepared on oxidised silicon wafers, in order to allow the application of surface science techniques. Thermal treatment of the films was optimised to chemically mimic the powder process, resulting in films possessing the essential features (including tetragonal phase, nanocrystallinity and sulfur content of ~3 atomic %) of active powder catalysts. Two distinctly different chemisorption sites were detected on the sulfated zirconia thin films by both ammonia and n-butane adsorption studies. Strongly chemisorbed ammonia reacts with certain sulfate species leading to the evolution of SO2 above 473 K. Low temperature (300-100 K) n-butane adsorption-desorption equilibrium isobaric measurements showed adsorption to be promoted over the sulfated zirconia thin films, as compared with oxidised silicon wafers. Strong and weak n-butane chemisorption, releasing heats of between 59-40 and 47-34 kJ/mol, corresponds to 5 and 25% of a monolayer coverage, respectively. The total amount of chemisorbed n-butane coincides very well with the estimated number of surface sulfate groups. An increase in adsorption heat was observed between coverages of ~5-8% of a monolayer, indicating adsorbate-adsorbate interactions. A bimolecular isomerisation mechanism is thus considered plausible under such coverages. Physisorption on the films generates heats of ~28 kJ/mol, for coverages from 30% up to a complete monolayer. Multilayer adsorption results in the formation of an electrically insulating adsorbate structure. Carbonaceous deposits were detected on the films after exposure to n-butane under reactive conditions (≥ 481 K), thus proving the films have reactive centres. Analysis has shown the deposits to contain unsaturated hydrocarbons, which have a π* resonance typical of butenes; furthermore, sulfate groups are reduced during exposure, thus proving the oxidative dehydrogenating ability of sulfated zirconia. The deposits are also shown to be oxygenated, thus are consistent with the stabilised form of the reactive carbocation intermediates. Powder sulfated zirconia catalysts were prepared from sulfating agents containing one and two pregrouped sulfur atoms, via a variety of different methods using various sulfur loadings, to test whether disulfate groups are responsible for the catalytic activity of the material. Sulfated zirconias synthesised from two pregrouped sulfur atoms were however found to be less active. Nevertheless, the presence of disulfate groups was found to be a prerequisite for catalytic activity and for materials prepared using the same sulfation method the more active were shown to have higher disulfate concentrations. It is thus proposed that the more strongly chemisorbing sites, which react with ammonia, correspond to a minority disulfate species. These disulfate sites may oxidatively dehydrogenate n-butane, initiating the formation of catalytically active isomerisation centres. The chemical environment of these disulfate groups is envisioned to strongly influence the catalytic reactivity of the active sites they generate.
Zusammenfassung
iv
Zusammenfassung
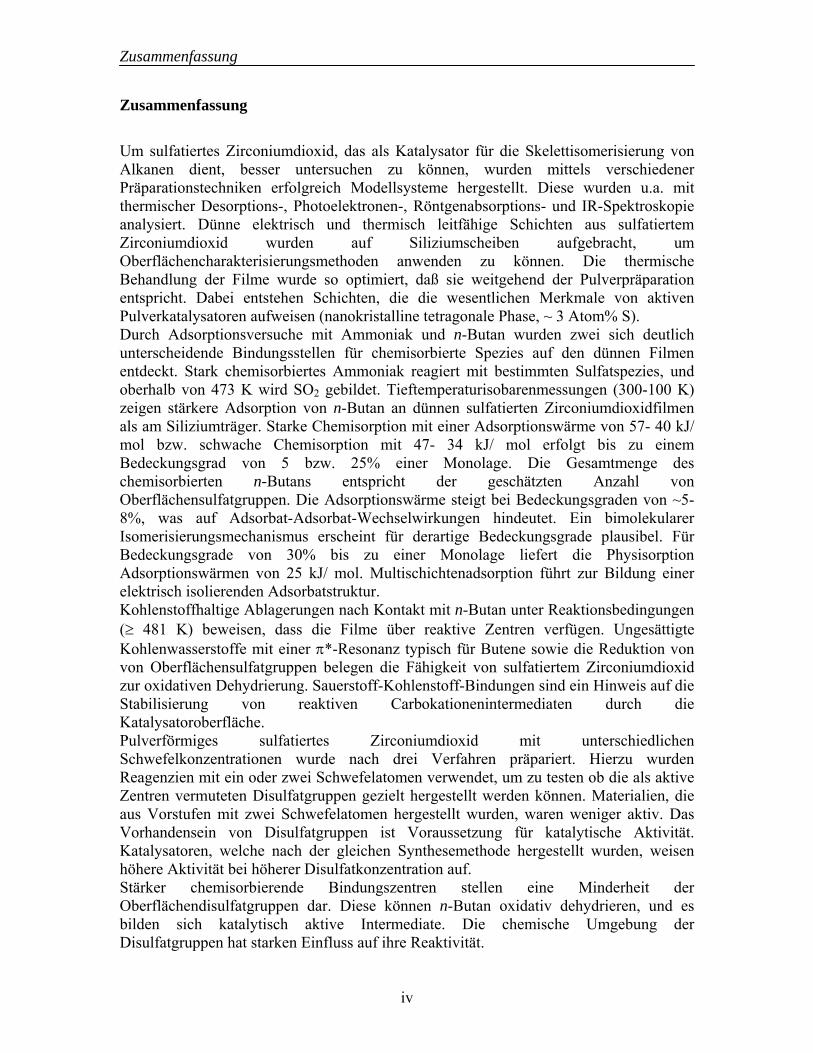
Um sulfatiertes Zirconiumdioxid, das als Katalysator für die Skelettisomerisierung von Alkanen dient, besser untersuchen zu können, wurden mittels verschiedener Präparationstechniken erfolgreich Modellsysteme hergestellt. Diese wurden u.a. mit thermischer Desorptions-, Photoelektronen-, Röntgenabsorptions- und IR-Spektroskopie analysiert. Dünne elektrisch und thermisch leitfähige Schichten aus sulfatiertem Zirconiumdioxid wurden auf Siliziumscheiben aufgebracht, um Oberflächencharakterisierungsmethoden anwenden zu können. Die thermische Behandlung der Filme wurde so optimiert, daß sie weitgehend der Pulverpräparation entspricht. Dabei entstehen Schichten, die die wesentlichen Merkmale von aktiven Pulverkatalysatoren aufweisen (nanokristalline tetragonale Phase, ~ 3 Atom% S). Durch Adsorptionsversuche mit Ammoniak und n-Butan wurden zwei sich deutlich unterscheidende Bindungsstellen für chemisorbierte Spezies auf den dünnen Filmen entdeckt. Stark chemisorbiertes Ammoniak reagiert mit bestimmten Sulfatspezies, und oberhalb von 473 K wird SO2 gebildet. Tieftemperaturisobarenmessungen (300-100 K) zeigen stärkere Adsorption von n-Butan an dünnen sulfatierten Zirconiumdioxidfilmen als am Siliziumträger. Starke Chemisorption mit einer Adsorptionswärme von 57- 40 kJ/ mol bzw. schwache Chemisorption mit 47- 34 kJ/ mol erfolgt bis zu einem Bedeckungsgrad von 5 bzw. 25% einer Monolage. Die Gesamtmenge des chemisorbierten n-Butans entspricht der geschätzten Anzahl von Oberflächensulfatgruppen. Die Adsorptionswärme steigt bei Bedeckungsgraden von ~5- 8%, was auf Adsorbat-Adsorbat-Wechselwirkungen hindeutet. Ein bimolekularer Isomerisierungsmechanismus erscheint für derartige Bedeckungsgrade plausibel. Für Bedeckungsgrade von 30% bis zu einer Monolage liefert die Physisorption Adsorptionswärmen von 25 kJ/ mol. Multischichtenadsorption führt zur Bildung einer elektrisch isolierenden Adsorbatstruktur. Kohlenstoffhaltige Ablagerungen nach Kontakt mit n-Butan unter Reaktionsbedingungen (≥ 481 K) beweisen, dass die Filme über reaktive Zentren verfügen. Ungesättigte Kohlenwasserstoffe mit einer π*-Resonanz typisch für Butene sowie die Reduktion von von Oberflächensulfatgruppen belegen die Fähigkeit von sulfatiertem Zirconiumdioxid zur oxidativen Dehydrierung. Sauerstoff-Kohlenstoff-Bindungen sind ein Hinweis auf die Stabilisierung von reaktiven Carbokationenintermediaten durch die Katalysatoroberfläche. Pulverförmiges sulfatiertes Zirconiumdioxid mit unterschiedlichen Schwefelkonzentrationen wurde nach drei Verfahren präpariert. Hierzu wurden Reagenzien mit ein oder zwei Schwefelatomen verwendet, um zu testen ob die als aktive Zentren vermuteten Disulfatgruppen gezielt hergestellt werden können. Materialien, die aus Vorstufen mit zwei Schwefelatomen hergestellt wurden, waren weniger aktiv. Das Vorhandensein von Disulfatgruppen ist Voraussetzung für katalytische Aktivität. Katalysatoren, welche nach der gleichen Synthesemethode hergestellt wurden, weisen höhere Aktivität bei höherer Disulfatkonzentration auf. Stärker chemisorbierende Bindungszentren stellen eine Minderheit der Oberflächendisulfatgruppen dar. Diese können n-Butan oxidativ dehydrieren, und es bilden sich katalytisch aktive Intermediate. Die chemische Umgebung der Disulfatgruppen hat starken Einfluss auf ihre Reaktivität.
Contents
v
Contents
Acknowledgements ............................................................................................................ i Abstract............................................................................................................................. iii Zusammenfassung............................................................................................................ iv Contents ............................................................................................................................. v Abbreviations ................................................................................................................... ix 1. Introduction............................................................................................................... 1
1.1 Catalytic Isomerisation of Alkanes..................................................................... 1 1.2 Sulfated Zirconia................................................................................................. 2
1.2.1 Preparation .................................................................................................. 4 1.2.2 Acidic properties......................................................................................... 5 1.2.3 Sulfate structure .......................................................................................... 5 1.2.4 Catalytic properties ..................................................................................... 6 1.2.5 Isomerisation mechanism............................................................................ 7
1.3 Application of Surface Science Techniques to Oxide Catalysts......................... 8 1.3.1 Sulfated zirconia thin solid films ................................................................ 9
1.4 Objectives and Strategy .................................................................................... 10 2. Synthesis and Thermal Treatment of Sulfated Zirconia Thin Films................. 12
2.1 Introduction....................................................................................................... 12 2.1.1 Biomimetic synthesis of oxide thin films ................................................. 12 2.1.2 Self-assembled monolayers ...................................................................... 12 2.1.3 Aqueous zirconium sulfate solutions ........................................................ 13 2.1.4 SAM mediated sulfated zirconia thin film growth ................................... 14 2.1.5 Thermal treatment of heterogeneously deposited sulfated zirconia thin films .......................................................................................................... 15 2.1.6 Aims.......................................................................................................... 16
2.2 Experimental ..................................................................................................... 16 2.2.1 Film synthesis ........................................................................................... 16 2.2.1.1 Substrate preparation ................................................................................ 16 2.2.1.2 Self assembled monolayer deposition and functionalisation .................... 17 2.2.1.3 Deposition of the sulfated zirconia precursor film ................................... 17 2.2.1.4 Thermal treatment of the thin films .......................................................... 17 2.2.2 Synthesis of an analogous sulfated zirconia powder ................................ 17 2.2.2.1 Precipitation of the powder....................................................................... 17 2.2.2.2 Thermal treatment of the precipitate......................................................... 17 2.2.3 Characterisation techniques ...................................................................... 18 2.2.3.1 XPS ........................................................................................................... 18 2.2.3.2 SEM .......................................................................................................... 18 2.2.3.3 TEM .......................................................................................................... 18 2.2.3.4 XRD .......................................................................................................... 18
2.3 Results............................................................................................................... 19 2.3.1 As deposited films..................................................................................... 19 2.3.2 Thermal treatment of films ....................................................................... 19
2.4 Discussion......................................................................................................... 24
Contents
vi
2.5 Conclusions....................................................................................................... 26 3. Thermal Desorption Spectroscopic Studies on Sulfated Zirconia Thin Films.. 28
3.1 Introduction....................................................................................................... 28 3.1.1 Temperature programmed desorption from sulfated zirconia powders.... 28 3.1.2 Temperature dependent desorption from sulfated zirconia thin films ...... 29 3.1.3 Motivation................................................................................................. 29
3.2 Experimental ..................................................................................................... 29 3.2.1 Apparatus .................................................................................................. 29 3.2.2 n-Butane thermal desorption spectroscopy............................................... 30 3.2.3 Ammonia thermal desorption spectroscopy.............................................. 30
3.3 Results............................................................................................................... 31 3.3.1 n-Butane thermal desorption spectroscopy............................................... 31 3.3.2 Ammonia thermal desorption spectroscopy.............................................. 32
3.4 Discussion......................................................................................................... 33 3.5 Conclusions....................................................................................................... 35
4. Isobaric Measurements on Sulfated Zirconia Thin Films................................... 36
4.1 Introduction....................................................................................................... 36 4.1.1 Determination of heats of adsorption........................................................ 36 4.1.2 Isobaric photoelectron spectroscopy measurements................................. 37 4.1.3 Heats of adsorption of n-butane on sulfated zirconia ............................... 38 4.1.4 Aims.......................................................................................................... 39
4.2 Experimental ..................................................................................................... 39 4.2.1 Set-up ........................................................................................................ 39 4.2.2 XPS isobaric measurements...................................................................... 40 4.2.2.1 Initial XPS isobaric measurements ........................................................... 41 4.2.2.2 Detailed XPS isobaric measurements ....................................................... 41 4.2.2.3 Coverage determination from XPS isobaric measurements ..................... 41 4.2.3 UPS isobaric measurements...................................................................... 42 4.2.3.1 Initial UPS isobaric measurements ........................................................... 42 4.2.3.2 Detailed UPS isobaric measurements ....................................................... 43 4.2.3.3 Coverage determination from UPS isobaric measurements ..................... 43
4.3 Results............................................................................................................... 44 4.3.1 Initial XPS isobaric measurements ........................................................... 44 4.3.2 Detailed XPS isobaric measurements ....................................................... 45 4.3.3 Initial UPS isobaric measurements ........................................................... 46 4.3.4 Detailed UPS isobaric measurements ....................................................... 47 4.3.5 n-Butane adsorption and sulfate surface site densities ............................. 50
4.4 Discussion......................................................................................................... 50 4.5 Conclusions....................................................................................................... 54
5. Interaction of n-Butane with Sulfated Zirconia Thin Films under Reaction Conditions................................................................................................................ 56
5.1 Introduction....................................................................................................... 56 5.1.1 XPS of sulfated zirconia ........................................................................... 56
Contents
vii
5.1.2 XPS of deactivated sulfated zirconia ........................................................ 56 5.1.3 XPS on zirconia thin films........................................................................ 56 5.1.4 XPS on sulfated zirconia thin films .......................................................... 57 5.1.5 Motivation................................................................................................. 57
5.2 Experimental ..................................................................................................... 57 5.3 Results............................................................................................................... 60
5.3.1 As introduced ............................................................................................ 60 5.3.2 Activation.................................................................................................. 62 5.3.3 In situ XPS ................................................................................................ 63 5.3.4 Ex situ XPS ............................................................................................... 63 5.3.5 NEXAFS................................................................................................... 65 5.3.6 Mass Spectrometry.................................................................................... 66
5.4 Discussion......................................................................................................... 66 5.5 Conclusions....................................................................................................... 70
6. Design and Construction of a Thin Film Reactor ................................................ 71
6.1 Introduction....................................................................................................... 71 6.1.1 Reactors for the catalytic testing of model thin films and supported particles on flat substrates and single crystals .......................................... 71 6.1.2 Aims.......................................................................................................... 73
6.2 Experimental ..................................................................................................... 74 6.2.1 Reactor design........................................................................................... 74 6.2.2 Test measurements.................................................................................... 75
6.3 Results............................................................................................................... 75 6.4 Discussion......................................................................................................... 77 6.5 Conclusions....................................................................................................... 79
7. Rational Design of Powder Sulfated Zirconia Catalysts ..................................... 81
7.1 Introduction....................................................................................................... 81 7.1.1 Disulfated zirconia .................................................................................... 81 7.1.2 Preparation of sulfated zirconia from precursors containing two sulfur atoms ......................................................................................................... 83 7.1.3 Motivation................................................................................................. 85
7.2 Experimental ..................................................................................................... 85 7.2.1 Synthesis of powder sulfated zirconias..................................................... 85 7.2.2 Calcination of sulfated zirconia powders.................................................. 86 7.2.3 Catalytic testing ........................................................................................ 87 7.2.4 TG-DSC-MS............................................................................................. 87 7.2.5 BET surface area....................................................................................... 87 7.2.6 XRD .......................................................................................................... 87 7.2.7 XPS ........................................................................................................... 88 7.2.8 DRIFTS..................................................................................................... 88
7.3 Results............................................................................................................... 89 7.3.1 Calcination of catalysts ............................................................................. 89 7.3.2 Catalytic testing ........................................................................................ 89 7.3.3 TGA-DSC-MS .......................................................................................... 91
Contents
viii
7.3.4 BET surface area....................................................................................... 92 7.3.5 XRD .......................................................................................................... 92 7.3.6 XPS ........................................................................................................... 93 7.3.7 DRIFTS..................................................................................................... 94
7.4 Discussion......................................................................................................... 96 7.5 Conclusions....................................................................................................... 99
8. Conclusions............................................................................................................ 100
8.1 Synthesis of Model Systems ........................................................................... 100 8.2 Sulfated Zirconia Surface Sites....................................................................... 101 8.3 Reactivity of Sulfated Zirconia....................................................................... 103 8.4 Contributions of Model Systems to the Scientific Understanding of Sulfated Zirconia Isomerisation Catalysts..................................................................... 105
9. References.............................................................................................................. 107
Abbreviations
ix
Abbreviations
θ Coverage
λe Electron mean free path
A-D Adsorption-desorption
AFM Atomic force microscopy
BE Binding energy
DFT Density-functional theory
DRIFT(S) Diffuse reflectance infrared Fourier transform (spectroscopy)
DSC Differential scanning calorimetry
EDX Energy dispersive X-ray
FT Fourier transform
FWHM Full width at half maximum
le Electron escape depth
LOD Limit of detection
LOQ Limit of quantification
MS Mass spectrometry
m/z Mass to charge ratio
n.d. Not detected
NEXAFS Near edge X-ray absorption fine structure
norm. Normalised
PE Photoemission
PSZ Ammonium peroxydisulfated loaded zirconia
RI Ring current
rt Room temperature
SAM Self assembled monolayer
SEM Scanning electron microscopy
SZ Sulfated zirconia
SZcom Sulfated zirconia prepared from a commercial precursor
SZev Sulfated zirconia prepared by the evaporation technique
SZim Sulfated zirconia prepared by the immersion technique
Abbreviations
x
SZiw Sulfated zirconia prepared by the incipient wetness technique
T Temperature
TAP Temporal analysis of products
TDS Thermal desorption spectroscopy
(HR)TEM (High resolution) transmission electron microscopy
TG Thermogravimetry
TPD Temperature programmed desorption
TSZ Ammonium thiosulfate loaded zirconia
UHV Ultra high vacuum
UP(S) Ultraviolet photoelectron (spectroscopy)
wt.% Weight percent
XP(S) X-ray photoelectron (spectroscopy)
XRD X-ray diffraction
Zcom Zirconia prepared from a commercial zirconium hydroxide
1. Introduction
1
1. Introduction
1.1 Catalytic Isomerisation of Alkanes
Hydrocarbon isomerisation is widely applied industrially for the production of both fuels
and petrochemicals.1 Skeletal isomerisation of straight chain alkanes increases their
octane number and hence, also, their commercial value. Octane ratings are indicative of
the antiknock quality of a given fuel or component. The tightened regulation of petrol
over the past two decades, especially the elimination of tetraethyl lead as well as
legislation restricting both benzene and sulfur content, has resulted in the increased
importance of branched light alkanes for the production of clean-burning, high
performance fuels.
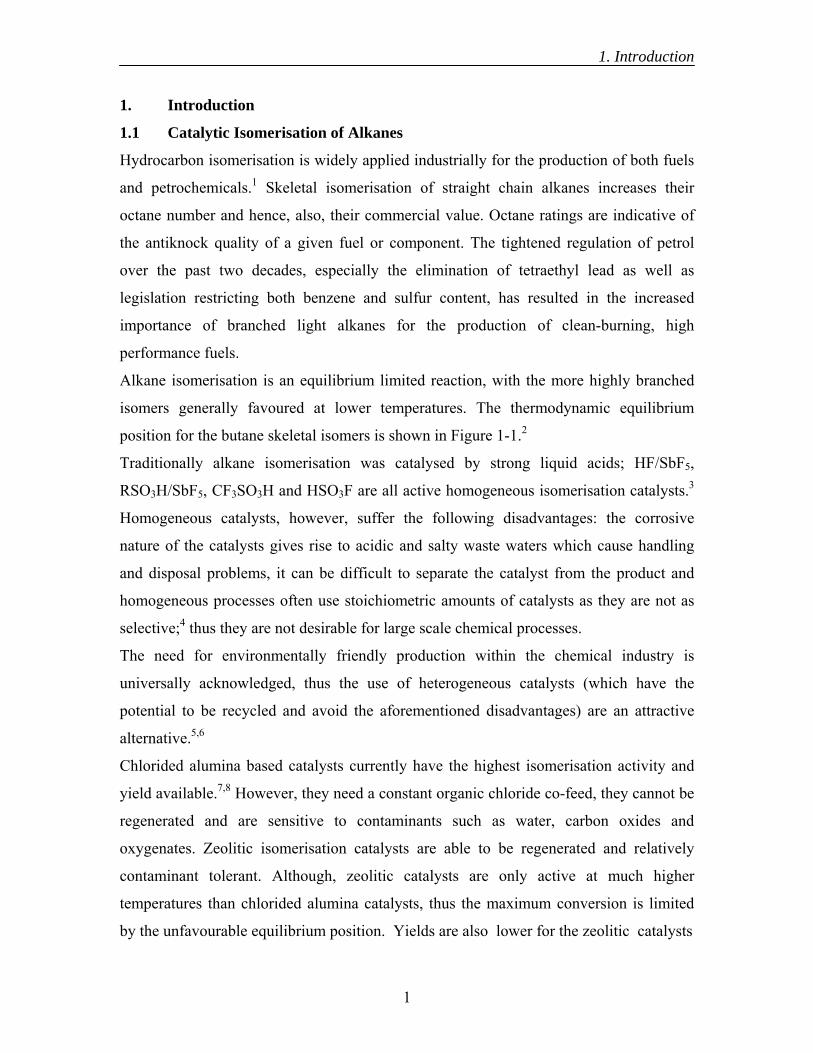
Alkane isomerisation is an equilibrium limited reaction, with the more highly branched
isomers generally favoured at lower temperatures. The thermodynamic equilibrium
position for the butane skeletal isomers is shown in Figure 1-1.2
Traditionally alkane isomerisation was catalysed by strong liquid acids; HF/SbF5,
RSO3H/SbF5, CF3SO3H and HSO3F are all active homogeneous isomerisation catalysts.3
Homogeneous catalysts, however, suffer the following disadvantages: the corrosive
nature of the catalysts gives rise to acidic and salty waste waters which cause handling
and disposal problems, it can be difficult to separate the catalyst from the product and
homogeneous processes often use stoichiometric amounts of catalysts as they are not as
selective;4 thus they are not desirable for large scale chemical processes.
The need for environmentally friendly production within the chemical industry is
universally acknowledged, thus the use of heterogeneous catalysts (which have the
potential to be recycled and avoid the aforementioned disadvantages) are an attractive
alternative.5,6
Chlorided alumina based catalysts currently have the highest isomerisation activity and
yield available.7,8 However, they need a constant organic chloride co-feed, they cannot be
regenerated and are sensitive to contaminants such as water, carbon oxides and
oxygenates. Zeolitic isomerisation catalysts are able to be regenerated and relatively
contaminant tolerant. Although, zeolitic catalysts are only active at much higher
temperatures than chlorided alumina catalysts, thus the maximum conversion is limited
by the unfavourable equilibrium position. Yields are also lower for the zeolitic catalysts
1. Introduction
2
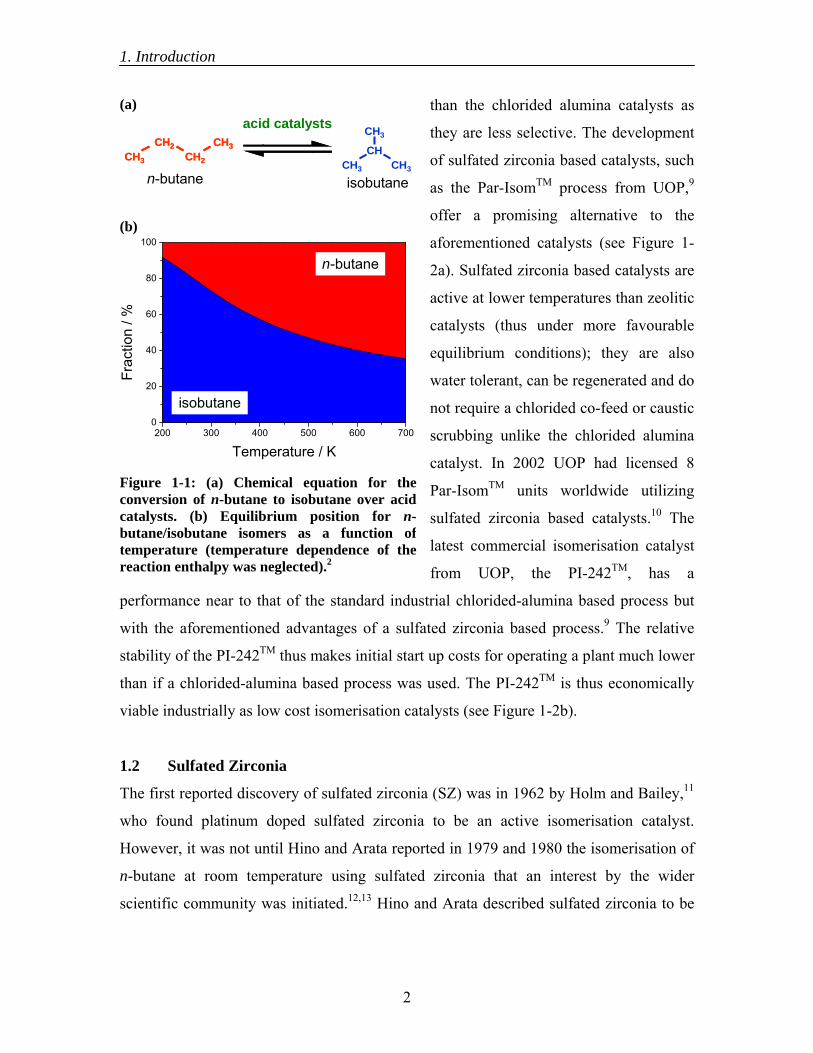
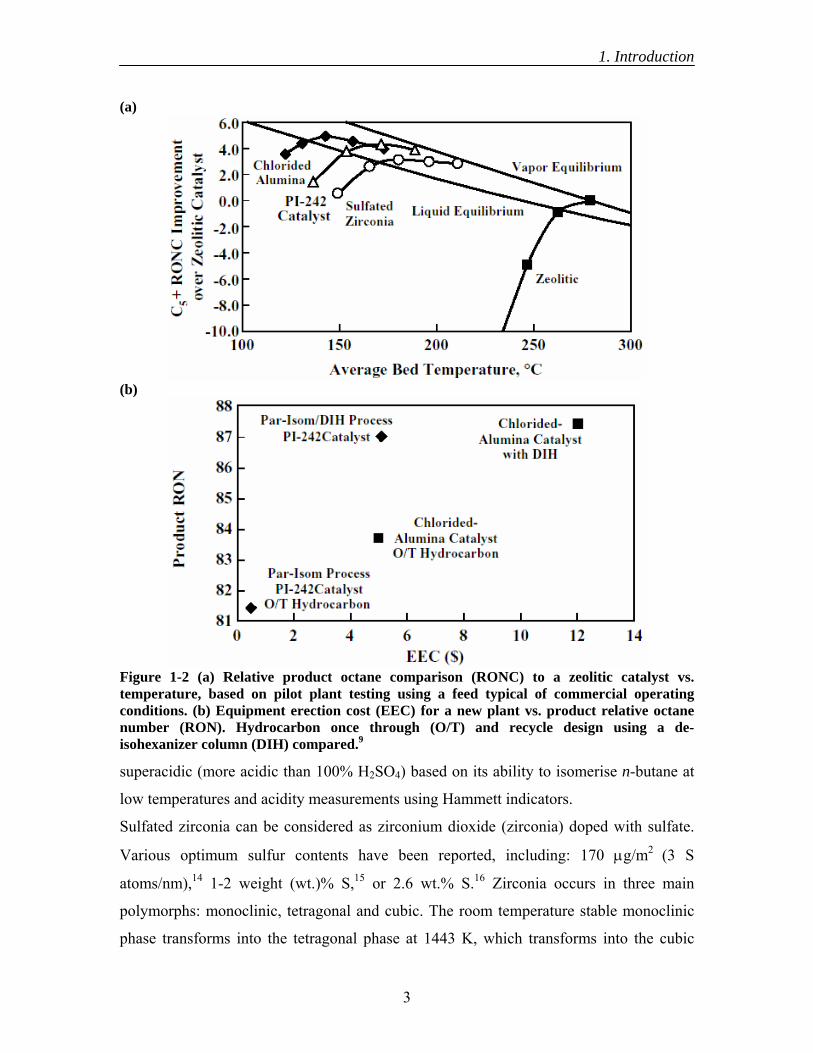
than the chlorided alumina catalysts as
they are less selective. The development
of sulfated zirconia based catalysts, such
as the Par-IsomTM process from UOP,9
offer a promising alternative to the
aforementioned catalysts (see Figure 1-
2a). Sulfated zirconia based catalysts are
active at lower temperatures than zeolitic
catalysts (thus under more favourable
equilibrium conditions); they are also
water tolerant, can be regenerated and do
not require a chlorided co-feed or caustic
scrubbing unlike the chlorided alumina
catalyst. In 2002 UOP had licensed 8
Par-IsomTM units worldwide utilizing
sulfated zirconia based catalysts.10 The
latest commercial isomerisation catalyst
from UOP, the PI-242TM, has a
performance near to that of the standard industrial chlorided-alumina based process but
with the aforementioned advantages of a sulfated zirconia based process.9 The relative
stability of the PI-242TM thus makes initial start up costs for operating a plant much lower
than if a chlorided-alumina based process was used. The PI-242TM is thus economically
viable industrially as low cost isomerisation catalysts (see Figure 1-2b).
1.2 Sulfated Zirconia
The first reported discovery of sulfated zirconia (SZ) was in 1962 by Holm and Bailey,11
who found platinum doped sulfated zirconia to be an active isomerisation catalyst.
However, it was not until Hino and Arata reported in 1979 and 1980 the isomerisation of
n-butane at room temperature using sulfated zirconia that an interest by the wider
scientific community was initiated.12,13 Hino and Arata described sulfated zirconia to be
(a)
n-butane isobutane
acid catalysts
CH2CH3
CH3CH2CH2CH3
CH3CH2
CH3CH3
CH3
CH
(b)
200 300 400 500 600 7000
20
40
60
80
100
n-butane
Frac
tion
/ %
Temperature / K
isobutane
Figure 1-1: (a) Chemical equation for theconversion of n-butane to isobutane over acidcatalysts. (b) Equilibrium position for n-butane/isobutane isomers as a function oftemperature (temperature dependence of thereaction enthalpy was neglected).2
1. Introduction
3
superacidic (more acidic than 100% H2SO4) based on its ability to isomerise n-butane at
low temperatures and acidity measurements using Hammett indicators.
Sulfated zirconia can be considered as zirconium dioxide (zirconia) doped with sulfate.
Various optimum sulfur contents have been reported, including: 170 μg/m2 (3 S
atoms/nm),14 1-2 weight (wt.)% S,15 or 2.6 wt.% S.16 Zirconia occurs in three main
polymorphs: monoclinic, tetragonal and cubic. The room temperature stable monoclinic
phase transforms into the tetragonal phase at 1443 K, which transforms into the cubic
(a)
(b)
Figure 1-2 (a) Relative product octane comparison (RONC) to a zeolitic catalyst vs.temperature, based on pilot plant testing using a feed typical of commercial operatingconditions. (b) Equipment erection cost (EEC) for a new plant vs. product relative octane number (RON). Hydrocarbon once through (O/T) and recycle design using a de-isohexanizer column (DIH) compared.9
1. Introduction
4
phase at 2643 K.17 The metastable tetragonal and cubic phases can be stabilised at room
temperature by the addition of various dopants (including sulfate)18 and also crystallite
size effects (by < 30 nm sized crystals).19-202122 Cubic and tetragonal sulfated zirconias
are active isomerisation catalysts, whereas monoclinic sulfated zirconia has been reported
to be inactive,23 or 4-5 times less active than tetragonal zirconia.24 For mixed monoclinic-
tetragonal phase materials the isomerisation conversion has been shown to be
proportional to the fraction of the tetragonal phase, thus indicating the activity of the
monoclinic phase to be insignificant by comparison.25,26 However, the zirconia phase is
not the only prerequisite for an active catalyst, many other factors are involved.27
1.2.1 Preparation
There are many different methods to prepare sulfated zirconia, the majority of these
routes can be generalised as follows:28 (1) Precipitation via hydrolysis of zirconium salt
solutions followed by sulfation. Typical salts used are ZrOCl2 or ZrO(NO3)2 and possible
sulfation agents include H2SO4, (NH4)2SO4 and (NH4)2S2O8 (2) Sol-gel synthesis from
organometallic zirconium compounds. Sulfuric acid can be used both as the sulfating
agent and to initiate the gelation. (3) Thermal decomposition of zirconium sulfate.
Besides these main preparation routes, various uncommon methods have been reported
and reviewed by Afanasiev et al..29 Sulfated zirconium hydroxides are also commercially
available from suppliers such as MEL chemicals30 and Sigma-Aldrich.31
Normally sulfation is followed by calcination to produce a crystalline oxide. Initially it
was believed that only sulfation prior to calcination results in highly active catalytic
materials;12 however, recently sulfation of crystalline zirconia has been shown to produce
active materials.26 The preparation route is extremely important in the determination of
physical properties of the produced sulfated zirconia, such as its surface area; which is
inherently related to catalytic activity.16,32
Doping of sulfated zirconia with various main group metals (such as Al33 and Ga34) and
transition metals (such as Pt,35 Mn and Fe36) has been shown to promote the
isomerisation activity of the catalyst. How these materials participate in the alkane
isomerisation is a subject of much debate and hence they are considered beyond the scope
of this thesis.
1. Introduction
5
1.2.2 Acidic properties
Sulfated zirconia catalysts were initially believed to be superacidic due to their ability to
isomerise n-butane even at room temperature (which is normally only possible by liquid
superacids) and acidity measurements using Hammett indicators.12,13 There are, however,
a number of drawbacks regarding the indicator technique including the assumptions that
equilibrium is achieved, the active site is an isolated acid and the end point has been
detected.
Direct correlations between the catalytic activities of sulfated zirconia and its acidity are
not consistent across the literature.37 The techniques used to evaluate the acidity of
sulfated zirconia often suffer from experimental problems, such as reaction rather than
desorption during temperature programmed methods. More recent investigations have
revealed the acidity of sulfated zirconia not to be stronger than that of sulfuric acid using
NMR38, UV-Vis39 and IR spectroscopies40 or theoretical calculations.41
Investigations into the type of sites have been made using numerous probes including
pyridine and carbon monoxide; although to date no consistent theories have emerged to
link the catalytic activity of sulfated zirconia to either its Brønsted or Lewis acidic sites.
Characterisation of solid acid-base catalysts remains a challenge as the determination of
acid sites depends on the choice of appropriate probe molecules.
1.2.3 Sulfate structure
It has been shown that only the presence of sulfur in the oxidation state +6 results in
active metal oxide isomerisation catalysts.42-434445 Normally it is assumed that the sulfate
is located at the surface of the zirconia crystals, there is however no proof that this
applies to all of the sulfur present.46
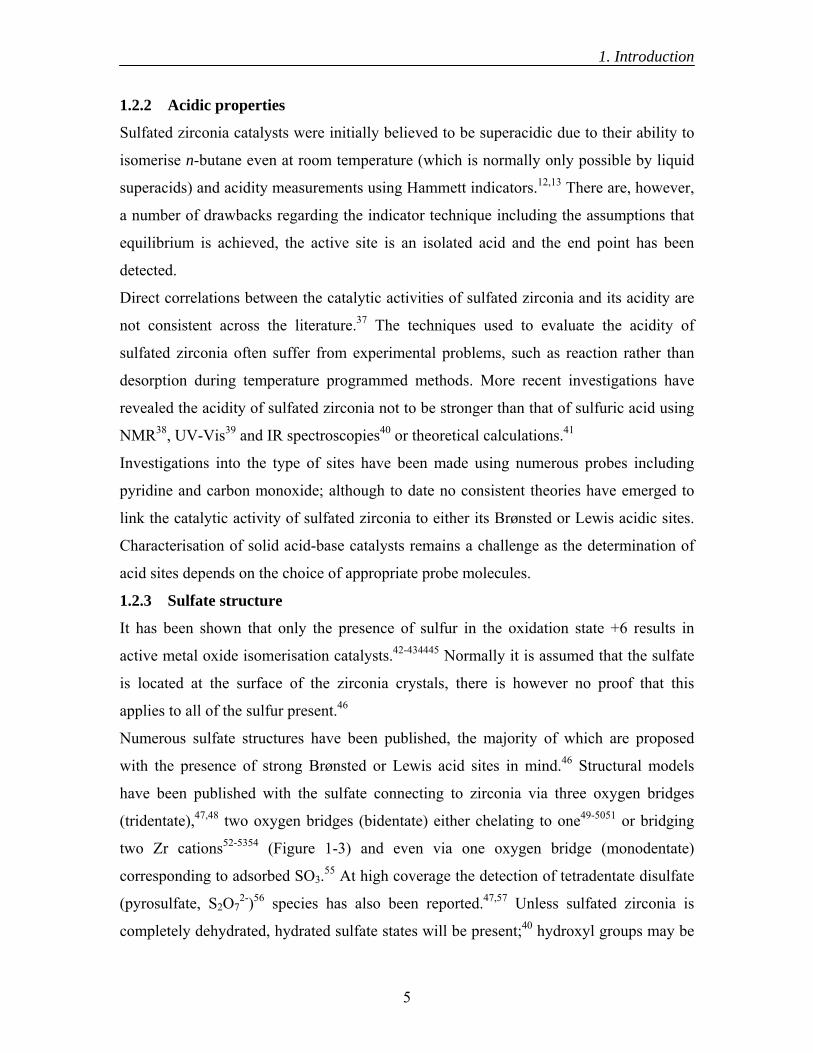
Numerous sulfate structures have been published, the majority of which are proposed
with the presence of strong Brønsted or Lewis acid sites in mind.46 Structural models
have been published with the sulfate connecting to zirconia via three oxygen bridges
(tridentate),47,48 two oxygen bridges (bidentate) either chelating to one49-5051 or bridging
two Zr cations52-5354 (Figure 1-3) and even via one oxygen bridge (monodentate)
corresponding to adsorbed SO3.55 At high coverage the detection of tetradentate disulfate
(pyrosulfate, S2O72-)56 species has also been reported.47,57 Unless sulfated zirconia is
completely dehydrated, hydrated sulfate states will be present;40 hydroxyl groups may be
1. Introduction
6
attached to either S or Zr,40,58-5960 or bridging S and Zr.32,61 From the large number of
models proposed it can be assumed that there is no single sulfate structure but a number
of different coexisting interchangeable species, which depend on various conditions such
as the coverage, degree of hydration, pretreatment and measurement atmosphere.
Recent experimental and theoretical findings62,63 have shown that active catalysts possess
an IR band at ~1404 cm-1, which is ascribed to the S=O bond stretching vibrations in
disulfate or adsorbed SO3 molecules.
1.2.4 Catalytic properties
Prior to reaction, sulfated zirconia must be activated in order to remove excess water
from the material. The catalyst should not, however, be completely dehydrated.
Decreasing the water content has been shown to result in a decrease in Brønsted acidity
and an increase in Lewis acidity.64 Various optimal activation temperatures have been
reported including: 523-573 K,64 573 K,65 590 K,66 673 K,67,65 723 K,68 and 923 K.69 The
range of temperatures may be due to the differing materials; however, other conditions
such as the gas atmosphere, holding time, flow and heating rates may have an influence.
The catalytic performance of sulfated zirconia for the isomerisation of alkanes has
typically one of two different profiles depending on the conditions: (a) an induction
period followed by a slow deactivation or, usually at higher initial conversions, (b) a
shorter induction period, followed by a rapid initial deactivation, then a slow
deactivation. During the initiation period active sites are formed on the catalyst, hence the
activated catalyst can be considered as a "precatalyst" which transforms into the active
species only upon exposure to the reactant. This indicates the importance of investigating
Figure 1-3: Proposed dehydrated sulfate structures.
S S
O
O O O
+
O
OO
OS
O
OO
OS
O
O
O
+ +
Tridentate monosulfate Bidentate monosulfate Tetradentate disulfate
1. Introduction
7
the interaction between sulfated zirconia and the reactant. A number of causes of the
deactivation have been proposed: (i) coke formation,15,66,70-717273747576777879808182 which
other authors have dismissed,83 (ii) reduction of sulfate83 and sulfur loss as H2S,77 (iii)
reduction of Zr4+,71 (iv) tetragonal to monoclinic zirconia phase transformation75,84 and
(v) poisoning by water.73
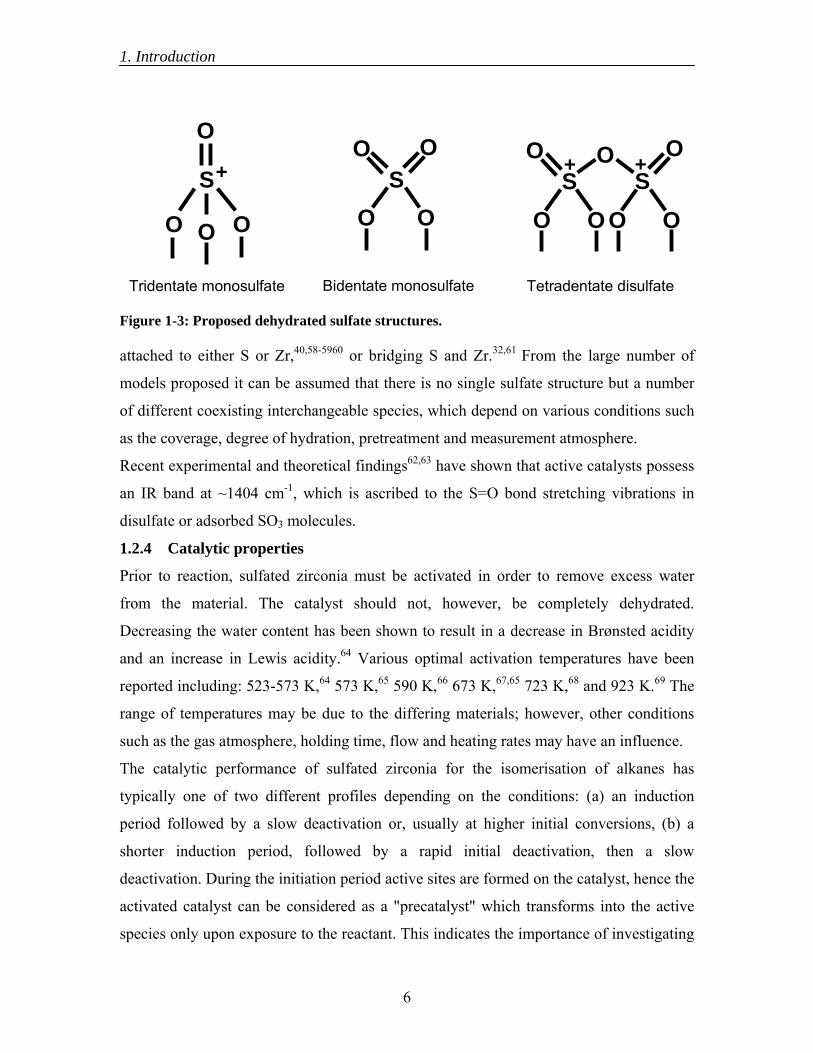
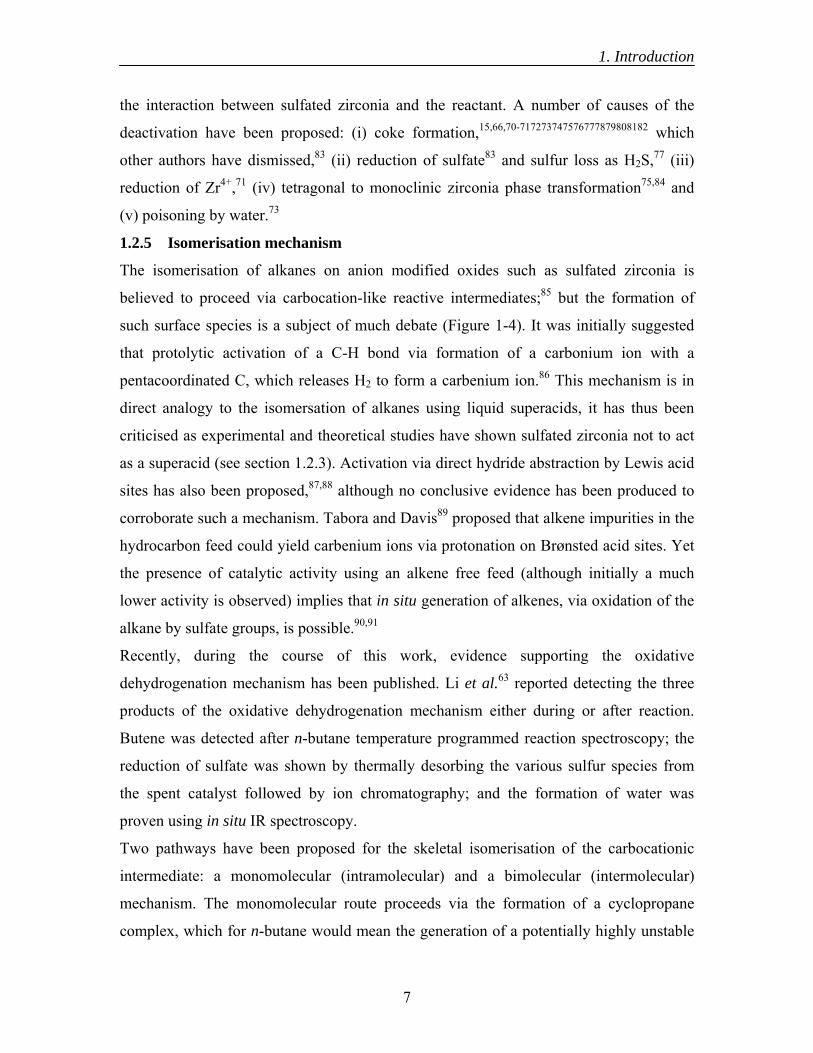
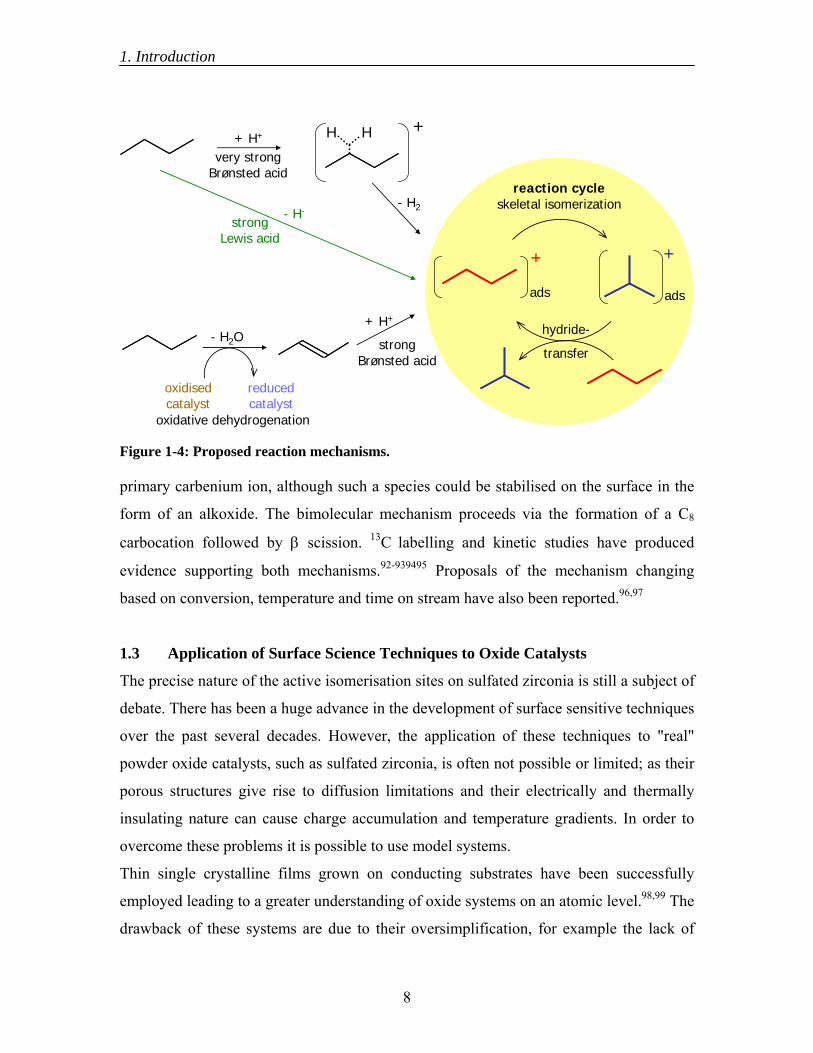
1.2.5 Isomerisation mechanism
The isomerisation of alkanes on anion modified oxides such as sulfated zirconia is
believed to proceed via carbocation-like reactive intermediates;85 but the formation of
such surface species is a subject of much debate (Figure 1-4). It was initially suggested
that protolytic activation of a C-H bond via formation of a carbonium ion with a
pentacoordinated C, which releases H2 to form a carbenium ion.86 This mechanism is in
direct analogy to the isomersation of alkanes using liquid superacids, it has thus been
criticised as experimental and theoretical studies have shown sulfated zirconia not to act
as a superacid (see section 1.2.3). Activation via direct hydride abstraction by Lewis acid
sites has also been proposed,87,88 although no conclusive evidence has been produced to
corroborate such a mechanism. Tabora and Davis89 proposed that alkene impurities in the
hydrocarbon feed could yield carbenium ions via protonation on Brønsted acid sites. Yet
the presence of catalytic activity using an alkene free feed (although initially a much
lower activity is observed) implies that in situ generation of alkenes, via oxidation of the
alkane by sulfate groups, is possible.90,91
Recently, during the course of this work, evidence supporting the oxidative
dehydrogenation mechanism has been published. Li et al.63 reported detecting the three
products of the oxidative dehydrogenation mechanism either during or after reaction.
Butene was detected after n-butane temperature programmed reaction spectroscopy; the
reduction of sulfate was shown by thermally desorbing the various sulfur species from
the spent catalyst followed by ion chromatography; and the formation of water was
proven using in situ IR spectroscopy.
Two pathways have been proposed for the skeletal isomerisation of the carbocationic
intermediate: a monomolecular (intramolecular) and a bimolecular (intermolecular)
mechanism. The monomolecular route proceeds via the formation of a cyclopropane
complex, which for n-butane would mean the generation of a potentially highly unstable
1. Introduction
8
primary carbenium ion, although such a species could be stabilised on the surface in the
form of an alkoxide. The bimolecular mechanism proceeds via the formation of a C8
carbocation followed by β scission. 13C labelling and kinetic studies have produced
evidence supporting both mechanisms.92-939495 Proposals of the mechanism changing
based on conversion, temperature and time on stream have also been reported.96,97
1.3 Application of Surface Science Techniques to Oxide Catalysts
The precise nature of the active isomerisation sites on sulfated zirconia is still a subject of
debate. There has been a huge advance in the development of surface sensitive techniques
over the past several decades. However, the application of these techniques to "real"
powder oxide catalysts, such as sulfated zirconia, is often not possible or limited; as their
porous structures give rise to diffusion limitations and their electrically and thermally
insulating nature can cause charge accumulation and temperature gradients. In order to
overcome these problems it is possible to use model systems.
Thin single crystalline films grown on conducting substrates have been successfully
employed leading to a greater understanding of oxide systems on an atomic level.98,99 The
drawback of these systems are due to their oversimplification, for example the lack of
Figure 1-4: Proposed reaction mechanisms.
+
ads
+
ads
hydride-
transfer
reaction cycleskeletal isomerization
H H +
very strong Brønsted acid
- H2
- H2O
reduced catalyst
oxidisedcatalyst
oxidative dehydrogenation
+ H+
strong Brønsted acid
- H-strong
Lewis acid
+ H+
1. Introduction
9
defects and support interaction, extrapolating to "real" powder catalysts has had limited
success. Alternatively, particles supported on flat model supports have also been
investigated.100,101 By depositing a thin oxide or carbon film on an inert conducting
substrate serious charging accumulation can be avoided, even if the film is an insulator.
The catalytic material can thus be deposited on this support. Such systems are inherently
more complex than the flat continuous single crystalline films.
Various methods exist for depositing oxide films or particles on flat substrates, including:
evaporation of metals followed by oxidation, chemical vapor deposition (vacuum dosing
of volatile organometallic precursors), wet chemical impregnation (such as spin or dip
coating of organometallics) or microfabrication via lithography. The resulting model
systems allow the application of surface spectroscopies.
1.3.1 Sulfated zirconia thin solid films
The specific chemical and physical properties of zirconia films have been extensively
studied due to their promising technological applications; for example as wave guides
when deposited on glass substrates,102 thermal barrier coatings103 and protective coatings
from abrasion, wear and wet corrosion.104 Numerous different methods for the synthesis
of zirconia films have been published, therefore only zirconia films incorporating sulfate
are commented on below.
Anodic oxide films have been prepared electrochemically on zirconium rods in sulfate
containing electrolytes by various groups.105-106107108109110111112113114 Zirconium, unlike
most metals, is known to incorporate anions from solutions during anodic
oxidation.107,115-116117 Rogers et al.107 showed the sulfur content of anodic zirconia films
to vary linearly from approximately 5 to 35x1020 atoms/cm3 with increasing the ionic
current density. Meisterjahn et al.108 reported a linear film growth of 2.6 nm/V (up to
9 V) on an initial oxide thickness of 4-6 nm. Pauporte and Finne114 were able to grow
dense 300-340 nm anodic zirconia films.
De Guire and co-workers118-119120 developed a method to prepare sulfated zirconia films
by chemical deposition of zirconium sulfate from an aqueous acid stabilised medium on
sulfonic acid terminated self-assembled monolayers (SAMs) attached to oxidised silicon
wafers. Surface morphology studies of such zirconia films found in addition to the film,
particles of 200 nm and larger embedded in the film.121,122 Further development to
1. Introduction
10
prevention of homogenous deposition, by lowering of the film deposition temperature,
resulted in smooth, non-porous, continuous sulfated zirconia thin films.123,124
transmission electron microscopy (TEM) investigations have shown annealing the films
to produce tetragonal sulfated zirconia.125-126127 More details regarding the preparation
and thermal treatment of these films are given in Chapter 2. Investigations of the stability
of the sulfated zirconia precursor solution have been performed,128 as well as on the
forces between the SAMs and zirconia particles in solution.129 Mechanical properties of
sulfated zirconia films prepared from similar aqueous depositions on SAM covered
substrates have also been studied.130-131132
Rizzato et al.133 prepared sulfated zirconia films on borosilicate glass surfaces by sol-gel
dip coating. Layer thickness was shown to increase with increasing withdrawal speed
(from ~25 to 100 nm) and decreases with thermal treatment. At temperatures below 623
K the films were shown to have a pore free structure, which consists of an inner layer of
Zr18O4(OH)36(SO4)9(Cl)6 and a thin (~2 nm) superficial layer of
Zr18O4(OH)38.8(SO4)12.6·33H2O.
Lin et al.134 reported the direct liquid phase deposition of sulfated zirconia films on
silicon wafers via the hydrolysis of zirconium sulfate with varying concentrations of
ammonium peroxydisulfate (persulfate, S2O82-).56 The ammonium peroxydisulfate
suppressed the zirconium precipitation and improved the film growth via heterogeneous
nucleation on the silicon. Film thicknesses of up to 200 nm were obtained. Thermal
treatment of the films at 873 K resulted in the formation of the tetragonal phase.
Meinel et al.135 prepared single-crystalline cubic sulfated zirconia films by reactive
deposited of Zr onto Pt(111) in an O2 atmosphere, followed by exposure to a SO3
atmosphere. During sulfation a (√3 x √3)R30° structure develops, which is stable to
700 K.
1.4 Objectives and Strategy
The main aim of this thesis is to investigate the isomerisation sites on sulfated zirconia by
the application of surface science techniques, which is made possible by the use of a
model thin film system. Fischer and co-workers123,124 described the preparation of
nanocrystalline thin films that are potentially suitable models for powder sulfated
1. Introduction
11
zirconia catalysts. The thinness of such films permits thermal and electrical conductivity,
the homogenous flat surface of the films prevents diffusion and simplifies the system,
while their nanocrystalline nature permits the chemical complexity and existence of
defects to yield catalytically relevant activity; hence films of this type can be considered
to act as a bridge between the materials gap in catalysis, which exists between "real"
powder catalysts and "ideal" single crystalline materials.
The main goals of the thin film investigations in this thesis are to:
(i) Produce model sulfated zirconia thin films based on the process described by
Fischer and co-workers.123,124
(ii) Investigate the role of the thermal treatment of the films.
(iii) Characterise the (acidic) surface sites via adsorption of probe molecules.
(iv) Validate the model system via proof of its catalytic reactivity.
During the course of this work, reports proposing the active calcined sulfate structure to
be that of disulfate were published.62,63 Active catalysts were shown to develop an IR
band at ~1404 cm-1, which theoretical studies have shown can only arise from disulfate or
adsorbed SO3 molecules. Thus as a complementary study to the thin films investigations
in this thesis, the rational design of a disulfated zirconia powder catalyst has been
attempted. The goals of this sub-project are to:
(i) Synthesise sulfated zirconia powders from sulfating agents containing two
pregrouped sulfur atoms and an analogous mono-sulfur precursor.
(ii) Compare their catalytic activities.
(iii) Attempt to relate any catalytic differences observed to the proposed
disulfate IR band at ~1404 cm-1.
The two strategies of this thesis are designed to test recent proposals of the scientific
community and increase the understanding with regards to the surface chemistry of
sulfated zirconia catalysts. In order to improve our fundamental knowledge of how
sulfated zirconia catalysts work only un-promoted catalysts and the simplest skeletal
isomerisation test reaction (n-butane to isobutane) have been investigated.
2. Synthesis and Thermal Treatment of Sulfated Zirconia Thin Films
12
2. Synthesis and Thermal Treatment of Sulfated Zirconia Thin Films
2.1 Introduction
2.1.1 Biomimetic synthesis of oxide thin films
The production of oxide thin films by the so-called biomimetic processing was pioneered
by the work of Bunker and co-workers.136 The main principle of such a preparation is to
use a self-assembled monolayer (SAM) to mediate film deposition from an aqueous
medium at low temperatures; thus mimicking biological growth of ceramics. Immersion
of a SAM covered substrate into a deposition medium, consisting of a dissolved metal
salt, results in the formation of a film consisting of an oxide or a potential oxide precursor
(such as a hydroxide, sulfate or carbonate depending on the anions present). Two
different mechanisms for film deposition are discussed in the literature:137,138 (i) cluster
growth of particles in the liquid phase (homogeneous) followed by adsorption on the
SAM and coagulation to form a film and (ii) ion by ion, via successive adsorption of
anions and cations on the substrate (heterogeneous nucleation). Deposition conditions can
dictate which deposition mechanism is observed. The two mechanisms may also occur
simultaneously.137 Successful biomimetic syntheses promote heterogeneous nucleation
and suppress homogeneous nucleation.136
2.1.2 Self-assembled monolayers
SAMs are molecular assemblies that are spontaneously formed on an appropriate
substrate when immersed into a solution of active surfactant in an organic solvent.139,140
Various reviews have reported on their synthesis, structure and properties.141-142143 There
are a number of different ways of preparing SAMs, these include: organosilicates on
hydroxlyated surfaces (e.g. SiO2 on Si); alkanethiols on gold, silver and copper; dialkyl
sulfides on gold; dialkyl disulfides on gold; alcohols and amines on platinum; and
carboxylic acids on aluminum oxide and silver.144
SAMs can be considered to consist of three parts: a head group, an alkyl body -(CH2)-
and a tail group. The head group binds to the substrate via chemisorption. This is an
exothermic process (typically in the order of 10s kJ/mol) and results in the apparent
pinning of the SAM to a specific site on the substrate. Although, as a result of the strong
molecular interaction with the substrate the head groups try to occupy every available
binding site on the surface, during this process they push together molecules that are
2. Synthesis and Thermal Treatment of Sulfated Zirconia Thin Films
13
already adsorbed. In the case of trichorosilyl head groups cross linking also occurs,
increasing the stability of the SAM.
The close packing of the alkyl chains gives rise to short range van der Waals forces
(typically up to 40 kJ/mol). A minimum chain length of ~9 carbon atoms is necessary to
stabilise the formation of a SAM. Chain lengths above ~20 carbon atoms result in
solubility problems. The highest degree of ordering and stability has been reported for
surfactant molecules with carbon chain length of 16 atoms. In the case of trichlorosilyl
head groups, the chemisorption, cross linking and van der Waals forces can result in the
SAM being stable to prolonged exposure in pHs ranging from strongly acidic to mildly
basic, at temperatures up to 313 K.
The tail or surface group of the SAM can be chosen from a number of species, including:
sulfonate, thioacetate, hydroxyl and methyl. Sulfonate tail groups are very effective in
initiating and sustaining the formation of oxide thin films when immersed in an
appropriate precursor solution. However, sulfonate tail groups cannot be used in
combination with trichloromethyl head groups, as they both have similar propensities to
react with substrate hydroxyl groups. It is however possible to transform the tail group in
situ after deposition of the SAM for the generation of specific reactive tail groups, for
example the oxidation of thioacetate to sulfonate.
2.1.3 Aqueous zirconium sulfate solutions
The solution chemistry of zirconium sulfate is complex because sulfate not only strongly
complexes with zirconium145,146 but is a potential bridging ligand and promotes
polymerization.147,148 Anion149-150151 mixed hydroxo sulfato complexes,148 also of
polynuclear type, are formed in sulfate solutions. Zirconium sulfate solutions are unstable
with regards to hydrolysis and precipitation. Heating promotes hydrolysis and hence
precipitation. The large number of possible sulfates, particularly basic sulfates, of various
constitutions that are precipitated from zirconium sulfate solutions suggest that many
complexes of different constitutions may exist in solution. The chemistry of zirconium
sulfate solutions may be ruled by complicated equilibria. The time frame for changes in
these solutions indicates the equilibration is slow. Hauser152 observed precipitation in
0.5 M zirconium sulfate solutions only after 2 weeks at 312.5 K. Matijević147 delayed the
onset of precipitation of 0.2 mM zirconium sulfate solutions by 10 h, 2 or 4 days using 1,
2. Synthesis and Thermal Treatment of Sulfated Zirconia Thin Films
14
2 or 4 mM nitric acid solutions, respectively. Cölfen et al.128 showed that for solutions
containing low zirconium sulfate concentrations (2 or 4 mM) and high acid
concentrations (0.4 or 0.6 M HCl) switching between relatively moderate temperatures of
323 to 343 K results in a change from long-term metastable (more than 96 hours) to
rapidly precipitating (30 minutes) conditions.
2.1.4 SAM mediated sulfated zirconia thin film growth
De Guire and co-workers118119-120 showed that zirconium containing films could be grown
on oxidized silicon wafers via SAM mediated aqueous deposition. They demonstrated
that SAMs formed from the following precursors promoted film growth:
trichlorosilylhexadecane thioacetate, hexadecyl trichlorosilane and octadecyl
trichlorosilane. The SAMs formed from trichlorosilylhexadecane thioacetate and
hexadecyl trichlorosilane needed to be converted to sulfonate terminated SAMs via
exposure to gaseous SO3 or immersion in a saturated aqueous solution of
KHSO5·KHSO4·K2SO4, respectively. In the absence of a SAM no film growth was
observed, as shown by XPS measurements. The films were grown from aqueous
solutions of either 4 mM zirconium sulfate in 0.4 M HCl or 10 mM zirconium sulfate in
0.6 M HCl, at 343 K, during single depositions between 0.5 and 24 hours or four
successive 1 hour immersions in freshly prepared solutions. After approximately 30
minutes at 373 K a visible cloudiness was observed in the deposition medium, indicating
bulk (homogeneous) precipitation. Cross section TEM measurements revealed, prior to
bulk precipitation films of only 3 nm thickness could be grown; following bulk
deposition films could be grown up to a maximum of 40 or 125 nm, during one
immersion, in 4 or 10 mM zirconium sulfate solutions, respectively. The successive 1
hour immersions in freshly prepared deposition medium produced a film of 180 nm.
Films grown on the sulfate free SAM (formed from octadecyl trichlorosilane) were
shown to contain sulfate by XPS measurements. The films grown on sulfonate terminated
SAMs were found to be adherent to the substrate using a tape peel test, this was not the
case for those grown on the SAM formed from octadecyl trichlorosilane. Atomic force
microscopy (AFM) and scanning electron microscopy (SEM) topography studies121,122
found that in addition to film formation, particles of typically 0.5-1 μm in diameter (SEM
and AFM) and 30-50 nm in depth (AFM) are embedded in the films.
2. Synthesis and Thermal Treatment of Sulfated Zirconia Thin Films
15
Fischer and co-workers123,124 found by lowering the film deposition temperature from
343 K to 323 K that the presence of particles in the film could be avoided; thus resulting
in smooth, non-porous, continuous sulfated zirconia thin films. Roddatis et al.126,127
showed by cross sectional TEM measurements the growth rate of the films deposited
between 2-96 hours to be constant, at ~1 nm/h. The deposited films were also shown, by
high resolution (HR)TEM, to be initially amorphous; however, electron beam irradiation
was shown to induce the formation of 5-10 nm tetragonal crystals.
Wang et al.130,131 have also prepared films from 0.4 mM zirconium sulfate on sulfonated
SAM of 3-mercaptopropyl trimethoxysilane at both 343 and 323 K in 0.4 M HCl. After 6
hours deposition at 343 K a film of 68 nm with ~300 nm quadratic-looking features was
observed. At 323 K, however, much smoother films were produced, the film growth rate
was shown to be ~1 nm/h between 20-100 hours.
More recently Zhang et al.132 prepared films from 0.01 M zirconium sulfate solutions
containing 0.4-0.1 M HCl at temperatures of 343-363 K for 0.5-24 hours, on a SAM
formed from diethylphosphatoethyltriethoxysilane and hydrolysed in HCl. In addition
films were also formed hydrothermally in an acid digestion bomb at 408 K for 24 hours,
during which the pressure was about 5 atm.
2.1.5 Thermal treatment of heterogeneously deposited sulfated zirconia thin films
Fischer and co-workers123,124 also investigated the effects of thermal treatment in either
argon or synthetic air at 773 K on heterogeneously deposited films. AFM and SEM
investigations show the films surfaces to be smooth and free from cracks after treatment
in both atmospheres.
Roddatis et al,126,127 studied, using HRTEM, heterogeneously deposited films thermally
treated at various temperatures in argon. Fourier transform analysis of selected areas of
the HRTEM images showed that below 798 K the structure does not change from the
amorphous state, whereas at 823 K crystallisation of the zirconia to the tetragonal state
occurs and above 873 K a small amount of monoclinic zirconia is seen. HRTEM images
show that the 823 K treatment produces a continuous polycrystalline zirconia film,
thinner than the as-deposited film by 60–70%, with 10–50 nm grain sizes.
2. Synthesis and Thermal Treatment of Sulfated Zirconia Thin Films
16
2.1.6 Aims
To allow the application of surface science techniques to sulfated zirconia, thin films as
described by A. Fischer123,124 will be produced. The chemical and physical properties of
the films will be studied in order to ensure that the films are a suitable chemical model
system for sulfated zirconia, conducting and non-porous. If the film synthesis is not
successful, further efforts will be made to modify the system and its synthesis.
Thermal treatment of the films produced will be investigated in both an inert and an
oxidising atmosphere with equivalent temperature programs; in order to study both the
chemical and physical effects of the SAM decomposition and film crystallization.
In order to further bridge the materials gap with "real" powder catalysts of varying
compositions, synthesis of an analogous powder catalyst was attempted. The analogous
powder was produced from the same precursor material as the thin films, thus mimicking
their preparation; however a higher deposition temperature was used in order to allow
precipitation of the powder.
2.2 Experimental
2.2.1 Film synthesis
2.2.1.1 Substrate preparation
Single crystal silicon (100) 1 cm2 wafers were used as the substrate, either p-type, 10
mOhm.cm, 750 μm thick polished on both sides or n-type, 4.2 Ohm.cm, 1.3 mm thick
with a groove drilled into the side for thermocouple placement, polished on one side. The
silicon wafers were cleaned using laboratory tissues and solvents (sequentially
chloroform, acetone, ethanol and water). Millipore® filtered water was used for all
preparation steps. The silicon wafers were then treated in Standard Clean 1 (SC1)153: 1
part 27% ammonia, 1 part 30% hydrogen peroxide to 5 parts water at 343 K for 40
minutes, followed by Standard Clean 2 (SC2)153: 1 part 32% hydrochloric acid, 1 part
30% hydrogen peroxide to 5 parts water also at 343 K for 40 minutes. Oxidation of the
wafers was performed in “piranha” solution (3 parts 30% hydrogen peroxide to 5 parts
conc. sulfuric acid) at 353 K for 50 minutes. On removal the wafers were rinsed with
water and dried in an argon stream.
2. Synthesis and Thermal Treatment of Sulfated Zirconia Thin Films
17
2.2.1.2 Self assembled monolayer deposition and functionalisation
To deposit the SAM, the wafers were immersed in a solution of 50 μl of 1-thioacetato-
16-(trichlorosilyl)hexadecane in 5 ml of bicyclohexyl for 5 h under an argon atmosphere
using a glove bag. The hydrophobic terminal thioacetate group of the SAM was then
oxidized in a saturated aqueous solution of KHSO5·KHSO4·K2SO4 for 5 hours.
2.2.1.3 Deposition of the sulfated zirconia precursor film
After oxidation the wafers were rinsed with water and transferred immediately into the
deposition medium, an aqueous solution of 4 mM zirconium (IV) sulfate tetrahydrate in
0.4 M hydrochloric acid. The temperature of the deposition medium was ramped slowly
(~1 K/min) to 323 K, in individual deposition tubes using a water bath. Films were
deposited over time periods of 24-96 h in order to prepare films of various thicknesses to
suit the different characterisation techniques employed; thinner films to maximise the
conductivity of the samples and thicker to minimise substrate contributions. On removal
from the deposition medium the films were rinsed with water and blown dry using argon.
2.2.1.4 Thermal treatment of the thin films
Thermal treatment of the films was performed in an inert atmosphere (pyrolysis), either
argon or nitrogen (to avoid potential heat damage to the film from combustion of the
SAM) or in air (calcination, to mimic the powder preparation). The films were heated to
823 K in 125 ml/min of the chosen atmosphere for 2 h, ramping the temperature up and
down at 5 K/min.
2.2.2 Synthesis of an analogous sulfated zirconia powder
2.2.2.1 Precipitation of the powder
Analogous aqueous solutions to those used to deposit the sulfated zirconia precursor
films, of 4 mM zirconium (IV) sulfate tetrahydrate in 0.4 M hydrochloric acid, were
heated to 343 K in order to initiate bulk precipitation. After either 76 or 96 h at 343 K the
precipitate was filtered, rinsed with water and dried in air.
2.2.2.2 Thermal treatment of the precipitate
Batches of the precipitated powder were heated to 823 K for 2 h in 125 ml/min of
nitrogen or in 125 ml/min of synthetic air to the following temperatures: 873, 898, 923,
948, 973 and 998 K for 3 h. In all cases the oven temperature was ramped up and down at
5 K/min.
2. Synthesis and Thermal Treatment of Sulfated Zirconia Thin Films
18
2.2.3 Characterisation techniques
2.2.3.1 XPS
The surface chemical composition of the films was investigated by X-ray photoelectron
spectroscopy (XPS) using the Mg Kα excitation (hν = 1256.3 eV) with a pass energy of
30 eV. A Shirley background was subtracted and binding energies were corrected to
Zr 3d5/2 = 182.2 eV of ZrO2.154 Atomic sensitivity factors for Zr 3d, O 1s, and S 2s were
taken from reference 155.
2.2.3.2 SEM
Topographical imaging of the films was performed using a Hitachi S-4100 scanning
electron microscope (SEM) with a Thermo Noran System SIX energy dispersive X-ray
detector (EDX). The SEM was operated at 5 kV using a working distance of 9 mm for
imaging and 15 mm for EDX measurements.
2.2.3.3 TEM
Cross section high resolution transmission electron microscopy (HRTEM) was performed
on 24 and 48 h deposited calcined films. The samples were prepared by first cutting the
wafers and gluing them together, film surface to film surface, then mechanically
polishing and dimpling them down to 5-10 μm, followed by ion milling with a Gatan
precision ion polishing system operated at 3.5 kV using Ar+ ions. In order to minimise
heating of the samples a single unfocused ion beam was used and the samples were
rotated.
Analysis was performed using a Philips CM200 electron microscope with a field
emission gun operated at 200 kV, additionally featuring a Tridiem Gatan imaging filter
and a Genesis 4000 energy-dispersive X-ray spectrometer. The microscope has a
maximum resolution of 0.18 nm. Fast Fourier transformation was employed to analyse
the structure of small areas or individual grains.
2.2.3.4 XRD
The X-ray diffraction (XRD) measurements were performed using a STOE STADI P
transmission diffractometer equipped with a primary focusing Ge monochromator (Cu
Kα1 radiation) and a position sensitive detector. The powders were mounted between two
layers of X-ray amorphous polyacetate (Mylar) foil, using a small amount of X-ray
2. Synthesis and Thermal Treatment of Sulfated Zirconia Thin Films
19
amorphous grease to hold the powder in place. The foils were clamped into a ring shaped
holder which rotates during the measurement.
Fittings of the diffractograms were performed with the program Topas v.3.0 (Bruker
AXS), using the Rietveld method, to give a monoclinic to tetragonal ratio. The
calculations of the theoretical peak intensities for monoclinic and tetragonal zirconia
were based on ICSD156 entries 89426 and 97004, respectively.
2.3 Results
2.3.1 As deposited films
XPS measurements of the as deposited films (Figure 2-1) show signals arising from
zirconium, oxygen, sulfur, carbon and silicon. Signals from the silicon substrate decrease
with increasing deposition time. Two maxima of the Si 2p were detected, one at Si 2p3/2 =
99.7 eV consistent with Si(100) and the other at Si 2p(3/2+1/2) = 103.7 eV, in accordance
with oxidised silicon.154 Signals arising from the zirconia film were shifted towards
higher binding energies because of charging, an offset of around 2.2 eV was observed.
Thus the maximum of the S 2p (S 2p3/2+1/2) signal was detected at 168.4 eV, indicating a
sulfur oxidation state of +6. The O 1s signal is composed of at least two peaks, the lower
binding energy peak at around 529.4 eV relates to oxide anions and the higher binding
energy peak at ca. 531.1 eV corresponds to sulfate and hydroxide species. Assuming the
charging correction is also valid for the carbon signal, the C 1s peak has a maximum at
~284.0 eV, which is similar to the reported value of "chain" carbon157 as would be
expected from the SAM.
SEM images (not shown) reveal the surface of the as deposited films to be continuous,
mainly smooth and homogeneous. However, spherically shaped particles of up to 1-2 μm
are observed on the film surface. EDX analyses reveal these particles to consist of
zirconium, oxygen and sulfur.
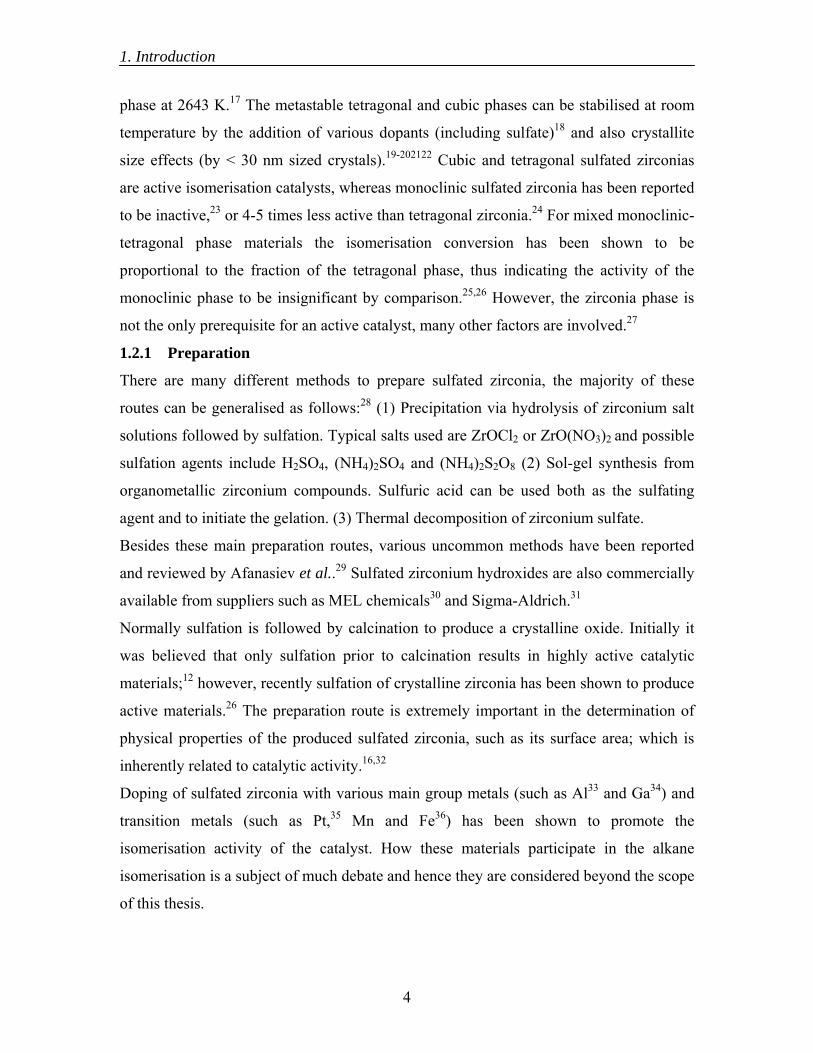
2.3.2 Thermal treatment of films
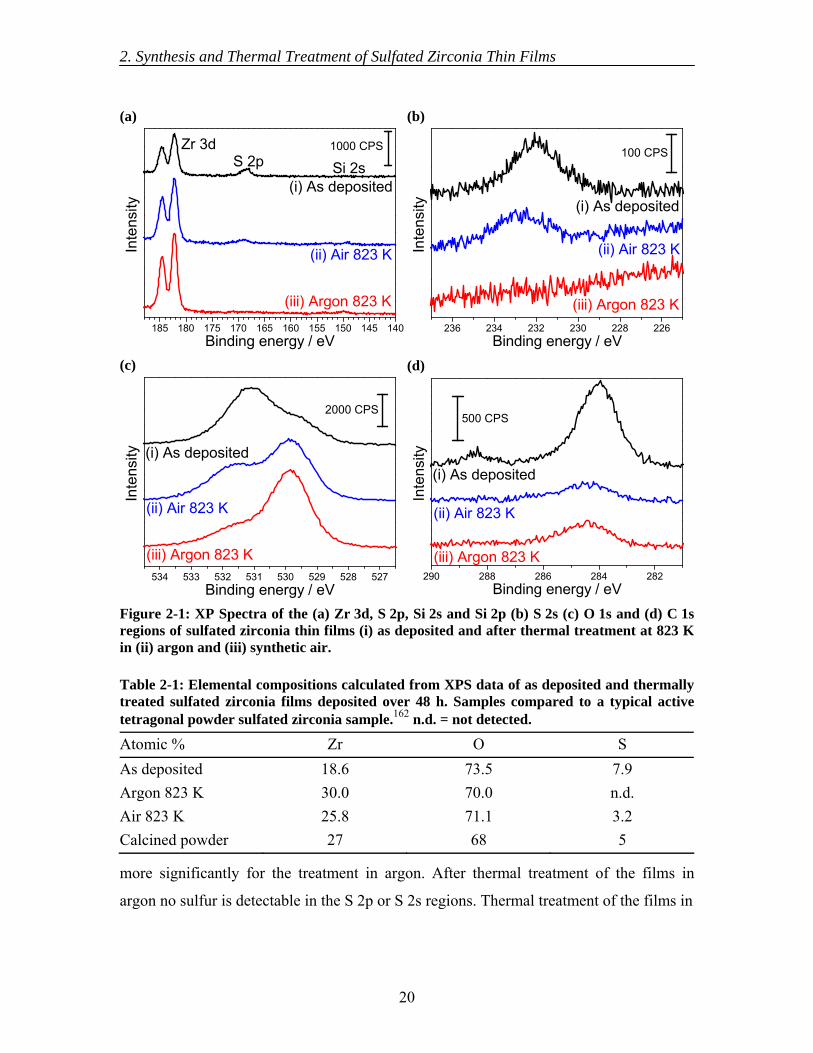
XP spectra of the films after the different thermal treatments show the loss of sulfur, as is
apparent from both the S 2p and S 2s (Figures 2-1a and b) regions as well as from the
O 1s signal (Figure 2-1c). The higher binding energy component of the O 1s signal
(relating to hydroxyl and sulfate groups) is reduced after both thermal treatments, but
2. Synthesis and Thermal Treatment of Sulfated Zirconia Thin Films
20
more significantly for the treatment in argon. After thermal treatment of the films in
argon no sulfur is detectable in the S 2p or S 2s regions. Thermal treatment of the films in
(a)
185 180 175 170 165 160 155 150 145 140
1000 CPS
Si 2sS 2p
(ii) Air 823 K
(iii) Argon 823 K
(i) As deposited
Inte
nsity
Binding energy / eV
Zr 3d
(b)
236 234 232 230 228 226
100 CPS
(ii) Air 823 K
(iii) Argon 823 K
(i) As deposited
Inte
nsity
Binding energy / eV(c)
534 533 532 531 530 529 528 527
2000 CPS
(ii) Air 823 K
(iii) Argon 823 K
(i) As deposited
Inte
nsity
Binding energy / eV
(d)
290 288 286 284 282
500 CPS
(ii) Air 823 K
(iii) Argon 823 K
(i) As deposited
Inte
nsity
Binding energy / eVFigure 2-1: XP Spectra of the (a) Zr 3d, S 2p, Si 2s and Si 2p (b) S 2s (c) O 1s and (d) C 1s regions of sulfated zirconia thin films (i) as deposited and after thermal treatment at 823 K in (ii) argon and (iii) synthetic air.
Table 2-1: Elemental compositions calculated from XPS data of as deposited and thermallytreated sulfated zirconia films deposited over 48 h. Samples compared to a typical active tetragonal powder sulfated zirconia sample.162 n.d. = not detected.
Atomic % Zr O S As deposited 18.6 73.5 7.9 Argon 823 K 30.0 70.0 n.d. Air 823 K 25.8 71.1 3.2 Calcined powder 27 68 5
2. Synthesis and Thermal Treatment of Sulfated Zirconia Thin Films
21
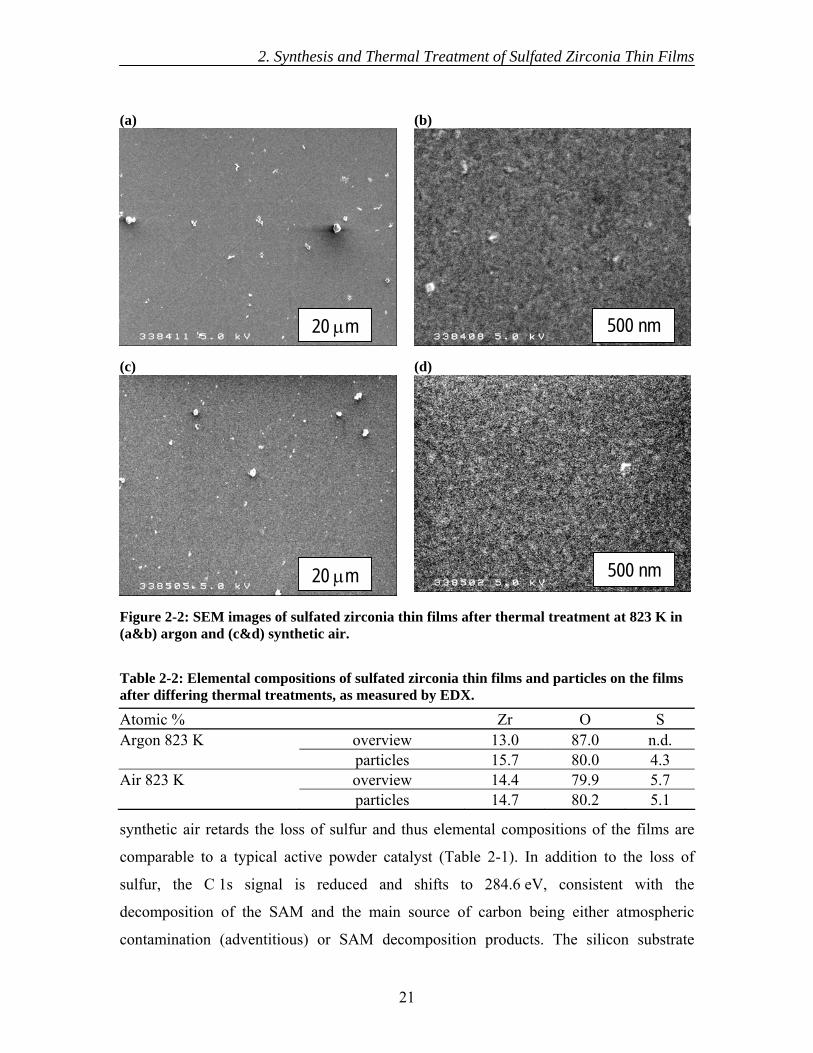
synthetic air retards the loss of sulfur and thus elemental compositions of the films are
comparable to a typical active powder catalyst (Table 2-1). In addition to the loss of
sulfur, the C 1s signal is reduced and shifts to 284.6 eV, consistent with the
decomposition of the SAM and the main source of carbon being either atmospheric
contamination (adventitious) or SAM decomposition products. The silicon substrate
(a)
20 μm
(b)
500 nm
(c)
20 μm
(d)
500 nm
Figure 2-2: SEM images of sulfated zirconia thin films after thermal treatment at 823 K in (a&b) argon and (c&d) synthetic air.
Table 2-2: Elemental compositions of sulfated zirconia thin films and particles on the films after differing thermal treatments, as measured by EDX. Atomic % Zr O S Argon 823 K overview 13.0 87.0 n.d. particles 15.7 80.0 4.3 Air 823 K overview 14.4 79.9 5.7 particles 14.7 80.2 5.1
2. Synthesis and Thermal Treatment of Sulfated Zirconia Thin Films
22
peaks are more prominent after thermal treatment, indicating a decrease in layer
thickness. Estimation of the thickness of the air-treated films from the intensity of the
Si 2p signal (using an electron mean free path taken from reference 158) yields values of
2–12 nm, increasing linearly with deposition time (see Figure 2-4).
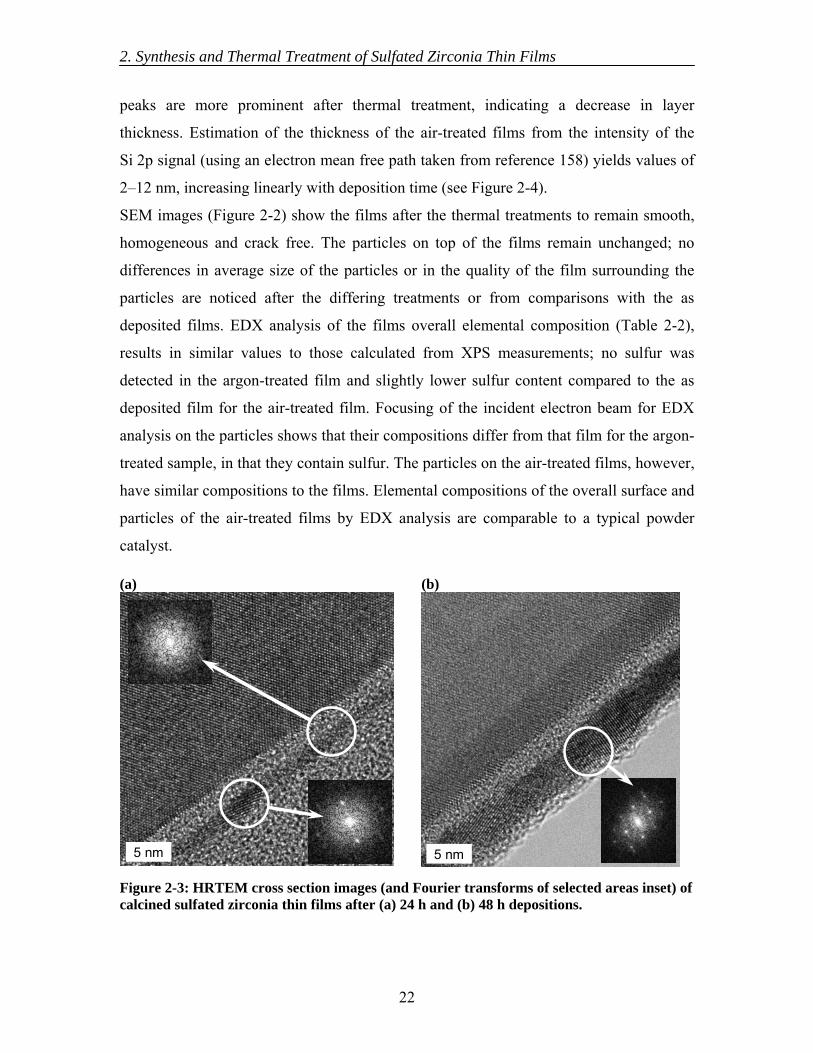
SEM images (Figure 2-2) show the films after the thermal treatments to remain smooth,
homogeneous and crack free. The particles on top of the films remain unchanged; no
differences in average size of the particles or in the quality of the film surrounding the
particles are noticed after the differing treatments or from comparisons with the as
deposited films. EDX analysis of the films overall elemental composition (Table 2-2),
results in similar values to those calculated from XPS measurements; no sulfur was
detected in the argon-treated film and slightly lower sulfur content compared to the as
deposited film for the air-treated film. Focusing of the incident electron beam for EDX
analysis on the particles shows that their compositions differ from that film for the argon-
treated sample, in that they contain sulfur. The particles on the air-treated films, however,
have similar compositions to the films. Elemental compositions of the overall surface and
particles of the air-treated films by EDX analysis are comparable to a typical powder
catalyst.
(a)
5 nm
(b)
5 nm
Figure 2-3: HRTEM cross section images (and Fourier transforms of selected areas inset) of calcined sulfated zirconia thin films after (a) 24 h and (b) 48 h depositions.
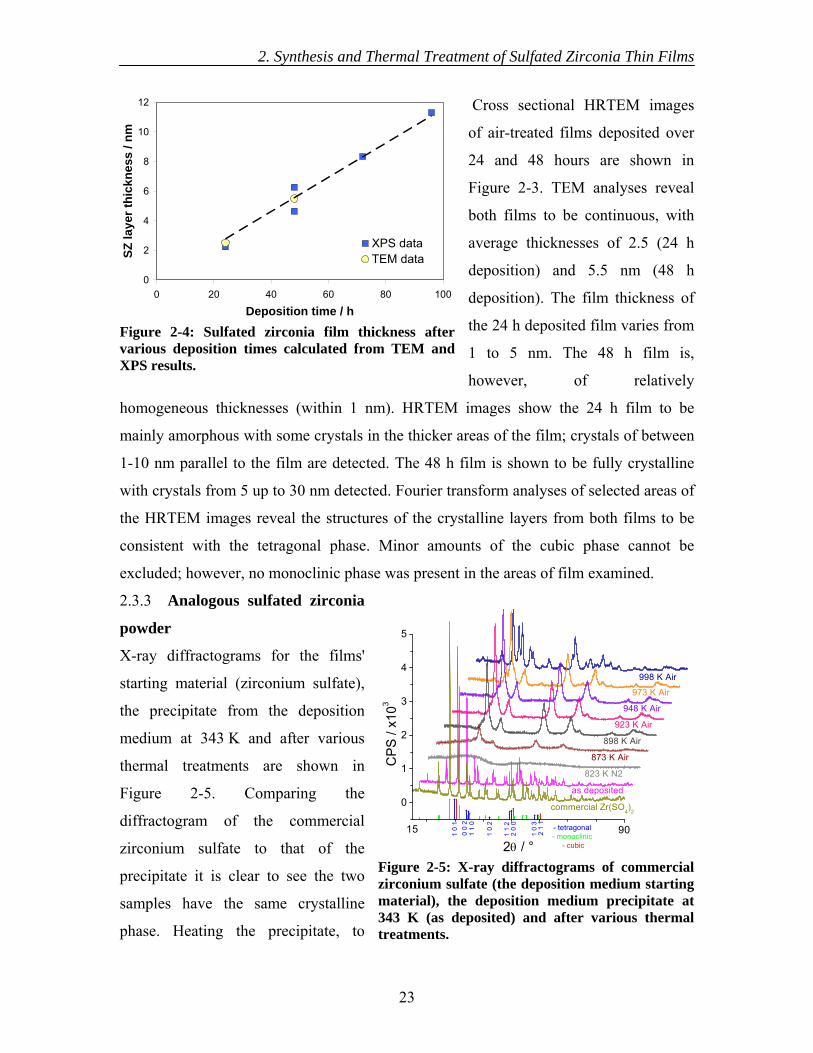
2. Synthesis and Thermal Treatment of Sulfated Zirconia Thin Films
23
Cross sectional HRTEM images
of air-treated films deposited over
24 and 48 hours are shown in
Figure 2-3. TEM analyses reveal
both films to be continuous, with
average thicknesses of 2.5 (24 h
deposition) and 5.5 nm (48 h
deposition). The film thickness of
the 24 h deposited film varies from
1 to 5 nm. The 48 h film is,
however, of relatively
homogeneous thicknesses (within 1 nm). HRTEM images show the 24 h film to be
mainly amorphous with some crystals in the thicker areas of the film; crystals of between
1-10 nm parallel to the film are detected. The 48 h film is shown to be fully crystalline
with crystals from 5 up to 30 nm detected. Fourier transform analyses of selected areas of
the HRTEM images reveal the structures of the crystalline layers from both films to be
consistent with the tetragonal phase. Minor amounts of the cubic phase cannot be
excluded; however, no monoclinic phase was present in the areas of film examined.
2.3.3 Analogous sulfated zirconia
powder
X-ray diffractograms for the films'
starting material (zirconium sulfate),
the precipitate from the deposition
medium at 343 K and after various
thermal treatments are shown in
Figure 2-5. Comparing the
diffractogram of the commercial
zirconium sulfate to that of the
precipitate it is clear to see the two
samples have the same crystalline
phase. Heating the precipitate, to
0
2
4
6
8
10
12
0 20 40 60 80 100
Deposition time / h
SZ la
yer t
hick
ness
/ nm
XPS dataTEM data
Figure 2-4: Sulfated zirconia film thickness aftervarious deposition times calculated from TEM andXPS results.
0
200
400
600
800
1000
90
0
1
2
3
4
5
2 1
1
2 0
0
1 0
3
1 1
2
1 0
2
1 1
00
0 2
998 K Air
973 K Air
948 K Air
923 K Air
898 K Air
873 K Air
823 K N2
as deposited
CP
S /
x103
2θ / °
commercial Zr(SO4)2
15 1 0
1 - tetragonal - monoclinic
- cubic
Figure 2-5: X-ray diffractograms of commercial zirconium sulfate (the deposition medium starting material), the deposition medium precipitate at 343 K (as deposited) and after various thermal treatments.
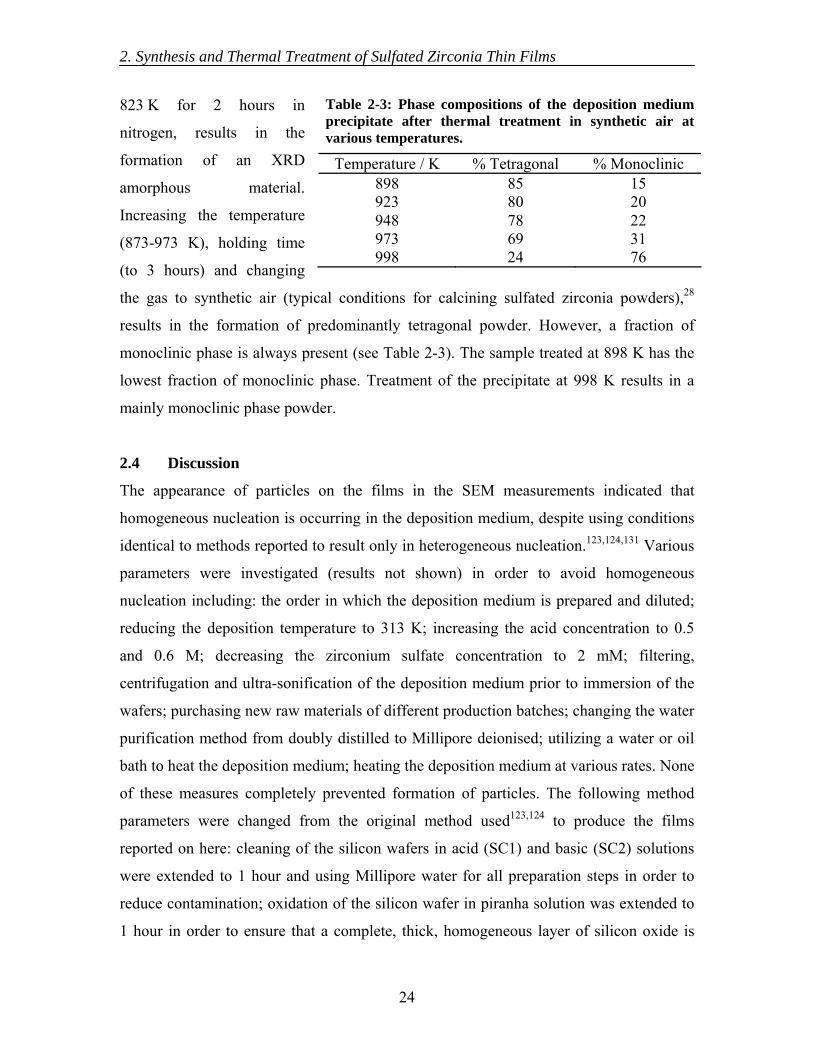
2. Synthesis and Thermal Treatment of Sulfated Zirconia Thin Films
24
823 K for 2 hours in
nitrogen, results in the
formation of an XRD
amorphous material.
Increasing the temperature
(873-973 K), holding time
(to 3 hours) and changing
the gas to synthetic air (typical conditions for calcining sulfated zirconia powders),28
results in the formation of predominantly tetragonal powder. However, a fraction of
monoclinic phase is always present (see Table 2-3). The sample treated at 898 K has the
lowest fraction of monoclinic phase. Treatment of the precipitate at 998 K results in a
mainly monoclinic phase powder.
2.4 Discussion
The appearance of particles on the films in the SEM measurements indicated that
homogeneous nucleation is occurring in the deposition medium, despite using conditions
identical to methods reported to result only in heterogeneous nucleation.123,124,131 Various
parameters were investigated (results not shown) in order to avoid homogeneous
nucleation including: the order in which the deposition medium is prepared and diluted;
reducing the deposition temperature to 313 K; increasing the acid concentration to 0.5
and 0.6 M; decreasing the zirconium sulfate concentration to 2 mM; filtering,
centrifugation and ultra-sonification of the deposition medium prior to immersion of the
wafers; purchasing new raw materials of different production batches; changing the water
purification method from doubly distilled to Millipore deionised; utilizing a water or oil
bath to heat the deposition medium; heating the deposition medium at various rates. None
of these measures completely prevented formation of particles. The following method
parameters were changed from the original method used123,124 to produce the films
reported on here: cleaning of the silicon wafers in acid (SC1) and basic (SC2) solutions
were extended to 1 hour and using Millipore water for all preparation steps in order to
reduce contamination; oxidation of the silicon wafer in piranha solution was extended to
1 hour in order to ensure that a complete, thick, homogeneous layer of silicon oxide is
Table 2-3: Phase compositions of the deposition medium precipitate after thermal treatment in synthetic air at various temperatures.
Temperature / K % Tetragonal % Monoclinic 898 85 15 923 80 20 948 78 22 973 69 31 998 24 76
2. Synthesis and Thermal Treatment of Sulfated Zirconia Thin Films
25
formed; heating of the deposition medium was performed at a constant rate of 1 K/min in
order to reduce homogeneous nucleation and hence the occurrence of particles on the
films.
Homogeneous nucleation not only results in the formation of particles on the film
surface, but in the formation of thinner films per deposition time as compared to those
reported from heterogeneously nucleated growth only; as indicated from XPS substrate
peaks and TEM images. This effect can be explained by the precipitation of particles via
homogeneous nucleation reducing the concentration of zirconium sulfate in solution, thus
the rate of heterogeneous nucleation is decreased. The thickness of the calcined films is
shown to increase linearly with time and particles were observed on the films regardless
of deposition time, thus indicating that the homogeneous precipitation occurs during the
initial stages of film deposition.
Topographical studies showed the majority of the films surface to be free of particles and
smooth. No influence of the particles was detected using XPS (differential charging not
observed, as compared with previously published results).123,124 The elemental
composition of the both the films and particles adhering to the films, after thermal
treatment in synthetic air, were shown to be equivalent and similar to an active powder
sample. Therefore, despite the presence of particles adhering to their surfaces, the
produced films are considered a suitable model for surface science studies.
Thermal treatment of the films in an inert gas (argon) results in loss of sulfur whereas in
air the majority of sulfate is retained, which is explainable by its decomposition pathway
into SO2 (g) + ½ O2 (g).159 Therefore, films thermally treated in air were used for further
investigations. Structural studies of the air-treated films show that very thin films do not
crystallise. In order to form a fully crystalline material films of approximately 5 nm
thickness are required. In subsequent chapters of this thesis calcined films deposited over
48 h were used when possible; however initial experiments were performed without the
knowledge that films from shorter deposition times resulted in films of generally
amorphous character. Given that the thinner films still have some tetragonal areas
experiments performed on these samples are not regarded as meaningless, although the
interpretation of such experiments must consider the low tetragonal fraction of the films.
2. Synthesis and Thermal Treatment of Sulfated Zirconia Thin Films
26
Thermal treatment of analogous powders precipitated from the deposition medium at
343 K did not result in the formation of a fully tetragonal material, despite using various
temperatures and conditions typical for calcining sulfated zirconia powders. Bulk
precipitation of the deposition medium at 343 K does not change the crystalline phase
from that of the orthorhombic zirconium sulfate tetrahydrate starting material.160
Deposition of the thin films on the other hand results in the formation of an amorphous
phase (as evident from results not shown and previous studies).126,127 Thus the deposition
mechanism, homogeneous versus heterogeneous, affects the crystalline phase formed. In
addition the tetragonal phase is stabilised by the formation of small crystals (< 30 nm
sized crystals),192021-22 which are formed on the 48 h deposited thin films after thermal
treatment. The 48 h films were thus found to have tetragonal crystals equivalent in size to
those of active sulfated zirconia powders.23 However, the tendency of very thin films not
to form the tetragonal phase may also be explained by the surface energy stabilisation of
the amorphous zirconia.161
The bulk precipitation from the deposition medium is judged not to result in a realistic
link between the sulfated zirconia thin films and powdered sulfated zirconias (given the
different crystalline phases present). Therefore the produced thin films have been
compared to tetragonal sulfated zirconia powders prepared by calcining either material
prepared using a standard precipitation technique162 (as used for XPS comparisons in this
chapter) or a commercially available (from MelCat) sulfated zirconium hydroxide
material.
2.5 Conclusions
Thin films containing zirconium, oxygen and sulfur were successfully synthesised using a
biomimetic route outlined in the literature. Homogeneous nucleation of the deposition
medium was suppressed but not completely avoided, resulting in particles on the films
surface. The presence of such particles is adjudged not to interfere with surface science
studies of the films.
Thermal treatment of the films was optimised in air to form a tetragonal film of
continuous thickness with a comparable composition to a typical active powder catalyst.
The deposition mechanism and the dimensions of the formed films appear to play crucial

2. Synthesis and Thermal Treatment of Sulfated Zirconia Thin Films
27
roles in formation of the tetragonal phase. Homogeneous deposition results in a powder
material that is XRD amorphous after thermal treatment at low temperatures or a mixture
of tetragonal and monoclinic after high temperature treatment. If the films are too thin the
layer will not crystallise.
3. Thermal Desorption Spectroscopic Studies on Sulfated Zirconia Thin Films
28
3. Thermal Desorption Spectroscopic Studies on Sulfated Zirconia Thin Films
3.1 Introduction
3.1.1 Temperature programmed desorption from sulfated zirconia powders
Numerous temperature programmed desorption investigations have been carried out on
sulfated zirconia using various probe molecules, including: pyridine,163-164165166167168169170
2,6-dimethylpyridine,165
ammonia,165,168,171172173174175176177178179180181182183184185186187188189190191192193194195-196
benzene164,172,197-198199 and substituted derivatives,197,199 isopropylamine,199,200 n-
butylamine,201 acetonitrile,202 carbon dioxide,179 nitrogen monoxide,188,203 n-butane,27,63
1-butene,204 argon205 and hydrogen.206 The majority of desorption studies use basic probe
molecules (such as pyridine and ammonia) to determine the strength (either relative or
absolute) and total number of acidic sites. However, studies have shown the thermal
treatment of sulfated zirconia after exposure to such bases to result not just in desorption
of the probe molecule but, also, its decomposition.164,166,167,171 Furthermore, pyridine
adsorption has been shown to reduce the sulfate stability.164,166,167 Thus sulfated zirconia
reacts with such bases and hence a qualitative measure of the acidic strength is not
possible. Some papers argue that the sites on which the probe molecule is decomposed
must be strong acids and quantification of the total number of acidic sites is still possible
from evaluation of the amount of desorbing probe and its decomposition products.171,179
However, with unspecific analytical methods of detection (such as thermal conductivity
detectors) it is not possible to differentiate between the probe molecule plus its
decomposition products and the decomposition of sulfated zirconia.
Investigations have been performed using weak bases (such as benzene, substituted
benzenes, acetonitrile and amines) in order to avoid decomposition, because of their
weaker interaction. Such probes only interact with the strongest adsorption sites. In many
cases, however, decomposition products (typically including CO2 and SO2) have, also,
been observed.164,198-199200201202 Sulfated zirconia has been shown to interact even with
argon (up to ~170 K).205 Furthermore, the probe molecules used may adsorb on zirconia
itself.165,177,178,186,188,189,192,207-208209210211
Thermal desorption investigations after exposing sulfated zirconia to 1-butene at 323 K,
monitored by GC-MS, have shown the probe molecule to oligomerize on the surface.204
3. Thermal Desorption Spectroscopic Studies on Sulfated Zirconia Thin Films
29
Recent studies exposing an active sulfated zirconia isomerisation catalysts to n-butane at
323 K followed by temperature programmed desorption detect higher MS signals for the
desorption of butene than butane.27,63 Whereas for a relatively inactive sulfated zirconia
material, butane and butene desorption were not detected. The generation of catalytic
sites on the active material was thus ascribed to its dehydrogenation functionality.
3.1.2 Temperature dependent desorption from sulfated zirconia thin films
The adsorption of ammonia on nanocrystalline sulfated zirconia thin films has been
previously investigated using XPS.123 XP spectra of the N 1s signal after exposure to
10000 L of ammonia at room temperature show two peaks at 402.1 and 400.0 eV. Heating
to 473 K results in a significant decrease of the higher binding energy peak while the
lower binding energy species remains relatively unaffected, indicating a weakly and a
strongly bound adsorbate species.
3.1.3 Motivation
Temperature programmed desorption has been applied to the sulfated zirconia thin films
in order to take advantage of their non-porous nature and thermal conductivity. These
properties should improve the detection resolution of the desorbing species and hence,
also, the quantification of the number and strength of different adsorption sites. The
interaction of both the reactant (n-butane) and a basic probe (ammonia) have been studied
to allow identification of both catalytically relevant and acidic sites.
3.2 Experimental
3.2.1 Apparatus
Thermal desorption spectroscopy was performed on samples mounted on a sapphire
holder and heated via electron bombardment.212 The samples were secured to the sapphire
holder and grounded via a stainless steel clip, which also held a K type thermocouple in
contact with the surface of the sample. Activation and thermal desorption spectroscopy
were performed in a chamber with a base pressure in the order of 10-9 hPa, in which a
differentially pumped mass spectrometer was placed within 1 mm of the sample surface.
The recorded mass to charge ratios (m/z) are shown in Table 3.1. Exposure to the probe
molecules was performed in a separate preparation chamber, at room temperature, and
then the samples were transferred into the main chamber under vacuum.
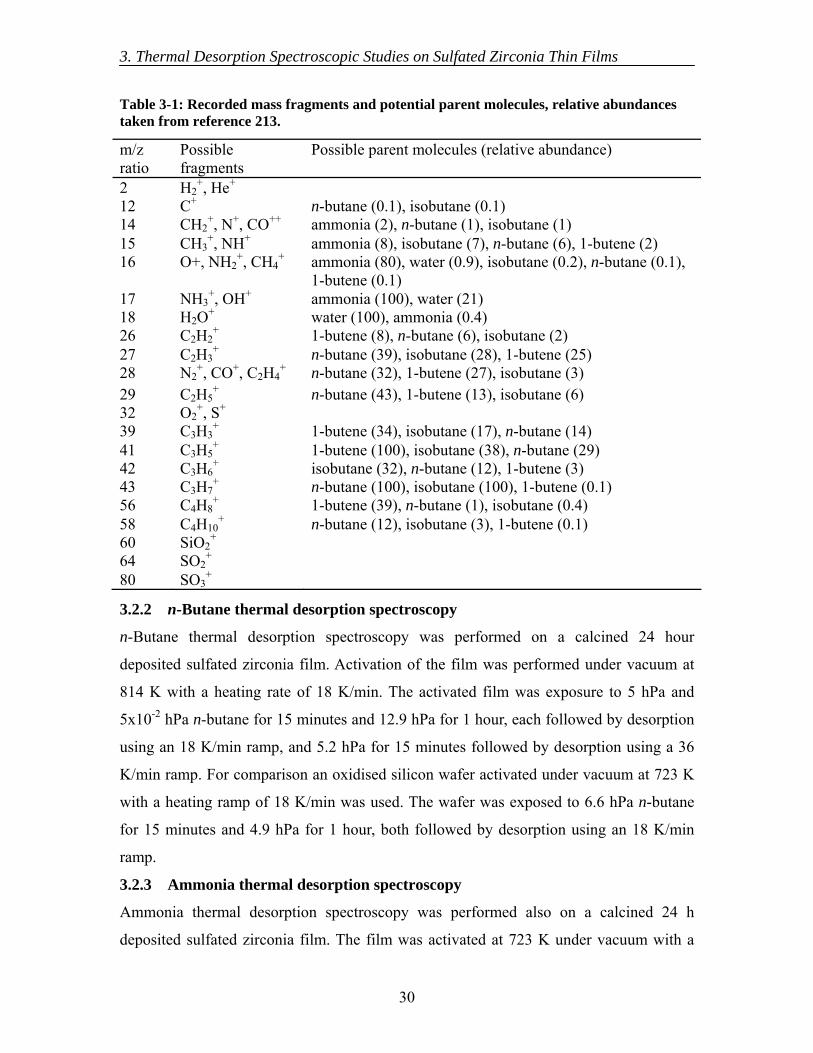
3. Thermal Desorption Spectroscopic Studies on Sulfated Zirconia Thin Films
30
3.2.2 n-Butane thermal desorption spectroscopy
n-Butane thermal desorption spectroscopy was performed on a calcined 24 hour
deposited sulfated zirconia film. Activation of the film was performed under vacuum at
814 K with a heating rate of 18 K/min. The activated film was exposure to 5 hPa and
5x10⁻² hPa n-butane for 15 minutes and 12.9 hPa for 1 hour, each followed by desorption
using an 18 K/min ramp, and 5.2 hPa for 15 minutes followed by desorption using a 36
K/min ramp. For comparison an oxidised silicon wafer activated under vacuum at 723 K
with a heating ramp of 18 K/min was used. The wafer was exposed to 6.6 hPa n-butane
for 15 minutes and 4.9 hPa for 1 hour, both followed by desorption using an 18 K/min
ramp.
3.2.3 Ammonia thermal desorption spectroscopy
Ammonia thermal desorption spectroscopy was performed also on a calcined 24 h
deposited sulfated zirconia film. The film was activated at 723 K under vacuum with a
Table 3-1: Recorded mass fragments and potential parent molecules, relative abundances taken from reference 213.
m/z ratio
Possible fragments
Possible parent molecules (relative abundance)
2 H2+, He+
12 C+ n-butane (0.1), isobutane (0.1) 14 CH2
+, N+, CO++ ammonia (2), n-butane (1), isobutane (1) 15 CH3
+, NH+ ammonia (8), isobutane (7), n-butane (6), 1-butene (2) 16 O+, NH2
+, CH4+ ammonia (80), water (0.9), isobutane (0.2), n-butane (0.1),
1-butene (0.1) 17 NH3
+, OH+ ammonia (100), water (21) 18 H2O+ water (100), ammonia (0.4) 26 C2H2
+ 1-butene (8), n-butane (6), isobutane (2) 27 C2H3
+ n-butane (39), isobutane (28), 1-butene (25) 28 N2
+, CO+, C2H4+ n-butane (32), 1-butene (27), isobutane (3)
29 C2H5+ n-butane (43), 1-butene (13), isobutane (6)
32 O2+, S+
39 C3H3+ 1-butene (34), isobutane (17), n-butane (14)
41 C3H5+ 1-butene (100), isobutane (38), n-butane (29)
42 C3H6+ isobutane (32), n-butane (12), 1-butene (3)
43 C3H7+ n-butane (100), isobutane (100), 1-butene (0.1)
56 C4H8+ 1-butene (39), n-butane (1), isobutane (0.4)
58 C4H10+ n-butane (12), isobutane (3), 1-butene (0.1)
60 SiO2+
64 SO2+
80 SO3+
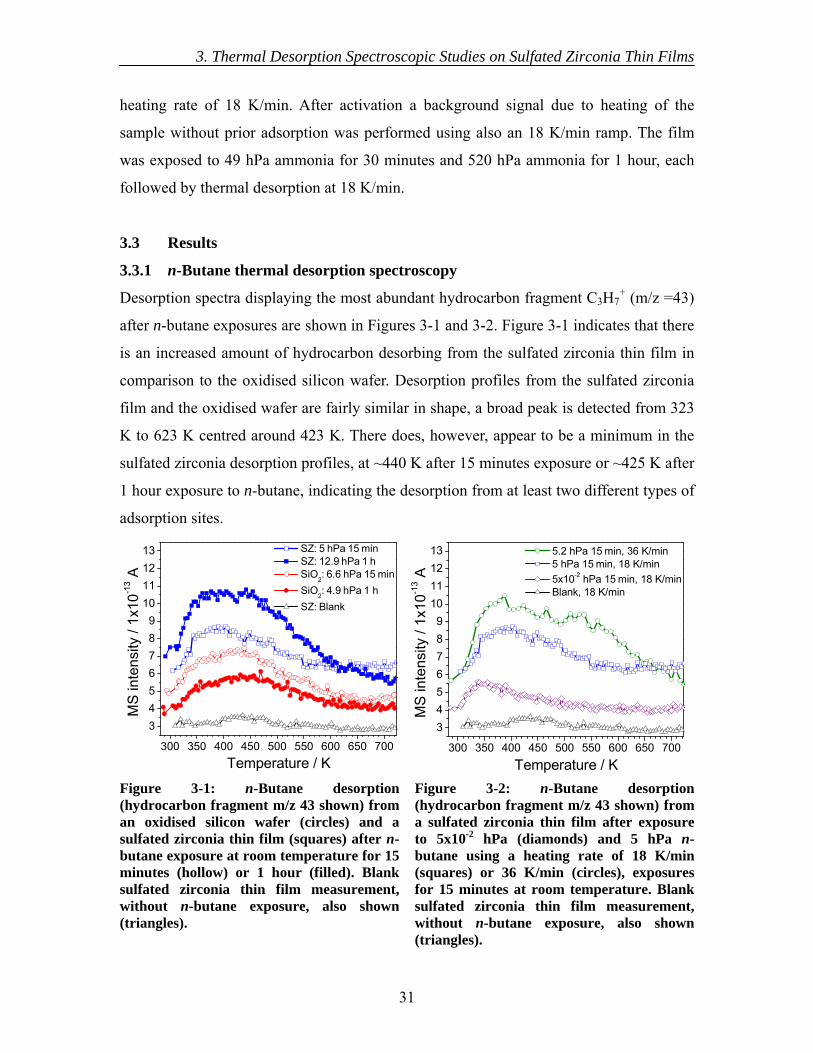
3. Thermal Desorption Spectroscopic Studies on Sulfated Zirconia Thin Films
31
heating rate of 18 K/min. After activation a background signal due to heating of the
sample without prior adsorption was performed using also an 18 K/min ramp. The film
was exposed to 49 hPa ammonia for 30 minutes and 520 hPa ammonia for 1 hour, each
followed by thermal desorption at 18 K/min.
3.3 Results
3.3.1 n-Butane thermal desorption spectroscopy
Desorption spectra displaying the most abundant hydrocarbon fragment C3H7+ (m/z =43)
after n-butane exposures are shown in Figures 3-1 and 3-2. Figure 3-1 indicates that there
is an increased amount of hydrocarbon desorbing from the sulfated zirconia thin film in
comparison to the oxidised silicon wafer. Desorption profiles from the sulfated zirconia
film and the oxidised wafer are fairly similar in shape, a broad peak is detected from 323
K to 623 K centred around 423 K. There does, however, appear to be a minimum in the
sulfated zirconia desorption profiles, at ~440 K after 15 minutes exposure or ~425 K after
1 hour exposure to n-butane, indicating the desorption from at least two different types of
adsorption sites.
300 350 400 450 500 550 600 650 700
3456789
10111213 SZ: 5 hPa 15 min
SZ: 12.9 hPa 1 h SiO2: 6.6 hPa 15 min SiO2: 4.9 hPa 1 h SZ: Blank
MS
inte
nsity
/ 1x
10-1
3 A
Temperature / K300 350 400 450 500 550 600 650 700
3456789
10111213 5.2 hPa 15 min, 36 K/min
5 hPa 15 min, 18 K/min 5x10⁻² hPa 15 min, 18 K/min Blank, 18 K/min
MS
inte
nsity
/ 1x
10-1
3 A
Temperature / KFigure 3-1: n-Butane desorption (hydrocarbon fragment m/z 43 shown) from an oxidised silicon wafer (circles) and a sulfated zirconia thin film (squares) after n-butane exposure at room temperature for 15 minutes (hollow) or 1 hour (filled). Blank sulfated zirconia thin film measurement, without n-butane exposure, also shown (triangles).
Figure 3-2: n-Butane desorption (hydrocarbon fragment m/z 43 shown) from a sulfated zirconia thin film after exposure to 5x10⁻² hPa (diamonds) and 5 hPa n-butane using a heating rate of 18 K/min (squares) or 36 K/min (circles), exposures for 15 minutes at room temperature. Blank sulfated zirconia thin film measurement, without n-butane exposure, also shown (triangles).
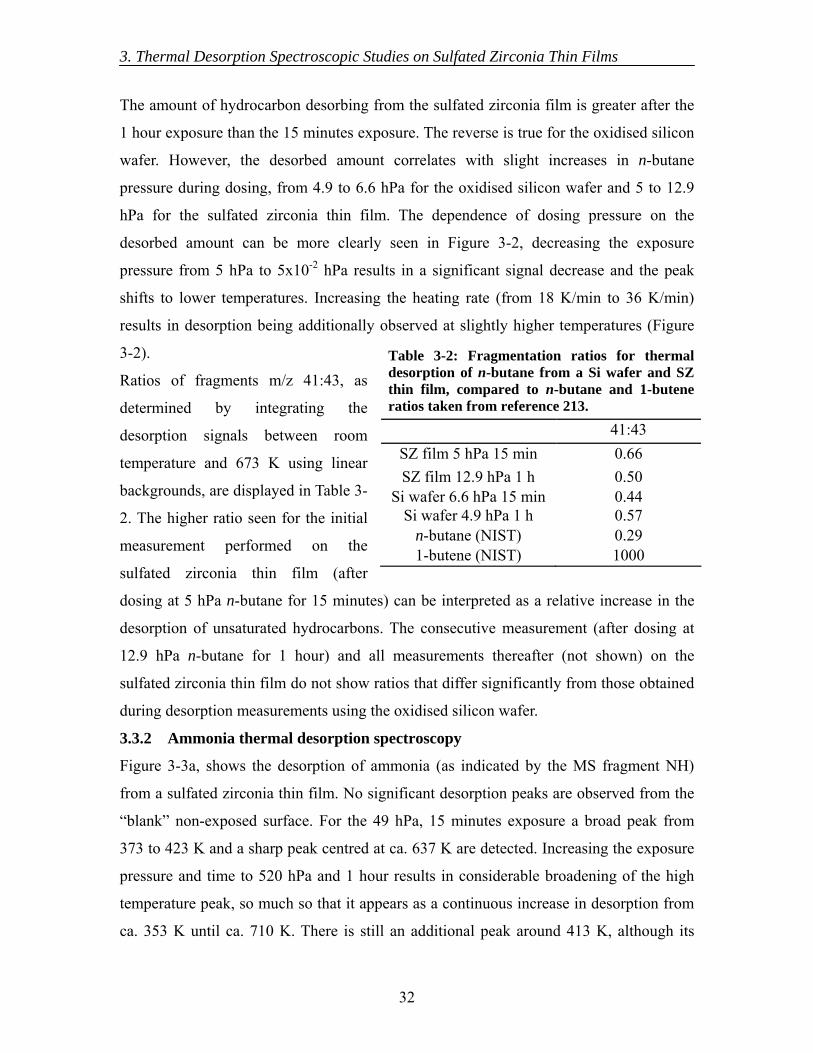
3. Thermal Desorption Spectroscopic Studies on Sulfated Zirconia Thin Films
32
The amount of hydrocarbon desorbing from the sulfated zirconia film is greater after the
1 hour exposure than the 15 minutes exposure. The reverse is true for the oxidised silicon
wafer. However, the desorbed amount correlates with slight increases in n-butane
pressure during dosing, from 4.9 to 6.6 hPa for the oxidised silicon wafer and 5 to 12.9
hPa for the sulfated zirconia thin film. The dependence of dosing pressure on the
desorbed amount can be more clearly seen in Figure 3-2, decreasing the exposure
pressure from 5 hPa to 5x10⁻² hPa results in a significant signal decrease and the peak
shifts to lower temperatures. Increasing the heating rate (from 18 K/min to 36 K/min)
results in desorption being additionally observed at slightly higher temperatures (Figure
3-2).
Ratios of fragments m/z 41:43, as
determined by integrating the
desorption signals between room
temperature and 673 K using linear
backgrounds, are displayed in Table 3-
2. The higher ratio seen for the initial
measurement performed on the
sulfated zirconia thin film (after
dosing at 5 hPa n-butane for 15 minutes) can be interpreted as a relative increase in the
desorption of unsaturated hydrocarbons. The consecutive measurement (after dosing at
12.9 hPa n-butane for 1 hour) and all measurements thereafter (not shown) on the
sulfated zirconia thin film do not show ratios that differ significantly from those obtained
during desorption measurements using the oxidised silicon wafer.
3.3.2 Ammonia thermal desorption spectroscopy
Figure 3-3a, shows the desorption of ammonia (as indicated by the MS fragment NH)
from a sulfated zirconia thin film. No significant desorption peaks are observed from the
“blank” non-exposed surface. For the 49 hPa, 15 minutes exposure a broad peak from
373 to 423 K and a sharp peak centred at ca. 637 K are detected. Increasing the exposure
pressure and time to 520 hPa and 1 hour results in considerable broadening of the high
temperature peak, so much so that it appears as a continuous increase in desorption from
ca. 353 K until ca. 710 K. There is still an additional peak around 413 K, although its
Table 3-2: Fragmentation ratios for thermal desorption of n-butane from a Si wafer and SZ thin film, compared to n-butane and 1-butene ratios taken from reference 213.
41:43 SZ film 5 hPa 15 min 0.66 SZ film 12.9 hPa 1 h 0.50
Si wafer 6.6 hPa 15 min 0.44 Si wafer 4.9 hPa 1 h 0.57
n-butane (NIST) 0.29 1-butene (NIST) 1000
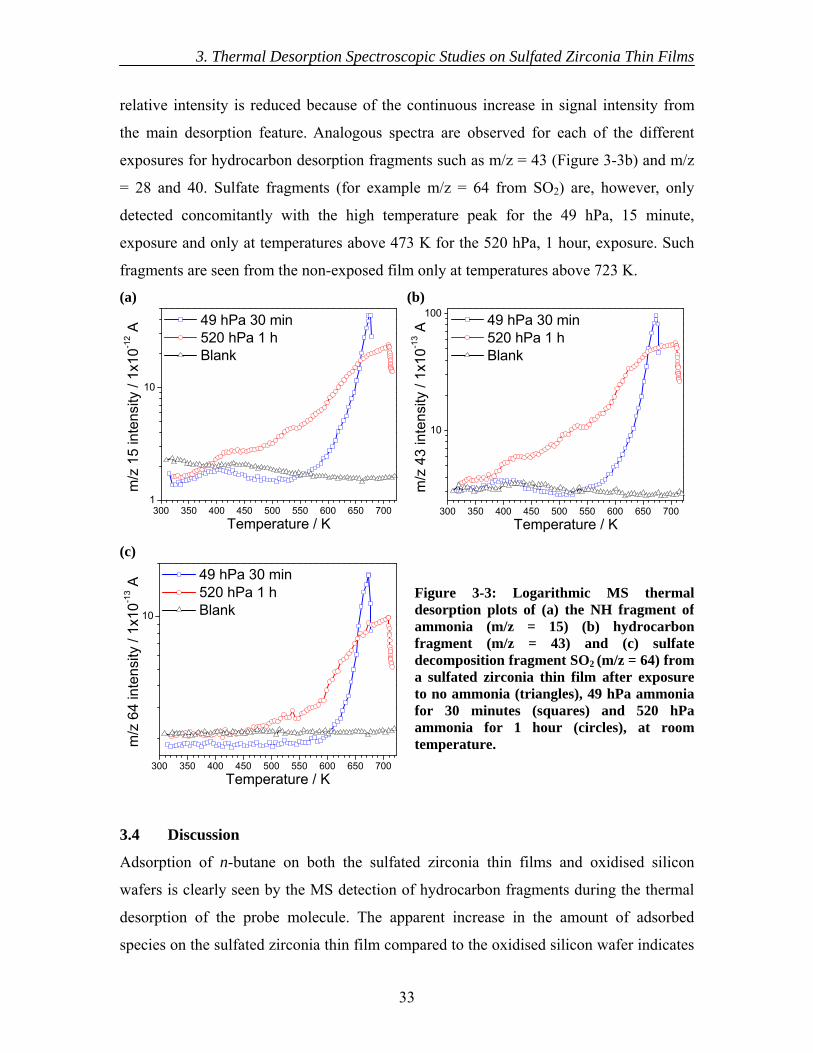
3. Thermal Desorption Spectroscopic Studies on Sulfated Zirconia Thin Films
33
relative intensity is reduced because of the continuous increase in signal intensity from
the main desorption feature. Analogous spectra are observed for each of the different
exposures for hydrocarbon desorption fragments such as m/z = 43 (Figure 3-3b) and m/z
= 28 and 40. Sulfate fragments (for example m/z = 64 from SO2) are, however, only
detected concomitantly with the high temperature peak for the 49 hPa, 15 minute,
exposure and only at temperatures above 473 K for the 520 hPa, 1 hour, exposure. Such
fragments are seen from the non-exposed film only at temperatures above 723 K.
3.4 Discussion
Adsorption of n-butane on both the sulfated zirconia thin films and oxidised silicon
wafers is clearly seen by the MS detection of hydrocarbon fragments during the thermal
desorption of the probe molecule. The apparent increase in the amount of adsorbed
species on the sulfated zirconia thin film compared to the oxidised silicon wafer indicates
(a)
300 350 400 450 500 550 600 650 7001
10
49 hPa 30 min 520 hPa 1 h Blank
m/z
15
inte
nsity
/ 1x
10-1
2 A
Temperature / K
(b)
300 350 400 450 500 550 600 650 700
10
100 49 hPa 30 min 520 hPa 1 h Blank
m/z
43
inte
nsity
/ 1x
10-1
3 A
Temperature / K
(c)
300 350 400 450 500 550 600 650 700
10
49 hPa 30 min 520 hPa 1 h Blank
m/z
64
inte
nsity
/ 1x
10-1
3 A
Temperature / K
Figure 3-3: Logarithmic MS thermal desorption plots of (a) the NH fragment of ammonia (m/z = 15) (b) hydrocarbon fragment (m/z = 43) and (c) sulfate decomposition fragment SO2 (m/z = 64) from a sulfated zirconia thin film after exposure to no ammonia (triangles), 49 hPa ammonia for 30 minutes (squares) and 520 hPa ammonia for 1 hour (circles), at room temperature.
3. Thermal Desorption Spectroscopic Studies on Sulfated Zirconia Thin Films
34
the presence of more adsorption sites; however, this may be due to an increase in surface
roughness and hence also surface area. Desorption profiles from the sulfated zirconia thin
film indicate the presence of at least two different adsorption sites. The temperature range
over which desorption is seen from both the sulfated zirconia thin films and oxidised
silicon wafers is similar, thus indicating an equivalent strength of interaction with the
adsorbate.
From the increased m/z 41:43 ratio seen after the initial dosing of the sulfated zirconia
thin film, as compared with measurements from the oxidised silicon wafers, it can be
inferred that the sulfated zirconia thin films possess sites capable of dehydrogenation.
This ratio may be lower than previously reported for temperature programmed desorption
from active sulfated zirconia powders27,63 due to the low fraction of tetragonal phase
within the very thin (24 hour deposited) sulfated zirconia films used. Lower ratios seen
for all subsequent measurements suggest these sites have been deactivated. Higher m/z
43:41 ratios are seen for all measurements as compared with the NIST n-butane ratio.
This is possibly caused by the adsorption of trace impurities or the relative sensitivity of
the MS used.
The shift to lower desorption temperatures and hence weaker adsorption sites with
decreasing exposure pressure of n-butane is counter to the idea that the stronger
adsorption sites are populated first – thus at higher exposure pressures desorption may be
limited by diffusion (either thermal or gaseous) or incorrect due to a high background
desorption. Increasing the heating rate leads to a broader desorption peak width, which
also insinuates diffusion to be a limitation. Thus thermal desorption spectroscopy may not
be the best technique to investigate the adsorption of n-butane on the sulfated zirconia
thin films. Although, the detected desorption of hydrocarbons at relatively low
temperatures from the sulfated zirconia thin films, after n-butane exposure, indicates a
weak adsorption and thus is in good agreement with the small heats of adsorption (~45–
60 kJ/mol) obtained for butanes on powder sulfated zirconia in calorimetric and temporal
analysis of products (TAP) experiments.27
Ammonia desorption profiles obtained from the nanocrystalline sulfated zirconia films
are in agreement with the findings of previous thermal desorption XPS studies123 and are
similar to those previously reported for active sulfated zirconia powder catalysts.174 The
3. Thermal Desorption Spectroscopic Studies on Sulfated Zirconia Thin Films
35
source of hydrocarbon fragmentation signals during thermal desorption is unclear. It
could be that they are from ammonia reacting with adsorbates on the chamber walls, or
the sample itself (i.e. adsorbed surface carbon or carbon remaining from the
decomposition of the SAM), or a co-adsorbing impurity (although this is unlikely given
the quality and increased adsorption strength of the ammonia). The reduction in sulfate
stability is consistent with earlier reports of sulfated oxides (including sulfated zirconia)
more readily undergoing decomposition upon exposure to basic probe molecules at
elevated temperatures.37
3.5 Conclusions
The ammonia and n-butane adsorption experiments conducted on the nanocrystalline
films detect two distinctly different types of sites. The stronger binding site has been
shown to react with ammonia at high temperatures rather than release the basic probe,
which is consistent with the literature.37 Desorption of n-butane resulted in a broad peak
at relatively low temperatures, which is also typical for powder sulfated zirconia samples.
Fragmentation ratios indicating the formation of alkenes over the sulfate zirconia thin
film were detected for the initial measurement. Thus the thin films have active sites
capable of dehydrogenation, as has recently been shown for powdered sulfated zirconia.
The application of thermal desorption spectroscopy to the sulfated zirconia thin films
was, however, unable to yield any additional information above currently published
reports. This is possibly due to the system limitations, resulting in relatively high
background signals as compared with the amount desorbing from the small surface area
of the sample. The adsorption properties of the nanocrystalline thin films could be shown
to be equivalent to those of active powder sulfated zirconia catalysts.
4. Isobaric Measurements on Sulfated Zirconia Thin Films
36
4. Isobaric Measurements on Sulfated Zirconia Thin Films
4.1 Introduction
4.1.1 Determination of heats of adsorption
The quantitative determination of thermodynamic and kinetic parameters from adsorption
and desorption studies, including heats of adsorption, are necessary for the understanding
of adsorbate-adsorbent interactions. Such parameters are required for the development of
adsorption models and therefore, also, the modelling of surface processes in
heterogeneous catalysis.214
Heats of adsorption can be determined directly from calorimetric experiments {for
example microcalorimetry or differential scanning calorimetry (DSC)}; however,
measurements on flat surfaces are limited to very few systems because of the specific
sample preparation prerequisites.215 Irreversible adsorption processes and adsorbate-
adsorbent reactions can be studied via calorimetry. Transient experiments on powders,
such as temporal analysis of products, can also give data on both kinetic parameters and
heats of adsorption. Modelling of diffusion parameters is however required.
Thermal desorption spectroscopy (TDS) [as discussed in Chapter 3] is widely used to
determine thermodynamic and kinetic parameters of the adsorption of gases on flat
surfaces. From TDS measurements the different types and number of adsorption sites can
be evaluated. TDS, also, allows the activation energy for desorption (Ed) to be calculated.
Only when adsorption is not an activated process does Ed equal the heat of adsorption.
The determination of the reaction order and frequency factor for desorption are in
principle possible as well, but very good TDS data is required. A further disadvantage of
TDS is that adsorption must be performed at relatively low temperatures so that
desorption does not occur. Adsorbate diffusion may therefore be kinetically limited,
hence different states may not be sequentially occupied and thus equilibrium not
achieved. Heating can therefore result not only in desorption but also the equilibration of
states.
In order to overcome the problems associated with TDS measurements, adsorption-
desorption (A-D) equilibrium methods, such as isotherms (constant temperature) or
isobars (constant pressure), can be used.216 Coverage-dependant isosteric (constant
coverage) heats of adsorption can be deduced from the relative position of sets of
4. Isobaric Measurements on Sulfated Zirconia Thin Films
37
isotherms at different temperatures or isobars at different pressures using the Clausius-
Clapeyron equation.217
As the Clausius-Clapeyron equation is deduced from thermodynamics, it is independent
of the kinetics of adsorption and desorption. An equivalent equation can be derived from
kinetic descriptions of adsorption and desorption using the Arrhenius law. The kinetic
derivation is independent of the strength of interaction and is even valid for different gas
and sample temperatures.218
In principle it is also possible to determine kinetic data from the shape of the isotherms or
isobars, such as the reaction order for desorption and adsorption, the Kisliuk factor
(which relates the dependence of the relative sticking probability on coverage) and the
frequency factor for desorption.216
There are a number of prerequisites for the application of A-D equilibrium
measurements, these include:
• Kinetics must be fast enough to establish equilibrium (i.e. the activation energy
for adsorption must not be too high).
• The adsorbate must not decompose irreversibly on the surface.
• Adsorption must be reversible (the heat of adsorption must not be so high that
equilibrium is strongly on the side of adsorption for the range of pressures and
temperatures studied).
The equilibrium position is generally not a severe restriction when studying catalytic
systems, as the relevant adsorbates are often not very strongly bound otherwise they
would block the active sites.
4.1.2 Isobaric photoelectron spectroscopy measurements
Surface sensitive spectroscopic methods, such as photoelectron spectroscopy, can be used
to measure adsorbate coverage under A-D equilibrium conditions. Evaluation of the
spectroscopic data can therefore lead to information relating to how the adsorbate binds
to the adsorbent, as well allowing the generation of isobars or isotherms.
UPS measurements under A-D equilibrium have been used to investigate a variety of
systems. The Henzler group determined heats of adsorption of water on NaCl(100)219 and
KCl(100)220. Ranke and co-workers identified differing adsorption sites and heats of
adsorption for ammonia on Ge(001), (113) and (111) surfaces;216,221 and for water,
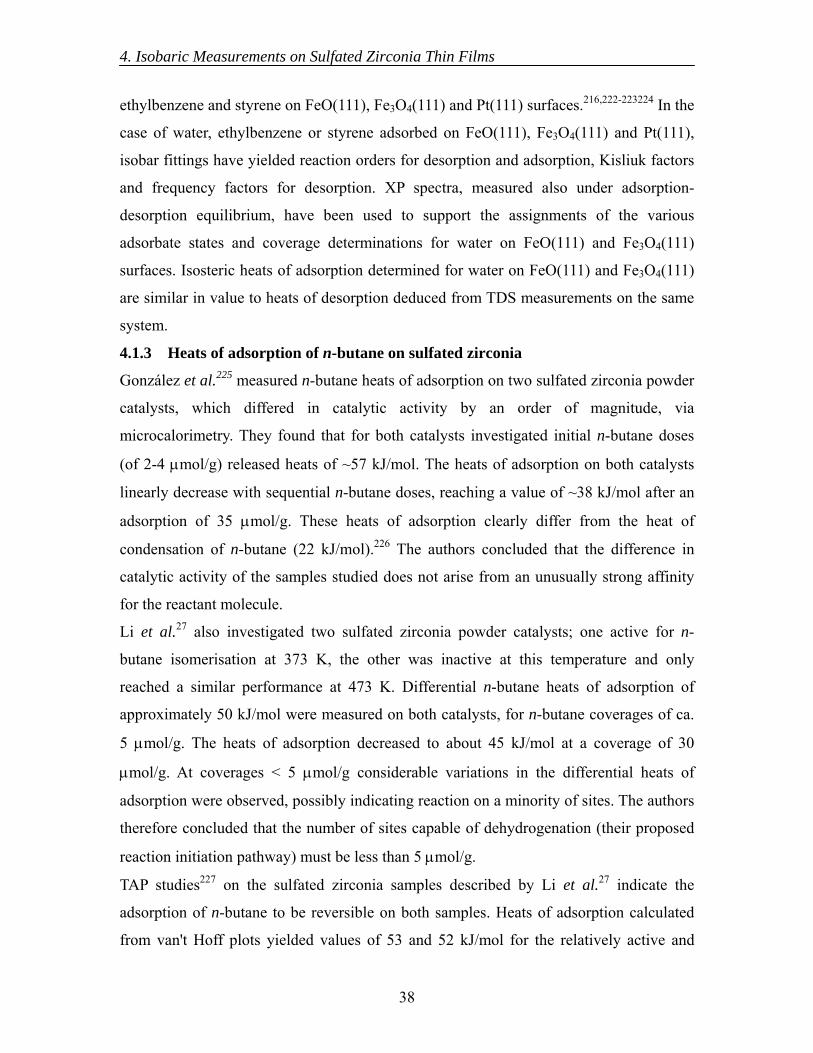
4. Isobaric Measurements on Sulfated Zirconia Thin Films
38
ethylbenzene and styrene on FeO(111), Fe3O4(111) and Pt(111) surfaces.216,222-223224 In the
case of water, ethylbenzene or styrene adsorbed on FeO(111), Fe3O4(111) and Pt(111),
isobar fittings have yielded reaction orders for desorption and adsorption, Kisliuk factors
and frequency factors for desorption. XP spectra, measured also under adsorption-
desorption equilibrium, have been used to support the assignments of the various
adsorbate states and coverage determinations for water on FeO(111) and Fe3O4(111)
surfaces. Isosteric heats of adsorption determined for water on FeO(111) and Fe3O4(111)
are similar in value to heats of desorption deduced from TDS measurements on the same
system.
4.1.3 Heats of adsorption of n-butane on sulfated zirconia
González et al.225 measured n-butane heats of adsorption on two sulfated zirconia powder
catalysts, which differed in catalytic activity by an order of magnitude, via
microcalorimetry. They found that for both catalysts investigated initial n-butane doses
(of 2-4 μmol/g) released heats of ~57 kJ/mol. The heats of adsorption on both catalysts
linearly decrease with sequential n-butane doses, reaching a value of ~38 kJ/mol after an
adsorption of 35 μmol/g. These heats of adsorption clearly differ from the heat of
condensation of n-butane (22 kJ/mol).226 The authors concluded that the difference in
catalytic activity of the samples studied does not arise from an unusually strong affinity
for the reactant molecule.
Li et al.27 also investigated two sulfated zirconia powder catalysts; one active for n-
butane isomerisation at 373 K, the other was inactive at this temperature and only
reached a similar performance at 473 K. Differential n-butane heats of adsorption of
approximately 50 kJ/mol were measured on both catalysts, for n-butane coverages of ca.
5 μmol/g. The heats of adsorption decreased to about 45 kJ/mol at a coverage of 30
μmol/g. At coverages < 5 μmol/g considerable variations in the differential heats of
adsorption were observed, possibly indicating reaction on a minority of sites. The authors
therefore concluded that the number of sites capable of dehydrogenation (their proposed
reaction initiation pathway) must be less than 5 μmol/g.
TAP studies227 on the sulfated zirconia samples described by Li et al.27 indicate the
adsorption of n-butane to be reversible on both samples. Heats of adsorption calculated
from van't Hoff plots yielded values of 53 and 52 kJ/mol for the relatively active and
4. Isobaric Measurements on Sulfated Zirconia Thin Films
39
inactive materials, respectively. These values are in good agreement with calorimetric
data on the same samples.
In a separate study, Li et al.228 investigated by DSC sulfated zirconia prepared under
different conditions from the aforementioned samples. Similar n-butane heats of
adsorption, starting at approximately 60 kJ/mol (at low coverage) declining to 40 kJ/mol
at 60 μmol/g, were obtained.
4.1.4 Aims
Given the difficulties in the application of TDS to the sulfated zirconia thin films
(presented in Chapter 3), the interaction of n-butane with the films under A-D equilibrium
was investigated using photoelectron spectroscopy. The application of low pressures and
temperatures is ideally suited to study the adsorption of n-butane as sulfated zirconia is
known to be catalytically active even at room temperature.12
The aims of performing isobaric studies on the sulfated zirconia thin films are to identify
the various adsorption sites on the films and quantitatively describe how the isosteric
adsorption heats of n-butane (the reactant) vary with coverage.
4.2 Experimental
4.2.1 Set-up
Samples were mounted for experiments on a sapphire sample holder using a stainless
steel clip. The sample temperature was measured via a K-type thermocouple inserted into
the side of the sample, as shown in Figure 4-1a. Validation of the thermocouple reading
was performed using a silicon wafer and a pyrometer (silicon emissivity = 0.7);229
differences in temperature readings from the thermocouple and pyrometer during heating
of the silicon wafer were considered negligible (see Figure 4-1b and c). For the XPS
isobaric measurements the samples were grounded through the clip, but for the UPS
isobaric measurements they were grounded via the thermocouple to ensure good sample-
thermocouple contact. The sample temperature was controlled by liquid N2 cooling and
resistive heating (for isobaric measurements) or electron bombardment (for in situ
activation), in a similar setup to the one described in reference 212. The base pressure in
the chamber was 2x10⁻¹⁰ hPa or lower. Atmospheric pressure activations were performed
in an adjacent chamber with a flow directed across the sample and heating via a lamp
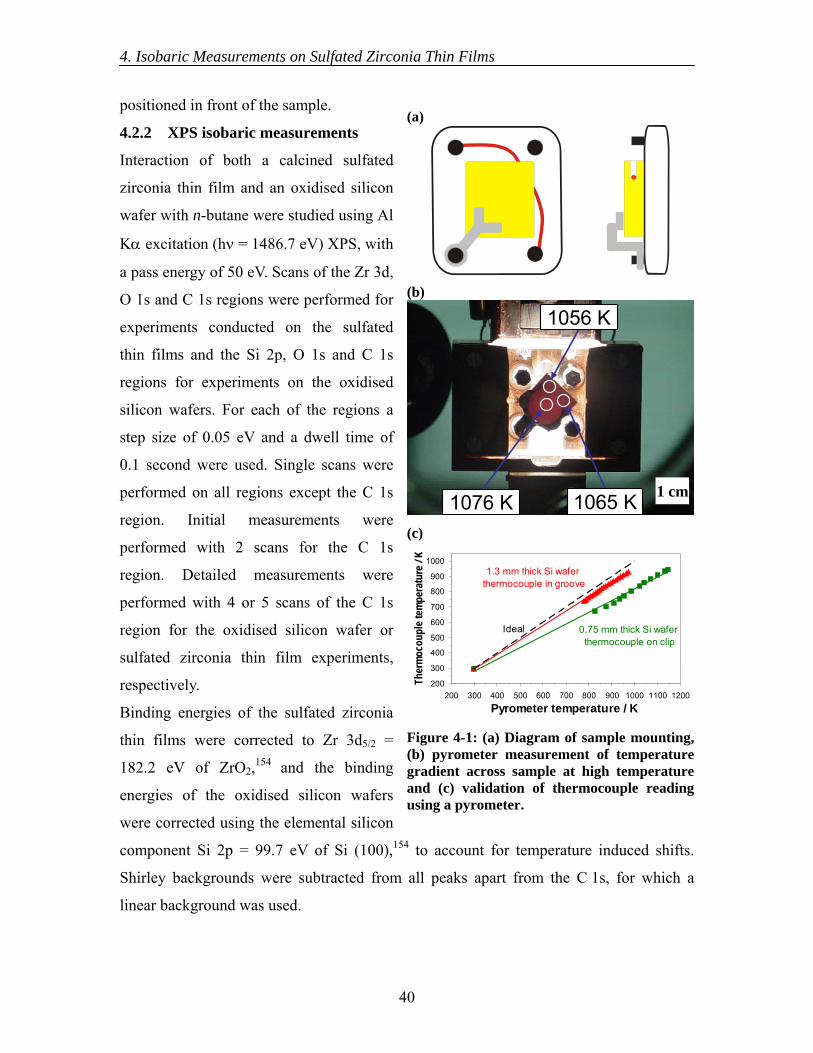
4. Isobaric Measurements on Sulfated Zirconia Thin Films
40
positioned in front of the sample.
4.2.2 XPS isobaric measurements
Interaction of both a calcined sulfated
zirconia thin film and an oxidised silicon
wafer with n-butane were studied using Al
Kα excitation (hν = 1486.7 eV) XPS, with
a pass energy of 50 eV. Scans of the Zr 3d,
O 1s and C 1s regions were performed for
experiments conducted on the sulfated
thin films and the Si 2p, O 1s and C 1s
regions for experiments on the oxidised
silicon wafers. For each of the regions a
step size of 0.05 eV and a dwell time of
0.1 second were used. Single scans were
performed on all regions except the C 1s
region. Initial measurements were
performed with 2 scans for the C 1s
region. Detailed measurements were
performed with 4 or 5 scans of the C 1s
region for the oxidised silicon wafer or
sulfated zirconia thin film experiments,
respectively.
Binding energies of the sulfated zirconia
thin films were corrected to Zr 3d5/2 =
182.2 eV of ZrO2,154 and the binding
energies of the oxidised silicon wafers
were corrected using the elemental silicon
component Si 2p = 99.7 eV of Si (100),154 to account for temperature induced shifts.
Shirley backgrounds were subtracted from all peaks apart from the C 1s, for which a
linear background was used.
(a)
(b)
1076 K
1056 K
1065 K 1 cm
(c)
0.75 mm thick Si wafer thermocouple on clip
1.3 mm thick Si wafer thermocouple in groove
Ideal
200
300
400
500
600
700
800
900
1000
200 300 400 500 600 700 800 900 1000 1100 1200
Pyrometer temperature / K
Ther
moc
oupl
e te
mpe
ratu
re /
K
Figure 4-1: (a) Diagram of sample mounting, (b) pyrometer measurement of temperature gradient across sample at high temperature and (c) validation of thermocouple reading using a pyrometer.
4. Isobaric Measurements on Sulfated Zirconia Thin Films
41
4.2.2.1 Initial XPS isobaric measurements
Initial measurements were performed on a sulfated zirconia film and an oxidised silicon
wafer, both activated at 623 K in UHV with a temperature ramp of 20 K/min. Spectra of
the UHV activated samples were recorded in A-D equilibrium, from room temperature to
100 K and back to room temperature, at n-butane pressures of 2.2x10⁻⁸ hPa and 2.2x10⁻⁷
hPa sequentially. Due to condensation of butane on the colder parts of the sample holder
during the long exposure times at low temperatures, pressures of up to 10-5 hPa were
observed while initially increasing the sample temperature. The electron analyser was
switched off during these periods, typically between 100 and 140 K.
In order to determine the signal intensity of an "infinitely" thick carbon layer the sulfated
zirconia thin film was also exposed to 1x10⁻⁶ hPa n-butane at 100 K until the signals
originating from the sulfated zirconia film (Zr 3d, O 1s and S 2p) were no longer
detectable.
A blind isobar experiment without X-ray irradiation was also performed on the oxidised
silicon wafer, to investigate the effects of irradiation. The wafer was exposed to 2.2x10⁻⁷
hPa n-butane from room temperature to 100 K. XPS of the O 1s, C 1s and Si 2p regions
were recorded prior to and immediately after the adsorption experiment at room
temperature.
4.2.2.2 Detailed XPS isobaric measurements
Detailed isobaric measurements were performed on a reactivated oxidised silicon wafer
and a new sulfated zirconia thin film, while decreasing the temperature. Activation of the
sulfated zirconia thin film was performed at atmospheric pressure in a flow of 40 ml/min
synthetic air at 573 K for 30 minutes (temperature ramp ~20 K/min). The air-activated
sample was exposed to 2.2x10⁻⁸ hPa n-butane at temperatures from 200 K to 100 K. At
120 K the temperature was held constant for 40 minutes. The oxidised silicon wafer was
reactivated at 623 K in 1x10⁻⁷ hPa O2 for 1 hour, using a temperature ramp of ~20 K/min.
The oxidised Si wafer was then exposed to 2.2x10⁻⁸ hPa n-butane while cooling from 200
K to 120 K.
4.2.2.3 Coverage determination from XPS isobaric measurements
C 1s Difference spectra, corresponding to the adsorbate signal, were obtained by
subtracting the "clean" surface spectrum under UHV prior to n-butane exposure from the
4. Isobaric Measurements on Sulfated Zirconia Thin Films
42
spectra taken in A-D equilibrium. The area of the difference signal could be converted
into a coverage dependant value using the Lambert-Beer absorption law {when coverage
(θ) is defined as the number of adsorbed molecules divided by the total number of
adsorption sites on the adsorbent}, as indicated in the below equation:
ads
e 0,ads
d Iθ ln 1l I
⎛ ⎞∝ = − −⎜ ⎟⎝ ⎠
Where d is the adsorbate thickness (averaged over the whole surface), le is the electron
escape depth, Iads is the adsorbate intensity and I0,ads is the intensity of an infinitely thick
adsorbate layer. Hence, d/le is proportional to the adsorbate coverage. The escape depth is
given by le = λe cos α, where λe is the electron mean free path and α the mean escape
angle normal to the surface (for the system used the analyser is at 0°, therefore le = λe). λe
depends strongly on the kinetic energy of the electrons and, albeit to a lesser degree, on
the material the electrons are passing through. Reported values of λe (for various kinetic
energies and materials) 154 can be used to estimate the adsorbate thickness, although wide
error margins are to be expected due to the uncertainty in λe and the calculated values
only have real meaning for full layer coverages. Calculated values are therefore quoted as
equivalent adsorbate thicknesses.
4.2.3 UPS isobaric measurements
He ΙΙ (hν = 40.8 eV) ultraviolet photoelectron spectroscopy (UPS) was also used to study
the interaction of n-butane with air-treated sulfated zirconia thin films and oxidised
silicon wafers. Measurements were performed with a pass energy of 15 eV and a -5 V
sample bias.
Secondary electron curves and He ΙΙ satellite-induced emissions have not been subtracted
from the UP spectra presented. Both binding energy and vacuum level (Evac) aligned x-
axis scales are given for all UP spectra (which differ by the work function of the
spectrometer, 4.6 eV). Sample charging has not been evaluated.
4.2.3.1 Initial UPS isobaric measurements
Initial measurements were performed on an oxidised silicon wafer. Spectra were
measured in A-D equilibrium at 1x10⁻⁶ hPa while decreasing the temperature from room
temperature to 105 K, followed by holding the temperature constant at 105 K for 1 hour.
In a subsequent experiment, the oxidised silicon wafer was cooled to 108 K and XP
4. Isobaric Measurements on Sulfated Zirconia Thin Films
43
spectra of the surface were taken. The sample was then exposed to 1x10⁻⁶ hPa n-butane
and the change in signal followed by UPS. After 20 minutes XP spectra of the surface
were taken. The XPS measurements were performed with a low resolution to minimise
beam damage.
4.2.3.2 Detailed UPS isobaric measurements
Detailed measurements were performed on new samples activated at 573 K under
atmospheric pressure in a flow of 40 ml/min synthetic air for 30 minutes, using
temperature ramps of ~20 K/min. Spectra were measured in A-D equilibrium under
constant n-butane pressures of 1x10⁻⁸, 1x10⁻⁷ and 1x10⁻⁶ hPa at temperatures from room
temperature to ~110 K, sequentially. After each isobar the sample was moved out of the
UV beam, the n-butane leak valve was closed and the sample was heated resistively up to
room temperature. Before and after the sets of UPS isobars, XPS measurements of
samples were performed in UHV.
After the set of UPS isobars the sulfated zirconia thin film was reactivated under the
same conditions as for the original activation. The film was then exposed to 1x10⁻⁶ hPa at
temperatures down to 100 K while turned out of the irradiating beam (a non-irradiated
isobar). UP and XP spectra were recorded in UHV at room temperature prior to and after
performing the non-irradiated isobar. The sulfated zirconia thin film was then reactivated
again and exposed to 1x10⁻⁶ hPa n-butane for 3 hours at room temperature with He II UV
irradiation. UP spectra were recorded after each hour and XP spectra of the sample were
measured in UHV before and after the 3 hours n-butane exposure.
4.2.3.3 Coverage determination from UPS isobaric measurements
Difference spectra of the oxidised silicon wafer and sulfated zirconia thin film in A-D
equilibrium have been analysed as outlined in reference 216. The clean spectrum
obtained prior to performing the isobar was subtracted from the spectra taken under n-
butane A-D equilibrium conditions, after applying an attenuation factor to the clean
spectrum and shifting the energy scale of the spectra acquired under n-butane A-D
equilibrium. The alignment shift and attenuation factor are applied such that there is not
an increase in the difference spectra between binding energies of ~2.5-4 eV (where no
spectral contributions from the adsorbate are expected). Misalignment of the spectra can
result in the introduction of artificial structures, such artefacts are minimised by repetition
4. Isobaric Measurements on Sulfated Zirconia Thin Films
44
using differing alignment shifts and attenuation factors.
The attenuation of the clean spectrum can be converted into a coverage related value
using the Lambert-Beer absorption law, using the following equation:
sub
e 0,sub
d Iθ lnl I
⎛ ⎞∝ = − ⎜ ⎟⎝ ⎠
Where Isub is the substrate (adsorbent) intensity and I0,sub is the substrate intensity prior to
adsorption. Thus, (Isub/I0,sub) is the attenuation factor used to form the difference spectra.
The carbon layer thickness was estimated in a similar way for the XPS measurements of
the silicon wafer after exposure to 1x10⁻⁶ hPa n-butane for 20 minutes at 108 K, using the
attenuation of the Si 2p peak.
4.3 Results
4.3.1 Initial XPS isobaric measurements
C 1s XP difference spectra of the sulfated zirconia thin film under 10-7 hPa n-butane are
shown in Figure 4-2a. An increase in the C 1s signal intensity is seen upon decreasing the
temperature below ~140 K, concomitantly the substrate peaks (O 1s and Zr 3d) decrease
in intensity, due to the adsorption of n-butane. Increasing the sample temperature from
100 K back to room temperature and evacuation results in a decrease of the C 1s signal;
however, a significant fraction of the signal remains (approximately 35% of the signal at
100 K). The C 1s binding energy of the adsorbed species changes with increasing
coverage from an initial value of ~284.3 eV at 136 K to ~284.8 eV at 100 K. Increasing
the sample temperature shifts the C 1s signal to lower binding energies, after evacuation a
peak at ~284.0 eV remains. No significant changes are observed in the Zr 3d and O 1s
peaks beside a decrease in intensity with the increasing C 1s signal.
Repeating this experiment with an oxidised silicon wafer also results in the adsorption of
n-butane at low temperatures and the formation of a carbonaceous species that remains
after evacuation. A similar trend in shifts of the adsorbed species’ C 1s signal is observed
upon increasing coverage, increasing temperature and evacuation.
The initial isobars on both the sulfated zirconia thin film and oxidised silicon wafer
performed under 10-8 hPa n-butane also show the formation of carbonaceous deposits
which remain after evacuation. The total adsorbate coverage on the samples during the
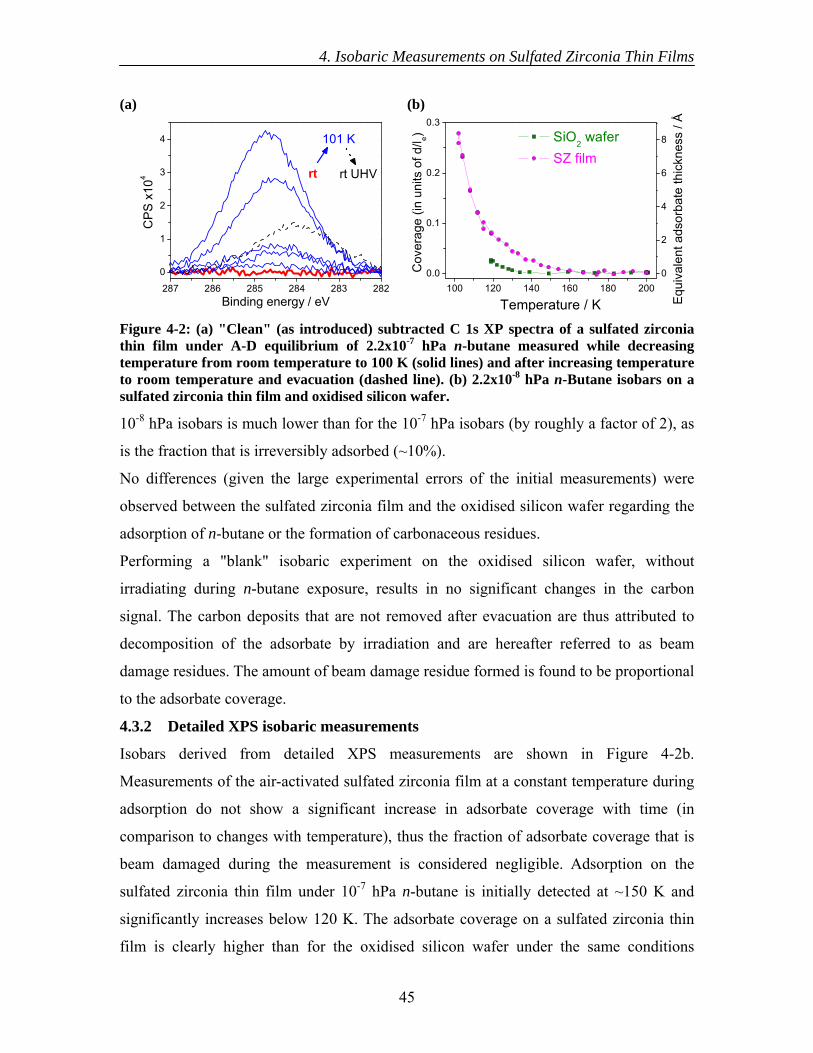
4. Isobaric Measurements on Sulfated Zirconia Thin Films
45
10-8 hPa isobars is much lower than for the 10-7 hPa isobars (by roughly a factor of 2), as
is the fraction that is irreversibly adsorbed (~10%).
No differences (given the large experimental errors of the initial measurements) were
observed between the sulfated zirconia film and the oxidised silicon wafer regarding the
adsorption of n-butane or the formation of carbonaceous residues.
Performing a "blank" isobaric experiment on the oxidised silicon wafer, without
irradiating during n-butane exposure, results in no significant changes in the carbon
signal. The carbon deposits that are not removed after evacuation are thus attributed to
decomposition of the adsorbate by irradiation and are hereafter referred to as beam
damage residues. The amount of beam damage residue formed is found to be proportional
to the adsorbate coverage.
4.3.2 Detailed XPS isobaric measurements
Isobars derived from detailed XPS measurements are shown in Figure 4-2b.
Measurements of the air-activated sulfated zirconia film at a constant temperature during
adsorption do not show a significant increase in adsorbate coverage with time (in
comparison to changes with temperature), thus the fraction of adsorbate coverage that is
beam damaged during the measurement is considered negligible. Adsorption on the
sulfated zirconia thin film under 10-7 hPa n-butane is initially detected at ~150 K and
significantly increases below 120 K. The adsorbate coverage on a sulfated zirconia thin
film is clearly higher than for the oxidised silicon wafer under the same conditions
(a)
287 286 285 284 283 282
0
1
2
3
4
rt UHV
CP
S x
104
Binding energy / eV
rt
101 K
(b)
100 120 140 160 180 2000.0
0.1
0.2
0.3
0
2
4
6
8 SiO2 wafer SZ film
Cov
erag
e (in
uni
ts o
f d/l e)
Temperature / K Equ
ival
ent a
dsor
bate
thic
knes
s / Å
Figure 4-2: (a) "Clean" (as introduced) subtracted C 1s XP spectra of a sulfated zirconia thin film under A-D equilibrium of 2.2x10⁻⁷ hPa n-butane measured while decreasing temperature from room temperature to 100 K (solid lines) and after increasing temperatureto room temperature and evacuation (dashed line). (b) 2.2x10⁻⁸ hPa n-Butane isobars on a sulfated zirconia thin film and oxidised silicon wafer.
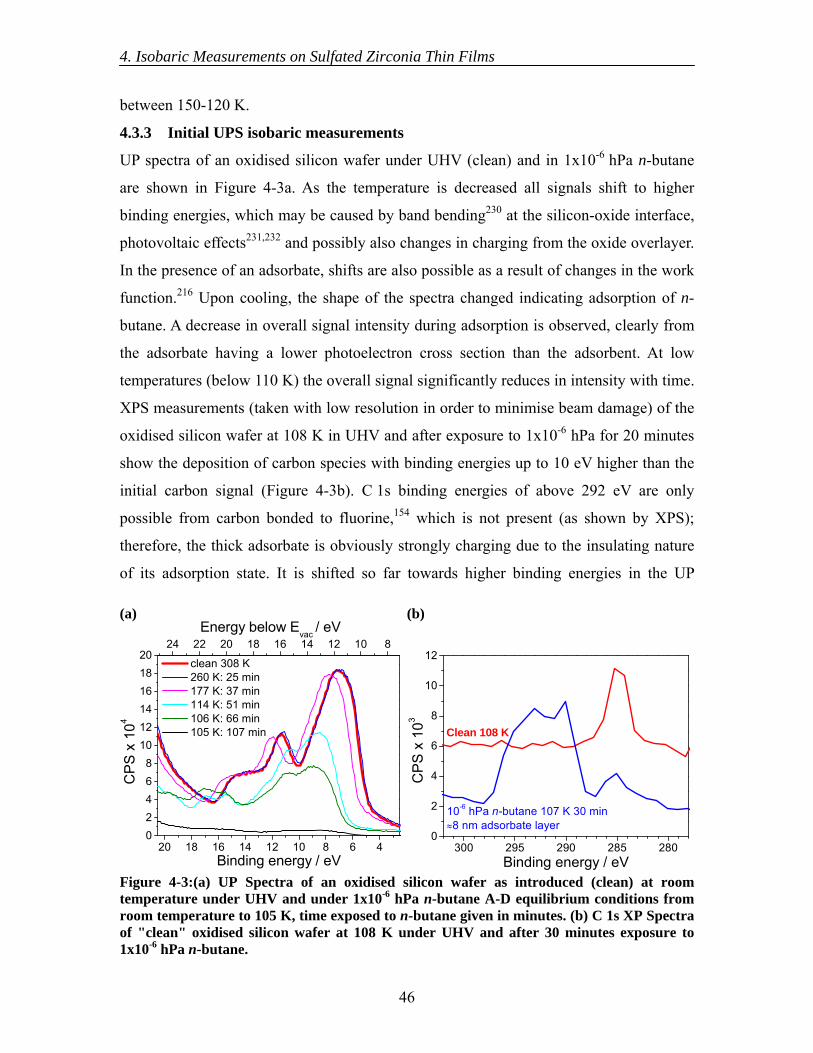
4. Isobaric Measurements on Sulfated Zirconia Thin Films
46
between 150-120 K.
4.3.3 Initial UPS isobaric measurements
UP spectra of an oxidised silicon wafer under UHV (clean) and in 1x10⁻⁶ hPa n-butane
are shown in Figure 4-3a. As the temperature is decreased all signals shift to higher
binding energies, which may be caused by band bending230 at the silicon-oxide interface,
photovoltaic effects231,232 and possibly also changes in charging from the oxide overlayer.
In the presence of an adsorbate, shifts are also possible as a result of changes in the work
function.216 Upon cooling, the shape of the spectra changed indicating adsorption of n-
butane. A decrease in overall signal intensity during adsorption is observed, clearly from
the adsorbate having a lower photoelectron cross section than the adsorbent. At low
temperatures (below 110 K) the overall signal significantly reduces in intensity with time.
XPS measurements (taken with low resolution in order to minimise beam damage) of the
oxidised silicon wafer at 108 K in UHV and after exposure to 1x10⁻⁶ hPa for 20 minutes
show the deposition of carbon species with binding energies up to 10 eV higher than the
initial carbon signal (Figure 4-3b). C 1s binding energies of above 292 eV are only
possible from carbon bonded to fluorine,154 which is not present (as shown by XPS);
therefore, the thick adsorbate is obviously strongly charging due to the insulating nature
of its adsorption state. It is shifted so far towards higher binding energies in the UP
(a)
20 18 16 14 12 10 8 6 402468
101214161820
24 22 20 18 16 14 12 10 8
clean 308 K 260 K: 25 min 177 K: 37 min 114 K: 51 min 106 K: 66 min 105 K: 107 min
CP
S x
104
Binding energy / eV
Energy below Evac / eV
(b)
300 295 290 285 2800
2
4
6
8
10
12
Clean 108 K
10-6 hPa n-butane 107 K 30 min≈8 nm adsorbate layer
CP
S x
103
Binding energy / eVFigure 4-3:(a) UP Spectra of an oxidised silicon wafer as introduced (clean) at roomtemperature under UHV and under 1x10⁻⁶ hPa n-butane A-D equilibrium conditions from room temperature to 105 K, time exposed to n-butane given in minutes. (b) C 1s XP Spectra of "clean" oxidised silicon wafer at 108 K under UHV and after 30 minutes exposure to1x10-6 hPa n-butane.
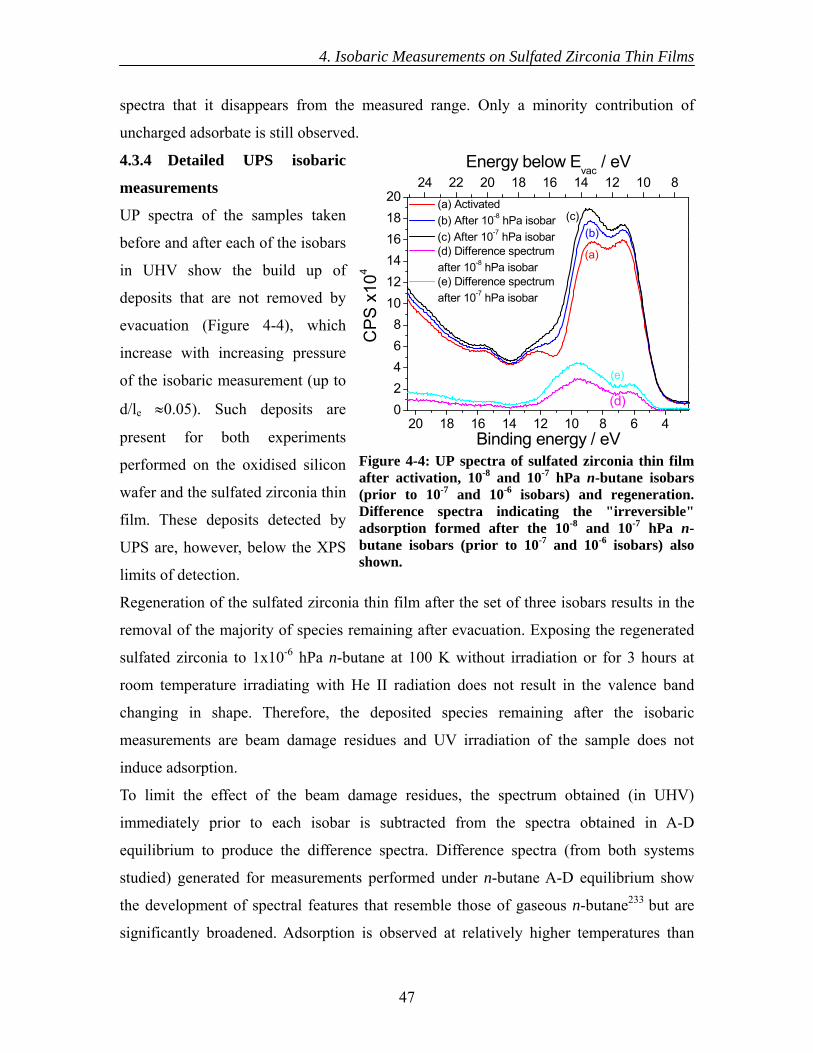
4. Isobaric Measurements on Sulfated Zirconia Thin Films
47
spectra that it disappears from the measured range. Only a minority contribution of
uncharged adsorbate is still observed.
4.3.4 Detailed UPS isobaric
measurements
UP spectra of the samples taken
before and after each of the isobars
in UHV show the build up of
deposits that are not removed by
evacuation (Figure 4-4), which
increase with increasing pressure
of the isobaric measurement (up to
d/le ≈0.05). Such deposits are
present for both experiments
performed on the oxidised silicon
wafer and the sulfated zirconia thin
film. These deposits detected by
UPS are, however, below the XPS
limits of detection.
Regeneration of the sulfated zirconia thin film after the set of three isobars results in the
removal of the majority of species remaining after evacuation. Exposing the regenerated
sulfated zirconia to 1x10⁻⁶ hPa n-butane at 100 K without irradiation or for 3 hours at
room temperature irradiating with He II radiation does not result in the valence band
changing in shape. Therefore, the deposited species remaining after the isobaric
measurements are beam damage residues and UV irradiation of the sample does not
induce adsorption.
To limit the effect of the beam damage residues, the spectrum obtained (in UHV)
immediately prior to each isobar is subtracted from the spectra obtained in A-D
equilibrium to produce the difference spectra. Difference spectra (from both systems
studied) generated for measurements performed under n-butane A-D equilibrium show
the development of spectral features that resemble those of gaseous n-butane233 but are
significantly broadened. Adsorption is observed at relatively higher temperatures than
20 18 16 14 12 10 8 6 402468
101214161820
24 22 20 18 16 14 12 10 8
(e)
(a)
(c)(b)
(a) Activated (b) After 10-8 hPa isobar (c) After 10-7 hPa isobar (d) Difference spectrum
after 10-8 hPa isobar (e) Difference spectrum
after 10-7 hPa isobar
CP
S x
104
Binding energy / eV
(d)
Energy below Evac / eV
Figure 4-4: UP spectra of sulfated zirconia thin film after activation, 10-8 and 10-7 hPa n-butane isobars (prior to 10-7 and 10-6 isobars) and regeneration. Difference spectra indicating the "irreversible"adsorption formed after the 10-8 and 10-7 hPa n-butane isobars (prior to 10-7 and 10-6 isobars) also shown.
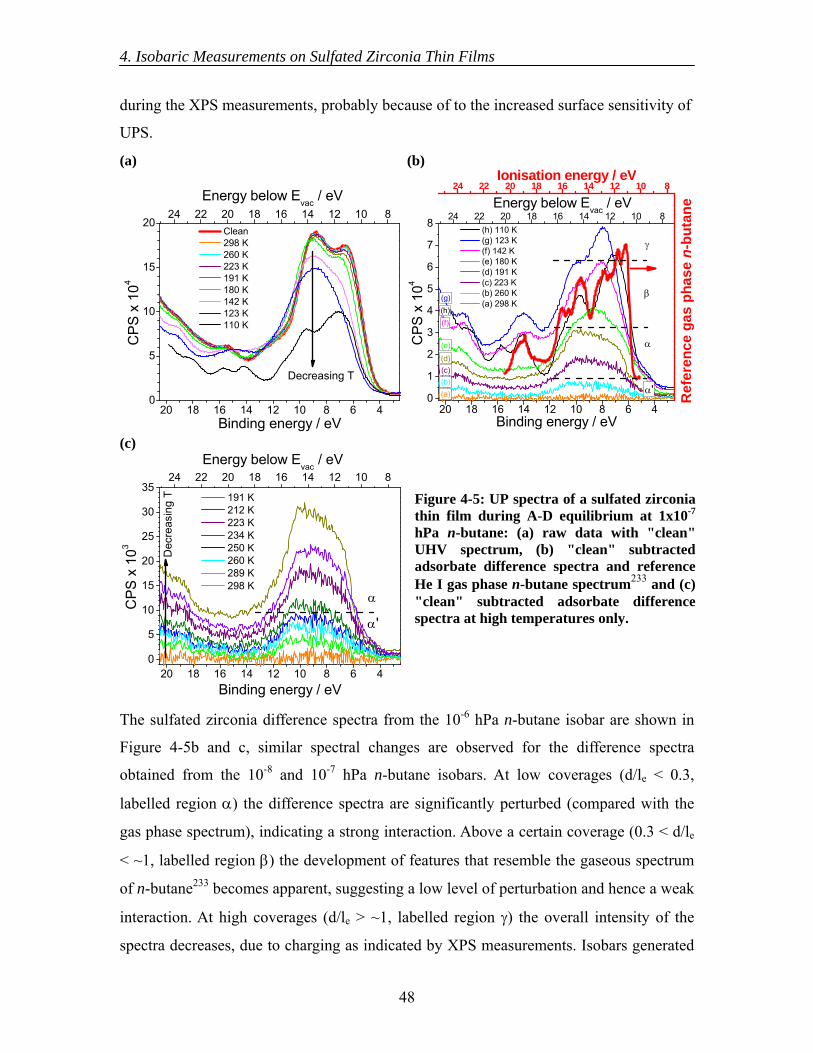
4. Isobaric Measurements on Sulfated Zirconia Thin Films
48
during the XPS measurements, probably because of to the increased surface sensitivity of
UPS.
The sulfated zirconia difference spectra from the 10-6 hPa n-butane isobar are shown in
Figure 4-5b and c, similar spectral changes are observed for the difference spectra
obtained from the 10-8 and 10-7 hPa n-butane isobars. At low coverages (d/le < 0.3,
labelled region α) the difference spectra are significantly perturbed (compared with the
gas phase spectrum), indicating a strong interaction. Above a certain coverage (0.3 < d/le
< ~1, labelled region β) the development of features that resemble the gaseous spectrum
of n-butane233 becomes apparent, suggesting a low level of perturbation and hence a weak
interaction. At high coverages (d/le > ~1, labelled region γ) the overall intensity of the
spectra decreases, due to charging as indicated by XPS measurements. Isobars generated
(a)
20 18 16 14 12 10 8 6 40
5
10
15
2024 22 20 18 16 14 12 10 8
Clean 298 K 260 K 223 K 191 K 180 K 142 K 123 K 110 K
CP
S x
104
Binding energy / eV
Decreasing T
Energy below Evac / eV
(b)
20 18 16 14 12 10 8 6 40
1
2
3
4
5
6
7
8
24 22 20 18 16 14 12 10 8
24 22 20 18 16 14 12 10 8
(h)(g)
(f)
(e)(d)(c)(b)
(h) 110 K (g) 123 K (f) 142 K (e) 180 K (d) 191 K (c) 223 K (b) 260 K (a) 298 K
γ
β
αCP
S x
104
Binding energy / eV
α'(a)
Ionisation energy / eV
Ref
eren
ce g
as p
hase
n-b
utan
eEnergy below Evac / eV
(c)
20 18 16 14 12 10 8 6 40
5
10
15
20
25
30
3524 22 20 18 16 14 12 10 8
191 K 212 K 223 K 234 K 250 K 260 K 289 K 298 K
α
α'
CP
S x
103
Binding energy / eV
Dec
reas
ing
T
Energy below Evac / eV
Figure 4-5: UP spectra of a sulfated zirconia thin film during A-D equilibrium at 1x10⁻⁷
hPa n-butane: (a) raw data with "clean" UHV spectrum, (b) "clean" subtracted adsorbate difference spectra and reference He I gas phase n-butane spectrum233 and (c) "clean" subtracted adsorbate difference spectra at high temperatures only.
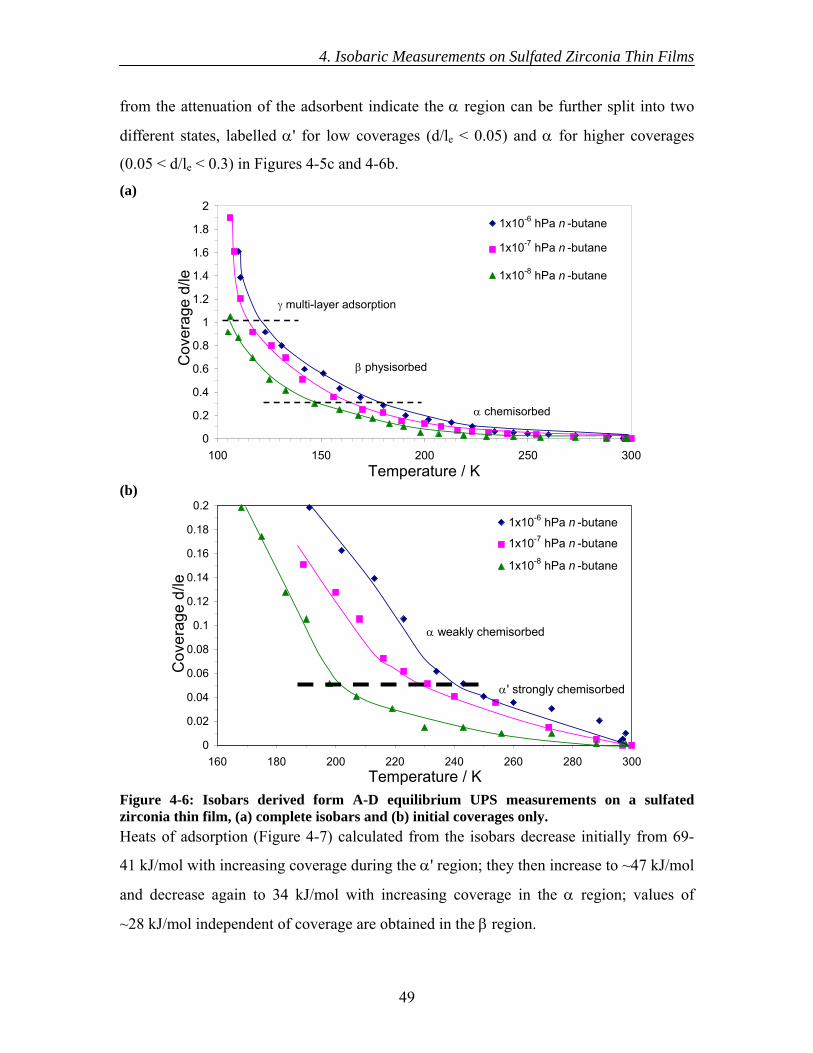
4. Isobaric Measurements on Sulfated Zirconia Thin Films
49
from the attenuation of the adsorbent indicate the α region can be further split into two
different states, labelled α' for low coverages (d/le < 0.05) and α for higher coverages
(0.05 < d/le < 0.3) in Figures 4-5c and 4-6b.
(a)
0
0.2
0.4
0.6
0.8
1
1.2
1.4
1.6
1.8
2
100 150 200 250 300Temperature / K
Cov
erag
e d/
le
1E-6 hPa n-butane
1E-7 hPa n-butane
1E-8 hPa n-butane
α chemisorbed
β physisorbed
γ multi-layer adsorption
1x10⁻⁶ hPa n -butane
1x10⁻⁷ hPa n -butane
1x10⁻⁸ hPa n -butane
(b)
0
0.02
0.04
0.06
0.08
0.1
0.12
0.14
0.16
0.18
0.2
160 180 200 220 240 260 280 300Temperature / K
Cov
erag
e d/
le
1E-6 hPa n-butane1E-7 hPa n-butane1E-8 hPa n-butane
α weakly chemisorbed
α' strongly chemisorbed
1x10⁻⁶ hPa n -butane
1x10⁻⁷ hPa n -butane
1x10⁻⁸ hPa n -butane
Figure 4-6: Isobars derived form A-D equilibrium UPS measurements on a sulfated zirconia thin film, (a) complete isobars and (b) initial coverages only. Heats of adsorption (Figure 4-7) calculated from the isobars decrease initially from 69-
41 kJ/mol with increasing coverage during the α' region; they then increase to ~47 kJ/mol
and decrease again to 34 kJ/mol with increasing coverage in the α region; values of
~28 kJ/mol independent of coverage are obtained in the β region.
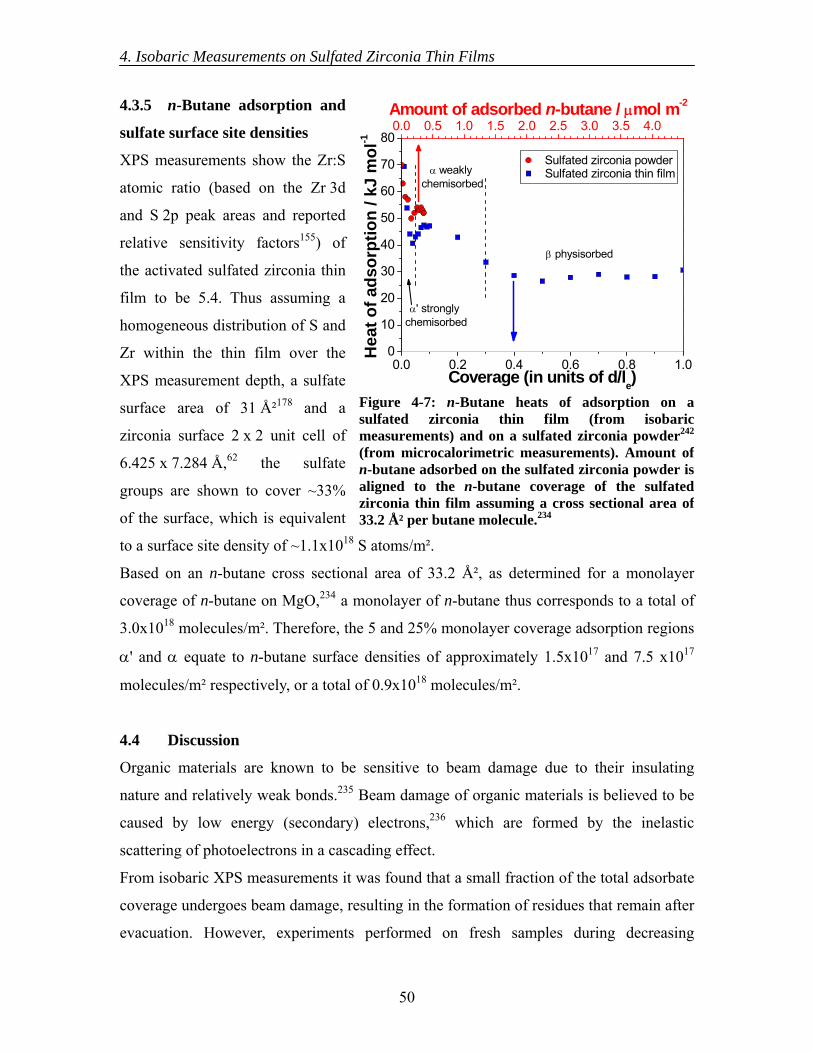
4. Isobaric Measurements on Sulfated Zirconia Thin Films
50
4.3.5 n-Butane adsorption and
sulfate surface site densities
XPS measurements show the Zr:S
atomic ratio (based on the Zr 3d
and S 2p peak areas and reported
relative sensitivity factors155) of
the activated sulfated zirconia thin
film to be 5.4. Thus assuming a
homogeneous distribution of S and
Zr within the thin film over the
XPS measurement depth, a sulfate
surface area of 31 Ų178 and a
zirconia surface 2 x 2 unit cell of
6.425 x 7.284 Å,62 the sulfate
groups are shown to cover ~33%
of the surface, which is equivalent
to a surface site density of ~1.1x10¹⁸ S atoms/m².
Based on an n-butane cross sectional area of 33.2 Ų, as determined for a monolayer
coverage of n-butane on MgO,234 a monolayer of n-butane thus corresponds to a total of
3.0x10¹⁸ molecules/m². Therefore, the 5 and 25% monolayer coverage adsorption regions
α' and α equate to n-butane surface densities of approximately 1.5x10¹⁷ and 7.5 x10¹⁷
molecules/m² respectively, or a total of 0.9x10¹⁸ molecules/m².
4.4 Discussion
Organic materials are known to be sensitive to beam damage due to their insulating
nature and relatively weak bonds.235 Beam damage of organic materials is believed to be
caused by low energy (secondary) electrons,236 which are formed by the inelastic
scattering of photoelectrons in a cascading effect.
From isobaric XPS measurements it was found that a small fraction of the total adsorbate
coverage undergoes beam damage, resulting in the formation of residues that remain after
evacuation. However, experiments performed on fresh samples during decreasing
0.0 0.2 0.4 0.6 0.8 1.00
10
20
30
40
50
60
70
800.0 0.5 1.0 1.5 2.0 2.5 3.0 3.5 4.0
Sulfated zirconia thin film
Hea
t of a
dsor
ptio
n / k
J m
ol-1
Coverage (in units of d/le)
β physisorbed
α weakly chemisorbed
Sulfated zirconia powder
Amount of adsorbed n-butane / μmol m-2
α' strongly chemisorbed
Figure 4-7: n-Butane heats of adsorption on a sulfated zirconia thin film (from isobaricmeasurements) and on a sulfated zirconia powder242
(from microcalorimetric measurements). Amount of n-butane adsorbed on the sulfated zirconia powder is aligned to the n-butane coverage of the sulfated zirconia thin film assuming a cross sectional area of33.2 Ų per butane molecule.234
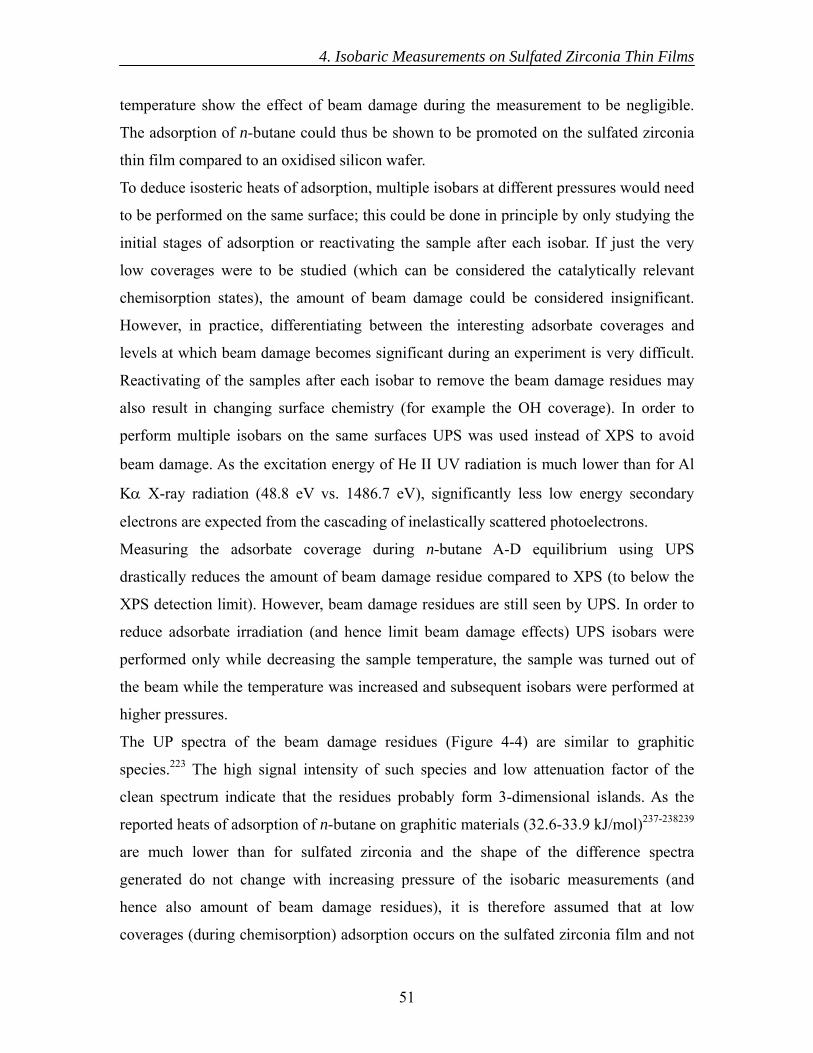
4. Isobaric Measurements on Sulfated Zirconia Thin Films
51
temperature show the effect of beam damage during the measurement to be negligible.
The adsorption of n-butane could thus be shown to be promoted on the sulfated zirconia
thin film compared to an oxidised silicon wafer.
To deduce isosteric heats of adsorption, multiple isobars at different pressures would need
to be performed on the same surface; this could be done in principle by only studying the
initial stages of adsorption or reactivating the sample after each isobar. If just the very
low coverages were to be studied (which can be considered the catalytically relevant
chemisorption states), the amount of beam damage could be considered insignificant.
However, in practice, differentiating between the interesting adsorbate coverages and
levels at which beam damage becomes significant during an experiment is very difficult.
Reactivating of the samples after each isobar to remove the beam damage residues may
also result in changing surface chemistry (for example the OH coverage). In order to
perform multiple isobars on the same surfaces UPS was used instead of XPS to avoid
beam damage. As the excitation energy of He ΙΙ UV radiation is much lower than for Al
Kα X-ray radiation (48.8 eV vs. 1486.7 eV), significantly less low energy secondary
electrons are expected from the cascading of inelastically scattered photoelectrons.
Measuring the adsorbate coverage during n-butane A-D equilibrium using UPS
drastically reduces the amount of beam damage residue compared to XPS (to below the
XPS detection limit). However, beam damage residues are still seen by UPS. In order to
reduce adsorbate irradiation (and hence limit beam damage effects) UPS isobars were
performed only while decreasing the sample temperature, the sample was turned out of
the beam while the temperature was increased and subsequent isobars were performed at
higher pressures.
The UP spectra of the beam damage residues (Figure 4-4) are similar to graphitic
species.223 The high signal intensity of such species and low attenuation factor of the
clean spectrum indicate that the residues probably form 3-dimensional islands. As the
reported heats of adsorption of n-butane on graphitic materials (32.6-33.9 kJ/mol)237-238239
are much lower than for sulfated zirconia and the shape of the difference spectra
generated do not change with increasing pressure of the isobaric measurements (and
hence also amount of beam damage residues), it is therefore assumed that at low
coverages (during chemisorption) adsorption occurs on the sulfated zirconia film and not
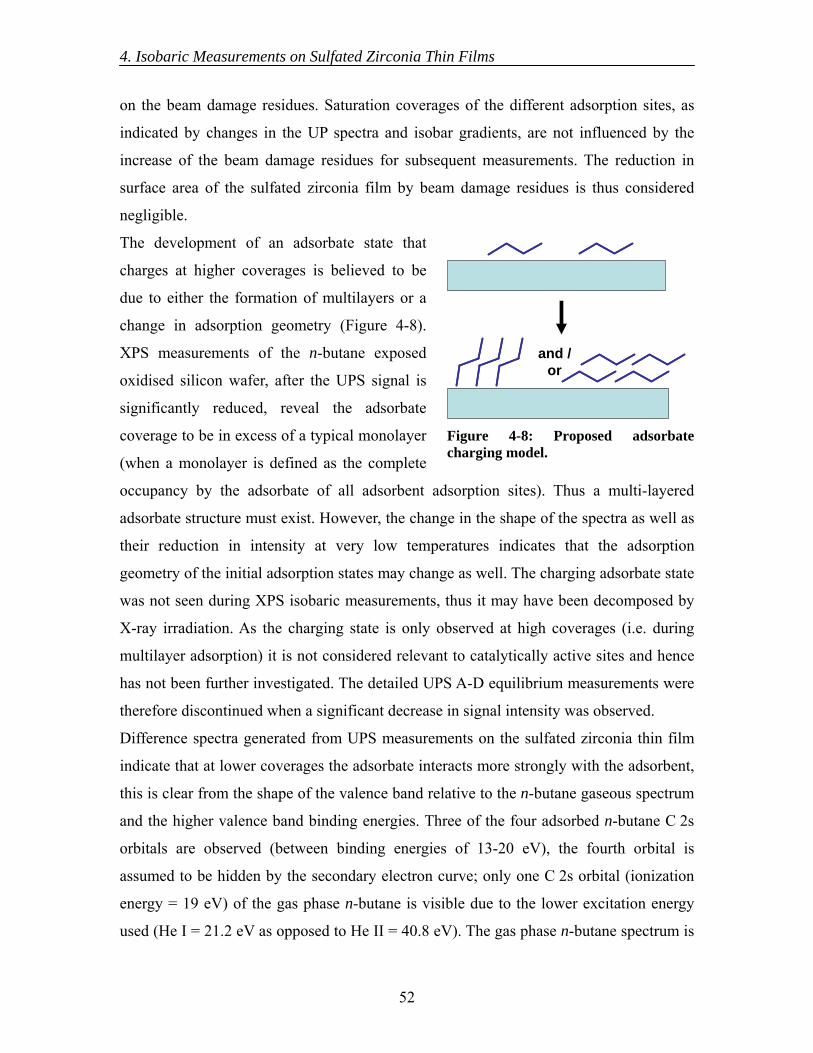
4. Isobaric Measurements on Sulfated Zirconia Thin Films
52
on the beam damage residues. Saturation coverages of the different adsorption sites, as
indicated by changes in the UP spectra and isobar gradients, are not influenced by the
increase of the beam damage residues for subsequent measurements. The reduction in
surface area of the sulfated zirconia film by beam damage residues is thus considered
negligible.
The development of an adsorbate state that
charges at higher coverages is believed to be
due to either the formation of multilayers or a
change in adsorption geometry (Figure 4-8).
XPS measurements of the n-butane exposed
oxidised silicon wafer, after the UPS signal is
significantly reduced, reveal the adsorbate
coverage to be in excess of a typical monolayer
(when a monolayer is defined as the complete
occupancy by the adsorbate of all adsorbent adsorption sites). Thus a multi-layered
adsorbate structure must exist. However, the change in the shape of the spectra as well as
their reduction in intensity at very low temperatures indicates that the adsorption
geometry of the initial adsorption states may change as well. The charging adsorbate state
was not seen during XPS isobaric measurements, thus it may have been decomposed by
X-ray irradiation. As the charging state is only observed at high coverages (i.e. during
multilayer adsorption) it is not considered relevant to catalytically active sites and hence
has not been further investigated. The detailed UPS A-D equilibrium measurements were
therefore discontinued when a significant decrease in signal intensity was observed.
Difference spectra generated from UPS measurements on the sulfated zirconia thin film
indicate that at lower coverages the adsorbate interacts more strongly with the adsorbent,
this is clear from the shape of the valence band relative to the n-butane gaseous spectrum
and the higher valence band binding energies. Three of the four adsorbed n-butane C 2s
orbitals are observed (between binding energies of 13-20 eV), the fourth orbital is
assumed to be hidden by the secondary electron curve; only one C 2s orbital (ionization
energy = 19 eV) of the gas phase n-butane is visible due to the lower excitation energy
used (He I = 21.2 eV as opposed to He II = 40.8 eV). The gas phase n-butane spectrum is
Figure 4-8: Proposed adsorbate charging model.
and /or
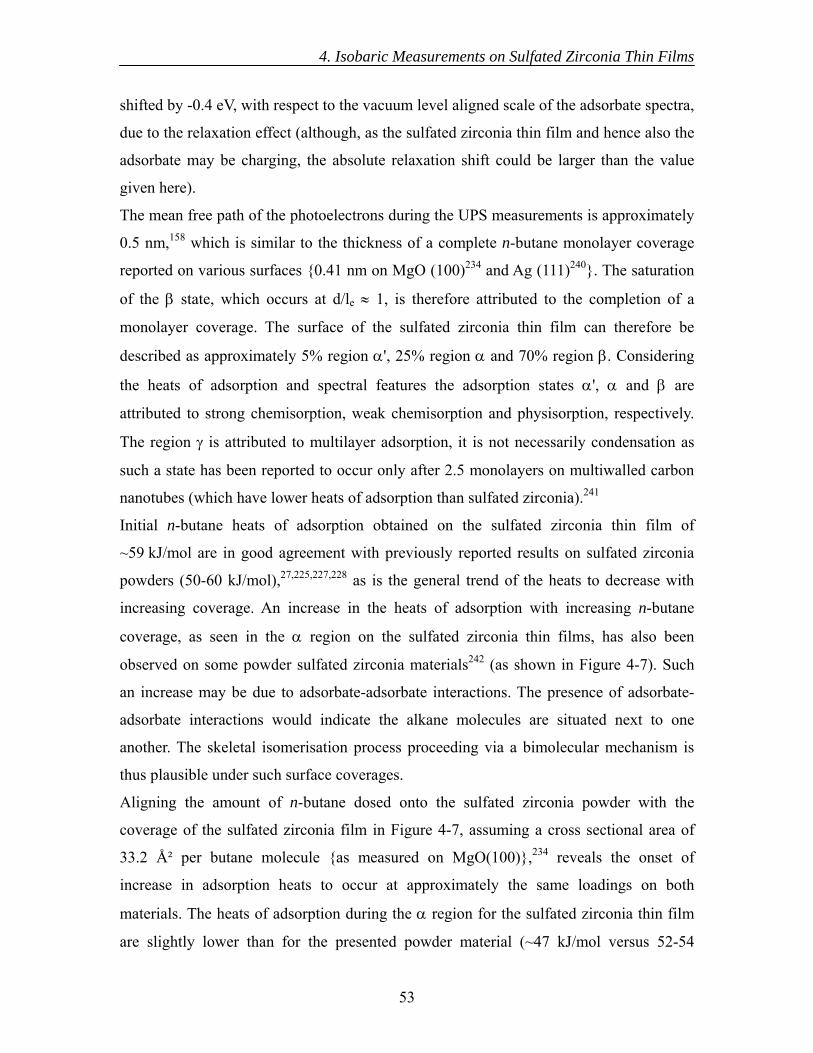
4. Isobaric Measurements on Sulfated Zirconia Thin Films
53
shifted by -0.4 eV, with respect to the vacuum level aligned scale of the adsorbate spectra,
due to the relaxation effect (although, as the sulfated zirconia thin film and hence also the
adsorbate may be charging, the absolute relaxation shift could be larger than the value
given here).
The mean free path of the photoelectrons during the UPS measurements is approximately
0.5 nm,158 which is similar to the thickness of a complete n-butane monolayer coverage
reported on various surfaces {0.41 nm on MgO (100)234 and Ag (111)240}. The saturation
of the β state, which occurs at d/le ≈ 1, is therefore attributed to the completion of a
monolayer coverage. The surface of the sulfated zirconia thin film can therefore be
described as approximately 5% region α', 25% region α and 70% region β. Considering
the heats of adsorption and spectral features the adsorption states α', α and β are
attributed to strong chemisorption, weak chemisorption and physisorption, respectively.
The region γ is attributed to multilayer adsorption, it is not necessarily condensation as
such a state has been reported to occur only after 2.5 monolayers on multiwalled carbon
nanotubes (which have lower heats of adsorption than sulfated zirconia).241
Initial n-butane heats of adsorption obtained on the sulfated zirconia thin film of
~59 kJ/mol are in good agreement with previously reported results on sulfated zirconia
powders (50-60 kJ/mol),27,225,227,228 as is the general trend of the heats to decrease with
increasing coverage. An increase in the heats of adsorption with increasing n-butane
coverage, as seen in the α region on the sulfated zirconia thin films, has also been
observed on some powder sulfated zirconia materials242 (as shown in Figure 4-7). Such
an increase may be due to adsorbate-adsorbate interactions. The presence of adsorbate-
adsorbate interactions would indicate the alkane molecules are situated next to one
another. The skeletal isomerisation process proceeding via a bimolecular mechanism is
thus plausible under such surface coverages.
Aligning the amount of n-butane dosed onto the sulfated zirconia powder with the
coverage of the sulfated zirconia film in Figure 4-7, assuming a cross sectional area of
33.2 Ų per butane molecule {as measured on MgO(100)},234 reveals the onset of
increase in adsorption heats to occur at approximately the same loadings on both
materials. The heats of adsorption during the α region for the sulfated zirconia thin film
are slightly lower than for the presented powder material (~47 kJ/mol versus 52-54
4. Isobaric Measurements on Sulfated Zirconia Thin Films
54
kJ/mol), however they are within the range of reported values on powders at higher
coverages (45 kJ/mol27 for 0.20 μmol/m², 38 kJ/mol225 for 0.36 μmol/m² and 40 kJ/mol228
for 0.55 μmol/m²).
The calculated sulfur surface site density assumes a homogeneous distribution of sulfur
and zirconium throughout the XPS measurement depth of the sulfated zirconia thin film.
It is, however, often assumed that the sulfate groups are situated on the surface of
zirconia crystals. The sulfate surface density was also estimated assuming a sulfate layer
on top of a zirconia film, taking into account the attenuation of the zirconium signal.243
Such a model results in the calculated thickness of the sulfate layer being in excess of a
monolayer coverage, which is not considered viable given the preparation route of the
zirconia thin films and the fact that polymeric sulfates (higher than disulfates) were not
observed by theoretical studies.62
Previously reported IR studies indicate the adsorption of n-butane to occur on hydroxyl
groups on sulfated zirconia.244 Furthermore, XPS investigations on the interaction of
sulfated zirconia thin films with n-butane under reactive conditions (see Chapter 5) show
the attenuation of the zirconium signal to be greater than sulfur upon carbon deposition.
However, given the similar coverages and densities of the chemisorbed n-butane (α' and
α) and sulfate surface sites, chemisorption of n-butane is therefore proposed to occur not
on the surface sulfate species but in close proximity to them. As the surface areas (and
hence structures) of both sulfate and n-butane molecules are assumed (based on literature
values) the correlations between the activated sulfate and total chemisorbed butane
surface coverages or densities are surprisingly good.
4.5 Conclusions
The adsorption of n-butane on sulfated zirconia thin films and oxidised silicon wafers
under A-D equilibrium conditions has been detected by XPS and UPS. The conducting
nature of the thin films used is essential in order to investigate the interaction with n-
butane under A-D equilibrium conditions by UPS.
Irradiation of adsorbed n-butane during XPS and UPS measurements results in the
formation of beam damage residues (although to a much lesser degree using UPS). The
application of specific experimental conditions showed that beam damage could be
4. Isobaric Measurements on Sulfated Zirconia Thin Films
55
considered negligible for single XPS isobars or multiple UPS isobar measurements. XPS
isobaric measurements have thus shown the sulfated zirconia thin films to promote the
adsorption of n-butane as compared to an oxidised silicon wafer.
UPS isobaric measurements showed the chemisorption of n-butane on the sulfated
zirconia thin films occurs via the sequential filling of two different sites; with coverages
of 0-0.05 and 0.05-0.3; and heats of adsorption from 59-40 and 47-34 kJ/mol,
respectively. The chemisorption of n-butane is proposed to occur in the close proximity
of surface sulfate groups on sulfated zirconia. Physisorption on the films results in heats
of ~28 kJ/mol for coverages between 0.3 up to a monolayer saturation. Multilayer
adsorption results in the formation of an insulating adsorbate structure. n-Butane adsorbs
reversibly on the sulfated zirconia thin film under the conditions studied.
The detection of adsorbate-adsorbate interactions during the weak chemisorption region
indicates the alkane molecules are adsorbed in close proximity to one another. Alkane
isomerisation proceeding via a bimolecular mechanism is thus considered viable under
such coverages.
5. Interaction of n-Butane with Sulfated Zirconia Thin Films under Reaction Conditions
56
5. Interaction of n-Butane with Sulfated Zirconia Thin Films under Reaction
Conditions
5.1 Introduction
5.1.1 XPS of sulfated zirconia
The application of photoelectron spectroscopy to study sulfated zirconia powders is
hindered due to the insulating nature of the oxide. Electrostatic charging results in the
binding energy scale needing to be corrected by typically 3.5 to 7 eV.83 The necessity to
calibrate the energy scale can cause some uncertainty in the exact binding energies and
thus has lead in some cases to the discussion of relative shifts.245 Various binding energies
have been reported for the Zr 3d5/2 peak of ZrO2, from 182.0 to 182.8 eV.154,246-247248249
5.1.2 XPS of deactivated sulfated zirconia
Studies on deactivated sulfated zirconia samples by XPS have shown the appearance of a
very minor amount of S4+ (at ~166-167 eV).83 These findings are consistent with an
earlier report from the same group of the presence of S4+ in deactivated platinum
containing sulfated zirconia.250 In both reports no S2- was detected, this has been
confirmed by the sulfidation of Pt containing sulfated zirconia, which results in the
appearance of an additional peak at ~162.5 eV.251
5.1.3 XPS on zirconia thin films
In a recent study Chang and Doong252 reported the effects of different temperatures and
atmospheres (air or nitrogen) during thermal treatment of zirconia films on their chemical
composition and crystalline properties, determined by XPS and XRD respectively. Fitting
of the O 1s spectra revealed two components, one at 529.9 eV and the other at 531.5 eV
that are ascribed to Zr-O and Zr-OH respectively. The Zr 3d is fitted using a separation of
1.08 eV between the different zirconium oxidation states taken from reference 248, into
Zr4+, Zr3+, Zr2+ and even Zr+. From comparing the phase transformation temperatures
deduced from the XRD data with the XPS results it was concluded that the reduction of
Zr4+ to lower oxidation states and the generation of oxygen vacancies play crucial roles in
stabilizing the formation of the meta-stable tetragonal phase. It must be noted however
that reduced fractions of Zr4+ were only detected in the "bulk" measurements of the films,
after the original surface had been removed by argon bombardment. The application of
argon bombardment is, however, known to potentially chemically alter samples.243
5. Interaction of n-Butane with Sulfated Zirconia Thin Films under Reaction Conditions
57
5.1.4 XPS on sulfated zirconia thin films
Jentoft et al.123 presented XP spectra for a sulfated zirconia thin film as deposited, after
calcination (in an adjacent preparation chamber) and after He sputtering. Charging
corrections (using Zr 3d5/2 = 182.2 eV)154 of only 2.0 eV (as deposited) and 1.7 eV
(calcined) were applied, which are significantly less than for sulfated zirconia powders.
Calcination was shown to remove almost all of the carbon (the main C 1s component at
284.5 eV). The O 1s peak is shown to consist of at least two components, one at 530 eV
assigned to O2- of ZrO2 and one at 531.5 eV, the latter of which is significantly reduced
relative to the other and shifts slightly to higher binding energies after calcination and
almost disappears after sputtering. The S 2p maximum is shown to shift after calcination
from 168.4 eV to 169.0 eV, which is consistent with the presence of S6+. After sputtering
the S 2p signal shifts to 161.2 eV, which is consistent with S2-. The disappearance of the
oxygen species and the high binding energy oxygen species strongly suggest that the O 1s
peak at 531.8 eV belongs to the sulfate species.
5.1.5 Motivation
In order to increase the resolution of the XP spectra, and in particular of the sulfur
species, high resolution XPS has been applied to a sulfated zirconia thin film using a
synchrotron light source. The use of a specialised, differentially pumped, set up allowing
in situ XPS studies at relatively high pressures (up to ~0.5 hPa) has also been
employed.253 In situ investigations on sulfated zirconia are essential, given the reacted
catalysts are known to undergo chemical changes upon exposure to air.254 The effects of
activating the sample in oxygen and exposing the sample to n-butane under reactive
conditions have thus been studied by in situ XPS to evaluate any changes that may be due
to the formation and removal of catalytically active sites. Carbon K edge near edge X-ray
absorption fine structure spectroscopy (NEXAFS) was also performed in order to
determine the nature of any carbonaceous deposits formed on the film's surface.
5.2 Experimental
The experiment was performed using the undulator beam line U49-2/PGM2 at the Berlin
synchrotron facility (BESSY, Berliner Elektronenspeicherring-Gesellschaft für
Synchrotronstrahlung), details of the setup are described in reference 253. The sample, a
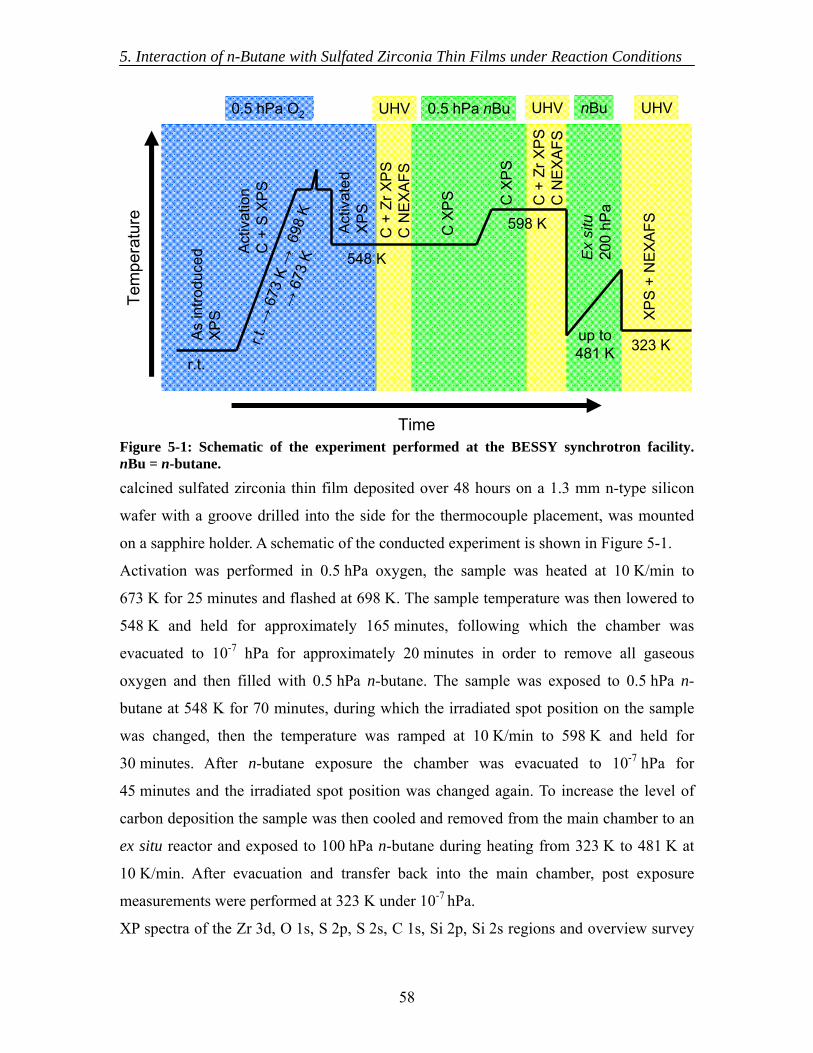
5. Interaction of n-Butane with Sulfated Zirconia Thin Films under Reaction Conditions
58
calcined sulfated zirconia thin film deposited over 48 hours on a 1.3 mm n-type silicon
wafer with a groove drilled into the side for the thermocouple placement, was mounted
on a sapphire holder. A schematic of the conducted experiment is shown in Figure 5-1.
Activation was performed in 0.5 hPa oxygen, the sample was heated at 10 K/min to
673 K for 25 minutes and flashed at 698 K. The sample temperature was then lowered to
548 K and held for approximately 165 minutes, following which the chamber was
evacuated to 10-7 hPa for approximately 20 minutes in order to remove all gaseous
oxygen and then filled with 0.5 hPa n-butane. The sample was exposed to 0.5 hPa n-
butane at 548 K for 70 minutes, during which the irradiated spot position on the sample
was changed, then the temperature was ramped at 10 K/min to 598 K and held for
30 minutes. After n-butane exposure the chamber was evacuated to 10-7 hPa for
45 minutes and the irradiated spot position was changed again. To increase the level of
carbon deposition the sample was then cooled and removed from the main chamber to an
ex situ reactor and exposed to 100 hPa n-butane during heating from 323 K to 481 K at
10 K/min. After evacuation and transfer back into the main chamber, post exposure
measurements were performed at 323 K under 10-7 hPa.
XP spectra of the Zr 3d, O 1s, S 2p, S 2s, C 1s, Si 2p, Si 2s regions and overview survey
As in
trodu
ced
XPS
Act
ivat
ion
C +
S X
PS
Act
ivat
ed
XPS
C
+ Z
r XP
SC
NEX
AFS
Time
Tem
pera
ture
0.5 hPa O2 UHV 0.5 hPa nBu
C X
PS
C X
PS
C +
Zr X
PSC
NEX
AFS
Ex
situ
200
hPa
XPS
+ N
EXA
FS
r.t.
r.t. →
673
K →
698
K →
673
K 548 K
598 K
up to481 K 323 K
UHV UHVnBu
Figure 5-1: Schematic of the experiment performed at the BESSY synchrotron facility. nBu = n-butane.
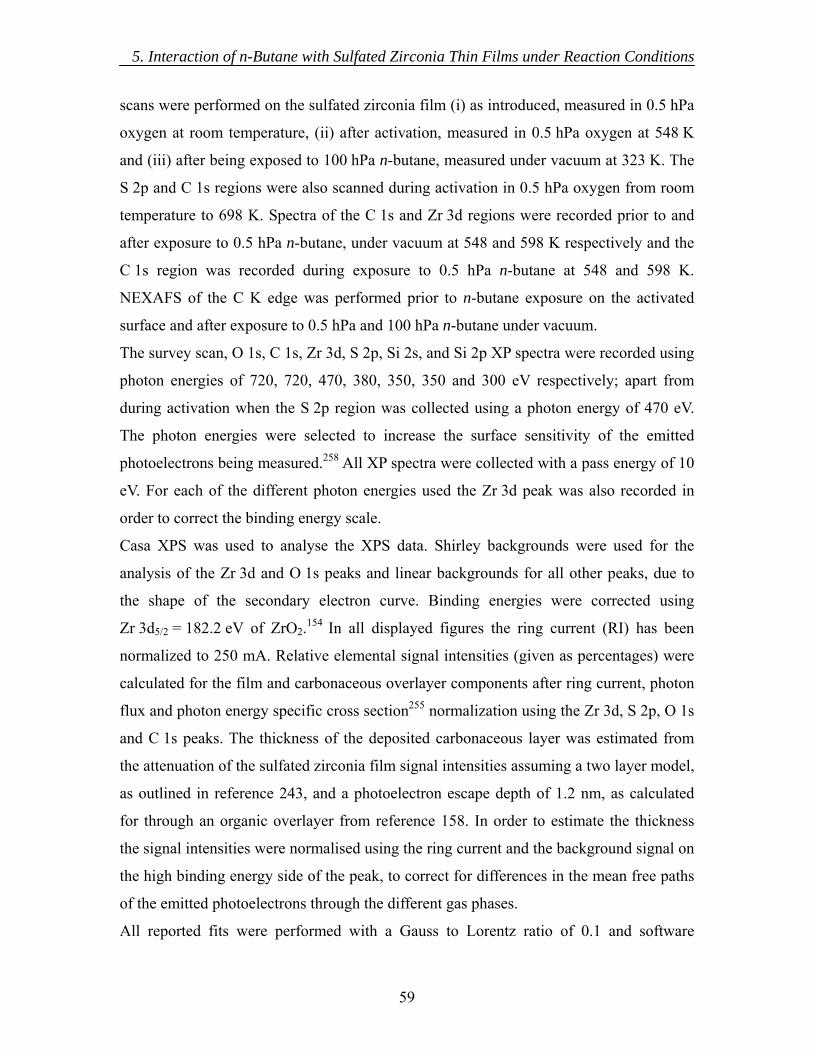
5. Interaction of n-Butane with Sulfated Zirconia Thin Films under Reaction Conditions
59
scans were performed on the sulfated zirconia film (i) as introduced, measured in 0.5 hPa
oxygen at room temperature, (ii) after activation, measured in 0.5 hPa oxygen at 548 K
and (iii) after being exposed to 100 hPa n-butane, measured under vacuum at 323 K. The
S 2p and C 1s regions were also scanned during activation in 0.5 hPa oxygen from room
temperature to 698 K. Spectra of the C 1s and Zr 3d regions were recorded prior to and
after exposure to 0.5 hPa n-butane, under vacuum at 548 and 598 K respectively and the
C 1s region was recorded during exposure to 0.5 hPa n-butane at 548 and 598 K.
NEXAFS of the C K edge was performed prior to n-butane exposure on the activated
surface and after exposure to 0.5 hPa and 100 hPa n-butane under vacuum.
The survey scan, O 1s, C 1s, Zr 3d, S 2p, Si 2s, and Si 2p XP spectra were recorded using
photon energies of 720, 720, 470, 380, 350, 350 and 300 eV respectively; apart from
during activation when the S 2p region was collected using a photon energy of 470 eV.
The photon energies were selected to increase the surface sensitivity of the emitted
photoelectrons being measured.258 All XP spectra were collected with a pass energy of 10
eV. For each of the different photon energies used the Zr 3d peak was also recorded in
order to correct the binding energy scale.
Casa XPS was used to analyse the XPS data. Shirley backgrounds were used for the
analysis of the Zr 3d and O 1s peaks and linear backgrounds for all other peaks, due to
the shape of the secondary electron curve. Binding energies were corrected using
Zr 3d5/2 = 182.2 eV of ZrO2.154 In all displayed figures the ring current (RI) has been
normalized to 250 mA. Relative elemental signal intensities (given as percentages) were
calculated for the film and carbonaceous overlayer components after ring current, photon
flux and photon energy specific cross section255 normalization using the Zr 3d, S 2p, O 1s
and C 1s peaks. The thickness of the deposited carbonaceous layer was estimated from
the attenuation of the sulfated zirconia film signal intensities assuming a two layer model,
as outlined in reference 243, and a photoelectron escape depth of 1.2 nm, as calculated
for through an organic overlayer from reference 158. In order to estimate the thickness
the signal intensities were normalised using the ring current and the background signal on
the high binding energy side of the peak, to correct for differences in the mean free paths
of the emitted photoelectrons through the different gas phases.
All reported fits were performed with a Gauss to Lorentz ratio of 0.1 and software
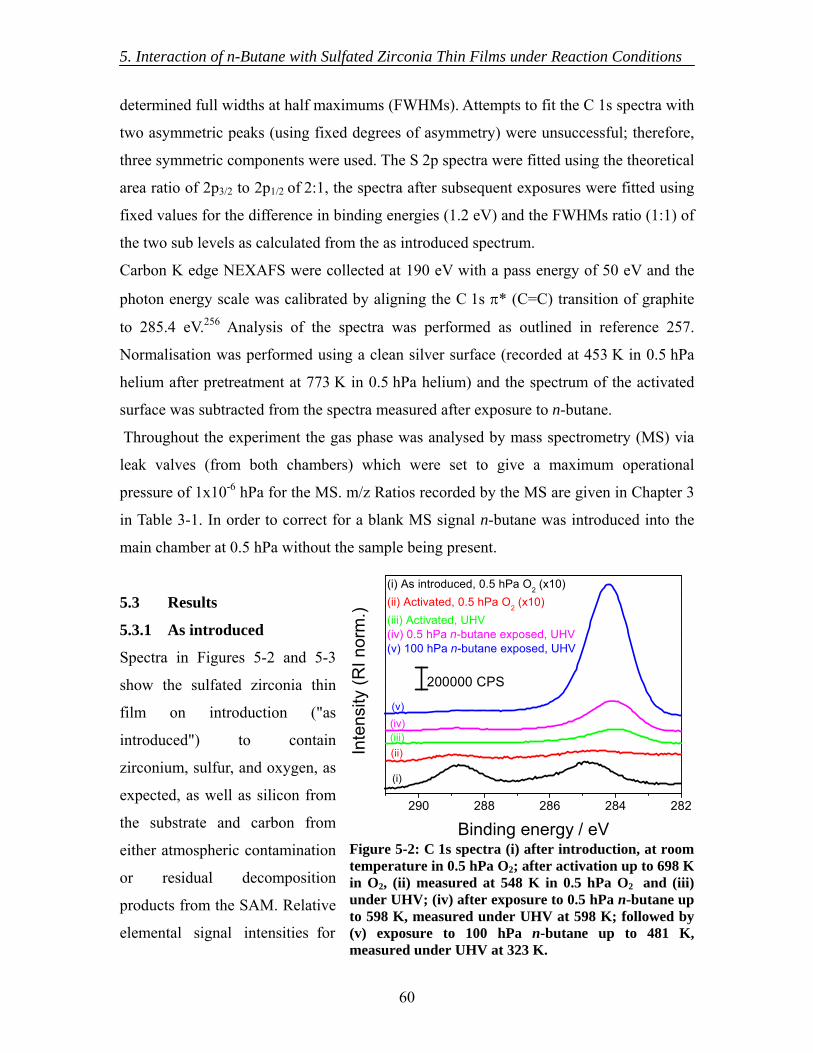
5. Interaction of n-Butane with Sulfated Zirconia Thin Films under Reaction Conditions
60
determined full widths at half maximums (FWHMs). Attempts to fit the C 1s spectra with
two asymmetric peaks (using fixed degrees of asymmetry) were unsuccessful; therefore,
three symmetric components were used. The S 2p spectra were fitted using the theoretical
area ratio of 2p3/2 to 2p1/2 of 2:1, the spectra after subsequent exposures were fitted using
fixed values for the difference in binding energies (1.2 eV) and the FWHMs ratio (1:1) of
the two sub levels as calculated from the as introduced spectrum.
Carbon K edge NEXAFS were collected at 190 eV with a pass energy of 50 eV and the
photon energy scale was calibrated by aligning the C 1s π* (C=C) transition of graphite
to 285.4 eV.256 Analysis of the spectra was performed as outlined in reference 257.
Normalisation was performed using a clean silver surface (recorded at 453 K in 0.5 hPa
helium after pretreatment at 773 K in 0.5 hPa helium) and the spectrum of the activated
surface was subtracted from the spectra measured after exposure to n-butane.
Throughout the experiment the gas phase was analysed by mass spectrometry (MS) via
leak valves (from both chambers) which were set to give a maximum operational
pressure of 1x10⁻⁶ hPa for the MS. m/z Ratios recorded by the MS are given in Chapter 3
in Table 3-1. In order to correct for a blank MS signal n-butane was introduced into the
main chamber at 0.5 hPa without the sample being present.
5.3 Results
5.3.1 As introduced
Spectra in Figures 5-2 and 5-3
show the sulfated zirconia thin
film on introduction ("as
introduced") to contain
zirconium, sulfur, and oxygen, as
expected, as well as silicon from
the substrate and carbon from
either atmospheric contamination
or residual decomposition
products from the SAM. Relative
elemental signal intensities for
290 288 286 284 282
(v)(iv)(iii)(ii)
(i) As introduced, 0.5 hPa O2 (x10)(ii) Activated, 0.5 hPa O2 (x10)(iii) Activated, UHV(iv) 0.5 hPa n-butane exposed, UHV(v) 100 hPa n-butane exposed, UHV
Inte
nsity
(RI n
orm
.)
Binding energy / eV
200000 CPS
(i)
Figure 5-2: C 1s spectra (i) after introduction, at room temperature in 0.5 hPa O2; after activation up to 698 K in O2, (ii) measured at 548 K in 0.5 hPa O2 and (iii) under UHV; (iv) after exposure to 0.5 hPa n-butane up to 598 K, measured under UHV at 598 K; followed by (v) exposure to 100 hPa n-butane up to 481 K, measured under UHV at 323 K.
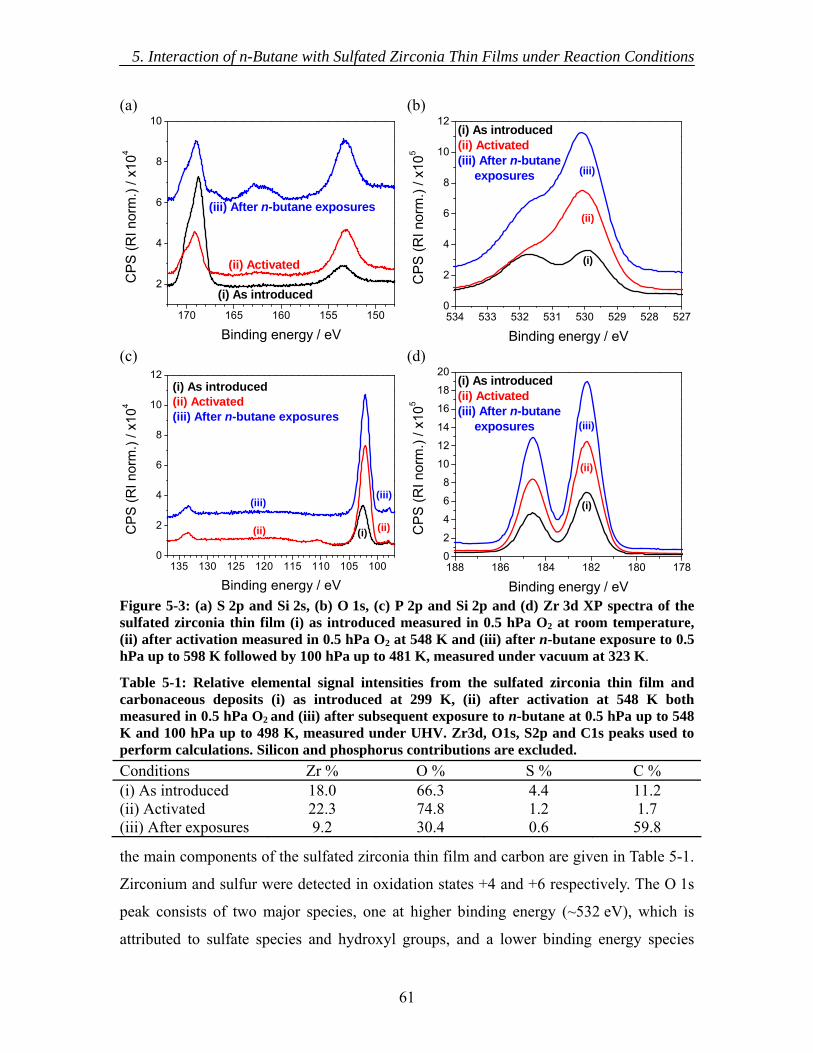
5. Interaction of n-Butane with Sulfated Zirconia Thin Films under Reaction Conditions
61
the main components of the sulfated zirconia thin film and carbon are given in Table 5-1.
Zirconium and sulfur were detected in oxidation states +4 and +6 respectively. The O 1s
peak consists of two major species, one at higher binding energy (~532 eV), which is
attributed to sulfate species and hydroxyl groups, and a lower binding energy species
(a)
170 165 160 155 150
2
4
6
8
10
(i) As introduced
CP
S (R
I nor
m.)
/ x10
4
Binding energy / eV
(iii) After n-butane exposures
(ii) Activated
(b)
534 533 532 531 530 529 528 5270
2
4
6
8
10
12
(iii)
(ii)
CP
S (R
I nor
m.)
/ x10
5
Binding energy / eV
(i) As introduced(ii) Activated(iii) After n-butane exposures
(i)
(c)
135 130 125 120 115 110 105 1000
2
4
6
8
10
12
(ii)
(iii)(iii)
(ii)
(i) As introduced(ii) Activated(iii) After n-butane exposures
CP
S (R
I nor
m.)
/ x10
4
Binding energy / eV
(i)
(d)
188 186 184 182 180 1780
2
4
6
8
10
12
14
16
18
20
(iii)
(ii)
CP
S (R
I nor
m.)
/ x10
5
Binding energy / eV
(i) As introduced(ii) Activated(iii) After n-butane exposures
(i)
Figure 5-3: (a) S 2p and Si 2s, (b) O 1s, (c) P 2p and Si 2p and (d) Zr 3d XP spectra of the sulfated zirconia thin film (i) as introduced measured in 0.5 hPa O2 at room temperature, (ii) after activation measured in 0.5 hPa O2 at 548 K and (iii) after n-butane exposure to 0.5 hPa up to 598 K followed by 100 hPa up to 481 K, measured under vacuum at 323 K.
Table 5-1: Relative elemental signal intensities from the sulfated zirconia thin film and carbonaceous deposits (i) as introduced at 299 K, (ii) after activation at 548 K both measured in 0.5 hPa O2 and (iii) after subsequent exposure to n-butane at 0.5 hPa up to 548 K and 100 hPa up to 498 K, measured under UHV. Zr3d, O1s, S2p and C1s peaks used to perform calculations. Silicon and phosphorus contributions are excluded. Conditions Zr % O % S % C % (i) As introduced 18.0 66.3 4.4 11.2 (ii) Activated 22.3 74.8 1.2 1.7 (iii) After exposures 9.2 30.4 0.6 59.8
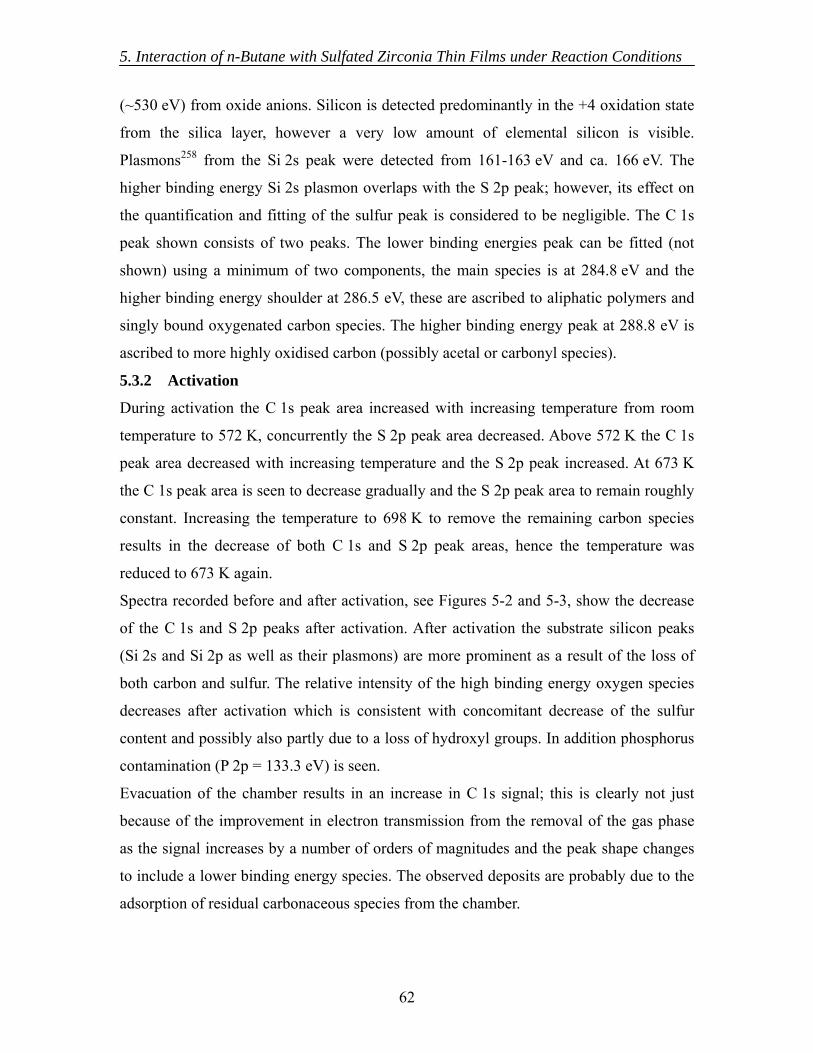
5. Interaction of n-Butane with Sulfated Zirconia Thin Films under Reaction Conditions
62
(~530 eV) from oxide anions. Silicon is detected predominantly in the +4 oxidation state
from the silica layer, however a very low amount of elemental silicon is visible.
Plasmons258 from the Si 2s peak were detected from 161-163 eV and ca. 166 eV. The
higher binding energy Si 2s plasmon overlaps with the S 2p peak; however, its effect on
the quantification and fitting of the sulfur peak is considered to be negligible. The C 1s
peak shown consists of two peaks. The lower binding energies peak can be fitted (not
shown) using a minimum of two components, the main species is at 284.8 eV and the
higher binding energy shoulder at 286.5 eV, these are ascribed to aliphatic polymers and
singly bound oxygenated carbon species. The higher binding energy peak at 288.8 eV is
ascribed to more highly oxidised carbon (possibly acetal or carbonyl species).
5.3.2 Activation
During activation the C 1s peak area increased with increasing temperature from room
temperature to 572 K, concurrently the S 2p peak area decreased. Above 572 K the C 1s
peak area decreased with increasing temperature and the S 2p peak increased. At 673 K
the C 1s peak area is seen to decrease gradually and the S 2p peak area to remain roughly
constant. Increasing the temperature to 698 K to remove the remaining carbon species
results in the decrease of both C 1s and S 2p peak areas, hence the temperature was
reduced to 673 K again.
Spectra recorded before and after activation, see Figures 5-2 and 5-3, show the decrease
of the C 1s and S 2p peaks after activation. After activation the substrate silicon peaks
(Si 2s and Si 2p as well as their plasmons) are more prominent as a result of the loss of
both carbon and sulfur. The relative intensity of the high binding energy oxygen species
decreases after activation which is consistent with concomitant decrease of the sulfur
content and possibly also partly due to a loss of hydroxyl groups. In addition phosphorus
contamination (P 2p = 133.3 eV) is seen.
Evacuation of the chamber results in an increase in C 1s signal; this is clearly not just
because of the improvement in electron transmission from the removal of the gas phase
as the signal increases by a number of orders of magnitudes and the peak shape changes
to include a lower binding energy species. The observed deposits are probably due to the
adsorption of residual carbonaceous species from the chamber.
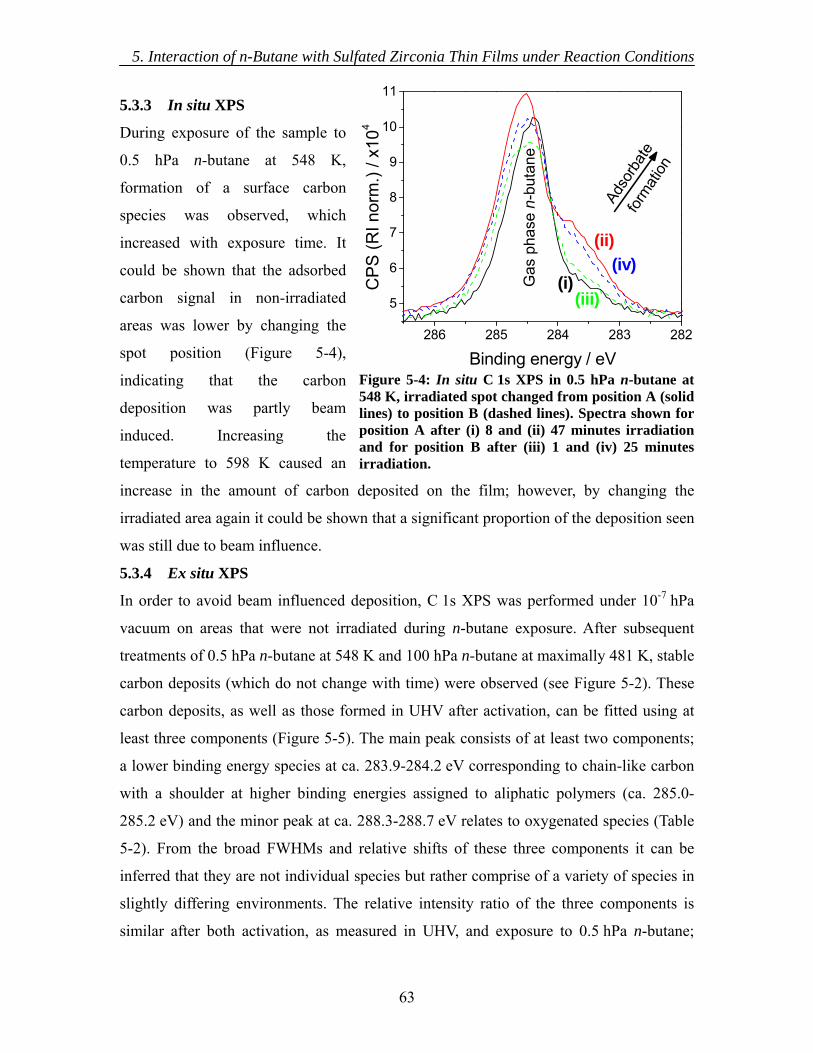
5. Interaction of n-Butane with Sulfated Zirconia Thin Films under Reaction Conditions
63
5.3.3 In situ XPS
During exposure of the sample to
0.5 hPa n-butane at 548 K,
formation of a surface carbon
species was observed, which
increased with exposure time. It
could be shown that the adsorbed
carbon signal in non-irradiated
areas was lower by changing the
spot position (Figure 5-4),
indicating that the carbon
deposition was partly beam
induced. Increasing the
temperature to 598 K caused an
increase in the amount of carbon deposited on the film; however, by changing the
irradiated area again it could be shown that a significant proportion of the deposition seen
was still due to beam influence.
5.3.4 Ex situ XPS
In order to avoid beam influenced deposition, C 1s XPS was performed under 10-7 hPa
vacuum on areas that were not irradiated during n-butane exposure. After subsequent
treatments of 0.5 hPa n-butane at 548 K and 100 hPa n-butane at maximally 481 K, stable
carbon deposits (which do not change with time) were observed (see Figure 5-2). These
carbon deposits, as well as those formed in UHV after activation, can be fitted using at
least three components (Figure 5-5). The main peak consists of at least two components;
a lower binding energy species at ca. 283.9-284.2 eV corresponding to chain-like carbon
with a shoulder at higher binding energies assigned to aliphatic polymers (ca. 285.0-
285.2 eV) and the minor peak at ca. 288.3-288.7 eV relates to oxygenated species (Table
5-2). From the broad FWHMs and relative shifts of these three components it can be
inferred that they are not individual species but rather comprise of a variety of species in
slightly differing environments. The relative intensity ratio of the three components is
similar after both activation, as measured in UHV, and exposure to 0.5 hPa n-butane;
286 285 284 283 282
5
6
7
8
9
10
11
(iii)
(iv)(ii)
CP
S (R
I nor
m.)
/ x10
4Binding energy / eV
(i)Gas
pha
se n
-but
ane
Adso
rbat
e fo
rmat
ion
Figure 5-4: In situ C 1s XPS in 0.5 hPa n-butane at 548 K, irradiated spot changed from position A (solidlines) to position B (dashed lines). Spectra shown forposition A after (i) 8 and (ii) 47 minutes irradiation and for position B after (iii) 1 and (iv) 25 minutesirradiation.
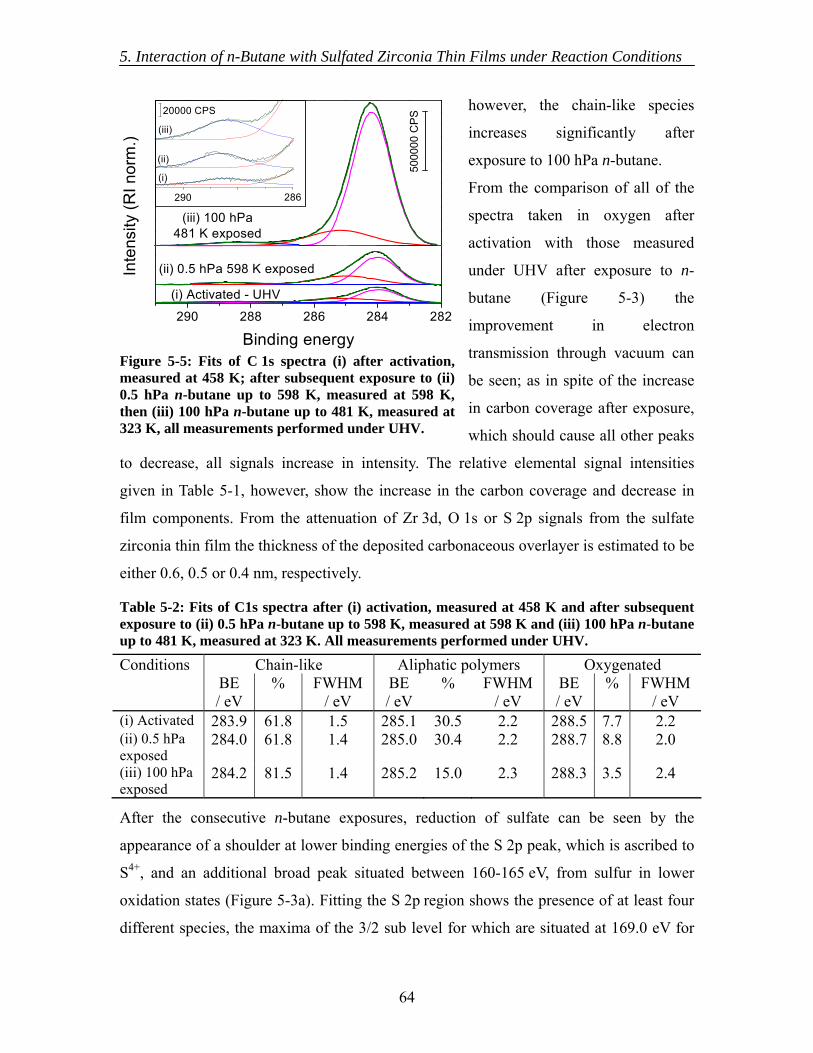
5. Interaction of n-Butane with Sulfated Zirconia Thin Films under Reaction Conditions
64
however, the chain-like species
increases significantly after
exposure to 100 hPa n-butane.
From the comparison of all of the
spectra taken in oxygen after
activation with those measured
under UHV after exposure to n-
butane (Figure 5-3) the
improvement in electron
transmission through vacuum can
be seen; as in spite of the increase
in carbon coverage after exposure,
which should cause all other peaks
to decrease, all signals increase in intensity. The relative elemental signal intensities
given in Table 5-1, however, show the increase in the carbon coverage and decrease in
film components. From the attenuation of Zr 3d, O 1s or S 2p signals from the sulfate
zirconia thin film the thickness of the deposited carbonaceous overlayer is estimated to be
either 0.6, 0.5 or 0.4 nm, respectively.
After the consecutive n-butane exposures, reduction of sulfate can be seen by the
appearance of a shoulder at lower binding energies of the S 2p peak, which is ascribed to
S4+, and an additional broad peak situated between 160-165 eV, from sulfur in lower
oxidation states (Figure 5-3a). Fitting the S 2p region shows the presence of at least four
different species, the maxima of the 3/2 sub level for which are situated at 169.0 eV for
290 288 286 284 282
(iii)
(ii)
(i)
(iii) 100 hPa481 K exposed
(ii) 0.5 hPa 598 K exposed
286
Inte
nsity
(RI n
orm
.)
Binding energy
290
20000 CPS
5000
00 C
PS
(i) Activated - UHV
Figure 5-5: Fits of C 1s spectra (i) after activation,measured at 458 K; after subsequent exposure to (ii) 0.5 hPa n-butane up to 598 K, measured at 598 K,then (iii) 100 hPa n-butane up to 481 K, measured at323 K, all measurements performed under UHV.
Table 5-2: Fits of C1s spectra after (i) activation, measured at 458 K and after subsequent exposure to (ii) 0.5 hPa n-butane up to 598 K, measured at 598 K and (iii) 100 hPa n-butane up to 481 K, measured at 323 K. All measurements performed under UHV.
Conditions Chain-like Aliphatic polymers Oxygenated BE
/ eV % FWHM
/ eV BE / eV
% FWHM / eV
BE / eV
% FWHM / eV
(i) Activated 283.9 61.8 1.5 285.1 30.5 2.2 288.5 7.7 2.2 (ii) 0.5 hPa exposed
284.0 61.8 1.4 285.0 30.4 2.2 288.7 8.8 2.0
(iii) 100 hPa exposed
284.2 81.5 1.4 285.2 15.0 2.3 288.3 3.5 2.4
5. Interaction of n-Butane with Sulfated Zirconia Thin Films under Reaction Conditions
65
S6+, 167.2 eV for S4+ and two
additional reduced states at 163.1
and 161.4 eV (Figure 5-6 and
Table 5-3). The zirconium to sulfur
ratio (based on the relative
elemental intensities of the Zr 3d
and S 2p peaks) therefore
decreases from 18.5 as measured
after activation to 15.0 after the
consecutive n-butane exposures.
In the Si 2s and Si 2p regions
(Figure 5-3a and c) there are no
major changes to the Si4+ or
elemental silicon peaks after exposure to n-butane, apart from their further attenuation by
the carbonaceous deposits, thus their plasmons are no longer visible in the 2p region and
therefore considered to be negligible in the 2s region. The ratio of the O 1s higher binding
energy component (~532 eV) to the lower binding energy component (~530 eV)
increases slightly after the n-butane exposure (Figure 5-3b). The Zr 3d and P 2p peaks all
do not alter
significantly after
exposure. Closer
inspection of the low
binding energy
tailing of the Zr 3d
peak reveals no
differences that may prove the presence of a Zr3+ species.
5.3.5 NEXAFS
Auger electron yield NEXAFS analysis of the C K edge, performed also under 10-7 hPa
vacuum after the aforementioned subsequent n-butane exposures (Figure 5-7), show the
development of a feature at ~285.0 eV. The transition only becomes clearly visible after
the higher pressure n-butane exposure. This transition is not consistent with absorbance
172 170 168 166 164 162 1600
1
2
3
CP
S (R
I nor
m.)
/ x 1
04
Binding energy / eVFigure 5-6: Fit of S 2p spectra, taken after subsequent 0.5 hPa n-butane up to 598 K and 100 hPa n-butane up to 481 K exposures, measured at 323 K under UHV.
Table 5-3: Fitting of S 2p spectra after subsequent n-butane exposures at 0.5 hPa up to 598 K and 100 hPa up to 481 K, measurement performed under UHV at 323 K. Binding energies of S 2p3/2 peak given. Species BE / eV % FWHM / eV S6+ 169.0 63.8 1.2 S4+ 167.1 9.2 1.3 S0 or S2- 163.1 9.3 1.2 S2- 161.4 17.7 1.9 Total reduced fraction - 36.2 -
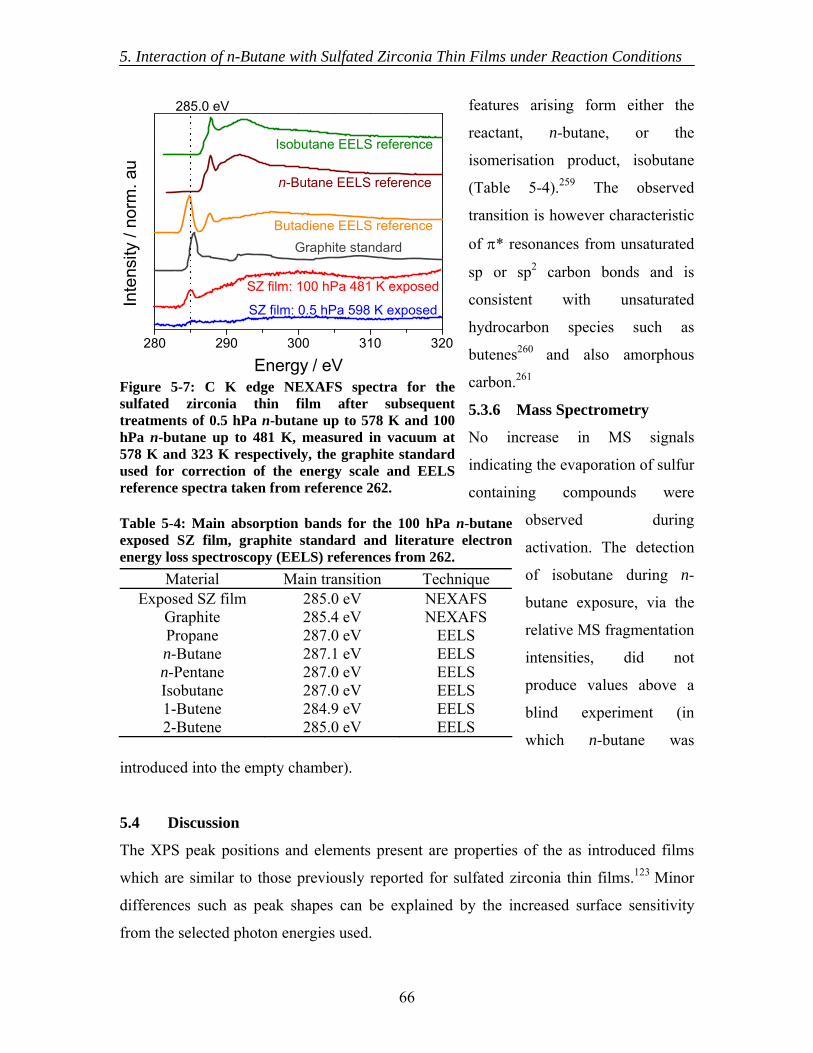
5. Interaction of n-Butane with Sulfated Zirconia Thin Films under Reaction Conditions
66
features arising form either the
reactant, n-butane, or the
isomerisation product, isobutane
(Table 5-4).259 The observed
transition is however characteristic
of π* resonances from unsaturated
sp or sp2 carbon bonds and is
consistent with unsaturated
hydrocarbon species such as
butenes260 and also amorphous
carbon.261
5.3.6 Mass Spectrometry
No increase in MS signals
indicating the evaporation of sulfur
containing compounds were
observed during
activation. The detection
of isobutane during n-
butane exposure, via the
relative MS fragmentation
intensities, did not
produce values above a
blind experiment (in
which n-butane was
introduced into the empty chamber).
5.4 Discussion
The XPS peak positions and elements present are properties of the as introduced films
which are similar to those previously reported for sulfated zirconia thin films.123 Minor
differences such as peak shapes can be explained by the increased surface sensitivity
from the selected photon energies used.
280 290 300 310 320
Isobutane EELS reference
n-Butane EELS reference
Butadiene EELS referenceGraphite standard
SZ film: 100 hPa 481 K exposed
SZ film: 0.5 hPa 598 K exposedInte
nsity
/ no
rm. a
u
Energy / eV
285.0 eV
Figure 5-7: C K edge NEXAFS spectra for the sulfated zirconia thin film after subsequent treatments of 0.5 hPa n-butane up to 578 K and 100 hPa n-butane up to 481 K, measured in vacuum at 578 K and 323 K respectively, the graphite standard used for correction of the energy scale and EELS reference spectra taken from reference 262.
Table 5-4: Main absorption bands for the 100 hPa n-butane exposed SZ film, graphite standard and literature electronenergy loss spectroscopy (EELS) references from 262.
Material Main transition Technique Exposed SZ film 285.0 eV NEXAFS
Graphite 285.4 eV NEXAFS Propane 287.0 eV EELS n-Butane 287.1 eV EELS n-Pentane 287.0 eV EELS Isobutane 287.0 eV EELS 1-Butene 284.9 eV EELS 2-Butene 285.0 eV EELS
5. Interaction of n-Butane with Sulfated Zirconia Thin Films under Reaction Conditions
67
During activation the initial decrease in sulfur is consistent with an increase in the carbon
coverage. However, at higher temperatures the loss of sulfur is not understood. The film
was previously calcined in synthetic air at 823 K and TDS experiments (see Chapter 3)
have shown that under vacuum the films are stable up to 723 K, thus within the
temperature and pressure ranges of this experiment.
The occurrence of beam influenced deposition during in situ n-butane XPS was not
unexpected given that beam damage has previously been observed for isobaric studies
using a conventional XPS source (see Chapter 4) and reports in the literature of organic
molecules decomposing under irradiation.263
Formation of stable carbon deposits on the surface after n-butane exposures proves that
the film contains reactive centres. Evaluation of the carbonaceous species via fitting the
C 1s spectra results in at least three major components, as fitting using two asymmetrical
peaks of fixed asymmetry was not possible for all of the carbon spectra. The use of three
symmetric peaks is however an oversimplification of the system as the C 1s peak is
generally known to be asymmetric towards higher binding energies.235 Furthermore, the
broad FWHMs of the three components and their shifting positions with coverage imply
the presence of additional minor components. The assignment of such minor components
based from the data presented here is however ambiguous. In comparison with
literature,157 the three main different environments identified have been ascribed to chain-
like carbon (~240.0 eV), aliphatic polymers (~285.3 eV) and oxygenates (~288.5 eV).
The chain-like carbon has been described as short hydrocarbon molecules possibly
hydrogen deficient, such as butane and butene. Aliphatic polymers are proposed to be
formed via the oligomerisation of alkenes on the surface. Separating of the hydrocarbons
into saturated and unsaturated species from the presented XPS data is not possible as such
components are reported to differ by only 0.3 eV.235 The dehydrogenation of the
hydrocarbon species, as indicated by the development of an unsaturated species by
NEXAFS, is not responsible for the binding energy shifts to higher values with increasing
coverage as alkenes are reported to have lower binding energies than alkanes.235
Formation of oxygenated species have been reported to stabilise the catalytically active
carbenium ions.85,228 Various carbon-oxygen functional groups may be present as
predicted from the oxidation pathway of butane on oxide surfaces,264 including alkoxide
5. Interaction of n-Butane with Sulfated Zirconia Thin Films under Reaction Conditions
68
(285.5-286.6 eV),265-266267268269270271272 acetal and carbonyl (288.0-289.2 eV)246 species.
Additionally, graphitic-like "coke" precursors (284.4-284.6 eV)157,246 may also exist on
the surface. The presence of minor amounts of graphitic-like and alkoxide species could
be responsible for the shift of the assigned chain-like and aliphatic polymer species to
higher binding energies after exposure to 100 hPa n-butane. Alternatively, the shift of
these hydrocarbon species to higher binding energies may be caused by the formation of
multilayers, as the estimated thickness of the deposited carbon layer is of the order of an
n-butane monolayer as determined by isobaric UPS measurements in Chapter 4 and
literature values.234,240 Multilayer adsorption of butadiene has been reported to result in a
shift of the C 1s binding energy from 284.0 to ~285.0 eV, which is attributed to the
weaker interaction with the surface.273
From the greater attenuation of zirconium as compared with sulfur after the accumulation
of stable reaction deposits, as indicated by the lower calculated carbonaceous layer
thickness using the S 2p versus Zr 3d signals and the decrease in zirconium to sulfur ratio
after exposures, it can be inferred that the carbonaceous layer is not homogeneous and the
deposits are situated preferentially on top of the zirconia rather than the sulfur species.
The decreased relative intensity of the O 1s lower binding energy component from oxide
anions, in comparison the higher binding energy component from sulfate and hydroxyl
species, is consistent with this hypothesis. Such findings are also in agreement with the
reported interaction of n-butane with single crystalline films of sulfated zirconia.162
The appearance of plasmons from the Si 2s region may affect the quantification and
position of the S 2p for the activated sample, however such effects are considered
negligible for the as introduced sample because of the low level of silicon seen. Fitting of
the as introduced S 2p sub levels results in a binding energy separation (1.2 eV) which is
similar to reported literature values of 1.19,274 1.2275 and 1.3276 eV. After the consecutive
n-butane exposures reduction of the sulfate is observed. These reduced sulfur species are
observed in the same region as the silicon 2s plasmons were, however the plasmons are
judged not to interfere with the evaluation of the sulfur species due to the relative
reduction in the silicon signals with increasing carbon coverage and also the absence of
plasmons from the Si 2p region.
5. Interaction of n-Butane with Sulfated Zirconia Thin Films under Reaction Conditions
69
The detection of S4+ on sulfated zirconia after n-butane exposure is consistent with
previous XPS studies on powder sulfated zirconia.83 Components at lower binding
energies than S4+ can be ascribed to sulfur in lower oxidation states. The peak at 163.1
may be from S0 (elemental sulfur) or S2-, whereas the peak at 161.4 eV may be ascribed
unambiguously to S2-.154,277 The position of the sulfide peak at 161.4 eV is consistent with
the sulfide formed after argon sputtering of sulfated zirconia thin films,123 however the
broad HWFM of this peak in comparison to the other components indicates this may be a
combination of different species. To the author's knowledge the formation of sulfides on
the surface of sulfated zirconia after n-butane exposure has not previously been detected
in XPS studies, but hydrogen disulfide has been reported to evolve from sulfated zirconia
during n-butane isomerisation at 523 K as determined by gas chromatography mass
spectrometry72 and to be present on the surface of sulfated zirconia after exposure to n-
butane at 573 K as indicated by DRIFTS.244,278
It is known from the literature that various sulfur complexes are liable to beam
damage.279-280281282283 No evidence of beam effects (changes with irradiation time) were
observed for the sulfate species during these measurements. The influence of the beam on
additional sulfur species (with oxidation states < +6) formed after butane exposure was
however not investigated. Reduction of the sulfate after exposure to n-butane can
therefore be assumed to not be effected by irradiation, whereas subsequent beam induced
reactions of the reduced products cannot be excluded. It is thus possible to quantify the
overall reduced fraction of sulfate, but further time-dependent studies would be required
in order to verify that none of the sulfur species produced after n-butane exposure are
artefacts formed by the measurement technique.
Oxidation of the carbonaceous deposits as indicated by the development of a peak at
~288.5 eV is consistent with the reduction of the sulfate species. In the literature, sulfate
reduction is facilitated by the formation of water, as detected by IR spectroscopy.63,284
The formation of water on the sulfated zirconia thin films was not detected by XPS, as
indicated by the absence of an O 1s peak at ~533.1 eV.285 However, under the
measurement conditions used any water formed would be expected to desorb from the
surface. Water was not detected by MS during the measurements, although this may be
because of a lack of sensitivity.
5. Interaction of n-Butane with Sulfated Zirconia Thin Films under Reaction Conditions
70
Formation of an unsaturated species after n-butane exposures, as detected by NEXAFS,
proves the films have sites capable of dehydrogenation. The absence of any discrete C-
H* and σ* resonances, thus rendering them indistinguishable from the edge jump, is
believed to be caused by the presence of multiple species differing only slightly in nature.
However, the distinct π* resonance seen is believed to be either the butene intermediate
from the oxidative dehydrogenation initiation pathway or possibly a side product from
this initiation step.63,90 This unsaturated species may also be the allylic species reported to
be formed on sulfated zirconia powders, as determined by UV-vis spectroscopy.15,74,286
5.5 Conclusions
The development of carbonaceous surface deposits proves the films contain reactive
centres. The ability of the catalyst to dehydrogenate n-butane proves that an oxidative
dehydrogenation pathway is possible and thus is in good agreement with the formation of
an alkene being the initiation step of the isomerisation mechanism.63,90 This is further
confirmed by the concurrent reduction of sulfate. The detection of oxygenated carbon
species is consistent with a stabilised carbocation being the catalytically active site.
6. Design and Construction of a Thin Film Reactor
71
6. Design and Construction of a Thin Film Reactor
6.1 Introduction
6.1.1 Reactors for the catalytic testing of model thin films and supported particles
on flat substrates and single crystals
Catalytic model thin films and supported particles on flat substrates and single crystals
have surface areas in the order of square centimetres only, thus making the detection and
analysis of reaction products over them at high pressures (>10-2 hPa) and temperatures
very difficult. For model catalysts with high turnover frequencies (~1 s-1), catalytic
activities can be measured in batch reactors (volume ~ 500 cm3) and analysed via gas
chromatography. In the case of low turnovers, reactors with volumes of a few millilitres
can be used; however, "a robust design of a reactor with very low volume is still to be
accomplished".287
Campbell288 has reviewed the reactors available for the catalytic testing of well defined
surfaces and Gunter et al.287 have described some possible reactors for the testing of
model catalytic films and supported particles on flat substrates. Important parameters
discussed in the aforementioned reviews regarding the design features of such reactors
are summarised below.
When determining surface structure-reactivity relationships on well defined surfaces,
minimal exposure of the catalysts to undesired vapours during and between high pressure
kinetic testing and surface analysis is essential. Proven designs for such studies generally
consist of a high pressure cell attached to a vacuum chamber through a transfer arm or a
retractable reactor that encloses the sample.289 To minimise potential surface
contamination it is important that the sample is transferred to vacuum in as rapid and
clean way as is possible. The reactor (and transfer device) should therefore be constructed
from low-surface-area, non porous and bakeable materials. If, however, the sample can
be exposed to air prior to and after reaction then much simpler designs are possible; for
example, Kuipers et al.290 used a glass reactor suspended in an oven.
Normally only the sample is heated during reaction in order to prevent side reactions or
degassing of contaminants from the walls of the reactor. Metallic samples are generally
heated via resistive heating. For oxide catalysts resistive heating is not possible, unless
the oxide is deposited on a metal. If the oxide completely covers the metal resistive
6. Design and Construction of a Thin Film Reactor
72
heating with a low background can be achieved, such as in reference 291. For oxides
deposited on one side of a metal support the catalytic activity of the metal must be
negligible, as in reference 292. Oxide samples may also be heated directly via, for
example, an infrared spotlight.293 Alternatively, the entire reactor can be heated provided
all background reactions are insignificant.
A very important design consideration is the volume of the reactor. In order to determine
accurate kinetics the reactant(s) and product(s) must be well mixed and at observable
concentrations. Typical gas diffusivity at atmospheric pressure and room temperature is
in the order of 0.1 cm²/s, thus the average diffusion length during 100 s is only
approximately 3 cm. Due to convection currents the actual mixing in a batch reactor will
be considerably faster than this but it should not be expected that remote parts (further
than ~5 cm) from the sample are efficiently mixed during time periods of less than 100 s.
Therefore the reactor should be of a compact design, such as in reference 294, or include
a recirculation device, as in reference 295. To avoid potential contamination and wall
reactions the compact reactor design is favoured by several groups.288,294,296
As previously stated, model thin films and supported particles on flat substrates and
single crystals have very low surface areas (~1 cm²). Assuming a typical reaction rate of
10-2 molecules/site/s and that the whole surface is active (a gross overestimation for
model oxide catalysts), the overall amount of product formed in 100 s is very small:
Product = (10-2 molecules/site/s)(1015 sites/cm²)(1 cm²)(100 s) = 1015 molecules
If the reactor is at 100 kPa and has a volume of 1 litre this corresponds to only ~40 ppb
product. Given that GC detection limits are of the order of 0.1-1 ppm, constructing a
reactor with a small volume is thus very advantageous (if not necessary). However, a
compromise must be made between reducing the reactor volume and maintaining enough
volume to take aliquots for analysis. In some cases the reactor is operated in a continuous
flow mode297 but this suffers from the same disadvantages as a large-volume reactor.
Another factor that favours having a small volume reactor is possible impurity
contamination from reactant gases, at 100 kPa 0.1 ppm trace impurities are a potential
source of approximately one full monolayer coverage for every ⅓ litre reactor volume.
Aliquots of the reaction gas for analysis can be taken from the reactor manually by using
a syringe and septum port or automatically by a built-in valve system. More complex
6. Design and Construction of a Thin Film Reactor
73
methods, such as rapidly compressing the reactor aliquot into the GC sampling loop prior
to injection using a reservoir of carrier gas298 or using cold fingers to trap condensable
products, can be used to increase product detection sensitivity.
6.1.2 Aims
To validate the sulfated zirconia thin films as model catalysts their catalytic activity must
be measured and related to powder sulfated zirconia catalysts. To measure the catalytic
activity of the sulfated zirconia thin films, a custom reactor needs to the constructed,
which meets the following prerequisites:
• Low volume.
• Flow mode operational for activation, up to 573 K.64,65
• Batch mode operational for reaction, up to 505 kPa and 373 K.
• Testing of a single sulfated zirconia thin film.
• Sampling of reaction gases must be possible during reaction.
• GC analysis.
To produce a measurable conversion over the sulfated zirconia thin films in as short a
time as possible the reactor should have a small volume. Given the low conversion
expected, a batch reactor should be constructed to increase reactant-catalyst contact
times. Testing a single sulfated zirconia thin film will allow ex situ characterisation of the
measured film and hence activity-structure relationships to be investigated. Over
pressurising of the reactor will increase the reaction rate (as the reaction order is known
to be between 1.3-1.4 with respect to n-butane concentration)94 and allow multiple
samples of the reaction gas to be taken.
Estimations based on a sulfated zirconia thin film with a 1 cm² surface area, in a 10 ml
reactor filled to 25 kPa n-butane at 373 K, show the limit of detection (LOD) and limit of
quantification (LOQ) to be reached only after 2 and 6 hours batch operation, respectively.
Where the LOD is equivalent to three times, and the LOQ to ten times, the standard
deviation of the inherent (blank) isobutane impurity to n-butane ratio of the reactant gas,
as measured by automated GC injections. Calculations were performed assuming a
sulfated zirconia reactivity of 0.57 μmol/m²/h at 5 kPa n-butane286 and an n-butane
reaction order of 1.4.94
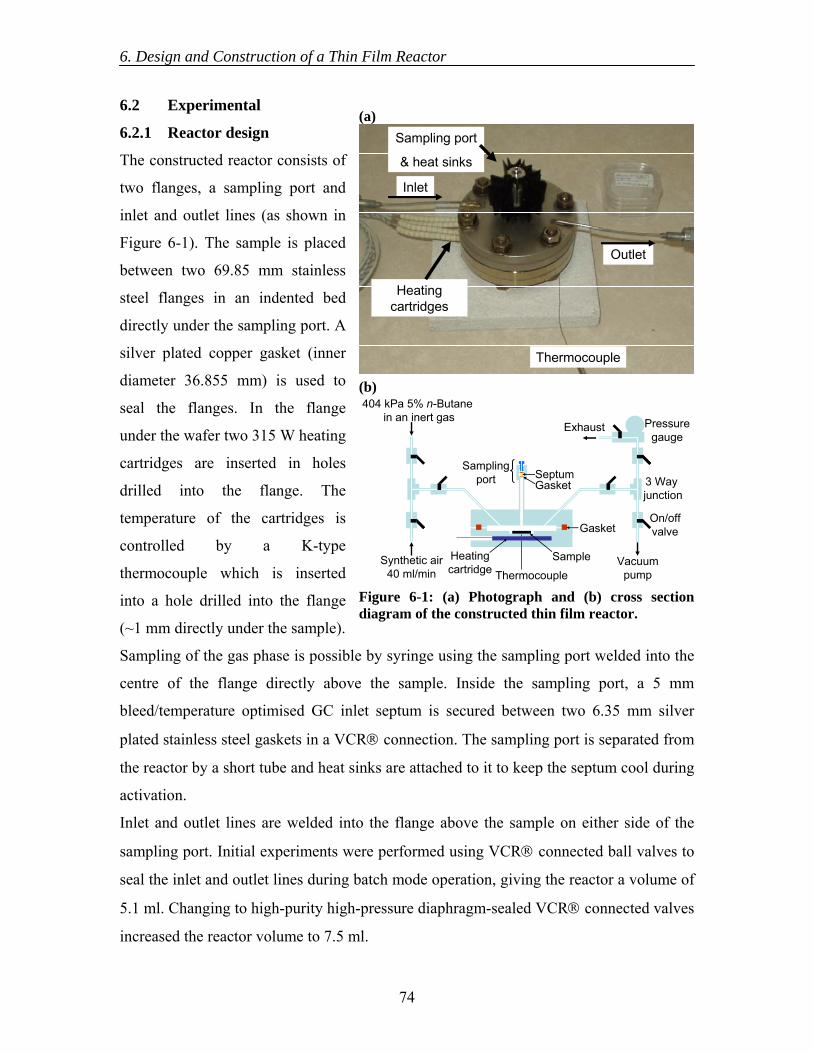
6. Design and Construction of a Thin Film Reactor
74
6.2 Experimental
6.2.1 Reactor design
The constructed reactor consists of
two flanges, a sampling port and
inlet and outlet lines (as shown in
Figure 6-1). The sample is placed
between two 69.85 mm stainless
steel flanges in an indented bed
directly under the sampling port. A
silver plated copper gasket (inner
diameter 36.855 mm) is used to
seal the flanges. In the flange
under the wafer two 315 W heating
cartridges are inserted in holes
drilled into the flange. The
temperature of the cartridges is
controlled by a K-type
thermocouple which is inserted
into a hole drilled into the flange
(~1 mm directly under the sample).
Sampling of the gas phase is possible by syringe using the sampling port welded into the
centre of the flange directly above the sample. Inside the sampling port, a 5 mm
bleed/temperature optimised GC inlet septum is secured between two 6.35 mm silver
plated stainless steel gaskets in a VCR® connection. The sampling port is separated from
the reactor by a short tube and heat sinks are attached to it to keep the septum cool during
activation.
Inlet and outlet lines are welded into the flange above the sample on either side of the
sampling port. Initial experiments were performed using VCR® connected ball valves to
seal the inlet and outlet lines during batch mode operation, giving the reactor a volume of
5.1 ml. Changing to high-purity high-pressure diaphragm-sealed VCR® connected valves
increased the reactor volume to 7.5 ml.
(a) Sampling port
& heat sinks
Thermocouple
Inlet
Outlet
Heating cartridges
(b)
Samplingport 3 Way
junction
On/offvalve
Pressuregauge
Vacuum pump
Exhaust
Thermocouple
404 kPa 5% n-Butane in an inert gas
Synthetic air40 ml/min
Gasket
GasketSeptum
SampleHeating cartridge
Figure 6-1: (a) Photograph and (b) cross section diagram of the constructed thin film reactor.
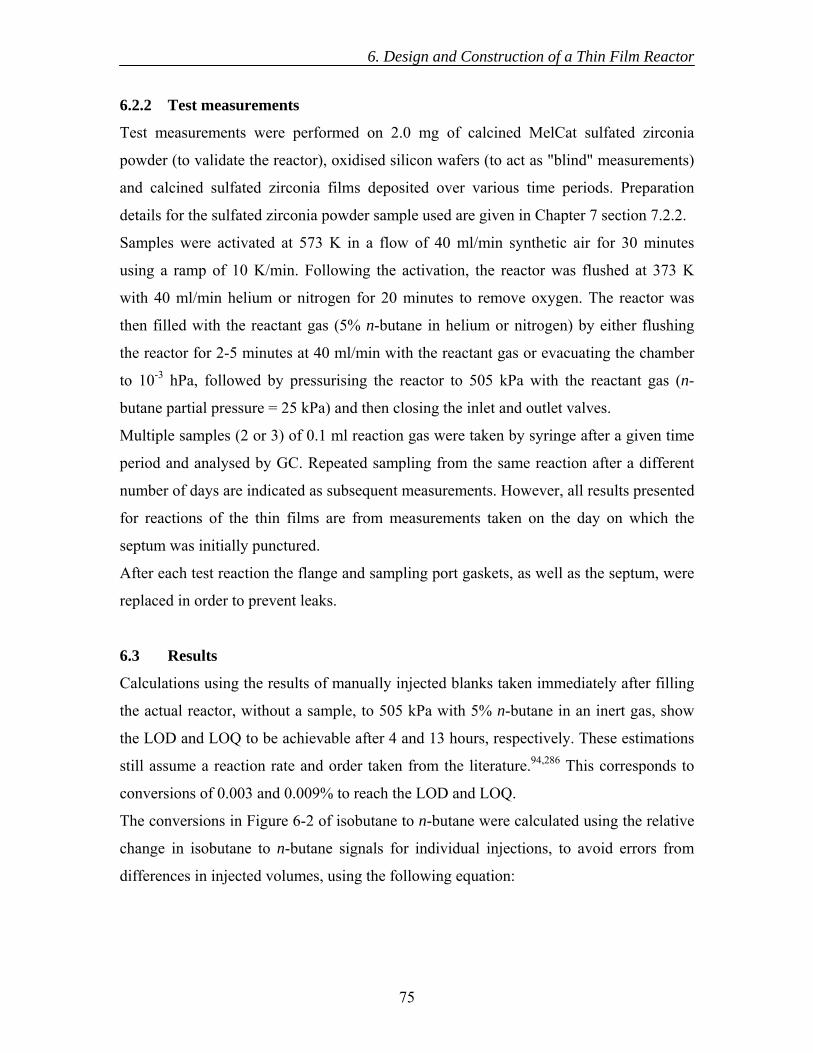
6. Design and Construction of a Thin Film Reactor
75
6.2.2 Test measurements
Test measurements were performed on 2.0 mg of calcined MelCat sulfated zirconia
powder (to validate the reactor), oxidised silicon wafers (to act as "blind" measurements)
and calcined sulfated zirconia films deposited over various time periods. Preparation
details for the sulfated zirconia powder sample used are given in Chapter 7 section 7.2.2.
Samples were activated at 573 K in a flow of 40 ml/min synthetic air for 30 minutes
using a ramp of 10 K/min. Following the activation, the reactor was flushed at 373 K
with 40 ml/min helium or nitrogen for 20 minutes to remove oxygen. The reactor was
then filled with the reactant gas (5% n-butane in helium or nitrogen) by either flushing
the reactor for 2-5 minutes at 40 ml/min with the reactant gas or evacuating the chamber
to 10-3 hPa, followed by pressurising the reactor to 505 kPa with the reactant gas (n-
butane partial pressure = 25 kPa) and then closing the inlet and outlet valves.
Multiple samples (2 or 3) of 0.1 ml reaction gas were taken by syringe after a given time
period and analysed by GC. Repeated sampling from the same reaction after a different
number of days are indicated as subsequent measurements. However, all results presented
for reactions of the thin films are from measurements taken on the day on which the
septum was initially punctured.
After each test reaction the flange and sampling port gaskets, as well as the septum, were
replaced in order to prevent leaks.
6.3 Results
Calculations using the results of manually injected blanks taken immediately after filling
the actual reactor, without a sample, to 505 kPa with 5% n-butane in an inert gas, show
the LOD and LOQ to be achievable after 4 and 13 hours, respectively. These estimations
still assume a reaction rate and order taken from the literature.94,286 This corresponds to
conversions of 0.003 and 0.009% to reach the LOD and LOQ.
The conversions in Figure 6-2 of isobutane to n-butane were calculated using the relative
change in isobutane to n-butane signals for individual injections, to avoid errors from
differences in injected volumes, using the following equation:
6. Design and Construction of a Thin Film Reactor
76
blanksample sample
blank
blanksample sample sample
blank
[iBu ][iBu ] - Bu ][ Bu ]
Conversion 100 [iBu ][iBu ] - Bu ] + [ Bu ][ Bu ]
nn
n nn
⎛ ⎞ × [⎜ ⎟
⎝ ⎠= × ⎛ ⎞
× [⎜ ⎟⎝ ⎠
Where [iBusample] and [nBusample] are the concentrations of isobutane and n-butane
detected after a set reaction time, respectively. [iBublank] and [nBublank] correspond to the
original isobutane impurity and n-butane concentrations.
Figure 6-2 shows that the
conversion of n-butane to
isobutane increases with reaction
time over the oxidised silicon
wafers, the powder sulfated
zirconia and the sulfated zirconia
thin films. The sulfated zirconia
powder produces a significantly
higher conversion than the
oxidised silicon wafers or sulfated
zirconia thin films. Differences
between the oxidised silicon wafers and the sulfated zirconia thin films are within the
errors of the measurements and there does not appear to be a trend. Converting the
conversions of the sulfated zirconia powder into rates results in values of 1.16 μmol/g/m²
after 112 hours and 0.73 μmol/g/m² after 285 hours. The calculation of such rates
assumes that the total concentration of butane (isobutane and n-butane) after the
measurement time is equal to the concentration at the start of the reaction as no side
products (with carbon chain lengths of 2-6) were detected in significant amounts.
In Table 6-1 the change in n-butane concentration, calculated from the GC signal area
relative to the initial blank measurement, is given for the reactions performed. There is a
clear decrease of n-butane concentration with reaction time, which is greater than the
possible error arising from performing manual injections and the loss from conversion to
isobutane or side reactions. Helium leak testing of the reactor septum port, inlet and
outlet lines was unable to detect any leaks above 10-9 hPa/l/s. Measuring the reactor
0.00
0.01
0.02
0.03
0.04
0.05
0.06
0.07
0.08
0.09
0 100 200 300 400 500 600Time / h
Con
vers
ion
/ %
Oxidised Si wafer2 mg SZ powder22 h deposited SZ film48 h deposited SZ film72 h deposited SZ film
2
2
Figure 6-2: Percentage conversion of n-butane to isobutane in a batch reactor at 373 K, filled to 400 kPa with 5% n-butane in an inert atmosphere. Pointswith a 2 inset are subsequent measurements.
6. Design and Construction of a Thin Film Reactor
77
pressure via an attached pressure gauge (reactor and pressure gauge combined volume =
29.5 ml) showed, after activation and pressurising the reactor to 430 kPa at 373 K for 10
days, the pressure to decrease by approximately 100 kPa. If the decrease in n-butane
signal is taken into account, the conversions detected over the powder sulfated zirconia
correspond to rates of only 0.42 μmol/g/m² after 112 hours (at 9 kPa n-butane) and
0.10 μmol/g/m² after 285 hours (at 3.5 kPa n-butane).
6.4 Discussion
A prototype reactor (not shown here) was constructed by adapting an in-house flow
reactor designed to measure the conversion of ethylbenzene to styrene over well defined
epitaxial iron-oxide layers.212 This reactor consisted of a resistively heated stainless steel
cup placed above the sample and was sealed using a gold gasket and a single central
screw. The septum was housed in a simple screw cap port with a hole drilled in the
middle. A number of flaws were found with such a design. The septa used were found to
disintegrate at temperatures above 473 K and leak. These problems were solved by
elongating the sampling port and adding heat sinks (to keep the septa below 373 K during
activation) and changing the sampling port to a VCR® connection inside which the
septum is placed between two stainless steel gaskets. The gold seal was also found to leak
over extended time periods (hours). Therefore, the gasket, reactor housing and heating
source were changed to those described in the experimental section of this chapter. The
redesigned reactor (presented in this chapter) was initially found to be stable to
pressurisation over several weeks.
The rate of isomerisation over the sulfated zirconia powder appears to decrease with
reaction time. Calculated isomerisation rates of the sulfated zirconia powder are lower
than expected, as compared with steady state rates from flow reactor measurements
presented in Chapter 7 section 7.3.2 and published results,286 taking into account the n-
Table 6-1: Percentage decrease in n-butane concentration over the testing period. (2) Indicates subsequent measurements.
After: % Decrease in n-butane concentration 5 days 12 days 20 days Oxidised Si wafers 48 80(2) 92 SZ powder 64 86(2) - SZ thin films 64 - 86
6. Design and Construction of a Thin Film Reactor
78
butane reaction order.94 At the low conversions measured, the reaction profile would be
expected to increase linearly with time. The low activity of the powder and decrease in
reaction rate with time are probably due to both the decrease in partial pressure of n-
butane from the leak and deactivation of the catalyst (which may be enhanced by back
diffusion of oxygen through the leak).
The cause of the "blind" oxidised silicon wafer tests showing a conversion is unclear. It is
apparent from the decrease in the n-butane concentration and pressure measurements of
the reactor (after undergoing the activation program) that the reactor has developed a
leak. Attempts to locate and prevent the leak by replacing the inlet and outlet valves,
tightening the flange gasket while flushing the reactor with an inert gas (between
activation and reaction) and inserting aluminium foil between the septum and inside
gasket in the sampling port were all unsuccessful. The source of the leak is probably the
flange gasket, as it will undergo thermal expansion during activation then contraction
when the temperature is lower for reaction. In addition, it is not designed to be over
pressurised. However, as both product and reactant should leak from the reactor, a leak
should not lead to a positive conversion for a "blind" experiment. If the blind conversion
is from contamination (for example from the powder experiment) then its activity should
also decrease with increasing reaction time, however the conversion appears to increase
linearly with reaction time. Thus the "blind" conversion is believed to be due to either an
inherent reactor flaw or the oxidised silicon wafer being active. If the "blind" activity is
caused by an inherent reactor flaw then it would have to be deducted from the sulfated
zirconia powder conversion, thus the rate detected over the powder would be even lower.
Given that the sulfated zirconia thin films have a total surface area ~300 times smaller
than the powdered material measured and hence their conversions would be expected to
differ by the same order of magnitude, such conversions would be impossible to detect
with the constructed setup. The lower than expected powder activity, "blind" silicon
oxide activity, detected leak and high deviation of the manual injections together mean
that the constructed reactor was not able to measure the catalytic activity of the sulfated
zirconia thin films.
In order to measure the catalytic activity of the films a completely new reactor would
have to be designed and constructed. Such a reactor would need to have no leaks and
6. Design and Construction of a Thin Film Reactor
79
improved detection and quantification limits. To ensure the reactor does not leak the seal
would have to be isolated from the heating source. This could possibly be achieved by
using a localised heating source directly under the sample, for example by inserting a
button heater inside the reactor although the reactor volume would probably have to be
increased. Alternatively, the reactor could be welded shut and the sample cut out after
each reaction, the reactor volume would therefore change slightly for each measurement.
The septa could also be isolated from the reactor via a valve which would only be opened
when a sample is being taken. However, the large error bars from taking manual
injections would need to be reduced in order to detect the very low conversion expected
from the sulfated zirconia thin films. Replacing the sampling port with a GC sampling
valve would enable direct automated injections of the reactant gas onto the GC and allow
the sampled gas to be replaced with reactant gas thus keeping the overall pressure of the
system constant. The implementation of such changes is not a simple task and therefore
was not possible during the time restrictions of this thesis.
Sulfated zirconia has been reported to have a turnover frequency of 10-4 s-1 and site
density of 5x10⁻⁶ mol/g (≈3x10¹² sites/cm²),228,299 as compared to typical well defined
model catalysts which have turnovers of the order of 10-2 s-1 and site densities of up to
1015 sites/cm².288 Thus the difficulties encountered in measuring the activity of the
sulfated zirconia thin films are attributed not only to trying to measure a conversion over
such a small amount of material but also the extremely low intrinsic activity of sulfated
zirconia. Despite the orders of magnitude difference in yields expected over the sulfated
thin films, as compared to previously measured model systems, further opportunities to
improve the reactor design were highlighted within this chapter, which may prove
successful in the future.
6.5 Conclusions
A batch reactor to measure the conversion of n-butane to isobutane over the sulfated
zirconia thin films was designed and constructed. Measurements with a small amount of
sulfated zirconia powder showed the conversion of n-butane to isobutane albeit with rates
lower than expected. Catalytic measurements of the sulfated zirconia thin films, however,
failed because of technical problems with the constructed reactor and the low intrinsic
6. Design and Construction of a Thin Film Reactor
80
activity of the material. The reactor was shown to leak and have a "blind" reactivity as
measured over an oxidised silicon wafer; in addition high error bars were observed.
Therefore, in order to realise the measuring of the catalytic activity of the films, it would
be necessary to design and construct a new reactor. Proposed suggestions for a new
reactor include isolating the sealing from the heating source or welding the reactor to
avoid leaks and building a GC sampling valve into the reactor, to improve detection and
quantification limits.
7. Rational Design of Powder Sulfated Zirconia Catalysts
81
7. Rational Design of Powder Sulfated Zirconia Catalysts
7.1 Introduction
7.1.1 Disulfated zirconia
The presence of a disulfate (pyrosulfate, S2O72-)56 species on zirconia was initially
proposed by Bensitel et al.47 after they observed an IR band at 1403 cm-1at high sulfate
coverages, which disappeared on exposure to water. Morterra et al.,48,300,301 also, assigned
the formation of an IR band at ~1406 cm-1, seen at sulfate coverages over half a
monolayer, to polynuclear sulfates, probably disulfates. Experiments indicated these
disulfates to be located on the regular patches of low index crystal planes (top
terminations of the scale-like particles) of zirconia. Increasing the sulfate loading (thus
favouring the presence of disulfate species) was shown to increase the number of
Brønsted acid sites, while lowering the number of Lewis acid sites but enhancing their
strength. These acidic sites were found to be liable to hydrolysis.
Escalona Platero et al.302 also ascribed an IR band at 1398 cm-1, from sulfated zirconia
produced by the thermolysis of zirconium sulfate, to disulfate species. They found the
disulfate groups disappeared at coverages below about 10% of a monolayer. High
temperature treatment was shown to remove the disulfate groups, trace amounts of
molecular water and strong Brønsted acid sites.
Xia et al.303 compared sulfated zirconia materials prepared using either ammonium
peroxydisulfate (persulfate, S2O82-)56 or sulfuric acid. The peroxydisulfated material was
shown to be more active for the isomerisation of n-butane at 308 K, which the authors
claim is due to it having more "superacid" sites rather than having stronger sites.
However, IR bands for the sulfuric acid prepared material are reported to show a strong
absorption band in the 1380-1390 cm-1 region, whereas the peroxydisulfated material
showed a band at 1398 cm-1, which the authors postulated are due to disulfate species, in
agreement with references 47 and 48.
Marus et al.304 also prepared sulfated zirconia catalysts using either ammonium
peroxydisulfate or sulfuric acid. In contrast to the study by Xia et al.,303 the maximum n-
butane isomerisation activity of the peroxydisulfated catalysts was found to be lower than
that of the sulfuric acid prepared catalysts. However, the authors showed for catalysts
prepared from both sulfating agents the amount of carbon required to completely
7. Rational Design of Powder Sulfated Zirconia Catalysts
82
deactivate them was equivalent to one carbon atom per two active sulfate atoms, using a
TGA/FTIR technique. Thus despite the lower activity of the peroxydisulfated catalysts
the authors still suggest the active sites to be composed of two sulfate atoms, such as
disulfate. They propose the active sites may be formed from either two vicinal sulfate
groups or two pregrouped sulfur atoms on certain zirconia sites.
Density-functional theory (DFT) and statistical thermodynamics calculations were used
by Hofmann and Sauer62 to investigate the adsorption of H2O and H2SO4 (or SO3) on
tetragonal zirconia (101). The authors showed that monosulfates and disulfates may occur
on the surface of zirconia, but no higher condensated sulfates were observed. Simulated
surface phase diagrams depend strongly on temperature and H2O and H2SO4 (or SO3)
partial pressures. The calculations indicated that vibrational bands in the region of 1420-
1400 cm-1 are from disulfate species and those at 1400 cm-1 are from adsorbed SO3
species. They thus predicted, in agreement with experimental IR literature,302,57 the
transformation of water rich sulfate structures into disulfates during calcination (at 873
K), which at higher temperatures (1073 K) undergo transformation to adsorbed SO3.
Li et al.63 proposed the disulfate (or SO3) species, seen by IR at 1404 cm-1, to be liable in
the presence of n-butane to an initiation reaction that creates the catalytic active centres
on sulfated zirconia. This is said to occur via the stoichiometric oxidative
dehydrogenation of butane by disulfate or SO3 groups to produce butene (present mostly
as alkoxide groups), water and SO2. They report the detection of all three oxidative
dehydrogenation reaction products by thermal desorption and in situ IR spectroscopy.
The butene surface concentration is stated to determine both the catalytic activity and
deactivation (via formation of oligomers) of sulfated zirconia. They also showed the IR
band at 1404 cm-1 shifted to lower wavenumbers (1398 cm-1, with a shoulder at 1378 cm-1)
with time on stream (consistent with the reduction of disulfate or SO3) and, by DFT,
favourable reaction energies for the oxidation of butane to butene particularly over sulfate
loadings of two S atoms per (1 x 2) surface cell.
Further work by Li et al.26 showed that washing sulfated zirconia samples with water
decreased their catalytic activity and shifted the maximum of the band seen at 1404 cm-1
to lower wavenumbers (~1391 cm-1). It is thus proposed that the catalytic activity of the
materials is proportional to their concentration of labile chemisorbed SO3, most likely in
7. Rational Design of Powder Sulfated Zirconia Catalysts
83
the form of disulfate. Klose et al.284 assigned all IR bands seen between 4000-1000 cm-1
on sulfated zirconia, based on reference 62, concluding that disulfate groups are the main
sulfur species. Several other groups have reported the possible presence of disulfate
species194,305,306 on sulfated zirconia.
7.1.2 Preparation of sulfated zirconia from precursors containing two sulfur atoms
Afanasiev et al.307 synthesised sulfated zirconia from zirconium oxychloride, potassium
disulfate and a KNO3-NaNO3 eutectic in a molten nitrate bath. The reaction mixture was
pretreated in nitrogen at 423 K followed by heating to 773 K for 2 hours. However, no
disulfate IR bands, near 1400 cm-1, were detected in the synthesised material.
Xia et al.303 prepared peroxydisulfated and sulfated zirconias using ammonium
peroxydisulfate and sulfuric acid sulfating agents. Zirconium hydroxide was immersed in
0.5 mol/l of the sulfate precursors for 30 minutes; followed by filtration, drying overnight
at 383 K and calcination at 923 K. The peroxydisulfated material was found to have a
lower surface area (58.2 versus 113.0 m²/g) and sulfur content (1.99 versus 3.3 wt.%
SO3) compared to the sulfated material. The lower surface area is reported to be probably
caused by immersing the amorphous zirconia in an aqueous ammonium salt solution. For
the isomerisation of n-butane at 308 K, higher conversions were detected over the
peroxydisulfated material (45.4 versus 37.1% after 20 hours). The reaction was, also,
performed at 523 K, resulting in the peroxydisulfated material initially having the lower
activity of the two materials (25.6 versus 27.3%, after 2 minutes) but to be more stable
with respect to time on stream (20.4 versus 17.5%, after 360 minutes). After 6 hours the
coke content of the peroxydisulfated material was found to be lower (1.14 versus 1.25
wt.%), thus explaining the deactivation of the sulfuric acid prepared material.
Marcus et al.,304 also, prepared peroxydisulfated and sulfated zirconia catalysts from
ammonium peroxydisulfate and sulfuric acid. Zirconia was immersed in various
normalities of either ammonium peroxydisulfate (0.3-0.6 N) or sulfuric acid (0.2-0.6 N)
for 15 minutes. The resulting product was decanted, dried overnight at 383 K, then
calcined at 873 K in oxygen for 1 hour. The materials were tested for the isomerisation of
n-butane at 473 K and their activities are given as a conversion after 15 minutes on
stream, as it is reported they all have equivalent deactivation constants. Of the
peroxydisulfate materials the 0.4 N prepared was shown to have the maximum
7. Rational Design of Powder Sulfated Zirconia Catalysts
84
conversion (13.6%), whereas for the sulfated materials the 0.5 N prepared was shown to
have the maximum conversion (18.77%). The sulfur contents and surface areas of the
most active samples from the different precursors were found to be very similar (3.32
versus 3.43% and 160 versus 149 m²/g, for the peroxydisulfated and sulfated materials,
respectively).
Dias et al.308 prepared peroxydisulfated and sulfated zirconia catalysts with and without
an MCM-41 support using ammonium peroxydisulfate and ammonium sulfate. The
"conventional" materials were prepared by immersing the zirconia precursor in 0.5 M
solutions of the sulfating agents for 30 minutes, followed by filtration, drying at 383 K
for 24 hours, then calcination at 923 K for 3 hours in air. Whereas, the supported
materials were prepared by first impregnating MCM-41 with aqueous ZrOCl2.8H2O, via
incipient wetness. Sulfation was also performed via incipient wetness, followed by drying
(at 393 K for 1 hour or 383 K for 24 hours) then calcination at 823 K for 3 hours in air.
The conventional peroxydisulfated and sulfated materials had similar surface areas (85
versus 90 m²/g) and sulfur contents (0.33 versus 0.37 mmol/g). Whereas, the supported
peroxydisulfated material had a lower surface area (382 versus 426 m²/g) but higher
sulfur content (1.2 versus 0.9 mmol/g) than the supported sulfated material. Catalytic
testing of the materials for the conversion of xylose to furfural showed the conventional
materials to have similar activities (rates of 7.4 versus 7.7 mmol/g/h after 30 minutes and
conversions of 80 versus 86% after 4 hours, for the peroxydisulfated and sulfated
materials were measured, respectively). The supported peroxydisulfated material was
shown to be initially more active (14.1 versus 8.9 mmol/g/h after 30 minutes), but similar
high conversions (95 and 94%) were detected after 4 hours.
Lavrenov et al.309 reported that the type of sulfating agent is believed to be of no
importance. They state that similar results were obtained using sulfuric acid, ammonium
sulfate, ammonium peroxydisulfate or gaseous mixtures of either sulfur dioxide or
hydrogen disulfide and oxygen. Results are only given for materials prepared from
ammonium sulfate though, as it is "the least reactive and neutral reagent" and hence
allows greater control over the sulfation procedure and improves reproducibility.
Mishra et al.68,179,310 sulfated dried zirconium hydroxide with ammonium peroxydisulfate
via the wetness impregnation technique. Calcination of the material was performed at 873
7. Rational Design of Powder Sulfated Zirconia Catalysts
85
K for 3 h. The resulting material was found to be active for the isomerisation of n-butane
at temperatures as low as 308 K under atmospheric pressure.
7.1.3 Motivation
It has been proposed that disulfate groups form the catalytically active sites on sulfated
zirconia.63 Thus it is envisioned the sulfation of zirconia using sulfating agents containing
two sulfur atoms would enhance the formation of these disulfate groups and, thus, also
the activity of the material produced. Various groups have prepared sulfated zirconia
from sulfating agents containing one and two sulfur atoms with varying results, with
regards to whether or not using two pregrouped sulfur atoms enhances activity.303,304,308 A
comprehensive study is thus proposed to investigate the effect of using sulfating agents
with two pregrouped sulfur atoms. The aim of this study is thus to prepare sulfated
zirconia from both sulfating agents with two pregrouped sulfur atoms {ammonium
peroxydisulfate and ammonium thiosulfate (S2O32-)} and an equivalent mono-sulfur
reagent (ammonium sulfate), over a range of sulfate loadings (2, 4.5 and 9 wt.% SO3),
using different sulfate impregnation techniques (incipient wetness and immersion
followed by either filtration or evaporation). The effect of the aforementioned sulfation
parameters on both the activity of the produced materials for the isomerisation of n-
butane to isobutane and the formation of an IR band at ~1400 cm-1 will be investigated.
7.2 Experimental
7.2.1 Synthesis of powder sulfated zirconias
Zirconium hydroxide (MEL chemicals, XZO 632/03, batch 95/256/01) was dried at 383
K for 21 hours prior to sulfation. Dried 13 g zirconium hydroxide batches were sulfated
using ammonium peroxydisulfate, ammonium thiosulfate or ammonium sulfate, via three
different impregnation techniques (numbered below). Sulfate loadings, given as weight
(wt.) % SO3, were calculated based on the weight of the dried zirconium hydroxide.
Doubly distilled water has been used for all syntheses. All sulfate solutions were prepared
immediately prior to their use.
(1) Impregnation via incipient wetness was performed to produce 2, 4.5 and 9 wt.% SO3
sulfated zirconia. The dried zirconium hydroxide batches were ground while drop wise
adding the relevant sulfating agent dissolved in 5.2 ml of water over 20 minutes. The
7. Rational Design of Powder Sulfated Zirconia Catalysts
86
samples were then dried in a desiccator for at least 24 hours prior to calcination. Samples
produced in this way are referred to as incipient wetness prepared.
(2) Zirconium hydroxide batches were immersed in 195 ml aqueous solutions containing
0.1 and 0.22 M of ammonium peroxydisulfate for 15 minutes to produce 2 and 4.5 wt.%
SO3 loadings respectively (molarities were derived by linearly extrapolating results from
reference 304). Batches were also immersed in ammonium sulfate and ammonium
thiosulfate aqueous solutions with equivalent sulfur concentrations to those used for
ammonium peroxydisulfate. The solid material was then vacuum filtered, dried at 383 K
for 21 h and stored in a desiccator prior to calcination. The resulting samples are referred
to as immersion prepared.
(3) Samples loaded with 2 and 4.5 wt.% SO3 were prepared by immersing zirconium
hydroxide batches in the various sulfating agents dissolved in 50 ml of water followed by
rotary evaporation of excess water. The samples were then dried at 383 K for 21 h and
stored in a desiccator prior to calcination. Samples produced in this way are referred to as
evaporation prepared.
The samples produced from the ammonium peroxydisulfate, ammonium thiosulfate or
ammonium sulfate are hereafter denoted xPSZy, xTSZy or xSZy, respectively; where x
corresponds to the SO3 wt.% loading and y indicates the impregnation technique (iw =
incipient wetness, im = immersion and ev = evaporation prepared).
7.2.2 Calcination of sulfated zirconia powders
Calcination of the synthesised materials was performed in a 8.4 ml quartz boat, as
described in reference 311. The boat is designed so that a thermocouple is located in the
middle of the bed. The samples were heated to 823 K for 3 hours, using a temperature
ramp and maximum cooling rate of 3 K/min. The oven temperature was recorded by a
thermocouple placed between the calcination tube and oven wall. In all experiments a
flow of 200 ml/min synthetic air was used, except for sample 4.5PSZim which was
performed in static air. For comparison, the zirconium hydroxide used and a commercial
sulfated zirconia precursor material (MEL Chemicals, XZO 682/01, batch 92/184/01, 5-6
wt.% SO3) were, also, calcined, after being dried at 383 K for 21 hours. Hereafter, the
commercial sulfated zirconia and zirconium hydroxide materials are denoted SZcom and
Zcom, respectively.
7. Rational Design of Powder Sulfated Zirconia Catalysts
87
7.2.3 Catalytic testing
Most of the calcined materials were tested for the isomerisation of n-butane to isobutane
in a plug flow reactor. Reactions were performed using 1 g of material, apart from SZcom
for which 500 mg was used. The catalysts were activated at 573 K for 30 minutes in
48 ml/min of synthetic air, followed by flushing at 373 K for 20 minutes in 48 ml/min of
helium. The temperature was ramped at 15 K/min. Isomerisation was performed at 383 K
with a feed of 80 ml/min 5 vol.% (or 1 vol.% for SZcom) n-butane in helium. Online
analysis was performed using a Micro-GC (Varian, 4900) with a CP-Sil 5 CB column
and thermal conductivity detector.
7.2.4 TG-DSC-MS
Thermogravimetry (TG) and differential scanning calorimetry (DSC) simultaneous
analyses were performed on selected samples using a STA 499 C instrument (Netzsch)
with online MS (Pfeiffer, QMS 200). Samples 4.5PSiw and 9PSiw (both not calcined) were
heated to 1373 K at 3 K/min in 21% oxygen in helium. Selected calcined materials (see
Table 7-2) were heated in argon to 1373 K, held at this temperature for 30 minutes then
cooled to 473 K, using heating and cooling rates of 10 K/min.
7.2.5 BET surface area
Surface areas of selected calcined samples (see Table 7-2) were measured by nitrogen
adsorption according to the method of Brunauer, Emmett and Teller (BET). The samples
were outgassed, prior to measurements, in vacuo at 523 K for 3 hours. The BET surface
areas were calculated from multipoint analyses, additionally the pore size distributions
were determined according to the Barrett, Joyner and Halenda (BJH) method.
7.2.6 XRD
X-ray diffractograms of calcined samples 2PSZiw, 4.5PSZiw and 9SZiw were recorded
using a Bruker AXS D8 advance diffractometer in reflection (Bragg-Brentano) geometry
with Cu Kα radiation, a secondary graphite monochromator and scintillation detector.
Fittings of the diffractograms were performed using the Topas v.3.0 program. Monoclinic
and tetragonal zirconia fractions were derived directly from Rietveld fits of ICSD
156entries 89426 and 97004, respectively. The fraction of XRD amorphous phase was
estimated by fitting a model consisting of 7 broad Gaussian peaks. The model was
derived from the XRD pattern of a commercial sulfate doped zirconium hydroxide
7. Rational Design of Powder Sulfated Zirconia Catalysts
88
sample (MEL Chemicals, XZO 1249/01, produced 15.5.06, ~7 wt.% SO3), after being
dried for 21 hours at 383 K. Relative intensities and peak positions of the model were
fixed but peak widths and total intensity were varied for the fitting of mixed precursor
and crystalline samples.
7.2.7 XPS
X-ray photoelectron spectra of calcined samples 4.5TSZim and 4.5SZim were taken with a
Leybold LHS 12 MCD instrument248 using Mg Kα excitation. Detailed scans of the
Zr 3d, O 1s, S 2p and N 1s regions were recorded for each sample, the C 1s region was
also recorded for 4.5TSZiw. Binding energies were corrected to Zr 3d5/2 = 182.2 eV of
ZrO2,154 to account for electrostatic charging. Shirley backgrounds were subtracted from
the Zr 3d and O 1s peaks and linear backgrounds were used for the S 2p and C 1s peaks.
7.2.8 DRIFTS
Diffuse reflectance infra-red Fourier transform spectroscopy (DRIFTS) was performed
using a Bruker IFS 66 FTIR spectrometer (1-2 cm-1 resolution) equipped with an in situ
cell (Graseby Specac, Environmental Chamber) with a chemically resistant ZnSe
window, a diffuse-reflectance attachment (Graseby Specac, "The Selector") and a
D315M MCT detector. The samples were placed in a gold cup, which is situated on a
heatable platform. Selected calcined materials were activated in situ at 573 K for 30
minutes in 48 ml/min of 20.5% oxygen in nitrogen, followed by cooling to 373 K, the
temperature was ramped up and down at 15 K/min. The cell was then flushed at 373 K
with 48 ml/min nitrogen for at least 20 minutes prior to measuring under the same
conditions. Spectra were background corrected using a KBr reference measured in
nitrogen.
Positions of overlapping bands, appearing as shoulders, have been determined using the
second derivative.312 For quantitative relevant band intensities the spectra were converted
using the Kubelka-Munk (KM) function, after normalising the reflectance spectra at 4800
cm-1 to 0.9 (to account for any differences in bed height).
7. Rational Design of Powder Sulfated Zirconia Catalysts
89
7.3 Results
7.3.1 Calcination of catalysts
Comparative measurements of bed and oven temperatures during calcinations of
materials loaded with 4.5 wt.% SO3 are presented in Figure 7-1. For all samples the bed
temperature was shown to lag behind the oven temperature between 423 and 573 K (oven
temperature), indicating an endothermic process is occurring. This is due to the removal
of water. At higher temperatures, between ca. 703 to 798 K, for the 2 and 4.5 wt.% SO3
samples an exothermic process occurs causing the bed temperature to increase by up to
100 K above the oven temperature. This rapid overheating of the sample is seen at higher
temperatures for the 4.5 wt.% SO3 loaded materials (as compared to 2 wt.% SO3 loaded
materials prepared using the same technique and sulfating agent), but is not observed for
the 9 wt.% SO3 loaded materials. For each of the different sulfation techniques used
trends are observed for the 2 and 4.5 wt.% SO3 loaded materials with regards to the oven
temperature at which the maximum bed overshoot temperature is reached. However, the
trends differ for the different sulfation techniques, for incipient wetness: PSZiw > SZiw >
TSZiw, for immersion: TSZim > SZim > PSZim and for evaporation TSZev > PSZev > SZev.
There do not appear to be any trends in the maximum bed overshoot temperature.
7.3.2 Catalytic testing
Maximum n-butane isomerisation activities and after 12 hours are given for tested
materials in Table 7-1 and selected reaction profiles are shown in Figure 7-2. None of the
2 wt.% SO3 loaded materials were found to be catalytically active. For each of the
sulfating techniques used the 4.5SZ loaded materials were found to be the most active.
The 4.5PSZ materials, prepared by a given sulfation technique, were generally found to
be more active than the 4.5TSZ materials, apart from the inactive 4.5PSZim sample which
was calcined in static air. For the 4.5SZ materials the immersion technique produced the
most active material and the evaporation technique the least active. The immersion
technique, also, produced the most active 4.5TSZ material; however, the incipient
wetness technique produced the least active. For the 4.5PSZ materials the incipient
wetness prepared sample was found to be more active then the material prepared by
evaporation.
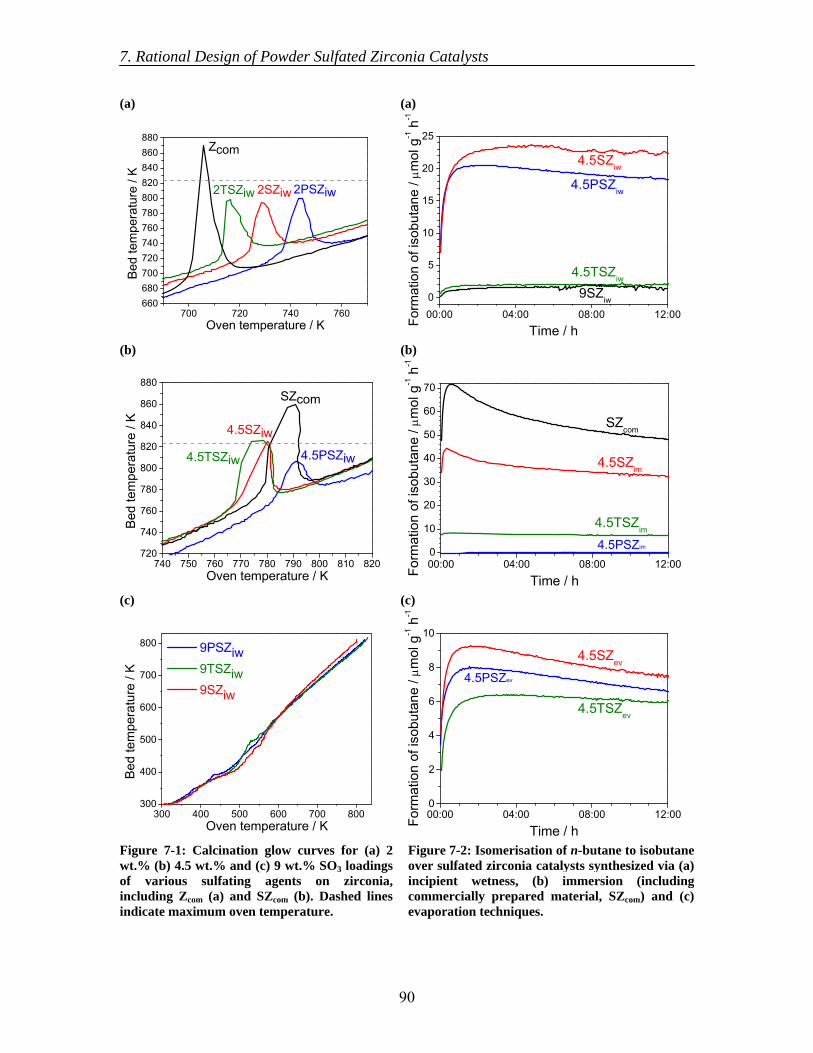
7. Rational Design of Powder Sulfated Zirconia Catalysts
90
(a)
700 720 740 760660680700720740760780800820840860880
2PSZiw2SZiw2TSZiw
Zcom
B
ed te
mpe
ratu
re /
K
Oven temperature / K
(a)
00:00 04:00 08:00 12:000
5
10
15
20
25
4.5PSZiw
4.5SZiw
4.5TSZiw
Form
atio
n of
isob
utan
e / μ
mol
g-1 h
-1
Time / h
9SZiw
(b)
740 750 760 770 780 790 800 810 820720
740
760
780
800
820
840
860
880
4.5PSZiw
SZcom
4.5SZiw
4.5TSZiw
Bed
tem
pera
ture
/ K
Oven temperature / K
(b)
00:00 04:00 08:00 12:000
10
20
30
40
50
60
70
4.5PSZim
4.5TSZim
SZcom
Form
atio
n of
isob
utan
e / μ
mol
g-1 h
-1
Time / h
4.5SZim
(c)
300 400 500 600 700 800300
400
500
600
700
800 9PSZiw 9TSZiw 9SZiw
Bed
tem
pera
ture
/ K
Oven temperature / K
(c)
00:00 04:00 08:00 12:000
2
4
6
8
10
4.5PSZev
4.5TSZev
Form
atio
n of
isob
utan
e / μ
mol
g-1 h
-1
Time / h
4.5SZev
Figure 7-1: Calcination glow curves for (a) 2 wt.% (b) 4.5 wt.% and (c) 9 wt.% SO3 loadings of various sulfating agents on zirconia, including Zcom (a) and SZcom (b). Dashed lines indicate maximum oven temperature.
Figure 7-2: Isomerisation of n-butane to isobutane over sulfated zirconia catalysts synthesized via (a) incipient wetness, (b) immersion (including commercially prepared material, SZcom) and (c) evaporation techniques.
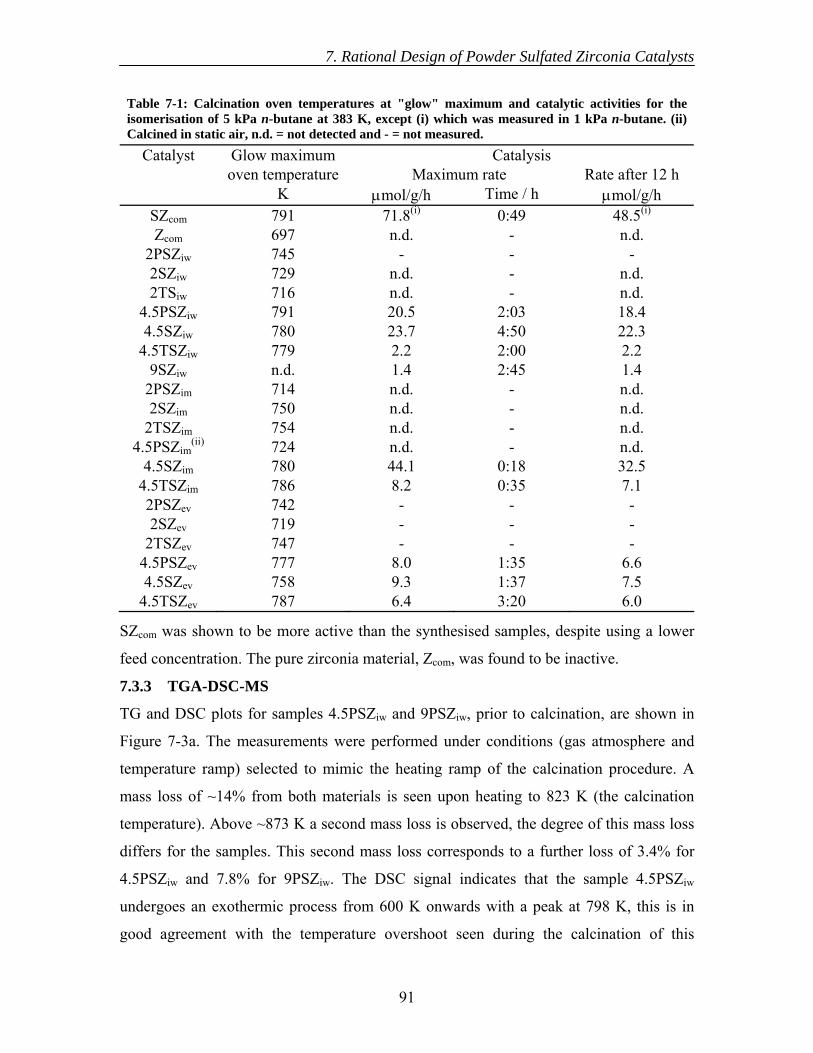
7. Rational Design of Powder Sulfated Zirconia Catalysts
91
Table 7-1: Calcination oven temperatures at "glow" maximum and catalytic activities for the isomerisation of 5 kPa n-butane at 383 K, except (i) which was measured in 1 kPa n-butane. (ii) Calcined in static air, n.d. = not detected and - = not measured.
Catalyst Glow maximum Catalysis oven temperature Maximum rate Rate after 12 h K μmol/g/h Time / h μmol/g/h
SZcom 791 71.8(i) 0:49 48.5(i) Zcom 697 n.d. - n.d.
2PSZiw 745 - - - 2SZiw 729 n.d. - n.d. 2TSiw 716 n.d. - n.d.
4.5PSZiw 791 20.5 2:03 18.4 4.5SZiw 780 23.7 4:50 22.3
4.5TSZiw 779 2.2 2:00 2.2 9SZiw n.d. 1.4 2:45 1.4
2PSZim 714 n.d. - n.d. 2SZim 750 n.d. - n.d.
2TSZim 754 n.d. - n.d. 4.5PSZim
(ii) 724 n.d. - n.d. 4.5SZim 780 44.1 0:18 32.5
4.5TSZim 786 8.2 0:35 7.1 2PSZev 742 - - - 2SZev 719 - - -
2TSZev 747 - - - 4.5PSZev 777 8.0 1:35 6.6 4.5SZev 758 9.3 1:37 7.5
4.5TSZev 787 6.4 3:20 6.0
SZcom was shown to be more active than the synthesised samples, despite using a lower
feed concentration. The pure zirconia material, Zcom, was found to be inactive.
7.3.3 TGA-DSC-MS
TG and DSC plots for samples 4.5PSZiw and 9PSZiw, prior to calcination, are shown in
Figure 7-3a. The measurements were performed under conditions (gas atmosphere and
temperature ramp) selected to mimic the heating ramp of the calcination procedure. A
mass loss of ~14% from both materials is seen upon heating to 823 K (the calcination
temperature). Above ~873 K a second mass loss is observed, the degree of this mass loss
differs for the samples. This second mass loss corresponds to a further loss of 3.4% for
4.5PSZiw and 7.8% for 9PSZiw. The DSC signal indicates that the sample 4.5PSZiw
undergoes an exothermic process from 600 K onwards with a peak at 798 K, this is in
good agreement with the temperature overshoot seen during the calcination of this
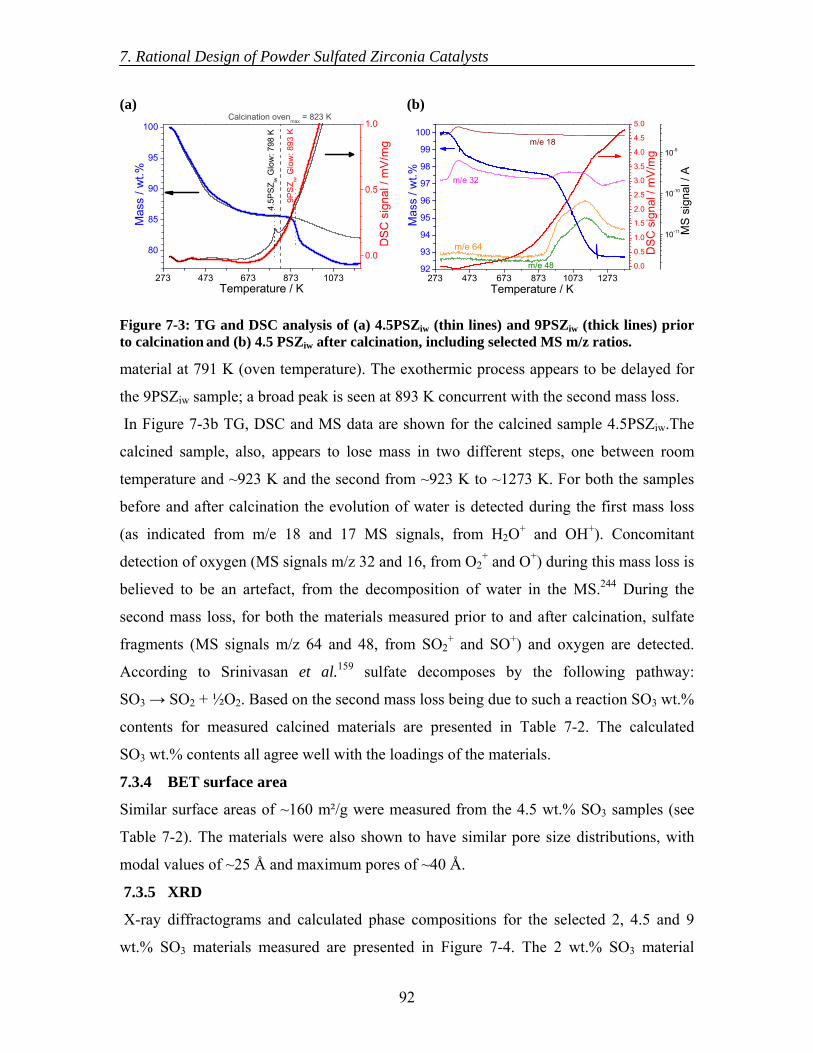
7. Rational Design of Powder Sulfated Zirconia Catalysts
92
material at 791 K (oven temperature). The exothermic process appears to be delayed for
the 9PSZiw sample; a broad peak is seen at 893 K concurrent with the second mass loss.
In Figure 7-3b TG, DSC and MS data are shown for the calcined sample 4.5PSZiw.The
calcined sample, also, appears to lose mass in two different steps, one between room
temperature and ~923 K and the second from ~923 K to ~1273 K. For both the samples
before and after calcination the evolution of water is detected during the first mass loss
(as indicated from m/e 18 and 17 MS signals, from H2O+ and OH+). Concomitant
detection of oxygen (MS signals m/z 32 and 16, from O2+ and O+) during this mass loss is
believed to be an artefact, from the decomposition of water in the MS.244 During the
second mass loss, for both the materials measured prior to and after calcination, sulfate
fragments (MS signals m/z 64 and 48, from SO2+ and SO+) and oxygen are detected.
According to Srinivasan et al.159 sulfate decomposes by the following pathway:
SO3 → SO2 + ½O2. Based on the second mass loss being due to such a reaction SO3 wt.%
contents for measured calcined materials are presented in Table 7-2. The calculated
SO3 wt.% contents all agree well with the loadings of the materials.
7.3.4 BET surface area
Similar surface areas of ~160 m²/g were measured from the 4.5 wt.% SO3 samples (see
Table 7-2). The materials were also shown to have similar pore size distributions, with
modal values of ~25 Å and maximum pores of ~40 Å.
7.3.5 XRD
X-ray diffractograms and calculated phase compositions for the selected 2, 4.5 and 9
wt.% SO3 materials measured are presented in Figure 7-4. The 2 wt.% SO3 material
(a)
273 473 673 873 1073
80
85
90
95
100
0.0
0.5
1.0
Mas
s / w
t.%
Temperature / K9P
SZ iw
Glo
w: 8
93 K
DSC
sig
nal /
mV
/mg
4.5P
SZiw
Glo
w: 7
98 K
Calcination ovenmax = 823 K
(b)
273 473 673 873 1073 127392
93
94
95
96
97
98
99
100
0.0
0.5
1.0
1.5
2.0
2.5
3.0
3.5
4.0
4.5
5.0
10-11
10-10
10-9
Mas
s / w
t.%
Temperature / K
DS
C s
igna
l / m
V/m
g
m/e 48
m/e 64
m/e 32
MS
sig
nal /
A
m/e 18
Figure 7-3: TG and DSC analysis of (a) 4.5PSZiw (thin lines) and 9PSZiw (thick lines) prior to calcination and (b) 4.5 PSZiw after calcination, including selected MS m/z ratios.
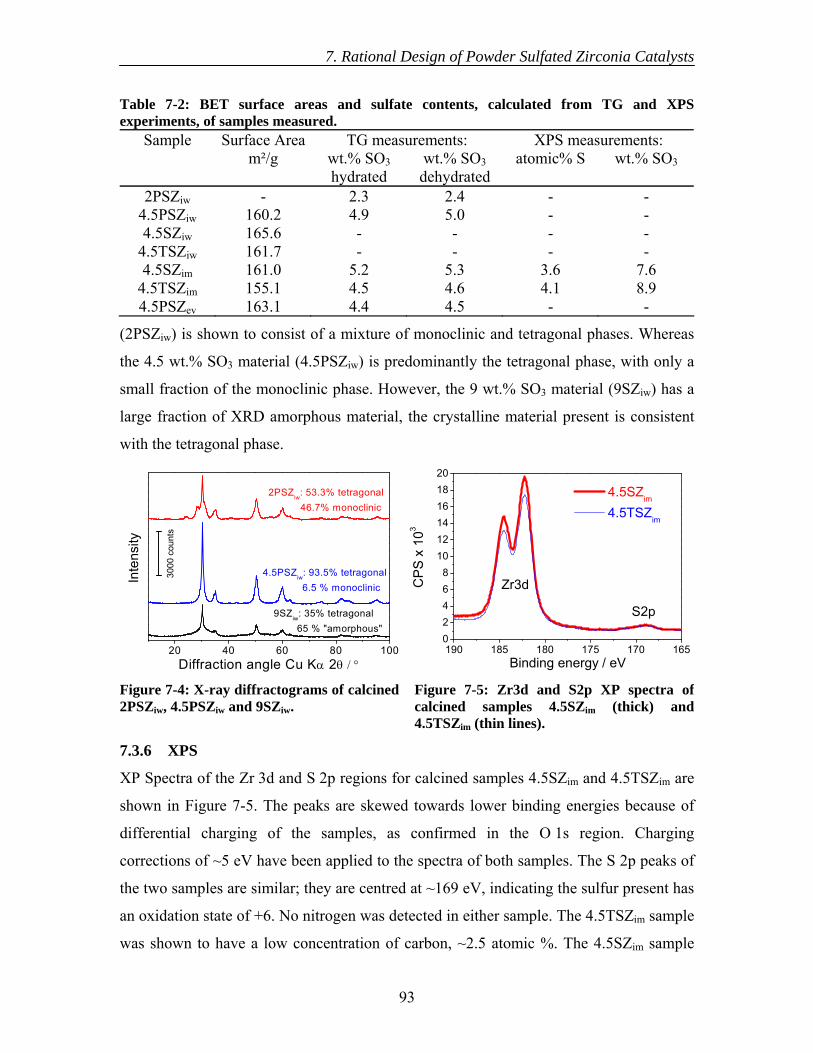
7. Rational Design of Powder Sulfated Zirconia Catalysts
93
(2PSZiw) is shown to consist of a mixture of monoclinic and tetragonal phases. Whereas
the 4.5 wt.% SO3 material (4.5PSZiw) is predominantly the tetragonal phase, with only a
small fraction of the monoclinic phase. However, the 9 wt.% SO3 material (9SZiw) has a
large fraction of XRD amorphous material, the crystalline material present is consistent
with the tetragonal phase.
7.3.6 XPS
XP Spectra of the Zr 3d and S 2p regions for calcined samples 4.5SZim and 4.5TSZim are
shown in Figure 7-5. The peaks are skewed towards lower binding energies because of
differential charging of the samples, as confirmed in the O 1s region. Charging
corrections of ~5 eV have been applied to the spectra of both samples. The S 2p peaks of
the two samples are similar; they are centred at ~169 eV, indicating the sulfur present has
an oxidation state of +6. No nitrogen was detected in either sample. The 4.5TSZim sample
was shown to have a low concentration of carbon, ~2.5 atomic %. The 4.5SZim sample
Table 7-2: BET surface areas and sulfate contents, calculated from TG and XPSexperiments, of samples measured.
Sample Surface Area TG measurements: XPS measurements: m²/g wt.% SO3
hydrated wt.% SO3 dehydrated
atomic% S wt.% SO3
2PSZiw - 2.3 2.4 - - 4.5PSZiw 160.2 4.9 5.0 - - 4.5SZiw 165.6 - - - -
4.5TSZiw 161.7 - - - - 4.5SZim 161.0 5.2 5.3 3.6 7.6
4.5TSZim 155.1 4.5 4.6 4.1 8.9 4.5PSZev 163.1 4.4 4.5 - -
20 40 60 80 100
2PSZiw: 53.3% tetragonal 46.7% monoclinic
4.5PSZiw: 93.5% tetragonal 6.5 % monoclinic
Inte
nsity
Diffraction angle Cu Kα 2θ / °
9SZiw: 35% tetragonal 65 % "amorphous"
3000
cou
nts
190 185 180 175 170 16502468
101214161820
S2p
4.5SZim
4.5TSZim
CP
S x
103
Binding energy / eV
Zr3d
Figure 7-4: X-ray diffractograms of calcined 2PSZiw, 4.5PSZiw and 9SZiw.
Figure 7-5: Zr3d and S2p XP spectra of calcined samples 4.5SZim (thick) and 4.5TSZim (thin lines).
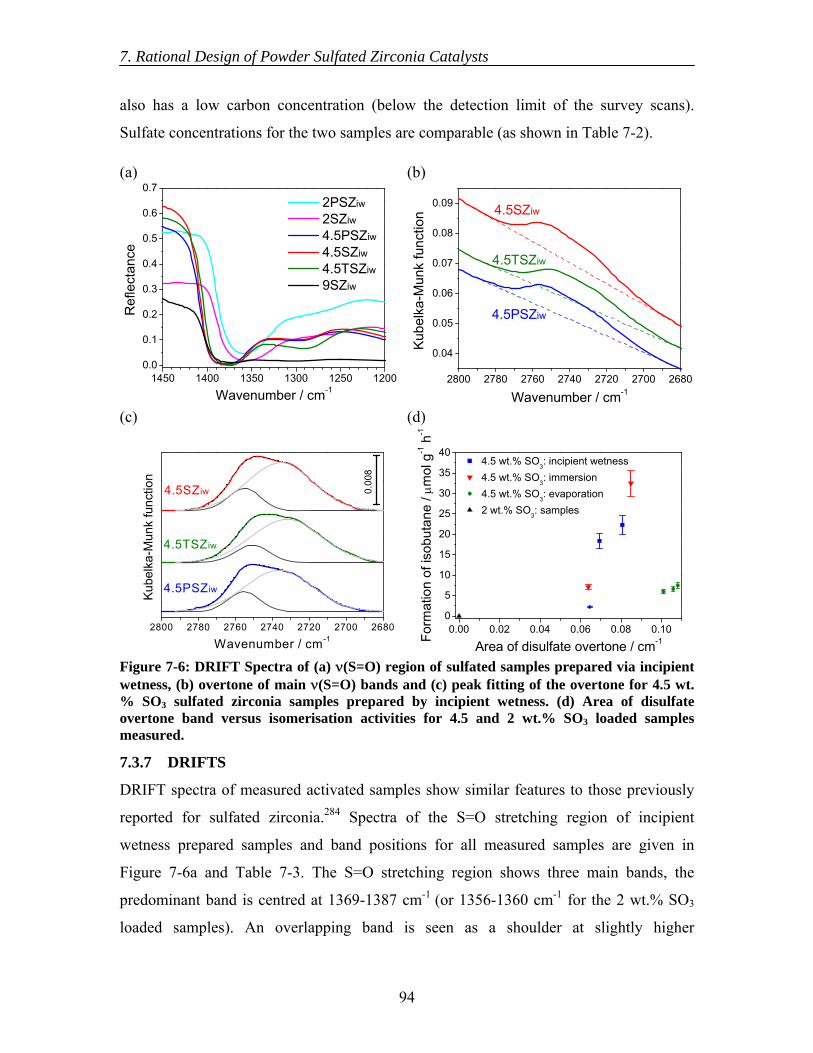
7. Rational Design of Powder Sulfated Zirconia Catalysts
94
also has a low carbon concentration (below the detection limit of the survey scans).
Sulfate concentrations for the two samples are comparable (as shown in Table 7-2).
7.3.7 DRIFTS
DRIFT spectra of measured activated samples show similar features to those previously
reported for sulfated zirconia.284 Spectra of the S=O stretching region of incipient
wetness prepared samples and band positions for all measured samples are given in
Figure 7-6a and Table 7-3. The S=O stretching region shows three main bands, the
predominant band is centred at 1369-1387 cm-1 (or 1356-1360 cm-1 for the 2 wt.% SO3
loaded samples). An overlapping band is seen as a shoulder at slightly higher
(a)
1450 1400 1350 1300 1250 12000.0
0.1
0.2
0.3
0.4
0.5
0.6
0.7
2PSZiw
2SZiw
4.5PSZiw
4.5SZiw
4.5TSZiw
9SZiw
Ref
lect
ance
Wavenumber / cm-1
(b)
2800 2780 2760 2740 2720 2700 2680
0.04
0.05
0.06
0.07
0.08
0.09
4.5PSZiw
4.5TSZiw
Kub
elka
-Mun
k fu
nctio
nWavenumber / cm-1
4.5SZiw
(c)
2800 2780 2760 2740 2720 2700 2680
4.5PSZiw
4.5TSZiw
Kube
lka-
Mun
k fu
nctio
n
Wavenumber / cm-1
0.00
8
4.5SZiw
(d)
0.00 0.02 0.04 0.06 0.08 0.100
5
10
15
20
25
30
35
404.5 wt.% SO3: incipient wetness4.5 wt.% SO3: immersion4.5 wt.% SO3: evaporation2 wt.% SO3: samples
Fo
rmat
ion
of is
obut
ane
/ μm
ol g
-1 h
-1
Area of disulfate overtone / cm-1
Figure 7-6: DRIFT Spectra of (a) ν(S=O) region of sulfated samples prepared via incipient wetness, (b) overtone of main ν(S=O) bands and (c) peak fitting of the overtone for 4.5 wt.% SO3 sulfated zirconia samples prepared by incipient wetness. (d) Area of disulfateovertone band versus isomerisation activities for 4.5 and 2 wt.% SO3 loaded samples measured.
7. Rational Design of Powder Sulfated Zirconia Catalysts
95
wavenumbers (1398-1400 cm-1 or 1383-1385 cm-1 for the 2 wt.% SO3 loaded samples). A
weaker band is seen at lower wavenumbers, at 1292-1300 cm-1 for all 4.5 wt.% SO3
loaded samples. For the 9 wt.% SO3 sample measured this band is weaker still and at
slightly higher wavenumbers (1304 cm-1). Samples loaded with 2 wt.% SO3 show a very
weak band at 1279 cm-1.
Quantification of the S=O stretching bands seen between 1279-1400 cm-1 is not possible,
even after normalisation and conversion using the Kubelka-Munk function, because of
the strong intensity of these bands and uncertainties arising from the background.
However, overtones of the two stronger S=O stretching bands are seen between ~2680-
Table 7-3: ν(S=O) DRIFTS band positions (in cm-1) of measured sulfated zirconia samples and assignments based on references 62 and 313. Note: sh = shoulder, w = weak and vw = very weak bands.
Sample [S2O72-,2H+]
or [SO3] [HSO4
-,SO4-, 3H+,2H2O]
or [SO42-,2H+]
[SO42-,
2H+,3H2O] [HSO4
-,SO4-,
3H+,2H2O] 2PSZiw - 1385 sh 1360 - 1279 vw 2SZiw - 1383 sh 1356 - 1279 vw
4.5PSZiw 1400 sh 1377 - 1298 - 4.5SZiw 1400 sh 1375 - 1298 -
4.5TSZiw 1400 sh 1377 - 1296 - 4.5SZim 1400 sh 1375 - 1300 -
4.5TSZim 1400 sh 1377 - 1296 - 4.5PSZev 1398 sh 1387 - 1300 - 4.5SZev 1398 sh 1369 - 1292 -
4.5TSZev 1400 sh 1373 - 1284 - 9SZiw 1398 sh 1373 - 1304 w -
Table 7-4: Fits of the DRIFTS main ν(S=O) overtone, after Kulbelka-Munk function conversion, for all 4.5 wt.% SO3 loaded samples measured, assignments based on references62 and 284.
Sample [S2O72-,2H+] or [SO3] [HSO4
-,SO4-, 3H+,2H2O] or [SO4
2-,2H+] Position
/ cm-1 Area / cm-1
Position / cm-1
Area / cm-1
Position / cm-1
Area / cm-1
4.5PSZiw 2756 0.069 2737 0.308 - - 4.5SZiw 2755 0.081 2736 0.349 - -
4.5TSZiw 2751 0.065 2732 0.337 - - 4.5SZim 2754 0.085 2733 0.352 - -
4.5TSZim 2752 0.064 2732 0.307 - - 4.5PSZev 2753 0.106 2730 0.623 2693 0.022 4.5SZev 2754 0.108 2735 0.464 - -
4.5TSZev 2755 0.101 2740 0.485 - -
7. Rational Design of Powder Sulfated Zirconia Catalysts
96
2780 cm-1 (see Figure 7-6b), the relative intensities of which can be compared. Fits of
these overtone bands were performed (Figure 7-6c) using a linear background and
constraining the full width half maximum (FWHM) of the higher wavenumber
component to between 17-20 cm-1. Two components were used to fit the spectra of all
samples except 4.5PSZev for which three components were used due to the increased
width of the overtone (~20 cm-1 towards lower wavenumbers) indicating the presence of
another overlapping band. The positions and areas of the fitted components for all 4.5
wt.% SO3 loaded samples measured are given in Table 7-4. Bandwidths varied between
17.0-18.3 cm-1 for the band at ~2754 cm-1 and 35-39 cm-1 for the band at ~2735 cm-1, the
additional component of 4.5PSZev has a bandwidth of 28 cm-1. Materials prepared using
the evaporation technique were found to have the largest areas of all components.
Incipient wetness and immersion prepared materials were found to have similar areas (for
materials loaded with the same sulfating agent). For all techniques the 4.5SZ materials
had the largest higher wavenumber component and the 4.5TSZ materials the smallest.
7.4 Discussion
The presence of an exothermic "glow" process during the calcination of sulfated zirconia
has previously been ascribed to a reduction in surface area and complete crystallisation of
the material.314315316317-318 Increasing the sulfur content has been reported to shift the
"glow" to higher temperatures,319 as shown here by calcination curves for the 2-4.5 wt.%
SO3 materials. High loadings of sulfur (9 wt.% SO3) increase the temperature required to
completely crystallise the material to above the calcination temperature used, as shown
by TGA-DSC, hence no "glow" is observed during calcination and XRD reveals the
calcined material (9SZiw) to be predominantly XRD amorphous. In order to fully
crystallise the materials with high sulfur loadings the calcination temperature should be
increased. TGA/DSC/MS plots, however, show the "glow" to coincide with the loss of
sulfate. The samples with high sulfur loadings are therefore considered not to be stable
with respect to forming a fully crystalline material under the conditions used. Materials
loaded with 9 wt.% SO3 were therefore only prepared via incipient wetness and just one
sample was catalytically tested. The material 9SZiw was found to have a low catalytic
activity, which is attributed to its low fraction of tetragonal phase.
7. Rational Design of Powder Sulfated Zirconia Catalysts
97
Low sulfur loadings (2 wt.% SO3) result not only in the "glow" being at a lower oven
temperature (compared to 4.5 wt.% SO3 loaded materials) but, also, the fraction of
tetragonal phase is significantly reduced (by the formation of the monoclinic phase), as
shown by XRD. The metastable tetragonal phase of zirconia is known to be stabilised by
the presence of sulfate, if, however, the sulfur loading is very low then the stable
monoclinic phase is, also, formed.18 The tetragonal phase has been shown to be a
necessary but not sufficient requirement to form a highly active catalytic material.27
Nevertheless, materials with low sulfur contents were still prepared, from the different
sulfating agents, to test if the minimum sulfur content required to produce an active
material is due to the absence of disulfates caused by the isolation of mono-sulfate
species. All materials prepared with a loading of 2 wt.% SO3 were, however, found to be
inactive for the isomerisation of n-butane.
The oven temperature at which the "glow" occurs for samples loaded with the same
sulfur content (either 2 or 4.5 wt.% SO3) would be expected to depend on the sulfate
precursor used, given that the sulfate structures have different thermal stabilities.
However, the order in which the glow exotherms occur for the different sulfating agents
varies depending on the sulfation technique used. A possible explanation is that the sulfur
content or the degree of hydration of the materials (prior to calcination) may change
slightly for the materials loaded with different sulfating agents depending on the sulfation
technique used. The catalytic activities of the 4.5 wt.% SO3 loaded materials do not seem
to correlate with the "glow" trends observed.
Sample 4.5PSZim was found to be the only inactive 4.5 wt.% SO3 loaded material, this is
believed to be due the different calcination conditions used for this sample. Comparisons
with this sample are therefore not considered meaningful, thus the sample was excluded
from further characterisation and will not be discussed hereafter.
Sulfate contents (determined as wt.% SO3) of selected calcined samples as derived from
TGA/MS results show similar values to the loaded amounts. Slight differences in sulfate
content do not show any consistent trend with catalytic activity. Higher sulfate contents
from XPS results than from TGA/MS calculations indicate the sulfate surface
concentration to be enhanced compared to the bulk. Given that only slight variations in
sulfur contents and surface areas of the samples measured were observed, the differing
7. Rational Design of Powder Sulfated Zirconia Catalysts
98
activities of the materials are not believed to result from different concentrations of sulfur
at the surface.
XP spectra of the calcined ammonium thiosulfate loaded sample measured (4.5TSZim)
show the sulfur on the material to be completely oxidised to S6+. The generally lower
activities of the ammonium thiosulfate loaded materials, as compared with the
ammonium sulfate loaded, cannot therefore be due to the oxidation state of sulfur. This is
to the author's knowledge the first report of active sulfated zirconia isomerisation
catalysts being prepared from ammonium thiosulfate.
DRIFTS measurements show that only samples possessing at band at ~1400-1398cm-1
are catalytically active. The presence of such a band is ascribed to disulfate groups, given
the results of reference 62 and the preparation conditions used. Integrating the overtone
of this band284 for active samples, after peak fitting to remove contributions from
overlapping band(s), shows no direct correlation between band intensity and catalytic
activity (Figure 7-6d). Materials prepared from precursors with two sulfur atoms, also, do
not have a more intense disulfate overtone band. Given the relative high stability of both
peroxydisulfate and thiosulfate salts in aqueous solutions320,321 the pregrouped sulfur
atoms are therefore assumed to dissociate either upon adsorption or during calcination.
The materials prepared via the evaporation technique have the most intense overtone
bands, possibly due to them having higher surface sulfate concentrations. During the
evaporation technique the sulfate is forced to precipitate on the surface of zirconium
hydroxide, whereas using the incipient wetness or immersion techniques sulfate
deposition within the pores of zirconium hydroxide is more likely to occur via capillary
forces or diffusion, respectively. If materials prepared using the same sulfating technique
are compared a correlation (although not linear) is observed between the disulfate
overtone band area and the catalytic activity of the materials. The same trends in both
disulfate band area and catalytic activity are seen for each of the sulfating techniques
used.
The presence of disulfate groups on sulfated zirconia are therefore considered a
prerequisite for forming an active isomerisation material; however, other factors such as
the sulfation technique are considered more influential on the catalytic activity than the
concentration of the disulfate groups. These more "influential" factors may be directly
7. Rational Design of Powder Sulfated Zirconia Catalysts
99
linked to the formation of "defect" sites which dictate the activity of adjacent catalytic
sites.
7.5 Conclusions
Powdered sulfated zirconia materials were successfully synthesised from three different
sulfating agents (ammonium sulfate, peroxydisulfate and thiosulfate), each added via
three different impregnation techniques (incipient wetness, immersion and evaporation).
Preparing sulfated zirconia from sulfating agents containing two sulfur atoms did not
increase the catalytic activity of the material. DRIFTS showed the formation of disulfate
groups also not to be promoted by use of precursors containing two pregrouped sulfur
atoms. The concentration of the disulfate band was shown not to correlate directly with
the catalytic activity of the materials produced. However, only materials with a disulfate
band were found to be active and for materials prepared in a similar way, higher disulfate
concentrations result in more active materials. The formation of disulfate groups is
therefore a prerequisite for catalytic activity. It is proposed that the catalytic sites are
generated from these disulfate species but that their isomerisation activities depend on
their environment rather than their total concentration.
8. Conclusions
100
8. Conclusions
The aim of this thesis was to investigate the surface chemistry of sulfated zirconia in
order to reveal information about its active isomerisation sites. To study the surface
chemistry of sulfated zirconia various model systems have been prepared to allow the
application of surface science techniques and to test the theory that disulfate groups62,63
are responsible for the generation of active sites on the catalyst.
8.1 Synthesis of Model Systems
Sulfated zirconia model systems were successfully produced via a range of different
preparation techniques. Thin films of sulfated zirconia were prepared on oxidised silicon
wafers, via the use of a self-assembled monolayer to promote heterogeneous deposition
from an acid stabilised aqueous solution of zirconium sulfate. Developments were made
to the thin film synthesis to reduce contamination and homogeneous deposition,
characterisation (following the changes) showed any such abnormalities in the films to be
negligible.
Thermal treatment of the films was optimised to chemically mimic the powder process
using an oxygen-containing atmosphere. The film thickness and heterogeneous
deposition mechanism were shown to be critical factors for formation of the tetragonal
phase. Surface stabilisation of the amorphous phase is proposed to prevent very thin (<5
nm) films from undergoing crystallisation. Homogeneous precipitation of an analogous
powder, from an equivalent deposition medium, was found to form a mixture of
tetragonal and monoclinic phases after thermal treatment under the conditions studied.
The development of a mixed phase oxide after the investigated thermal treatments is
proposed to occur as a result of re-crystallisation of orthorhombic zirconium sulfate
during homogeneous precipitation as opposed to the amorphous thin films which are
formed during heterogeneous deposition. Thermally treated thin films were found to have
the essential features (including equivalent sulfur content, crystalline phase and acidic
properties) of active powder catalysts,162 thus validating them as a model system. The use
of sulfated zirconia thin films improved the application of various surface science
techniques to the material, as compared with results from powder studies.
8. Conclusions
101
Sulfating agents containing one (ammonium sulfate) and two sulfur atoms (ammonium
peroxydisulfate and thiosulfate) were used to produce sulfated zirconia powders via
various impregnation techniques (incipient wetness, immersion and evaporation).
Experimental determinations of the overall sulfur content of the materials after thermal
treatment agreed well with the calculated loadings, however sulfur was found to be
enriched at the surface. Sulfur was detected only in the +6 oxidation state after thermal
treatment, thus indicating the complete oxidation of the thiosulfate loaded material. The
level of sulfur loading was shown to dictate the crystalline phase of the material; too high
(9 wt.% SO3) and the materials did not fully crystallise, too low (2 wt.% SO3) and the
more stable monoclinic phase was also formed in significant amounts. The thermally
treated 4.5 wt.% SO3 loaded material was shown to consist of predominantly the
tetragonal phase.
8.2 Sulfated Zirconia Surface Sites
Two distinctly different chemisorption sites were detected on sulfated zirconia by both
ammonia and n-butane adsorption studies. Ammonia adsorption on the sulfated zirconia
thin films followed by thermal desorption resulted in the evolution of ammonia in two
stages. A broad peak at relatively low temperatures indicating weakly bound molecules
and a second peak at higher temperatures with concurrent loss of sulfate were observed.
The basic probe molecule therefore not only adsorbs but also reacts with certain sites on
the sulfated zirconia thin films, these two types of interactions arise from different
surface sites.
Low temperature XPS measurements showed n-butane adsorption to be promoted over
the sulfated zirconia thin films, as compared with the oxidised silicon wafers used as
substrates. However the adsorbed reactant molecule, n-butane, was found to be liable to
beam damage during exposure to n-butane. In order to measure multiple adsorption-
desorption equilibrium isobars, with a single sample, at different pressures the effects of
beam damage were reduced to a negligible level by the use of a low energy excitation
source (UV radiation) and conducting the experiments in a manner to minimise adsorbate
irradiation. UPS isobars could thus be measured on the sulfated zirconia thin films. This
technique has previously never been applied to such a complex system as sulfated
8. Conclusions
102
zirconia and is only possible due to the conducting nature of the model thin films. The
application of this technique allowed not only the generation of information regarding the
strength of interaction (heats of adsorption) but also provided spectroscopic data (UP
spectra) showing how the interaction changes with coverage.
Adsorption of n-butane equivalent to 5 and 25% of a monolayer coverage on the sulfated
zirconia thin films, releasing heats of between 59-40 and 47-34 kJ/mol, is ascribed to
strong and weak chemisorption respectively. The deduced heats of adsorptions are in
good agreement with values obtained from powder sulfated zirconias.27,225,227 An increase
in adsorption heat was observed between coverages of ~5-8% of a monolayer, this is
believed to be due to adsorbate-adsorbate interactions. Physisorption on the films
generates heats of ~28 kJ/mol, for coverages between 30% up to a complete monolayer.
Multilayer adsorption results in the formation of an insulating adsorbate structure. n-
Butane adsorption is reversible under the conditions studied.
Sulfated zirconia powders, loaded with 4.5 wt.% SO3, have sulfate S=O stretching bands
that can be ascribed to mono-sulfate and disulfate groups. Materials with low sulfate
loadings (2 wt.% SO3) only show the presence of mono-sulfate bands. The highly loaded
sulfate (9 wt.% SO3) material measured showed intense sulfate stretching bands, but the
disulfate band was relatively weak. For the 4.5 wt.% SO3 loaded materials, those
prepared via the evaporation technique were shown to have the most intense disulfate
bands. For each of the different preparation techniques used the materials prepared from
ammonium sulfate were found to have the most intense disulfate bands and those
prepared from ammonium thiosulfate the weakest. Thus the use of sulfating agents
containing two sulfur atoms does not promote the formation of disulfate spices, possibly
due to their dissociation on adsorption or during calcination. The disulfate band was
found to be much weaker than the mono-sulfate ascribed band for all samples studied.
Given the adsorption studies on the sulfated zirconia thin films and the DRIFTS analysis
of the selectively synthesised powders it is proposed that the more strongly chemisorbing
sites, which reacted with ammonia and have 59-40 kJ/mol n-butane heats of adsorption,
correspond to a minority, disulfate species. Hence the weaker, more dominant
chemisorption sites are ascribed to mono-sulfate species. The formation of the disulfate
groups depends on various preparation factors, such as the sulfate loading, the synthesis
8. Conclusions
103
method and the sulfate precursor. The range of n-butane heats of adsorption and width of
ammonia thermal desorption peaks for both the disulfate and mono-sulfate species are
attributed to there being a distribution of similar adsorption sites. It is thus envisioned the
chemical environment of the disulfate and mono-sulfate species play a key role in their
adsorption properties.
8.3 Reactivity of Sulfated Zirconia
Beam influenced deposition was observed during n-butane in situ studies on the surface
of the sulfated zirconia thin films under reactive conditions. Carbon deposits were,
however, found to be stable to irradiation after removal of the gas phase. The formation
of carbonaceous surface deposits, after ex situ exposure to n-butane under reactive
conditions, proves the films contain reactive centres. The application of a synchrotron
light source enabled the high resolution analysis of the chemical states of the surface
deposits and the sulfated zirconia thin films. Evaluation of these stable carbon deposits by
XPS revealed the existence of at least three different chemical environments; which are
ascribed to "chain" like carbon (such as small hydrocarbons), aliphatic polymers and
oxygenated carbon. Further analysis by NEXAFS reveals the presence of unsaturated
hydrocarbons, which are consistent with butenes. The dehydrogenating ability of the
sulfated zirconia thin films was also confirmed by the increased detection of alkene
fragments, as compared to oxidised silicon wafers, during TDS after exposure to n-butane
at room temperature. During reactive exposure to n-butane sulfate groups were shown to
be reduced.
The formation of unsaturated hydrocarbon surface species and sulfate reduction, under
reaction conditions, are attributes that support oxidative dehydrogenation (Figure 8-1)
being the isomerisation initiation mechanism.63,90 The detection of oxygenated species is
also consistent with a stabilised carbocation being the catalytically active site. Aliphatic
polymers detected are proposed to be formed via the oligomerisation of alkenes on the
surface.
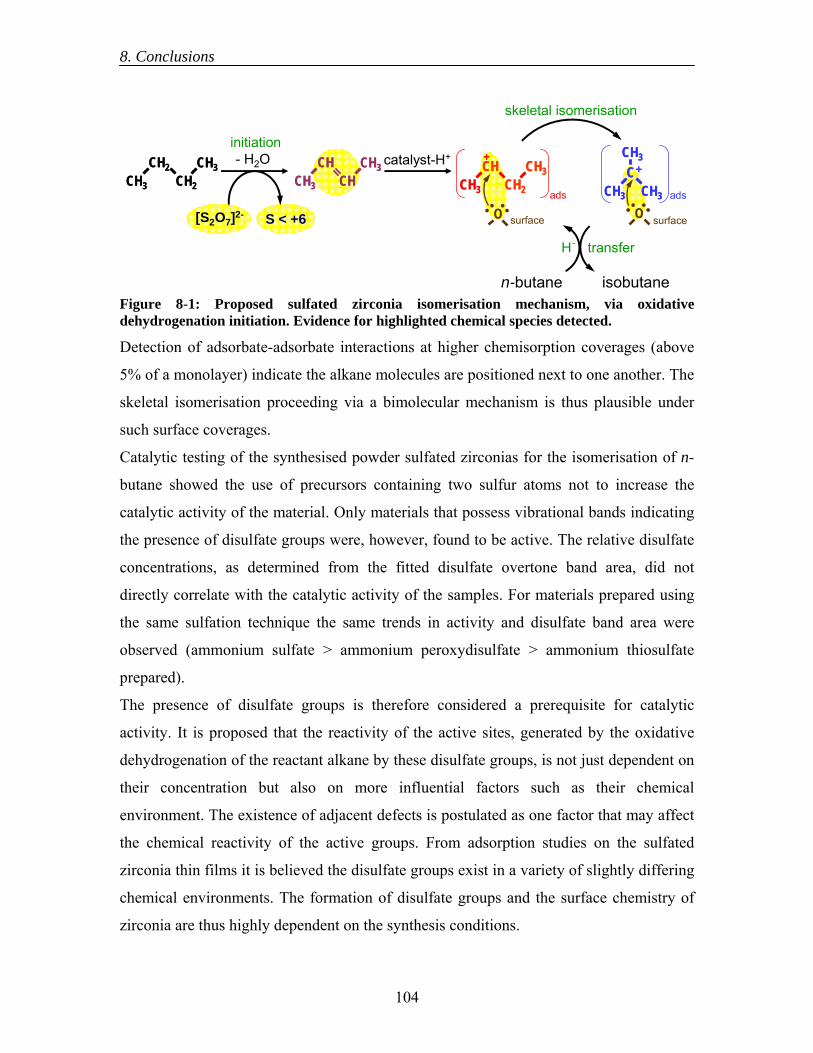
8. Conclusions
104
Detection of adsorbate-adsorbate interactions at higher chemisorption coverages (above
5% of a monolayer) indicate the alkane molecules are positioned next to one another. The
skeletal isomerisation proceeding via a bimolecular mechanism is thus plausible under
such surface coverages.
Catalytic testing of the synthesised powder sulfated zirconias for the isomerisation of n-
butane showed the use of precursors containing two sulfur atoms not to increase the
catalytic activity of the material. Only materials that possess vibrational bands indicating
the presence of disulfate groups were, however, found to be active. The relative disulfate
concentrations, as determined from the fitted disulfate overtone band area, did not
directly correlate with the catalytic activity of the samples. For materials prepared using
the same sulfation technique the same trends in activity and disulfate band area were
observed (ammonium sulfate > ammonium peroxydisulfate > ammonium thiosulfate
prepared).
The presence of disulfate groups is therefore considered a prerequisite for catalytic
activity. It is proposed that the reactivity of the active sites, generated by the oxidative
dehydrogenation of the reactant alkane by these disulfate groups, is not just dependent on
their concentration but also on more influential factors such as their chemical
environment. The existence of adjacent defects is postulated as one factor that may affect
the chemical reactivity of the active groups. From adsorption studies on the sulfated
zirconia thin films it is believed the disulfate groups exist in a variety of slightly differing
chemical environments. The formation of disulfate groups and the surface chemistry of
zirconia are thus highly dependent on the synthesis conditions.
S < +6
- H2O
[S2O7]2-
initiationcatalyst-H+
ads
Hֿ transfer
adsCH2CH3
CH3CH2CH2CH3
CH3CH2CHCH3
CH3CHCHCH3
CH3CHCH2CH3
CH3CH+
CH2CH3
CH3CH+
CH3CH3
CH3C+
CH3CH3
CH3C+
isobutanen-butane
O Osurface surface
skeletal isomerisation
Figure 8-1: Proposed sulfated zirconia isomerisation mechanism, via oxidative dehydrogenation initiation. Evidence for highlighted chemical species detected.
8. Conclusions
105
8.4 Contributions of Model Systems to the Scientific Understanding of Sulfated
Zirconia Isomerisation Catalysts
The use of a model thin film system has allowed the materials gap which exists within
catalysis research to be bridged. Thin films of sulfated zirconia have enabled surface
science techniques to be applied while not compromising the chemical complexity of the
catalyst.
Equilibrium adsorption-desorption investigations under isobaric conditions on the thin
films, using UPS, which would not have been possible on powder materials, have yielded
concurrent heats of adsorption and spectroscopic data. Such measurements, producing
heats similar to those acquired from powder catalysts,27,225,227,228 have enabled the
different types of adsorption to be identified and quantified. This level of interpretation
has not been possible from previously published data of adsorption heats on sulfated
zirconia powders catalysts.
Studying the films under reactive conditions has shown the development of carbonaceous
deposits on their surface, thus proving the films have reactive centres and validating them
as model systems. Detailed analysis of the deposited species and film's surface has
revealed the following chemical information:
(i) The deposited species is unsaturated, with a π* resonance typical of butene,
thus proving the dehydrogenation ability of sulfated zirconia.
(ii) Concurrent reduction of sulfate, indicating the unsaturated deposits are formed
by oxidative dehydrogenation.
(iii) Formation of oxygenated carbonaceous groups, which are consistent with the
stabilisation of the proposed carbocation intermediate.
The identification of such groups have been greatly aided by the use of the thin films to
allow high resolution XPS to be performed and the utilisation of a specialised design
setup enabling the films to be investigated under well-defined conditions. These findings
prove oxidative dehydrogenation is responsible for the generation of alkenes on the
surface of sulfated zirconia, thus they strongly concur with the initiation of the
isomerisation pathway proceeding by this mechanism (Figure 8-1).63,90 The presence of
butene and sulfate reduction over sulfated zirconia are consistent with earlier reports from
powder sulfated zirconia catalyst studies; including the detection of butene by
8. Conclusions
106
temperature programmed reaction spectroscopy;63 allylic species by UV-vis
spectroscopy,15,74,286 olefinic species by DRIFTS,278 sulfide by thermal desorption
followed by ion chromatography63 and XPS;83 and hydrogen disulfate by online gas
chromatography mass spectrometry72 and DRIFTS.278 This is however to the authors
knowledge the first time both butene and sulfate reduction have been detected on the
surface of sulfated zirconia after exposure at such relatively moderate conditions.
From the synthesis and investigation of powder sulfated zirconia catalysts it has been
found, as previously proposed,62,63 that disulfate groups are necessary for the formation of
catalytically active sites on sulfated zirconia. However, no direct correlation between the
concentration of such species and catalytic activity was observed, thus implying that
further variable(s) need to be identified to fully understand the catalytic behaviour of
sulfated zirconia. One such variable proposed is the presence of defect sites. The use of
defect sensitive techniques, such as electron paramagnetic resonance spectroscopy, to
study sulfated zirconia is currently ongoing within the department of Inorganic Chemistry
at the Fritz Haber Institute and through external collaborations. It is believed that such
studies, along with the identification of disulfate groups and their concentrations on
sulfated zirconia as presented in this thesis, may yield information regarding parameters
governing the skeletal alkane isomerisation activity of reactive sites on the catalyst
generated by oxidative dehydrogenation.
The model systems investigated in this thesis have thus lead not only to an improved
understanding of the surface sites on sulfated zirconia catalysts, but also of the initiation
and reaction alkane isomerisation mechanisms.
9. References
107
9. References
1 A. Huebner, M. Buchan and W. Martin, in Encyclopedia of Catalysis, ed. I. T. Horváth, E. Iglesia, M. T.
Klein, J. A. Lercher, A. J. Russell and E. I. Stiefel, John Wiley & Sons, New York, 2003, Vol. 4, pp. 268-
279. 2 D’Ans Lax, Taschenbuck für Chemiker und Physiker, Band II Organische Verbindungen, 4. Auflage,
Springer-Verlag, Berlin, 1983. 3 G. A. Olah, G. K. Surya Prakash and J. Sommer, Superacids, John Wiley & Sons, New York, 1985, pp.
254-259 4 C. N. Scatterfield, Heterogeneous Catalysis in Practice, McGraw-Hill, 1980. 5 K. Tanabe and W. Hölderich, Appl. Catal., A ,1999, 181, 399-434. 6 R. A. Sheldon and R. S. Downing, Appl. Catal,. A, 1999, 189, 163-183. 7 C. Gosling, R. Rosin, P. Bullen, T. Shimizu and T. Imai, Petroleum Technology Quarterly, Winter 97/98,
55-59. 8 P. J. Kuchar, R. D. Gillespie, C. D. Gosling, W. C. Martin, M. J. Cleveland and P. J. Bullen, Hydrocarbon
Eng., 1999, March, 50-57. 9 G. C. Anderson, R. R. Rosin, M. A. Stine and M. J. Hunter, 2004 NPRA Annual Meeting, San Antonio,
TX, USA, March 21–23, 2004, paper AM-04-46. 10 M. J. Hunter, Proceedings of DGMK-Conference "Chances for Innovative Processes at the Interface
between Refining and Petrochemistry", Berlin, October 9-11, 2002, p. 41-52. 11 V. C. F. Holm and G. C. Bailey, US Pat., 3 032 599, 1962. 12 M. Hino, S. Kobayashi and K. Arata, J. Am. Chem. Soc., 1979, 101, 6439-6441. 13 M. Hino and K. Arata, J. Chem. Soc., Chem. Commun., 1980, 851-852. 14 P. Nascimento, C. Akratapoulou, M. Oszagyan, G. Coudurier, C. Travers, J. F. Joly and J. C. Védrine,
Proceedings of the 10th International Congress on Catalysis, July 19-24, 1992, Budapest, Hungary, New
Frontiers in Catalysis, ed. L. Guczi, F. Solymosi, P. Tetényi, Elsevier, Amsterdam, 1993, pp. 1185. 15 F. R. Chen, G. Coudurier, J. F. Joly and J. C. Védrine, J. Catal., 1993, 143, 616-626. 16 M. G. Cutrufello, U. Diebold and R. D. Gonzalez, Catal. Lett., 2005, 101, 5-13. 17 J. Luo and R. Stevens, J. Am. Ceram. Soc., 1999, 82, 1922-1924. 18 M. A. Ecormier, K. Wilson and A. F. Lee, J. Catal., 2003, 215, 57-65. 19 R. C. Garvie and M. F. Goss, J. Mater. Sci., 1986, 21, 1253-1257. 20 R. C. Garvie, J. Phys. Chem., 1965, 69, 1238-1243. 21 R. C. Garvie, J. Phys. Chem., 1978, 82, 218-224. 22 A. Christensen and E. A. Carter, Phys. Rev. B, 1998, 58, 8050-8064. 23 C. Morterra, G. Poncelet, F. Pinna and M. Signoretto, J. Catal., 1995, 157, 109-123. 24 W. Stichert, F. Schüth, S. Kuba and H. Knözinger, J. Catal., 2001, 198, 277-285. 25 J. A. Moreno and G. Poncelet, J. Catal., 2001, 203, 453-465.
9. References
108
26 X. Li, K. Nagaoka, R. Olindo and J. A. Lercher, J. Catal., 2006, 238, 39-45. 27 X. Li, K. Nagaoka, L. J. Simon, J. A. Lercher, S. Wrabetz, F. C. Jentoft, C. Breitkopf, S. Matysik and H.
Papp, J. Catal., 2005, 230, 214-225. 28F. C. Jentoft, Oxo-Anion Modified Oxides, in Handbook of Heterogeneous Catalysis, ed. G. Ertl, H.
Knözinger, F. Schüth and J. Weitkamp, Wiley-VCh, 2nd edn., in press. 29 P. Afanasiev, A. Thiollier, M. Breysse and J. L. Dubois, Top. Catal., 1999, 8, 147-160. 30 www.Zrchem.com 31 www.sigma-aldrich.com 32 T. Riemer, D. Spielbauer, M. Hunger, G. A. H. Mekhemer and H. Knözigner, J. Chem. Soc., Chem.
Commun., 1994, 10, 1181-1182. 33 Z. Gao, Y. Xia, W. Hau and C. Miao, Top. Catal., 1998, 6, 101-106. 34 M. Signoretto, M. A. Stefano, F. Pinna, S. Polizzi, C. Cerrato and C. Morterra, Microporous Mesoporous
Mater., 2005, 81, 19-29. 35 F. Garin, D. Andriamasinoro, A. Abdulsamad and J. Sommer, J. Catal., 1991, 131, 199-203. 36 C. Y. Hsu, C. R. Heimbuch, C. T. Armes and B. C. Gates, J. Chem. Soc., Chem. Comm., 1992, 22, 1645-
1646. 37 X. Song and A. Sayari, Catal. Rev. Sci. Eng., 1996, 38, 329-412. 38 J. B. Nicholas, J. F. Haw, L. W. Beck, T. R. Krawietz and D. B. Ferguson, J. Am. Chem. Soc., 1994, 117,
12350-12351. 39 B. S. Umansky and K. Hall, J. Catal., 1990, 124, 97-108. 40 L. M. Kustov, V. B. Kazansky, F. Figueras and D. Tichit, J. Catal., 1994, 150, 143-149. 41 F. Babou, B. Bigot and P. Sautet, J. Phys. Chem., 1993, 97, 11501-11509. 42 J. R. Sohn and H. W. Kim, J. Mol. Catal., 1989, 52, 361-374. 43 T. Jin, M. Machida, T. Yamaguchi and K. Tanabe, Inorg. Chem., 1984, 23, 4396-4398. 44 T. Yamaguchi, T. Jin and K. Tanabe, J. Phys. Chem., 1986, 90, 3148-3152. 45 Y. Nagase, T. Jin, H. Hattori, T. Yamaguchi and K. Tanabe, Bull. Chem. Soc. Jpn., 1985, 58, 916-918. 46 F. C. Jentoft, Sulfated Zirconia Alkane Isomerisation Catalysts: A Treatise, Thesis (Habilitationsschrift),
Humboldt-Universität Berlin, 2004. 47 M. Bensitel, O. Saur, J. C. Lavally and B. A. Morrow, Mater. Chem. Phys., 1988, 19, 147-156. 48 C. Morterra, G. Cerrato and V. Bolis, Catal. Today, 1993, 17, 505-515. 49 K. Arata and M. Hino, Mater. Chem. Phys., 1990, 26, 213-237. 50 T. Yamaguchi, Appl. Catal., A, 1990, 146, 1-25. 51 J. M. Parera, Catal. Today, 1992, 15, 481-490. 52 K. Arata, Adv. Catal., 1990, 37, 165-211. 53 M. Signoretto, F. Pinna, G. Struckul, P. Chies, G. Cerrato, S. Di Ciero and C. Morterra, J. Catal., 1997,
167, 522-523.
9. References
109
54 A. Clearfield, G. P. D. Serrette and A. H. Khazi-Syed, Catal. Today, 1994, 20, 295-315. 55 F. Babou, G. Coudurier and J. C. Vedrine, J. Catal., 1995, 152, 341-349. 56 N. G. Connelly, T. Damhus, R. M. Hartshorn and A. T. Hutton, Nomenclature of Inorganic Chemistry,
IUPAC Recommendations 2005, RSC Publishing, 2005. 57 C. Morterra, G. Cerrato, F. Pinna and M. Signoretto, J. Phys. Chem., 1994, 98, 12373-12381. 58 D. A. Ward and E. I. Ko., J. Catal., 1994, 150, 18-33. 59 M. Waqif, J. Bachelier, O. Saur and J. C. Lavalley, J. Mol. Catal., 1992, 72, 127-138. 60 V. V. Strelko, Kinet. Catal., 2003, 44, 834-839. 61 V. Bolis, G. Magnacca, G. Cerrato and C. Morterra, Langmuir, 1997, 13, 888-894. 62 A. Hofmann and J. Sauer, J. Phys. Chem. B, 2004, 108, 14652-14662. 63 X. Li, K. Nagaoka, L. J. Simon, R. Olindo, J. A. Lercher, A. Hofmann and J. Sauer, J. Am. Chem. Soc.,
2005, 127, 16159-16166. 64 S. X. Song and R. A. Kydd, J. Chem. Soc., Faraday Trans., 1998, 94, 1333-1338. 65 M. Risch and E. E. Wolf, Appl. Catal., A, 2001, 206, 283-293. 66 S. Y. Kim, J. G. Goodwin and D. Galloway, Catal. Today, 2000, 63, 21-32. 67 B. Li and R. D. Gonzalez, Ind. Eng. Chem. Res., 1996, 35, 3141-3148. 68 H. K. Mishra and K. M. Parida, Appl. Catal., A, 2002, 224, 179-189. 69 C. R. Vera and J. M. Parera, J. Catal., 1997, 166, 254-262. 70 Z. Hong, K. B. Fogash and J. A. Dumesic, Catal. Today, 1999, 51, 269-288. 71 C. R. Vera, C. L. Piech, K. Shimizu, C. A. Querini and J. M. Parera, J. Catal., 1999, 187, 39-49. 72 F. T. T. Ng and N. Horvát, Appl. Catal., A, 1995, 123, L197-L203. 73 R. A. Comelli, C. R. Vera and J. M. Perera, J. Catal., 1995, 151, 96-101. 74 D. Spielbauer, G. A. H. Mekhemer, E. Bosch and H. Knözinger, Catal. Lett., 1996, 36, 59-68. 75 S. R. Vaudagna, R. A. Comelli, and N. S. Figoli, Catal. Lett., 1997, 47, 259-264. 76 S. R. Vaudagna, R. A. Comelli, S. A. Canavese and N. S. Figoli, J. Catal., 1997, 169, 389-393. 77 B. Li and R. D. Gonzalez, Appl. Catal., A, 1997, 165, 291-300. 78 K. B. Fogash, Z. Hong, J. M. Kobe and J. A. Dumesic, Appl. Catal., A, 1998, 172, 107-116. 79 H. Knözinger, Top. Catal., 1998, 6, 107-110. 80 B. Li and R. D. Gonzalez, Appl. Catal., A, 1998, 174, 109-119. 81 B. Li and R. D. Gonzalez, Catal. Today, 1998, 46, 55-67. 82 R. Marcus, U. Diebold and R. D. Gonzalez, Catal. Lett., 2003, 86, 151-156. 83 G. Resofski, M. Muhler, S. Sprenger, U. Wild and Z. Paál, Appl. Catal., A, 2003, 240, 71-81. 84 C. Li and P. C. Stair, Catal. Lett., 1996, 36, 119-123. 85 J. Sommer, R. Jost and M. Hachoumy, Catal. Today, 1997, 38, 309-319. 86 T. K. Cheung and B. C. Gates, Chem. Commun., 1996, 1937-1938. 87 M. Marczewski, J. Chem. Soc., Faraday Trans., 1986, 82, 1687-1701.
9. References
110
88 M. Marczewski, Bull. Soc. Chim. Fr., 1986, 750-755. 89 J. E. Tabora and R. J. Davis, J. Am. Chem. Soc., 1996, 118, 12240-12241. 90 A. Ghenciu and D. Fărcaşiu, Chem. Commun., 1996, 169-170. 91 D. Fǎrcaşiu, A. Ghenciu and J. Q. Li, J. Catal., 1996, 158, 116-127. 92 V. Maurice, M. Salmeron and G. A. Somorjai, Surf. Sci., 1990, 237, 116-126. 93 V. Adeeva, H. Y. Liu, B. Q. Xu and W. M. H. Sachtler, Top. Catal., 1998, 6, 61-76. 94 H. Liu, V. Adeeva, G. D. Lei and W. M. H. Sachtler, J. Mol. Catal. A: Chem., 1995, 100, 35-48. 95 S. Y. Kim, J. G. Goodwin and D. Fǎrcaşiu, Appl. Catal., 2001, 207, 281-286. 96 T. Suzuki and T. Okuhara, Chem. Lett., 2000, 5, 470-471. 97 H. Matsuhashi, H. Shibata, H. Nakamura and K. Arata, Appl. Catal., A, 1999, 187, 99-106. 98 J. A. Rodriquez and D. W. Goodman, Surf. Sci. Rep., 1991, 14, 1-107. 99 J. Freund, H. Kuhlenbeck and V. Staemmler, Rep. Prog. Phys., 1996, 59, 283-347. 100 P. L. J. Gunter, J. W. Niemantsverdriet, F. H. Ribiberteiro, G. A. Somorjai, Catal. Rev. Sci. Eng., 1999,
39, 77-168. 101 J. W. Niemantsverdrit, A. F. P. Engelen, A. M. de Jong, W. Wieldraaijer and G. J. Kramer, Appl. Surf.
Sci., 1999, 144-145, 366-374. 102 Y. Sorek, M. Zevin, R. Reisfeld, T. Hurvits and S. Ruschin, Chem. Mater., 1997, 9, 670-676. 103 C. W. Turner, Am. Ceram. Soc. Bull., 1991, 70, 1487-1490. 104 M. Guglielmi, J. Sol-Gel Sci. Tech., 1997, 8, 443-449. 105 G. C. Willis, G. B. Adams, and P. Van Rysselberghe, Electrochim. Acta, 1964, 9, 79-91. 106 M. S. El-Basiouny, A. A. Mazhar, F. El-Taib Heakal and M. A. Ameer, J. Electroanal. Chem., 1983,
147, 181-191. 107 G. T.Rodgers, P. H. G. Draper and S. S. Wood, Electrochim. Acta, 1968, 13, 251-261. 108 P. Meisterjahn, H. W. Hoppe and J. W. Schultze, J. Electroanal. Chem., 1987, 217, 159-185. 109 N. Khalil, A. Bowen and J. S. L. Leach, Electrochim. Acta, 1988, 33, 1721-1727. 110 E. M. Patrito and V. A. Macagno, J. Electroanal. Chem., 1994, 375, 203-211. 111 A. S. Mogoda, M. M Hefny, S. A. Salih and H. E. El-Faiky, Thin Solid Films, 1994, 250, 87-91. 112 S. M. Abed El-Motaal, N. H. Hilal and W. A. Badaw, Electrochim. Acta, 1994, 39, 2611-2617. 113 A. Mamun, R. Schennach, J. R. Parga, M. Y. A. Mollah, M. A. Hossain and D. L. Cocke, Electrochim.
Acta, 2001, 46, 3343–3350. 114 T. Pauporte and J. Finne, J. Appl. Electrochem., 2006, 33, 33–41. 115 J. C. Banter, J. Electrochem. Soc., 1967, 114, 508-511. 116 J. S. Leach and B. R. Pearson, Electrochim. Acta, 1984, 29, 1271-1282. 117 M. A. A. Rahim, A. A. A. Rahman and M. W. Khalil, J. Appl. Electrochem., 1996, 26, 1037-1043. 118 H. Shin, M. Agarwel, M. R. De Guire and A. H. Heuer, J. Am. Ceram. Soc., 1996, 79, 1975-1978. 119 M. Agarwal, M. R. De Guire and A. H. Heuer, J. Am. Ceram. Soc., 1997, 80, 2967-2981.
9. References
111
120 H. Shin, M. Agarwel, M. R. De Guire and A. H. Heuer, Acta Mater., 1998, 46, 801-815. 121 T. P. Niesen, M. R. De Guire, J. Bill, F. Aldinger, M. Rühle, A. Fischer, F. C. Jentoft and R. Schlögl, J.
Mater. Res., 1999, 14, 2464-2475. 122 A. Fischer, F. C. Jentoft, G. Weinberg, R. Schlögl, T. P. Niesen, J. Bill, F. Aldinger, M. R. De Guire and
M. Rühle, J. Mater. Res., 1999, 14, 3725-3733. 123 F. C. Jentoft, A. Fischer, G. Weinberg, U. Wild and R. Schlögl, Stud. Surf. Sci. Catal., 2000, 130, 209-
214. 124 A. Fischer, Doctorial Thesis, TU Berlin, 2001. 125 A. D. Polli, T. Wagner, A. Fischer, G. Weinberg, F. C. Jentoft, R. Schlögl and M. Rühle, Thin Solid
Films, 2000, 379, 122-127. 126 V. V. Roddatis, D. S. Su, F. C. Jentoft and R. Schlögl, Philos. Mag. A., 2002, 82, 2825-2839. 127 V. V. Roddatis, D. S. Su, E. Beckmann, F. C. Jentoft, U. Braun, J. Kröhnert and R. Schlögl, Surf. Coat.
Technol., 2002, 151-152, 63-66. 128 H. Cölfen, H. Schnablegger, A. Fischer, F. C. Jentoft, G. Weinberg and R. Schlögl, Langmuir, 2002, 18,
3500-3509. 129 Y. Tang and M. R. De Gurie, J. Mater. Chem., 2004, 14, 1173-1179. 130 J. Wang, S. Yang, X. Liu, S. Ren, F. Guan and M. Chen, Appl. Surf. Sci., 2004, 221, 272–280. 131 J. Wang, X. Liu, S. Ren, F. Guan and S. Yang, Tribology Lett., 2005, 18, 429-436. 132 G. Zhang, J. Y. Howe, D. W. Coffey, D. A. Blom, L. F. Allard and J. Cho, Mater. Sci. Eng., C, 2006,
26, 1344–1350. 133 A. P. Rizzato, C. V. Santilli and S. H. Pulcinelli, J. Non-Cryst. Solids, 1999, 247, 158-163. 134 J. M. Lin, M. C. Hsu and K. Z. Fung, J. Power Sources, 2006, 159, 49–54. 135 K. Meinel, A. Hofmann, S. Förster, R. Kulla, K. M. Schindler, H. Neddermeyer, J. Sauer and W.
Widdra, Phys. Chem. Chem. Phys., 2006, 8, 1593-1600. 136 B. C. Bunker, P. C. Rieke, B. J. Tarasevich, A. A. Campell, G. E. Fryxell, G. L. Graff, L. Song, J. Liu, J.
W. Virden and G. L. McVay, Science (Washington, D. C.), 1994, 264, 48-55. 137 S. Gorer and G. Hodes, J. Phys. Chem., 1994, 98, 5338-5346. 138 F. C. Meldrum, J. Flath and W. Knoll, Langmuir, 1997, 13, 2033-2049. 139 C. W. Bigelow, D. L. Pickett and W. A. Zisman, J. Colloid Interface Sci., 1946, 1, 513-538. 140 W. A. Zisman, Adv. Chem. Ser., 1964, 43, 1-51. 141 J. D. Swalwn, D. L. Allura, J. D. Andrade, E. A. Chandross, S. Garoff, J. Israelachvili, T. J. McCarthy,
R. Murray, R. F. Pease, J. F. Rabolt, K. J. Wynne and H. Yu, Langmuir, 1987, 3, 932-950. 142 A. Ulman, Adv. Mater., 1990, 2, 573-582. 143 D. H. Charych and M. D. Bednarski, MRS Bull., 1992, 17, 61-66. 144 A. Ulman, An Introduction to Ultrathin Organic Films from Langmuir-Blodgett to Self Assembly,
Academic Press, New York, 1991.
9. References
112
145 S. Ahrland, D. Karipides and B. Norén, Acta Chem. Scand., 1963, 17, 411-424. 146 R. E. Connick and W. H. McVey, J. Am. Chem. Soc., 1949, 71, 3182-3191. 147 E. Matijević, Acc. Chem. Res., 1981, 14, 22-29. 148 A. Clearfield, Rev. Pure Appl. Chem., 1964, 14, 91-108. 149 B. A. Lister and L. A. MacDonald, J. Chem. Soc., 1952, 4315-4330. 150 R. Ruer, Z. Anorg. Chem., 1904, 42, 87-99. 151 F. G. Baglin and D. Breger, Inorg. Nucl. Chem. Lett., 1976, 12, 173-177. 152 O. Hauser, Z. Anorg. Allg. Chem., 1905, 45, 185-204. 153 W. Kern, J. Electrochem. Soc., 1990, 137, 1887-1892. 154 J. F. Moulder, W. F. Stickle, P. E. Sobol and K. D. Bomben, Handbook of X-ray Photoelectron
Spectroscopy, Perkin Elmer Physical Electrons Division, 1992. 155 C. D. Wagner, L. E. Davis, M. V. Zeller, J. A. Taylor, R. M. Raymond and L. H. Gale, Surf. Interface
Anal., 1981, 3, 211–225. 156 Inorganic Crystal Structure Database (ICSD), http://icsd.fkf.mpg.de 157 N. M. Rodriguez, P. E. Anderson, A. Wootsch, U. Wild, R. Schlögl, and Z. Páal, J. Catal., 2001, 197,
365-377. 158 M. P. Seah and W. A. Dench, Surf. Interf. Anal., 1979, 1, 2-11. 159 R. Srinivasan, R. A. Keogh, D. R. Milburn and B. H. Davis, J. Catal., 1995, 153, 123-130. 160 J. Singer and D. T. Cromer, Acta Cryst., 1959, 12, 719-723. 161 I. Molodetsky, A. Navrotsky, M. J. Paskowitz, V. J. Leppert and S. H. Risbud, J. Non-Cryst. Solids,
2000, 262, 106-113. 162 C. Breitkopf, H. Papp, X. Li, R. Olindo, J. A. Lercher, R. Lloyd, S. Wrabetz, F. C. Jentoft, K. Meinel, S.
Förster, K. M. Schindler, H. Neddermeyer, W. Widdra, A. Hofmann and J. Sauer, Phys. Chem. Chem.
Phys., 2007, 9, 3600-3618. 163 H. Matsuhashi, H. Motoi and K. Arata, Catal. Lett., 1994, 26, 325-328. 164 R. Srinivasan, R. A. Keogh, A. Ghenciu, D. Farcasiu and B. H. Davis, J. Catal., 1996, 158, 502–510. 165 H. Suja, C. S. Deepa, K. Sreeja Rani and S. Sugunan, Appl. Catal., A, 2002, 230, 233-243. 166 R. W. Stevens, S. S. C. Chuang and B. H. Davis, Appl. Catal., A, 2003, 252, 57-74. 167 R. W. Stevens, S. S. C. Chuang and B. H. Davis, Thermochim. Acta, 2003, 407, 61–71. 168 S. Furuta, H. Matsuhashi and K. Arata, Appl. Catal., A, 2004, 269, 187–191. 169 N. A. Comelli, E. N. Ponzi and M. I. Ponzi, Chem. Eng. J., 2006, 117, 93–99. 170 S. T. Hussain, M. Mazhar, S. Gul, K. T. Chuang, and A. R. Sanger, Bull. Korean Chem. Soc., 2006, 27,
1844-1850. 171 T. Okuhara, T. Nishimura, H. Watanabe and M. Misono, J. Mol. Catal., 1992, 74, 247-256. 172 X. Song and A. Sayari, Appl. Catal., A, 1994, 110, 121-136. 173 A. Corma, V. Formes, M. I. Juan-Rajadell, J. M. Lopez Nieto, Appl. Catal., A, 1994, 116, 151-163.
9. References
113
174 A. Corma, M. I. Juan-Rajadell, J. M. Lopez-Nieto, A. Martinez and C. Marthez, Appl. Catal., A, 1994,
111, 175-189. 175 J. E. Tabora and R. J. Davis, J. Chem. Soc. Faraday Trans., 1995, 91, 1825-1833. 176 M. A. Coelho, D. E. Resasco, E. C. Sikabwe and R. L. White, Catal. Lett., 1995, 32, 253-262. 177 R. Barthos, F. Lonyi, J. Engelhardt and J. Valyon, Top. Catal., 2000, 10, 79–87. 178 N. Katada, J. Endo, K. Notsu, N. Yasunobu, N. Naito and M. Niwa, J. Phys. Chem. B, 2000, 104,
10321-10328. 179 H. K. Mishra, A. K. Dalai, K. M. Parida and S. K. Bej, Appl. Catal., A, 2001, 217, 263-273. 180 R. Barthos, F. Lonyi, G. Onyestyak and J. Valyon, Solid State Ionics, 2001, 141-142, 253-258. 181 A. Trunschke, J. Deutsch, D. Müller, H. Lieske, V. Quaschning and E. Kemnitz, Catal. Lett., 2002, 83,
271-279. 182 R. Sakthivel, H. A. Prescott, J. Deutsch, H. Lieske and E. Kemnitz, Appl. Catal., A, 2003, 253, 237–247. 183 F. Omota, A. C. Dimian and A. Bliek, Chem. Eng. Sci., 2003, 58, 3175-3185. 184 M. Niwa, Y. Habuta, K. Okumura and N. Katada, Catal. Today, 2003, 87, 213–218. 185 H. K. Mishra, A. K. Dalai, D. D. Das, K. M. Parida and N. C. Pradhan, J. Colloid Interface Sci., 2004,
272, 378–383. 186 N. Li, A. Wang, X. Wang, M. Zheng, R. Cheng and T. Zhang, Appl. Catal., B, 2004, 48, 259–265. 187 G. D. Yadav and A. D. Murkute, J. Catal., 2004, 224, 218–223. 188 N. Li, A. Wang, M. Zheng, X. Wang, R. Cheng and T. Zhang, J. Catal., 2004, 225, 307–315. 189 N. Katada and M. Niwa, Catal. Surv. Asia, 2004, 8, 161-170. 190 W. Wang, J. H. Wang, C. L. Chen, N. P. Xu and C. Y. Mou, Catal. Today, 2004, 97, 307–313. 191 S. Parambadath, M. Chidambaram and A. P. Singh, Catal. Today, 2004, 97, 233–240. 192 B. M. Reddy, P. M. Sreekanth and V. R. Reddy, J. Mol. Catal. A:Chem., 2005, 225, 71–78. 193 B. M. Reddy, P. M. Sreekanth and P. Lakshmanan, J. Mol. Catal. A:Chem, 2005, 237, 93–100. 194 K. Föttinger, E. Halwax and H. Vinek, Appl. Catal., A, 2006, 301, 115–122. 195 A. V. Ivanov, S. V. Lysenko, S. V. Baranova, A. V. Sungurov, T. N. Zangelov and E. A. Karakhanov,
Microporous Mesoporous Mater., 2006, 91, 254–260. 196 W. H. Chen, H. H. Ko, A. Sakthivel, S. J. Huang, S. H. Liu, A. Y. Lo, T. C. Tsai and S. B. Liu, Catal.
Today, 2006, 116, 111–120. 197 C. H. Lin and C. Y. Hsu, J. Chem. Soc., Chem. Commun., 1992, 1479-1480. 198 A. Jatia, C. Chang, J. D. MacLeod, T. Okubo and M. E. Davis, Catal. Lett., 1993, 25, 21-28. 199 K. T. Wan, C. B. Khouw, and M. E. Davis, J. Catal., 1996, 158, 311–326. 200 T. A. Peters, N. E. Benes, A. Holmen and J. T. F. Keurentjes, Appl. Catal., A, 2006, 297, 182–188. 201 D. R. Milburn, K. Saito, R. A. Keogh and B. H. Davis, Appl. Catal., A, 2001, 215, 191-197. 202 A. Adeeva, J. W. de Hann, J. Jänchen, G. D. Lei, V. Schünemann, L. M. van de Ven, W. M. H. Sachtler
and R. A. van Santen, J. Catal., 1995, 151, 364-372.
9. References
114
203 N. Li, A. Wang, Z. Liu, X. Wang, M. Zheng, Y. Huang and T. Zhang, Appl. Catal., B, 2006, 62, 292–
298. 204 E. C. Sikabwe and R. L. White, Catal. Lett., 1997, 44, 177-183. 205 H. Matsuhashi and K. Arata, Catal. Surv. Asia, 2006, 10, 1-7. 206 T. Shishido and H. Hattori, Appl. Catal., A, 1996, 146, 157-164. 207 G. K. Chuah, S. Jaenicke and T. H. Xu, Surf. Interface Anal., 1999, 28, 131-134. 208 C. Su, J. Li, D. He, Z. Cheng and Q. Zhu, Appl. Catal., A, 2000, 202, 81-89. 209 J. M. Dominguez, J. L. Hernandez and G. Sandoval, Appl. Catal., A, 2000, 197, 119-130. 210 K. Pokrovski, K. T. Jung, and A. T. Bell, Langmuir, 2001, 17, 4297-4303. 211 D. He, Y. Ding, H. Yin, T. Wang, H. Luo and C. Li, Catal. Lett., 2002, 84, 89-93. 212 W. Weiss, M. Ritter, D. Zscherpel, M. Swoboda and R. Schlögl, J. Vac. Sci. Technol. A, 1998, 16, 21-
29. 213 http://webbook.nist.gov/ 214 P. Stoltze, Prog. Surf. Sci., 2000, 65, 65-150. 215 W. A. Brown, R. Kose and D. A. King, Chem Rev., 1998, 98, 797-832. 216 W. Ranke and Y. Joseph, Phys. Chem. Chem. Phys., 2002, 4, 2483–2498. 217 K. Christmann, Introduction to Surface Physical Chemistry, Steinkopff Verlag, Darmstadt, 1991. 218 W. Weiss and W. Ranke, Prog. Surf. Sci., 2002, 70, 1-151. 219 S. Fölsch, A. Stock and M. Henzler, Surf. Sci., 1992, 264, 65-72. 220 M. Henzler, A. Stock and M. Böl, in Adsorption on Ordered Surfaces of Ionic Solids and Thin Films, ed.
E. Umbach and H. J. Freund, Springer, Berlin, 1993, vol. 33., pp. 15-23. 221 W. Ranke, Surf. Sci., 1995, 342, 281-292. 222 W. Ranke and W. Weiss, Surf. Sci., 1998, 414, 236-253. 223 W. Ranke and W. Weiss, Surf. Sci., 2000, 465, 317-330. 224 Y. Joseph, W. Ranke and W. Weiss, J. Phys. Chem. B, 2000, 104, 3224-3236. 225 M. R. González, K. B. Fogash, J. M. Kobe and J. A. Dumesic, Catal. Today, 1997, 33, 303-312. 226 R. C. Weast, Handbook of Chemistry and Physics, 58th edn., CRC Press, Cleveland, 1977. 227 C. Breitkopf, J. Mol. Catal. A: Chem., 2005, 226, 269–278. 228 X. Li, K. Nagaoka, L. J. Simon, R. Olindo and J. A. Lercher, J. Catal., 2005, 232, 456-466. 229 P. J. Timans, J. Appl. Phys., 1993, 74, 6353-6364. 230 P. Kramer and L.J. van Ruyven, Appl. Phys. Lett., 1972, 20, 420-422. 231 M. H. Hecht, Phys. Rev. B, 1990, 41, 7918-7921. 232 S. Chang, I. M. Vitomirov, L. J. Brillson, D. F. Rioux, P. D. Kirchner, G. D. Pettit, J.M. Woodall and M.
H. Hecht, Phys. Rev. B, 1990, 41, 12299-12302.
9. References
115
233 K. Kimura, S. Katsumata, Y. Achiba, T. Yamazaki, S. Iwata, Handbook of He Ι Photoelectron Spectra
of Fundamental Organic Molecules, Japan Scientific Societies Press, Tokyo and Halsted Press, New York,
1981. 234 T. Arnold, S. Channa, S. M. Clarke, R. E. Cook and J. Z. Larese, Phys. Rev. B, 2006, 74, 085421. 235 D. Briggs and T. Grant, Surface Analysis by Auger and X-ray Photoelectron Spectroscopy, IM
Publications, West Sussex and Surface Spectra Limited, Manchester, 2003. 236 L. Sanche, Nucl. Instrum. Methods Phys. Res., Sect. B, 2003, 208, 4-10. 237 S. E. Hoory and J. M. Prausnitz, Trans. Faraday Soc., 1967, 63, 455-460. 238 G. C. Chirnside and C. G. Pope, J. Phys. Chem., 1964, 68, 2377-2379. 239 S. Ross, J. K. Salens and J. Olivier, J Phys. Chem., 1962, 66, 696-700. 240 Z. Wu, S. N. Ehrlich, B. Matthies, K. W. Herwig, P. Dai, U. G. Volkmann, F. Y. Hansen and H. Taub,
Chem. Phys. Lett., 2001, 348, 168-174. 241 J. M. Hilding and E. A. Grulke, J. Phys. Chem. B, 2004, 108, 13688-13695. 242 S. Wrabetz and F. C. Jentoft, unpublished work. 243 D. Briggs and M. P. Seah, Practical Surface Analysis, John Wiley and Sons, Chichester, 2nd edn., 1990,
vol. 1, pp. 168-173 and 244-248. 244 B. S. Klose, Doctorial thesis, TU Berlin, 2005. 245 D. R. Milburn, R. A. Keogh, R. Srinivasan and B. H. Davis, Appl. Catal., A, 1996, 147, 109-125. 246 S. Ardizzone, M. G. Cattania and P. Lugo, Electrochim. Acta, 1994, 39, 1509-1517. 247 K. Ebitani, J. Konishi, T. Tanaka and H. Hattori, J. Catal., 1992, 135, 60-67. 248 J. M. Manoli, C. Potvin, M. Muhler, U. Wild, G. Resofszki, T. Buchholz and Z. Paál, J. Catal., 1998,
178, 338-351. 249 C. Morant, J. M. Sanz, L. Galán, L. Soriano and F. Rueda, Surf. Sci., 1989, 218, 331-345. 250 Z. Paál, U. Wild, M. Muhler, J.-M. Manoli, C. Potvin, T. Buchholz, S. Sprenger and G. Resofszki, Appl.
Catal., A, 1999, 188, 257-266. 251 M. D. Appay, J. M. Manoli, C. Potvin, M. Muhler, U. Wild, O. Poznyakova and Z. Paál, J. Catal., 2004,
222, 419-428. 252 S. Chang and R. Doong, Chem. Mater., 2005, 17, 4837-4844. 253 H. Bluhm, M. Hävecker, A. Knop-Gericke, E. Kleimenov, R. Schlögl, D. Teschner, V. I. Bukhtiyarov,
D. F. Ogletree and M. Salmeron, J. Phys. Chem. B, 2004, 108, 14340-14347. 254 G. Tzolova-Müller and F. C. Jentoft, unpublished results. 255 J. J. Yeh and I. Lindau, Atomic and Nuclear Data Tables, 1985, 32, 1-155. 256 P. E. Batson, Phys. Rev. B: Condens. Matter, 1993, 48, 2608-2610. 257 J. Stöhr, NEXAFS Spectroscopy, Springer, Berlin, 1992. 258 M. P. Seah and S. J. Spencer, Surf. Interface Anal., 2002, 33, 640–652. 259 A. P. Hitchcock and I. Ishii, J. Electron Spectrosc. Relat. Phenom., 1987, 42, 11–26.
9. References
116
260 A. P. Hitchcock, S. Beaulieu, T. Steel, J. Stöhr and F. Stette, J. Chem. Phys., 1984, 80, 3927–3935. 261 G. Comelli, J. Stöhr, C. J. Robinson and W. Jark, Phys. Rev. B: Condens. Matter, 1988, 38, 7511–7519. 262 A. P. Hitchcock and D. C. Mancini, J. Electron Spectrosc., 1994, 67, 1-132. 263 O. Guise, H. Marbach, J. Levy, J. Ahner and J. T. Yates, Surf. Sci., 2004, 571, 128-138. 264 G. Centi, F. Cavani and F. Trifirò, Selective Oxidation by Heterogeneous Catalysis, Kluwer
Academic/Plenum Publishers, New York, 2001, pp. 446-454. 265 L. Wang, Y. Tian, H. Ding and J. Li, Eur. Polym. J., 2006, 42, 2921–2930. 266 X. Wallart, C. H. de Villeneuve and P. Allongue, J. Am. Chem. Soc., 2005, 127, 7871-7878. 267 H. Jensen, A. Soloviev, Z. Lib and E. G. Søgaard, Appl. Surf. Sci., 2005, 246, 239–249. 268 V. van Elsbergen, C. Weijtens and J. Zaumseil, Appl. Surf. Sci., 2004, 234, 120–125. 269 N. Saito, S. H. Lee, N. Maeda, R. Ohta, H. Sugimura and O. Takai, J. Vac. Sci. Technol. A, 2004, 22,
1425-1427. 270 R. Tomita, S. Urano and S. Kohiki, J. Polym. Sci., Part A: Polym. Chem., 2002, 40, 2917–2926. 271 M. Atreya, S. Li, E. T. Kang, K. G. Neoh, Z. H. Ma and K. L. Tan, J. Vac. Sci. Technol. A, 1999, 17,
853-861. 272 S. Affrossman and S. M. MacDonald, Langmuir, 1996, 12, 2090-2095. 273 J. Silvestre-Albero, M. Borasio, G. Rupprechter and H. J. Freund, Catal. Commun., 2007, 8, 292-298. 274 G. Beamson and D. Briggs, High Resolution XPS of Organic Polymers, The Scienta ESCA300
Database, Wiley, Chichester, 1992. 275 X. Wang and M. Lieberman, Langmuir, 2003, 19, 7346-7353. 276 T. Ishida, N. Choi, W. Mizutani, H. Tokumoto, I. Kojima, H. Azehara, H. Hokari, U. Akiba and M.
Fujihira, Langmuir, 1999, 15, 6799-6806. 277 C. D. Wagner, A. V. Naumkin, A. Kraut-Vass, J. W. Allison, C. J. Powell and J. R. Rumble, NIST X-ray
Photoelectron Spectroscopy Database, NIST Standard Reference Database 20, version 3.4 (Web Version),
2006, http://srdata.nist.gov/xps/ 278 B. S. Klose, F. C. Jentoft, R. Schlögl, I. R. Subbotina and V. B. Kazansky, Langmuir, 2005, 21, 10564-
10572. 279 E. Kristensen, PhD dissertation, Uppsla University, 1996. 280 M. Wirde, U. Gelius, T. Dunbar and D. L. Allara, Nucl. Instrum. Methods Phys. Res., Sect. B, 1997, 131,
245-251. 281 K. Bandyopadhyay, K. Vijayamohanan, M. Venkataramanan and T. Pradeep, Langmuir, 1999, 15,
5314-5322. 282 I. Kartio, K. Laajalehto and E. Suoninen, Colloids Surf., A, 1999, 154, 97–101. 283 K. Heister, M. Zharnikov, M. Grunze, L. S. O. Johansson and A. Ulman, Langmuir, 2001, 17, 8-11. 284 B. S. Klose, F. C. Jentoft and R. Schlögl, J. Catal., 2005, 233, 68-80. 285 C. D. Wagner, D. A. Zatko and R. H. Raymond, Anal. Chem., 1980, 52, 1445.
9. References
117
286 R. Ahmad, J. Melsheimer, F. C. Jentoft and R. Schlögl, J. Catal., 2003, 218, 365-374. 287 P. L. J. Gunter, J. W. Niemantsverdriet, F. H. Riberio and G. A. Somorjai, Catal. Rev.-Sci. Eng., 1997,
39, 77-168. 288 C. T. Campbell, Adv. Catal., 1989, 36, 1-54. 289 O. R. Kahn, E. E. Petersen and G. A. Somorjai, J. Catal., 1974, 34, 294-306. 290 E. W. Kuipers, I. H. Vinkenburg and H. Oosterbeek, J. Catal., 1995, 152, 137-146. 291 X. Xu and D. W. Goodman, Appl. Phys. Lett., 1992, 61, 774-776. 292 S. Ladas, H. Poppa and M. Boudart, Surf. Sci., 1981, 102, 151-171. 293 A. Baffa, C. Lin, A. T. Bell and G. A. Somorjai, J. Catal., 1994, 149, 149-158. 294 C. T. Campbell and M. T. Paffett, Surf. Sci., 1984, 139, 396-416. 295 D. W. Blakely, E. I. Kozak, B. A. Sexton and G. A. Somorjai, J. Vac. Sci. Technol., 1976, 13, 1091-
1096. 296 D. W. Goodman, R. D. Kelley, T. E. Madey and J. T. Yates, J. Catal., 1980, 63, 226-234. 297 H. J. Krebs, H. P. Bonzel and G. Gafner, Surf. Sci., 1979, 88, 269-283. 298 C. T. Campbell and K. A. Daube, J. Catal., 1987, 104, 109-119. 299 X. Li, Doctorial Thesis, Technischen Universität München, 2004. 300 C. Morterra, G. Cerrato, C. Emanuel and V. Bolis, J. Catal., 1993, 142, 249-367. 301 C. Morterra, V. Bolis, G. Cerrato and G. Magnacca, Surf. Sci., 1994, 307-309, 1206-1213. 302 E. Escalona Platero, M. Peñarroya Mentruit, C. Otero Areán and A. Zecchina, J. Catal., 1996, 162, 268-
276. 303 Y. Xia, W. Hua and Z. Gao, Appl. Catal., A., 1999, 185, 293-300. 304 R. L. Marcus, R. D. Gonzalez, E. L. Kugler and A. Auroux, Chem. Eng. Comm., 2003, 190, 1601-1619. 305 K. Biró, F. Figueras and S. Békássy, Appl. Catal., A, 2002, 229, 235-243. 306 D. Prasetyoko, Z. Ramli, S. Endud and H. Nur, J. Mol. Catal. A, 2005, 241, 118-125. 307 P. Afanasiev, C. Geantet and M. Breysse, J. Mater. Chem., 1994, 4, 1653-1657. 308 A. S. Dias, S. Lima, M. Pillinger and A. A. Valente, Catal. Lett., 2007, 114, 151-160. 309 A. V. Lavrenov, E. V. Perelevskii, V. P. Finevich, V. I. Zaikovskii, E. A. Paukshtis, V. K. Duplyakin
and S. S. Bal’zhinimaev, Russ. J. Appl. Chem., 2003, 76, 550-557. 310 H. K. Mishra, A. K Dalai, D. D. Das, K. M Parida and N. C. Pradhan, J. Colloid Interface Sci., 2004,
272, 378-383. 311 A. Hahn, T. Ressler, R. E. Jentoft and F. C. Jentoft, Chem. Commun., 2001, 537-538. 312 A. M. C. Davies, Spectroscopy Europe, 2007, 19, 32-33. 313 B.S. Klose, F.C. Jentoft, R. Schlögl, A. Hofmann and J. Sauer, XXXIX Jahrestreffen Deutscher
Katalytiker, Weimar, 15-17 March, 2006. 314 R. Srinivasan and B. H. Davis, J. Colloid Interface Sci., 1993, 156, 400-405. 315 M. Sorrentino, L. Steinbrecher and F. Hazel, J. Colloid Interface. Sci., 1969, 31, 307-316.
9. References
118
316 A. Keshavaraja, N. E. Jacob and A. V. Ramaswamy, Thermochim. Acta, 1995, 254, 267-275. 317 J. Livage, K. Doi and C. Mazières, J. Am. Ceram. Soc., 1968, 51, 349-353. 318 A. Hahn, R. E. Jentoft, T. Ressler, G. Weinberg, R. Schlögl and F. C. Jentoft, J. Catal., 2005, 236, 324-
334. 319 S. Chokkaram, R. Sirnivasan, D. R. Milburn and B. H. Davis, J. Colloid. Interface Sci., 1994, 165, 160-
168. 320 A. F. Holleman and E. Wiberg, Lehrbuch der Anorganischen Chemie, Walter de Gruyter, Berlin, New
York, 1985 pp. 519-524. 321 Gmelins Handbuch der anorganischen Chemie, S 9, B2: Schwefelsauerstoffsaeuren, Verlag Chemie,
1960, pp. 822-825 and 874-875.


![Sulfated zirconia[1]](https://img.pdfslide.net/doc/110x75/5568f2ecd8b42aff2e8b4932/sulfated-zirconia1.jpg)