Embed Size (px)
Citation preview
INVESTING IN AFRICA:
A practical perspective for the South African Institutional Investor
ABSTRACT
INVESTING IN AFRICA: A PRACTICAL PERSPECTIVE FOR THE SOUTH AFRICAN INSTITUTIONAL INVESTOR
BY
Zeenat Patel, Donovan McKay, Nick Janse Van Rensburg and Nimisha Bhagwan
Strong growth rates, increasing urbanisation, favourable demographics and a growing middle class are
among the key reasons that make a compelling argument for South African investors to include the
Africa investment opportunity in their overall portfolio. This investigation seeks to highlight the practical
implications for investors by exploring the available investment opportunities and the challenges that
can be faced. Due consideration has been given to appropriate benchmarks and fee structures that
have a material effect on the outcomes and performance of an investment decision. Amendments to
the regulatory framework have further enhanced the profile of Africa and resulted in a renewed focus by
investors on the African continent. Finally, the perspectives of asset managers whose product offerings
include Africa are provided for further insight into the investment landscape.
CONTACT DETAILS
Zeenat Patel [email protected]
Donovan McKay [email protected]
Nick Janse van Rensburg [email protected]
Nimisha Bhawan [email protected]
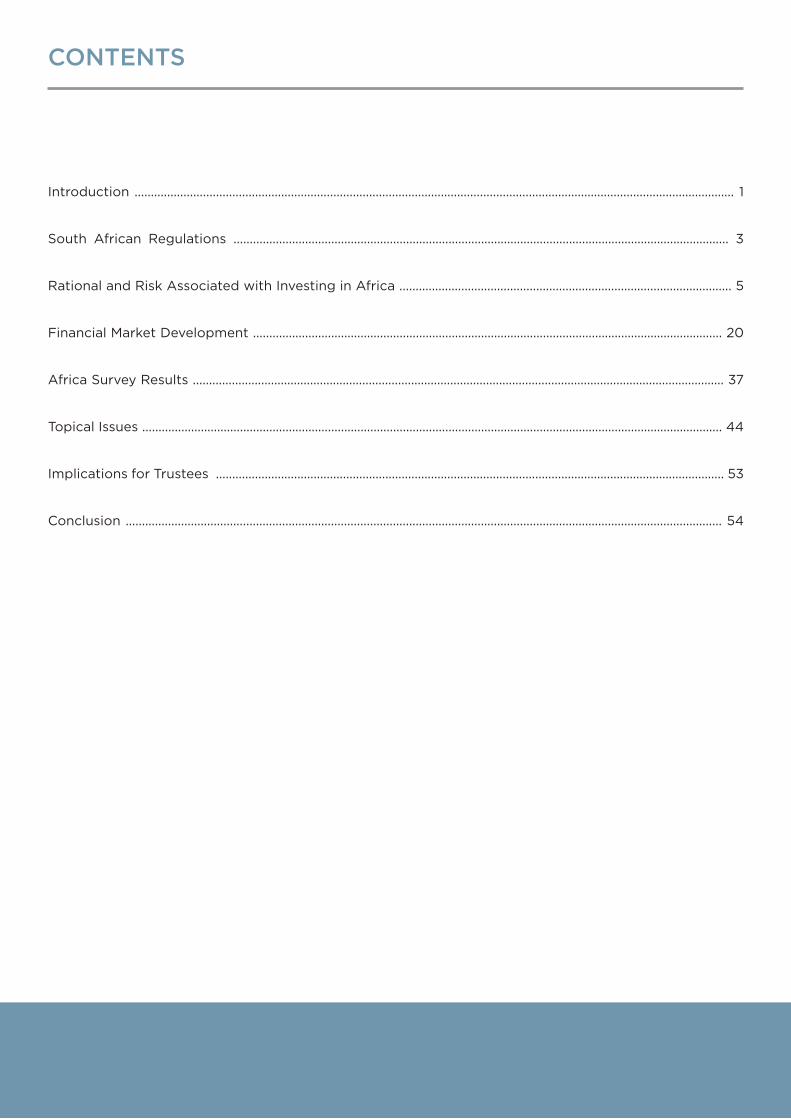
CONTENTS
Introduction ........................................................................................................................................................................................ 1
South African Regulations ........................................................................................................................................................ 3
Rational and Risk Associated with Investing in Africa ...................................................................................................... 5
Financial Market Development ................................................................................................................................................ 20
Africa Survey Results ................................................................................................................................................................... 37
Topical Issues .................................................................................................................................................................................. 44
Implications for Trustees ............................................................................................................................................................ 53
Conclusion ....................................................................................................................................................................................... 54
1. INTRODUCTION
In the years following the global financial crisis, the desperate search for growth, yield and solvency has led investors to pay much more attention to emerging markets, and in particular frontier markets. The term “Frontier Markets” was first used when, in 1992, the International Finance Corporation Emerging Markets Database, led by Farida Khambata, began publishing data on smaller markets. Khambata coined the term for this set of indices. Back then, there were few investment opportunities in frontier markets, and even investing in emerging-market countries such as Brazil and Russia was considered foreign. Things have definitely changed since then, with emerging and frontier markets at the forefront of driving global growth over recent years.
Frontier markets are still associated with much smaller countries that are investable but have lower market capitalisation and liquidity than the more developed emerging markets. Within frontier markets, Africa is often called “the final frontier”. In Africa, only South Africa, Egypt and Morocco are classified as emerging markets with most other countries classified as frontier markets.
Many factors make the African continent an attractive destination for investors. Emerging and frontier markets typically have more favourable growth and population dynamics and in general have more moderate debt levels than developed markets. In addition Africa’s favourable demographic profile, rapid urbanisation, the rise of the African consumer and improving political outlook as well as governance frameworks all strengthen the case for investing in Africa.
With improved fiscal balances of governments, borrowing from central banks or from commercial banks is being replaced by government bond issuances. The rapid growth in the issuance of Eurobonds is testament that governments across the continent can now raise foreign debt with relative ease, which was unthinkable a few years ago. Private equity is another way for investors to access the Africa investment opportunity, especially in countries where a stock exchange or a bond market does not exist or is very small.
Frontier equity markets are typically pursued by investors seeking high, long-term returns and low correlations with other markets. Investing in frontier markets does, however, come with a certain amount of risk. They typically have more political risk, are less liquid, are less transparent, and face a host of social and governance challenges not typically associated with developed markets. Financial markets are also less developed, which creates challenges when trying to access them. There is also no generally accepted standard benchmark that can be used to evaluate manager performance.
Since 2008, foreign-exchange regulations have allowed South African retirement funds to invest 5% of their assets in Africa. This has led to greater interest in the African investment opportunity within the investment community. As a result of the positive trends across the African continent, many South African and foreign asset-management firms have set up funds that focus solely on investing in shares listed across the continent to meet the demand of institutional investors from around the globe.
Despite the risks and challenges, Africa as an investment destination has become a major theme within investment circles. Not surprisingly, a growing number of FTSE/JSE-listed companies have made large investment strides into the continent, particularly in the telecommunications, retail and mining sectors. A number of large multi-nationals are also expanding operations into Africa either through acquisitions or establishing offices on the continent.
Africa is a vast continent with a population of over one billion people, 54 countries, thousands of ethnic communities and languages and divergent systems of government and cultures. Investing in these markets thus requires a different type of skill set and an in-depth knowledge of political and economic factors affecting these countries.
Did you know?
Africa has 54 fully recognised countries, nine territories and two de facto independent states with limited or no recognition.
1 of 55
1. INTRODUCTION
The paper will cover the following aspects:
• SouthAfricanregulations• ThecaseforinvestinginAfrica,aswellastherisksinvolved• Thechanginglandscapeofinvestmentopportunitiesonthecontinent,includingthedevelopmentofthelisted
equity space, bond markets and trends in private equity• PerspectivesfromSouthAfricanassetmanagersofferinginvestmentproductsthatinvestinAfrica• TopicalissuestoconsiderwheninvestinginAfrica• ConsiderationsfortrusteesofSouthAfricanretirementfundsandthequestionstheyshouldbeaskingfund
managers
Did you know?
In terms of market capitalisation, stock markets in sub-Saharan Africa grew by 579% from 1992 to 2012, according to the World Bank
2 of 55
2. SOUTH AFRICAN REGULATIONS
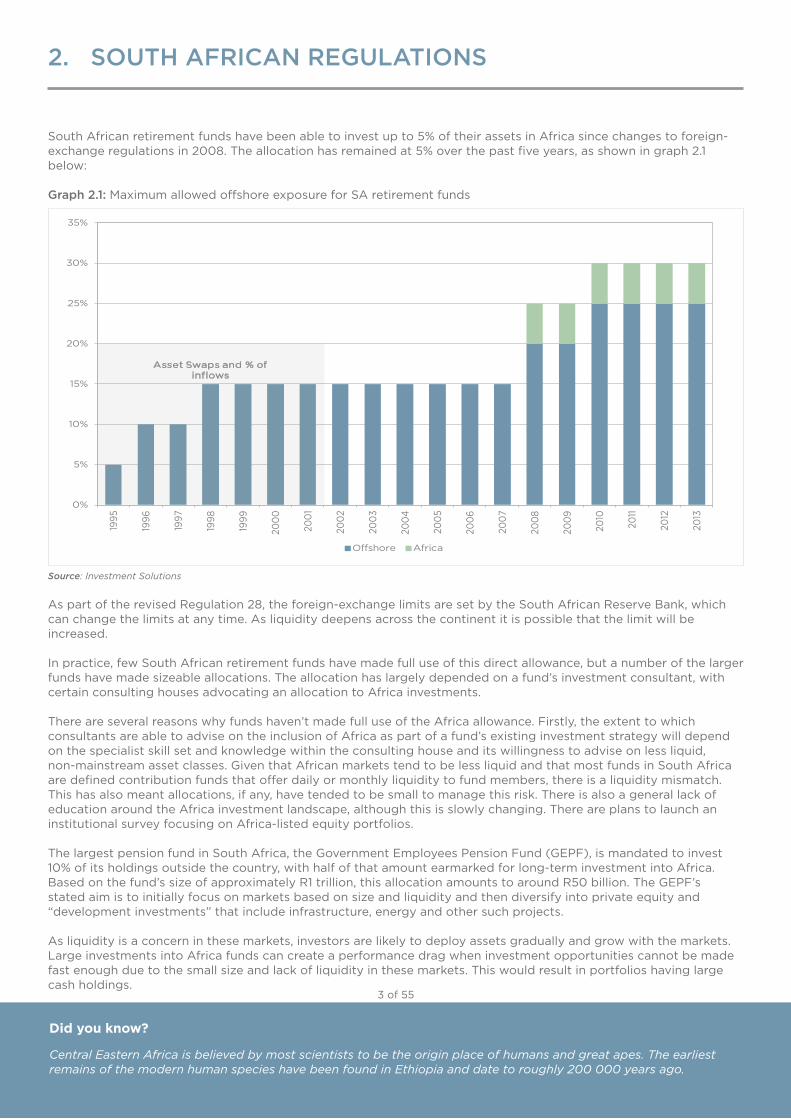
South African retirement funds have been able to invest up to 5% of their assets in Africa since changes to foreign-exchange regulations in 2008. The allocation has remained at 5% over the past five years, as shown in graph 2.1 below:
Graph 2.1: Maximum allowed offshore exposure for SA retirement funds
Source: Investment Solutions
As part of the revised Regulation 28, the foreign-exchange limits are set by the South African Reserve Bank, which can change the limits at any time. As liquidity deepens across the continent it is possible that the limit will be increased.
In practice, few South African retirement funds have made full use of this direct allowance, but a number of the larger funds have made sizeable allocations. The allocation has largely depended on a fund’s investment consultant, with certain consulting houses advocating an allocation to Africa investments.
There are several reasons why funds haven’t made full use of the Africa allowance. Firstly, the extent to which consultants are able to advise on the inclusion of Africa as part of a fund’s existing investment strategy will depend on the specialist skill set and knowledge within the consulting house and its willingness to advise on less liquid, non-mainstream asset classes. Given that African markets tend to be less liquid and that most funds in South Africa are defined contribution funds that offer daily or monthly liquidity to fund members, there is a liquidity mismatch. This has also meant allocations, if any, have tended to be small to manage this risk. There is also a general lack of education around the Africa investment landscape, although this is slowly changing. There are plans to launch an institutional survey focusing on Africa-listed equity portfolios.
The largest pension fund in South Africa, the Government Employees Pension Fund (GEPF), is mandated to invest 10% of its holdings outside the country, with half of that amount earmarked for long-term investment into Africa. Based on the fund’s size of approximately R1 trillion, this allocation amounts to around R50 billion. The GEPF’s stated aim is to initially focus on markets based on size and liquidity and then diversify into private equity and “development investments” that include infrastructure, energy and other such projects.
As liquidity is a concern in these markets, investors are likely to deploy assets gradually and grow with the markets. Large investments into Africa funds can create a performance drag when investment opportunities cannot be made fast enough due to the small size and lack of liquidity in these markets. This would result in portfolios having large cash holdings.
Asset Swaps and % of inflows
0%
5%
10%
15%
20%
25%
30%
35%
1995
1996
1997
1998
1999
2000
2001
2002
2003
2004
2005
2006
2007
2008
2009
2010
2011
2012
2013
Offshore Africa
Did you know?
Central Eastern Africa is believed by most scientists to be the origin place of humans and great apes. The earliest remains of the modern human species have been found in Ethiopia and date to roughly 200 000 years ago.
3 of 55
2. SOUTH AFRICAN REGULATIONS
In addition to making a direct allocation to Africa investments, South African investors gain exposure through FTSE/JSE-listed companies that have expanded onto the continent. Shares such as MTN, Shoprite and Standard Bank have meaningful exposure to operations outside South Africa.
Some retirement funds that use fully discretionary balanced mandates may have exposure to Africa through allocations by their asset managers. Managers such as Investec and Coronation were among the first to make allocations to Africa. More recently, Allan Gray has also made a small allocation. Initial allocations tend to be about 1% to 2%. The allocation through balanced mandates can often be advantageous as in some instances no performance fees are paid at the Africa fund level, but this will vary from manager to manager.
Investors that have made allocations have generally been handsomely rewarded as Africa (ex-South Africa) has been one of the best-performing regions in terms of stock market performance over the past 12 months to end June 2013. To date, most of the allocations to Africa have been in the listed equity space, although there is a growing trend towards allocations to bonds, particularly as capital markets develop, and less liquid asset classes such as private equity and agriculture.
Did you know?
Africa’s name is derived from an ancient area in modern-day Tunisia known as Ifriqiya, or sunny place, in Tamazight (a dialect indigenous to North Africa).
4 of 55
3. RATIONALE AND RISKS ASSOCIATED WITH INVESTING IN AFRICA
The rationale for investing in Africa has been well documented over recent years as it has become more popular with institutional investors. The reasons for investing in the continent include:
• Economicprospects(highgrowthandlowdebtlevels)• Demographicprofile• UrbanisationandtheriseoftheAfricanconsumer• Improvingpoliticalandpolicyoutlook,increasedproductivityandimprovinggovernanceframeworks
Each of these factors, together with the risks, will be discussed in more detail in the sections that follow.
3.1. ECONOMIC PROSPECTS
ECONOMIC GROWTH
The global economic recovery remains tepid, but it is expected to gradually strengthen. African countries, specifically sub-Saharan African countries, continue to grow at a strong pace, spurred by domestic demand and have benefited from high commodity prices in the past with economic prospects tilted to the upside. Economic output in sub-Saharan Africa expanded at nearly twice the global rate over the last decade and a number of African countries have been among the fastest-growing economies in the world during this period.
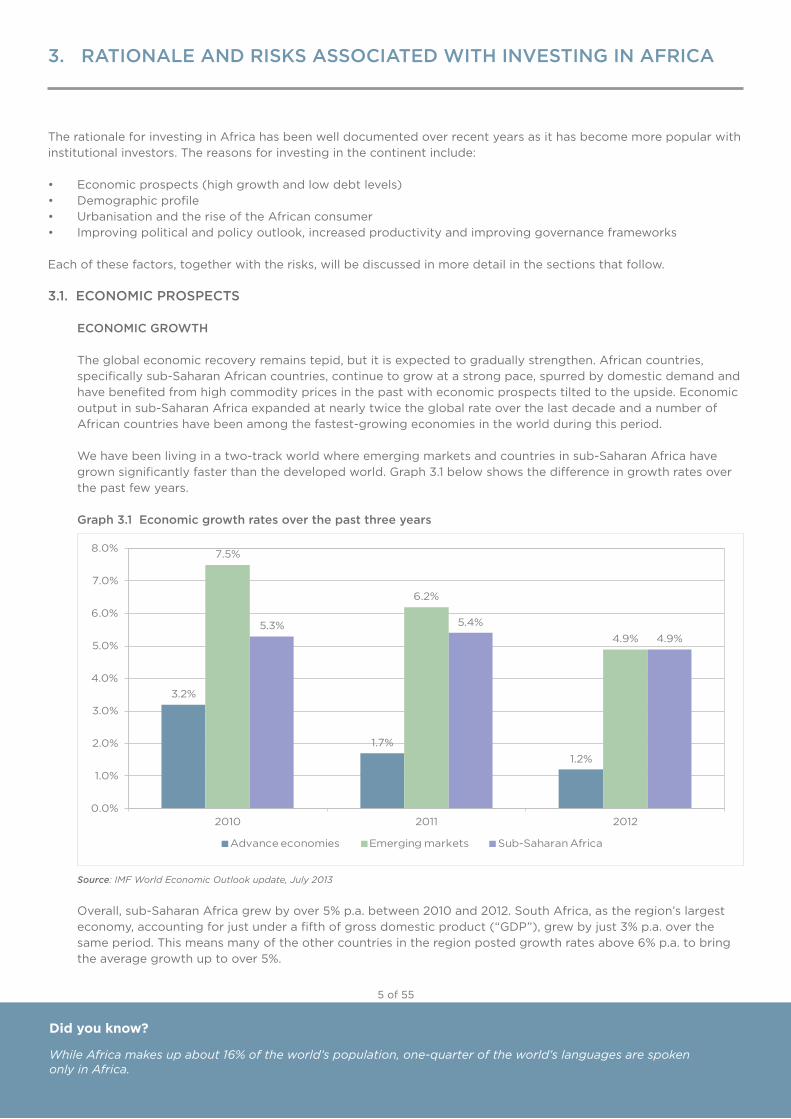
We have been living in a two-track world where emerging markets and countries in sub-Saharan Africa have grown significantly faster than the developed world. Graph 3.1 below shows the difference in growth rates over the past few years.
Graph 3.1 Economic growth rates over the past three years
Source: IMF World Economic Outlook update, July 2013
Overall, sub-Saharan Africa grew by over 5% p.a. between 2010 and 2012. South Africa, as the region’s largest economy, accounting for just under a fifth of gross domestic product (“GDP”), grew by just 3% p.a. over the same period. This means many of the other countries in the region posted growth rates above 6% p.a. to bring the average growth up to over 5%.
3.2%
1.7%1.2%
7.5%
6.2%
4.9%5.3% 5.4%
4.9%
0.0%
1.0%
2.0%
3.0%
4.0%
5.0%
6.0%
7.0%
8.0%
2010 2011 2012
Advance economies Emerging markets Sub-Saharan Africa
Did you know?
While Africa makes up about 16% of the world’s population, one-quarter of the world’s languages are spoken only in Africa.
5 of 55
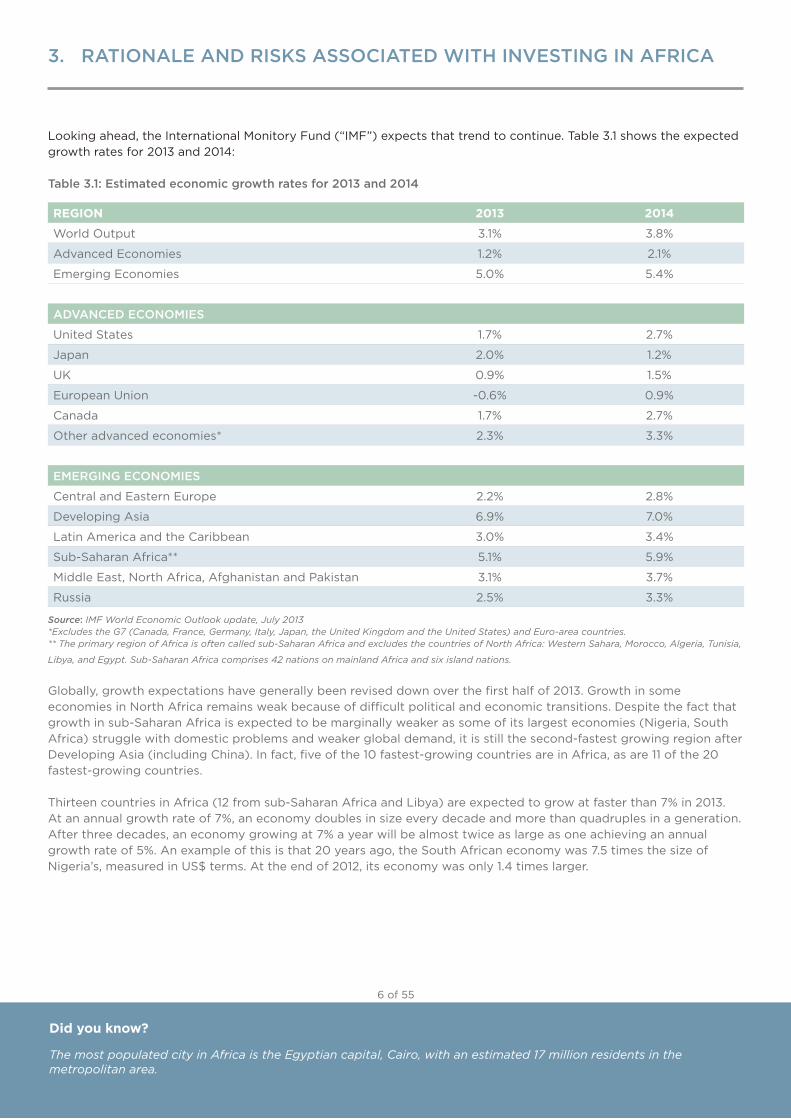
Looking ahead, the International Monitory Fund (“IMF”) expects that trend to continue. Table 3.1 shows the expected growth rates for 2013 and 2014:
Table 3.1: Estimated economic growth rates for 2013 and 2014
REGION 2013 2014
World Output 3.1% 3.8%
Advanced Economies 1.2% 2.1%
Emerging Economies 5.0% 5.4%
ADVANCED ECONOMIES
UnitedStates 1.7% 2.7%
Japan 2.0% 1.2%
UK 0.9% 1.5%
EuropeanUnion -0.6% 0.9%
Canada 1.7% 2.7%
Other advanced economies* 2.3% 3.3%
EMERGING ECONOMIES
Central and Eastern Europe 2.2% 2.8%
Developing Asia 6.9% 7.0%
Latin America and the Caribbean 3.0% 3.4%
Sub-Saharan Africa** 5.1% 5.9%
Middle East, North Africa, Afghanistan and Pakistan 3.1% 3.7%
Russia 2.5% 3.3%
Source: IMF World Economic Outlook update, July 2013*Excludes the G7 (Canada, France, Germany, Italy, Japan, the United Kingdom and the United States) and Euro-area countries.** The primary region of Africa is often called sub-Saharan Africa and excludes the countries of North Africa: Western Sahara, Morocco, Algeria, Tunisia,
Libya, and Egypt. Sub-Saharan Africa comprises 42 nations on mainland Africa and six island nations.
Globally, growth expectations have generally been revised down over the first half of 2013. Growth in some economies in North Africa remains weak because of difficult political and economic transitions. Despite the fact that growth in sub-Saharan Africa is expected to be marginally weaker as some of its largest economies (Nigeria, South Africa) struggle with domestic problems and weaker global demand, it is still the second-fastest growing region after Developing Asia (including China). In fact, five of the 10 fastest-growing countries are in Africa, as are 11 of the 20 fastest-growing countries.
Thirteen countries in Africa (12 from sub-Saharan Africa and Libya) are expected to grow at faster than 7% in 2013. At an annual growth rate of 7%, an economy doubles in size every decade and more than quadruples in a generation. After three decades, an economy growing at 7% a year will be almost twice as large as one achieving an annual growth rate of 5%. An example of this is that 20 years ago, the South African economy was 7.5 times the size of Nigeria’s,measuredinUS$terms.Attheendof2012,itseconomywasonly1.4timeslarger.
Did you know?
The most populated city in Africa is the Egyptian capital, Cairo, with an estimated 17 million residents in the metropolitan area.
6 of 55
3. RATIONALE AND RISKS ASSOCIATED WITH INVESTING IN AFRICA
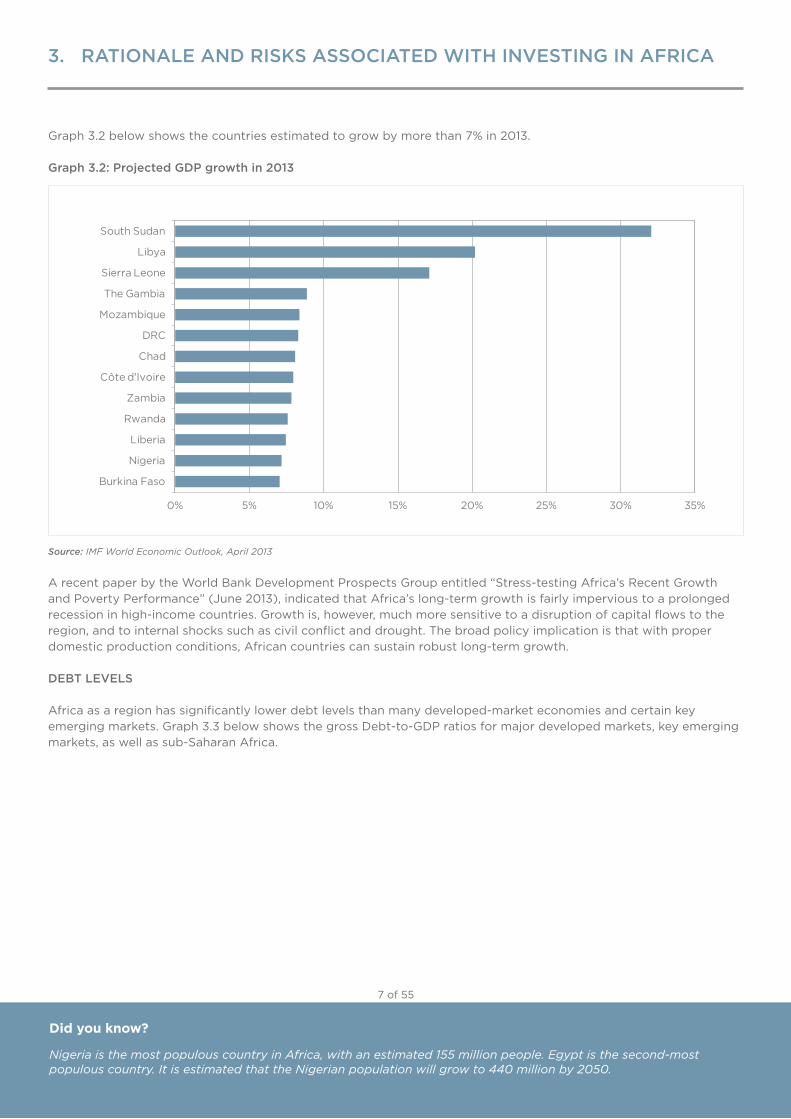
Graph 3.2 below shows the countries estimated to grow by more than 7% in 2013.
Graph 3.2: Projected GDP growth in 2013
Source: IMF World Economic Outlook, April 2013
A recent paper by the World Bank Development Prospects Group entitled “Stress-testing Africa’s Recent Growth and Poverty Performance” (June 2013), indicated that Africa’s long-term growth is fairly impervious to a prolonged recession in high-income countries. Growth is, however, much more sensitive to a disruption of capital flows to the region, and to internal shocks such as civil conflict and drought. The broad policy implication is that with proper domestic production conditions, African countries can sustain robust long-term growth.
DEBT LEVELS
Africa as a region has significantly lower debt levels than many developed-market economies and certain key emerging markets. Graph 3.3 below shows the gross Debt-to-GDP ratios for major developed markets, key emerging markets, as well as sub-Saharan Africa.
Did you know?
Nigeria is the most populous country in Africa, with an estimated 155 million people. Egypt is the second-most populous country. It is estimated that the Nigerian population will grow to 440 million by 2050.
0% 5% 10% 15% 20% 25% 30% 35%
South Sudan
Libya
Sierra Leone
The Gambia
Mozambique
DRC
Chad
Côte d'Ivoire
Zambia
Rwanda
Liberia
Nigeria
Burkina Faso
7 of 55
3. RATIONALE AND RISKS ASSOCIATED WITH INVESTING IN AFRICA
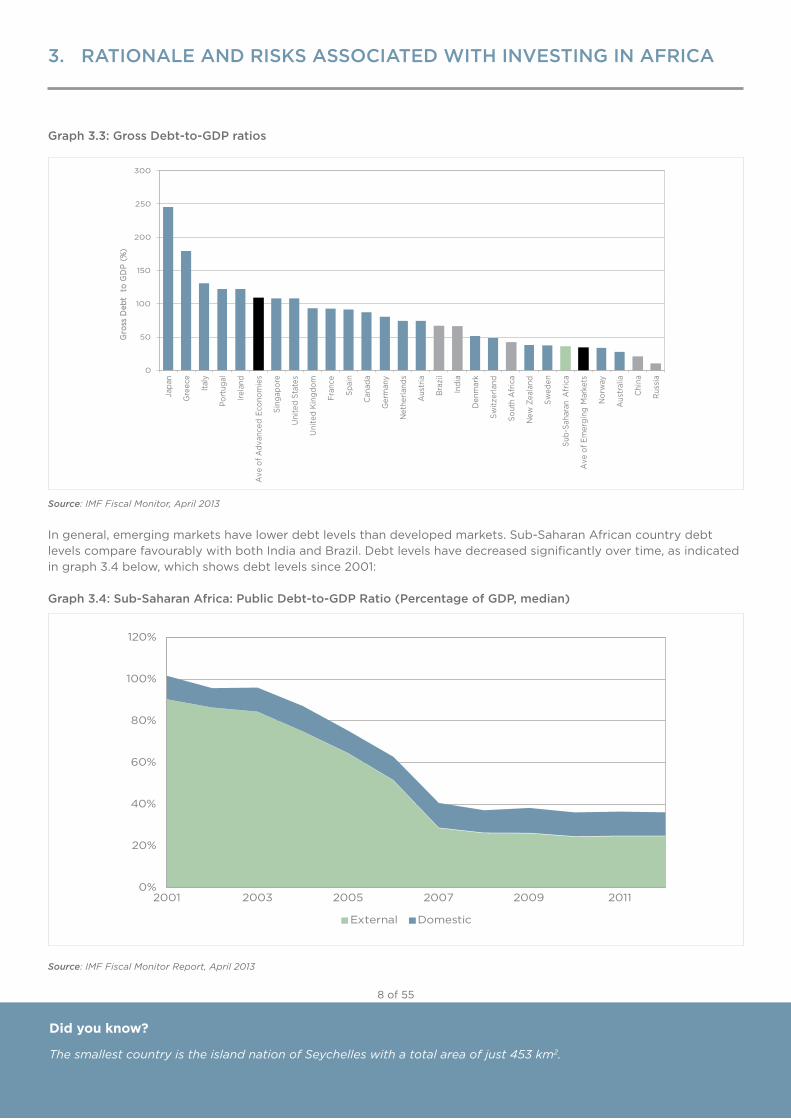
Graph 3.3: Gross Debt-to-GDP ratios
Source: IMF Fiscal Monitor, April 2013
In general, emerging markets have lower debt levels than developed markets. Sub-Saharan African country debt levels compare favourably with both India and Brazil. Debt levels have decreased significantly over time, as indicated in graph 3.4 below, which shows debt levels since 2001:
Graph 3.4: Sub-Saharan Africa: Public Debt-to-GDP Ratio (Percentage of GDP, median)
Source: IMF Fiscal Monitor Report, April 2013
Did you know?
The smallest country is the island nation of Seychelles with a total area of just 453 km2.
0%
20%
40%
60%
80%
100%
120%
2001 2003 2005 2007 2009 2011
External Domestic
8 of 55
0
50
100
150
200
250
300Ja
pan
Gre
ece
Italy
Port
ugal
Irela
nd
Ave
of A
dvan
ced
Econ
omie
s
Sing
apor
e
UnitedStates
UnitedKingd
om
Fran
ce
Spai
n
Can
ada
Ger
man
y
Net
herla
nds
Aus
tria
Bra
zil
Indi
a
Den
mar
k
Switz
erla
nd
Sout
h A
fric
a
New
Zea
land
Swed
en
Sub-
Saha
ran
Afr
ica
Ave
of E
mer
ging
Mar
kets
Nor
way
Aus
tral
ia
Chi
na
Rus
sia
Gro
ss D
ebt
to
GD
P (
%)
3. RATIONALE AND RISKS ASSOCIATED WITH INVESTING IN AFRICA
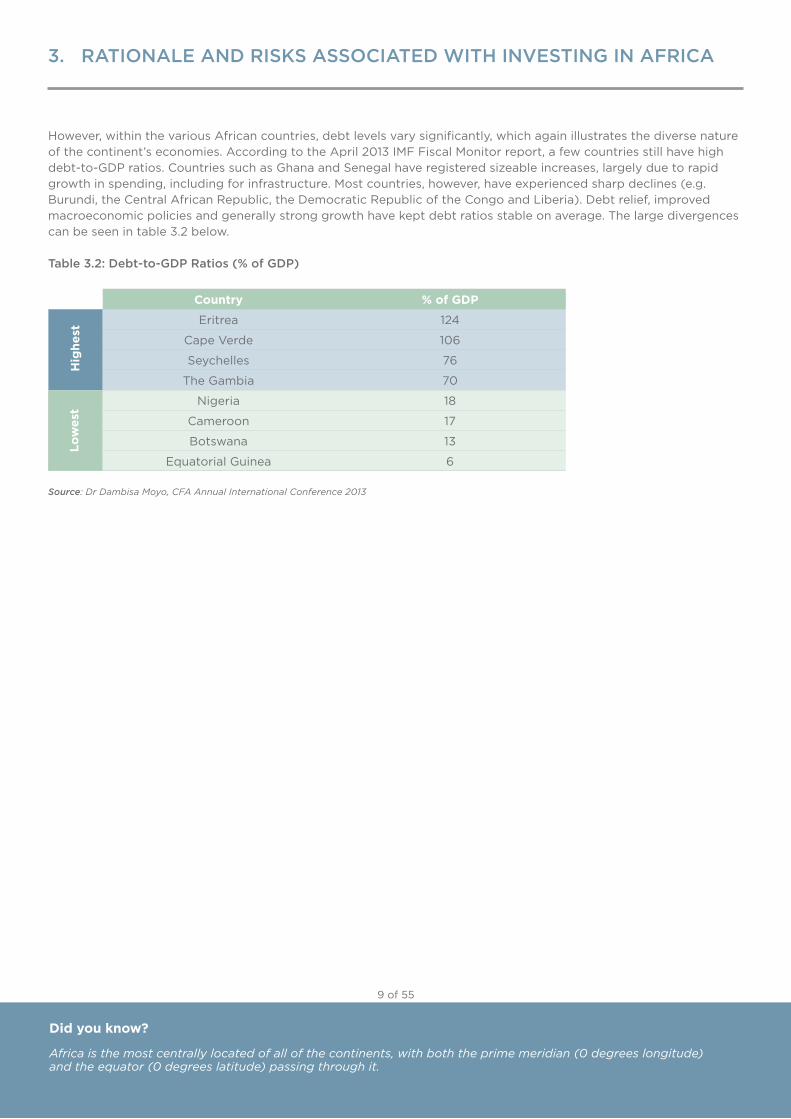
However, within the various African countries, debt levels vary significantly, which again illustrates the diverse nature of the continent’s economies. According to the April 2013 IMF Fiscal Monitor report, a few countries still have high debt-to-GDP ratios. Countries such as Ghana and Senegal have registered sizeable increases, largely due to rapid growth in spending, including for infrastructure. Most countries, however, have experienced sharp declines (e.g. Burundi, the Central African Republic, the Democratic Republic of the Congo and Liberia). Debt relief, improved macroeconomic policies and generally strong growth have kept debt ratios stable on average. The large divergences can be seen in table 3.2 below.
Table 3.2: Debt-to-GDP Ratios (% of GDP)
Country % of GDP
Eritrea 124
Cape Verde 106
Seychelles 76
The Gambia 70
Nigeria 18
Cameroon 17
Botswana 13
Equatorial Guinea 6
Source: Dr Dambisa Moyo, CFA Annual International Conference 2013
Hig
hest
Low
est
Did you know?
Africa is the most centrally located of all of the continents, with both the prime meridian (0 degrees longitude) and the equator (0 degrees latitude) passing through it.
9 of 55
3. RATIONALE AND RISKS ASSOCIATED WITH INVESTING IN AFRICA
3.2. DEMOGRAPHIC PROFILE
A growing labour force, rapid urbanisation and a growing middle class are demographic shifts helping African countries to continue to grow despite low global economic growth. These trends will also help transform Africa from a commodities-led growth story to a consumer-led one.
While most of the developed world is concerned about ageing and shrinking populations, Africa’s population is young, continues to grow and thus offers huge potential in terms of population dynamics. Africa is home to one billion people, accounting for about 15% of the world’s population, and the IMF expects 18% of the world’s people to live in Africa by 2030.
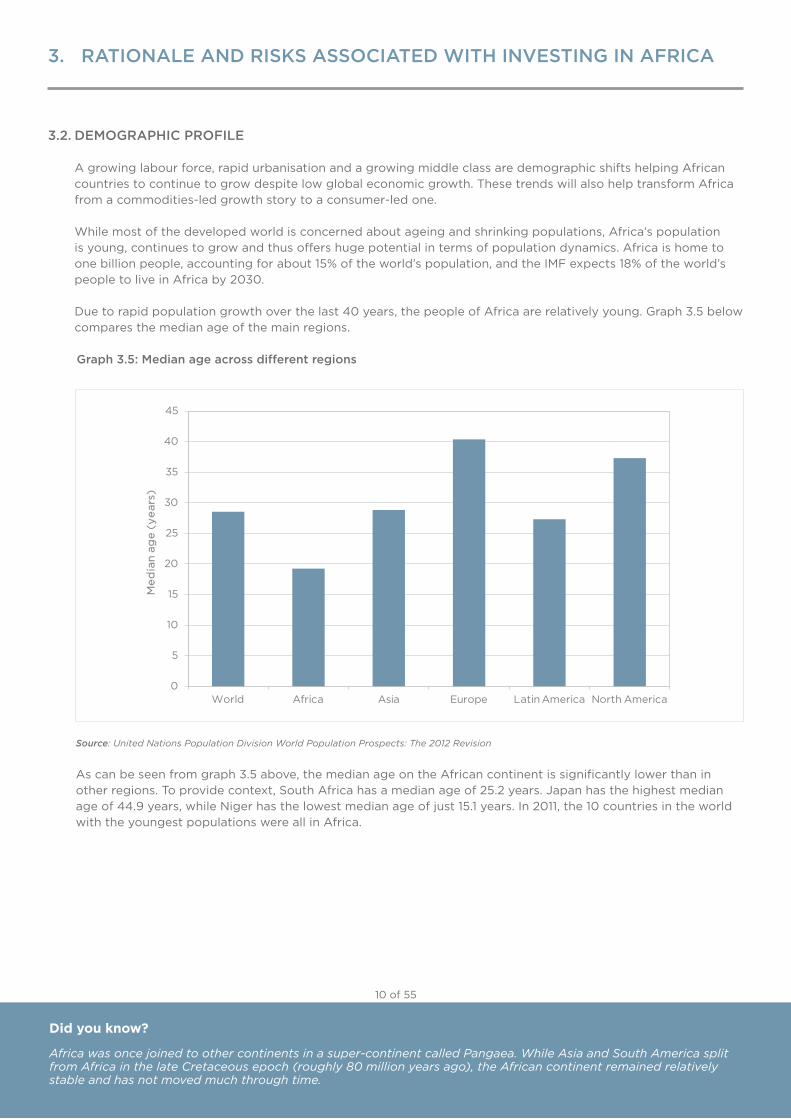
Due to rapid population growth over the last 40 years, the people of Africa are relatively young. Graph 3.5 below compares the median age of the main regions.
Graph 3.5: Median age across different regions
Source: United Nations Population Division World Population Prospects: The 2012 Revision
As can be seen from graph 3.5 above, the median age on the African continent is significantly lower than in other regions. To provide context, South Africa has a median age of 25.2 years. Japan has the highest median age of 44.9 years, while Niger has the lowest median age of just 15.1 years. In 2011, the 10 countries in the world with the youngest populations were all in Africa.
Did you know?
Africa was once joined to other continents in a super-continent called Pangaea. While Asia and South America split from Africa in the late Cretaceous epoch (roughly 80 million years ago), the African continent remained relatively stable and has not moved much through time.
0
5
10
15
20
25
30
35
40
45
World Africa Asia Europe Latin America North America
Me
dia
n a
ge
(y
ear
s)
10 of 55
3. RATIONALE AND RISKS ASSOCIATED WITH INVESTING IN AFRICA
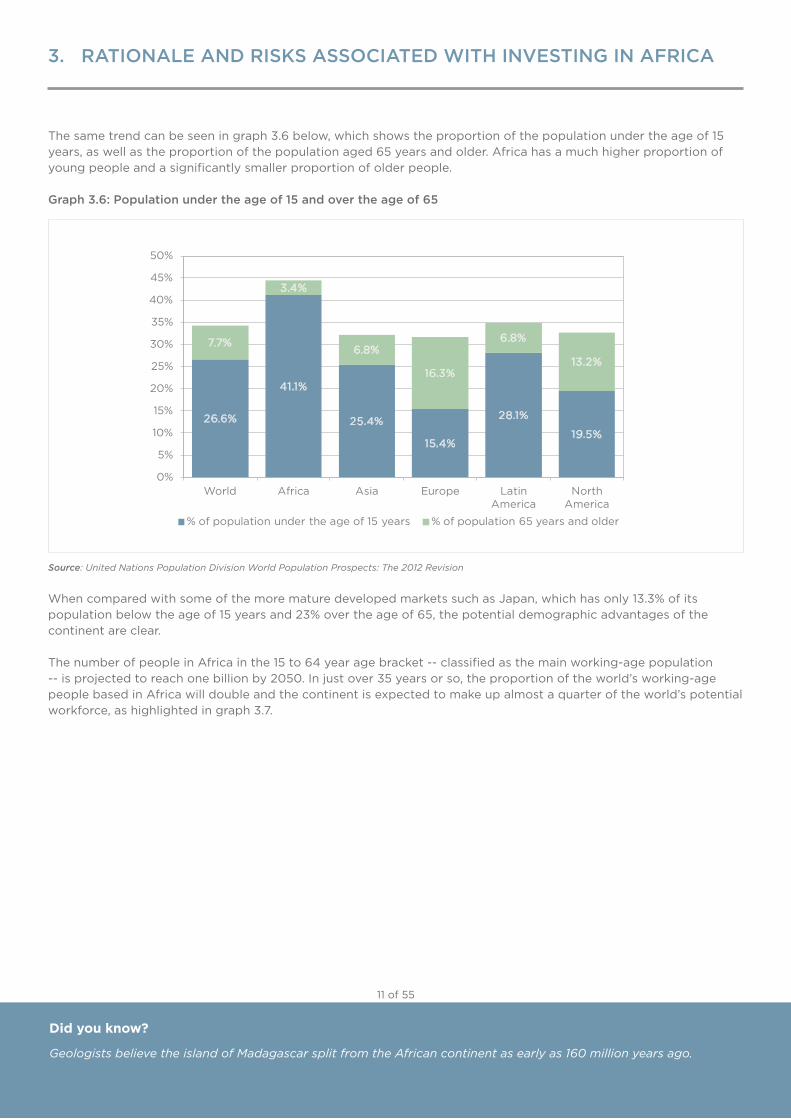
The same trend can be seen in graph 3.6 below, which shows the proportion of the population under the age of 15 years, as well as the proportion of the population aged 65 years and older. Africa has a much higher proportion of young people and a significantly smaller proportion of older people.
Graph 3.6: Population under the age of 15 and over the age of 65
Source: United Nations Population Division World Population Prospects: The 2012 Revision
When compared with some of the more mature developed markets such as Japan, which has only 13.3% of its population below the age of 15 years and 23% over the age of 65, the potential demographic advantages of the continent are clear.
The number of people in Africa in the 15 to 64 year age bracket -- classified as the main working-age population -- is projected to reach one billion by 2050. In just over 35 years or so, the proportion of the world’s working-age people based in Africa will double and the continent is expected to make up almost a quarter of the world’s potential workforce, as highlighted in graph 3.7.
Did you know?
Geologists believe the island of Madagascar split from the African continent as early as 160 million years ago.
26.6%
41.1%
25.4%
15.4%
28.1%
19.5%
7.7%
3.4%
6.8%
16.3%
6.8%
13.2%
0%
5%
10%
15%
20%
25%
30%
35%
40%
45%
50%
World Africa Asia Europe Latin America
North America
% of population under the age of 15 years % of population 65 years and older
11 of 55
3. RATIONALE AND RISKS ASSOCIATED WITH INVESTING IN AFRICA
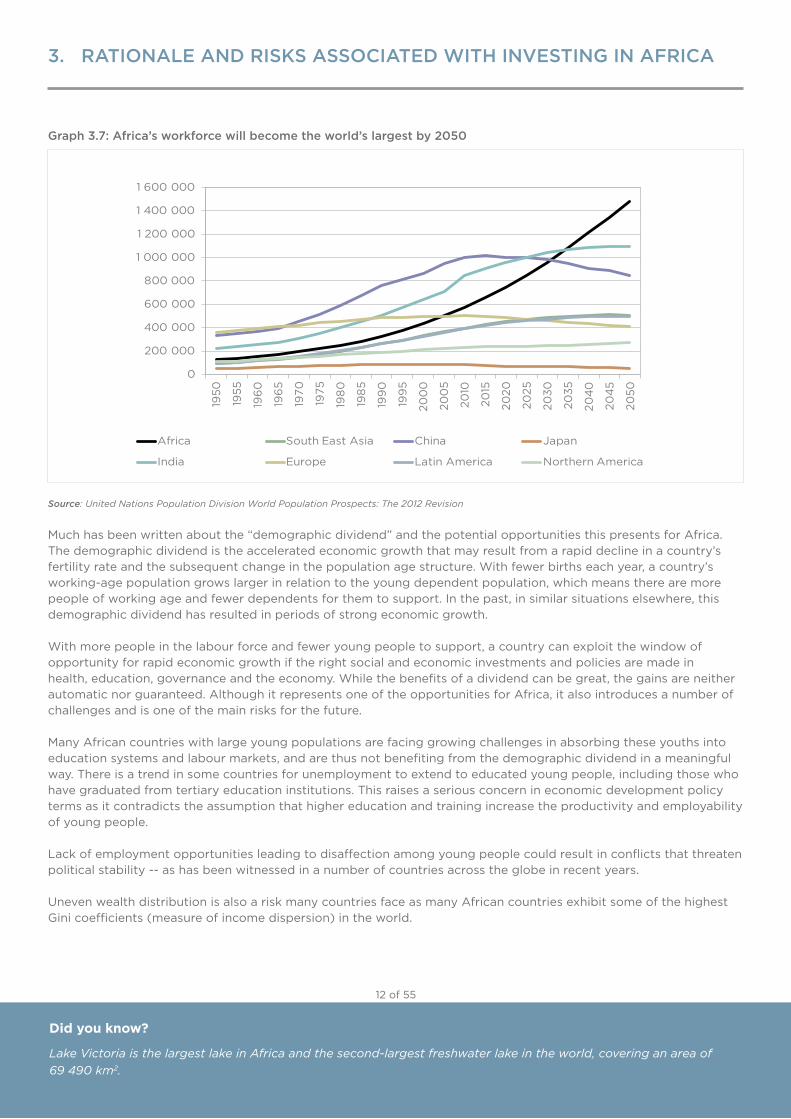
Graph 3.7: Africa’s workforce will become the world’s largest by 2050
Source: United Nations Population Division World Population Prospects: The 2012 Revision
Much has been written about the “demographic dividend” and the potential opportunities this presents for Africa. The demographic dividend is the accelerated economic growth that may result from a rapid decline in a country’s fertility rate and the subsequent change in the population age structure. With fewer births each year, a country’s working-age population grows larger in relation to the young dependent population, which means there are more people of working age and fewer dependents for them to support. In the past, in similar situations elsewhere, this demographic dividend has resulted in periods of strong economic growth.
With more people in the labour force and fewer young people to support, a country can exploit the window of opportunity for rapid economic growth if the right social and economic investments and policies are made in health, education, governance and the economy. While the benefits of a dividend can be great, the gains are neither automatic nor guaranteed. Although it represents one of the opportunities for Africa, it also introduces a number of challenges and is one of the main risks for the future.
Many African countries with large young populations are facing growing challenges in absorbing these youths into education systems and labour markets, and are thus not benefiting from the demographic dividend in a meaningful way. There is a trend in some countries for unemployment to extend to educated young people, including those who have graduated from tertiary education institutions. This raises a serious concern in economic development policy terms as it contradicts the assumption that higher education and training increase the productivity and employability of young people.
Lack of employment opportunities leading to disaffection among young people could result in conflicts that threaten political stability -- as has been witnessed in a number of countries across the globe in recent years.
UnevenwealthdistributionisalsoariskmanycountriesfaceasmanyAfricancountriesexhibitsomeofthehighestGini coefficients (measure of income dispersion) in the world.
Did you know?
Lake Victoria is the largest lake in Africa and the second-largest freshwater lake in the world, covering an area of 69 490 km2.
0
200 000
400 000
600 000
800 000
1 000 000
1 200 000
1 400 000
1 600 000
1950
1955
196
0
196
5
1970
1975
198
0
198
5
199
0
199
5
200
0
200
5
2010
2015
2020
2025
2030
2035
204
0
204
5
2050
Africa South East Asia China Japan
India Europe Latin America Northern America
12 of 55
3. RATIONALE AND RISKS ASSOCIATED WITH INVESTING IN AFRICA
3.3. URBANISATION AND THE RISE OF THE AFRICAN CONSUMER
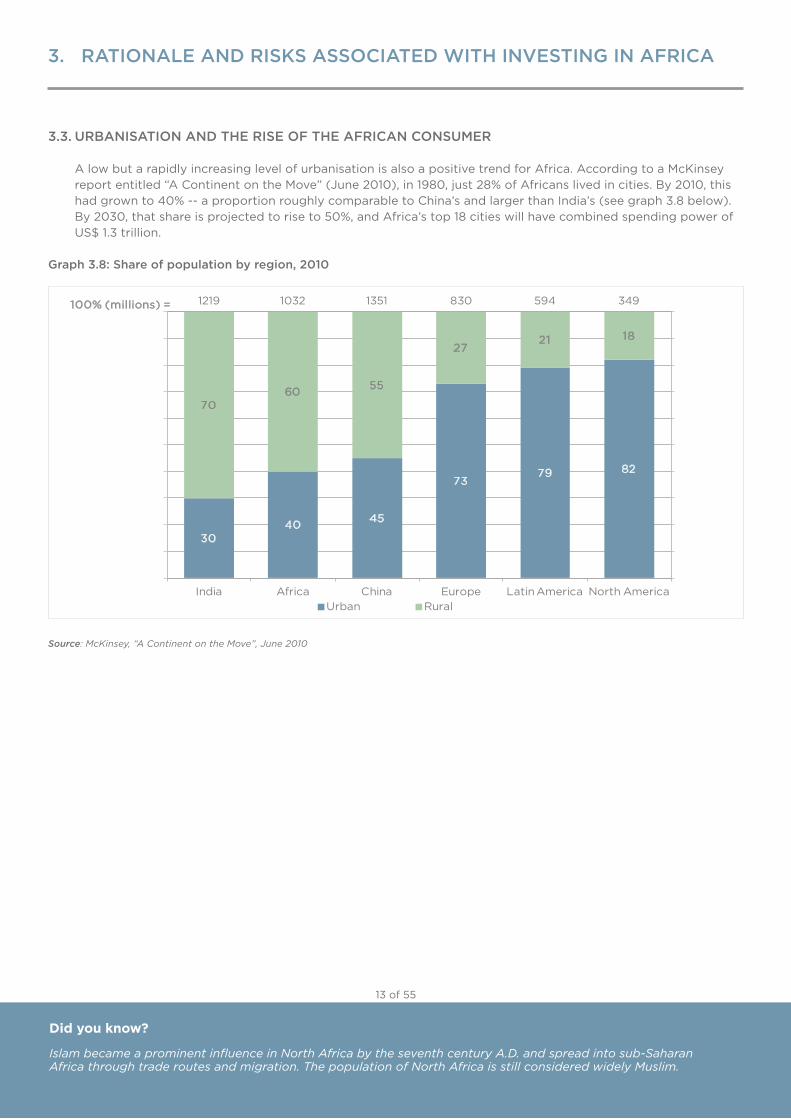
A low but a rapidly increasing level of urbanisation is also a positive trend for Africa. According to a McKinsey report entitled “A Continent on the Move” (June 2010), in 1980, just 28% of Africans lived in cities. By 2010, this had grown to 40% -- a proportion roughly comparable to China’s and larger than India’s (see graph 3.8 below). By 2030, that share is projected to rise to 50%, and Africa’s top 18 cities will have combined spending power of US$1.3trillion.
Graph 3.8: Share of population by region, 2010
Source: McKinsey, “A Continent on the Move”, June 2010
Did you know?
Islam became a prominent influence in North Africa by the seventh century A.D. and spread into sub-Saharan Africa through trade routes and migration. The population of North Africa is still considered widely Muslim.
3040 45
7379 82
7060 55
2721 18
1219 1032 1351 830 594 349
0
10
20
30
40
50
60
70
80
90
100
0%
10%
20%
30%
40%
50%
60%
70%
80%
90%
100%
India Africa China Europe Latin America North AmericaUrban Rural
100% (millions) =
13 of 55
3. RATIONALE AND RISKS ASSOCIATED WITH INVESTING IN AFRICA
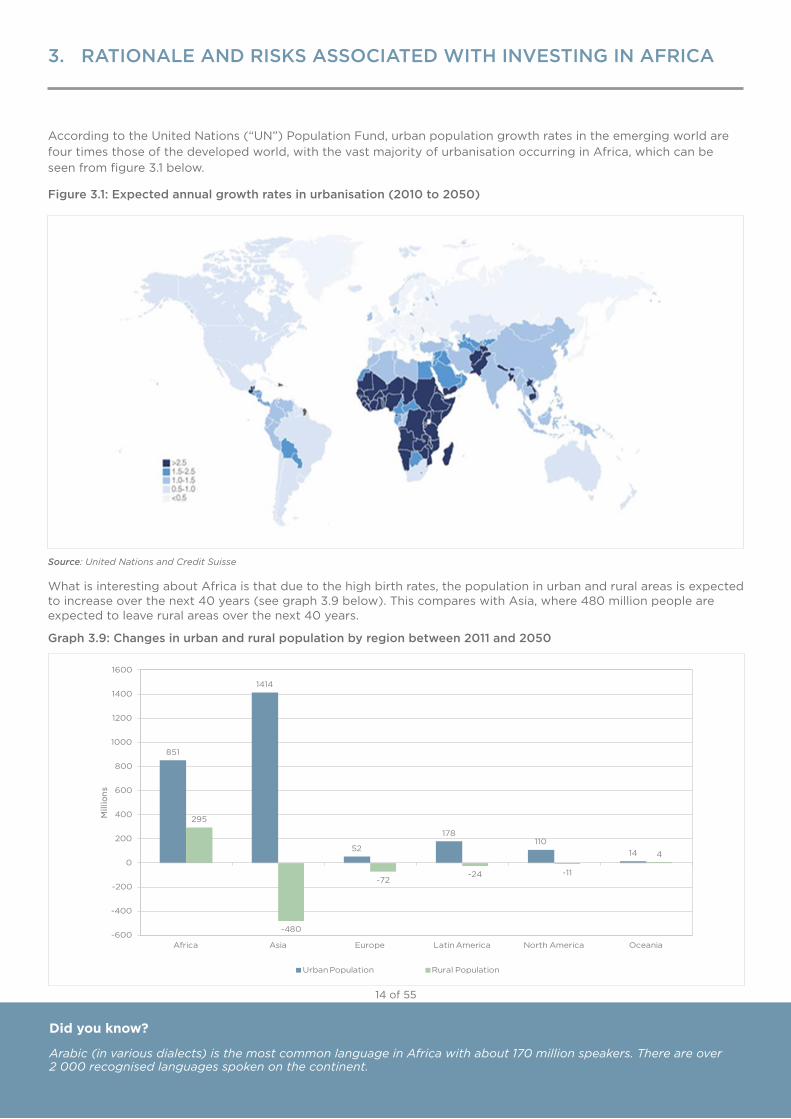
AccordingtotheUnitedNations(“UN”)PopulationFund,urbanpopulationgrowthratesintheemergingworldarefour times those of the developed world, with the vast majority of urbanisation occurring in Africa, which can be seen from figure 3.1 below.
Figure 3.1: Expected annual growth rates in urbanisation (2010 to 2050)
Source: United Nations and Credit Suisse
What is interesting about Africa is that due to the high birth rates, the population in urban and rural areas is expected to increase over the next 40 years (see graph 3.9 below). This compares with Asia, where 480 million people are expected to leave rural areas over the next 40 years.
Graph 3.9: Changes in urban and rural population by region between 2011 and 2050
Did you know?
Arabic (in various dialects) is the most common language in Africa with about 170 million speakers. There are over 2 000 recognised languages spoken on the continent.
851
1414
52
178110
14
295
-480
-72-24 -11
4
-600
-400
-200
0
200
400
600
800
1000
1200
1400
1600
Africa Asia Europe Latin America North America Oceania
Mill
ions
UrbanPopulation Rural Population
14 of 55
3. RATIONALE AND RISKS ASSOCIATED WITH INVESTING IN AFRICA
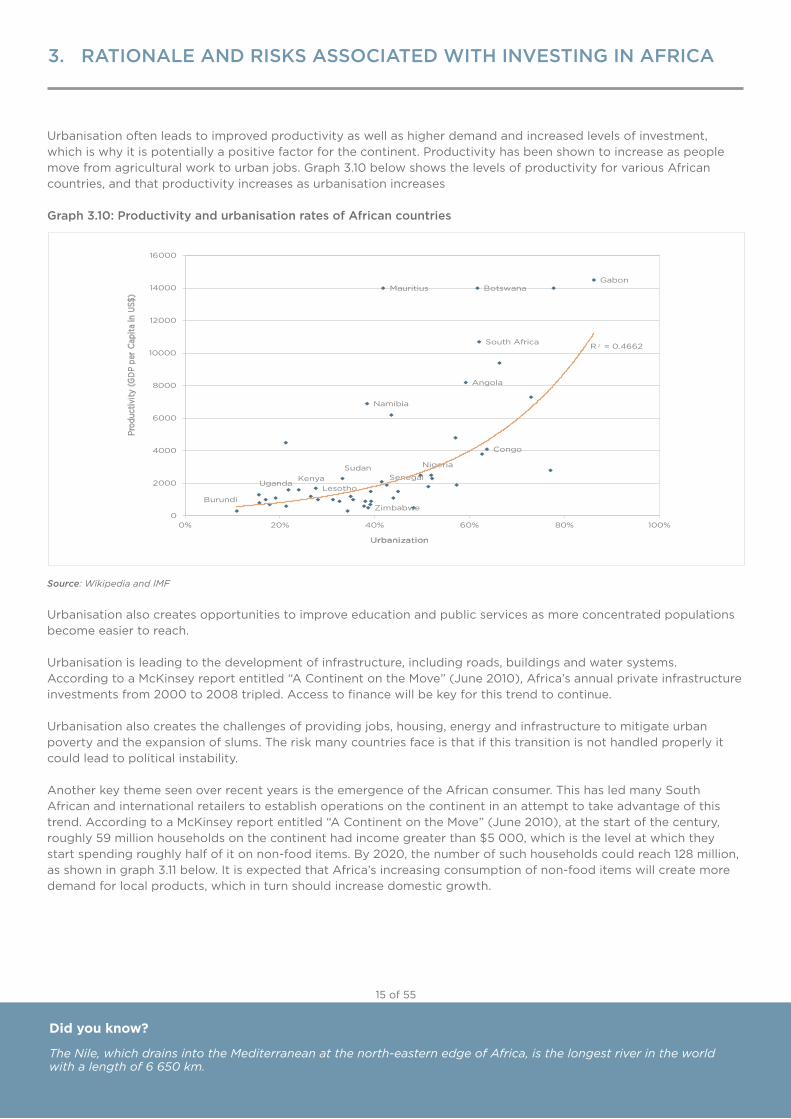
Urbanisationoftenleadstoimprovedproductivityaswellashigherdemandandincreasedlevelsofinvestment,which is why it is potentially a positive factor for the continent. Productivity has been shown to increase as people move from agricultural work to urban jobs. Graph 3.10 below shows the levels of productivity for various African countries, and that productivity increases as urbanisation increases
Graph 3.10: Productivity and urbanisation rates of African countries
Source: Wikipedia and IMF
Urbanisationalsocreatesopportunitiestoimproveeducationandpublicservicesasmoreconcentratedpopulationsbecome easier to reach.
Urbanisationisleadingtothedevelopmentofinfrastructure,includingroads,buildingsandwatersystems.According to a McKinsey report entitled “A Continent on the Move” (June 2010), Africa’s annual private infrastructure investments from 2000 to 2008 tripled. Access to finance will be key for this trend to continue.
Urbanisationalsocreatesthechallengesofprovidingjobs,housing,energyandinfrastructuretomitigateurbanpoverty and the expansion of slums. The risk many countries face is that if this transition is not handled properly it could lead to political instability.
Another key theme seen over recent years is the emergence of the African consumer. This has led many South African and international retailers to establish operations on the continent in an attempt to take advantage of this trend. According to a McKinsey report entitled “A Continent on the Move” (June 2010), at the start of the century, roughly59millionhouseholdsonthecontinenthadincomegreaterthan$5000,whichisthelevelatwhichtheystart spending roughly half of it on non-food items. By 2020, the number of such households could reach 128 million, as shown in graph 3.11 below. It is expected that Africa’s increasing consumption of non-food items will create more demand for local products, which in turn should increase domestic growth.
Did you know?
The Nile, which drains into the Mediterranean at the north-eastern edge of Africa, is the longest river in the world with a length of 6 650 km.
GabonMauritius Botswana
South Africa
Angola
Namibia
Congo
NigeriaSudanSenegal
LesothoKenya
Uganda
ZimbabweBurundi
R² = 0.4662
0
2000
4000
6000
8000
10000
12000
14000
16000
0% 20% 40% 60% 80% 100%
Prod
uctiv
ity(GDPperCapita
inUS$)
Urbanization
15 of 55
3. RATIONALE AND RISKS ASSOCIATED WITH INVESTING IN AFRICA
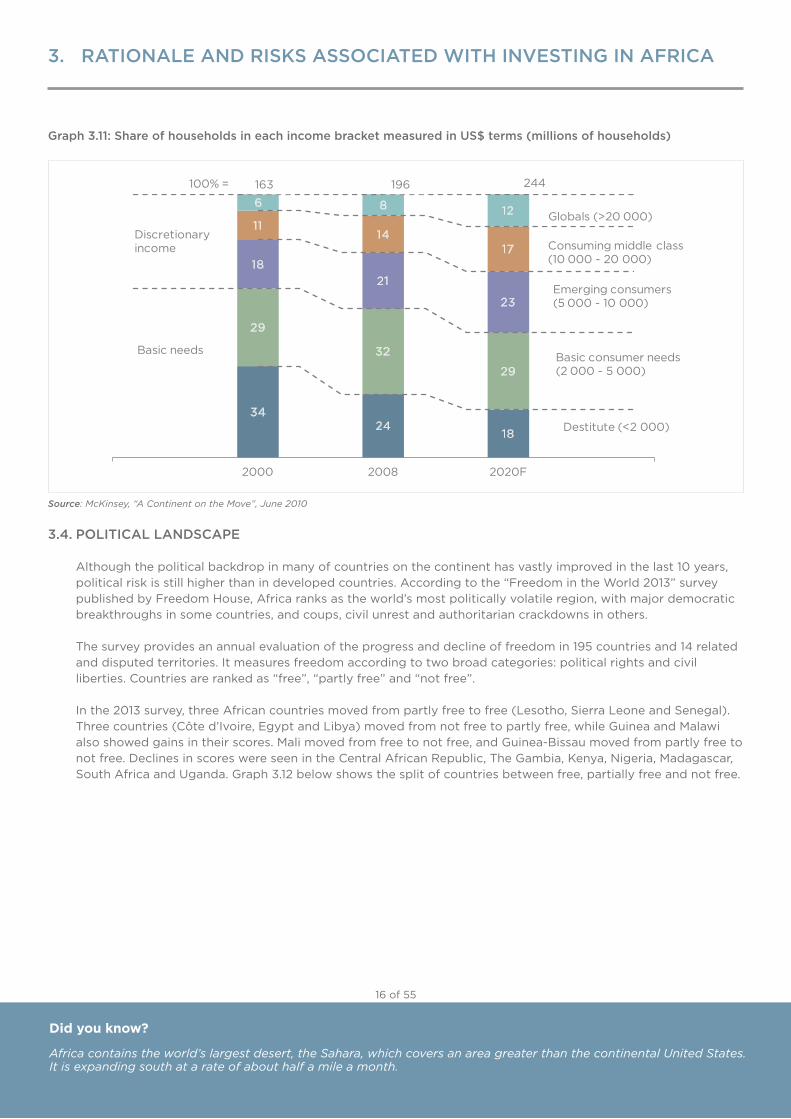
Graph 3.11: Share of households in each income bracket measured in US$ terms (millions of households)
Source: McKinsey, “A Continent on the Move”, June 2010
3.4. POLITICAL LANDSCAPE
Although the political backdrop in many of countries on the continent has vastly improved in the last 10 years, political risk is still higher than in developed countries. According to the “Freedom in the World 2013” survey published by Freedom House, Africa ranks as the world’s most politically volatile region, with major democratic breakthroughs in some countries, and coups, civil unrest and authoritarian crackdowns in others.
The survey provides an annual evaluation of the progress and decline of freedom in 195 countries and 14 related and disputed territories. It measures freedom according to two broad categories: political rights and civil liberties. Countries are ranked as “free”, “partly free” and “not free”.
In the 2013 survey, three African countries moved from partly free to free (Lesotho, Sierra Leone and Senegal). Three countries (Côte d’Ivoire, Egypt and Libya) moved from not free to partly free, while Guinea and Malawi also showed gains in their scores. Mali moved from free to not free, and Guinea-Bissau moved from partly free to not free. Declines in scores were seen in the Central African Republic, The Gambia, Kenya, Nigeria, Madagascar, SouthAfricaandUganda.Graph3.12belowshowsthesplitofcountriesbetweenfree,partiallyfreeandnotfree.
Did you know?
Africa contains the world’s largest desert, the Sahara, which covers an area greater than the continental United States. It is expanding south at a rate of about half a mile a month.
3424
18
29
32
29
1821
23
1114
17
6 8 12
2000 2008 2020F
Consuming middle class(10 000 - 20 000)
Emerging consumers (5 000 - 10 000)
Basic consumer needs (2 000 - 5 000)
Destitute (<2 000)
Globals (>20 000)
163 196 244100% =
Discretionary income
Basic needs
16 of 55
3. RATIONALE AND RISKS ASSOCIATED WITH INVESTING IN AFRICA
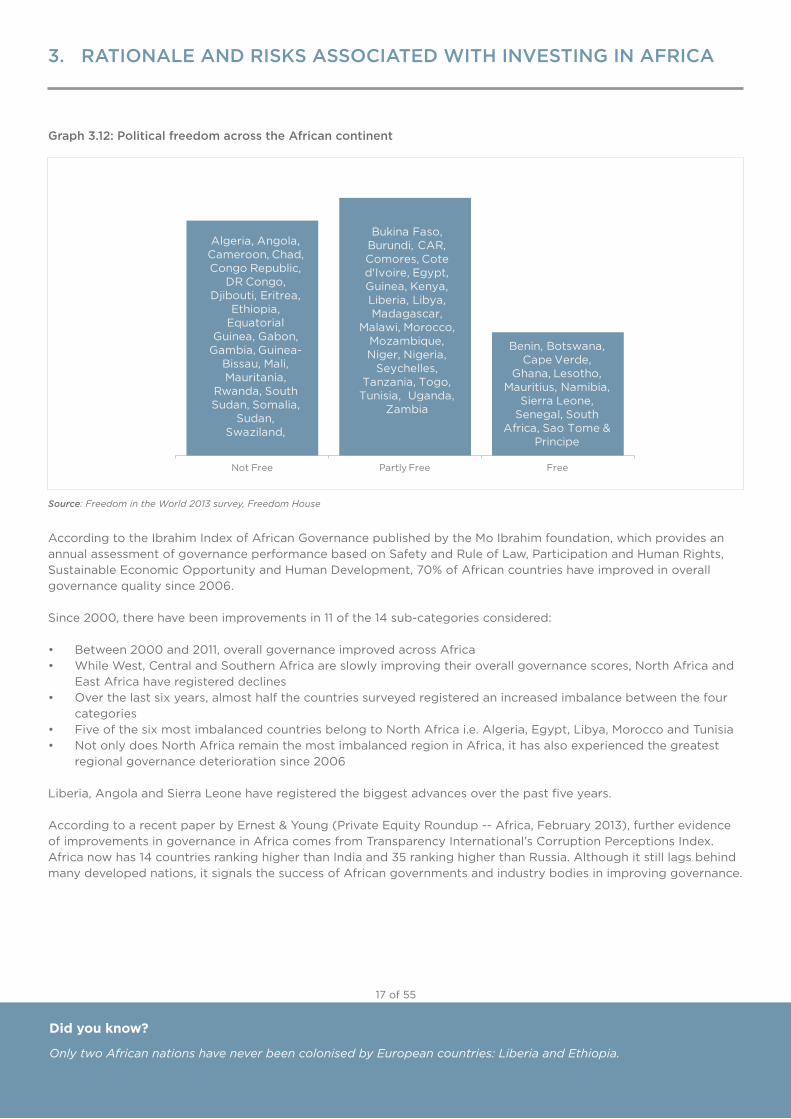
Graph 3.12: Political freedom across the African continent
Source: Freedom in the World 2013 survey, Freedom House
According to the Ibrahim Index of African Governance published by the Mo Ibrahim foundation, which provides an annual assessment of governance performance based on Safety and Rule of Law, Participation and Human Rights, Sustainable Economic Opportunity and Human Development, 70% of African countries have improved in overall governance quality since 2006.
Since 2000, there have been improvements in 11 of the 14 sub-categories considered:
• Between2000and2011,overallgovernanceimprovedacrossAfrica• WhileWest,CentralandSouthernAfricaareslowlyimprovingtheiroverallgovernancescores,NorthAfricaand
East Africa have registered declines• Overthelastsixyears,almosthalfthecountriessurveyedregisteredanincreasedimbalancebetweenthefour
categories• FiveofthesixmostimbalancedcountriesbelongtoNorthAfricai.e.Algeria,Egypt,Libya,MoroccoandTunisia• NotonlydoesNorthAfricaremainthemostimbalancedregioninAfrica,ithasalsoexperiencedthegreatest
regional governance deterioration since 2006
Liberia, Angola and Sierra Leone have registered the biggest advances over the past five years.
According to a recent paper by Ernest & Young (Private Equity Roundup -- Africa, February 2013), further evidence of improvements in governance in Africa comes from Transparency International’s Corruption Perceptions Index. Africa now has 14 countries ranking higher than India and 35 ranking higher than Russia. Although it still lags behind many developed nations, it signals the success of African governments and industry bodies in improving governance.
Did you know?
Only two African nations have never been colonised by European countries: Liberia and Ethiopia.
Not Free Partly Free Free
Algeria, Angola, Cameroon, Chad, Congo Republic,
DR Congo, Djibouti, Eritrea,
Ethiopia, Equatorial
Guinea, Gabon, Gambia, Guinea-
Bissau, Mali, Mauritania,
Rwanda, South Sudan, Somalia,
Sudan, Swaziland,
Bukina Faso, Burundi, CAR, Comores, Cote d'Ivoire, Egypt, Guinea, Kenya, Liberia, Libya, Madagascar,
Malawi, Morocco, Mozambique, Niger, Nigeria,
Seychelles, Tanzania, Togo, Tunisia,Uganda,
Zambia
Benin, Botswana, Cape Verde,
Ghana, Lesotho, Mauritius, Namibia,
Sierra Leone, Senegal, South
Africa, Sao Tome & Principe
17 of 55
3. RATIONALE AND RISKS ASSOCIATED WITH INVESTING IN AFRICA
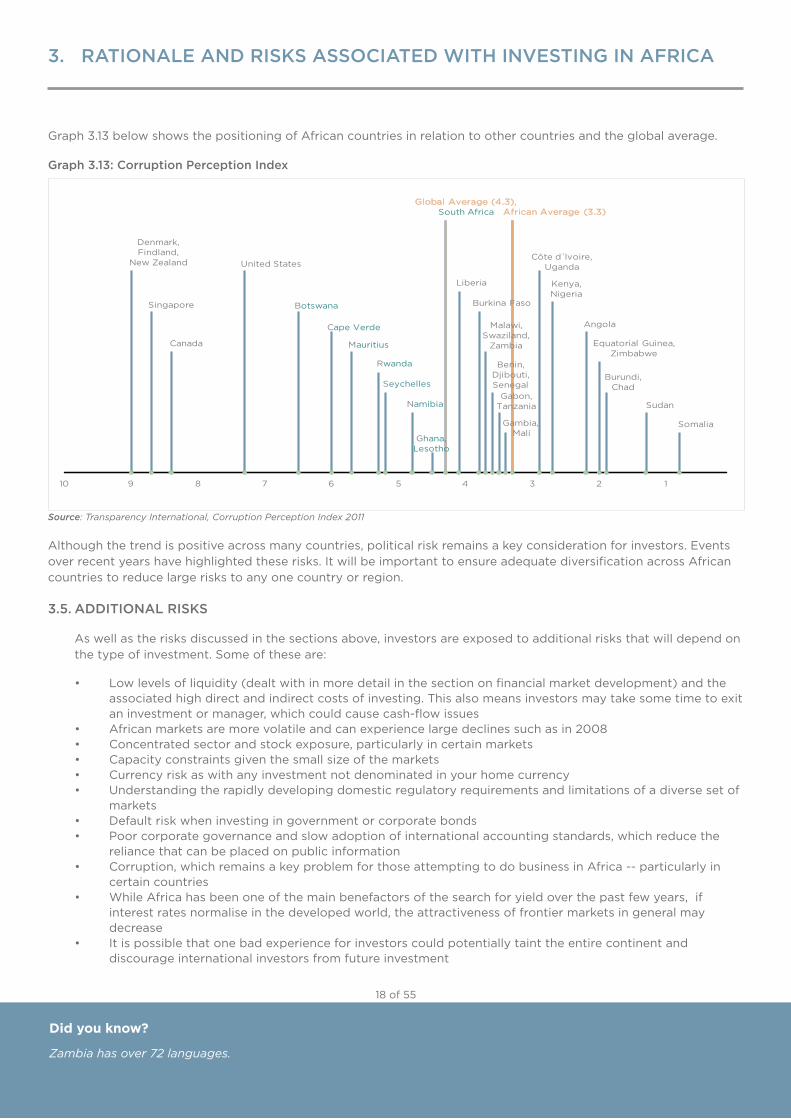
Graph 3.13 below shows the positioning of African countries in relation to other countries and the global average.
Graph 3.13: Corruption Perception Index
Source: Transparency International, Corruption Perception Index 2011
Although the trend is positive across many countries, political risk remains a key consideration for investors. Events over recent years have highlighted these risks. It will be important to ensure adequate diversification across African countries to reduce large risks to any one country or region.
3.5. ADDITIONAL RISKS
As well as the risks discussed in the sections above, investors are exposed to additional risks that will depend onthe type of investment. Some of these are:
• Lowlevelsofliquidity(dealtwithinmoredetailinthesectiononfinancialmarketdevelopment)andtheassociated high direct and indirect costs of investing. This also means investors may take some time to exit an investment or manager, which could cause cash-flow issues
• Africanmarketsaremorevolatileandcanexperiencelargedeclinessuchasin2008• Concentratedsectorandstockexposure,particularlyincertainmarkets• Capacityconstraintsgiventhesmallsizeofthemarkets• Currencyriskaswithanyinvestmentnotdenominatedinyourhomecurrency• Understandingtherapidlydevelopingdomesticregulatoryrequirementsandlimitationsofadiversesetof
markets• Defaultriskwheninvestingingovernmentorcorporatebonds• Poorcorporategovernanceandslowadoptionofinternationalaccountingstandards,whichreducethe
reliance that can be placed on public information• Corruption,whichremainsakeyproblemforthoseattemptingtodobusinessinAfrica--particularlyin
certain countries • WhileAfricahasbeenoneofthemainbenefactorsofthesearchforyieldoverthepastfewyears,if
interest rates normalise in the developed world, the attractiveness of frontier markets in general may decrease
• Itispossiblethatonebadexperienceforinvestorscouldpotentiallytainttheentirecontinentanddiscourage international investors from future investment
Denmark, Findland,
New Zealand
Singapore
Canada
UnitedStates
Botswana
Cape Verde
Mauritius
Rwanda
Seychelles
Namibia
Ghana, Lesotho
Global Average (4.3),South Africa
Liberia
Burkina Faso
Malawi, Swaziland,
Zambia
Benin, Djibouti, Senegal
Gabon, Tanzania
Gambia,Mali
African Average (3.3)
Côte d´Ivoire, Uganda
Kenya, Nigeria
Angola
Equatorial Guinea, Zimbabwe
Burundi, Chad
Sudan
Somalia
10 9 8 7 6 5 4 3 2 1
Did you know?
Zambia has over 72 languages.
18 of 55
3. RATIONALE AND RISKS ASSOCIATED WITH INVESTING IN AFRICA
The following factors are also risks when considering the future development of African countries:
• Governmentbureaucracyandhindrancestodoingbusinessonthecontinent• Lackofaccesstofinance,whichcouldhamperinfrastructuredevelopment• Lackofeducationandskillsdevelopment,whichcouldexacerbateunemploymentandpovertylevels• Poorpublichealthsystems• Poorproductivityandhigherlabourcosts,whichmakeAfricaneconomiesuncompetitivewhencomparedwith
other emerging regions.
Did you know?
Africa is politically organised into the African Union, a federation created in 2001 and comprising all nations except Morocco.
19 of 55
3. RATIONALE AND RISKS ASSOCIATED WITH INVESTING IN AFRICA
4. FINANCIAL MARKET DEVELOPMENT
The financial landscape in Africa has evolved over the years with the growth of the listed equity and bond markets, as well as the private equity market. Traditionally, most countries depended on the banking system for finance. The financial markets are increasingly playing a role in providing capital to the private sector, with funding being allocated to areas such as financial services and telecommunications. Typically, institutional African investors such as retirement funds are restricted from making investments outside their home countries. The financial markets provide a solution to creating more investment opportunity and the ability to diversify investments for local savers and investors. The quantum of such savings to be invested in financial markets has led to the development of financial markets. To date, a few South African investors have made allocations to Africa through listed equity, but over time we expect allocations to be made to other asset classes.
4.1. EQUITY MARKETS
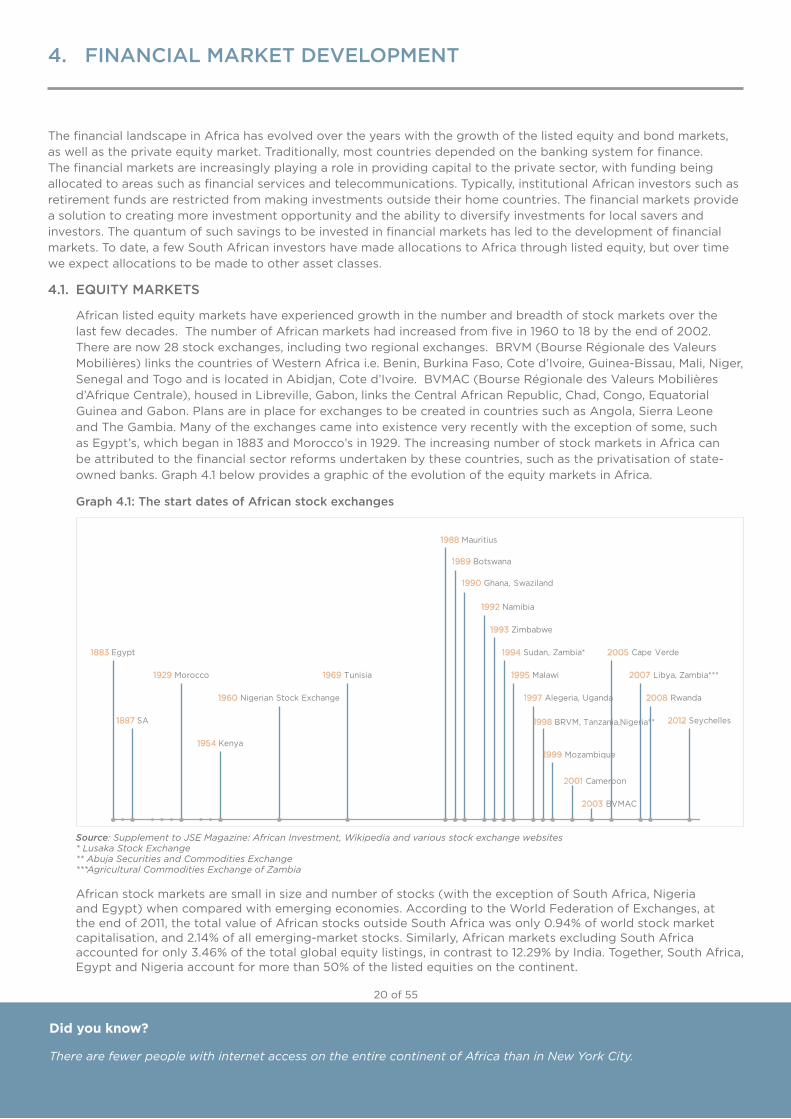
African listed equity markets have experienced growth in the number and breadth of stock markets over the last few decades. The number of African markets had increased from five in 1960 to 18 by the end of 2002. There are now 28 stock exchanges, including two regional exchanges. BRVM (Bourse Régionale des Valeurs Mobilières) links the countries of Western Africa i.e. Benin, Burkina Faso, Cote d’Ivoire, Guinea-Bissau, Mali, Niger, Senegal and Togo and is located in Abidjan, Cote d’Ivoire. BVMAC (Bourse Régionale des Valeurs Mobilières d’Afrique Centrale), housed in Libreville, Gabon, links the Central African Republic, Chad, Congo, Equatorial Guinea and Gabon. Plans are in place for exchanges to be created in countries such as Angola, Sierra Leone and The Gambia. Many of the exchanges came into existence very recently with the exception of some, such as Egypt’s, which began in 1883 and Morocco’s in 1929. The increasing number of stock markets in Africa can be attributed to the financial sector reforms undertaken by these countries, such as the privatisation of state-owned banks. Graph 4.1 below provides a graphic of the evolution of the equity markets in Africa.
Graph 4.1: The start dates of African stock exchanges
Source: Supplement to JSE Magazine: African Investment, Wikipedia and various stock exchange websites * Lusaka Stock Exchange ** Abuja Securities and Commodities Exchange ***Agricultural Commodities Exchange of Zambia
African stock markets are small in size and number of stocks (with the exception of South Africa, Nigeria and Egypt) when compared with emerging economies. According to the World Federation of Exchanges, at the end of 2011, the total value of African stocks outside South Africa was only 0.94% of world stock market capitalisation, and 2.14% of all emerging-market stocks. Similarly, African markets excluding South Africa accounted for only 3.46% of the total global equity listings, in contrast to 12.29% by India. Together, South Africa, Egypt and Nigeria account for more than 50% of the listed equities on the continent.
1883 Egypt
1887 SA
1929 Morocco
1954 Kenya
1960 Nigerian Stock Exchange
1969 Tunisia
1988 Mauritius
1989 Botswana
1990 Ghana, Swaziland
1992 Namibia
1993 Zimbabwe
1994 Sudan, Zambia*
1995 Malawi
1997 Alegeria,Uganda
1998 BRVM, Tanzania,Nigeria**
1999 Mozambique
2001 Cameroon
2003 BVMAC
2005 Cape Verde
2007 Libya, Zambia***
2008 Rwanda
2012 Seychelles
Did you know?
There are fewer people with internet access on the entire continent of Africa than in New York City.
20 of 55
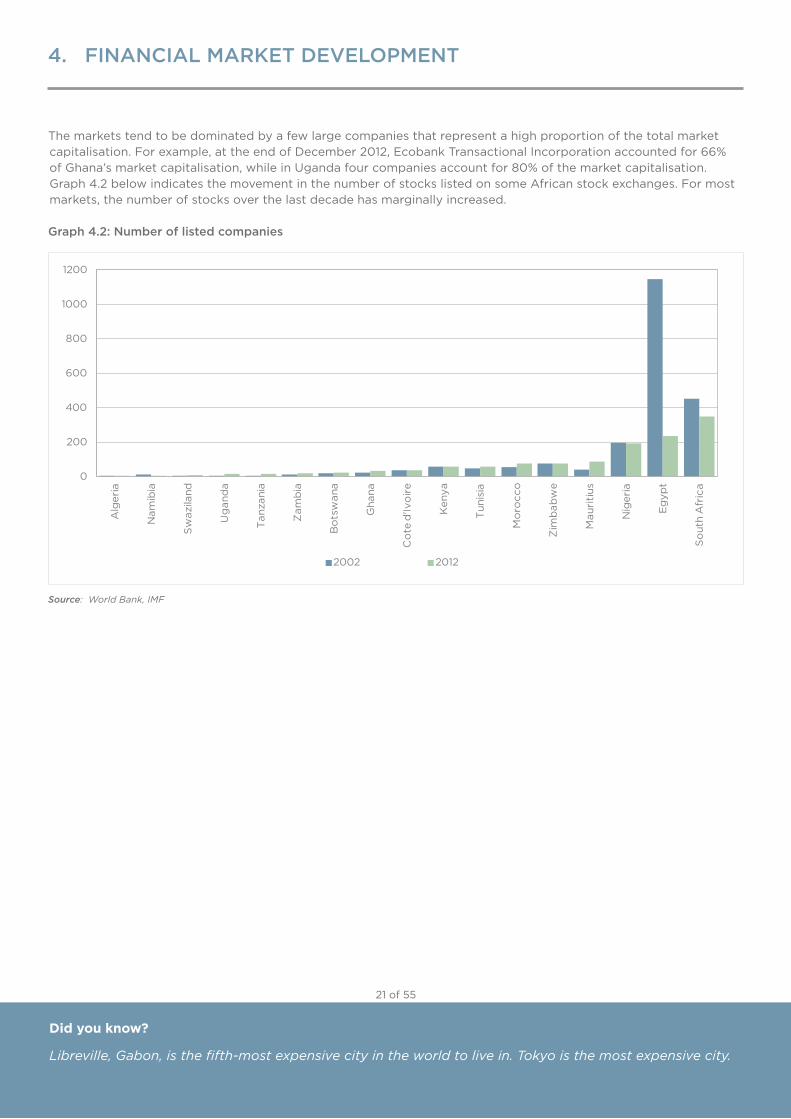
The markets tend to be dominated by a few large companies that represent a high proportion of the total market capitalisation. For example, at the end of December 2012, Ecobank Transactional Incorporation accounted for 66% ofGhana’smarketcapitalisation,whileinUgandafourcompaniesaccountfor80%ofthemarketcapitalisation.Graph 4.2 below indicates the movement in the number of stocks listed on some African stock exchanges. For most markets, the number of stocks over the last decade has marginally increased.
Graph 4.2: Number of listed companies
Source: World Bank, IMF
Did you know?
Libreville, Gabon, is the fifth-most expensive city in the world to live in. Tokyo is the most expensive city.
0
200
400
600
800
1000
1200
Alg
eria
Nam
ibia
Sw
azila
nd
Uganda
Tan
zani
a
Zam
bia
Bo
tsw
ana
Gha
na
Co
te d
'Ivo
ire
Ken
ya
Tun
isia
Mo
rocc
o
Zim
bab
we
Mau
riti
us
Nig
eria
Eg
ypt
So
uth
Afr
ica
2002 2012
21 of 55
4. FINANCIAL MARKET DEVELOPMENT
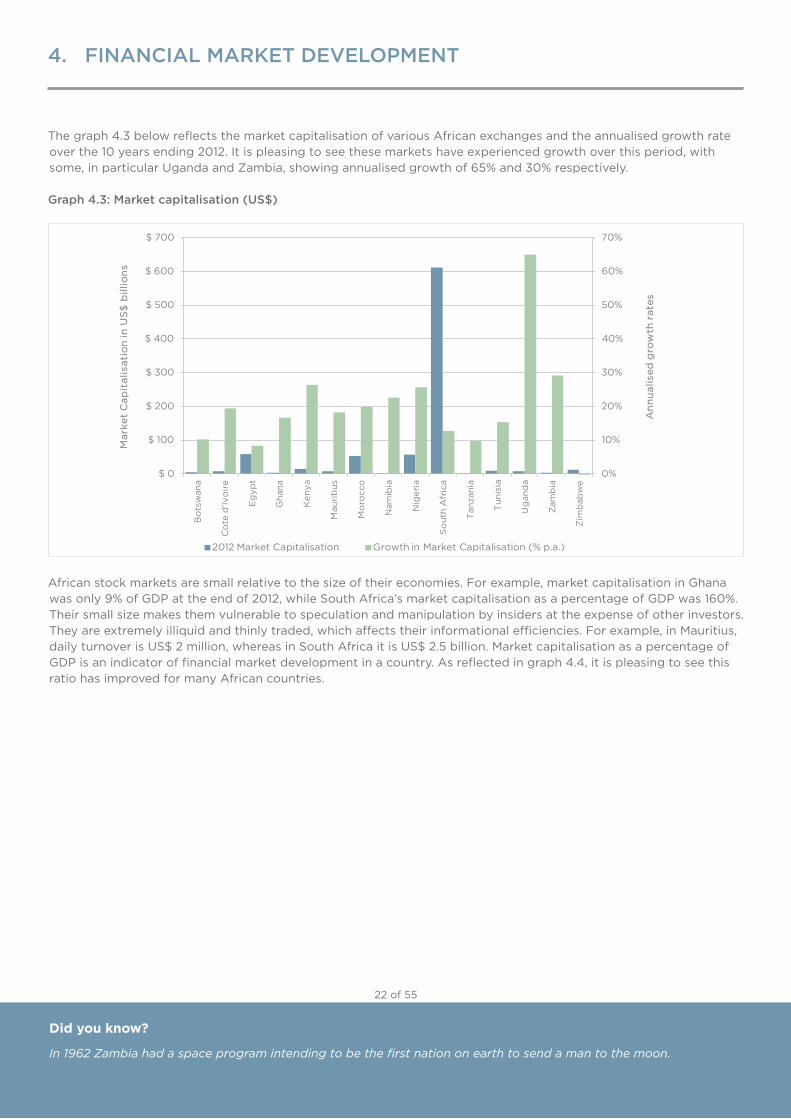
The graph 4.3 below reflects the market capitalisation of various African exchanges and the annualised growth rate over the 10 years ending 2012. It is pleasing to see these markets have experienced growth over this period, with some,inparticularUgandaandZambia,showingannualisedgrowthof65%and30%respectively.
Graph 4.3: Market capitalisation (US$)
African stock markets are small relative to the size of their economies. For example, market capitalisation in Ghana was only 9% of GDP at the end of 2012, while South Africa’s market capitalisation as a percentage of GDP was 160%. Their small size makes them vulnerable to speculation and manipulation by insiders at the expense of other investors. They are extremely illiquid and thinly traded, which affects their informational efficiencies. For example, in Mauritius, dailyturnoverisUS$2million,whereasinSouthAfricaitisUS$2.5billion.MarketcapitalisationasapercentageofGDP is an indicator of financial market development in a country. As reflected in graph 4.4, it is pleasing to see this ratio has improved for many African countries.
Did you know?
In 1962 Zambia had a space program intending to be the first nation on earth to send a man to the moon.
0%
10%
20%
30%
40%
50%
60%
70%
$0
$100
$200
$300
$400
$500
$600
$700
Bo
tsw
ana
Co
te d
'Ivo
ire
Eg
ypt
Gha
na
Ken
ya
Mau
riti
us
Mo
rocc
o
Nam
ibia
Nig
eria
So
uth
Afr
ica
Tan
zani
a
Tun
isia
Uganda
Zam
bia
Zim
bab
we
An
nu
alis
ed g
row
th r
ates
MarketCapitalisationinUS$billions
2012 Market Capitalisation Growth in Market Capitalisation (% p.a.)
22 of 55
4. FINANCIAL MARKET DEVELOPMENT
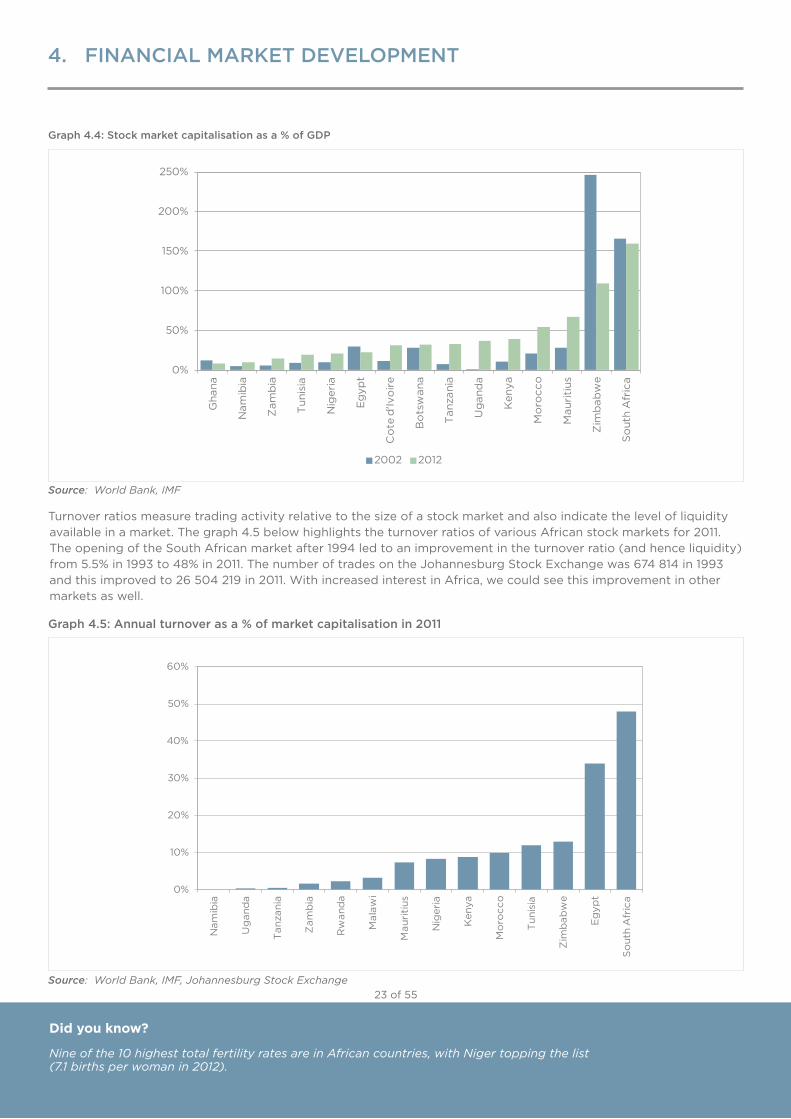
Graph 4.4: Stock market capitalisation as a % of GDP
Source: World Bank, IMF
Turnover ratios measure trading activity relative to the size of a stock market and also indicate the level of liquidity available in a market. The graph 4.5 below highlights the turnover ratios of various African stock markets for 2011. The opening of the South African market after 1994 led to an improvement in the turnover ratio (and hence liquidity) from 5.5% in 1993 to 48% in 2011. The number of trades on the Johannesburg Stock Exchange was 674 814 in 1993 and this improved to 26 504 219 in 2011. With increased interest in Africa, we could see this improvement in other markets as well.
Graph 4.5: Annual turnover as a % of market capitalisation in 2011
Source: World Bank, IMF, Johannesburg Stock Exchange
Did you know?
Nine of the 10 highest total fertility rates are in African countries, with Niger topping the list (7.1 births per woman in 2012).
0%
50%
100%
150%
200%
250%
Gha
na
Nam
ibia
Zam
bia
Tun
isia
Nig
eria
Eg
ypt
Co
te d
'Ivo
ire
Bo
tsw
ana
Tan
zani
a
Uganda
Ken
ya
Mo
rocc
o
Mau
riti
us
Zim
bab
we
So
uth
Afr
ica
2002 2012
0%
10%
20%
30%
40%
50%
60%
Nam
ibia
Uganda
Tan
zani
a
Zam
bia
Rw
and
a
Mal
awi
Mau
riti
us
Nig
eria
Ken
ya
Mo
rocc
o
Tun
isia
Zim
bab
we
Eg
ypt
So
uth
Afr
ica
23 of 55
4. FINANCIAL MARKET DEVELOPMENT
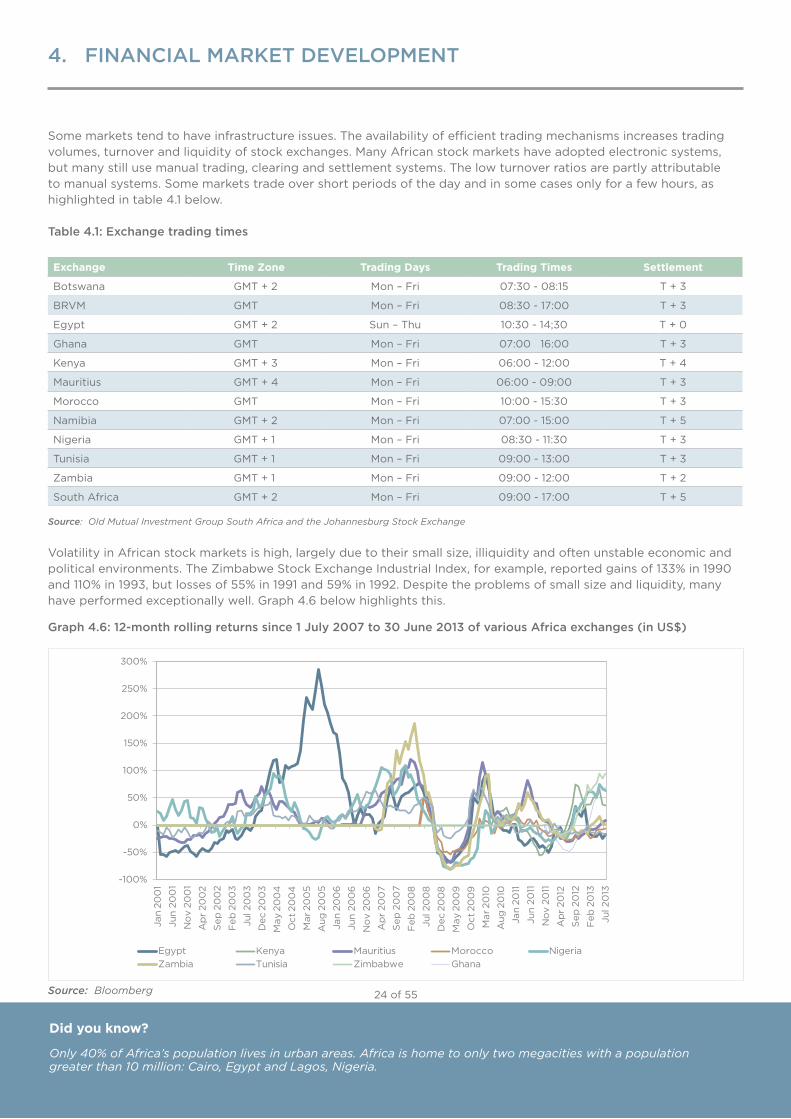
Some markets tend to have infrastructure issues. The availability of efficient trading mechanisms increases trading volumes, turnover and liquidity of stock exchanges. Many African stock markets have adopted electronic systems, but many still use manual trading, clearing and settlement systems. The low turnover ratios are partly attributable to manual systems. Some markets trade over short periods of the day and in some cases only for a few hours, as highlighted in table 4.1 below.
Table 4.1: Exchange trading times
Exchange Time Zone Trading Days Trading Times Settlement
Botswana GMT + 2 Mon – Fri 07:30 - 08:15 T + 3
BRVM GMT Mon – Fri 08:30 - 17:00 T + 3
Egypt GMT + 2 Sun – Thu 10:30 - 14;30 T + 0
Ghana GMT Mon – Fri 07:00 16:00 T + 3
Kenya GMT + 3 Mon – Fri 06:00 - 12:00 T + 4
Mauritius GMT + 4 Mon – Fri 06:00 - 09:00 T + 3
Morocco GMT Mon – Fri 10:00 - 15:30 T + 3
Namibia GMT + 2 Mon – Fri 07:00 - 15:00 T + 5
Nigeria GMT + 1 Mon – Fri 08:30 - 11:30 T + 3
Tunisia GMT + 1 Mon – Fri 09:00 - 13:00 T + 3
Zambia GMT + 1 Mon – Fri 09:00 - 12:00 T + 2
South Africa GMT + 2 Mon – Fri 09:00 - 17:00 T + 5
Source: Old Mutual Investment Group South Africa and the Johannesburg Stock Exchange
Volatility in African stock markets is high, largely due to their small size, illiquidity and often unstable economic and political environments. The Zimbabwe Stock Exchange Industrial Index, for example, reported gains of 133% in 1990 and 110% in 1993, but losses of 55% in 1991 and 59% in 1992. Despite the problems of small size and liquidity, many have performed exceptionally well. Graph 4.6 below highlights this.
Graph 4.6: 12-month rolling returns since 1 July 2007 to 30 June 2013 of various Africa exchanges (in US$)
Source: Bloomberg
Did you know?
Only 40% of Africa’s population lives in urban areas. Africa is home to only two megacities with a population greater than 10 million: Cairo, Egypt and Lagos, Nigeria.
-100%
-50%
0%
50%
100%
150%
200%
250%
300%
Jan
200
1
Jun
200
1
No
v 20
01
Ap
r 20
02
Sep
20
02
Feb
20
03
Jul 2
00
3
Dec
20
03
May
20
04
Oct
20
04
Mar
20
05
Aug
20
05
Jan
200
6
Jun
200
6
No
v 20
06
Ap
r 20
07
Sep
20
07
Feb
20
08
Jul 2
00
8
Dec
20
08
May
20
09
Oct
20
09
Mar
20
10
Aug
20
10
Jan
2011
Jun
2011
No
v 20
11
Ap
r 20
12
Sep
20
12
Feb
20
13
Jul 2
013
Egypt Kenya Mauritius Morocco NigeriaZambia Tunisia Zimbabwe Ghana
24 of 55
4. FINANCIAL MARKET DEVELOPMENT
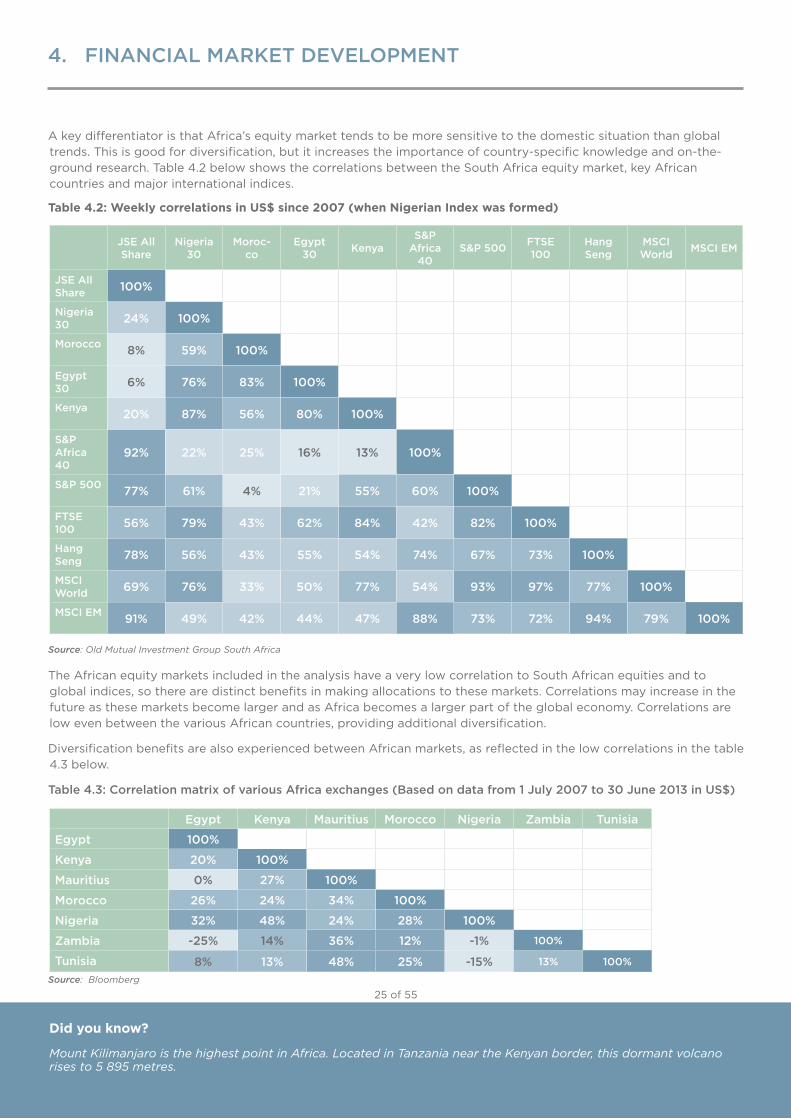
A key differentiator is that Africa’s equity market tends to be more sensitive to the domestic situation than global trends. This is good for diversification, but it increases the importance of country-specific knowledge and on-the-ground research. Table 4.2 below shows the correlations between the South Africa equity market, key African countries and major international indices.
Table 4.2: Weekly correlations in US$ since 2007 (when Nigerian Index was formed)
JSE All Share
Nigeria 30
Moroc-co
Egypt 30 Kenya
S&P Africa
40S&P 500 FTSE
100Hang Seng
MSCI World MSCI EM
JSE All Share 100%
Nigeria 30 24% 100%
Morocco 8% 59% 100%
Egypt 30 6% 76% 83% 100%
Kenya 20% 87% 56% 80% 100%
S&P Africa 40
92% 22% 25% 16% 13% 100%
S&P 500 77% 61% 4% 21% 55% 60% 100%
FTSE 100 56% 79% 43% 62% 84% 42% 82% 100%
Hang Seng 78% 56% 43% 55% 54% 74% 67% 73% 100%
MSCI World 69% 76% 33% 50% 77% 54% 93% 97% 77% 100%
MSCI EM 91% 49% 42% 44% 47% 88% 73% 72% 94% 79% 100%
Source: Old Mutual Investment Group South Africa
The African equity markets included in the analysis have a very low correlation to South African equities and to global indices, so there are distinct benefits in making allocations to these markets. Correlations may increase in the future as these markets become larger and as Africa becomes a larger part of the global economy. Correlations are low even between the various African countries, providing additional diversification.
Diversification benefits are also experienced between African markets, as reflected in the low correlations in the table 4.3 below.
Table 4.3: Correlation matrix of various Africa exchanges (Based on data from 1 July 2007 to 30 June 2013 in US$)
Egypt Kenya Mauritius Morocco Nigeria Zambia Tunisia
Egypt 100%
Kenya 20% 100%
Mauritius 0% 27% 100%
Morocco 26% 24% 34% 100%
Nigeria 32% 48% 24% 28% 100%
Zambia -25% 14% 36% 12% -1% 100%
Tunisia 8% 13% 48% 25% -15% 13% 100%
Source: Bloomberg
Did you know?
Mount Kilimanjaro is the highest point in Africa. Located in Tanzania near the Kenyan border, this dormant volcano rises to 5 895 metres.
25 of 55
4. FINANCIAL MARKET DEVELOPMENT
Did you know?
ForeigndirectinvestmentintoAfricahasgrownfromaroundUS$10billionayearinthe1990stoUS$50billionin 2012, according to the 2013 World Investment Report. Such inflows were largely driven by investments in theresourcesectorincountriessuchastheDRC,Mauritania,MozambiqueandUganda.Consumer-orientatedmanufacturing and services also benefited. The emergence and expansion of stock markets in Africa will help attract private investment and represents a significant step towards integration into the global financial marketplace. The improvement in the financial market landscape in Africa creates opportunities for local and global investors, including retirement funds.
The discovery of resources in many African countries has led to industry looking to the financial markets to raise capital, thereby aiding financial market development. With the increasing size of the working population, many investors will look to the African markets to invest their savings.
The drawbacks, as highlighted above, of the various stock markets in Africa may make investors wary of exploring such opportunities. The growth of the African markets cannot go unnoticed and for many of these economies there are plans to improve the situation. Regulation is coming to the fore and information is becoming more readily available. For first-time investors in the African markets, listed equity investments are a good initial step as they are easier to dispose of than direct investments or sovereign loans.
4.2. BOND MARKET
Bond market development in Africa has been increasing, with a number of countries establishing markets, albeit small and inactive. The increase in government bond issues is due to investors’ search for yield given the current low interest rate environment in much of the developed world, as well as financial sector reforms taking place in some countries. For example, in 2004, the governor of the Central Bank of Nigeria decided to raisetheminimumcapitalrequirementforbankstoUS$250millionbyDecember2005.Thisbankingsectorrecapitalisation was achieved through a combination of private and public bond issues on the local market that was largely taken up by wealthy Nigerian investors.
A number of bodies have come to Africa’s assistance to facilitate the growth of corporate bond markets by issuing local currency bonds to finance infrastructure and lending projects. These multilateral financial institutions include the International Finance Corporation of the World Bank and the Swedish International Development Cooperation Agency. These institutions have launched the Efficient Securities Markets Institutional Development Africa Programme, which aims to foster well-functioning securities markets through transaction support and regulatory assistance. Since the launch of this programme in 2007, Kenya, Tanzania,Uganda,BurundiandRwandahavebenefitedfromcorporatebondgrowth.
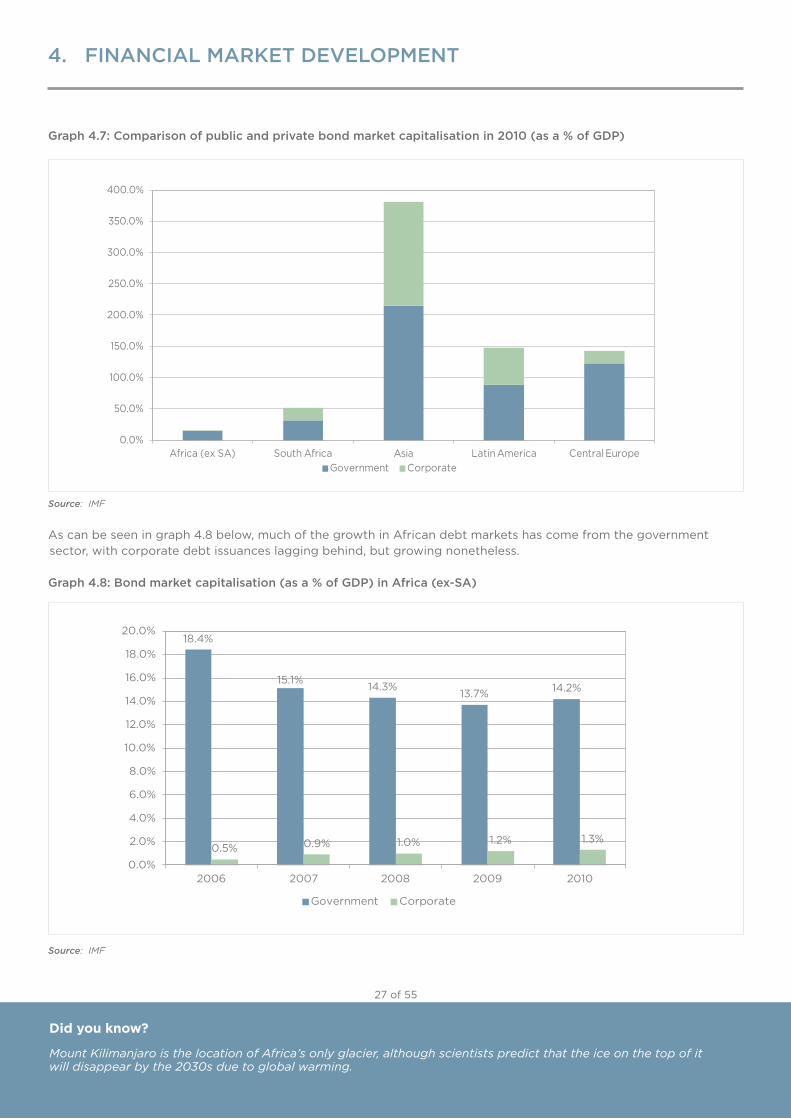
Compared with world economies, African bond markets are still in a nascent stage of development, as highlighted in graph 4.7.
Did you know?
In August 2012, Zimbabwe proposed to create a US$ 300 million Disneyland theme park next to Victoria Falls to attract young tourists.
26 of 55
4. FINANCIAL MARKET DEVELOPMENT
Did you know?
Graph 4.7: Comparison of public and private bond market capitalisation in 2010 (as a % of GDP)
Source: IMF
As can be seen in graph 4.8 below, much of the growth in African debt markets has come from the government sector, with corporate debt issuances lagging behind, but growing nonetheless.
Graph 4.8: Bond market capitalisation (as a % of GDP) in Africa (ex-SA)
Source: IMF
Did you know?
Mount Kilimanjaro is the location of Africa’s only glacier, although scientists predict that the ice on the top of it will disappear by the 2030s due to global warming.
0.0%
50.0%
100.0%
150.0%
200.0%
250.0%
300.0%
350.0%
400.0%
Africa (ex SA) South Africa Asia Latin America Central EuropeGovernment Corporate
18.4%
15.1%14.3%
13.7% 14.2%
0.5% 0.9% 1.0% 1.2% 1.3%
0.0%
2.0%
4.0%
6.0%
8.0%
10.0%
12.0%
14.0%
16.0%
18.0%
20.0%
2006 2007 2008 2009 2010
Government Corporate
27 of 55
4. FINANCIAL MARKET DEVELOPMENT
Did you know?Did you know?
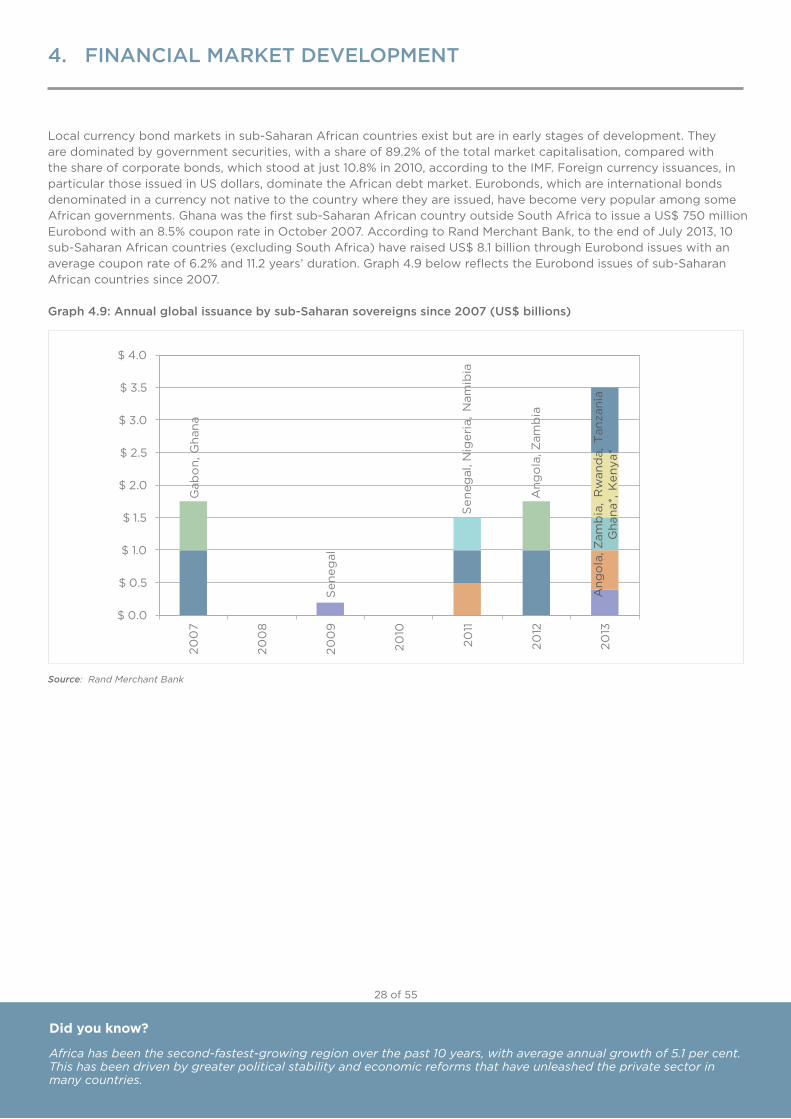
Local currency bond markets in sub-Saharan African countries exist but are in early stages of development. They are dominated by government securities, with a share of 89.2% of the total market capitalisation, compared with the share of corporate bonds, which stood at just 10.8% in 2010, according to the IMF. Foreign currency issuances, in particularthoseissuedinUSdollars,dominatetheAfricandebtmarket.Eurobonds,whichareinternationalbondsdenominated in a currency not native to the country where they are issued, have become very popular among some Africangovernments.Ghanawasthefirstsub-SaharanAfricancountryoutsideSouthAfricatoissueaUS$750millionEurobond with an 8.5% coupon rate in October 2007. According to Rand Merchant Bank, to the end of July 2013, 10 sub-SaharanAfricancountries(excludingSouthAfrica)haveraisedUS$8.1billionthroughEurobondissueswithanaverage coupon rate of 6.2% and 11.2 years’ duration. Graph 4.9 below reflects the Eurobond issues of sub-Saharan African countries since 2007.
Graph 4.9: Annual global issuance by sub-Saharan sovereigns since 2007 (US$ billions)
Source: Rand Merchant Bank
Did you know?
Africa has been the second-fastest-growing region over the past 10 years, with average annual growth of 5.1 per cent. This has been driven by greater political stability and economic reforms that have unleashed the private sector in many countries.
Gab
on,
Gha
na
Sen
egal
Sen
egal
, Nig
eria
, N
amib
ia
Ang
ola
, Zam
bia
$0.0
$0.5
$1.0
$1.5
$2.0
$2.5
$3.0
$3.5
$4.0
200
7
200
8
200
9
2010
2011
2012
2013
Ang
ola
,Zam
bia
, R
wan
da,
Tan
zani
aG
hana
*, K
enya
*
28 of 55
4. FINANCIAL MARKET DEVELOPMENT
Did you know?Did you know?
Table 4.3: Examples of Eurobond Issuances by African Countries
Country Year of issue Maturity Yield
Size of issue(US$
billion)Purpose of issue Subscription
Level
Egypt2010 2020 5.75% 1 Financing a widening budget deficit
2010 2040 1.5
Gabon 2007 2017 8.20% 1 Repaying debt
Ghana 2007 2017 7.50% 0.75 Improving Infrastructure 4X
Namibia 2011 2021 5.75% 0.5Financing TIPEEG (Targeted Intervention Programme for Employment and Economic Growth)
5.5X
Nigeria
2011 2021 6.38% 0.5 2.5X
2013 2018 5.38% 0.5 Financing power projects across the country 3.5X
2013 2023 6.63% 0.5 5X
Rwanda 2013 2023 6.88% 0.4
UsingUS$200milliontorepayloansinrelation to the Kigali Convention Centre and the RwandAir strategic development plan;US$150milliontofinancethecompletion of the Kigali Convention Centre;andUS$150milliontobeusedtopay for building a 28 megawatt hydro-power plant
8.7X
Senegal2009 2014 9.25% 0.2
2011 2021 9.13% 0.5 4X
Zambia 2012 2022 5.63% 0.75
Financing the upgrading of infrastructure in the road and energy sectors and funding the country’s budget and spending in social sectors (education and health)
15X
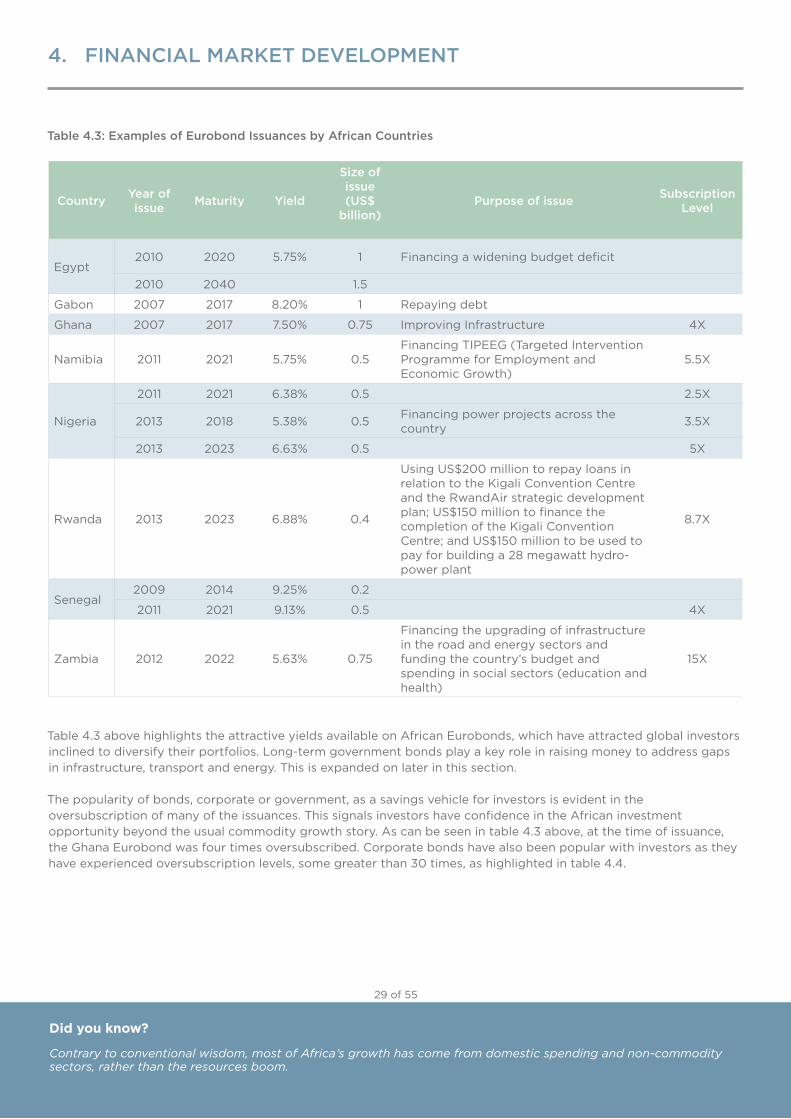
Table 4.3 above highlights the attractive yields available on African Eurobonds, which have attracted global investors inclined to diversify their portfolios. Long-term government bonds play a key role in raising money to address gaps in infrastructure, transport and energy. This is expanded on later in this section.
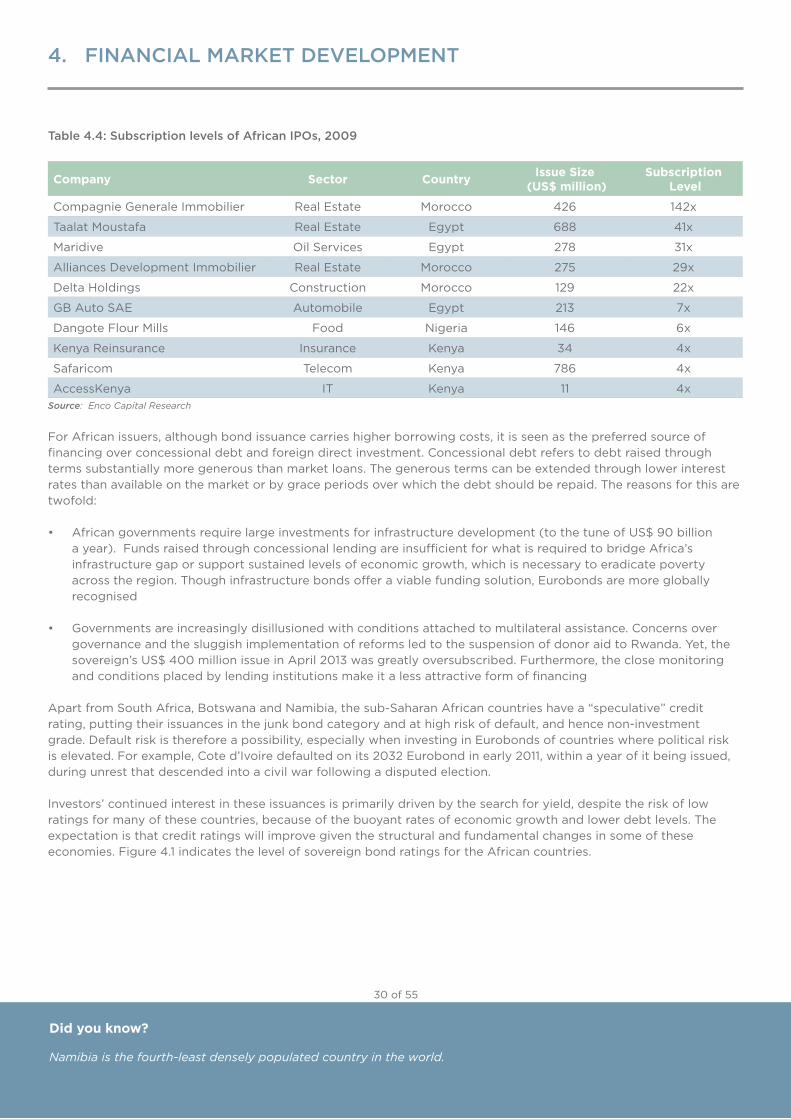
The popularity of bonds, corporate or government, as a savings vehicle for investors is evident in the oversubscription of many of the issuances. This signals investors have confidence in the African investment opportunity beyond the usual commodity growth story. As can be seen in table 4.3 above, at the time of issuance, the Ghana Eurobond was four times oversubscribed. Corporate bonds have also been popular with investors as they have experienced oversubscription levels, some greater than 30 times, as highlighted in table 4.4.
Did you know?
Contrary to conventional wisdom, most of Africa’s growth has come from domestic spending and non-commodity sectors, rather than the resources boom.
29 of 55
4. FINANCIAL MARKET DEVELOPMENT
Did you know?Did you know?Did you know?
Table 4.4: Subscription levels of African IPOs, 2009
Company Sector Country Issue Size (US$ million)
Subscription Level
Compagnie Generale Immobilier Real Estate Morocco 426 142x
Taalat Moustafa Real Estate Egypt 688 41x
Maridive Oil Services Egypt 278 31x
Alliances Development Immobilier Real Estate Morocco 275 29x
Delta Holdings Construction Morocco 129 22x
GB Auto SAE Automobile Egypt 213 7x
Dangote Flour Mills Food Nigeria 146 6x
Kenya Reinsurance Insurance Kenya 34 4x
Safaricom Telecom Kenya 786 4x
AccessKenya IT Kenya 11 4xSource: Enco Capital Research
For African issuers, although bond issuance carries higher borrowing costs, it is seen as the preferred source of financing over concessional debt and foreign direct investment. Concessional debt refers to debt raised through terms substantially more generous than market loans. The generous terms can be extended through lower interest rates than available on the market or by grace periods over which the debt should be repaid. The reasons for this are twofold:
• Africangovernmentsrequirelargeinvestmentsforinfrastructuredevelopment(tothetuneofUS$90billiona year). Funds raised through concessional lending are insufficient for what is required to bridge Africa’s infrastructure gap or support sustained levels of economic growth, which is necessary to eradicate poverty across the region. Though infrastructure bonds offer a viable funding solution, Eurobonds are more globally recognised
• Governments are increasingly disillusioned with conditions attached to multilateral assistance. Concerns over governance and the sluggish implementation of reforms led to the suspension of donor aid to Rwanda. Yet, the sovereign’sUS$400millionissueinApril2013wasgreatlyoversubscribed.Furthermore,theclosemonitoringand conditions placed by lending institutions make it a less attractive form of financing
Apart from South Africa, Botswana and Namibia, the sub-Saharan African countries have a “speculative” credit rating, putting their issuances in the junk bond category and at high risk of default, and hence non-investment grade. Default risk is therefore a possibility, especially when investing in Eurobonds of countries where political risk is elevated. For example, Cote d’Ivoire defaulted on its 2032 Eurobond in early 2011, within a year of it being issued, during unrest that descended into a civil war following a disputed election.
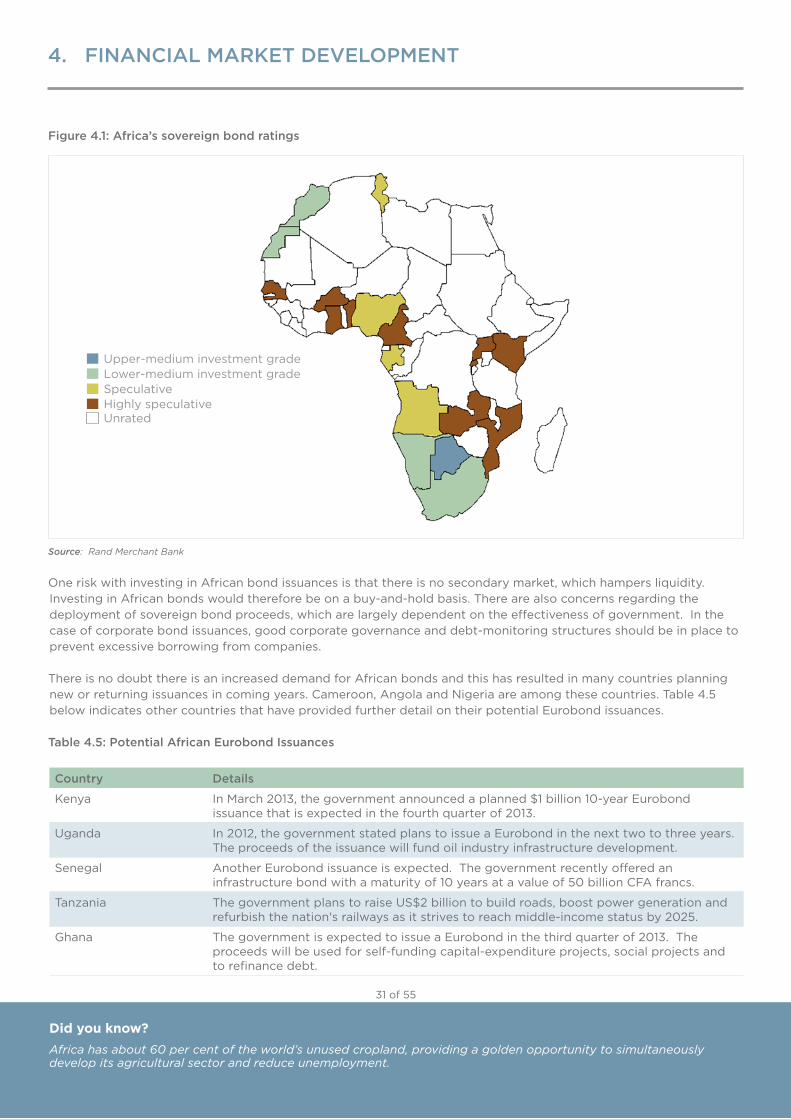
Investors’ continued interest in these issuances is primarily driven by the search for yield, despite the risk of low ratings for many of these countries, because of the buoyant rates of economic growth and lower debt levels. The expectation is that credit ratings will improve given the structural and fundamental changes in some of these economies. Figure 4.1 indicates the level of sovereign bond ratings for the African countries.
Did you know?
Namibia is the fourth-least densely populated country in the world.
30 of 55
4. FINANCIAL MARKET DEVELOPMENT
Did you know?Did you know?Did you know?
Figure 4.1: Africa’s sovereign bond ratings
Source: Rand Merchant Bank
One risk with investing in African bond issuances is that there is no secondary market, which hampers liquidity. Investing in African bonds would therefore be on a buy-and-hold basis. There are also concerns regarding the deployment of sovereign bond proceeds, which are largely dependent on the effectiveness of government. In the case of corporate bond issuances, good corporate governance and debt-monitoring structures should be in place to prevent excessive borrowing from companies.
There is no doubt there is an increased demand for African bonds and this has resulted in many countries planning new or returning issuances in coming years. Cameroon, Angola and Nigeria are among these countries. Table 4.5 below indicates other countries that have provided further detail on their potential Eurobond issuances.
Table 4.5: Potential African Eurobond Issuances
Country Details
Kenya InMarch2013,thegovernmentannouncedaplanned$1billion10-yearEurobondissuance that is expected in the fourth quarter of 2013.
Uganda In 2012, the government stated plans to issue a Eurobond in the next two to three years. The proceeds of the issuance will fund oil industry infrastructure development.
Senegal Another Eurobond issuance is expected. The government recently offered an infrastructure bond with a maturity of 10 years at a value of 50 billion CFA francs.
Tanzania ThegovernmentplanstoraiseUS$2billiontobuildroads,boostpowergenerationandrefurbish the nation's railways as it strives to reach middle-income status by 2025.
Ghana The government is expected to issue a Eurobond in the third quarter of 2013. The proceeds will be used for self-funding capital-expenditure projects, social projects and to refinance debt.
Did you know?Africa has about 60 per cent of the world’s unused cropland, providing a golden opportunity to simultaneously develop its agricultural sector and reduce unemployment.
Upper-mediuminvestmentgradeLower-medium investment gradeSpeculativeHighly speculativeUnrated
31 of 55
4. FINANCIAL MARKET DEVELOPMENT
Did you know?Did you know?Did you know?
4.3. Private Equity
Private equity is another way for investors to access the Africa investment opportunity, especially in countries where a stock exchange or a bond market does not exist or is very small. A number of private equity firms have made allocations to Africa and, more recently, the GEPF has stated its aim to allocate to private equity in Africa. This has heightened interest in this asset class in the investment community.
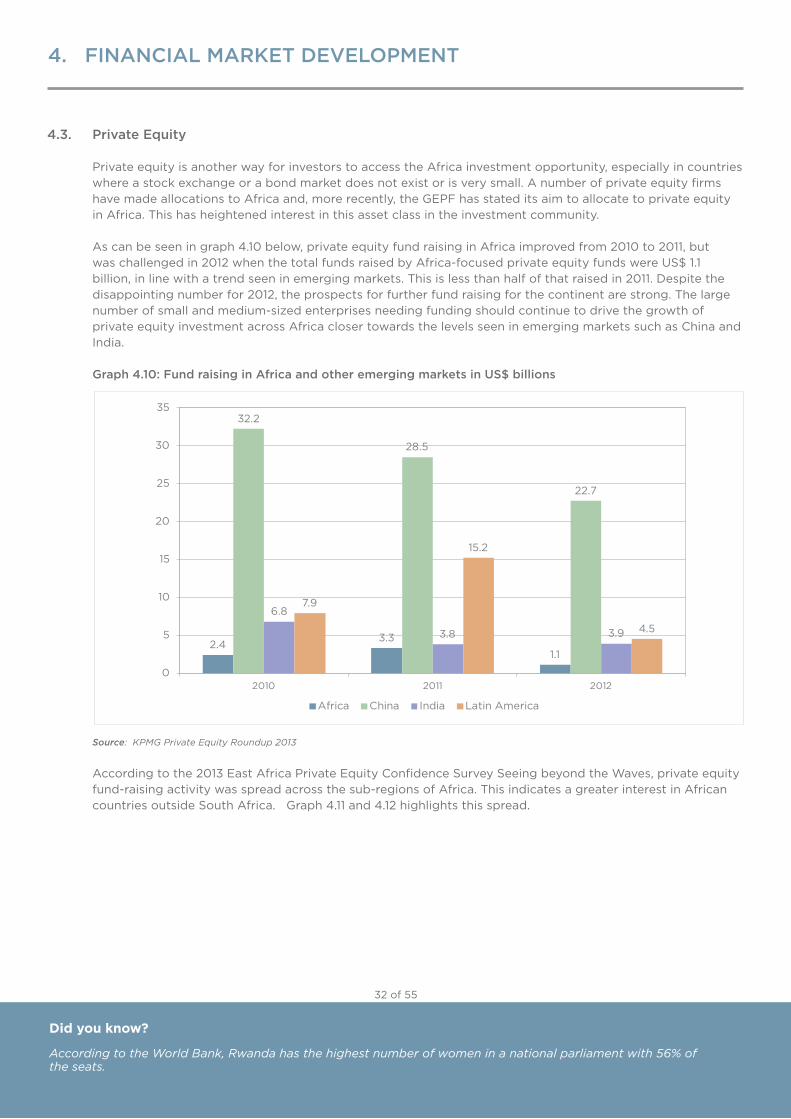
As can be seen in graph 4.10 below, private equity fund raising in Africa improved from 2010 to 2011, but waschallengedin2012whenthetotalfundsraisedbyAfrica-focusedprivateequityfundswereUS$1.1billion, in line with a trend seen in emerging markets. This is less than half of that raised in 2011. Despite the disappointing number for 2012, the prospects for further fund raising for the continent are strong. The large number of small and medium-sized enterprises needing funding should continue to drive the growth of private equity investment across Africa closer towards the levels seen in emerging markets such as China and India.
Graph 4.10: Fund raising in Africa and other emerging markets in US$ billions
Source: KPMG Private Equity Roundup 2013
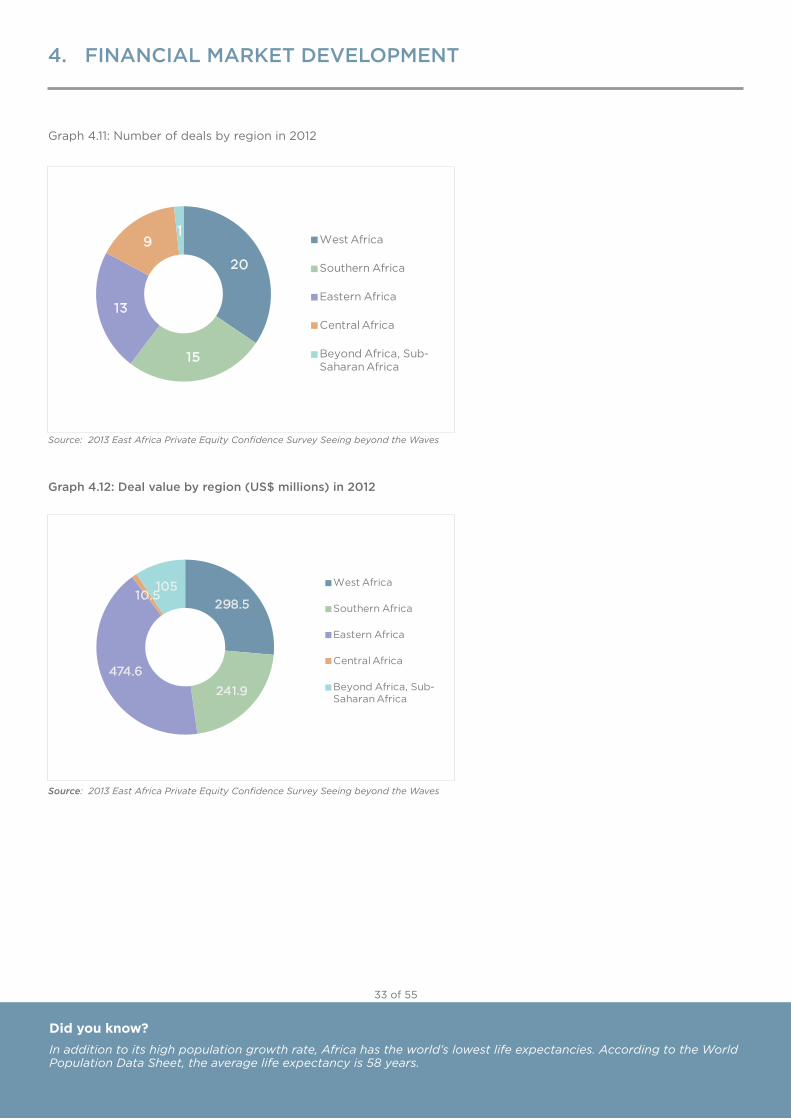
According to the 2013 East Africa Private Equity Confidence Survey Seeing beyond the Waves, private equity fund-raising activity was spread across the sub-regions of Africa. This indicates a greater interest in African countries outside South Africa. Graph 4.11 and 4.12 highlights this spread.
Did you know?
According to the World Bank, Rwanda has the highest number of women in a national parliament with 56% of the seats.
2.43.3
1.1
32.2
28.5
22.7
6.8
3.8 3.9
7.9
15.2
4.5
0
5
10
15
20
25
30
35
2010 2011 2012
Africa China India Latin America
32 of 55
4. FINANCIAL MARKET DEVELOPMENT
Did you know?Did you know?Did you know?
Graph 4.11: Number of deals by region in 2012
Source: 2013 East Africa Private Equity Confidence Survey Seeing beyond the Waves
Graph 4.12: Deal value by region (US$ millions) in 2012
Source: 2013 East Africa Private Equity Confidence Survey Seeing beyond the Waves
Did you know?In addition to its high population growth rate, Africa has the world’s lowest life expectancies. According to the World Population Data Sheet, the average life expectancy is 58 years.
33 of 55
20
15
13
91
West Africa
Southern Africa
Eastern Africa
Central Africa
Beyond Africa, Sub-Saharan Africa
298.5
241.9
474.6
10.5105 West Africa
Southern Africa
Eastern Africa
Central Africa
Beyond Africa, Sub-Saharan Africa
4. FINANCIAL MARKET DEVELOPMENT
Did you know?Did you know?Did you know?
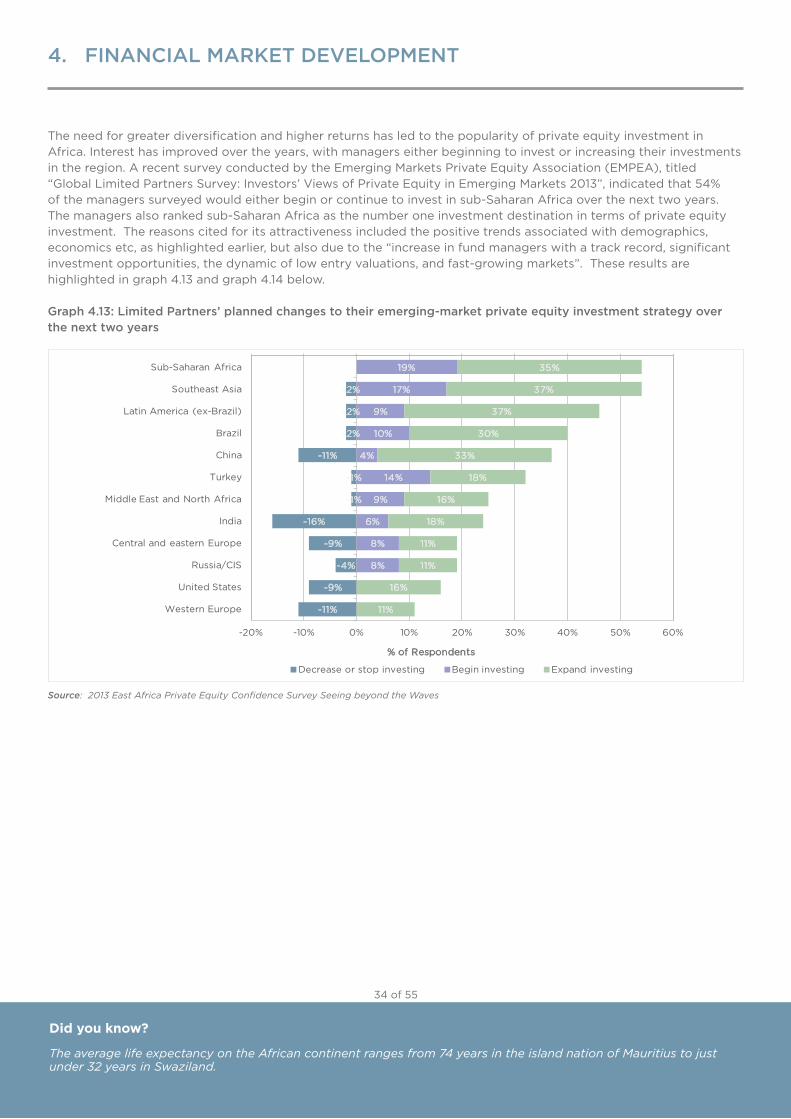
The need for greater diversification and higher returns has led to the popularity of private equity investment in Africa. Interest has improved over the years, with managers either beginning to invest or increasing their investments in the region. A recent survey conducted by the Emerging Markets Private Equity Association (EMPEA), titled “Global Limited Partners Survey: Investors’ Views of Private Equity in Emerging Markets 2013”, indicated that 54% of the managers surveyed would either begin or continue to invest in sub-Saharan Africa over the next two years. The managers also ranked sub-Saharan Africa as the number one investment destination in terms of private equity investment. The reasons cited for its attractiveness included the positive trends associated with demographics, economics etc, as highlighted earlier, but also due to the “increase in fund managers with a track record, significant investment opportunities, the dynamic of low entry valuations, and fast-growing markets”. These results are highlighted in graph 4.13 and graph 4.14 below.
Graph 4.13: Limited Partners’ planned changes to their emerging-market private equity investment strategy over the next two years
Source: 2013 East Africa Private Equity Confidence Survey Seeing beyond the Waves
Did you know?
The average life expectancy on the African continent ranges from 74 years in the island nation of Mauritius to just under 32 years in Swaziland.
-2%
-2%
-2%
-11%
-1%
-1%
-16%
-9%
-4%
-9%
-11%
19%
17%
9%
10%
4%
14%
9%
6%
8%
8%
35%
37%
37%
30%
33%
18%
16%
18%
11%
11%
16%
11%
-20% -10% 0% 10% 20% 30% 40% 50% 60%
Sub-Saharan Africa
Southeast Asia
Latin America (ex-Brazil)
Brazil
China
Turkey
Middle East and North Africa
India
Central and eastern Europe
Russia/CIS
UnitedStates
Western Europe
% of Respondents
Decrease or stop investing Begin investing Expand investing
34 of 55
4. FINANCIAL MARKET DEVELOPMENT
Did you know?Did you know?Did you know?
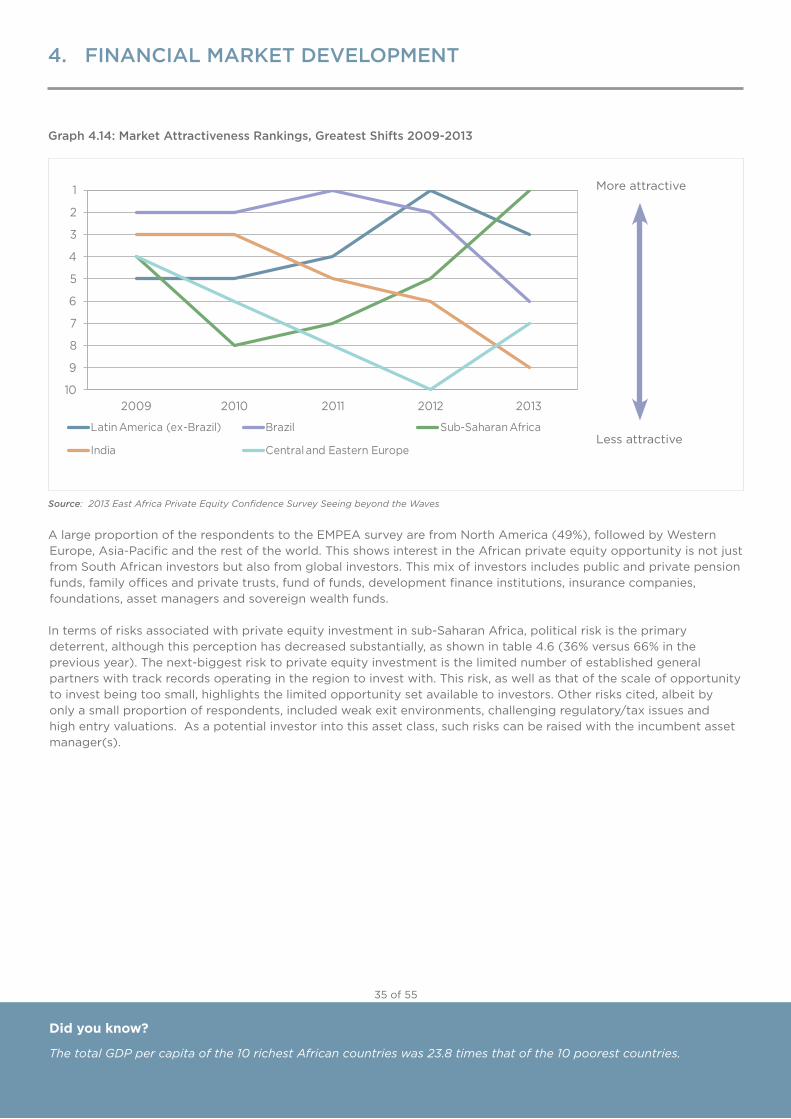
Graph 4.14: Market Attractiveness Rankings, Greatest Shifts 2009-2013
Source: 2013 East Africa Private Equity Confidence Survey Seeing beyond the Waves
A large proportion of the respondents to the EMPEA survey are from North America (49%), followed by Western Europe, Asia-Pacific and the rest of the world. This shows interest in the African private equity opportunity is not just from South African investors but also from global investors. This mix of investors includes public and private pension funds, family offices and private trusts, fund of funds, development finance institutions, insurance companies, foundations, asset managers and sovereign wealth funds.
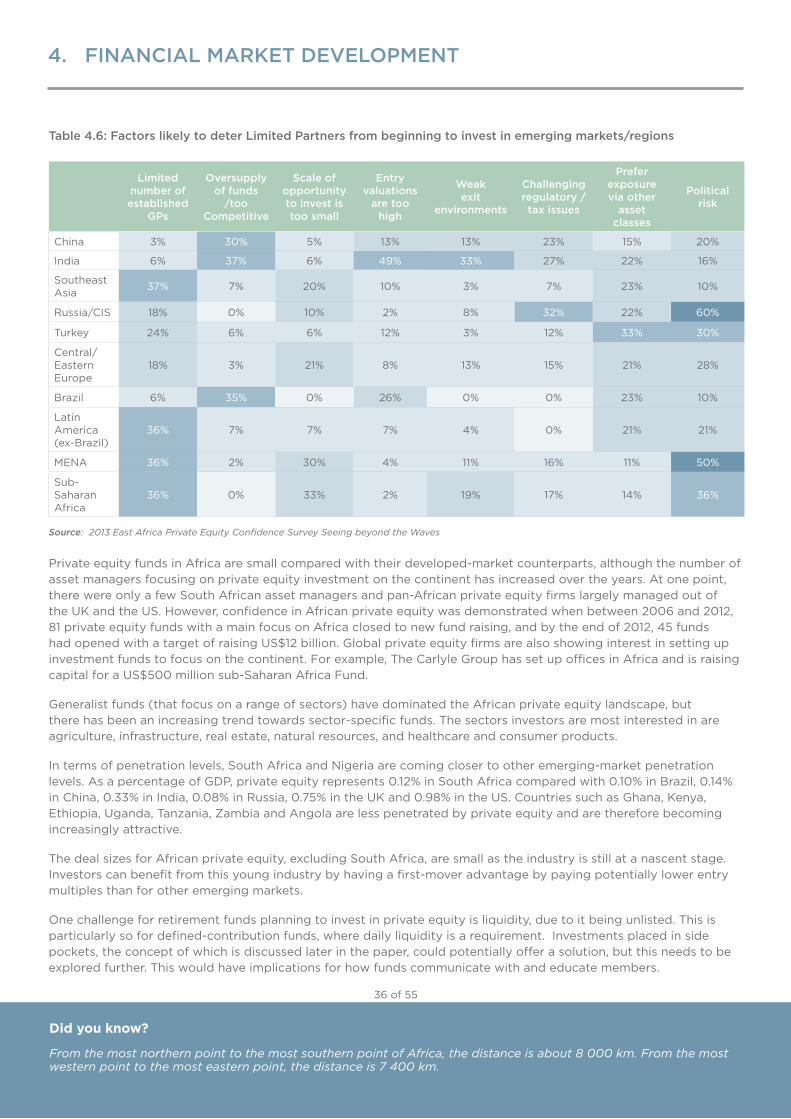
In terms of risks associated with private equity investment in sub-Saharan Africa, political risk is the primary deterrent, although this perception has decreased substantially, as shown in table 4.6 (36% versus 66% in the previous year). The next-biggest risk to private equity investment is the limited number of established general partners with track records operating in the region to invest with. This risk, as well as that of the scale of opportunity to invest being too small, highlights the limited opportunity set available to investors. Other risks cited, albeit by only a small proportion of respondents, included weak exit environments, challenging regulatory/tax issues and high entry valuations. As a potential investor into this asset class, such risks can be raised with the incumbent asset manager(s).
Did you know?
The total GDP per capita of the 10 richest African countries was 23.8 times that of the 10 poorest countries.
More attractive
Less attractive
1
2
3
4
5
6
7
8
9
102009 2010 2011 2012 2013
Latin America (ex-Brazil) Brazil Sub-Saharan Africa
India Central and Eastern Europe
35 of 55
4. FINANCIAL MARKET DEVELOPMENT
Did you know?Did you know?Did you know?
Table 4.6: Factors likely to deter Limited Partners from beginning to invest in emerging markets/regions
Limited number of established
GPs
Oversupply of funds
/too Competitive
Scale of opportunity to invest is too small
Entry valuations
are too high
Weak exit
environments
Challenging regulatory / tax issues
Prefer exposure via other
asset classes
Political risk
China 3% 30% 5% 13% 13% 23% 15% 20%
India 6% 37% 6% 49% 33% 27% 22% 16%
Southeast Asia 37% 7% 20% 10% 3% 7% 23% 10%
Russia/CIS 18% 0% 10% 2% 8% 32% 22% 60%
Turkey 24% 6% 6% 12% 3% 12% 33% 30%
Central/ Eastern Europe
18% 3% 21% 8% 13% 15% 21% 28%
Brazil 6% 35% 0% 26% 0% 0% 23% 10%
Latin America (ex-Brazil)
36% 7% 7% 7% 4% 0% 21% 21%
MENA 36% 2% 30% 4% 11% 16% 11% 50%
Sub- Saharan Africa
36% 0% 33% 2% 19% 17% 14% 36%
Source: 2013 East Africa Private Equity Confidence Survey Seeing beyond the Waves
Private equity funds in Africa are small compared with their developed-market counterparts, although the number of asset managers focusing on private equity investment on the continent has increased over the years. At one point, there were only a few South African asset managers and pan-African private equity firms largely managed out of theUKandtheUS.However,confidenceinAfricanprivateequitywasdemonstratedwhenbetween2006and2012,81 private equity funds with a main focus on Africa closed to new fund raising, and by the end of 2012, 45 funds hadopenedwithatargetofraisingUS$12billion.Globalprivateequityfirmsarealsoshowinginterestinsettingupinvestment funds to focus on the continent. For example, The Carlyle Group has set up offices in Africa and is raising capitalforaUS$500millionsub-SaharanAfricaFund.
Generalist funds (that focus on a range of sectors) have dominated the African private equity landscape, but there has been an increasing trend towards sector-specific funds. The sectors investors are most interested in are agriculture, infrastructure, real estate, natural resources, and healthcare and consumer products.
In terms of penetration levels, South Africa and Nigeria are coming closer to other emerging-market penetration levels. As a percentage of GDP, private equity represents 0.12% in South Africa compared with 0.10% in Brazil, 0.14% inChina,0.33%inIndia,0.08%inRussia,0.75%intheUKand0.98%intheUS.CountriessuchasGhana,Kenya,Ethiopia,Uganda,Tanzania,ZambiaandAngolaarelesspenetratedbyprivateequityandarethereforebecomingincreasingly attractive.
The deal sizes for African private equity, excluding South Africa, are small as the industry is still at a nascent stage. Investors can benefit from this young industry by having a first-mover advantage by paying potentially lower entry multiples than for other emerging markets.
One challenge for retirement funds planning to invest in private equity is liquidity, due to it being unlisted. This is particularly so for defined-contribution funds, where daily liquidity is a requirement. Investments placed in side pockets, the concept of which is discussed later in the paper, could potentially offer a solution, but this needs to be explored further. This would have implications for how funds communicate with and educate members.
Did you know?
From the most northern point to the most southern point of Africa, the distance is about 8 000 km. From the most western point to the most eastern point, the distance is 7 400 km.
36 of 55
4. FINANCIAL MARKET DEVELOPMENT
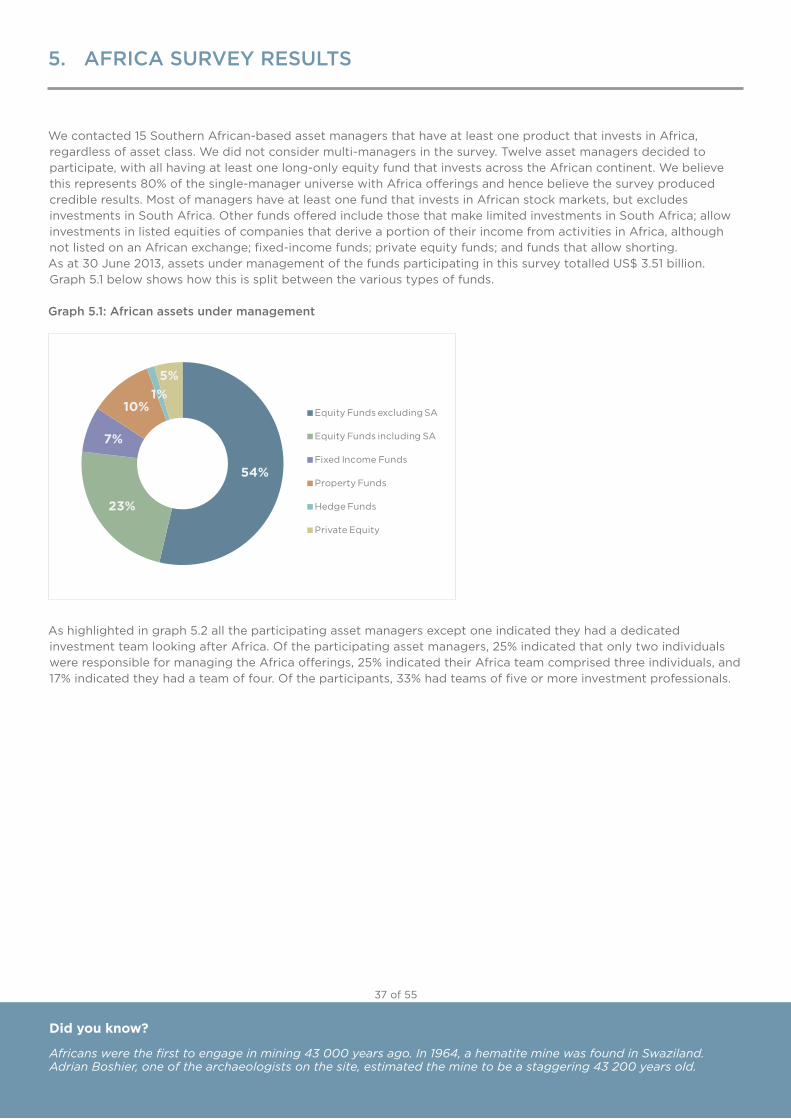
Did you know?Did you know?Did you know?
5. AFRICA SURVEY RESULTS
We contacted 15 Southern African-based asset managers that have at least one product that invests in Africa, regardless of asset class. We did not consider multi-managers in the survey. Twelve asset managers decided to participate, with all having at least one long-only equity fund that invests across the African continent. We believe this represents 80% of the single-manager universe with Africa offerings and hence believe the survey produced credible results. Most of managers have at least one fund that invests in African stock markets, but excludes investments in South Africa. Other funds offered include those that make limited investments in South Africa; allow investments in listed equities of companies that derive a portion of their income from activities in Africa, although not listed on an African exchange; fixed-income funds; private equity funds; and funds that allow shorting.Asat30June2013,assetsundermanagementofthefundsparticipatinginthissurveytotalledUS$3.51billion.Graph 5.1 below shows how this is split between the various types of funds.
Graph 5.1: African assets under management
As highlighted in graph 5.2 all the participating asset managers except one indicated they had a dedicated investment team looking after Africa. Of the participating asset managers, 25% indicated that only two individuals were responsible for managing the Africa offerings, 25% indicated their Africa team comprised three individuals, and 17% indicated they had a team of four. Of the participants, 33% had teams of five or more investment professionals.
Did you know?
Africans were the first to engage in mining 43 000 years ago. In 1964, a hematite mine was found in Swaziland. Adrian Boshier, one of the archaeologists on the site, estimated the mine to be a staggering 43 200 years old.
37 of 55
54%
23%
7%
10%1%
5%
Equity Funds excluding SA
Equity Funds including SA
Fixed Income Funds
Property Funds
Hedge Funds
Private Equity
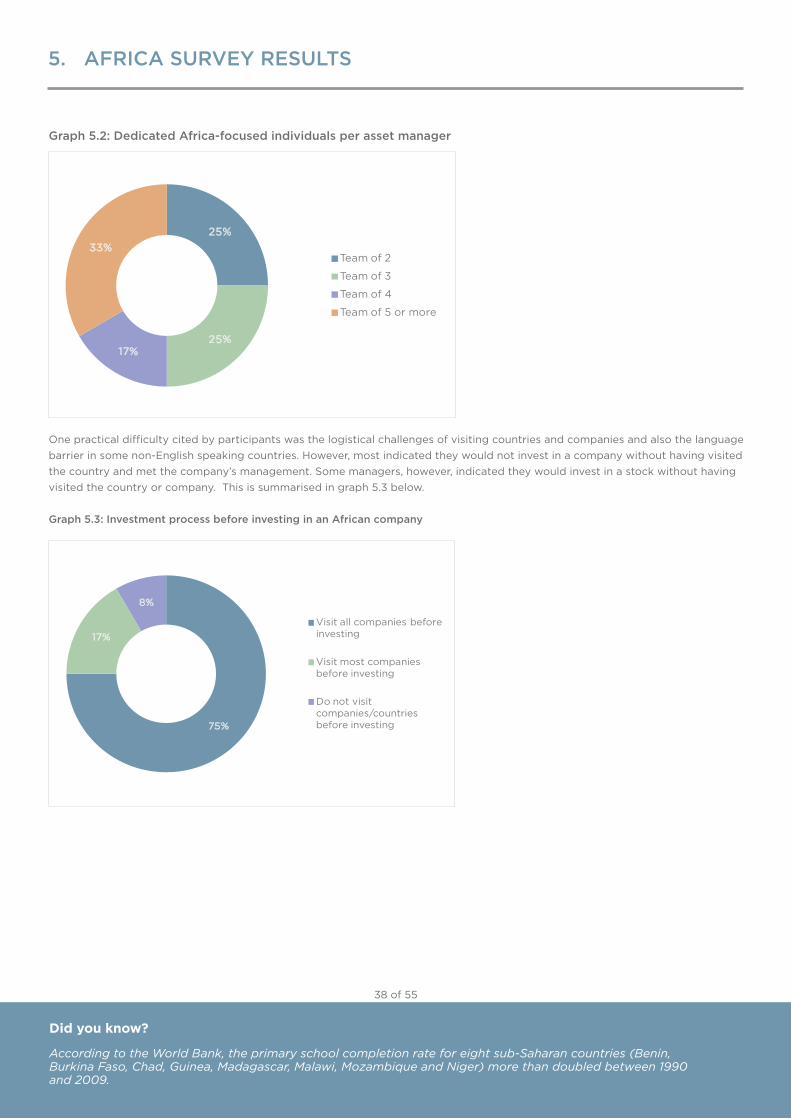
Did you know?Did you know?Did you know?
Graph 5.2: Dedicated Africa-focused individuals per asset manager
One practical difficulty cited by participants was the logistical challenges of visiting countries and companies and also the language barrier in some non-English speaking countries. However, most indicated they would not invest in a company without having visited the country and met the company’s management. Some managers, however, indicated they would invest in a stock without having visited the country or company. This is summarised in graph 5.3 below.
Graph 5.3: Investment process before investing in an African company
Did you know?
According to the World Bank, the primary school completion rate for eight sub-Saharan countries (Benin, Burkina Faso, Chad, Guinea, Madagascar, Malawi, Mozambique and Niger) more than doubled between 1990 and 2009.
25%
25%17%
33%Team of 2
Team of 3
Team of 4
Team of 5 or more
75%
17%
8%
Visit all companies before investing
Visit most companies before investing
Do not visit companies/countries before investing
38 of 55
5. AFRICA SURVEY RESULTS
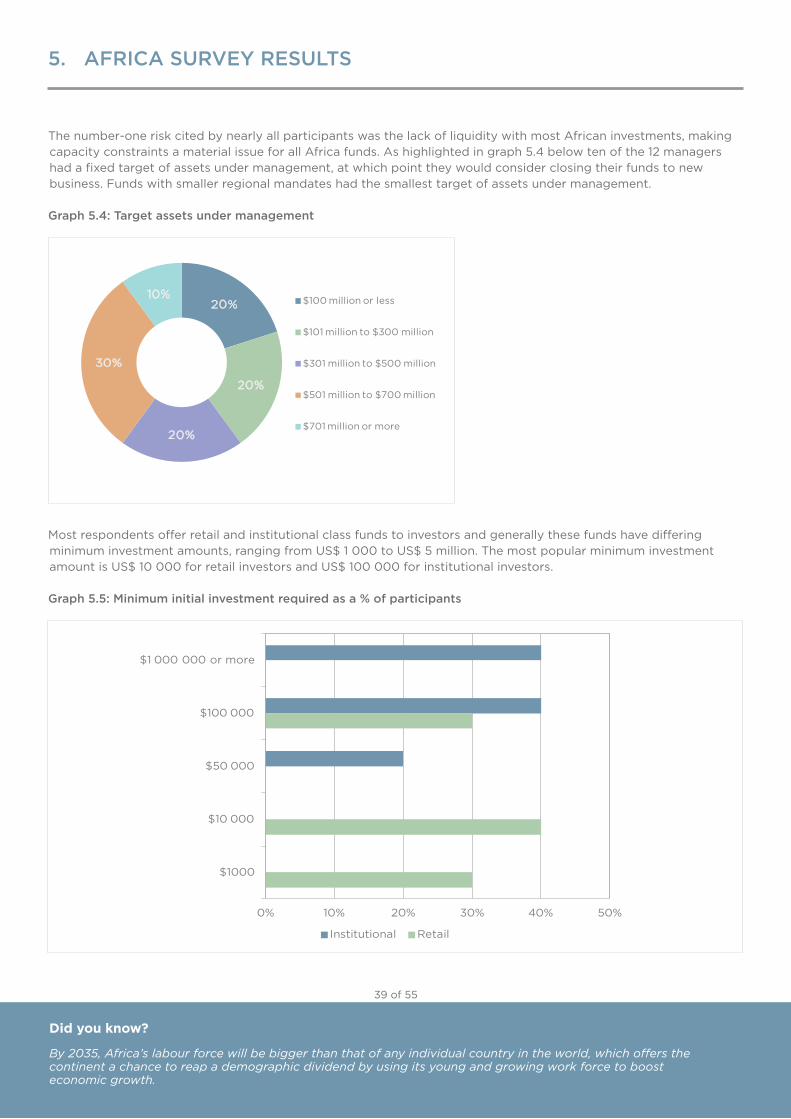
Did you know?Did you know?Did you know?
The number-one risk cited by nearly all participants was the lack of liquidity with most African investments, making capacity constraints a material issue for all Africa funds. As highlighted in graph 5.4 below ten of the 12 managers had a fixed target of assets under management, at which point they would consider closing their funds to new business. Funds with smaller regional mandates had the smallest target of assets under management.
Graph 5.4: Target assets under management
Most respondents offer retail and institutional class funds to investors and generally these funds have differing minimuminvestmentamounts,rangingfromUS$1000toUS$5million.ThemostpopularminimuminvestmentamountisUS$10000forretailinvestorsandUS$100000forinstitutionalinvestors.
Graph 5.5: Minimum initial investment required as a % of participants
Did you know?
By 2035, Africa’s labour force will be bigger than that of any individual country in the world, which offers the continent a chance to reap a demographic dividend by using its young and growing work force to boost economic growth.
0% 10% 20% 30% 40% 50%
$1000000ormore
$100000
$50000
$10000
$1000
Institutional Retail
39 of 55
20%
20%
20%
30%
10% $100millionorless
$101millionto$300million
$301millionto$500million
$501millionto$700million
$701millionormore
5. AFRICA SURVEY RESULTS
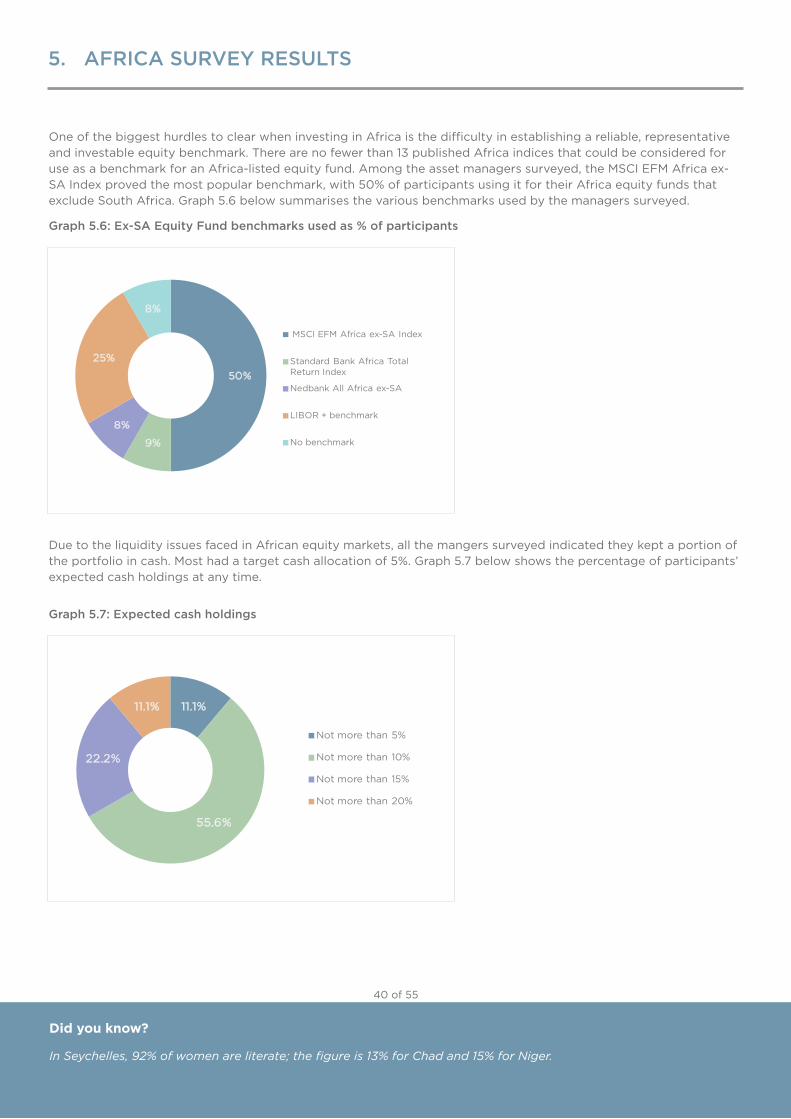
Did you know?Did you know?Did you know?
One of the biggest hurdles to clear when investing in Africa is the difficulty in establishing a reliable, representative and investable equity benchmark. There are no fewer than 13 published Africa indices that could be considered for use as a benchmark for an Africa-listed equity fund. Among the asset managers surveyed, the MSCI EFM Africa ex-SA Index proved the most popular benchmark, with 50% of participants using it for their Africa equity funds that exclude South Africa. Graph 5.6 below summarises the various benchmarks used by the managers surveyed.
Graph 5.6: Ex-SA Equity Fund benchmarks used as % of participants
Due to the liquidity issues faced in African equity markets, all the mangers surveyed indicated they kept a portion of the portfolio in cash. Most had a target cash allocation of 5%. Graph 5.7 below shows the percentage of participants’ expected cash holdings at any time.
Graph 5.7: Expected cash holdings
Did you know?
In Seychelles, 92% of women are literate; the figure is 13% for Chad and 15% for Niger.
40 of 55
50%
9%
8%
25%
8%
MSCI EFM Africa ex-SA Index
Standard Bank Africa Total Return Index
Nedbank All Africa ex-SA
LIBOR + benchmark
No benchmark
11.1%
55.6%
22.2%
11.1%
Not more than 5%
Not more than 10%
Not more than 15%
Not more than 20%
5. AFRICA SURVEY RESULTS
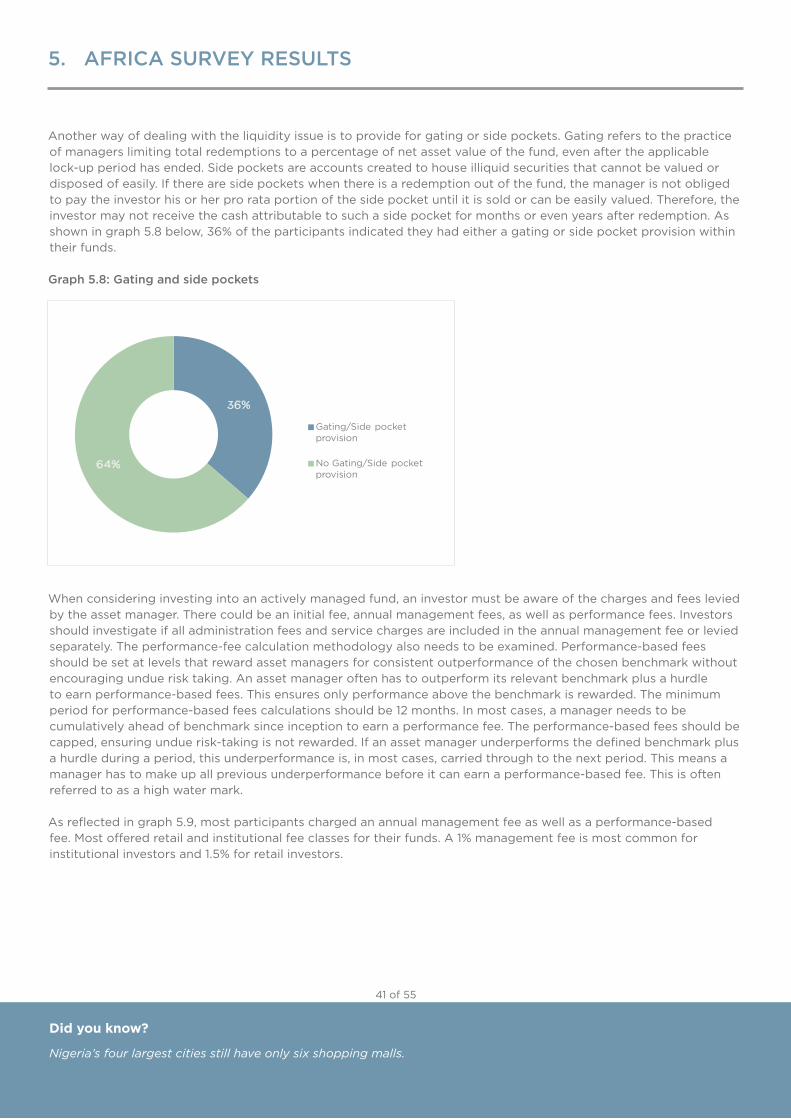
Did you know?Did you know?Did you know?
Another way of dealing with the liquidity issue is to provide for gating or side pockets. Gating refers to the practice of managers limiting total redemptions to a percentage of net asset value of the fund, even after the applicable lock-up period has ended. Side pockets are accounts created to house illiquid securities that cannot be valued or disposed of easily. If there are side pockets when there is a redemption out of the fund, the manager is not obliged to pay the investor his or her pro rata portion of the side pocket until it is sold or can be easily valued. Therefore, the investor may not receive the cash attributable to such a side pocket for months or even years after redemption. As shown in graph 5.8 below, 36% of the participants indicated they had either a gating or side pocket provision within their funds.
Graph 5.8: Gating and side pockets
When considering investing into an actively managed fund, an investor must be aware of the charges and fees levied by the asset manager. There could be an initial fee, annual management fees, as well as performance fees. Investors should investigate if all administration fees and service charges are included in the annual management fee or levied separately. The performance-fee calculation methodology also needs to be examined. Performance-based fees should be set at levels that reward asset managers for consistent outperformance of the chosen benchmark without encouraging undue risk taking. An asset manager often has to outperform its relevant benchmark plus a hurdle to earn performance-based fees. This ensures only performance above the benchmark is rewarded. The minimum period for performance-based fees calculations should be 12 months. In most cases, a manager needs to be cumulatively ahead of benchmark since inception to earn a performance fee. The performance-based fees should be capped, ensuring undue risk-taking is not rewarded. If an asset manager underperforms the defined benchmark plus a hurdle during a period, this underperformance is, in most cases, carried through to the next period. This means a manager has to make up all previous underperformance before it can earn a performance-based fee. This is often referred to as a high water mark.
As reflected in graph 5.9, most participants charged an annual management fee as well as a performance-based fee. Most offered retail and institutional fee classes for their funds. A 1% management fee is most common for institutional investors and 1.5% for retail investors.
Did you know?
Nigeria’s four largest cities still have only six shopping malls.
41 of 55
36%
64%
Gating/Side pocket provision
No Gating/Side pocket provision
5. AFRICA SURVEY RESULTS
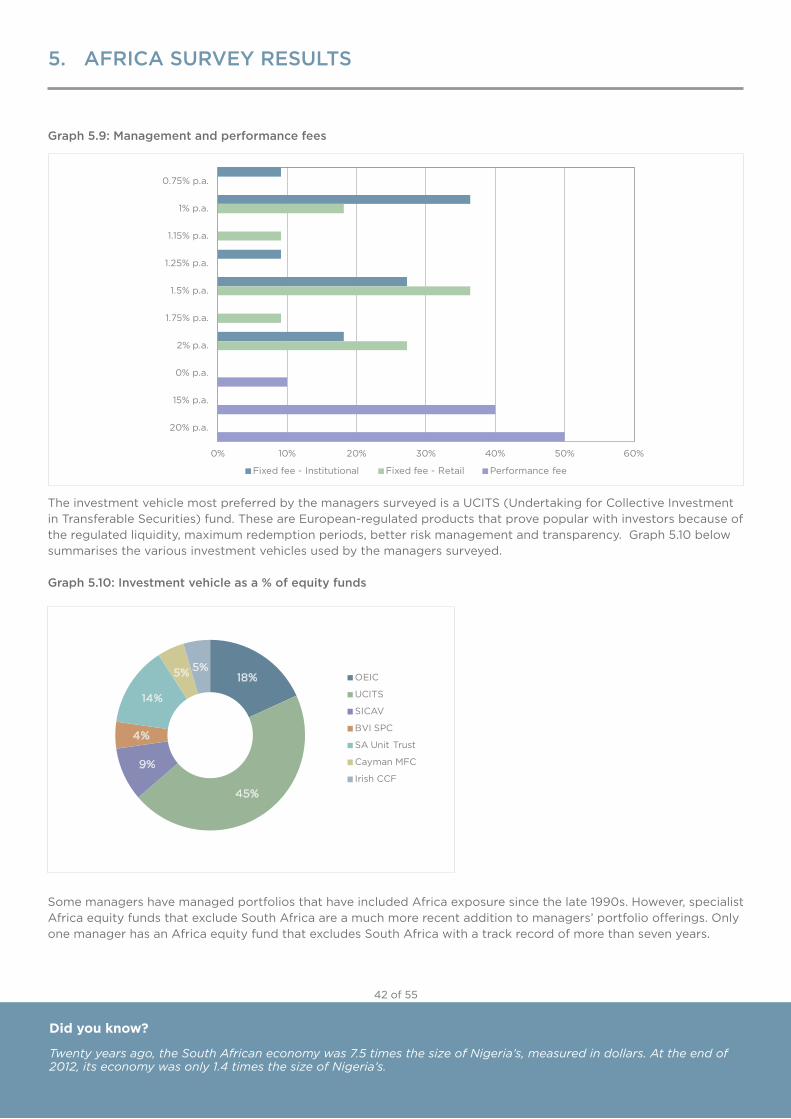
Did you know?Did you know?Did you know?
Graph 5.9: Management and performance fees
TheinvestmentvehiclemostpreferredbythemanagerssurveyedisaUCITS(UndertakingforCollectiveInvestmentin Transferable Securities) fund. These are European-regulated products that prove popular with investors because of the regulated liquidity, maximum redemption periods, better risk management and transparency. Graph 5.10 below summarises the various investment vehicles used by the managers surveyed.
Graph 5.10: Investment vehicle as a % of equity funds
Some managers have managed portfolios that have included Africa exposure since the late 1990s. However, specialist Africa equity funds that exclude South Africa are a much more recent addition to managers’ portfolio offerings. Only one manager has an Africa equity fund that excludes South Africa with a track record of more than seven years.
Did you know?
Twenty years ago, the South African economy was 7.5 times the size of Nigeria’s, measured in dollars. At the end of 2012, its economy was only 1.4 times the size of Nigeria’s.
42 of 55
0% 10% 20% 30% 40% 50% 60%
0.75% p.a.
1% p.a.
1.15% p.a.
1.25% p.a.
1.5% p.a.
1.75% p.a.
2% p.a.
0% p.a.
15% p.a.
20% p.a.
Fixed fee - Institutional Fixed fee - Retail Performance fee
18%
45%
9%
4%
14%
5% 5%OEIC
UCITS
SICAV
BVI SPC
SAUnitTrust
Cayman MFC
Irish CCF
5. AFRICA SURVEY RESULTS
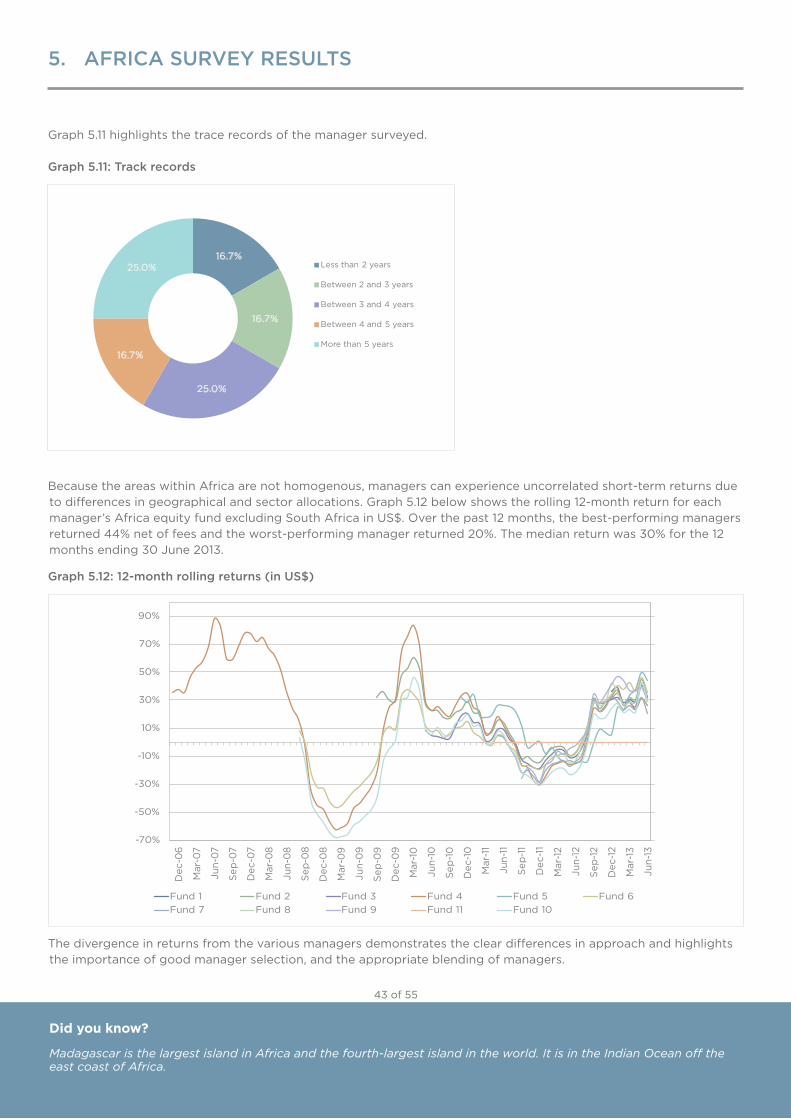
Did you know?Did you know?Did you know?
Graph 5.11 highlights the trace records of the manager surveyed.
Graph 5.11: Track records
Because the areas within Africa are not homogenous, managers can experience uncorrelated short-term returns due to differences in geographical and sector allocations. Graph 5.12 below shows the rolling 12-month return for each manager’sAfricaequityfundexcludingSouthAfricainUS$.Overthepast12months,thebest-performingmanagersreturned 44% net of fees and the worst-performing manager returned 20%. The median return was 30% for the 12 months ending 30 June 2013.
Graph 5.12: 12-month rolling returns (in US$)
The divergence in returns from the various managers demonstrates the clear differences in approach and highlights the importance of good manager selection, and the appropriate blending of managers.
Did you know?
Madagascar is the largest island in Africa and the fourth-largest island in the world. It is in the Indian Ocean off the east coast of Africa.
-70%
-50%
-30%
-10%
10%
30%
50%
70%
90%
Jun-
13
Mar
-13
Dec
-12
Sep
-12
Jun-
12
Mar
-12
Dec
-11
Sep
-11
Jun-
11
Mar
-11
Dec
-10
Sep
-10
Jun-
10
Mar
-10
Dec
-09
Sep
-09
Jun-
09
Mar
-09
Dec
-08
Sep
-08
Jun-
08
Mar
-08
Dec
-07
Sep
-07
Jun-
07
Mar
-07
Dec
-06
Fund 1 Fund 2 Fund 3 Fund 4 Fund 5 Fund 6Fund 7 Fund 8 Fund 9 Fund 11 Fund 10
43 of 55
16.7%
16.7%
25.0%
16.7%
25.0% Less than 2 years
Between 2 and 3 years
Between 3 and 4 years
Between 4 and 5 years
More than 5 years
5. AFRICA SURVEY RESULTS
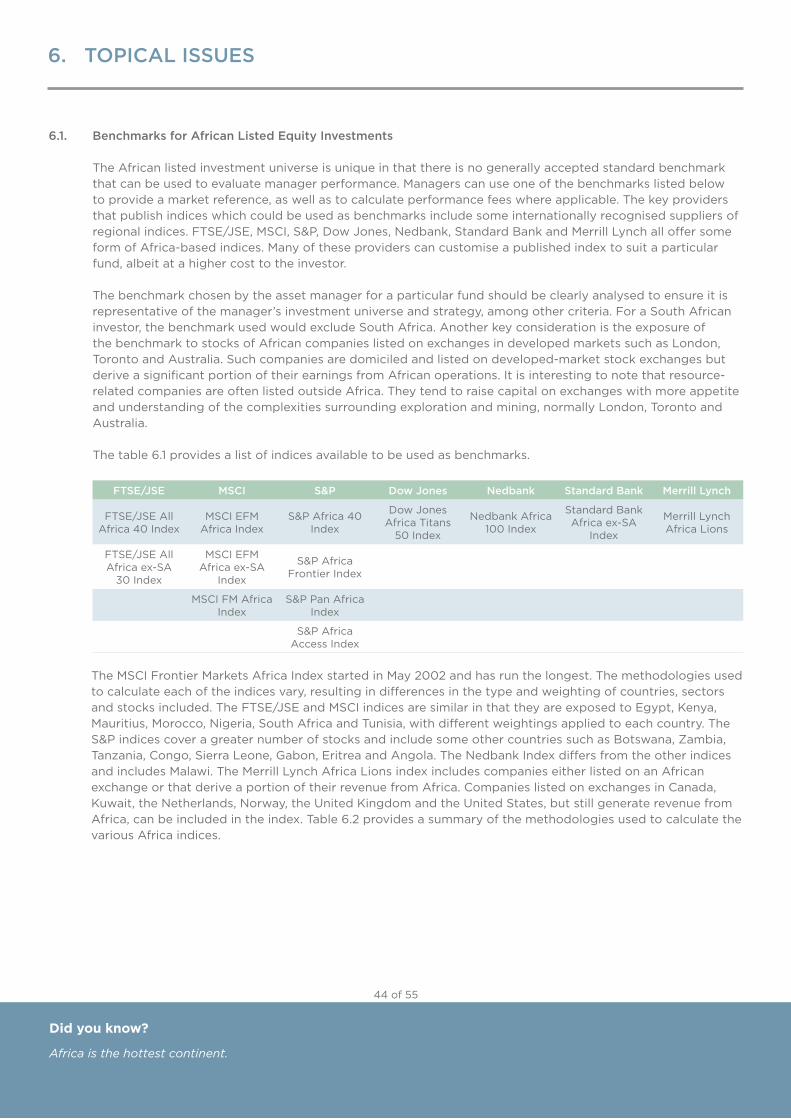
Did you know?Did you know?Did you know?
6. TOPICAL ISSUES
6.1. Benchmarks for African Listed Equity Investments
The African listed investment universe is unique in that there is no generally accepted standard benchmark that can be used to evaluate manager performance. Managers can use one of the benchmarks listed below to provide a market reference, as well as to calculate performance fees where applicable. The key providers that publish indices which could be used as benchmarks include some internationally recognised suppliers of regional indices. FTSE/JSE, MSCI, S&P, Dow Jones, Nedbank, Standard Bank and Merrill Lynch all offer some form of Africa-based indices. Many of these providers can customise a published index to suit a particular fund, albeit at a higher cost to the investor.
The benchmark chosen by the asset manager for a particular fund should be clearly analysed to ensure it is representative of the manager’s investment universe and strategy, among other criteria. For a South African investor, the benchmark used would exclude South Africa. Another key consideration is the exposure of the benchmark to stocks of African companies listed on exchanges in developed markets such as London, Toronto and Australia. Such companies are domiciled and listed on developed-market stock exchanges but derive a significant portion of their earnings from African operations. It is interesting to note that resource-related companies are often listed outside Africa. They tend to raise capital on exchanges with more appetite and understanding of the complexities surrounding exploration and mining, normally London, Toronto and Australia.
The table 6.1 provides a list of indices available to be used as benchmarks.
FTSE/JSE MSCI S&P Dow Jones Nedbank Standard Bank Merrill Lynch
FTSE/JSE All Africa 40 Index
MSCI EFM Africa Index
S&P Africa 40 Index
Dow Jones Africa Titans
50 Index
Nedbank Africa 100 Index
Standard Bank Africa ex-SA
Index
Merrill Lynch Africa Lions
FTSE/JSE All Africa ex-SA
30 Index
MSCI EFM Africa ex-SA
Index
S&P Africa Frontier Index
MSCI FM Africa Index
S&P Pan Africa Index
S&P Africa Access Index
The MSCI Frontier Markets Africa Index started in May 2002 and has run the longest. The methodologies used to calculate each of the indices vary, resulting in differences in the type and weighting of countries, sectors and stocks included. The FTSE/JSE and MSCI indices are similar in that they are exposed to Egypt, Kenya, Mauritius, Morocco, Nigeria, South Africa and Tunisia, with different weightings applied to each country. The S&P indices cover a greater number of stocks and include some other countries such as Botswana, Zambia, Tanzania, Congo, Sierra Leone, Gabon, Eritrea and Angola. The Nedbank Index differs from the other indices and includes Malawi. The Merrill Lynch Africa Lions index includes companies either listed on an African exchange or that derive a portion of their revenue from Africa. Companies listed on exchanges in Canada, Kuwait,theNetherlands,Norway,theUnitedKingdomandtheUnitedStates,butstillgeneraterevenuefromAfrica, can be included in the index. Table 6.2 provides a summary of the methodologies used to calculate the various Africa indices.
Did you know?
Africa is the hottest continent.
44 of 55
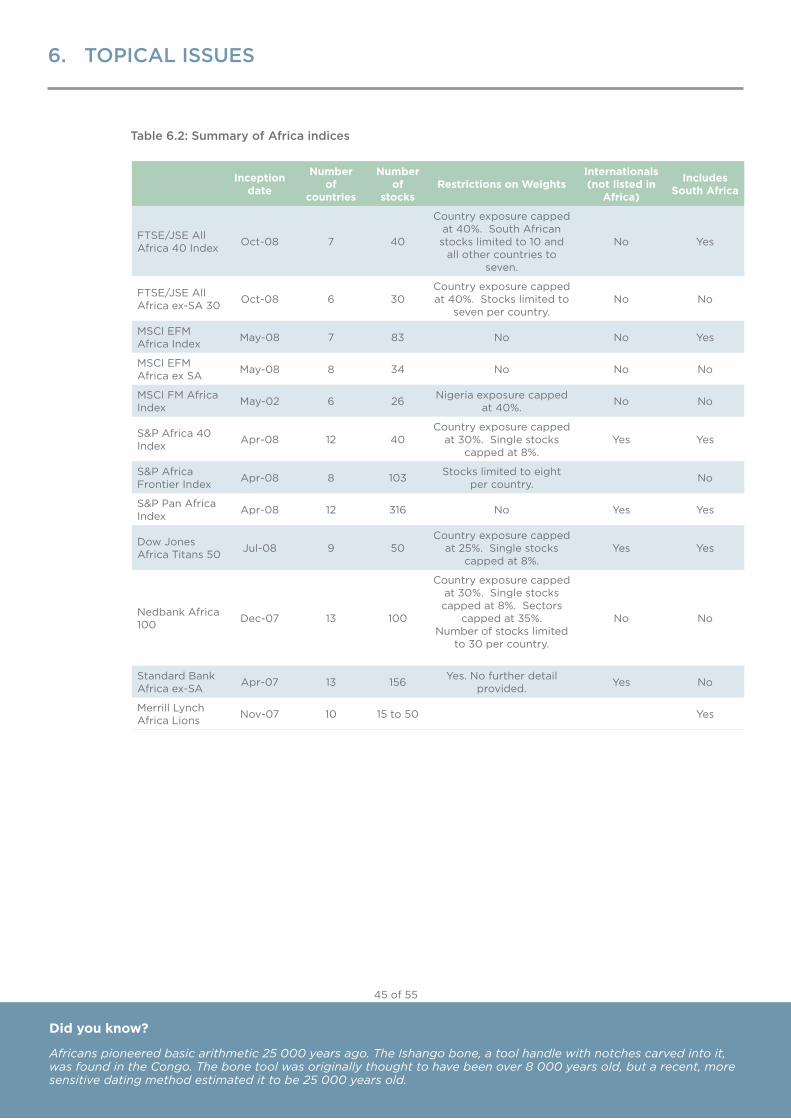
Did you know?Did you know?Did you know?
Table 6.2: Summary of Africa indices
Inception date
Number of
countries
Number of
stocksRestrictions on Weights
Internationals (not listed in
Africa)
Includes South Africa
FTSE/JSE All Africa 40 Index Oct-08 7 40
Country exposure capped at 40%. South African stocks limited to 10 and
all other countries to seven.
No Yes
FTSE/JSE All Africa ex-SA 30 Oct-08 6 30
Country exposure capped at 40%. Stocks limited to
seven per country.No No
MSCI EFM Africa Index May-08 7 83 No No Yes
MSCI EFM Africa ex SA May-08 8 34 No No No
MSCI FM Africa Index May-02 6 26 Nigeria exposure capped
at 40%. No No
S&P Africa 40 Index Apr-08 12 40
Country exposure capped at 30%. Single stocks
capped at 8%.Yes Yes
S&P Africa Frontier Index Apr-08 8 103 Stocks limited to eight
per country. No
S&P Pan Africa Index Apr-08 12 316 No Yes Yes
Dow Jones Africa Titans 50 Jul-08 9 50
Country exposure capped at 25%. Single stocks
capped at 8%.Yes Yes
Nedbank Africa 100 Dec-07 13 100
Country exposure capped at 30%. Single stocks capped at 8%. Sectors
capped at 35%.Number of stocks limited
to 30 per country.
No No
Standard Bank Africa ex-SA Apr-07 13 156 Yes. No further detail
provided. Yes No
Merrill Lynch Africa Lions Nov-07 10 15 to 50 Yes
Did you know?
Africans pioneered basic arithmetic 25 000 years ago. The Ishango bone, a tool handle with notches carved into it, was found in the Congo. The bone tool was originally thought to have been over 8 000 years old, but a recent, more sensitive dating method estimated it to be 25 000 years old.
45 of 55
6. TOPICAL ISSUES
Did you know?Did you know?Did you know?
Based on the above tables, there are a number of key findings:
• ThepossiblebenchmarkstendnottoberepresentativeoftheentireopportunitysetinAfricaasthey contain some significant country and sector biases• TheyareveryconcentratedaroundafewcountriesandheavilyweightedtowardsEgyptandNigeria in particular• Thesectorexposuresareextremelyskewedtowardsfinancialsandtelecommunications;perhaps surprisingly, there is very little resources exposure• Managersaregenerallybenchmarknon-cognisant,whichmeansportfolioswilldeviatesignificantly from any benchmarks on a stock/sector and country level, and their performance will be very volatile relative to their chosen benchmark
The range of benchmarks for asset managers offering Africa investment products varies, hence it is a very difficult but important choice to make. Some of the asset managers we surveyed offer products that are typicallyabsolute-returnincharacter,aimingtooutperformacash-basedbenchmark(suchasaUS$Libor-linked benchmark) due to the difficulties of using a published index. The complexity with using a cash-based benchmark is that the asset manager could be paid performance fees when outperforming the benchmark while taking equity-related risk. As markets develop, we would like to see more managers using a market-linked benchmark.
The benchmarks used by the managers we surveyed vary, making comparative performance attribution difficult. Some of the biggest problems with some of the Africa investment indices relate to liquidity. It can take quite a long time for cash allocated to Africa investments to be fully invested in a market. If liquidity constraints and a free-float methodology are used, the number of available constituents to invest in reduces. Where there are many stocks in a particular index, the liquidity of some of them is so low they are difficult to include in portfolios. Such a small number of shares may not reflect the market universe, rendering performance comparisons useless. Another challenge is data availability, but having said this, we have seen asset managers beginning to create products to track bespoke indices.
Did you know?66% of the world’s chocolate comes from Africa.
46 of 55
6. TOPICAL ISSUES
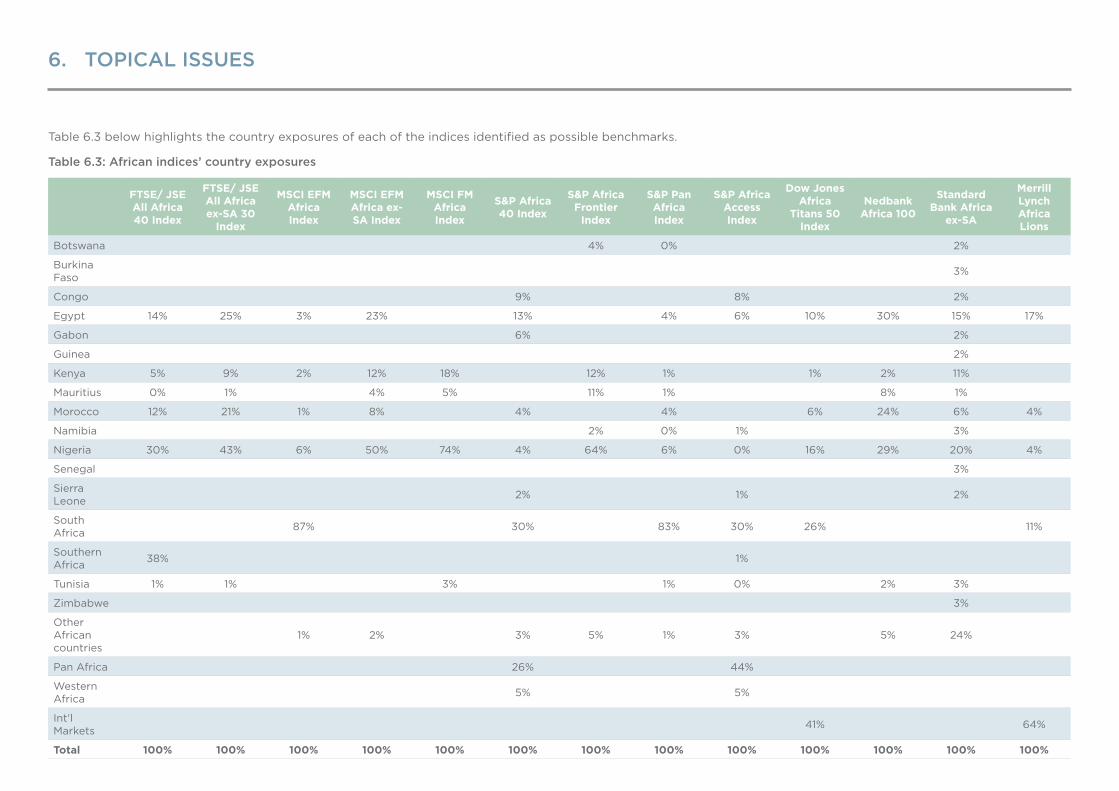
6. TOPICAL ISSUES
Table 6.3 below highlights the country exposures of each of the indices identified as possible benchmarks.
Table 6.3: African indices’ country exposures
FTSE/ JSE All Africa 40 Index
FTSE/ JSE All Africa ex-SA 30
Index
MSCI EFM Africa Index
MSCI EFM Africa ex-SA Index
MSCI FM Africa Index
S&P Africa 40 Index
S&P Africa Frontier
Index
S&P Pan Africa Index
S&P Africa Access Index
Dow Jones Africa
Titans 50 Index
Nedbank Africa 100
Standard Bank Africa
ex-SA
Merrill Lynch Africa Lions
Botswana 4% 0% 2%
Burkina Faso 3%
Congo 9% 8% 2%
Egypt 14% 25% 3% 23% 13% 4% 6% 10% 30% 15% 17%
Gabon 6% 2%
Guinea 2%
Kenya 5% 9% 2% 12% 18% 12% 1% 1% 2% 11%
Mauritius 0% 1% 4% 5% 11% 1% 8% 1%
Morocco 12% 21% 1% 8% 4% 4% 6% 24% 6% 4%
Namibia 2% 0% 1% 3%
Nigeria 30% 43% 6% 50% 74% 4% 64% 6% 0% 16% 29% 20% 4%
Senegal 3%
Sierra Leone 2% 1% 2%
South Africa 87% 30% 83% 30% 26% 11%
Southern Africa 38% 1%
Tunisia 1% 1% 3% 1% 0% 2% 3%
Zimbabwe 3%
Other African countries
1% 2% 3% 5% 1% 3% 5% 24%
Pan Africa 26% 44%
Western Africa 5% 5%
Int’l Markets 41% 64%
Total 100% 100% 100% 100% 100% 100% 100% 100% 100% 100% 100% 100% 100%
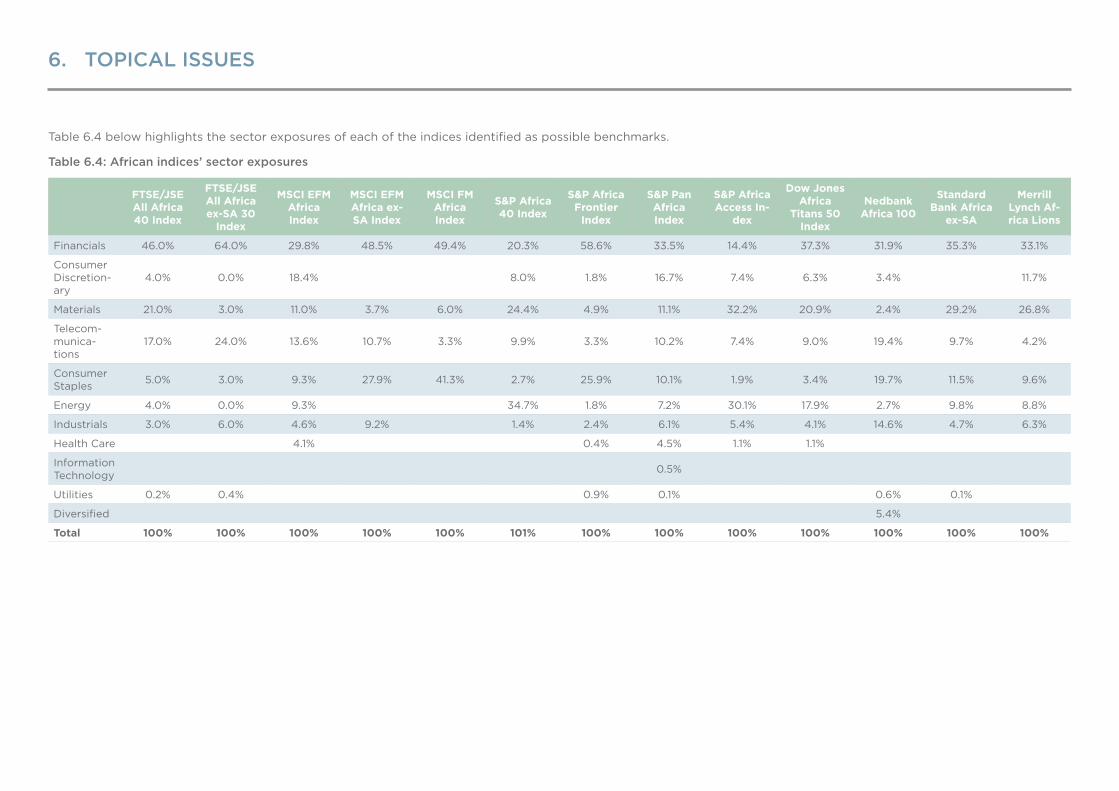
6. TOPICAL ISSUES
Table 6.4 below highlights the sector exposures of each of the indices identified as possible benchmarks.
Table 6.4: African indices’ sector exposures
FTSE/JSE All Africa 40 Index
FTSE/JSE All Africa ex-SA 30
Index
MSCI EFM Africa Index
MSCI EFM Africa ex-SA Index
MSCI FM Africa Index
S&P Africa 40 Index
S&P Africa Frontier
Index
S&P Pan Africa Index
S&P Africa Access In-
dex
Dow Jones Africa
Titans 50 Index
Nedbank Africa 100
Standard Bank Africa
ex-SA
Merrill Lynch Af-rica Lions
Financials 46.0% 64.0% 29.8% 48.5% 49.4% 20.3% 58.6% 33.5% 14.4% 37.3% 31.9% 35.3% 33.1%
Consumer Discretion-ary
4.0% 0.0% 18.4% 8.0% 1.8% 16.7% 7.4% 6.3% 3.4% 11.7%
Materials 21.0% 3.0% 11.0% 3.7% 6.0% 24.4% 4.9% 11.1% 32.2% 20.9% 2.4% 29.2% 26.8%
Telecom-munica-tions
17.0% 24.0% 13.6% 10.7% 3.3% 9.9% 3.3% 10.2% 7.4% 9.0% 19.4% 9.7% 4.2%
Consumer Staples 5.0% 3.0% 9.3% 27.9% 41.3% 2.7% 25.9% 10.1% 1.9% 3.4% 19.7% 11.5% 9.6%
Energy 4.0% 0.0% 9.3% 34.7% 1.8% 7.2% 30.1% 17.9% 2.7% 9.8% 8.8%
Industrials 3.0% 6.0% 4.6% 9.2% 1.4% 2.4% 6.1% 5.4% 4.1% 14.6% 4.7% 6.3%
Health Care 4.1% 0.4% 4.5% 1.1% 1.1%
Information Technology 0.5%
Utilities 0.2% 0.4% 0.9% 0.1% 0.6% 0.1%
Diversified 5.4%
Total 100% 100% 100% 100% 100% 101% 100% 100% 100% 100% 100% 100% 100%
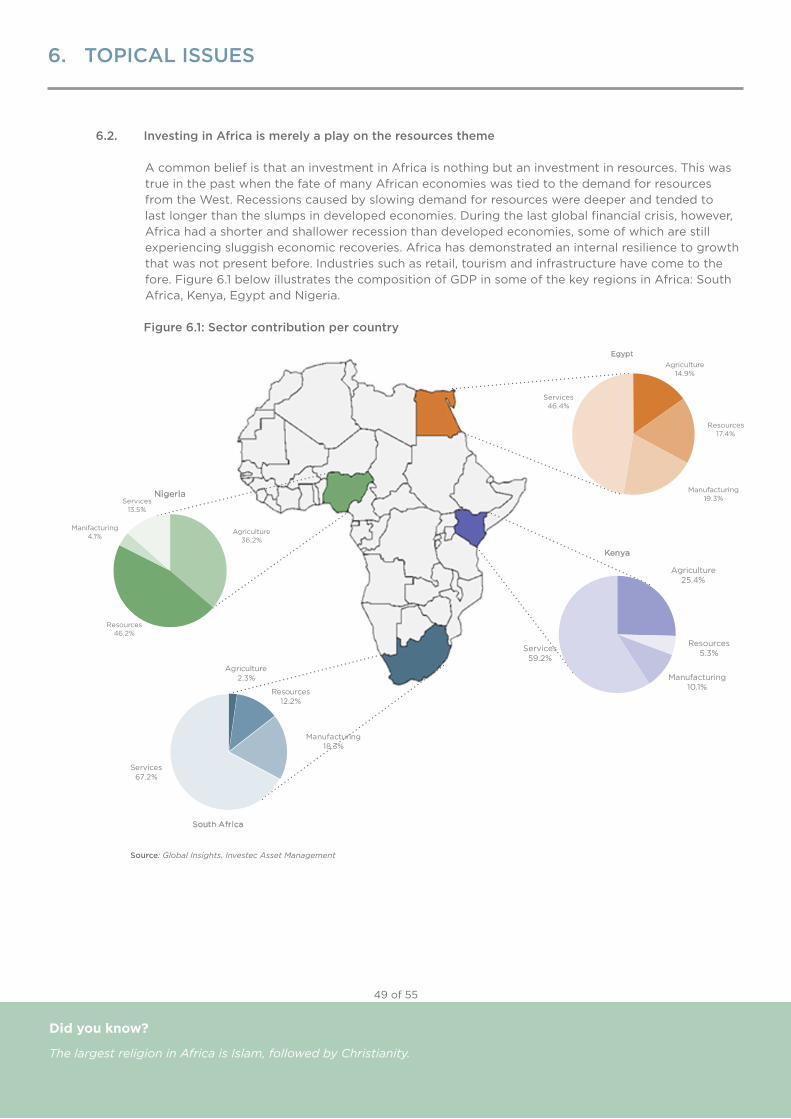
Did you know?Did you know?Did you know?
6.2. Investing in Africa is merely a play on the resources theme
A common belief is that an investment in Africa is nothing but an investment in resources. This was true in the past when the fate of many African economies was tied to the demand for resources from the West. Recessions caused by slowing demand for resources were deeper and tended to last longer than the slumps in developed economies. During the last global financial crisis, however, Africa had a shorter and shallower recession than developed economies, some of which are still experiencing sluggish economic recoveries. Africa has demonstrated an internal resilience to growth that was not present before. Industries such as retail, tourism and infrastructure have come to the fore. Figure 6.1 below illustrates the composition of GDP in some of the key regions in Africa: South Africa, Kenya, Egypt and Nigeria.
Figure 6.1: Sector contribution per country
Source: Global Insights, Investec Asset Management
Did you know?
The largest religion in Africa is Islam, followed by Christianity.
Agriculture36.2%
Resources46.2%
Manifacturing4.1%
Services13.5%
Nigeria
Agriculture2.3%
Resources12.2%
Services67.2%
South Africa
Manufacturing18.3%
Agriculture25.4%
Resources5.3%
Manufacturing10.1%
Services59.2%
Kenya
Agriculture14.9%
Resources17.4%
Manufacturing19.3%
Services46.4%
Egypt
49 of 55
6. TOPICAL ISSUES
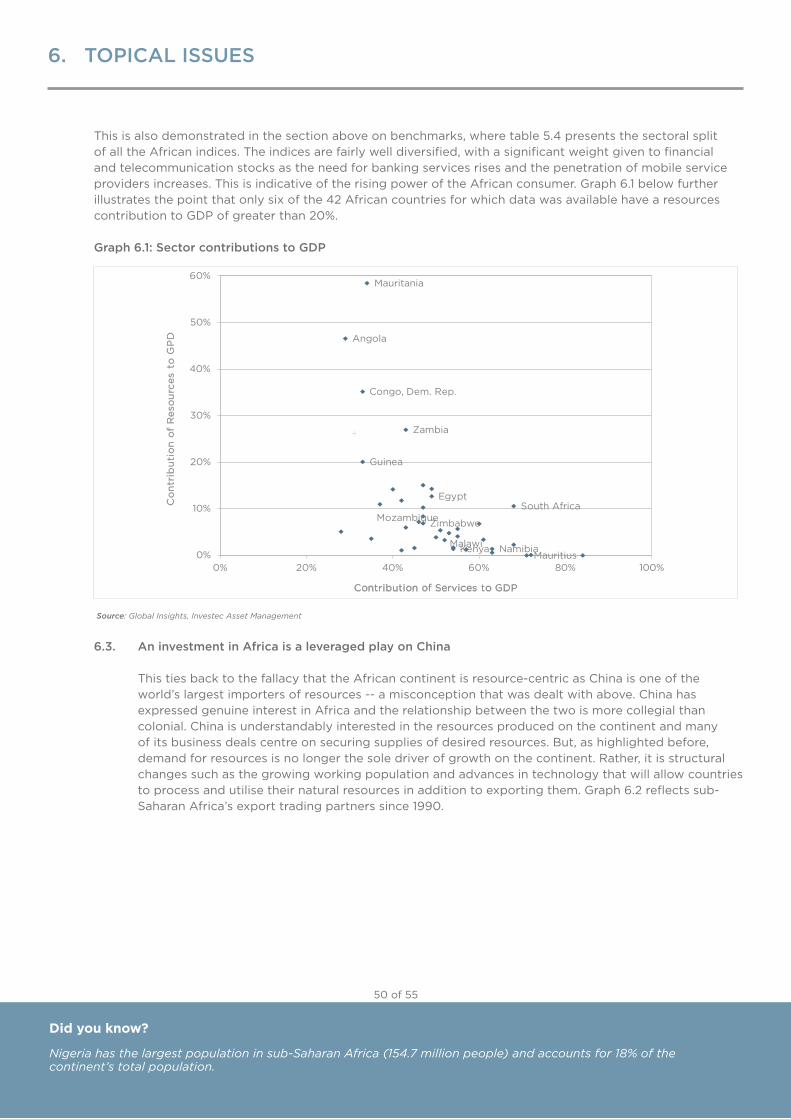
Did you know?Did you know?Did you know?
This is also demonstrated in the section above on benchmarks, where table 5.4 presents the sectoral splitof all the African indices. The indices are fairly well diversified, with a significant weight given to financialand telecommunication stocks as the need for banking services rises and the penetration of mobile serviceproviders increases. This is indicative of the rising power of the African consumer. Graph 6.1 below furtherillustrates the point that only six of the 42 African countries for which data was available have a resourcescontribution to GDP of greater than 20%.
Graph 6.1: Sector contributions to GDP
Source: Global Insights, Investec Asset Management
6.3. An investment in Africa is a leveraged play on China
This ties back to the fallacy that the African continent is resource-centric as China is one of the world’s largest importers of resources -- a misconception that was dealt with above. China has expressed genuine interest in Africa and the relationship between the two is more collegial than colonial. China is understandably interested in the resources produced on the continent and many of its business deals centre on securing supplies of desired resources. But, as highlighted before, demand for resources is no longer the sole driver of growth on the continent. Rather, it is structural changes such as the growing working population and advances in technology that will allow countries to process and utilise their natural resources in addition to exporting them. Graph 6.2 reflects sub-Saharan Africa’s export trading partners since 1990.
Did you know?
Nigeria has the largest population in sub-Saharan Africa (154.7 million people) and accounts for 18% of the continent’s total population.
South Africa
Zimbabwe
MauritiusKenya
Egypt
Angola
Malawi Namibia
Mozambique
Mauritania
Congo, Dem. Rep.
Zambia
Guinea
0%
10%
20%
30%
40%
50%
60%
0% 20% 40% 60% 80% 100%
Co
ntr
ibu
tio
n o
f R
eso
urc
es t
o G
PD
Contribution of Services to GDP
50 of 55
6. TOPICAL ISSUES
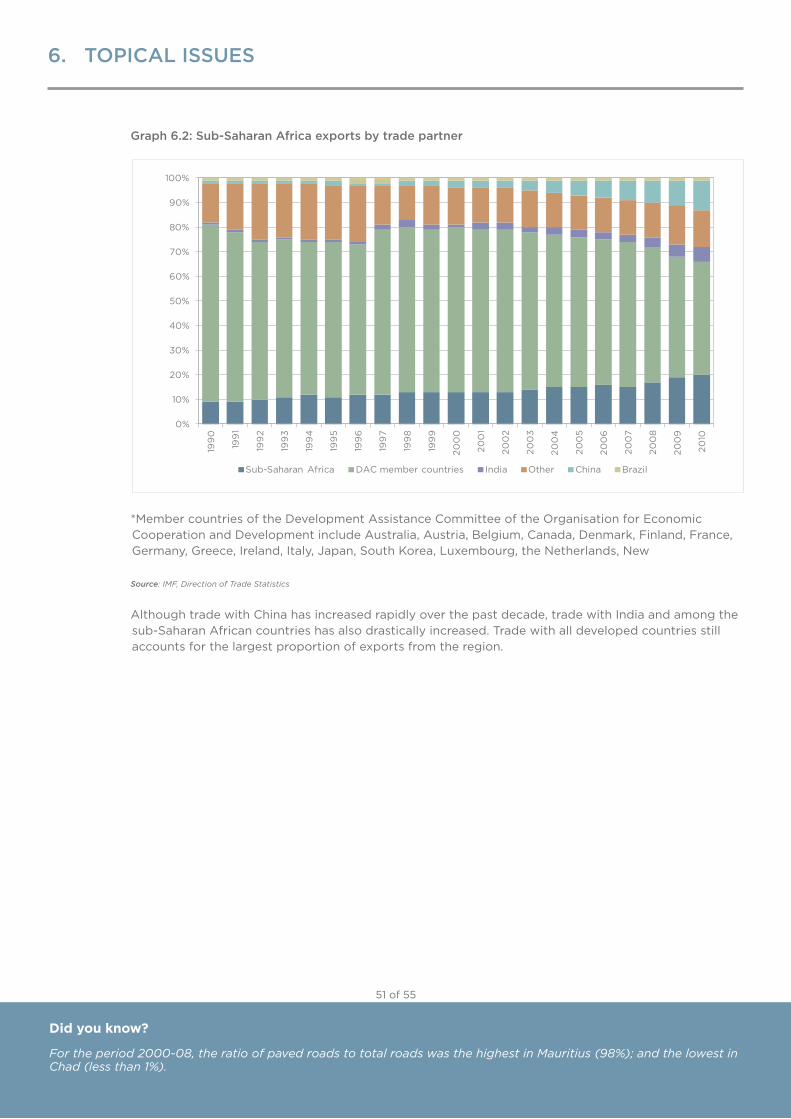
Did you know?Did you know?Did you know?
Graph 6.2: Sub-Saharan Africa exports by trade partner
*Member countries of the Development Assistance Committee of the Organisation for Economic Cooperation and Development include Australia, Austria, Belgium, Canada, Denmark, Finland, France, Germany, Greece, Ireland, Italy, Japan, South Korea, Luxembourg, the Netherlands, New
Source: IMF, Direction of Trade Statistics
Although trade with China has increased rapidly over the past decade, trade with India and among the sub-Saharan African countries has also drastically increased. Trade with all developed countries still accounts for the largest proportion of exports from the region.
Did you know?
For the period 2000-08, the ratio of paved roads to total roads was the highest in Mauritius (98%); and the lowest in Chad (less than 1%).
0%
10%
20%
30%
40%
50%
60%
70%
80%
90%
100%
199
0
199
1
199
2
199
3
199
4
199
5
199
6
199
7
199
8
199
9
200
0
200
1
200
2
200
3
200
4
200
5
200
6
200
7
200
8
200
9
2010
Sub-Saharan Africa DAC member countries India Other China Brazil
51 of 55
6. TOPICAL ISSUES
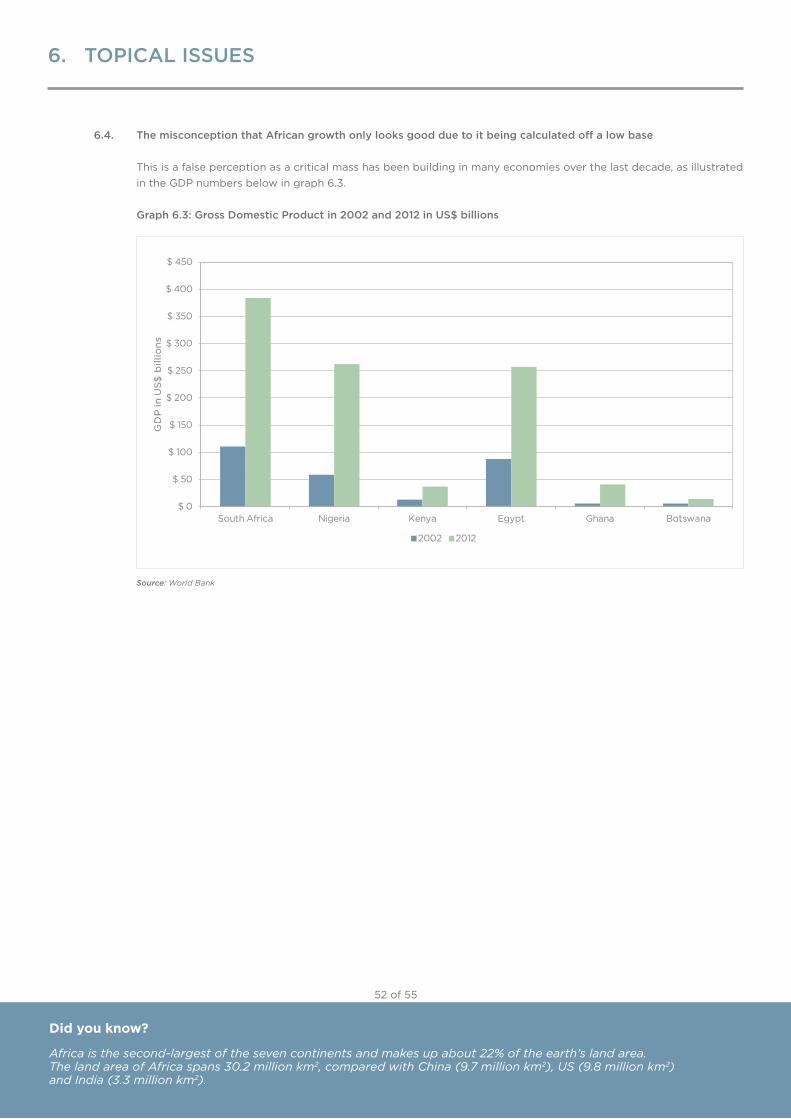
Did you know?Did you know?Did you know?
6.4. The misconception that African growth only looks good due to it being calculated off a low base
This is a false perception as a critical mass has been building in many economies over the last decade, as illustrated in the GDP numbers below in graph 6.3.
Graph 6.3: Gross Domestic Product in 2002 and 2012 in US$ billions
Source: World Bank
Did you know?
Africa is the second-largest of the seven continents and makes up about 22% of the earth’s land area. The land area of Africa spans 30.2 million km2, compared with China (9.7 million km2), US (9.8 million km2) and India (3.3 million km2).
$0
$50
$100
$150
$200
$250
$300
$350
$400
$450
South Africa Nigeria Kenya Egypt Ghana Botswana
GDPinUS$billions
2002 2012
52 of 55
6. TOPICAL ISSUES
Did you know?Did you know?Did you know?
7. IMPLICATIONS FOR TRUSTEES
Regulation 28 of the Pension Funds Act stipulates that funds, advisers and trustees should ensure funds’ assets, including foreign assets, are appropriate for their liabilities. These liabilities are generally long term, so investing in Africa can add value to retirement benefits, assuming an appropriately long-term view is taken by pension-fund trustees and members. However, inclusion of such a portfolio may not be appropriate for members close to retirement who are concerned about volatility and liquidity constraints. But this will depend on the size of the allocation as well as on what members plan to do with their fund credits once they retire. Given the allocation is likely to be small, any liquidity constraints could be managed effectively. This highlights the need for trustees to have a carefully considered default option that systematically reduces volatile and less liquid asset classes as members approach retirement age.
Including an investment into Africa also increases the governance burden on trustees from communication, manager-selection and monitoring perspectives. Although any allocation to Africa is likely to be small, trustees should carefully explain the rationale for such an investment to members so that they are aware of the potential rewards and risks. Protests in Egypt in 2011 and 2013 highlight the vulnerability to unforeseen events and it is likely that members will question such an allocation when there is negative news from time to time.
Given the nature of investing in Africa, trustees will need to appoint specialist managers with local networks, experience and a demonstrable track record of investing into the continent. The number of managers offering investment products that invest in Africa continues to expand and their performance can be very different over time. Given this, trustees may consider appointing more than one manager, depending on the size of the allocation, for diversification.
The number of benchmarks available to track the performance of African bourses is growing, which raises the profile of these frontier markets. Trustees should remember that the performance of any manager will be volatile relative to any benchmark over the short term.
While there are diversification benefits and opportunities for higher returns by investing in Africa, investors and asset managers must be aware that any investments should have a long-term focus.
Given the likely size of initial allocations, as well as the practical issues around segregated mandates -- for example, the difficulties in setting up custody accounts in many less developed markets -- it is likely that many investors will use pooled funds to access Africa investments. It is then important to consider the legal structure of the pooled fund.
For less liquid investments, trustees of defined contribution funds could consider using side pockets to deal with this issue. As explained earlier, side pockets are accounts created to house illiquid securities that cannot be valued or disposed of easily. However, this would require further investigation and depend on whether the rules of funds allowed this. Member education and communication will be very important if this option is used.
Trustees must also consider rebalancing the rules so that the portfolio does not increase too much above its target weight, while remembering that there might be certain notice periods to withdraw from portfolios. It would also be possible to use cash flows to rebalance portfolios.
Below is a list of questions trustees should ask when selecting an asset manager for a listed equity portfolio:
• Whatisthebenchmarkoftheportfolio?• Whatarethefeesandhowareperformancefeesstructured?• Howbigistheinvestmentteamandhowmuchrelevantexperiencedoesithave?• Whatisthephilosophyandprocessofthemanageranddoesitdoon-the-groundresearch?• Whataretheredemptiontermsandrestrictions?• Whatisthelegalstructureofthefund?• Howmanystocksaretypicallywithintheportfolio?• Towhatextentcanotherassetclassesbeusedintheportfolio?• TowhatextentwillstockslistedoutsideAfricabeused?• Arethereanystockorcountryrestrictionsinthemandate?
Did you know?
In 2010, it took 216 days to start a business in Guinea-Bissau; it took three days in Rwanda.
53 of 55
Did you know?Did you know?Did you know?
8. CONCLUSION
Africa markets can be volatile and do have higher risks than investing in developed markets. However, they also offer real opportunities for long-term investors who understand the risks.
In our opinion, investors with the appropriate risk appetite should consider making a small initial allocation to an Africa investment as part of a well-diversified portfolio and commit to it for the long term. The initial allocation could be a listed equity component, but investors should monitor the development of other asset classes and be ready to take advantage as opportunities arise.
Did you know?
South Africa is the only nation in the world to voluntarily abandon its nuclear weapons programme.
54 of 55
REFERENCES
1. 2013 East Africa Private Equity Confidence Survey: Seeing Beyond the Waves, April 2013. Deloitte and Africa Assets
2. A Comparative Analysis of the Performance of African Stock Markets for the Period 2008 – 2009 Volume II, June 2010, Capital
Markets Authority
3. A Continent on the Move, McKinsey, 2010
4. Africa: The next investment frontier, Investec Asset Management, 2012
5. An update on new Africa Funds, GraySwan, 2013
6. Andrianaivo,M,Yartey,C,A.UnderstandingtheGrowthofAfricanFinancialMarkets,August2009.IMFWorkingPaper
7. Cabot-Alletzhauser, A, Hu, B, Matthews, M. Africa: The “Lost Continent” or the “Next China”, Alexander Forbes, 2012
8. Corruption Perception Index, Transparency International, 2011
9. Demographic Dividend or Time Bomb, African Development Bank Group, 2013
10. Dr Moyo, D. Investing in the Frontier: Placing the Opportunity in a Global Context, 66th CFA Institute Annual Conference, 2013
11. Fauconnier, C, Ramkhelawan-Bhana, N. RMB Global Markets Research: Sub-Saharan Africa monthly, July 2013. Rand Merchant
Bank
12. Fiscal Monitor, IMF, April 2013
13. Freedom in the World 2013, Freedom House, 2013
14. Global Limited Partners Survey: Investors’ Views of Private Equity in Emerging Markets, 2013. Emerging Markets Private Equity
Association
15. Guerrero Blanco, T. Frontier Markets: A World of Opportunities, 2013
16. Ibrahim Index of African Governance, Mo Ibrahim Foundation, (http://www.moibrahimfoundation.org)
17. Interesting Chart #112: South African economy vs. Nigerian economy, Stanlib Asset Management, 2013
18. InternationalMonetaryFund(2011):DirectionofTradeStatistics.Mimas,UniversityofManchester.
19. Investec Asset Management, Global Insights Forum 2012,
20. Lyudvig, A. Right Choice. Africa AM
21. Mu, Y, Phelps, P, Stotsky, J.G. Bond Markets in Africa, January 2013. IMF Working Paper
22. Nkontchou, C. Recent Evolution of the African Financial Markets, March 2010. Private Sector & Development
23. Private Equity in the Shadow of Giants. Southern African Venture Capital and Private Equity Association
24. Private Equity Roundup – Africa, February 2013. Ernst & Young
25. Senbet, L, Otchere, I. African Stock Markets, March 2008. African Finance for the 21st Century High-Level Seminar organised
by the IMF Institute in collaboration with the Joint Africa Institute, Tunisia
26. Shields, J. AFRICA IN 2012: Odds in Africa’s Favor as Continent Walks Economic Tightrope, January 2012. http://www.imf.org/
external/pubs/ft/survey/so/2012/car011012a.htm
27. tress-testing Africa’s Recent Growth and Poverty Performance, World Bank Development Prospects Group, 2013
28. Sub-Saharan Africa Stock Markets 2011 Review and 2012 Outlook, February 2012. Imara Investing in Africa
29. The Growth Potential of sub-Saharan Africa, August 2012. Investec Asset Management
30. Theron, G, de Bruin, K. Africa All Equity Survey, February 2013. GraySwan Investments
31. Theron, G, de Bruin, K. Africa Listed Equity: Trackers and ETFs, March 2013. GraySwan Investments
32. Theron, G, de Bruin, K. Africa: Equity Benchmarks, February 2013. GraySwan Investments
33. Theron, G, Theron, D. An update on new Africa Funds, April 2013. GraySwan Investments
34. Verster, J,P. Focus on: Corporate Bonds, May 2012. Africa FM.
35. WorldEconomicOutlookUpdate,IMF,July2013
36. World Economic Outlook, IMF, April 2013
37. WorldPopulationProspects:The2012Revision,UnitedNationsPopulationDivision
38. WorldUrbanisationProspects:The2011Revision,UnitedNations
39. Yartey,C,A, Komla, C. Stock Market Development in sub-Saharan Africa: Critical Issues and Challenges, August 2007. IMF
Working Paper
40. Zhou, D. China in Africa: 6 Myths, 2012. http://www.policymic.com/articles/10632/6-myths-about-the-evils-of-chinese-
influence-on-african-economic-development