Embed Size (px)
Citation preview

GLOBAL CONNECTIVITY QUARTERLY
©2015 Raymond James & Associates, Inc., member New York Stock Exchange/SIPC
INVESTMENT BANKING
1
GLOBAL CONNECTIVITY QUARTERLY
GLOBAL CONNECTIVITY COVERAGE TEAM
Information obtained from third-party sources is considered reliable, but we do not guarantee that the information herein is accurate or complete. This report was prepared within Raymond James & Associates' Investment Banking Department and is for information
purposes only. This report is not a product of Raymond James & Associates' Research Department; recipients of this report should not interpret the information herein as sufficient grounds for an investment decision or any other decision. The report shall not constitute
an offer to sell or the solicitation of an offer to buy any of the securities mentioned herein; past performance does not guarantee future results. This report includes logos or other words or devices that may be registered trademarks of their respective owners. Such use is
solely for purposes of convenience in referring to the trademark owners and their products/services. This report and its contents are not endorsed, sponsored or affiliated with any trademark owner. Raymond James and its affiliates are not affiliated with any trademark
owner but may provide certain financial services to one or more trademark owners or their affiliates.
SUMMER 2015
Frank McGrew, Managing Director
(615) 645-6797
Michael Stockburger, Senior Vice President
(901) 579-2705
Jason Lowry, Associate
(615) 645-6802
GLOBAL CONNECTIVITY QUARTERLY
©2015 Raymond James & Associates, Inc., member New York Stock Exchange/SIPC
INVESTMENT BANKING
2
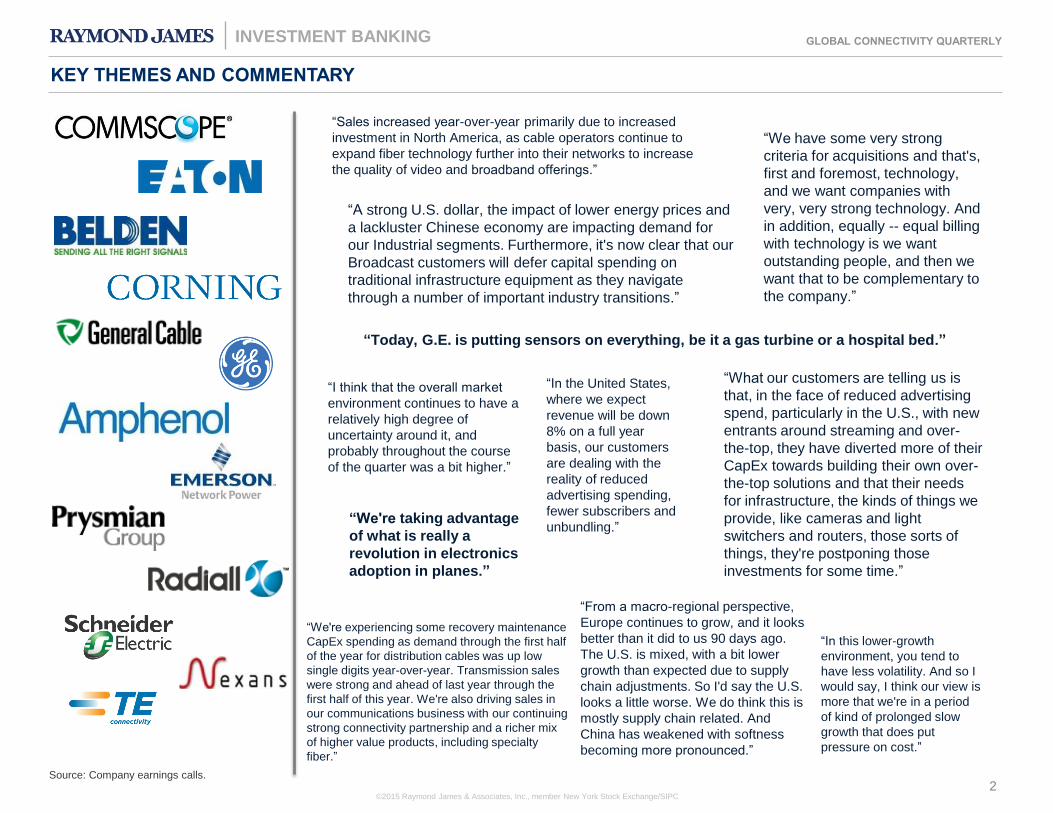
KEY THEMES AND COMMENTARY
Source: Company earnings calls.
“Sales increased year-over-year primarily due to increased
investment in North America, as cable operators continue to
expand fiber technology further into their networks to increase
the quality of video and broadband offerings.”
“Today, G.E. is putting sensors on everything, be it a gas turbine or a hospital bed.”
“We have some very strong
criteria for acquisitions and that's,
first and foremost, technology,
and we want companies with
very, very strong technology. And
in addition, equally -- equal billing
with technology is we want
outstanding people, and then we
want that to be complementary to
the company.”
“In this lower-growth
environment, you tend to
have less volatility. And so I
would say, I think our view is
more that we're in a period
of kind of prolonged slow
growth that does put
pressure on cost.”
“What our customers are telling us is
that, in the face of reduced advertising
spend, particularly in the U.S., with new
entrants around streaming and over-
the-top, they have diverted more of their
CapEx towards building their own over-
the-top solutions and that their needs
for infrastructure, the kinds of things we
provide, like cameras and light
switchers and routers, those sorts of
things, they're postponing those
investments for some time.”
“We're experiencing some recovery maintenance
CapEx spending as demand through the first half
of the year for distribution cables was up low
single digits year-over-year. Transmission sales
were strong and ahead of last year through the
first half of this year. We're also driving sales in
our communications business with our continuing
strong connectivity partnership and a richer mix
of higher value products, including specialty
fiber.”
“From a macro-regional perspective,
Europe continues to grow, and it looks
better than it did to us 90 days ago.
The U.S. is mixed, with a bit lower
growth than expected due to supply
chain adjustments. So I'd say the U.S.
looks a little worse. We do think this is
mostly supply chain related. And
China has weakened with softness
becoming more pronounced.”
“We're taking advantage
of what is really a
revolution in electronics
adoption in planes.”
“I think that the overall market
environment continues to have a
relatively high degree of
uncertainty around it, and
probably throughout the course
of the quarter was a bit higher.”
“In the United States,
where we expect
revenue will be down
8% on a full year
basis, our customers
are dealing with the
reality of reduced
advertising spending,
fewer subscribers and
unbundling.”
“A strong U.S. dollar, the impact of lower energy prices and
a lackluster Chinese economy are impacting demand for
our Industrial segments. Furthermore, it's now clear that our
Broadcast customers will defer capital spending on
traditional infrastructure equipment as they navigate
through a number of important industry transitions.”

GLOBAL CONNECTIVITY QUARTERLY
©2015 Raymond James & Associates, Inc., member New York Stock Exchange/SIPC
INVESTMENT BANKING
3
85%
95%
105%
115%
125%
135%
145%
155%
165%
Aug-12 Nov-12 Feb-13 May-13 Aug-13 Nov-13 Feb-14 May-14 Aug-14 Nov-14 Feb-15 May-15 Aug-15
Communications Connectivity Wire & Cable Power Connectivity S&P 500
# of Median ∆ in Stock Price Median % of 52 - Median TEV / LTM Median TEV / 2015E
Sector Companies 3-Month 12-Month TEV ($MMs) Week High Revenue EBITDA Revenue EBITDA
Wire & Cable 8 (15.9%) (17.5%) $2,089.4 74.4% 0.5x 7.9x 0.6x 6.9x
Communications Connectivity 8 (9.2%) (5.4%) 4,381.1 79.8% 1.4x 9.6x 1.6x 9.6x
Power Connectivity 12 (9.4%) (11.3%) 10,175.3 83.4% 1.5x 10.0x 1.5x 9.6x
Note: Indexed stocks are weighted based on market capitalization. See pages 4 and 5 for index constituents. Past performance is not indicative of future results. Indices are unmanaged.
You cannot invest directly into an index.
Source: S&P Capital IQ.
GLOBAL CONNECTIVITY STOCK PERFORMANCE
GLOBAL CONNECTIVITY SECTOR PUBLIC COMPANY TRADING STATISTICS
Source: S&P Capital IQ as of 8/31/2015.
133% 131%
140%
108%
GLOBAL CONNECTIVITY QUARTERLY
©2015 Raymond James & Associates, Inc., member New York Stock Exchange/SIPC
INVESTMENT BANKING
4
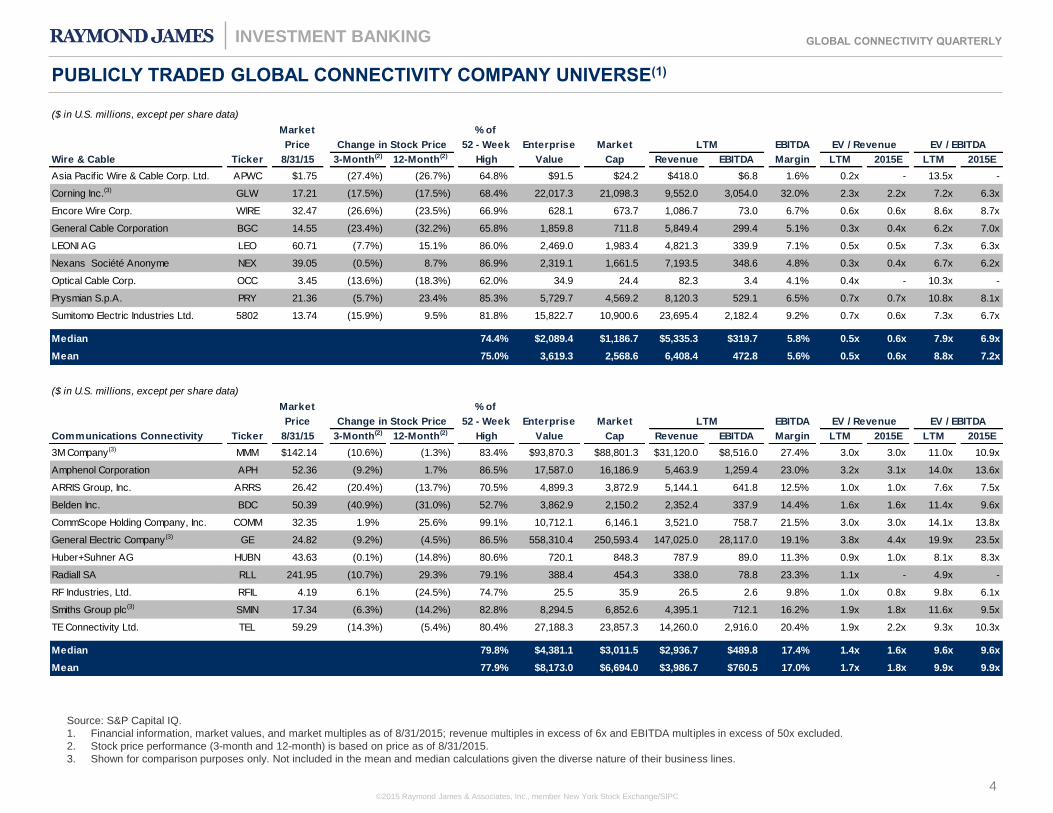
($ in U.S. millions, except per share data)
Market % of
Price Change in Stock Price 52 - Week Enterprise Market LTM EBITDA EV / Revenue EV / EBITDA
Wire & Cable Ticker 8/31/15 3-Month(2) 12-Month(2) High Value Cap Revenue EBITDA Margin LTM 2015E LTM 2015E
Asia Pacif ic Wire & Cable Corp. Ltd. APWC $1.75 (27.4%) (26.7%) 64.8% $91.5 $24.2 $418.0 $6.8 1.6% 0.2x - 13.5x -
Corning Inc.(3) GLW 17.21 (17.5%) (17.5%) 68.4% 22,017.3 21,098.3 9,552.0 3,054.0 32.0% 2.3x 2.2x 7.2x 6.3x
Encore Wire Corp. WIRE 32.47 (26.6%) (23.5%) 66.9% 628.1 673.7 1,086.7 73.0 6.7% 0.6x 0.6x 8.6x 8.7x
General Cable Corporation BGC 14.55 (23.4%) (32.2%) 65.8% 1,859.8 711.8 5,849.4 299.4 5.1% 0.3x 0.4x 6.2x 7.0x
LEONI AG LEO 60.71 (7.7%) 15.1% 86.0% 2,469.0 1,983.4 4,821.3 339.9 7.1% 0.5x 0.5x 7.3x 6.3x
Nexans Société Anonyme NEX 39.05 (0.5%) 8.7% 86.9% 2,319.1 1,661.5 7,193.5 348.6 4.8% 0.3x 0.4x 6.7x 6.2x
Optical Cable Corp. OCC 3.45 (13.6%) (18.3%) 62.0% 34.9 24.4 82.3 3.4 4.1% 0.4x - 10.3x -
Prysmian S.p.A. PRY 21.36 (5.7%) 23.4% 85.3% 5,729.7 4,569.2 8,120.3 529.1 6.5% 0.7x 0.7x 10.8x 8.1x
Sumitomo Electric Industries Ltd. 5802 13.74 (15.9%) 9.5% 81.8% 15,822.7 10,900.6 23,695.4 2,182.4 9.2% 0.7x 0.6x 7.3x 6.7x
Median 74.4% $2,089.4 $1,186.7 $5,335.3 $319.7 5.8% 0.5x 0.6x 7.9x 6.9x
Mean 75.0% 3,619.3 2,568.6 6,408.4 472.8 5.6% 0.5x 0.6x 8.8x 7.2x
($ in U.S. millions, except per share data)
Market % of
Price Change in Stock Price 52 - Week Enterprise Market LTM EBITDA EV / Revenue EV / EBITDA
Communications Connectivity Ticker 8/31/15 3-Month(2) 12-Month(2) High Value Cap Revenue EBITDA Margin LTM 2015E LTM 2015E
3M Company(3) MMM $142.14 (10.6%) (1.3%) 83.4% $93,870.3 $88,801.3 $31,120.0 $8,516.0 27.4% 3.0x 3.0x 11.0x 10.9x
Amphenol Corporation APH 52.36 (9.2%) 1.7% 86.5% 17,587.0 16,186.9 5,463.9 1,259.4 23.0% 3.2x 3.1x 14.0x 13.6x
ARRIS Group, Inc. ARRS 26.42 (20.4%) (13.7%) 70.5% 4,899.3 3,872.9 5,144.1 641.8 12.5% 1.0x 1.0x 7.6x 7.5x
Belden Inc. BDC 50.39 (40.9%) (31.0%) 52.7% 3,862.9 2,150.2 2,352.4 337.9 14.4% 1.6x 1.6x 11.4x 9.6x
CommScope Holding Company, Inc. COMM 32.35 1.9% 25.6% 99.1% 10,712.1 6,146.1 3,521.0 758.7 21.5% 3.0x 3.0x 14.1x 13.8x
General Electric Company(3) GE 24.82 (9.2%) (4.5%) 86.5% 558,310.4 250,593.4 147,025.0 28,117.0 19.1% 3.8x 4.4x 19.9x 23.5x
Huber+Suhner AG HUBN 43.63 (0.1%) (14.8%) 80.6% 720.1 848.3 787.9 89.0 11.3% 0.9x 1.0x 8.1x 8.3x
Radiall SA RLL 241.95 (10.7%) 29.3% 79.1% 388.4 454.3 338.0 78.8 23.3% 1.1x - 4.9x -
RF Industries, Ltd. RFIL 4.19 6.1% (24.5%) 74.7% 25.5 35.9 26.5 2.6 9.8% 1.0x 0.8x 9.8x 6.1x
Smiths Group plc(3) SMIN 17.34 (6.3%) (14.2%) 82.8% 8,294.5 6,852.6 4,395.1 712.1 16.2% 1.9x 1.8x 11.6x 9.5x
TE Connectivity Ltd. TEL 59.29 (14.3%) (5.4%) 80.4% 27,188.3 23,857.3 14,260.0 2,916.0 20.4% 1.9x 2.2x 9.3x 10.3x
Median 79.8% $4,381.1 $3,011.5 $2,936.7 $489.8 17.4% 1.4x 1.6x 9.6x 9.6x
Mean 77.9% $8,173.0 $6,694.0 $3,986.7 $760.5 17.0% 1.7x 1.8x 9.9x 9.9x
PUBLICLY TRADED GLOBAL CONNECTIVITY COMPANY UNIVERSE(1)
Source: S&P Capital IQ.
1. Financial information, market values, and market multiples as of 8/31/2015; revenue multiples in excess of 6x and EBITDA multiples in excess of 50x excluded.
2. Stock price performance (3-month and 12-month) is based on price as of 8/31/2015.
3. Shown for comparison purposes only. Not included in the mean and median calculations given the diverse nature of their business lines.

GLOBAL CONNECTIVITY QUARTERLY
©2015 Raymond James & Associates, Inc., member New York Stock Exchange/SIPC
INVESTMENT BANKING
5
($ in U.S. millions, except per share data)
Market % of
Price Change in Stock Price 52 - Week Enterprise Market LTM EBITDA EV / Revenue EV / EBITDA
Power Connectivity Ticker 8/31/15 3-Month(2) 12-Month(2) High Value Cap Revenue EBITDA Margin LTM 2015E LTM 2015E
ABB Ltd. ABBN $19.28 (9.5%) (10.4%) 83.7% $45,969.6 $42,811.8 $37,889.0 $5,444.0 14.4% 1.2x 1.3x 8.4x 9.0x
AZZ incorporated AZZ 50.60 3.8% 9.2% 93.7% 1,625.3 1,304.0 829.4 161.4 19.5% 2.0x 1.8x 10.1x 9.6x
Crompton Greaves Limited 500093 2.58 2.4% (12.2%) 84.9% 1,902.5 1,614.2 1,676.8 27.7 1.7% 1.1x 0.9x NM 21.0x
Eaton Corporation plc ETN 57.06 (21.1%) (18.3%) 77.3% 35,056.6 26,675.6 21,888.0 3,562.0 16.3% 1.6x 1.6x 9.8x 9.8x
Emerson Electric Co. EMR 47.72 (20.9%) (25.5%) 72.4% 35,484.7 31,358.7 23,297.0 4,528.0 19.4% 1.5x 1.6x 7.8x 8.7x
Hubbell Inc. HUB.B 98.67 (9.4%) (18.4%) 77.5% 6,006.3 5,853.9 3,427.8 599.7 17.5% 1.8x 1.7x 10.0x 10.8x
Pow ell Industries, Inc. POWL 29.36 (21.4%) (44.3%) 53.9% 283.5 344.1 662.4 31.3 4.7% 0.4x 0.4x 9.0x 5.9x
Rockw ell Automation Inc. ROK 111.83 (10.9%) (4.1%) 88.0% 14,344.2 14,997.0 6,482.2 1,367.0 21.1% 2.2x 2.3x 10.5x 9.9x
Schneider Electric SE SU 63.10 (16.2%) (12.4%) 74.8% 43,925.5 36,236.9 29,058.2 4,297.4 14.8% 1.5x 1.5x 10.2x 9.6x
Siemens Aktiengesellschaft SIE 99.08 (7.9%) (7.2%) 83.2% 102,734.0 82,756.4 84,031.2 8,794.2 10.5% 1.2x 1.2x 11.7x 9.3x
Volex plc VLX 1.31 (0.6%) 3.2% 92.6% 115.0 116.9 423.4 1.7 0.4% 0.3x 0.3x NM 6.2x
XP Pow er Ltd. XPP 24.59 (2.2%) 4.3% 92.0% 469.5 467.8 164.8 42.0 25.5% 2.8x 2.8x 11.2x 10.1x
Median 83.4% $10,175.3 $10,425.5 $4,955.0 $983.4 15.5% 1.5x 1.5x 10.0x 9.6x
Mean 81.2% 23,993.1 20,378.1 17,485.9 2,404.7 13.8% 1.5x 1.4x 9.9x 10.0x
PUBLICLY TRADED GLOBAL CONNECTIVITY COMPANY UNIVERSE(1)
Source: S&P Capital IQ.
1. Financial information, market values, and market multiples as of 8/31/2015; revenue multiples in excess of 6x and EBITDA multiples in excess of 50x excluded.
2. Stock price performance (3-month and 12-month) is based on price as of 8/31/2015.
GLOBAL CONNECTIVITY QUARTERLY
©2015 Raymond James & Associates, Inc., member New York Stock Exchange/SIPC
INVESTMENT BANKING
6
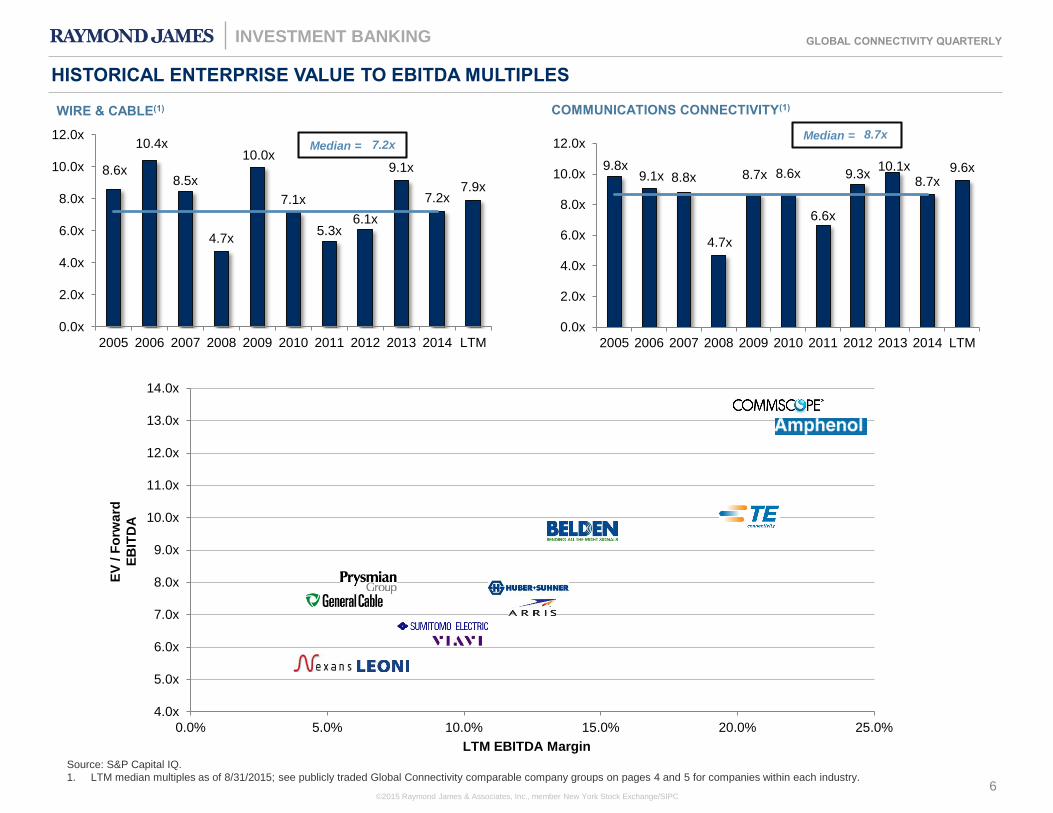
9.8x9.1x 8.8x
4.7x
8.7x 8.6x
6.6x
9.3x10.1x
8.7x9.6x
0.0x
2.0x
4.0x
6.0x
8.0x
10.0x
12.0x
2005 2006 2007 2008 2009 2010 2011 2012 2013 2014 LTM
8.7xMedian =
8.6x
10.4x
8.5x
4.7x
10.0x
7.1x
5.3x6.1x
9.1x
7.2x7.9x
0.0x
2.0x
4.0x
6.0x
8.0x
10.0x
12.0x
2005 2006 2007 2008 2009 2010 2011 2012 2013 2014 LTM
7.2xMedian =
4.0x
5.0x
6.0x
7.0x
8.0x
9.0x
10.0x
11.0x
12.0x
13.0x
14.0x
0.0% 5.0% 10.0% 15.0% 20.0% 25.0%
WIRE & CABLE(1) COMMUNICATIONS CONNECTIVITY(1) E
V / F
orw
ard
EB
ITD
A
LTM EBITDA Margin
HISTORICAL ENTERPRISE VALUE TO EBITDA MULTIPLES
Source: S&P Capital IQ.
1. LTM median multiples as of 8/31/2015; see publicly traded Global Connectivity comparable company groups on pages 4 and 5 for companies within each industry.

GLOBAL CONNECTIVITY QUARTERLY
©2015 Raymond James & Associates, Inc., member New York Stock Exchange/SIPC
INVESTMENT BANKING
7
9.9x10.4x10.6x
5.6x
8.9x
11.1x
8.2x
9.3x
11.4x 10.9x10.0x
0.0x
2.0x
4.0x
6.0x
8.0x
10.0x
12.0x
14.0x
2005 2006 2007 2008 2009 2010 2011 2012 2013 2014 LTM
9.8xMedian =
8.0x
9.0x
10.0x
11.0x
0.0% 5.0% 10.0% 15.0% 20.0% 25.0% 30.0%
POWER CONNECTIVITY(1)
HISTORICAL ENTERPRISE VALUE TO EBITDA MULTIPLES
Source: S&P Capital IQ.
1. LTM median multiples as of 8/31/2015; see publicly traded Global Connectivity comparable company groups on pages 4 and 5 for companies within each industry.
EV
/ F
orw
ard
EB
ITD
A
LTM EBITDA Margin
GLOBAL CONNECTIVITY QUARTERLY
©2015 Raymond James & Associates, Inc., member New York Stock Exchange/SIPC
INVESTMENT BANKING
8
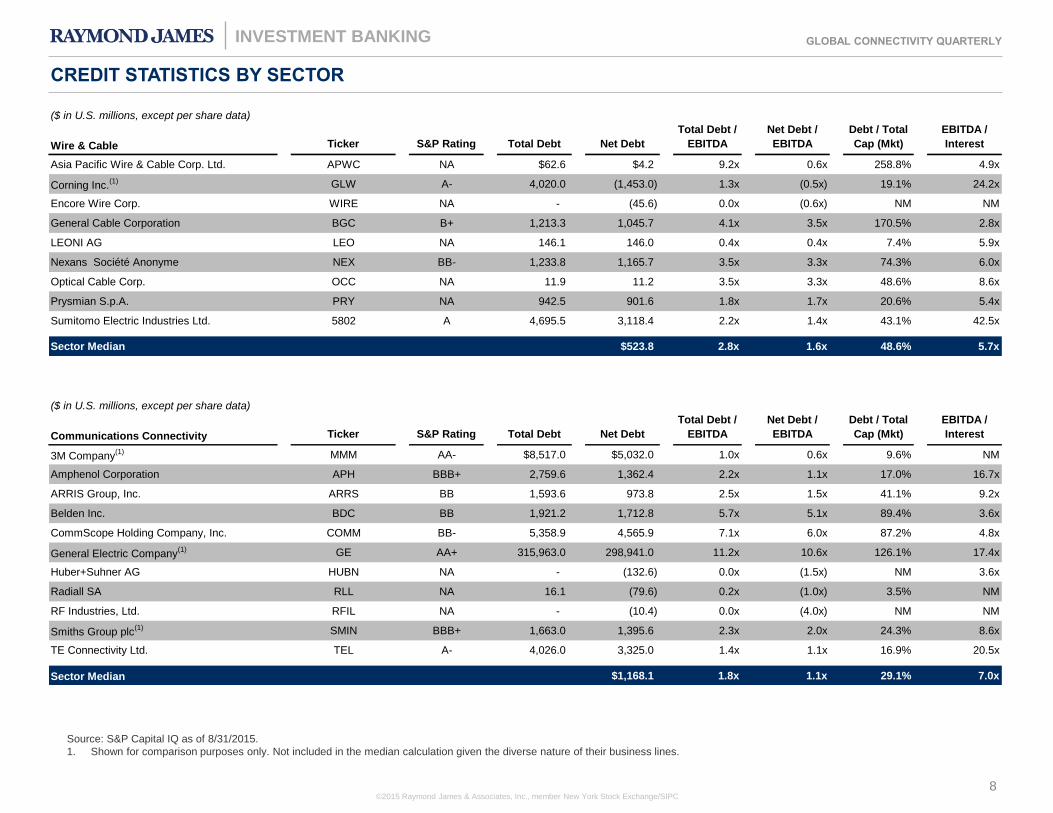
($ in U.S. millions, except per share data)
Wire & Cable Ticker S&P Rating Total Debt Net Debt
Total Debt /
EBITDA
Net Debt /
EBITDA
Debt / Total
Cap (Mkt)
EBITDA /
Interest
Asia Pacific Wire & Cable Corp. Ltd. APWC NA $62.6 $4.2 9.2x 0.6x 258.8% 4.9x
Corning Inc.(1) GLW A- 4,020.0 (1,453.0) 1.3x (0.5x) 19.1% 24.2x
Encore Wire Corp. WIRE NA - (45.6) 0.0x (0.6x) NM NM
General Cable Corporation BGC B+ 1,213.3 1,045.7 4.1x 3.5x 170.5% 2.8x
LEONI AG LEO NA 146.1 146.0 0.4x 0.4x 7.4% 5.9x
Nexans Société Anonyme NEX BB- 1,233.8 1,165.7 3.5x 3.3x 74.3% 6.0x
Optical Cable Corp. OCC NA 11.9 11.2 3.5x 3.3x 48.6% 8.6x
Prysmian S.p.A. PRY NA 942.5 901.6 1.8x 1.7x 20.6% 5.4x
Sumitomo Electric Industries Ltd. 5802 A 4,695.5 3,118.4 2.2x 1.4x 43.1% 42.5x
Sector Median $523.8 2.8x 1.6x 48.6% 5.7x
($ in U.S. millions, except per share data)
Communications Connectivity Ticker S&P Rating Total Debt Net Debt
Total Debt /
EBITDA
Net Debt /
EBITDA
Debt / Total
Cap (Mkt)
EBITDA /
Interest
3M Company(1) MMM AA- $8,517.0 $5,032.0 1.0x 0.6x 9.6% NM
Amphenol Corporation APH BBB+ 2,759.6 1,362.4 2.2x 1.1x 17.0% 16.7x
ARRIS Group, Inc. ARRS BB 1,593.6 973.8 2.5x 1.5x 41.1% 9.2x
Belden Inc. BDC BB 1,921.2 1,712.8 5.7x 5.1x 89.4% 3.6x
CommScope Holding Company, Inc. COMM BB- 5,358.9 4,565.9 7.1x 6.0x 87.2% 4.8x
General Electric Company(1) GE AA+ 315,963.0 298,941.0 11.2x 10.6x 126.1% 17.4x
Huber+Suhner AG HUBN NA - (132.6) 0.0x (1.5x) NM 3.6x
Radiall SA RLL NA 16.1 (79.6) 0.2x (1.0x) 3.5% NM
RF Industries, Ltd. RFIL NA - (10.4) 0.0x (4.0x) NM NM
Smiths Group plc(1) SMIN BBB+ 1,663.0 1,395.6 2.3x 2.0x 24.3% 8.6x
TE Connectivity Ltd. TEL A- 4,026.0 3,325.0 1.4x 1.1x 16.9% 20.5x
Sector Median $1,168.1 1.8x 1.1x 29.1% 7.0x
CREDIT STATISTICS BY SECTOR
Source: S&P Capital IQ as of 8/31/2015. 1. Shown for comparison purposes only. Not included in the median calculation given the diverse nature of their business lines.

GLOBAL CONNECTIVITY QUARTERLY
©2015 Raymond James & Associates, Inc., member New York Stock Exchange/SIPC
INVESTMENT BANKING
9
($ in U.S. millions, except per share data)
Power Connectivity Ticker S&P Rating Total Debt Net Debt
Total Debt /
EBITDA
Net Debt /
EBITDA
Debt / Total
Cap (Mkt)
EBITDA /
Interest
ABB Ltd. ABBN A $7,988.0 $2,801.0 1.5x 0.5x 18.7% 9.0x
AZZ incorporated AZZ NA 367.1 321.3 2.3x 2.0x 28.2% 10.0x
Crompton Greaves Limited 500093 NA 431.2 297.6 15.6x 10.8x 26.7% 49.9x
Eaton Corporation plc ETN NA 8,761.0 8,331.0 2.5x 2.3x 32.8% 15.8x
Emerson Electric Co. EMR A 7,469.0 4,076.0 1.6x 0.9x 23.8% 22.2x
Hubbell Inc. HUB.B A 598.0 143.3 1.0x 0.2x 10.2% 18.9x
Powell Industries, Inc. POWL NA 2.8 (60.6) 0.1x (1.9x) 0.8% NM
Rockwell Automation Inc. ROK A 1,505.0 (652.8) 1.1x (0.5x) 10.0% 22.0x
Schneider Electric SE SU A- 9,496.0 7,125.6 2.2x 1.7x 26.2% 11.2x
Siemens Aktiengesellschaft SIE A+ 34,625.5 19,227.0 3.9x 2.2x 41.8% 19.2x
Volex plc VLX NA 31.9 (1.9) NM NM 27.2% 0.7x
XP Power Ltd. XPP NA 6.8 0.6 0.2x 0.0x 1.4% NM
Sector Median $309.5 1.6x 0.9x 25.0% 17.3x
CREDIT STATISTICS BY SECTOR
Source: S&P Capital IQ as of 8/31/2015.

GLOBAL CONNECTIVITY QUARTERLY
©2015 Raymond James & Associates, Inc., member New York Stock Exchange/SIPC
INVESTMENT BANKING
10
Communications Connectivity
Date Enterprise EV / LTM
Announced Closed Target Buyers/Investors Value ($M) Revenue EBITDA
6/25/2015 Pending General Cable Corp., Asia Pacific Operations MM Logistics Co.,Ltd. 175.0$ - -
5/8/2015 5/14/2015 TPC Wire & Cable Corp. Audax Group, Inc. - - -
4/22/2015 Pending Pace plc ARRIS Group, Inc. 2,017.0 0.8x 7.3x
4/14/2015 5/1/2015 ActiveVideo Networks, Inc. Charter Communications; ARRIS Group, Inc. 135.0 - -
2/28/2015 2/28/2015 Invotec Group Limited (nka:Amphenol Invotec) Amphenol Corporation - - -
1/27/2015 8/28/2015 TE Connectivity Ltd., Telecom, Enterprise and Wireless Business CommScope Holding Company, Inc. 3,059.0 1.6x 10.2x
1/13/2015 1/13/2015 Oxalis Group Limited Eaton Corporation plc - - -
12/22/2014 12/22/2014 60% Stake In Phelps Dodge International Philippines A. Soriano Corp. 67.1 - -
12/15/2014 1/9/2015 TR Manufacturing Incorporated Corning Inc. - - -
12/11/2014 5/8/2015 Advanced Photonix Inc. Luna Innovations Incorporated 23.3 0.8x NM
12/8/2014 1/2/2015 Tripwire, Inc. Belden Inc. 710.0 4.3x 13.4x
11/18/2014 12/22/2014 Oplink Communications, Inc. Koch Industries, Inc. 322.1 1.6x 37.7x
11/17/2014 11/17/2014 RFL Electronics Inc. Hubbell Power Systems, Inc. 20.0 - -
11/11/2014 1/20/2015 Comnet Telecom Supply Inc. RF Industries, Ltd. 5.5 0.6x -
11/4/2014 1/22/2015 Elecsys Corporation Lindsay Corporation 71.0 2.4x 18.3x
10/11/2014 11/12/2014 Bridon Limited Teachers' Private Capital 585.9 1.4x 8.8x
10/10/2014 10/31/2014 Shenzhen Xiangtong Photoelectric Technology Co., Ltd. China Aviation Optical-Electrical Technology 39.1 2.9x -
6/18/2014 10/9/2014 Measurement Specialties Inc. TE Connectivity Ltd. 1,603.5 3.9x 22.3x
6/11/2014 6/11/2014 ProSoft Technology, Inc. Belden Inc. 105.0 2.1x -
6/9/2014 7/21/2014 Hittite Microwave Corporation Analog Devices, Inc. 1,954.7 7.1x 16.7x
5/30/2014 5/30/2014 Wema Group Holding AS Measurement Specialties Inc. 113.2 1.2x 21.9x
4/2/2014 6/30/2014 SEACON Advanced Products, LLC TE Connectivity Ltd. 452.0 3.9x 13.5x
2/6/2014 3/31/2014 Grass Valley USA, LLC, Prior to Merger with Miranda Technologies Inc. Belden Inc. 218.0 0.8x 8.1x
12/20/2013 12/20/2013 Joslyn Sunbank Company, LLC Esterline Technologies Corp. 48.0 - -
12/10/2013 12/10/2013 Trendium, Inc. JDS Uniphase Corporation (nka:Viavi Solutions Inc.) 24.9 - -
12/6/2013 1/6/2014 Network Instruments, LLC JDS Uniphase Corporation (nka:Viavi Solutions Inc.) 200.0 5.0x -
Mean 2.5x 16.2x
Median 1.8x 13.5x
Source: S&P Capital IQ.
Note: Only includes transactions greater than $10 million.
The following is a representative sample of transactions announced or completed since December 2013.
SELECT RECENT GLOBAL CONNECTIVITY M&A TRANSACTIONS
GLOBAL CONNECTIVITY QUARTERLY
©2015 Raymond James & Associates, Inc., member New York Stock Exchange/SIPC
INVESTMENT BANKING
11
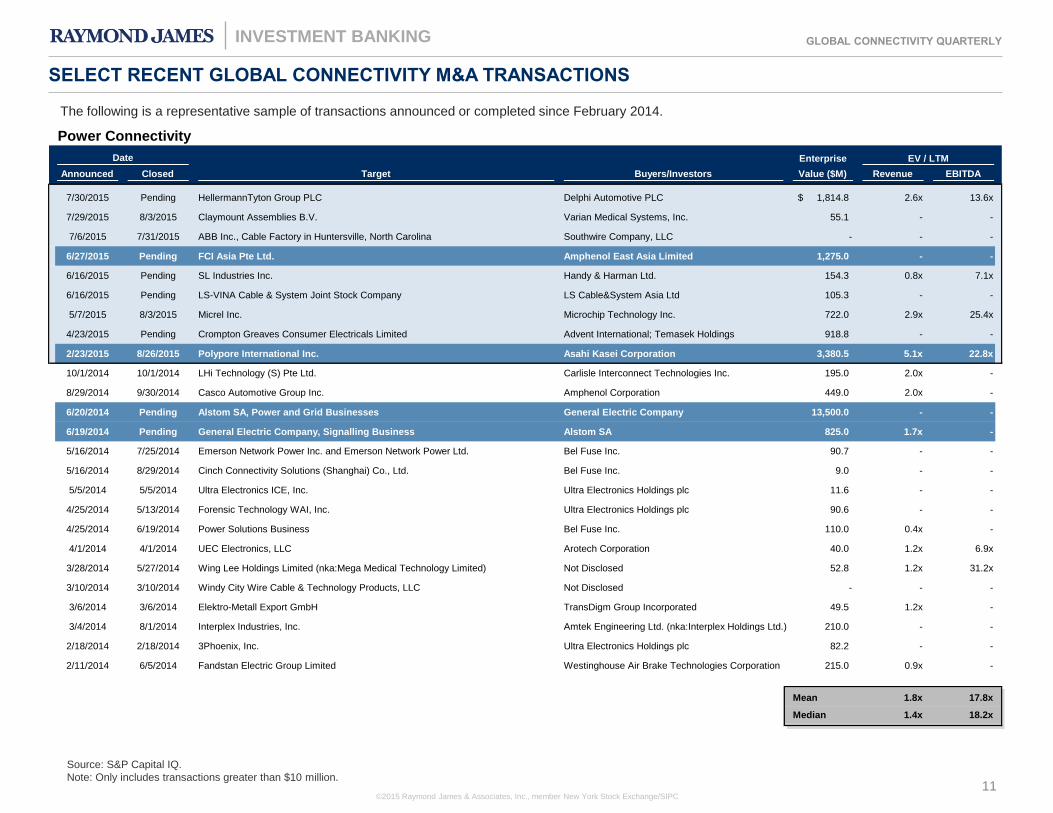
Power Connectivity
Date Enterprise EV / LTM
Announced Closed Target Buyers/Investors Value ($M) Revenue EBITDA
7/30/2015 Pending HellermannTyton Group PLC Delphi Automotive PLC 1,814.8$ 2.6x 13.6x
7/29/2015 8/3/2015 Claymount Assemblies B.V. Varian Medical Systems, Inc. 55.1 - -
7/6/2015 7/31/2015 ABB Inc., Cable Factory in Huntersville, North Carolina Southwire Company, LLC - - -
6/27/2015 Pending FCI Asia Pte Ltd. Amphenol East Asia Limited 1,275.0 - -
6/16/2015 Pending SL Industries Inc. Handy & Harman Ltd. 154.3 0.8x 7.1x
6/16/2015 Pending LS-VINA Cable & System Joint Stock Company LS Cable&System Asia Ltd 105.3 - -
5/7/2015 8/3/2015 Micrel Inc. Microchip Technology Inc. 722.0 2.9x 25.4x
4/23/2015 Pending Crompton Greaves Consumer Electricals Limited Advent International; Temasek Holdings 918.8 - -
2/23/2015 8/26/2015 Polypore International Inc. Asahi Kasei Corporation 3,380.5 5.1x 22.8x
10/1/2014 10/1/2014 LHi Technology (S) Pte Ltd. Carlisle Interconnect Technologies Inc. 195.0 2.0x -
8/29/2014 9/30/2014 Casco Automotive Group Inc. Amphenol Corporation 449.0 2.0x -
6/20/2014 Pending Alstom SA, Power and Grid Businesses General Electric Company 13,500.0 - -
6/19/2014 Pending General Electric Company, Signalling Business Alstom SA 825.0 1.7x -
5/16/2014 7/25/2014 Emerson Network Power Inc. and Emerson Network Power Ltd. Bel Fuse Inc. 90.7 - -
5/16/2014 8/29/2014 Cinch Connectivity Solutions (Shanghai) Co., Ltd. Bel Fuse Inc. 9.0 - -
5/5/2014 5/5/2014 Ultra Electronics ICE, Inc. Ultra Electronics Holdings plc 11.6 - -
4/25/2014 5/13/2014 Forensic Technology WAI, Inc. Ultra Electronics Holdings plc 90.6 - -
4/25/2014 6/19/2014 Power Solutions Business Bel Fuse Inc. 110.0 0.4x -
4/1/2014 4/1/2014 UEC Electronics, LLC Arotech Corporation 40.0 1.2x 6.9x
3/28/2014 5/27/2014 Wing Lee Holdings Limited (nka:Mega Medical Technology Limited) Not Disclosed 52.8 1.2x 31.2x
3/10/2014 3/10/2014 Windy City Wire Cable & Technology Products, LLC Not Disclosed - - -
3/6/2014 3/6/2014 Elektro-Metall Export GmbH TransDigm Group Incorporated 49.5 1.2x -
3/4/2014 8/1/2014 Interplex Industries, Inc. Amtek Engineering Ltd. (nka:Interplex Holdings Ltd.) 210.0 - -
2/18/2014 2/18/2014 3Phoenix, Inc. Ultra Electronics Holdings plc 82.2 - -
2/11/2014 6/5/2014 Fandstan Electric Group Limited Westinghouse Air Brake Technologies Corporation 215.0 0.9x -
Mean 1.8x 17.8x
Median 1.4x 18.2x
Source: S&P Capital IQ.
Note: Only includes transactions greater than $10 million.
The following is a representative sample of transactions announced or completed since February 2014.
SELECT RECENT GLOBAL CONNECTIVITY M&A TRANSACTIONS

GLOBAL CONNECTIVITY QUARTERLY
©2015 Raymond James & Associates, Inc., member New York Stock Exchange/SIPC
INVESTMENT BANKING
12
• Twelve dedicated investment bankers with over 160 combined years of banking and capital markets expertise
• Services: Mergers & Acquisitions (Buy & Sell-side advisory); Public Equity and Debt Offerings; Private Placements of Equity and Debt;
Divestitures; Restructurings & Recapitalizations; Valuations & Fairness Opinions
• Longstanding relationships with extensive network of industrial-focused strategic buyers and private equity sponsors
INDUSTRIAL SECTOR EXPERTISE
GENERAL INDUSTRIALS INVESTMENT BANKING GROUP
Building Products & Infrastructure Water Infrastructure
Industrial Technology Distribution
Building Products Metals & Infrastructure Equipment Services
Automation & Process Control
Environmental Equipment
& Controls Intelligent Transportation
Basic Specialty
• Stone, Concrete,
Aggregates
• Lumber
• Walls, Ceilings,
Floors, Decking
• Framing, Roofing,
Insulation
• Sheet Goods
• Windows & Doors
• Fixtures &
Cabinets
• Lighting
• Residential
Plumbing
• Service Centers &
Processors
• Metal Stamping
• Steel Fabricators
• Integrated
Producers
• Mini Mill
Producers
• Storm Water
Products
• Pipe & Tube
Producers
• Aluminum
• Scrap & Raw
Materials
• Recycling
Services
• Metal, Concrete
and Plastic Pipe
• Filtration /
Separation
• Distribution &
Collection
• Specialty
Chemicals
• Water &
Wastewater
Treatment
Equipment
• Treating Boiler
Water
• Manufactured /
On-site Tanks
• Irrigation
• Pump Stations
• Pool Supplies
• Disinfection
• Facility
Management
• Site Development
• Billing & Meter
Reading
• Energy
Management
• Maintenance
• Pipeline Repair
• Logistics
• Procurement
• Support Services
• Well Water
Drilling
• Installation &
Tunneling
• Marine
Construction
• Water and
Wastewater Plant
Construction
• Automation
• Robotics
• Motion Control
• Photonics
• Building Controls
• 3D Printing
• Pumps
• Control Valves
• Control Systems
• Wire & Cable
• Interconnect
Systems
• Connectors
• Instrumentation &
Control Products
• Transmission &
Distribution
(Services &
Products)
• Switchgear &
Signal
Conditioning
Products
• Air Handling
• Filtration
• HVAC
Components
• Bike Rentals
• Smart Traffic
• On-Demand
• Roofing
• HVAC
• Insulation
• Engineered Wood
• Pipe, Valve &
Fitting
• Process Flow
Control
• Motion Control &
Fluid Power
• MRO
• Automotive
• Tires
• Linens
• Fiberglass
• Diversified
• Technology
• Heavy Equipment
Global Connectivity